Abstract
Introduction:
The mixed layer depth (MLD) regulates air–sea heat fluxes, nutrient entrainment, and ecosystem dynamics in the Mediterranean Sea, making its long-term evolution a sensitive indicator of climate-driven changes in ocean stratification and surface thermal conditions.
Methods:
Using a high-resolution Mediterranean physical reanalysis and daily mixed-layer estimates (1990–2019), we quantify basin-wide changes in MLD, their seasonal and regional variability, and the physical drivers behind them.
Results:
Across the Mediterranean, MLD exhibits strong seasonal and interannual variability, but a persistent long-term shoaling of ≈0.5–0.6 m per decade is evident. This trend is most robust in spring and late autumn (notably April, November, and December) and is linked primarily to enhanced near-surface stratification driven by surface warming and subsurface salinification; surface Brunt–Väisälä frequency (N²) increased by ≈4.26 × 10⁻⁷ s⁻² per decade in the upper 0–50 m. Changes in wind stress are spatially heterogeneous and too weak to explain the basin-scale shoaling, although localized winter intensification (e.g., Gulf of Lion) produced episodic deepening and strong convection in the 1990s–2000s. Sub-basin contrasts are pronounced: the Levantine Basin shows consistent shoaling, the Southern Adriatic displays modest variability, and the Northwestern Mediterranean experienced transient deepening episodes linked to dense water formation.
Discussion:
Continued shoaling of the mixed layer has important implications for winter ventilation, nutrient supply to the euphotic zone, and the vulnerability of Mediterranean ecosystems to prolonged marine heatwaves.
1 Introduction
The ocean’s mixed layer serves as a dynamic and critical interface between the atmosphere and the ocean interior. Within this layer, wind, waves, and surface currents homogenize temperature, salinity, and nutrients, creating a relatively uniform zone extending from the surface to its base (Brainerd and Gregg, 1995). The depth and properties of the mixed layer play a crucial role in climate regulation by controlling heat and carbon exchanges between the ocean and atmosphere, thereby influencing regional weather patterns and global climate systems (Bindoff et al., 2019).
Beyond its climatic significance, the mixed layer is essential for marine ecosystems: it regulates nutrient entrainment that sustains primary productivity and phytoplankton growth, forming the foundation of the ocean food web, and it modulates oxygen ventilation into subsurface layers (Lavigne et al., 2013; Villamaña et al., 2019; Comesaña et al., 2021). Additionally, the mixed layer influences pollutant dispersion and shapes the ocean’s response to seasonal and interannual variability, making it a central focus in both ecological and climate research (Henson et al., 2009; Yoder et al., 1993).
The Mediterranean Sea and its sub-basins (Figure 1), a semi-enclosed basin with a net heat deficit, are particularly sensitive to climate change due to restricted water exchange with the global ocean (Babagolimatikolaei, 2024, 2025; Babagolimatikolaei et al., 2025). Changes in surface temperature, salinity, and precipitation patterns intensify water column stratification, reduce vertical nutrient supply, and threaten biodiversity. Rising sea levels and more frequent marine heatwaves further endanger coastal ecosystems and fisheries, underlining the basin’s dual vulnerability to both environmental and socio-economic impacts.
Figure 1
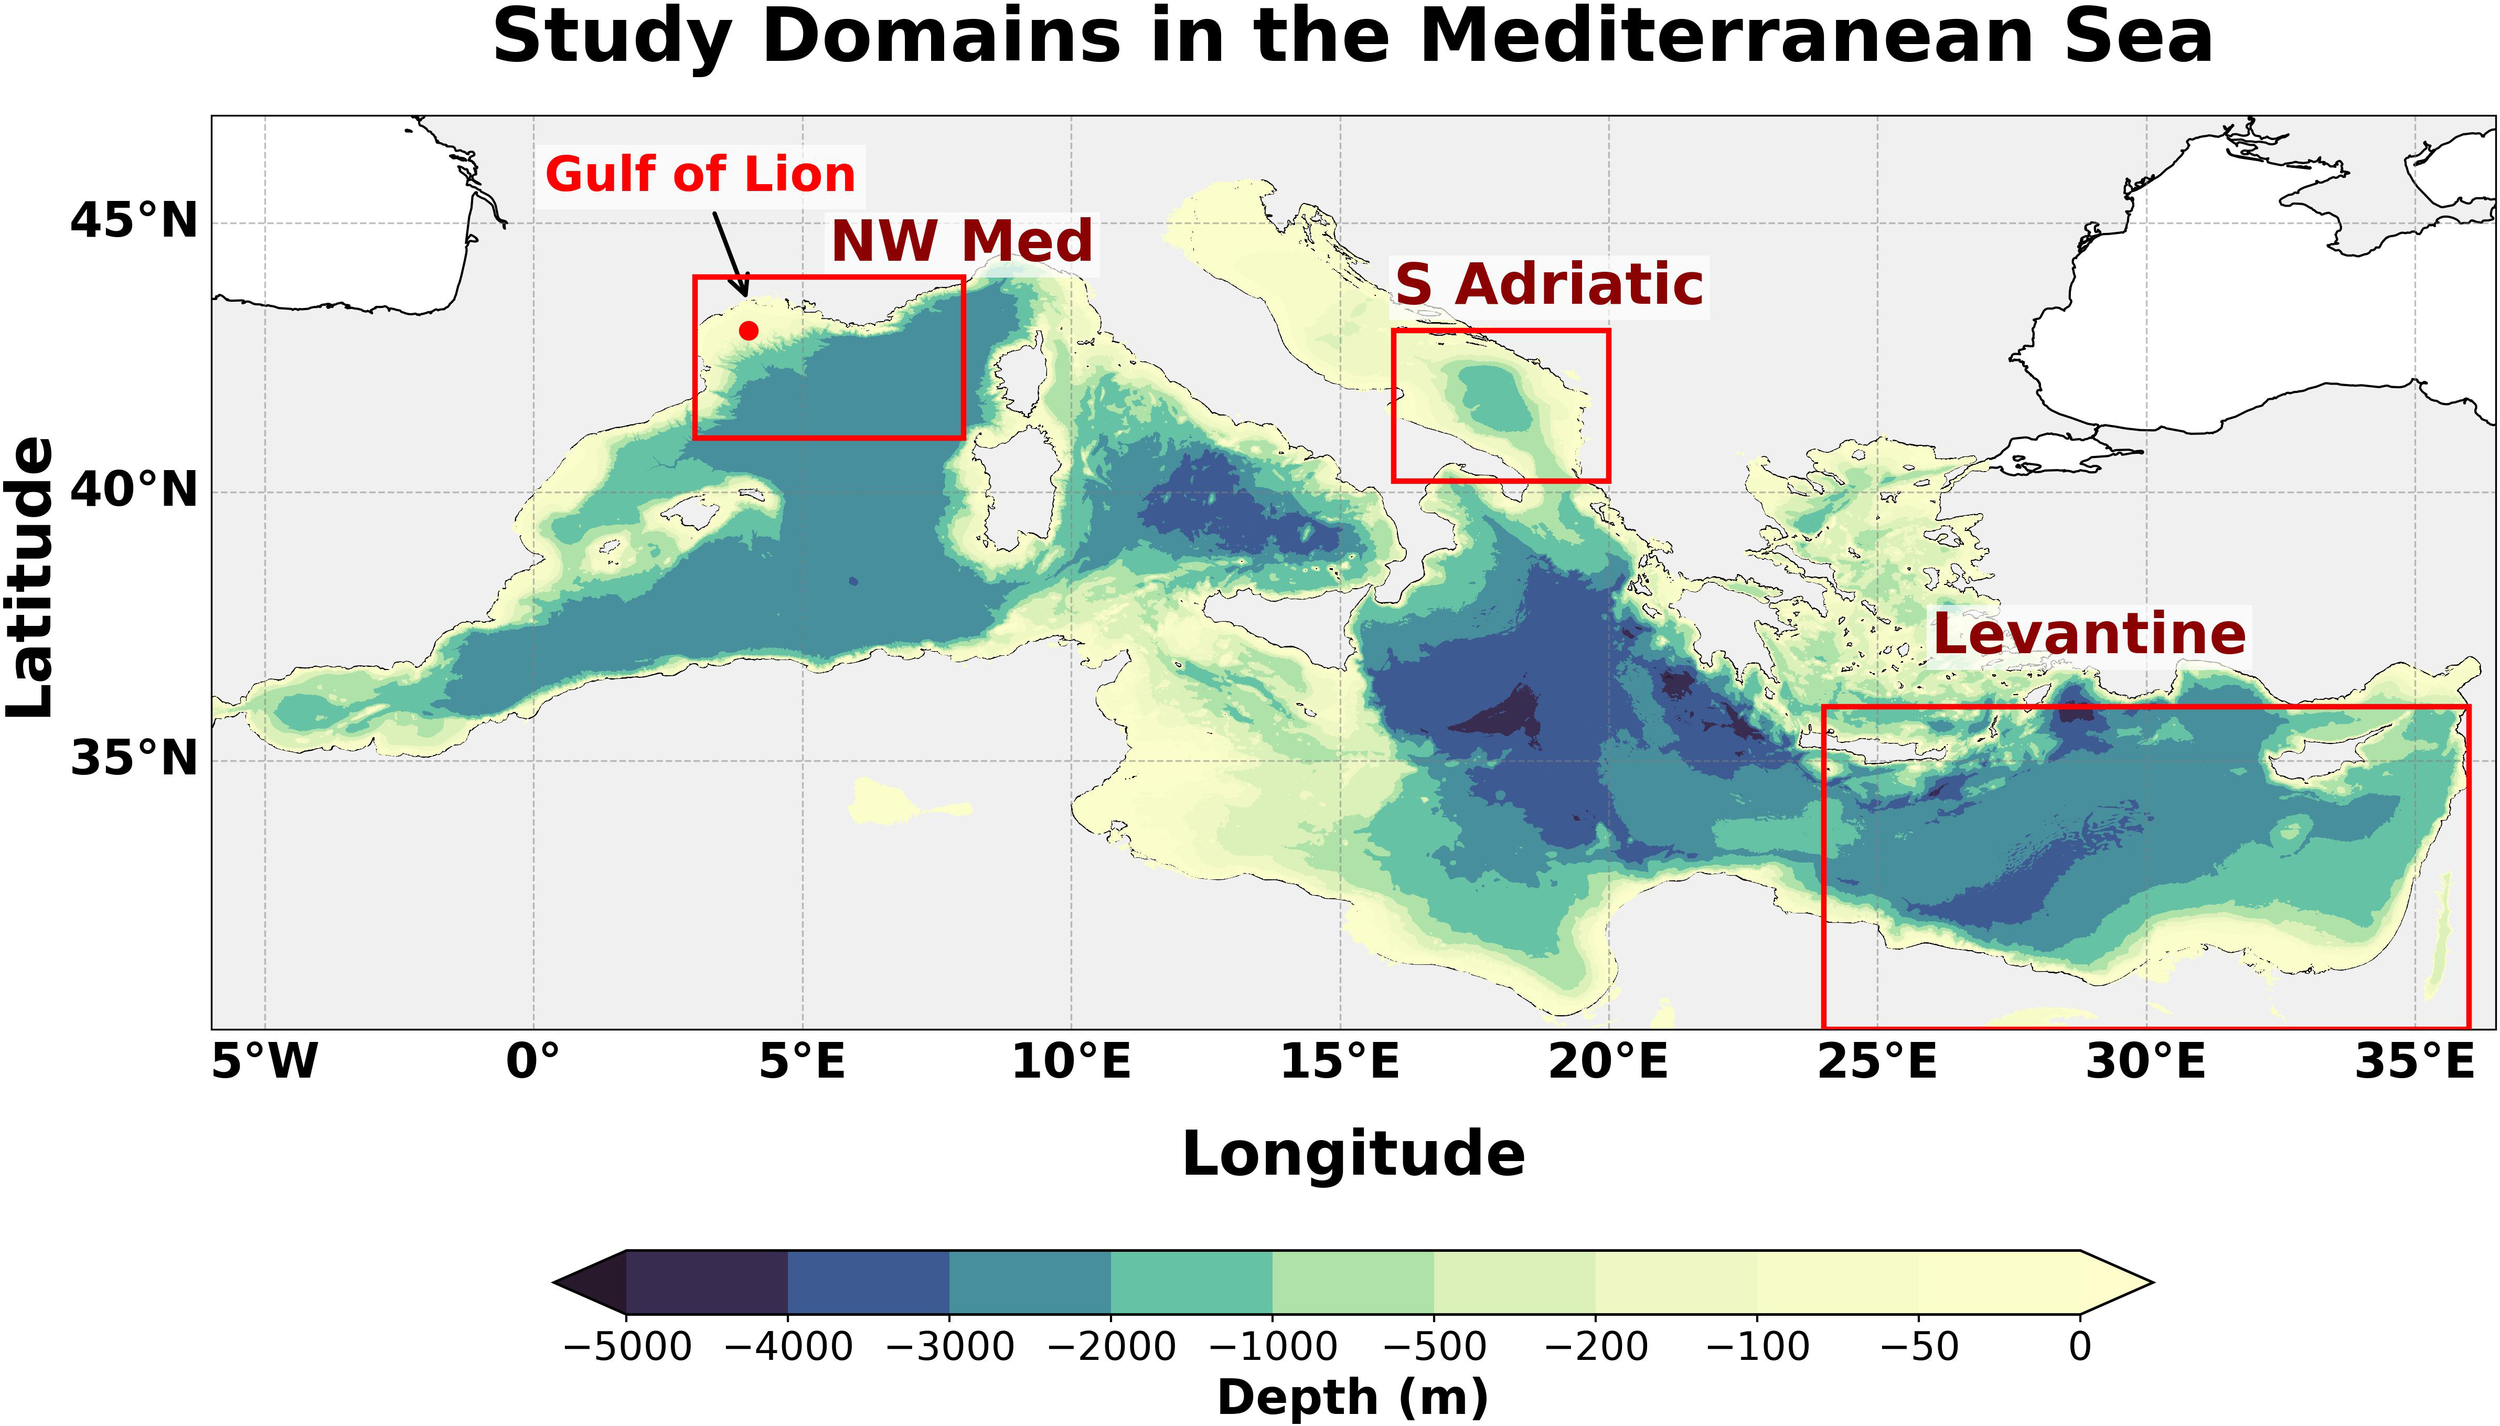
Bathymetry of the Mediterranean Sea. Boxes indicate the Northwestern (NW) Mediterranean (Gulf of Lion), Southern Adriatic, and Levantine Basin, which are selected as subdomains for specific calculations. Bathymetric data are extracted from General Bathymetric Chart of the Oceans (GEBCO; GEBCO Compilation Group, 2022).
Observational and modelling studies already indicate ongoing shifts in the Mediterranean’s surface properties, with projections suggesting continued warming and salinity increases throughout the twenty-first century (Cuttelod et al., 2008; Coll et al., 2012; Vargas-Yáñez et al., 2021; Adloff et al., 2015). These trends are expected to strengthen stratification, potentially weakening deep convection and thermohaline circulation, thereby reducing nutrient availability in the euphotic zone and limiting ventilation of intermediate and deep waters (Somot et al., 2006; Herrmann et al., 2008; de Fommervault et al., 2015; Coppola et al., 2018). In this context, a key question arises: how has the Mediterranean mixed layer evolved under these changing conditions, given its central role in linking physical processes with ecosystem functioning?
High-resolution studies, such as the climatology developed by d’Ortenzio et al. (2005) using temperature and salinity profiles, have provided detailed maps of MLD across the Mediterranean. These maps revealed circulation patterns, deep-water formation regions, and marked east–west differences driven by density variations, highlighting strong seasonal and mesoscale variability. More recent analyses (Vargas-Yáñez et al., 2022), focused mainly on the western basin (e.g., Spanish Mediterranean waters and the Gulf of Cádiz), suggested that despite significant surface warming and salinity changes, no statistically significant long-term trends in MLD or upper-layer stratification were observed. This underscores both the complexity of air–sea interactions and the importance of long-term basin-wide monitoring. Moreover, Houpert et al. (2015) develop a monthly 1° × 1°climatology of mixed layer and thermocline properties in the Mediterranean using over 190,000 temperature profiles (1969–2012). They describe the seasonal cycle, highlight regional differences in winter mixing, and provide the first basin-wide, observation-based estimate of upper-ocean heat storage rate and its variability. However, substantial gaps remain in understanding the variability of the Mediterranean mixed layer on daily to decadal timescales since 1990, particularly in its ecological implications in the whole Mediterranean Sea.
The present study provides the first basin-wide assessment of Mediterranean mixed layer variability over three decades using high-resolution reanalysis. Unlike earlier works limited to seasonal cycles or local regions, we investigate daily to decadal changes across the whole basin and perform separate analyses for key sub-basins, including the Gulf of Lion and its surroundings, the Southern Adriatic, and the Levantine Basin, which are important for thermohaline circulation in the Mediterranean Sea (Pinardi and Masetti, 2000). By identifying the physical drivers of these changes, with emphasis on wind forcing and stratification, and by discussing their consequences for nutrient cycling, oxygen ventilation, and ecosystem vulnerability, this work contributes to a better understanding of how semi-enclosed seas act as early indicators of climate-driven change in the global ocean.
The rest of this paper is structured as follows: Section 2 describes the data and methodology; Section 3 presents the variability of the mixed layer from daily to decadal scales with sub-basin analyses; Section 4 examines the physical drivers of this variability across the whole Mediterranean Sea; Section 5 discusses implications for ocean–ecosystem interactions; and Section 6 summarizes the main conclusions.
2 Data and methodology
In this study, MLD (also temperature and salinity) in the Mediterranean Sea is investigated using the Mediterranean Sea Physics Reanalysis dataset. This product is generated by a numerical system that couples the Nucleus for European Modelling of the Ocean (NEMO) hydrodynamic model with the OceanVAR variational data assimilation scheme, which assimilates temperature and salinity as well as satellite sea level. Simulations are carried out with the NEMO 3.6 ocean general circulation model (OGCM) (Madec et al., 2017), configured at a horizontal resolution of 1/24° with 141 vertical levels (Escudier et al., 2021).
The model setup incorporates Copernicus Marine Environment Monitoring Service (CMEMS) updates (Clementi et al., 2017), extends into the Atlantic to represent exchanges through the Strait of Gibraltar, and parameterizes inflow from the Dardanelles (Kourafalou and Barbopoulos, 2003). Bathymetry is derived from GEBCO data (Weatherall et al., 2015), and initial conditions are taken from the SDN_V2aa climatology for 1900–1987 (Simoncelli et al., 2015). The MLD is estimated from potential density using the σθ-threshold method, defined as the depth at which density exceeds its value at 10 m by Δσθ = 0.03 kg m-3, a criterion that has been shown to capture the base of the mixed layer and the onset of seasonal restratification more accurately than larger thresholds (de Boyer Montégut et al., 2004). Further model details are available in Escudier et al. (2021).
For the atmospheric forcing, we use monthly surface wind stress fields from a Mediterranean ocean reanalysis product covering the 30-year period 1990–2019. This dataset is provided on the same spatial grid as the ocean model, ensuring consistency and allowing for a more accurate and reliable analysis.
The analysis uses daily averaged MLD data (1990–2019) together with monthly averaged temperature, salinity, and wind fields from the same period. It is carried out over the entire Mediterranean Sea with some extra analysis for the Gulf of Lion and its surroundings, the Southern Adriatic, and the Levantine Basin. This approach allows us to assess the temporal and spatial variability of MLD over three decades. Results are presented in Section 3. For this study, winter is defined as December–February, spring as March–May, summer as June–August, and autumn as September–November.
3 Results
This section presents the temporal and spatial variability of MLD in the Mediterranean Sea. Section 3.1 focuses on temporal patterns, including daily, seasonal, interannual, and long-term trends, highlighting anomalies of MLD. Section 3.2 examines spatial variability using monthly and decadal maps to identify the regions exhibiting the most pronounced changes. Section 3.3 examines the seasonal and inter-basin variability of MLD, focusing on the Gulf of Lion and its surroundings, the Southern Adriatic, and the Levantine Basin.
3.1 Temporal variability and trends in MLD
For each day from 1990 to 2019, mixed layer depth (MLD) values are extracted at all model grid points across the Mediterranean Sea. From these daily fields, the spatial mean and median MLD are computed to represent basin-wide conditions. The resulting daily mean and median values are then averaged over each year to produce the annual time series. Daily spatial average MLD distributions show a strong right-skewness, with the majority of values shallower than 20 m, though occasional deepening events extend beyond 120 m (Figures 2a, b). Mean values (~25 m) are consistently deeper than median values (~15 m), reflecting the influence of these extreme deepening events.
Figure 2
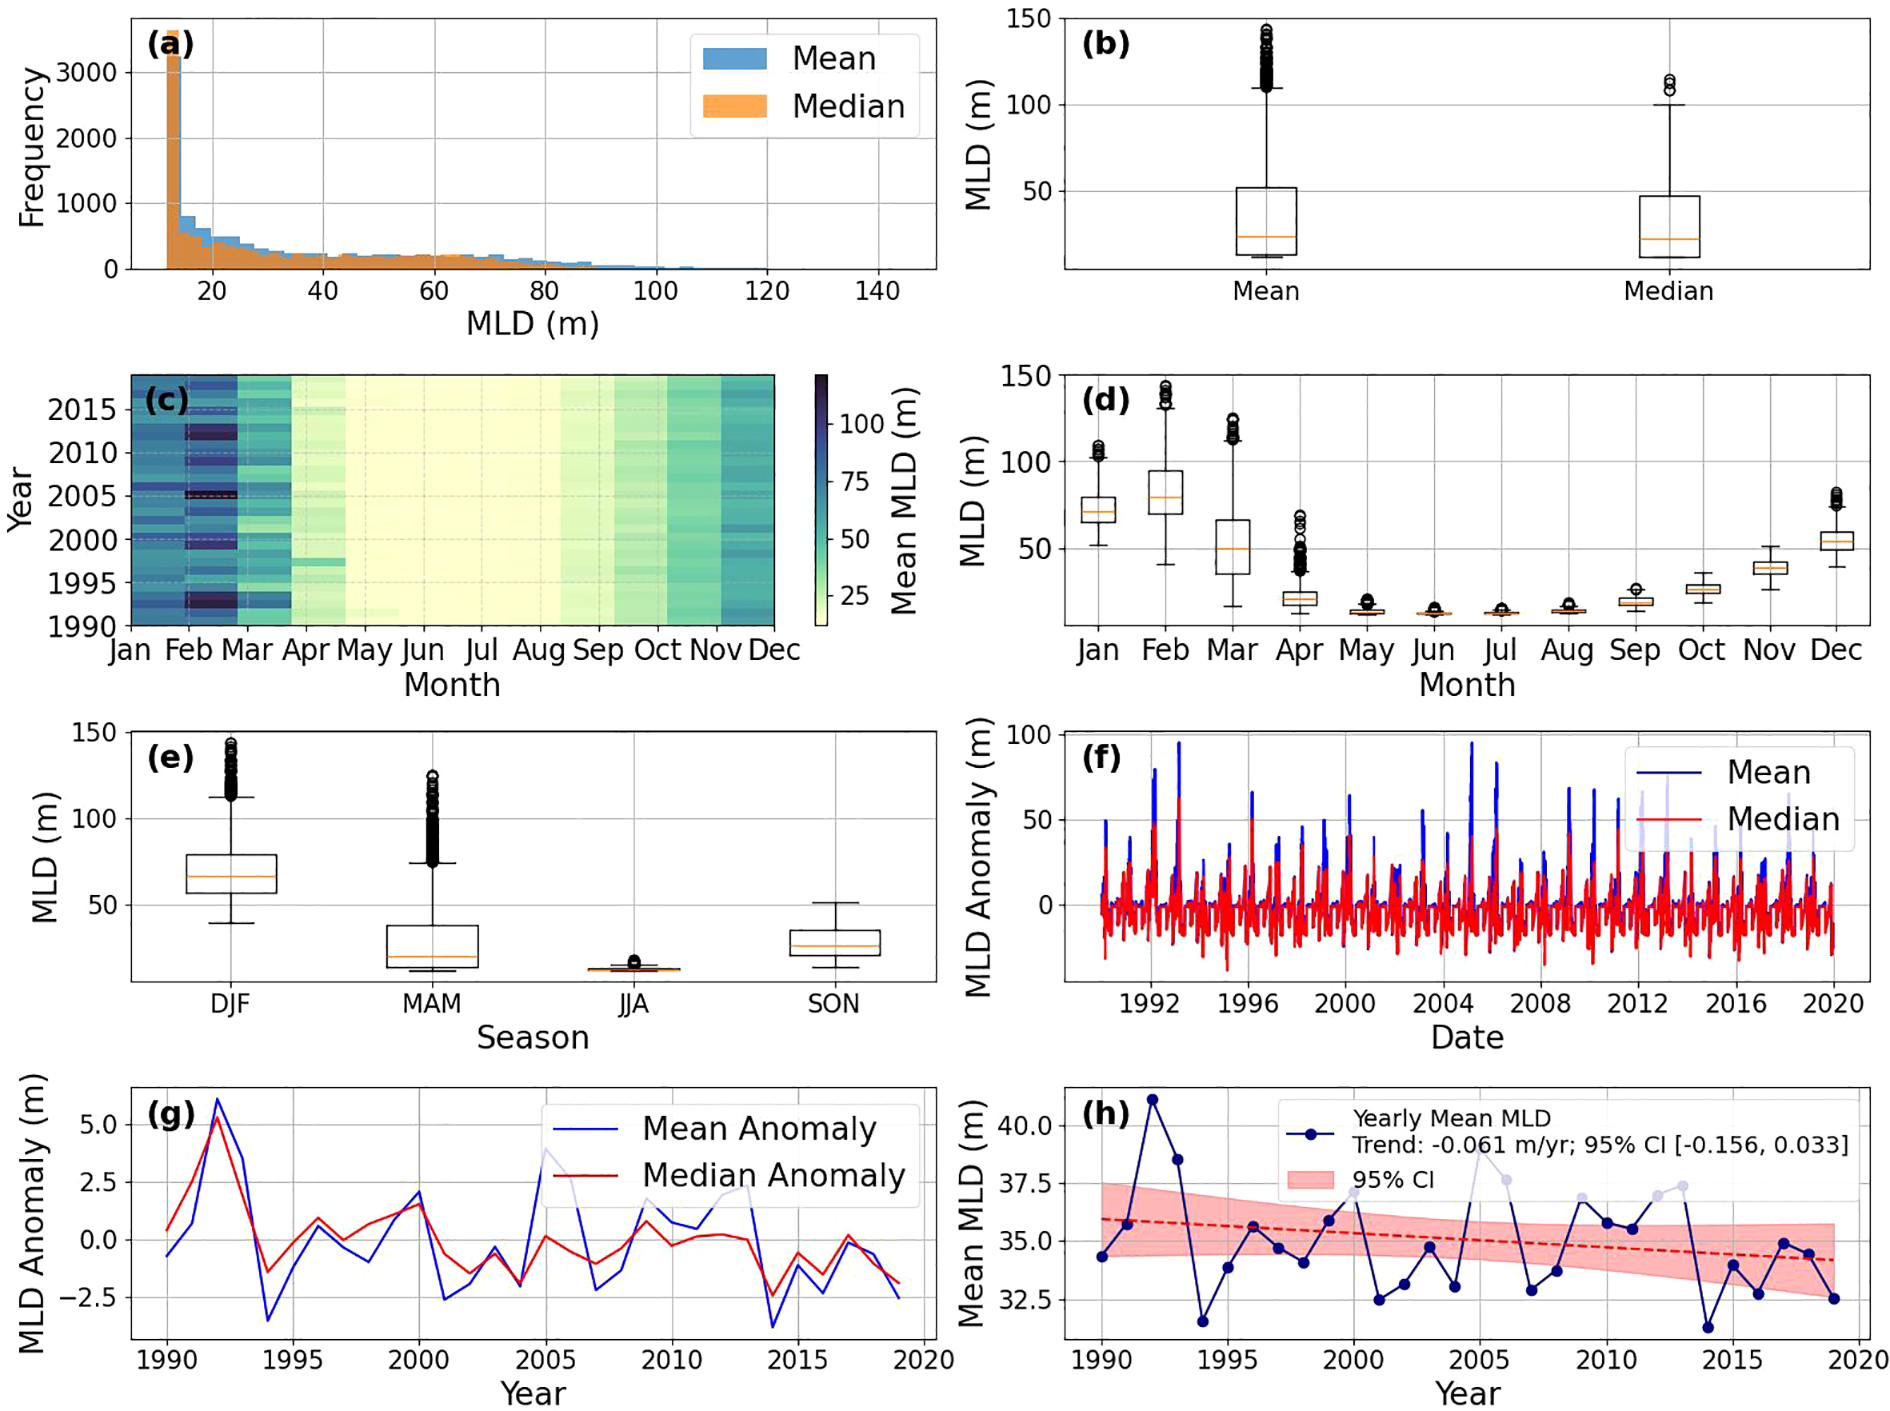
Overview of MLD variability from 1990 to 2019. For each day, MLD values from all model grid points are used to compute the spatial mean and median MLD, representing basin-wide conditions. (a, b) Distribution of daily MLD, showing histograms and boxplots for mean and median values. (c, d) Monthly statistics, including boxplots and a Hovmöller diagram, illustrating intra-annual variability. (e, f) Seasonal MLD distributions and anomalies relative to seasonal means. (g) Interannual variability of yearly MLD anomalies. (h) Yearly mean MLD with linear trend and 95% confidence interval; slope = –0.061 m/yr, 95% CI [–0.156, 0.033]. Seasonal abbreviations: DJF, December–February (winter); MAM, March–May (spring); JJA, June–August (summer); SON, September–November (autumn).
Pronounced seasonal variability dominates the MLD signal (Figures 2c, d). The deepest mixed layers occur in December–March, with median depths between 70 and 90 m and maxima exceeding 120 m. In contrast, the shallowest conditions are observed in summer (July–August), when the median MLD is typically less than 10 m. Spring and autumn exhibit intermediate depths ranging between 25 and 40 m, a pattern that is consistent throughout the 1990–2019 record. The Hovmöller diagram (Figure 2c), further highlights the persistence of this seasonal cycle across years. Based on the Hovmöller patterns, exceptionally deep MLDs are observed in February of 1992, 1993, 2005, 2012, and 2013, whereas years such as 1995 and 2016 exhibit comparatively shallow conditions with the lowest winter MLD values.
Seasonal boxplots illustrate maximum deepening during winter and spring, while summer is characterized by the shallowest MLD values (Figure 2e). Anomalies relative to seasonal means generally remain within ±50 m (Figure 2f), indicating strong intra-annual variability with notable interannual excursions.
Interannual anomalies vary between approximately −2.5 m and +5 m (Figure 2g). Significant events include a positive anomaly in 1992 (+5 m), and a negative anomaly around 1994 and 2014 (−2.5 m). These fluctuations can reflect both climatic oscillations and episodic forcing mechanisms that modulate MLD beyond the seasonal cycle.
Despite this variability, a long-term trend is evident (Figure 2h). The yearly mean MLD declined at a rate of –0.061 m yr-1 (–6.1 cm yr-1) between 1990 and 2019, with a 95% confidence interval of [–0.156, 0.033] m yr-1, indicating that the observed trend is subject to statistical uncertainty. Decadal averages show a decline of approximately 50–60 cm per decade, from ~35.5 m during the 1990s to ~34.5 m in the 2010s. This persistent long-term decline, despite short-term fluctuations, suggests a shallowing of the upper ocean mixed layer in the Mediterranean Sea over the study period.
3.2 Spatial variability: decadal MLD changes
The first step in understanding monthly variability is to plot the monthly standard deviation in order to identify and monitor the areas and months with the highest variability (Supplementary Figure S1). The analysis shows that December, January, February, and March exhibit the highest standard deviations. Among all months, February records the greatest variability, with standard deviations exceeding 500 m. The region with the highest variability is the northwestern Mediterranean Sea, particularly near the Gulf of Lion.
To better understand long-term monthly patterns, monthly linear trends of MLD from 1990 to 2019 are calculated (Figure 3) and presented separately for each decade in Supplementary Figures S2-S4. For each month, a separate linear trend is applied at every grid point, using time (in years) as the independent variable and MLD as the dependent variable. The slope of the fitted line represents the MLD trend (in meters per year) for that month, indicating whether the mixed layer has been deepening or shoaling over time.
Figure 3
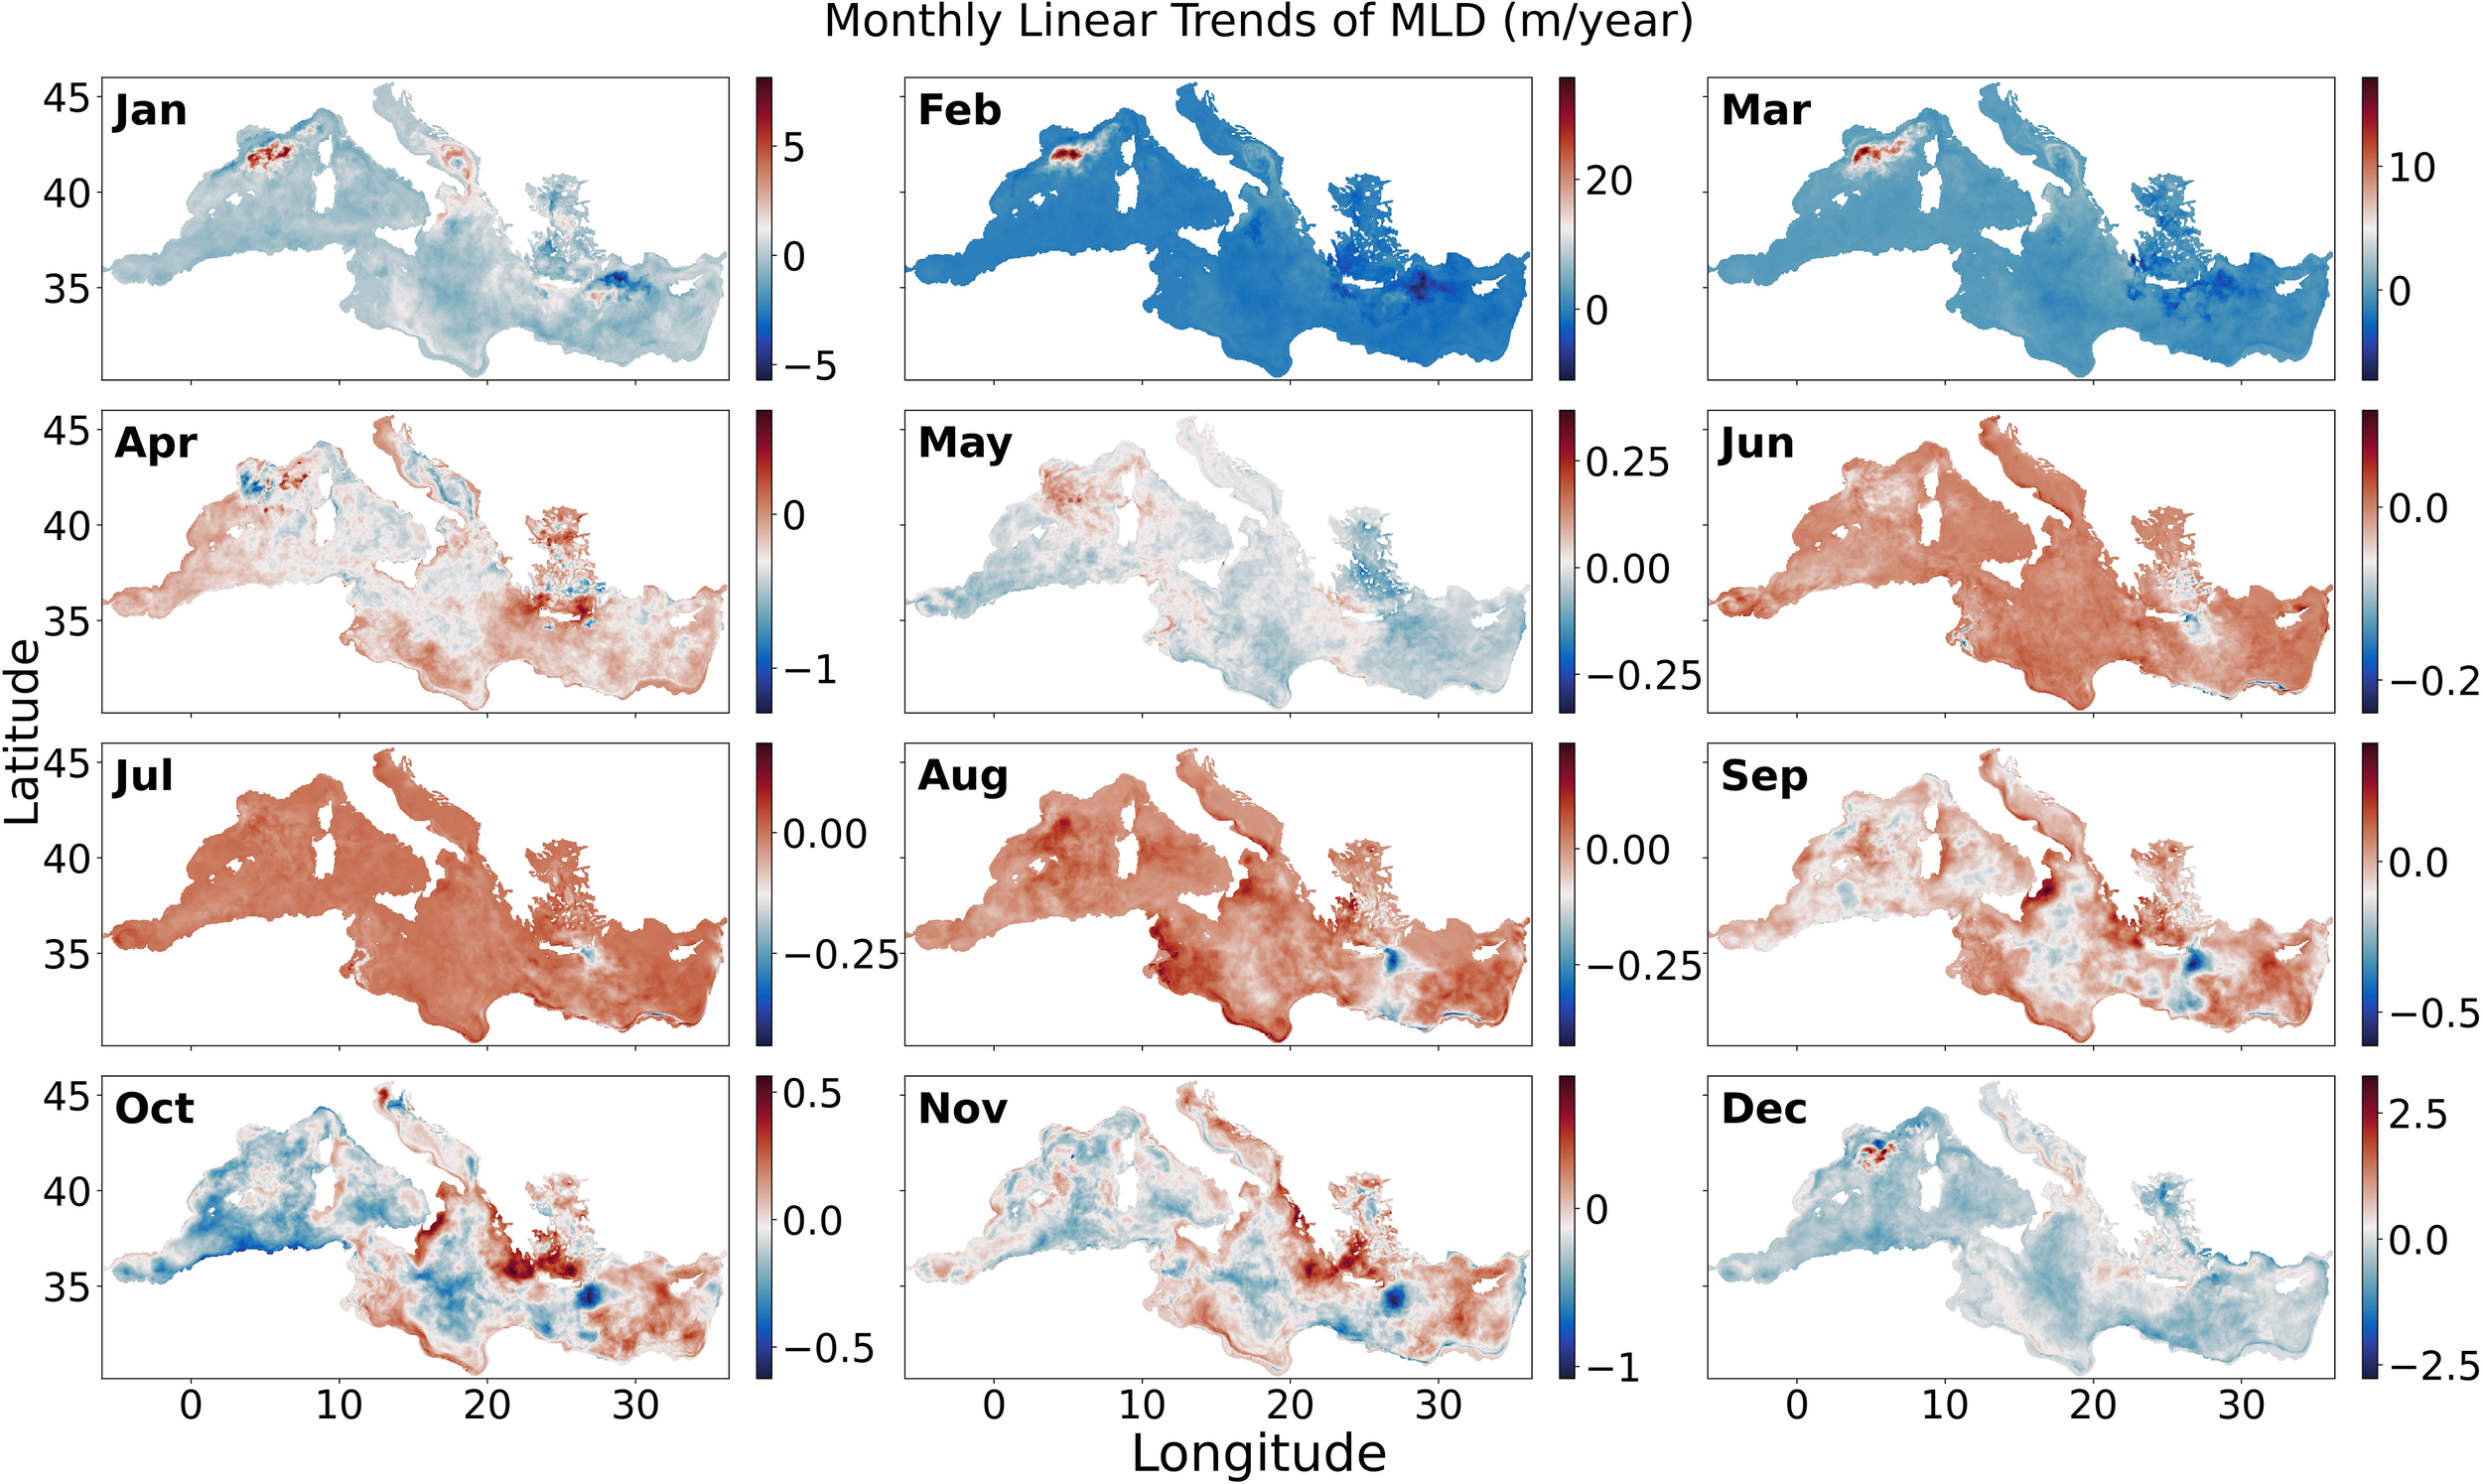
Monthly linear trends of mixed layer depth (MLD; m yr-1) over the Mediterranean Sea for the period 1990–2019. Each panel corresponds to a different month, showing the spatial distribution of the linear trend estimated at every grid point. Positive values indicate a deepening of the mixed layer, while negative values indicate a shoaling.
During the cold months (December–March), the basin is largely dominated by negative trends, indicating a long-term shoaling of the mixed layer. This trend reaches up to 10 m in the eastern Mediterranean, particularly near the Levantine Basin. However, localized deepening is observed south of the Gulf of Lion, with increases of approximately 2 m in December, 7.5 m in January, 25 m in February, and 15 m in March. An analysis of each decade separately shows an increase of up to 20 m in the Gulf of Lion, and a decrease of about 25 m in other areas during the 1990s (Supplementary Figure S2). In the 2000s (Supplementary Figure S3), there is an increase of about 100 m in the Gulf of Lion, particularly in February. In the 2010s (Supplementary Figure S4), the MLD decreases by up to 100 m in the Gulf of Lion, while other areas show an increase of about 20 m.
April, with values ranging from –1 to 0.5 m (Figure 3), exhibits a mix of increasing and decreasing trends across the Mediterranean Sea, though decreases dominate the area overall. Based on the decade-separated analysis, the 1990s show a decrease of about 5 m across most of the western Mediterranean basin, while some areas in the east show slight increases (Supplementary Figure S2). In the 2000s (Supplementary Figure S3), most areas experienced a decrease of a few meters, whereas in the 2010s an overall increase is observed (Supplementary Figure S4). The most positive trends are found in the western and eastern Mediterranean.
Other months (Figure 3) generally show a decrease of about 20 cm in most areas, while from June to September, an increase of up to 20 cm per year is observed in many regions. In October, most of the western Mediterranean displays a decrease of up to 60 cm, whereas the eastern Ionian and Levantine Seas show increases of 30–40 cm. In November, an increase of around 50 cm is observed in some parts of the eastern Mediterranean, including the Ionian Sea, Adriatic Sea, and Levantine Basin, although some areas within the Levantine Sea and the western Mediterranean basin experience shoaling of about 1 m.
Based on the analysis of monthly trends in the Mediterranean Sea from 1990 to 2019, using the median slope method for all grid points (Supplementary Figure S5A), we can conclude that in January and February, the MLD shows an increase of approximately 10 cm per year, with the lowest uncertainty among all months. For the remaining months, there is generally a decreasing trend in MLD. Notably, April and November exhibit decreases of 18 cm/year and 10 cm/year, respectively, both with the highest statistical certainty. In December, MLD decreases by about 20 cm/year, showing a moderate level of certainty.
Taken together, Winter and to a lesser extent spring, drive most interdecadal MLD variability, with the strongest signals in the Gulf of Lion, Levantine Basin, and Southern Adriatic, which are examined further in the next section.
3.3 Seasonal and inter-basin variability of MLD
Seasonal mean MLD time series (1990–2019) are extracted for the NW Mediterranean (Gulf of Lion and its surroundings), Southern Adriatic, Levantine Basin, and the Mediterranean as a whole (Figure 1). For each domain, we formed seasonal decadal means for three periods—1990s (1990–99), 2000s (2000–09), 2010s (2010–19)—by averaging all monthly MLD fields within each season and decade inside the domain. Decadal changes are then expressed as percent differences relative to the earlier decade.
In the NW Mediterranean, results reveal pronounced deepening during winter and spring from the 1990s to 2000s, with strong positive trends of +63.1% in winter and +61.2% in spring (Table 1). Summer and autumn instead show weak shoaling (−0.5%/dec and −5.3%/dec). This asymmetry highlights the dominance of convective season deepening in shaping the long-term signal. In the Southern Adriatic, MLD trends remain modest. Winter shows moderate deepening (+8.6%/dec), spring a small increase (+2.3%/dec), while summer and autumn are essentially stable (~0%/dec). From the 2000s to the 2010s, the Northwestern Mediterranean and the Southern Adriatic generally experienced shoaling of the mixed layer in all seasons, except for spring in the NW Mediterranean, consistent with the overall Mediterranean trend.
Table 1
| Basin/season | Winter (1990s→2000s/2000s→2010s) | Spring (1990s→2000s/2000s→2010s) | Summer (1990s→2000s/2000s→2010s) | Autumn (1990s→2000s/2000s→2010s) |
|---|---|---|---|---|
| NW Med | +63.1%/−6.7% | +61.2%/+3.4% | +0.8%/−1.6% | −9.7%/−1.5% |
| Southern Adriatic | +25.4%/−0.5% | +8.7%/−5.1% | +0.7%/−0.1% | +7.7%/−6.3% |
| Levantine Basin | −11.5%/−1.3% | −20.2%/−4.4% | −1.9%/−0.6% | −0.4%/−1.5% |
| Whole Mediterranean | −0.1%/−1.7% | −6.3%/−2.2% | −0.2%/−0.5% | −1.9%/−2.3% |
Percent changes in seasonal mean MLD between consecutive decades (1990s→2000s and 2000s→2010s) for the NW Mediterranean (Gulf of Lion), Southern Adriatic, Levantine Basin, and the Mediterranean as a whole. Values are expressed as relative changes (%) based on decadal means. Positive values indicate deepening, while negative values indicate shoaling. Percent change is calculated as 100×(D2−D1)/D1, where D1 and D2 are the mean MLD values for the earlier and later decades, respectively.
In the Levantine Basin, MLD trends are opposite to those in the NW Mediterranean. Winter and spring show consistent shoaling (−7.4%/dec and −12.8%/dec), with smaller declines in summer and autumn. For the whole Mediterranean, regression indicates a basin-wide shoaling tendency, weaker than in the Levantine. Winter and spring show modest negative trends (−1.7%/dec and −4.2%/dec), while summer and autumn changes remain small but still negative.
Inter-basin correlation analysis based on monthly data further highlights this spatial variability (Figure 4). Strong positive correlations are found between the Southern Adriatic and the Whole Mediterranean (R = 0.93; Figure 4E) and between the Levantine Basin and the Whole Mediterranean (R = 0.96; Figure 4F), indicating that variability in these sub-basins strongly influences the basin-wide signal. In contrast, correlations involving the NW Mediterranean are weaker, particularly with the Levantine Basin (R = 0.57; Figure 4B), reflecting the opposing long-term trends and regional heterogeneity.
Figure 4
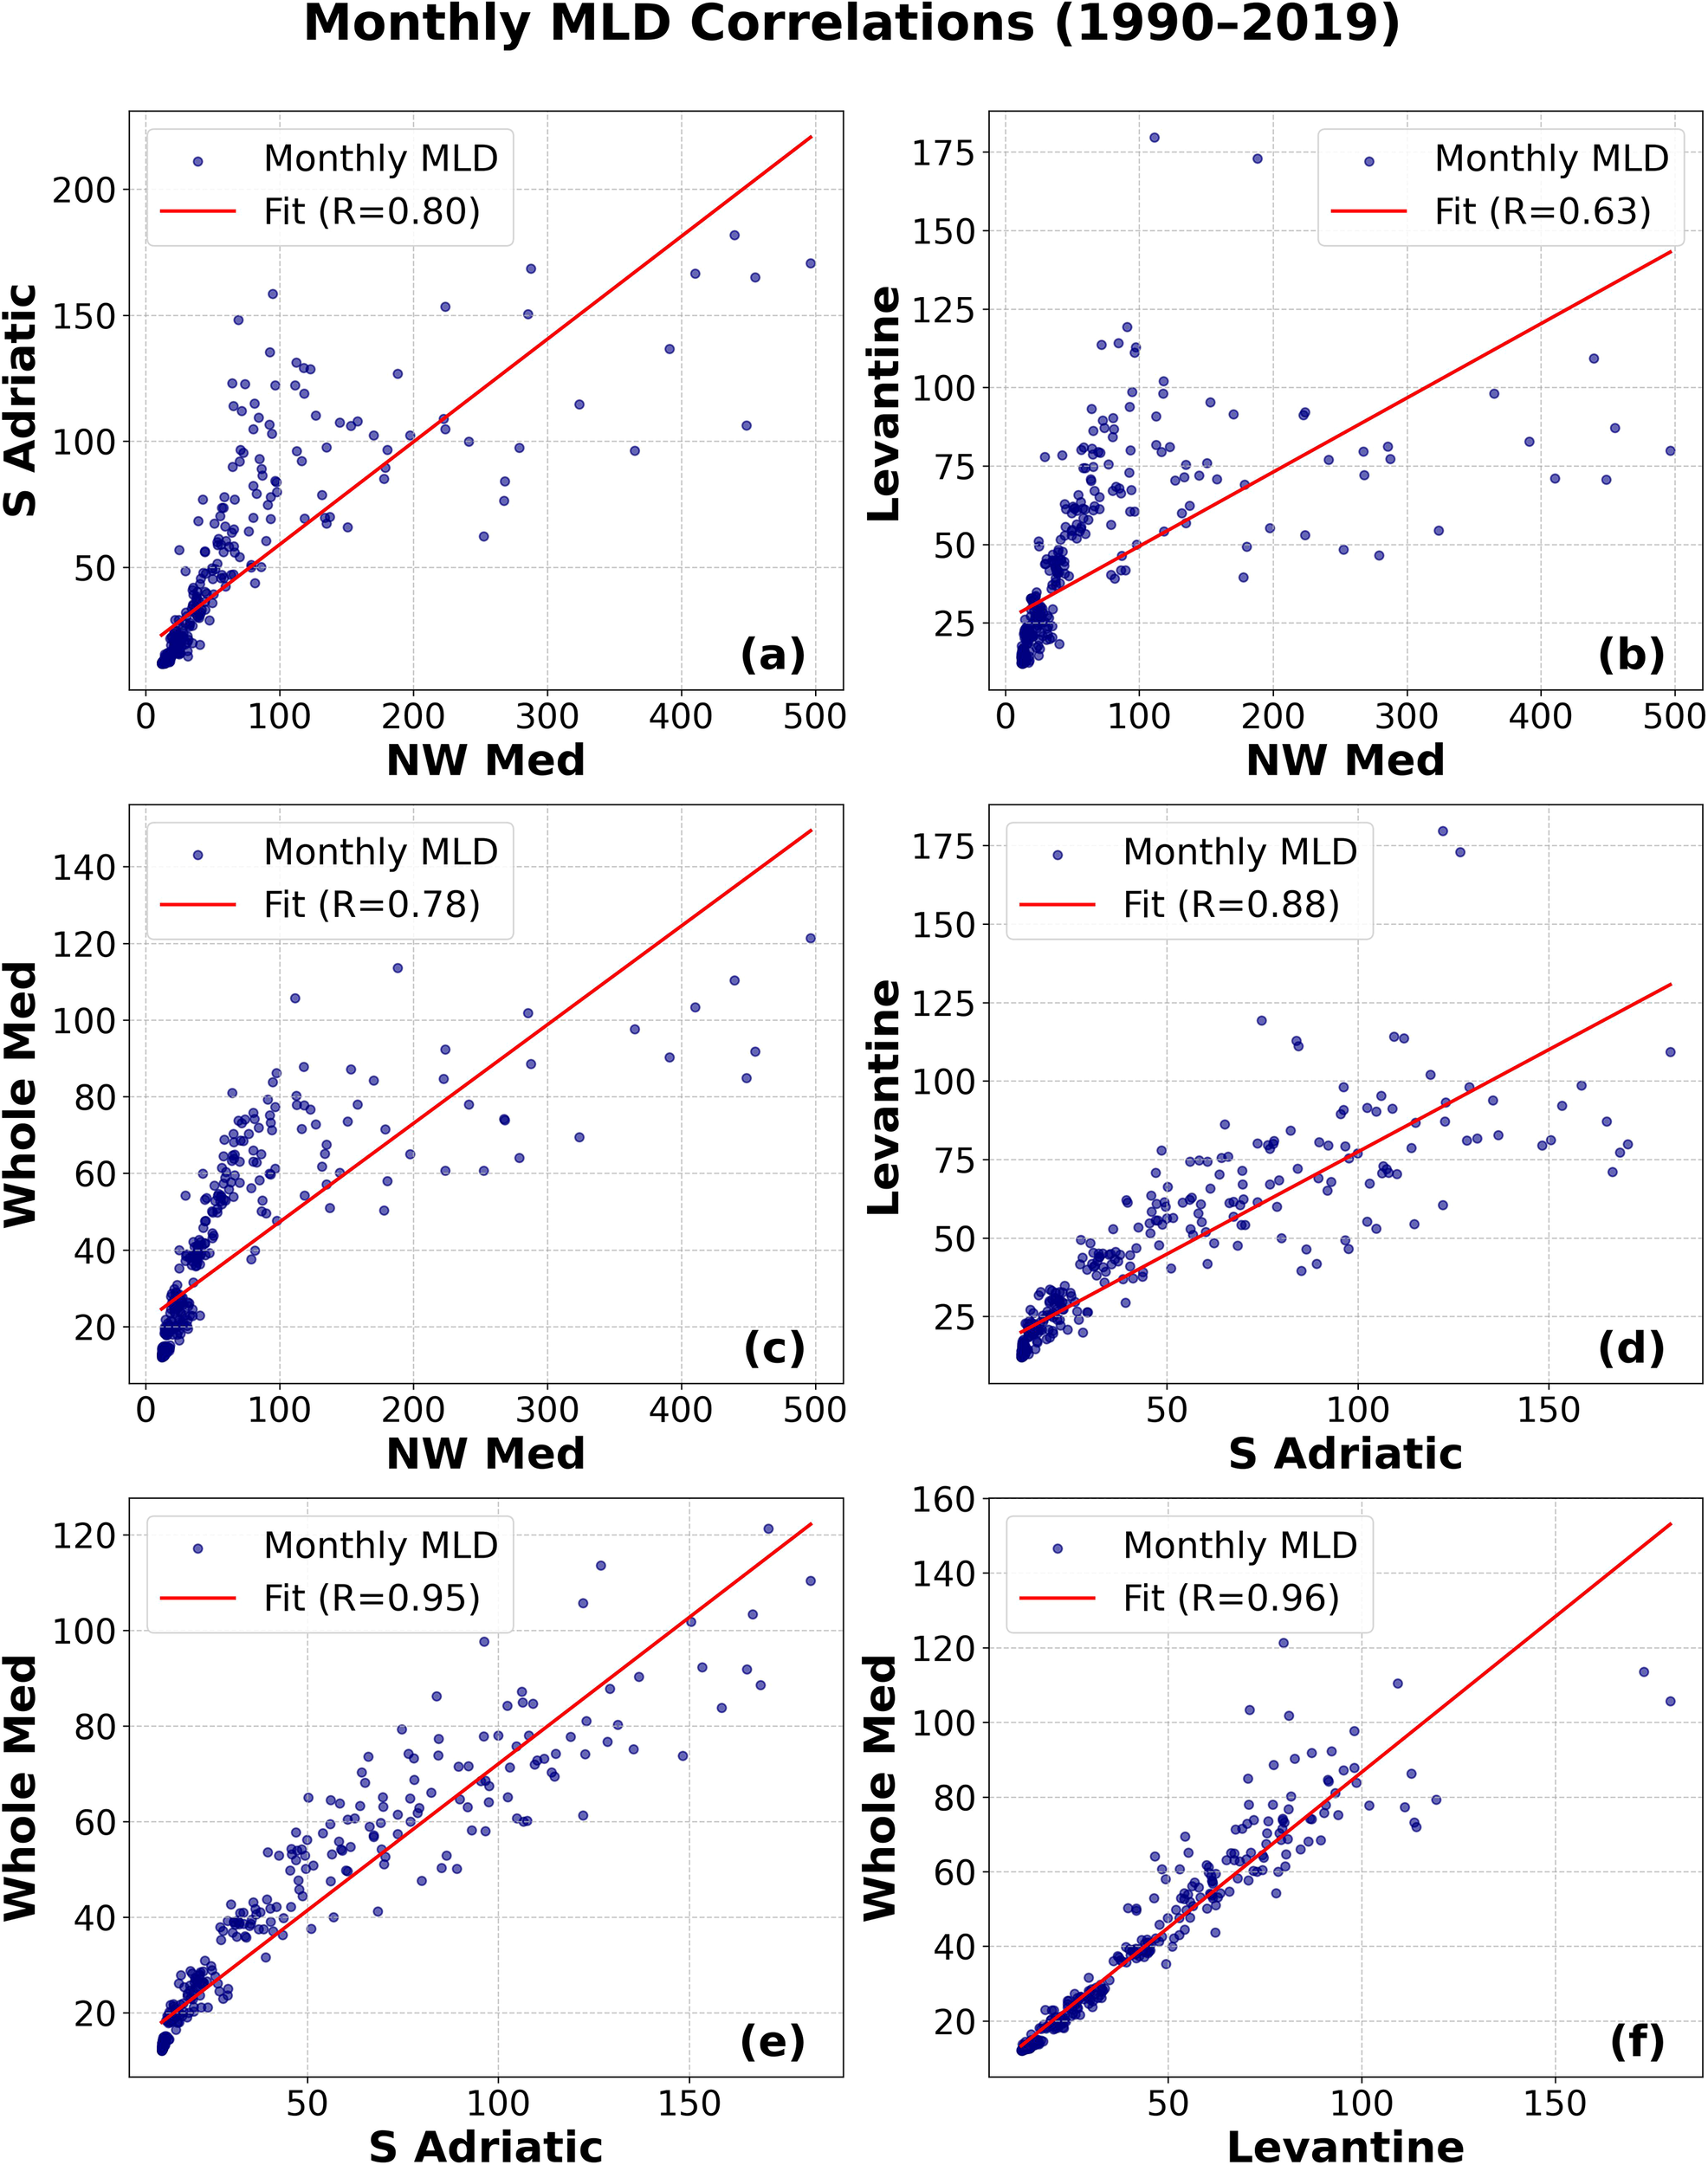
Monthly MLD correlations between Mediterranean sub-basins over the period 1990–2019. Each panel shows scatterplots of monthly mean MLDs for a pair of basins, with least-squares regression lines (red) and corresponding correlation coefficients (R).
Based on this section, two key points emerge. The Mediterranean Sea as a whole exhibits a long-term shoaling of the mixed layer on a decadal time scale, while in specific regions, such as the NW Mediterranean, it can be seen an anomalous deepening. This raises two scientific questions:
-
What mechanisms could explain the apparent overall tendency toward mixed-layer shoaling in some months in the Mediterranean Sea?
-
Why does the NW Mediterranean show a remarkable increase in mixed layer depth, particularly from the 1990s to 2000s?
In the rest of this paper, the paper focuses primarily on the first question, as the second involves a strong local atmospheric forcing and deep convection processes dataset, which requires dedicated analysis and will be addressed in future work. It should also be noted that in the 2010s, a shoaling of the mixed layer is observable in the NW Mediterranean, in line with the general trend across the entire basin.
4 Drivers of variability
MLD in the Mediterranean Sea is primarily controlled by wind forcing, background stratification, surface heat fluxes, and freshwater exchanges. Strong winds enhance turbulence and mixing, deepening the MLD, whereas vertical density gradients (stratification) limit how far turbulence can penetrate. Among these drivers, wind and stratification are the most influential: stronger winds deepen the MLD, while stronger stratification shoals it. Section 3 highlights the variability of MLD in the Mediterranean Sea, revealing a long-term decreasing trend of about 50–60 cm over the study period (≈6 cm per year). Wind primarily drives surface mixing, whereas temperature and salinity regulate stratification, which controls the resistance of the water column to vertical mixing. By analysing long-term datasets, we can link observed MLD trends to changes in these physical drivers. Section 4.1 evaluates the role of wind variability, while Section 4.2 examines the influence of stratification on MLD variability in the Mediterranean Sea.
4.1 Wind speed: surface mixing
In this section, the wind stress components over the entire Mediterranean Sea are extracted from the reanalysis data. Using Equation 1, the wind stress is calculated based on the monthly data. τ is the vector sum of wind stress in the zonal (τx) and meridional (τγ) directions.
The resulting wind stress field is spatially averaged over the Mediterranean basin (Figure 5).
Figure 5
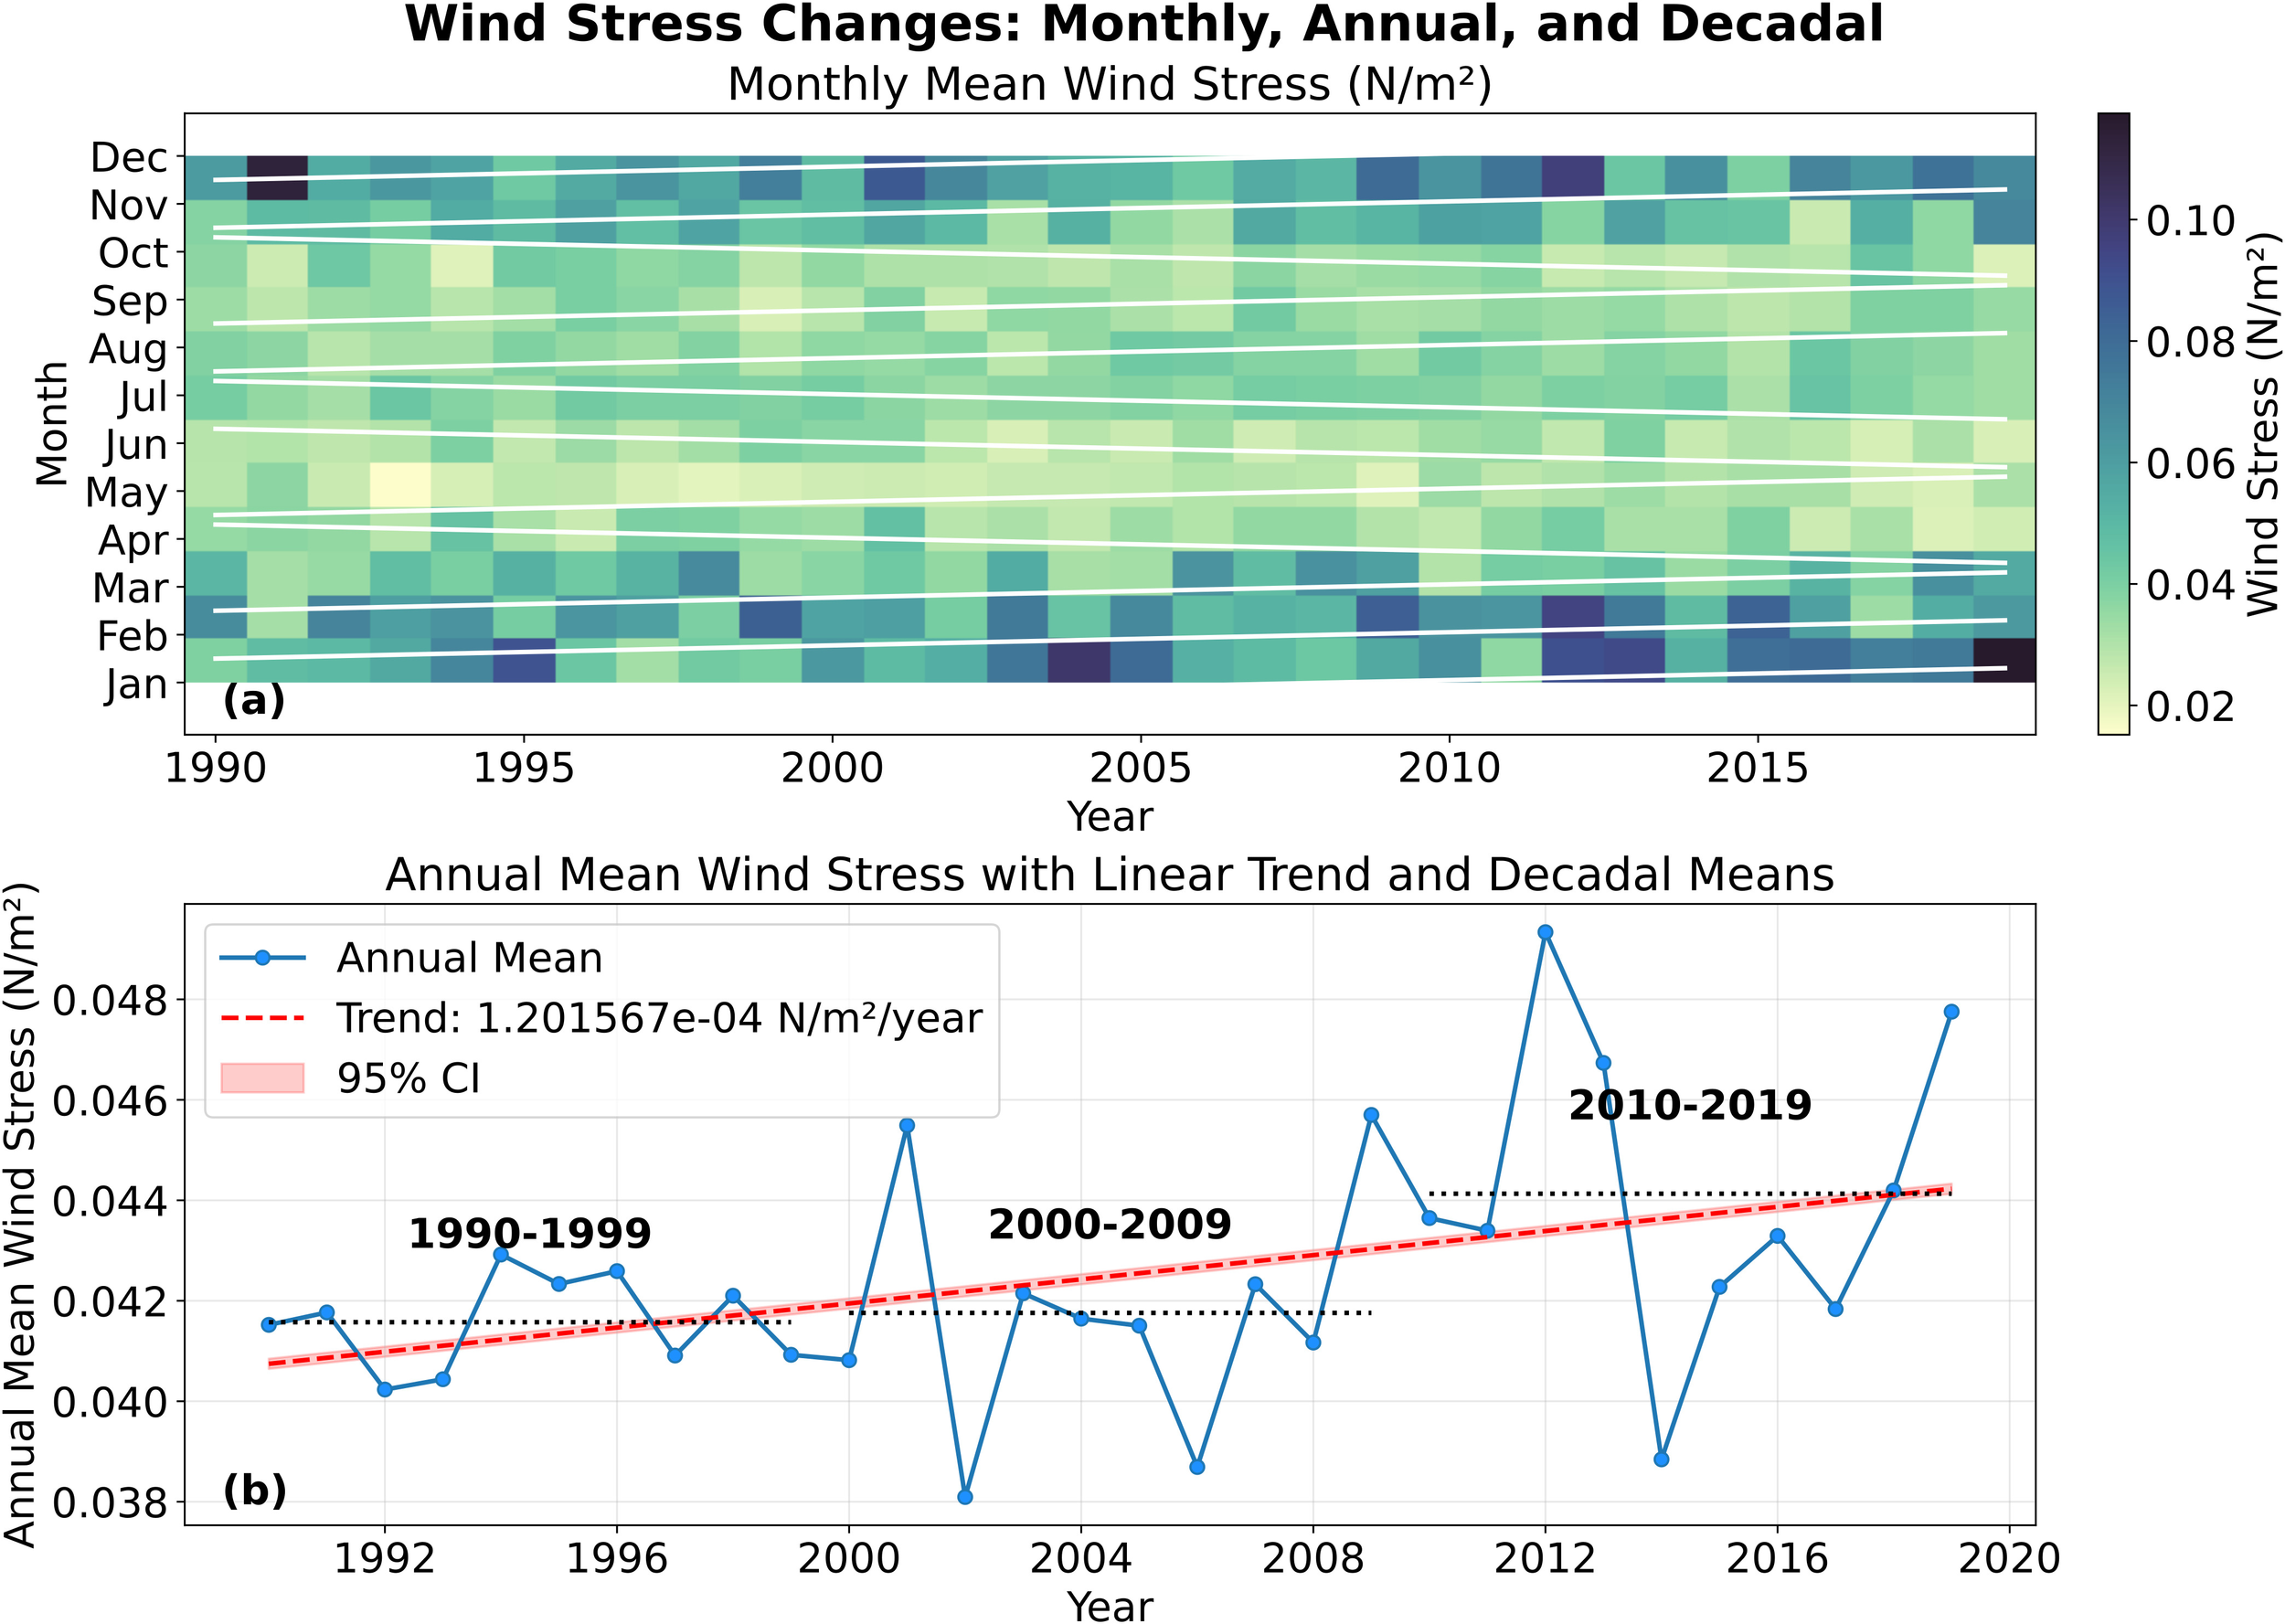
(a) Hovmöller diagram showing monthly wind stress τ (Pa) over multiple years. White lines indicate linear trends for each month. (b) Annual mean wind speed time series with an overlaid linear trend (red dashed line) with 95% confidence interval (CI), and decadal mean values (black dotted lines). Decadal ranges are labelled above each horizontal line.
The Hovmöller diagram of monthly mean wind stress (Figure 5a) highlights persistent seasonal cycles throughout the 1990–2019 period. Monthly values typically range between 0.02 and 0.10 N m-2, with the highest wind stress values occurring during late autumn and winter (approximately November–February), when values regularly exceed 0.06 N m-2. In contrast, weaker wind forcing appears during late spring and summer, often falling below 0.04 N m-2. This seasonal modulation plays a direct role in controlling vertical shear and turbulent mixing within the upper ocean.
The annual mean wind stress time series (Figure 5b) exhibits pronounced interannual variability, with values fluctuating between roughly 0.038 and 0.048 N m-2 over the 30-year record. The decadal averages reveal distinct shifts in wind forcing regimes: from 1990–1999, values cluster near 0.040 N m-2; during 2000–2009, a modest increase is evident, with means rising toward 0.041–0.042 N m-2; and from 2010–2019, annual means frequently exceed 0.044 N m-2, marking the highest decade in the record.
The linear trend indicates a statistically coherent increase in wind stress of approximately 1.20 × 10⁻⁴ N m-2 yr-1, with a shaded 95% confidence interval supporting the robustness of this trend. Although this gradual intensification suggests slightly enhanced wind-driven mixing over recent decades, the magnitude of the increase is relatively small.
The monthly wind stress magnitude trends over the Mediterranean Sea for the period 1990–2019 reveal distinct spatial and seasonal variability (Figure 6). The most prominent positive trends occur during winter, particularly in January and February, when the northwestern Mediterranean—especially the Gulf of Lion and adjacent regions—shows a marked increase in wind stress magnitude. This suggests an intensification of wintertime wind forcing. In contrast, spring months such as April display negative trends over parts of the western Mediterranean, indicating a weakening of wind stress during this season. It directly supports the result shown in Figure 3, which indicates shoaling of the MLD in the northwestern Mediterranean, as well as an overall decrease in MLD across the entire Mediterranean Sea, consistent with Supplementary Figure S5A. There is also good agreement between Figure 3 and Figure 6 in the northwestern Mediterranean.
Figure 6
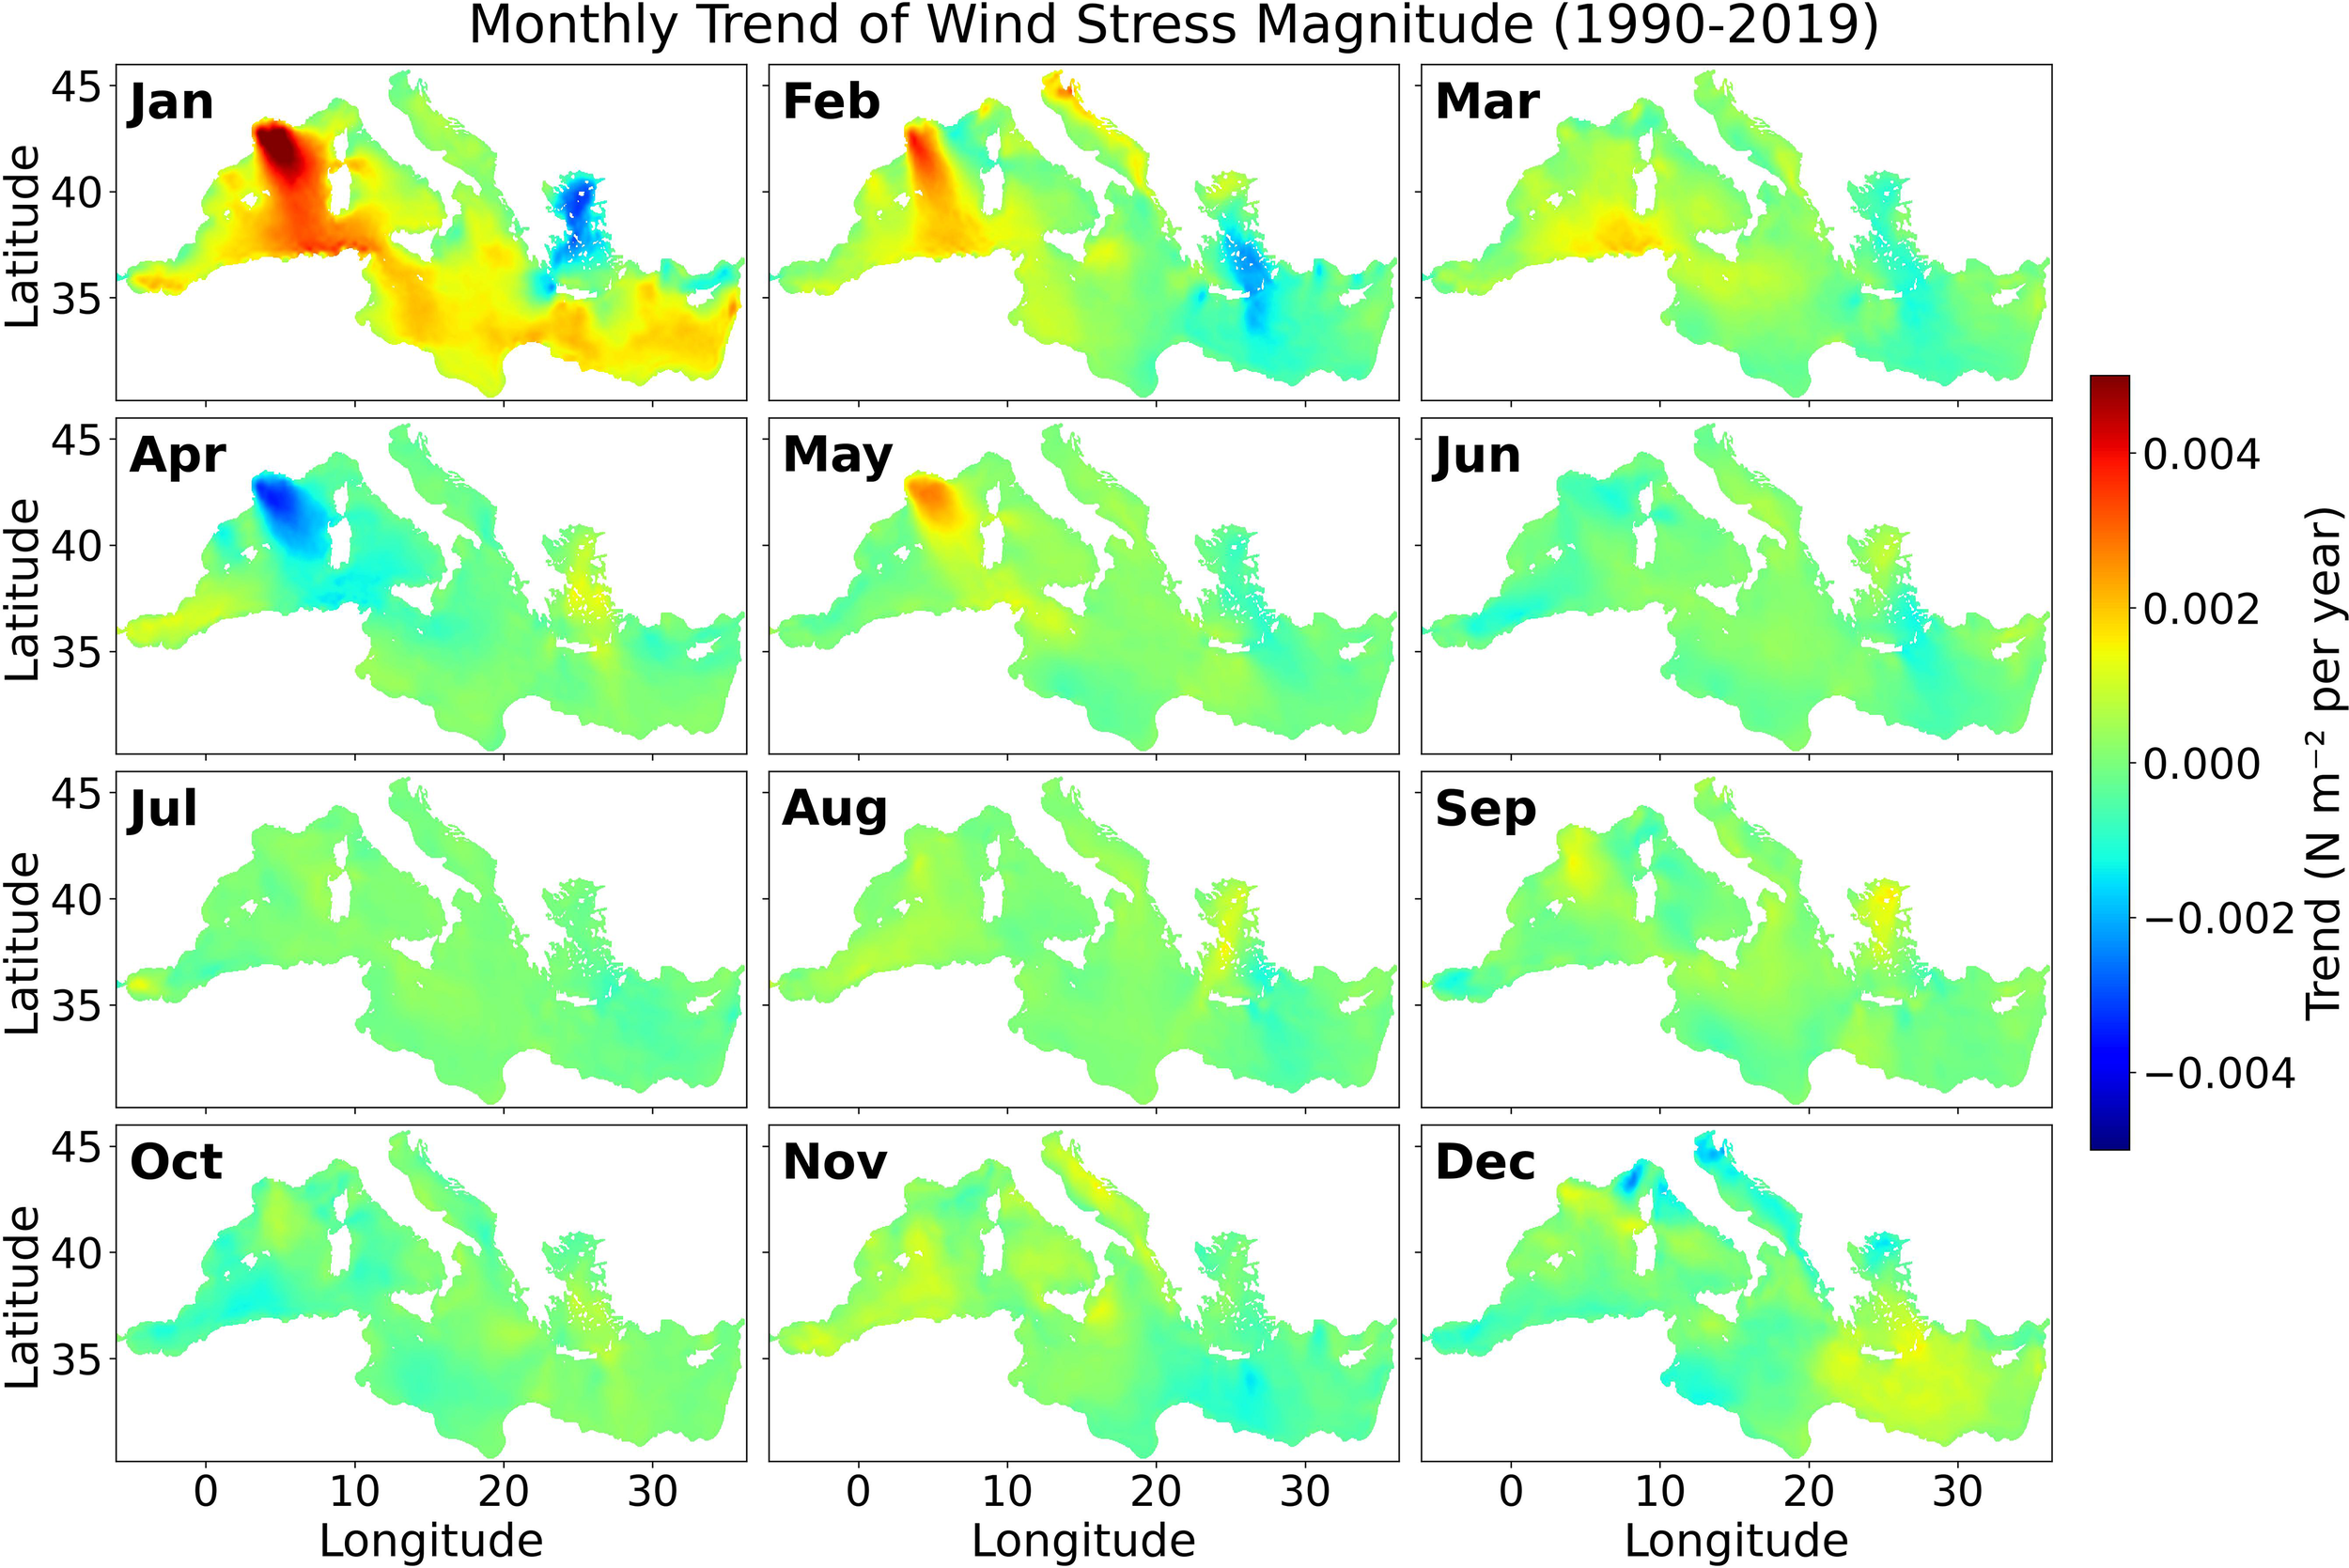
Monthly trends of wind stress magnitude (N·m-2·year-1) over the period 1990–2019. Each panel shows the linear trend for a specific month at each grid point. Positive values indicate an increasing trend, while negative values indicate a decreasing trend.
During summer (June–August), the trends are generally weak and spatially uniform, with values close to zero across most of the basin. This reflects the relative stability of summer wind regimes and the absence of significant long-term changes in wind intensity. In autumn, moderate positive trends reappear, particularly in November and December, though they are less intense and more spatially confined than those observed in winter.
Based on the analysis of monthly trends in wind stress over the Mediterranean Sea from 1990 to 2019, using the median-slope method applied to all grid points (Supplementary Figure S5B), we can conclude that January shows an increase of 0.0012 N m-2 per year with the highest level of certainty. Although only a small increase in MLD is observed across the Mediterranean, the results suggest that during the cold season, other factors also contribute to MLD variability in addition to wind. According to Figure 6, most of this contribution is associated with the northwestern Mediterranean Sea. There is also good agreement between the decrease in wind stress and the observed decrease in MLD. In May, the increase in wind stress is also detected with good certainty, while for the remaining months the uncertainty is relatively high.
4.2 Temperature and salinity as drivers of stratification
Temperature and salinity are the key determinants of ocean stratification, governing the water column’s stability and its resistance to vertical mixing. Strong stratification suppresses mixed-layer deepening, whereas weaker stratification enhances vertical exchange between surface and subsurface waters. This section examines the temporal variability and long-term trends of temperature (Section 4.2.1) and salinity (Section 4.2.2) as the primary factors shaping stratification.
4.2.1 Surface and subsurface temperature variability
Monthly average surface temperatures in the entire Mediterranean Sea (Figure 7a) show a clear seasonal cycle ranging between ~14°C in winter and ~28°C in summer. Superimposed on this variability is a statistically long-term warming trend (red dashed line), suggesting that surface waters have been gradually becoming warmer over the past three decades. This persistent surface warming has implications for surface heat storage and air–sea fluxes.
Figure 7
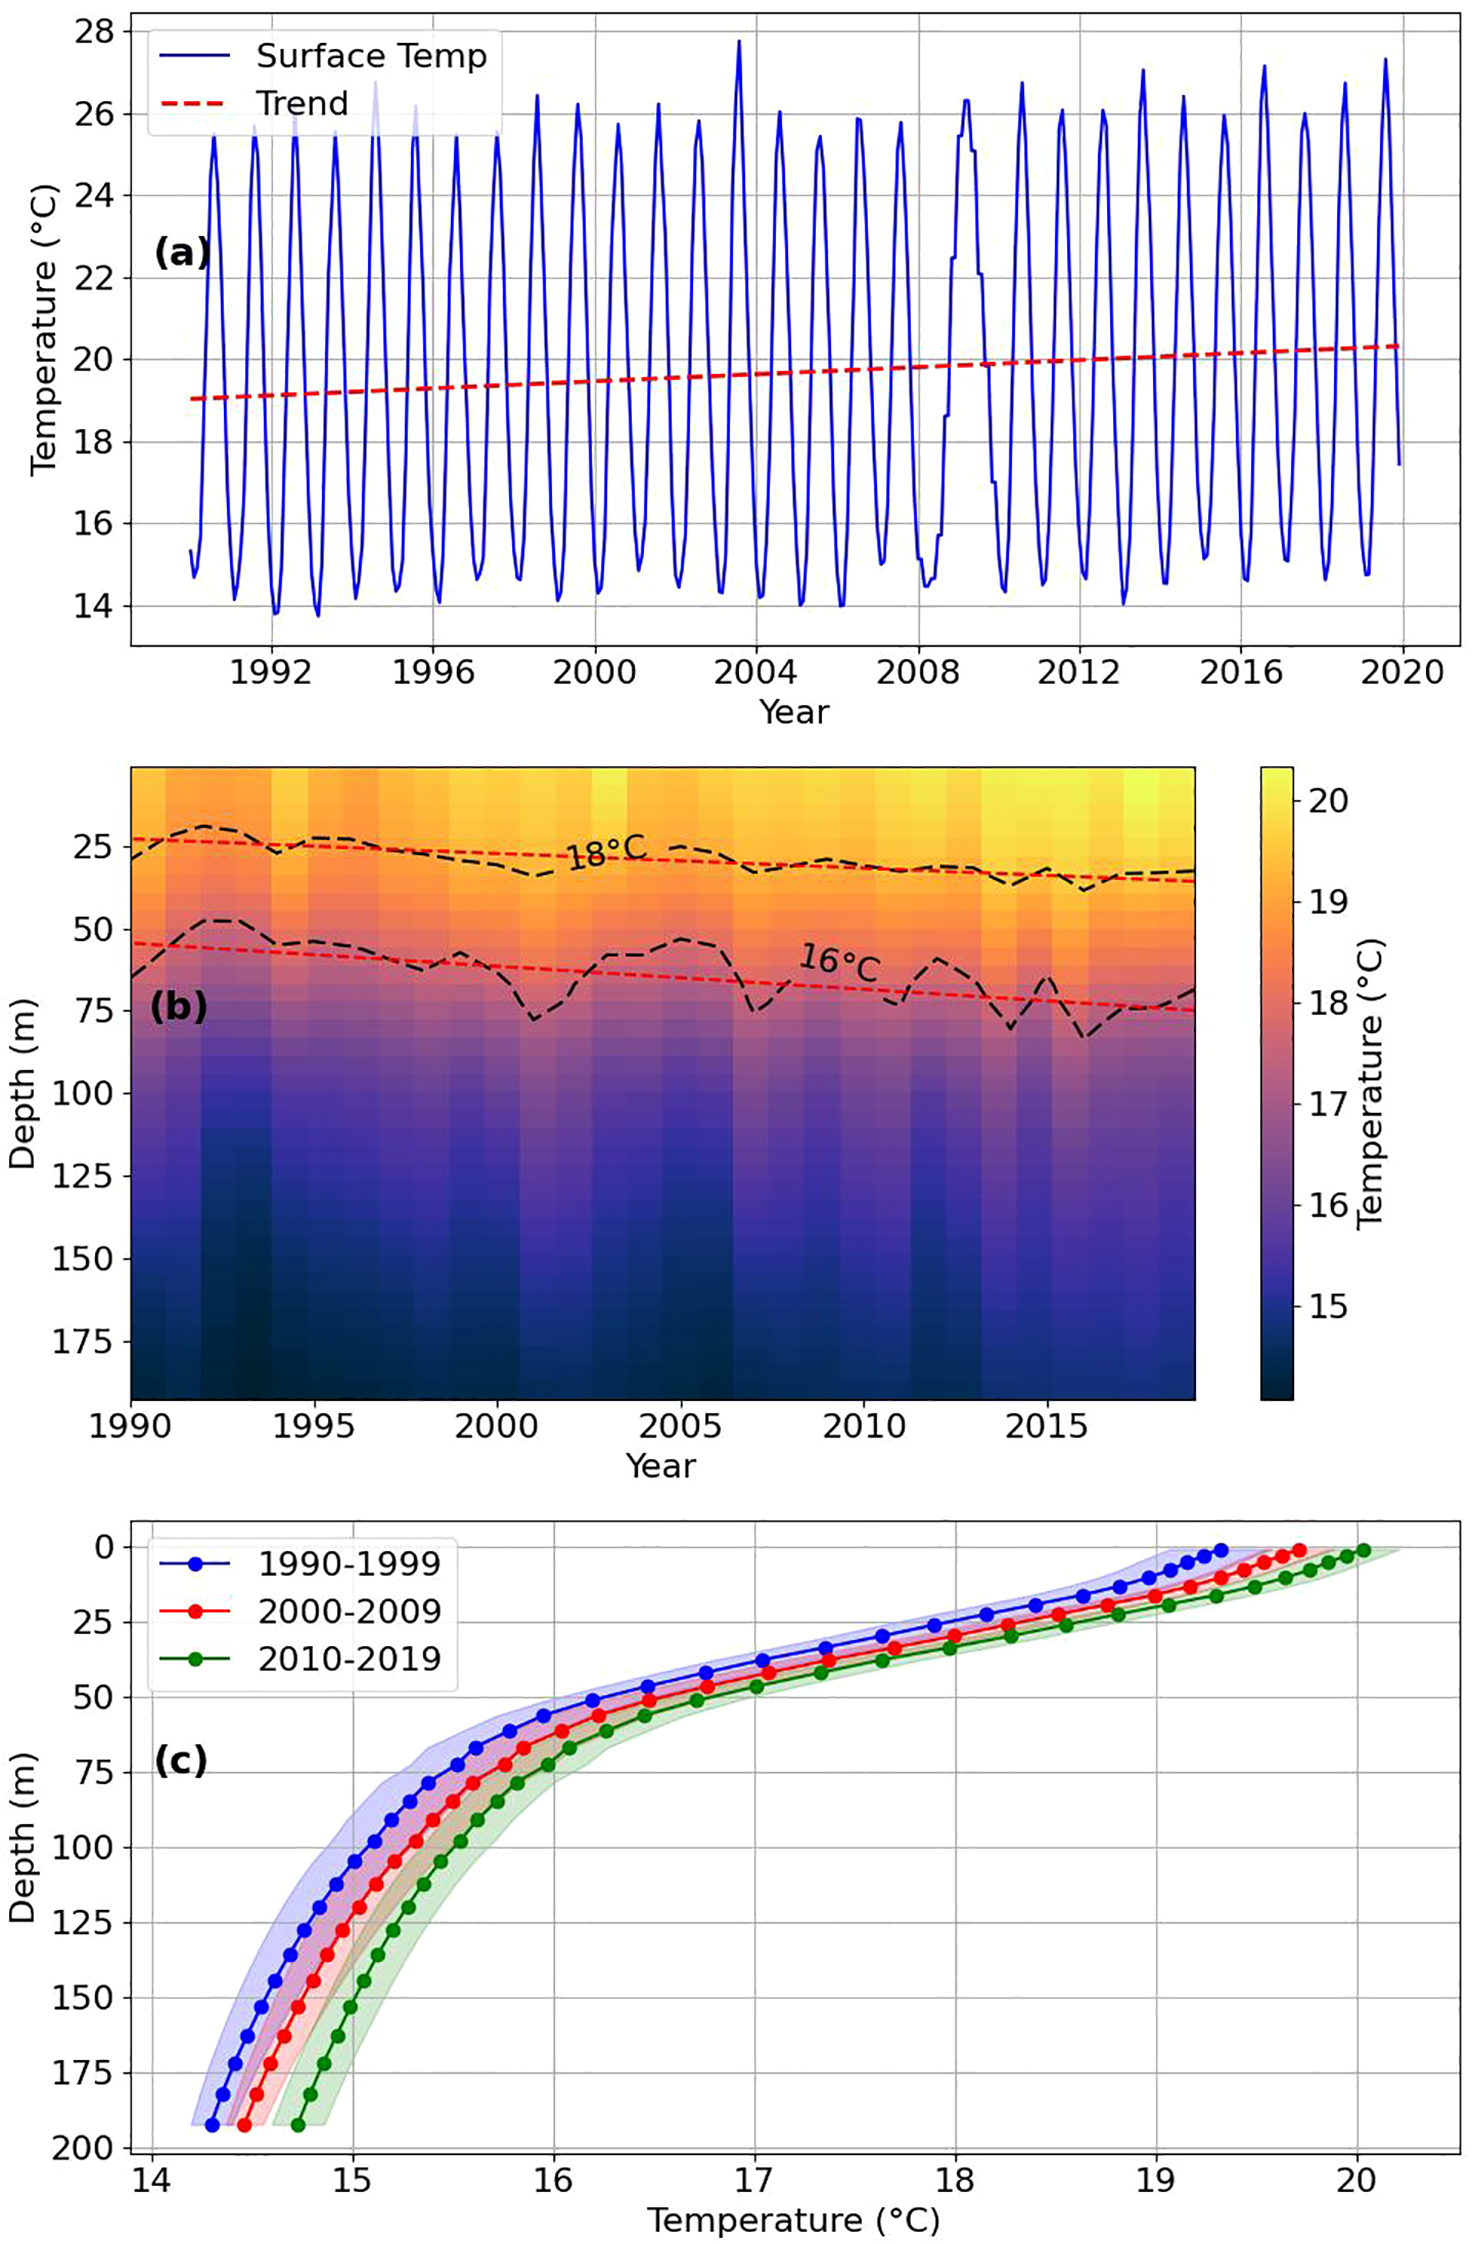
(a) Monthly surface temperature time series (°C) with its linear trend (red dashed line). (b) Yearly temperature profiles at different depths, visualized as a heatmap with contour lines at 16°C and 18°C. Red dashed lines indicate linear trends of these contour levels over time. (c) Decadal mean temperature depth profiles for 1990–1999, 2000–2009, and 2010–2019. Shaded areas represent standard deviation.
Yearly averaged time–depth profiles (Figure 7b) highlight the longer-term evolution of the thermal structure. Strong oscillations are confined to the upper ~50 m, reflecting the integrated effect of seasonal cycles, while layers below ~75 m remain relatively stable. The yearly averaged contour lines at 16°C and 18°C show gradual shoaling trends over the study period, with red dashed lines indicating warming at intermediate depths. This demonstrates that the warming signal is not restricted to the surface but has been progressively penetrating the thermocline on decadal scales.
Decadal mean vertical profiles (Figure 7c) reinforce this pattern. Between the 1990s and 2010s, the upper 100 m warmed consistently, with the most pronounced changes below ~50 m. The decadal progression illustrates a systematic upward displacement of isotherms. Shaded areas representing standard deviation highlight interannual to decadal variability, but the overall trend remains robust: surface and subsurface waters are warming, and the thermal gradient across the upper ocean has intensified.
Together, these results indicate that the study region is experiencing long-term warming throughout the upper water column. The implications of this warming for ocean stratification will be examined in Section 4.3.
4.2.2 Surface and subsurface salinity variability
Monthly surface salinity (Figure 8a) shows clear seasonal oscillations superimposed on a significant long-term upward trend. Surface values increased from ~38.1 PSU in the early 1990s to ~38.35 PSU by 2019, with the red dashed line confirming a persistent salinification of the surface layer. This trend suggests enhanced evaporation and/or reduced freshwater input in the study region over recent decades.
Figure 8
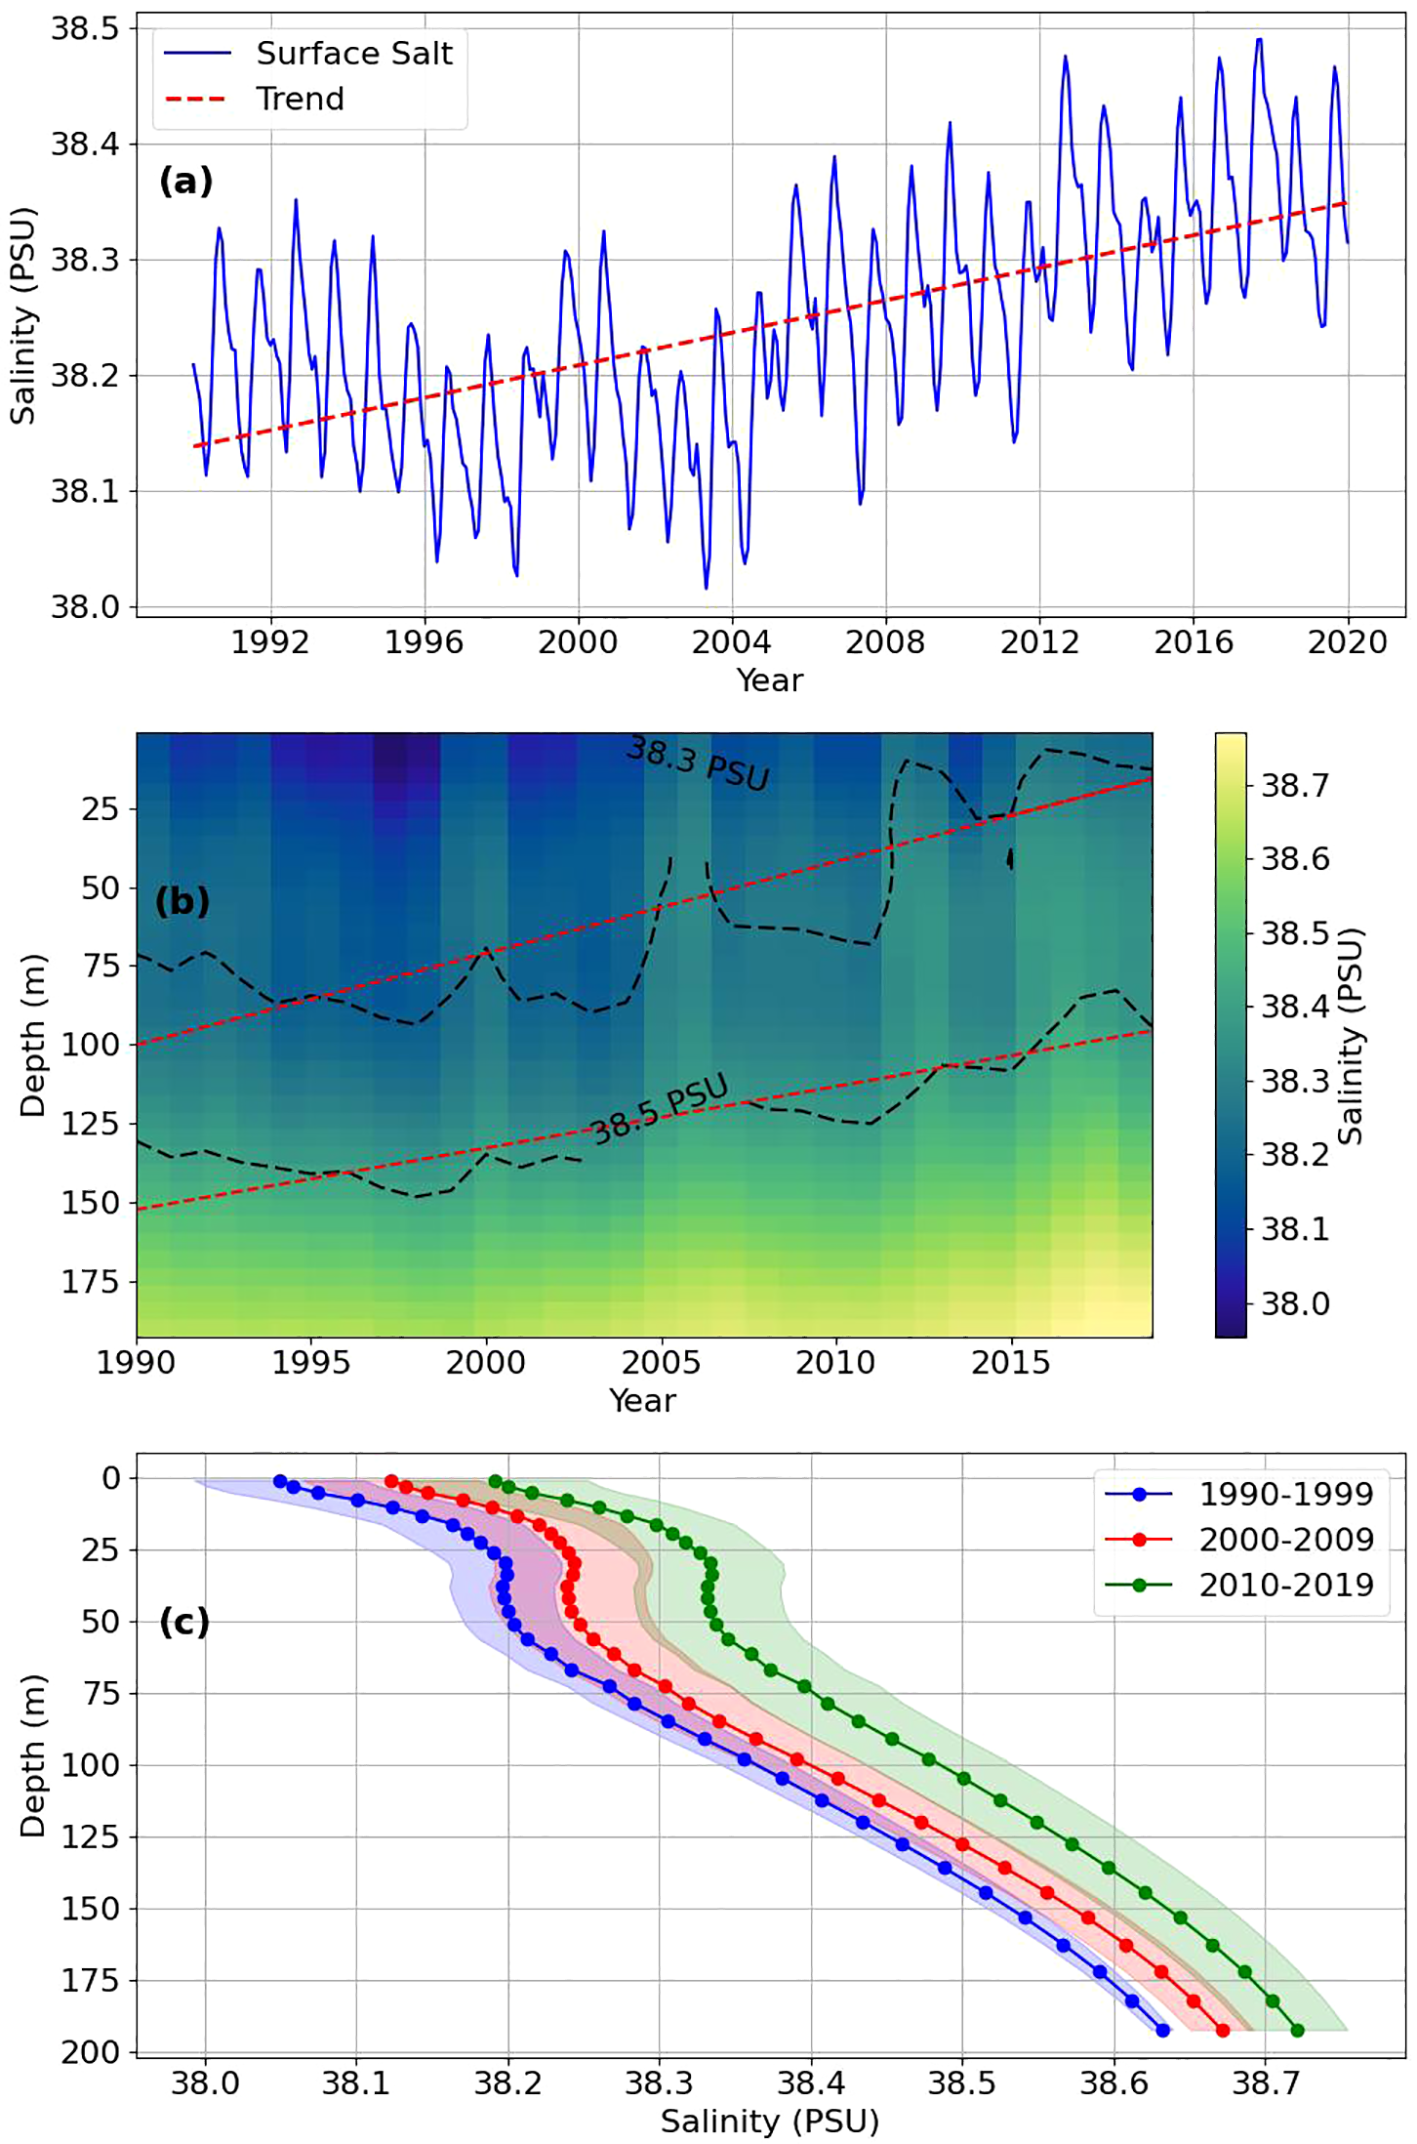
Salinity variations over time and depth. (a) Monthly surface salinity with a linear trend (red dashed line). (b) Yearly salinity heatmap with black dashed contours at 38.3 and 38.5 PSU and red dashed trendlines showing the depth evolution of these isohalines. (c) Decadal mean salinity profiles with standard deviation shading for 1990–1999 (blue), 2000–2009 (red), and 2010–2019 (green), illustrating vertical changes in salinity structure over time.
The yearly averaged salinity distribution with depth (Figure 8b) highlights a sustained vertical salinity gradient throughout the water column. While seasonal variability dominates the near-surface layers, the contour lines at 38.3 and 38.5 PSU show a systematic deepening over time, as indicated by the red dashed trendlines. This reflects progressive salinification not only at the surface but also in subsurface layers, indicating that the signal of increasing salinity penetrates downward through the upper ~150 m. The enhanced subsurface salinity trend is especially important, as it amplifies density differences and contributes to long-term stratification changes.
Decadal mean salinity profiles (Figure 8c) further illustrate this progression. Between the 1990s and 2010s, salinity increased consistently at nearly all depths. The upper ~50 m shows a modest rise, but the most pronounced changes occur below this depth, where salinity has steadily shifted toward higher values. The shaded standard deviation envelopes emphasize natural variability, yet the overall upward shift across decades is robust. The vertical migration of isohalines and the overall salinification of the water column point to an intensifying haline contribution to density stratification.
Taken together, these findings demonstrate that salinity has increased steadily in both surface and subsurface layers over the past three decades. This progressive salinification, combined with warming trends (Section 4.2.1), has likely strengthened upper-ocean stratification, which will be analysed in Section 4.3.
4.3 Long-term trends in upper-ocean stratification
The combined effects of wind-driven mixing, surface heating, and salinity changes are reflected in the stratification of the water column, here quantified (Equation 2) by the Brunt–Väisälä frequency (N2), defined as
where g= 9.8 m/s2 is gravity, ρ is potential density, ρ0 =1025kgm−3 is a reference density, and z is positive upward. Positive values of N² indicate stable stratification, with larger values corresponding to stronger resistance to vertical mixing. Because mixed layer depth is strongly controlled by the balance between surface forcing (e.g., wind stress, buoyancy fluxes) and background stratification, analysing N² provides insight into the mechanisms driving the observed shoaling or deepening of the MLD (Kraus and Turner, 1967; Mertens and Schott, 1998).
The time–depth distribution of N² (Figure 9a) shows consistently stronger stratification in the upper ~50 m, coinciding with the seasonal thermocline, while values decline with depth. Over the 30-year period, stratification patterns reveal substantial interannual variability, particularly near the surface, reflecting the combined influence of seasonal cycles, episodic atmospheric forcing, and surface buoyancy fluxes. The density contours (isopycnals) suggest a gradual shoaling of stratification zones, consistent with surface warming and salinification trends identified in Sections 4.2.1 and 4.2.2.
Figure 9
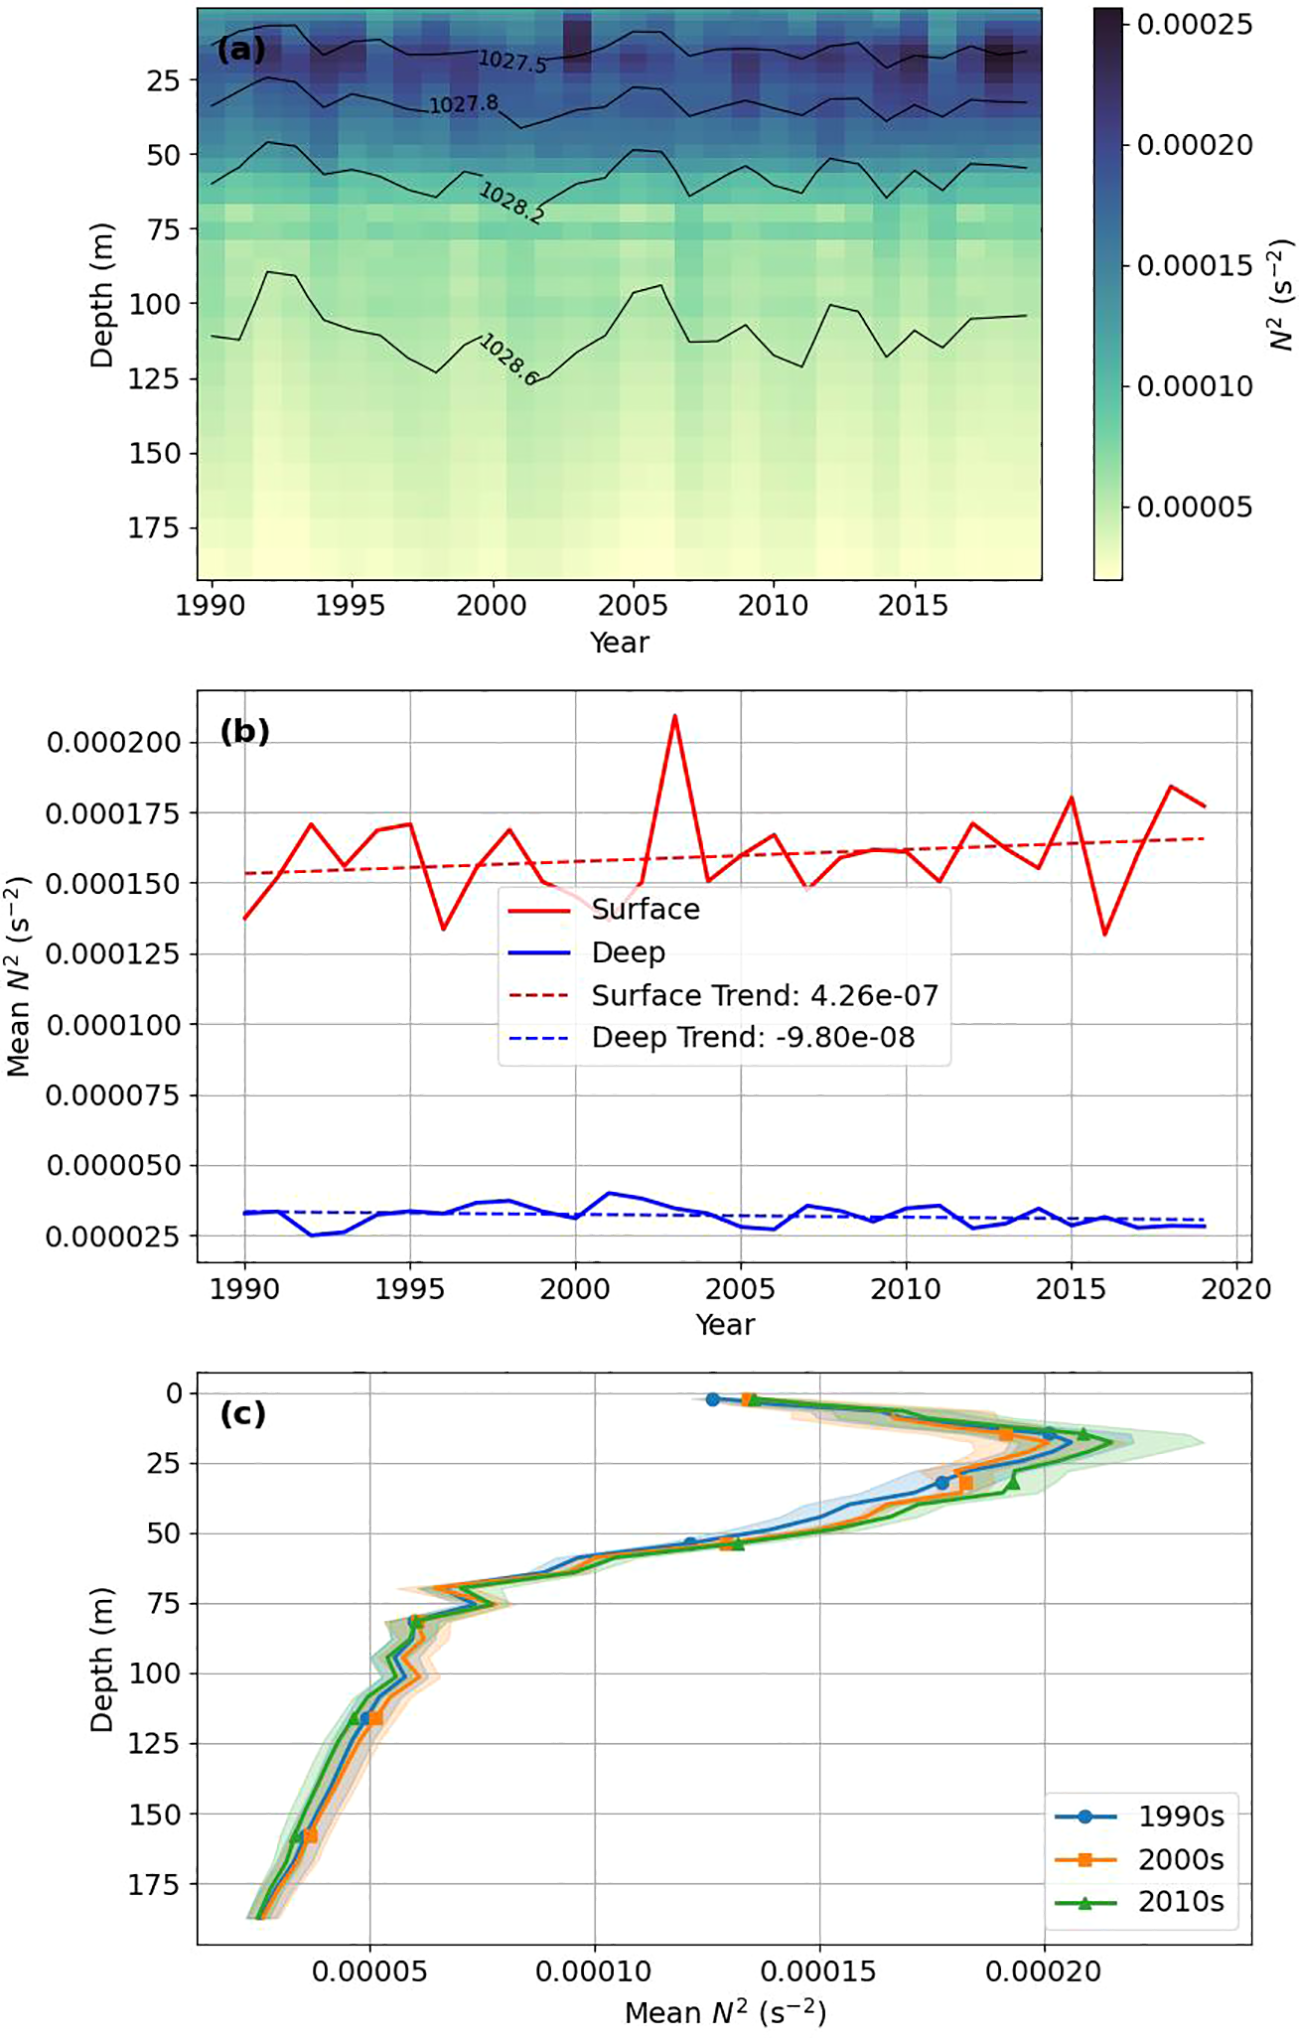
Stratification variability in the study region over 1990–2019, quantified by the Brunt–Väisälä frequency (N²). (a) Time-depth heatmap of N² with overlaid density contours (isopycnals), showing interannual and vertical variations. (b) Mean annual N² in surface (0 to 50 m) and deep (150 to 200 m) layers, with linear trends indicating long-term changes. (c) Decadal mean vertical profiles for the 1990s, 2000s, and 2010s, with shaded areas representing standard deviation, highlighting variability within each decade.
Mean annual N² values for surface (0 to 50 m) and deep (100 to 200m) (Figure 9b) highlight contrasting trends. Surface stratification exhibits a positive trend (+4.26 × 10⁻⁷ s-2 per decade), corresponding to ~2.8% per decade relative to the mean (1.52 × 10⁻⁵ s-2). In contrast, deep-layer stratification shows no significant long-term trend (−9.80 × 10⁻⁸ s-2, not significant), suggesting that density gradients at depth have weakened slightly, likely due to the combined effects of long-term salinity increases and reduced vertical mixing. These opposing trends underline the dominant role of temperature in shaping surface stability, while salinity exerts stronger control in deeper layers.
Decadal mean vertical profiles (Figure 9c) further emphasize the persistence of the overall stratification structure across decades. The strongest gradients remain concentrated in the upper 50 m, with stability decreasing rapidly below 150 m. Despite interannual fluctuations (shaded variability envelopes), the overall shape of the profiles has changed little between the 1990s, 2000s, and 2010s. This suggests that while surface and subsurface layers are becoming slightly more stratified, the fundamental vertical distribution of N² has remained stable over time.
A clear seasonal structure shows in the spatial pattern of long-term surface N² trends across the Mediterranean between 1990 and 2019 (Figure 10). During the cold season (late autumn–winter; November–March), trends are generally small and near zero throughout most of the basin, with only sparse and weak positive or negative patches near the coasts. In contrast, the transition into spring produces a pronounced shift: April exhibits extensive and coherent positive trends in surface N² across much of the basin, especially over shelf and coastal regions, whereas May develops large, spatially organized negative anomalies in several central and eastern sub-basins.
Figure 10
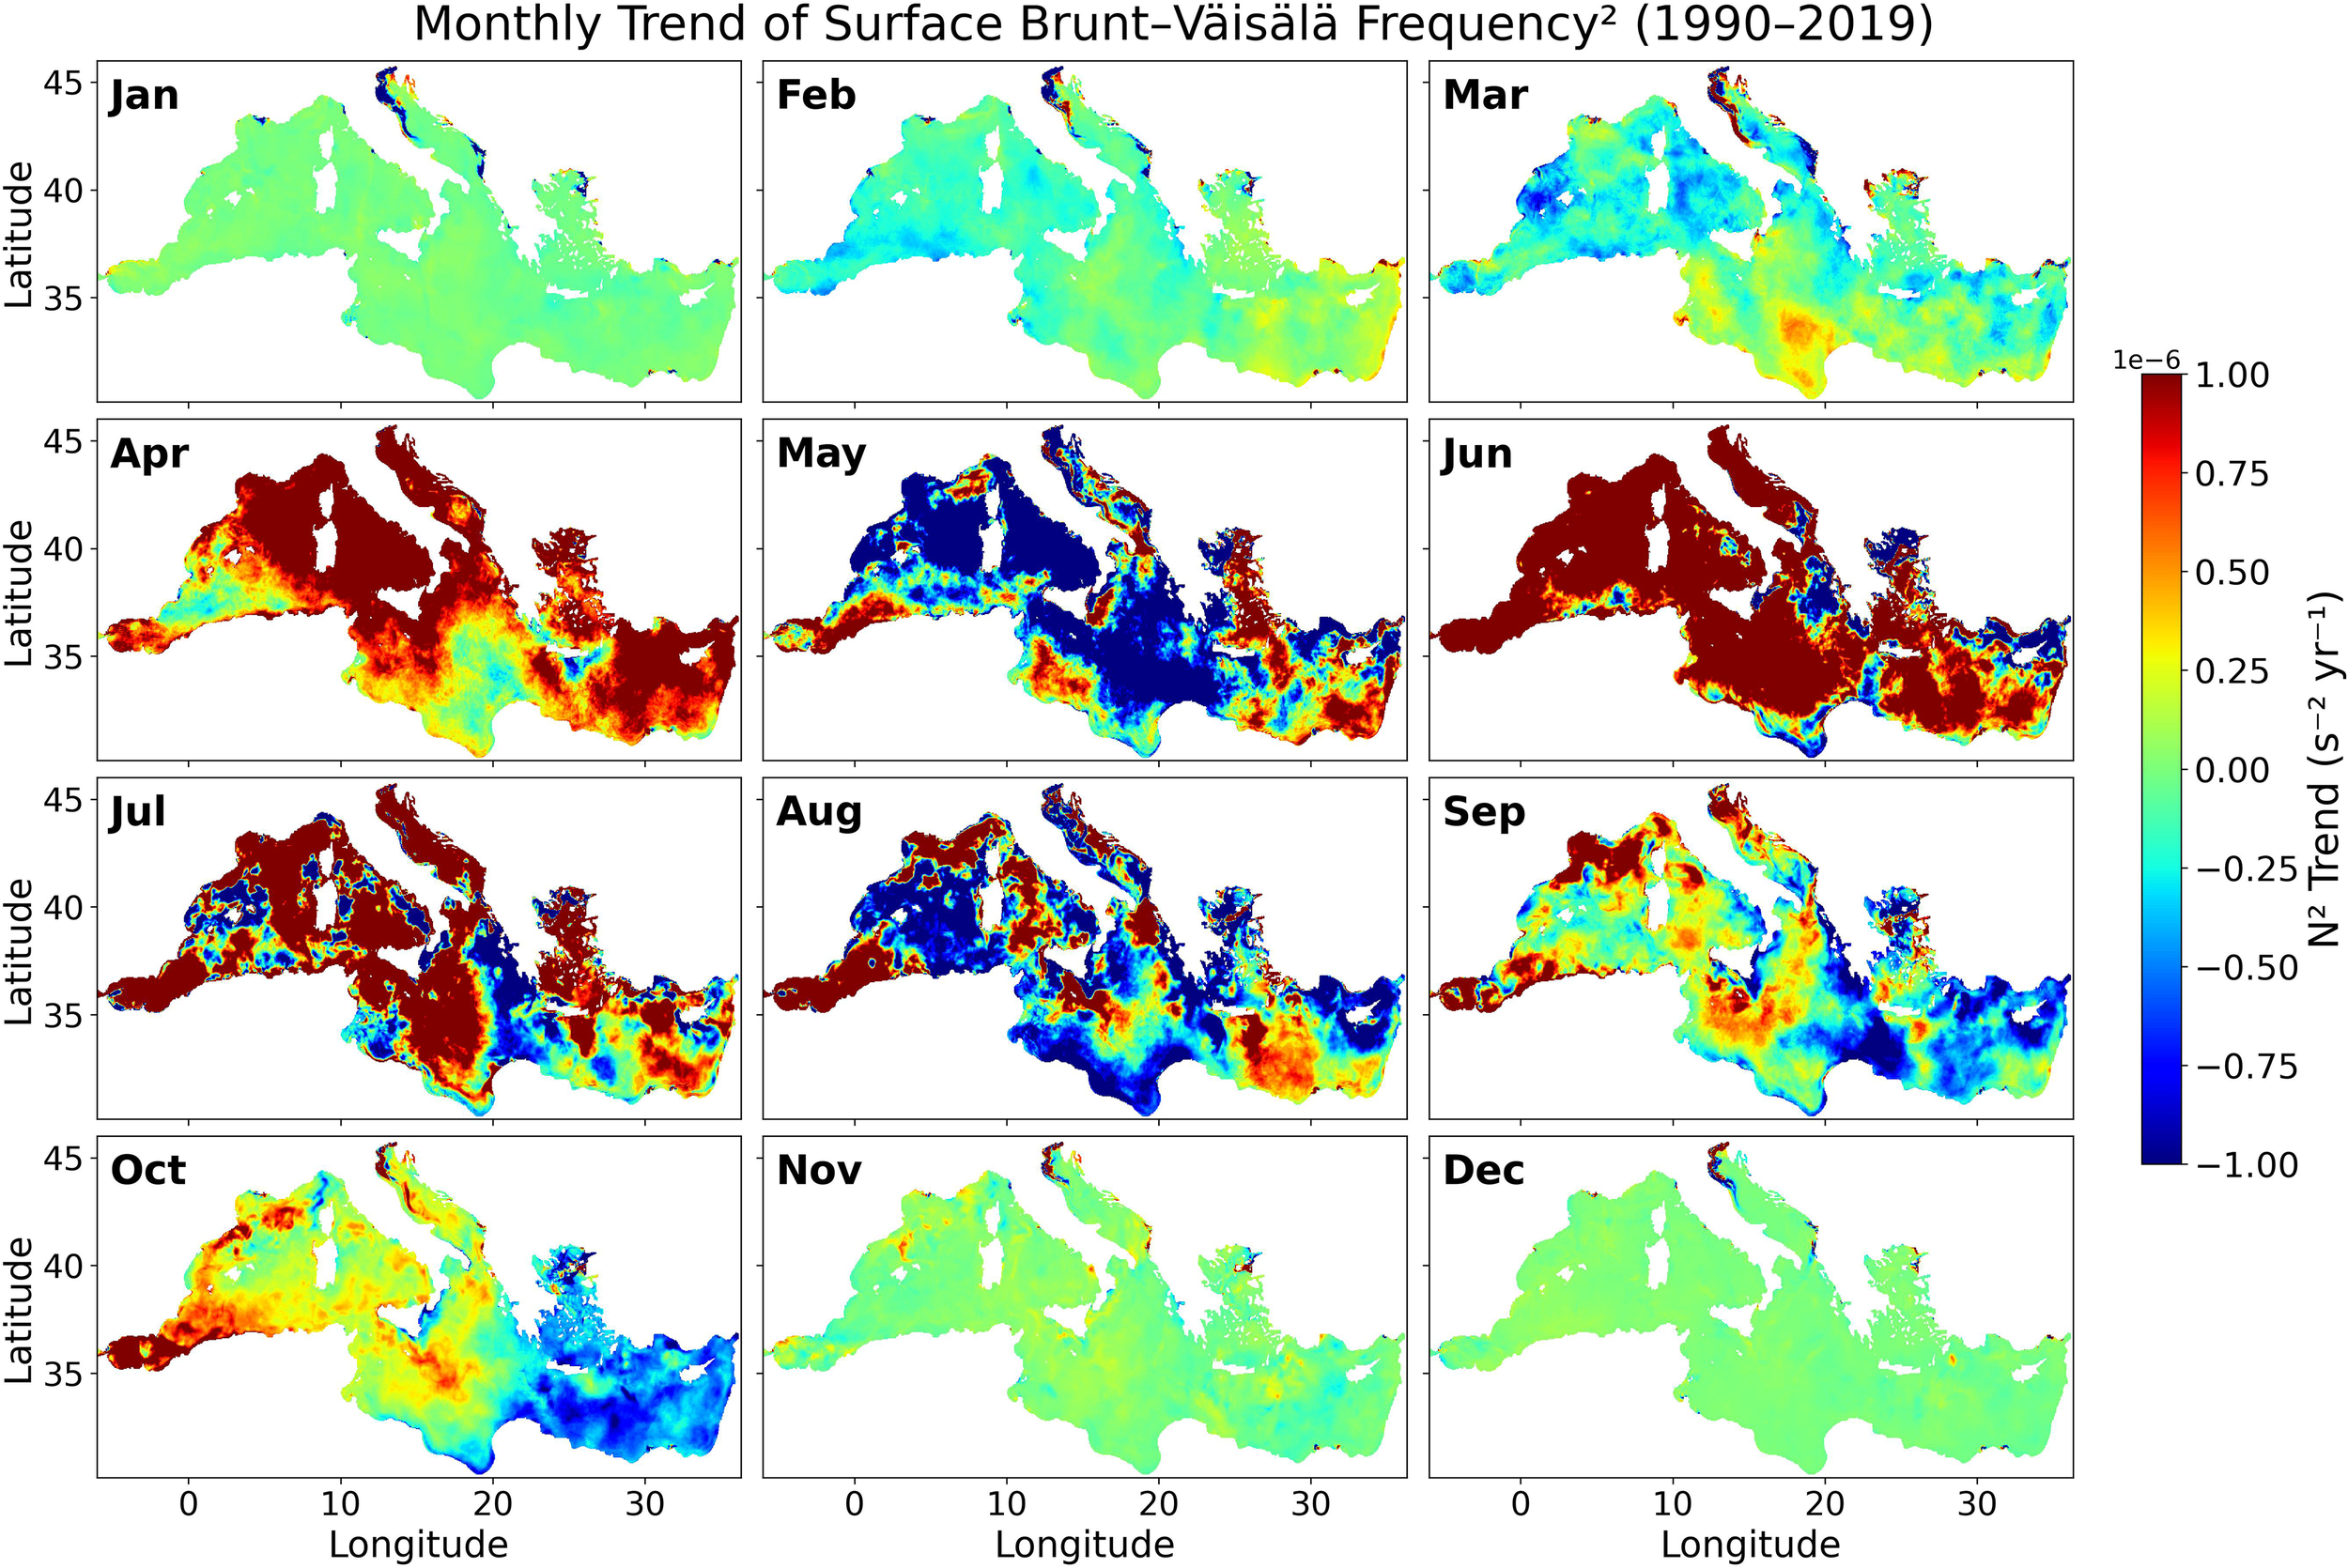
Monthly spatial trends of surface Brunt–Väisälä frequency squared (N²) over 1990–2019. Each panel shows the linear trend in surface N² (s-2 yr-1) for a specific month. Trends are calculated using linear least-squares fits at each grid point.
Summer (June–August) is marked by a strongly heterogeneous mosaic of very large trends of opposite sign. Many shallow coastal and shelf areas show large positive trends, but these are interspersed with some negative trends in other localized regions—particularly within parts of the eastern basin and along some narrow coastal bands. By early autumn (September–October), the pattern becomes more mixed, with a tendency toward negative trends in deeper basins and weaker positive trends nearshore; by December, the field returns to the low-magnitude, near-zero structure characteristic of winter.
Domain-mean monthly trends in surface N² with confidence intervals (Supplementary Figure S5c) summarise these spatial patterns into a seasonal cycle of basin-average change and clarify which monthly medians are statistically robust. Basin-mean trends are smallest during winter and increase in absolute magnitude through spring and summer. April stands out as the only month in which the confidence interval excludes zero, indicating a robust, basin-wide increase in near-surface stratification during the spring transition. Other months—notably June and July—exhibit large median positive trends, but their confidence intervals are wide and overlap zero, implying that strong interannual variability or spatial heterogeneity prevents these increases from being statistically distinguishable from no trend at the 95% level.
Taken together, the results demonstrate that near-surface stratification has intensified across the Mediterranean over the past three decades, driven primarily by surface warming, with subsurface salinification providing additional stabilization. This enhanced surface stability aligns with, and likely contributes to, the observed shoaling of the mixed layer.
5 Discussion
Our findings indicate that the Mediterranean mixed layer has experienced a persistent shoaling of approximately 0.5–0.6 m per decade since 1990, despite substantial seasonal and interannual variability. This long-term tendency is most consistent with enhanced stratification driven by surface warming and subsurface salinification, rather than with sustained changes in wind forcing. The seasonal pattern of the shoaling is particularly informative: April, November, and December show the most robust and statistically confident trends. Among these, April is the month in which both decreasing wind stress and increasing stratification act together, reinforcing the shoaling signal. Stratification generally strengthens through most of the warm season, favouring shallower mixed layers and allowing late-summer and autumn stability to influence the onset of winter mixing.
Spatial contrasts across the basin further illuminate how regional processes modulate the basin-wide response. In the Levantine Basin, mixed layers have consistently shoaled, indicating a sustained suppression of winter–spring convection under increasingly stratified conditions. The Southern Adriatic, by contrast, shows modest variability with episodes of decadal deepening but no persistent long-term trend, reflecting its transitional role between eastern and western circulation regimes. In the Gulf of Lion and surrounding regions, anomalous deepening episodes occurred during the 1990s–2000s, likely linked to strong atmospheric forcing and dense-water formation. These anomalies may also reflect the legacy of the Eastern Mediterranean Transient (EMT) in the early 1990s, which reorganized convection between the Adriatic and Aegean Seas (Malanotte-Rizzoli et al., 1999). Such events highlight how large-scale shifts in circulation can temporarily override basin-scale shoaling and significantly reshape regional convection dynamics and nutrient entrainment.
Although we have looked at two main factors—wind and stratification—affecting the variability of the MLD, it is important to note that MLD is a complex system, especially in winter and near the Gulf of Lion, where dense water forms. During deep water formation, there is an initial phase when wind and surface buoyancy changes mix the water and help the mixed layer become deeper. However, once the mixed layer reaches a certain depth, the effect of wind mixing is no longer important, and further deepening is mainly controlled by buoyancy changes (Kraus and Turner, 1967; Mertens and Schott, 1998). Buoyancy is another key factor that deserves more study in future work, but it is beyond the scope of this paper.
Comparisons with previous regional studies reinforce the robustness of our interpretation. For instance, the absence of significant long-term MLD trends in the Spanish Mediterranean reported by Vargas-Yáñez et al. (2022) is consistent with our observation that western basin trends remain spatially heterogeneous and often weak. Likewise, the weak and non-significant long-term trends in wind stress found in several observational analyses support our conclusion that buoyancy forcing, not wind, governs the long-term evolution of MLD. Agreement with observational studies such as Houpert et al. (2015)—who reported large winter MLD variability and deep mixed layers in the Northwestern Mediterranean, Southern Adriatic, and Levantine Sea—further demonstrates that the spatial structure and seasonality of the MLD in our analysis are consistent with known convection hotspots.
Nevertheless, uncertainties must be acknowledged. Reanalysis-derived MLD estimates depend on model resolution, data assimilation procedures, and the specific density-threshold criterion applied, which may influence absolute depth estimates and local trends, especially in regions with sparse in-situ observations. Local anomalies, such as those in the Gulf of Lion or Southern Adriatic, may therefore represent a combination of real physical processes and model-related limitations. Future work should include sensitivity analyses using alternative MLD definitions, improve integration between reanalysis products and in-situ measurements—such as MedArgo floats, gliders, and moorings—and further investigate the mechanisms that produce episodic deepening or regional departures from the basin-scale shoaling trend.
6 Conclusion
This study provides basin-wide evidence that the Mediterranean mixed layer has shoaled by approximately 0.5–0.6 m per decade from 1990 to 2019. Although substantial seasonal and interannual variability persists, the long-term trend is consistent with increasing near-surface stratification driven by surface warming and subsurface salinification, while long-term changes in wind forcing do not explain the observed evolution. Regional differences remain pronounced: the Levantine Basin exhibits consistent shoaling, the Southern Adriatic shows modest variability without a systematic trend, and the Gulf of Lion experienced episodic deepening during the 1990s–2000s. These sub-basin contrasts highlight the importance of regional dynamics in shaping the overall response of the Mediterranean Sea.
The shift toward a shallower mixed layer has important implications for climate and ecosystem functioning. Reduced vertical mixing weakens the capacity of the upper ocean to buffer surface warming, enhances the likelihood of prolonged marine heatwaves, and diminishes nutrient resupply to the euphotic zone. These changes may reduce productivity, affect fisheries, and threaten ecological resilience throughout the basin. Although uncertainties related to reanalysis methods and MLD definitions remain. Continued integration of reanalysis and in-situ observations, alongside sensitivity tests of MLD criteria, will be essential for refining confidence in these results and for understanding how the Mediterranean—and other climate-sensitive marginal seas—may evolve under ongoing warming and increasing stratification.
Statements
Data availability statement
The raw data can be accessed from Med MFC (Escudier et al., 2021). Statistical analyses were performed using NumPy and Pandas, and the figures were generated with Matplotlib and Cartopy. The raw data supporting the conclusions of this article are publicly available from the Copernicus Marine Environment Monitoring Service (CMEMS) at https://data.marine.copernicus.eu/product/MEDSEA_MULTIYEAR_PHY_006_004/services. No restrictions apply to access. Additional data generated during this study are available from the corresponding author upon reasonable request.
Author contributions
JB: Conceptualization, Methodology, Data curation, Software, Visualization, Writing – original draft, Writing – review & editing.
Funding
The author(s) declared that financial support was received for this work and/or its publication. This work was supported by the Dean’s Award from the University of Manchester for the author’s PhD.
Acknowledgments
Babagolimatikolaei acknowledges the Dean’s Award from the University of Manchester for providing the funding for his PhD. The author also gratefully acknowledges the use of the Mediterranean Physics Reanalysis data and the ERA5 reanalysis dataset provided by the European Centre for Medium-Range Weather Forecasts (ECMWF), which were essential for this research.
Conflict of interest
The authors declared that this work was conducted in the absence of any commercial or financial relationships that could be construed as a potential conflict of interest.
Generative AI statement
The author(s) declare that generative AI was not used in the creation of this manuscript.
Any alternative text (alt text) provided alongside figures in this article has been generated by Frontiers with the support of artificial intelligence and reasonable efforts have been made to ensure accuracy, including review by the authors wherever possible. If you identify any issues, please contact us.
Publisher’s note
All claims expressed in this article are solely those of the authors and do not necessarily represent those of their affiliated organizations, or those of the publisher, the editors and the reviewers. Any product that may be evaluated in this article, or claim that may be made by its manufacturer, is not guaranteed or endorsed by the publisher.
Supplementary material
The Supplementary Material for this article can be found online at: https://www.frontiersin.org/articles/10.3389/fmars.2025.1699007/full#supplementary-material
References
1
Adloff F. Somot S. Sevault F. Jordà G. Aznar R. Déqué M. et al . (2015). Mediterranean Sea response to climate change in an ensemble of twenty first century scenarios. Climate Dynamics45, 2775–2802. doi: 10.1007/s00382-015-2507-3
2
Babagolimatikolaei J. (2024). Atmospheric and Po River discharge anomalies in 2017: Impacts on water properties of the adriatic Sea and North Ionian Sea. J. Earth Syst. Environ. 9, 981–997.
3
Babagolimatikolaei J. (2025). Variability of the Southern Adriatic gyre during 2016–2018. J. Geophys. Res. Ocean. 130, e2025JC023248–17. doi: 10.1029/2025JC023248
4
Babagolimatikolaei J. Schultz D. M. Draycott S. Parkes B. (2025). Impacts of the Po River on Adriatic Sea hydrodynamics and interbasin exchanges. J. Geophysical Research: Oceans130, e2024JC022196. doi: 10.1029/2024JC022196
5
Bindoff N. L. Cheung W. W. L. Kairo J. G. Arístegui J. Guinder V. A. Hallberg R. et al . (2019). “ Changing ocean, marine ecosystems, and dependent communities,” in IPCC Special Report on the Ocean and Cryosphere in a Changing Climate. Eds. PörtnerH.-O.RobertsD. C.Masson-DelmotteV.ZhaiP.TignorM.PoloczanskaE.MintenbeckK.AlegríaA.NicolaiM.OkemA.PetzoldJ.RamaB.WeyerN. M. ( Cambridge University Press, Cambridge, UK and New York, NY, USA).
6
Brainerd K. E. Gregg M. C. (1995). Surface mixed and mixing layer depths. Deep Sea Res. Part I: Oceanographic Res. Papers42, 1521–1543. doi: 10.1016/0967-0637(95)00068-H
7
Clementi E. Pistoia J. Delrosso D. Mattia G. Fratianni C. Storto A. et al . (2017). “ A 1/24 degree resolution Mediterranean analysis and forecast modelling system for the Copernicus Marine Environment Monitoring Service,” in Book of Abstracts, 27–28.
8
Coll M. Piroddi C. Albouy C. Ben Rais Lasram F. Cheung W. W. Christensen V. et al . (2012). The Mediterranean Sea under siege: spatial overlap between marine biodiversity, cumulative threats and marine reserves. Global Ecol. Biogeography21, 465–480. doi: 10.1111/j.1466-8238.2011.00697.x
9
Comesaña A. Fernández-Castro B. Chouciño P. Fernández E. Fuentes-Lema A. Gilcoto M. et al . (2021). Mixing and phytoplankton growth in an upwelling system. Front. Mar. Sci.8. doi: 10.3389/fmars.2021.712342
10
Coppola L. Legendre L. Lefevre D. Prieur L. Taillandier V. Riquier E. D. (2018). Seasonal and inter-annual variations of dissolved oxygen in the northwestern Mediterranean Sea (DYFAMED site). Prog. Oceanography162, 187–201. doi: 10.1016/j.pocean.2018.03.001
11
Cuttelod A. García N. Abdul Malak D. Temple H. Katariya V. (2008). “ The Mediterranean: A biodiversity hotspot under threat,” in The 2008 Review of The IUCN Red List of Threatened Species. Eds. ViéJ.-C.Hilton-TaylorC.StuartS. N. ( IUCN Gland, Switzerland).
12
d’Ortenzio F. Iudicone D. de Boyer Montegut C. Testor P. Antoine D. Marullo S. et al . (2005). Seasonal variability of the mixed layer depth in the Mediterranean Sea as derived from in situ profiles. Geophysical Res. Lett.32. doi: 10.1029/2005GL022463
13
de Boyer Montégut C. Madec G. Fischer A. S. Lazar A. Iudicone D. (2004). Mixed layer depth over the global ocean: An examination of profile data and a profile-based climatology. J. Geophysical Research: Oceans109. doi: 10.1029/2004JC002378
14
de Fommervault O. P. Migon C. d’Alcalà M. R. Coppola L. (2015). Temporal variability of nutrient concentrations in the northwestern Mediterranean sea (DYFAMED time-series station). Deep Sea Res. Part I: Oceanographic Res. Papers100, 1–12. doi: 10.1016/j.dsr.2015.02.006
15
Escudier R. Clementi E. Cipollone A. Pistoia J. Drudi M. Grandi A. et al . (2021). A high resolution reanalysis for the Mediterranean Sea. Front. Earth Sci.9. doi: 10.3389/feart.2021.702285
16
GEBCO Compilation Group (2022). GEBCO_2022 grid. doi: 10.5285/e0f0bb80-ab44-2739-e053-6c86abc0289c
17
Henson S. A. Dunne J. P. Sarmiento J. L. (2009). Decadal variability in North Atlantic phytoplankton blooms. J. Geophysical Research: Oceans114. doi: 10.1029/2008JC005139
18
Herrmann M. Estournel C. Déqué M. Marsaleix P. Sevault F. Somot S. (2008). Dense water formation in the Gulf of Lions shelf: Impact of atmospheric interannual variability and climate change. Continental Shelf Res.28, 2092–2112. doi: 10.1016/j.csr.2008.03.003
19
Houpert L. Testor P. De Madron X. D. Somot S. D’ortenzio F. Estournel C. et al . (2015). Seasonal cycle of the mixed layer, the seasonal thermocline and the upper-ocean heat storage rate in the Mediterranean Sea derived from observations. Prog. Oceanography132, 333–352. doi: 10.1016/j.pocean.2014.11.004
20
Kourafalou V. H. Barbopoulos K. (2003). “ High resolution simulations on the North Aegean Sea seasonal circulation,” in Annales Geophysicae, vol. 21. ( Copernicus Publications, Göttingen, Germany), 251–265. doi: 10.5194/angeo-21-251-2003
21
Kraus E. B. Turner J. S. (1967). A one-dimensional model of the seasonal thermocline II. The general theory and its consequences. Tellus19, 98–106. doi: 10.3402/tellusa.v19i1.9753
22
Lavigne H. d’Ortenzio F. Migon C. Claustre H. Testor P. d’Alcalà M. R. et al . (2013). Enhancing the comprehension of mixed layer depth control on the Mediterranean phytoplankton phenology. J. Geophysical Research: Oceans118, 3416–3430. doi: 10.1002/jgrc.20251
23
Madec G. Bourdallé-Badie R. Bouttier P. Bricaud C. Bruciaferri D. Calvert D. et al . (2017). NEMO ocean engine (Version v3. 6), notes Du pôle de modélisation de l’institut Pierre-simon Laplace (IPSL). Zenodo.
24
Malanotte-Rizzoli P. Manca B. B. d’Alcala M. R. Theocharis A. Brenner S. Budillon G. et al . (1999). The Eastern Mediterranean in the 80s and in the 90s: the big transition in the intermediate and deep circulations. Dynamics Atmospheres Oceans29, 365–395. doi: 10.1016/S0377-0265(99)00011-1
25
Mertens C. Schott F. (1998). Interannual variability of deep-water formation in the northwestern Mediterranean. J. Phys. oceanography28, 1410–1424. doi: 10.1175/1520-0485(1998)028<1410:IVODWF>2.0.CO;2
26
Pinardi N. Masetti E. (2000). Variability of the large scale general circulation of the Mediterranean Sea from observations and modelling: a review. Palaeogeography Palaeoclimatology Palaeoecol.158, 153–173. doi: 10.1016/S0031-0182(00)00048-1
27
Simoncelli S. Coatanoan C. Myroshnychenko V. Sagen H. Bäck Ö. Scory S. et al . (2015). SeaDataNet. First Release of Regional Climatologies. doi: 10.13155/50381
28
Somot S. Sevault F. Déqué M. (2006). Transient climate change scenario simulation of the Mediterranean Sea for the twenty-first century using a high-resolution ocean circulation model. Climate Dynamics27, 851–879. doi: 10.1007/s00382-006-0167-z
29
Vargas-Yáñez M. Juza M. García-Martínez M. C. Moya F. Balbín R. Ballesteros E. et al . (2021). Long-term changes in the water mass properties in the Balearic channels over the period 1996–2019. Front. Mar. Sci.8. doi: 10.3389/fmars.2021.640535
30
Vargas-Yáñez M. Moya F. Balbín R. Santiago R. Ballesteros E. Sánchez-Leal R. F. et al . (2022). Seasonal and long-term variability of the mixed layer depth and its influence on ocean productivity in the Spanish Gulf of Cádiz and Mediterranean Sea. Front. Mar. Sci.9. doi: 10.3389/fmars.2022.901893
31
Villamaña M. Marañón E. Cermeño P. Estrada M. Fernández-Castro B. Figueiras F. G. et al . (2019). The role of mixing in controlling resource availability and phytoplankton community composition. Prog. Oceanography178, 102181. doi: 10.1016/j.pocean.2019.102181
32
Weatherall P. Marks K. M. Jakobsson M. Schmitt T. Tani S. Arndt J. E. et al . (2015). A new digital bathymetric model of the world’s oceans. Earth space Sci.2, 331–345. doi: 10.1002/2015EA000107
33
Yoder J. A. McClain C. R. Feldman G. C. Esaias W. E. (1993). Annual cycles of phytoplankton chlorophyll concentrations in the global ocean: A satellite view. Global Biogeochemical Cycles7, 181–193. doi: 10.1029/93GB02358
Summary
Keywords
mixed layer depth, Mediterranean Sea, ocean stratification, climate change, nutrient supply
Citation
Babagolimatikolaei J (2025) Three decades of Mediterranean mixed layer depth change: basin trends and regional contrasts. Front. Mar. Sci. 12:1699007. doi: 10.3389/fmars.2025.1699007
Received
04 September 2025
Revised
15 November 2025
Accepted
29 November 2025
Published
18 December 2025
Volume
12 - 2025
Edited by
Toru Miyama, Japan Agency for Marine-Earth Science and Technology, Japan
Reviewed by
Manuel Vargas-Yáñez, Spanish Institute of Oceanography (IEO), Spain
Antonella Gallo, National Institute of Oceanography and Experimental Geophysics (OGS), Italy
Updates
Copyright
© 2025 Babagolimatikolaei.
This is an open-access article distributed under the terms of the Creative Commons Attribution License (CC BY). The use, distribution or reproduction in other forums is permitted, provided the original author(s) and the copyright owner(s) are credited and that the original publication in this journal is cited, in accordance with accepted academic practice. No use, distribution or reproduction is permitted which does not comply with these terms.
*Correspondence: Javad Babagolimatikolaei, javad.babagolimatikolaei@manchester.ac.uk
Disclaimer
All claims expressed in this article are solely those of the authors and do not necessarily represent those of their affiliated organizations, or those of the publisher, the editors and the reviewers. Any product that may be evaluated in this article or claim that may be made by its manufacturer is not guaranteed or endorsed by the publisher.