Abstract
Studying the origins of male green turtles is critical for assessing their poorly understood natal homing behavior, compared to that of females, which have a high degree of fidelity to their nesting beach of their birth. Between 2005 and 2012, we collected 379 tissue samples from male and female green turtles (Chelonia mydas) to test the hypothesis that there is no difference in natal homing between the sexes in two tropical Island mating areas of the western Atlantic: Isla de Aves, Venezuela, and Atol das Rocas, Brazil. We sequenced an ~800bp fragment of the mtDNA control region from each individual and characterized their haplotype profiles. Comparisons between males and females from rookeries and their closely associated offshore courtship areas revealed no significant genetic differentiation between males and females at either site, suggesting that males also return to their hatching site to breed. To examine fidelity of males to their natal region in more depth, we combined our results with published data from 2,350 individuals from 31 green turtle rookeries in the Gulf of Mexico, Caribbean Sea, Atlantic Ocean, and the Mediterranean Sea. Considering contributions of 1% or more, a mixed stock analysis of four regional haplotype groups revealed that adult males sampled at Isla de Aves originated from rookeries in the eastern Caribbean, mainly from Isla de Aves itself (95.3%). Also, haplotype frequencies indicated that adult males sampled at Atol das Rocas originated mainly from Atol das Rocas (74.5%), possibly with small (on average 4%) contributions from five other regional rookeries. These combined results also suggest that males from both Isla de Aves and Atol das Rocas return to their natal regions to reproduce, as do females. This study provides the first direct evidence of male natal homing in green turtles in two populations of the western Atlantic and confirms that this phenomenon, previously observed in Australian green turtles, also occurs there. Understanding the factors that contribute to varying degrees of homing to courtship areas is essential for evaluating the demographic independence of populations. It further allows for a more accurate assessment of their vulnerability to regional threats.
1 Introduction
Numerous species travel significant distances between seasonal habitats during their life cycles, and in green sea turtles this can involve spectacular island-finding abilities, such as between the northern coast of Brazil and the remote mid-Atlantic Ascension Island >2000 km away (Hays et al., 2002; Luschi and Hays, 2018). This interconnection is vital for ecological and evolutionary processes in these species and the ecosystems they inhabit (Webster et al., 2002; Webster and Marra, 2005). Assessing the population structure and connectivity of migratory species is essential for effective management and conservation, especially when there may be variation in migratory behavior (Prugnolle and de Meeûs, 2002). For example, in some bird species, females migrate farther than males, and to different locations (Gow and Wiebe, 2014), while in some mammals, males disperse further than females, leading to contrasting genetic patterns. Marine turtles are another iconic migratory group and are a promising biological model in which to examine potential sex-based population structuring, due to their seasonal long-distance migrations between nesting and foraging habitats, and well-documented female natal homing to nesting sites (Hays and Hawkes, 2018; Miller, 1997).
Previous studies and evidence suggest that philopatry and dispersal may differ between the sexes, with females consistently showing strong natal homing (Bowen et al., 1992; Bjorndal et al., 2005; Bowen and Karl, 2007) and males exhibiting more variable reproductive movements (Fuentes et al., 2025; Dolfo et al. 2025). Some studies propose that males may contribute disproportionately to nuclear gene flow through broader spatial movements or opportunistic mating during migratory overlap, potentially reducing nuclear differentiation among rookeries (Encalada et al., 1996; FitzSimmons et al., 1997a; Bowen and Karl, 2007; Schofield et al., 2010). This behavior could promote gene flow within and among rookeries, thereby reducing the detectable genetic signal of strict natal homing in males, particularly when courtship and foraging areas intersect (Bowen and Karl, 2007). However, other research indicates that males can display natal-region fidelity comparable to females, as reported for courtship aggregations in the Great Barrier Reef and other regions (Limpus, 1993; FitzSimmons et al., 1997a). These contrasting findings suggest that sex-specific philopatry and mating behavior are context-dependent, influenced by regional geography, rookery configuration, and breeding area distribution (Naro-Maciel et al., 2014; Roden et al., 2013). Gaining insight into this variability is therefore essential for interpreting genetic structure, gene flow patterns, and population connectivity in green turtles.
Female natal homing in marine turtles has been the focus of much research. While this behavior can limit gene flow and increase demographic isolation between nesting beaches (Bowen et al., 1992; Bjorndal et al., 2005; Avise, 2007; Lande, 1988), natural selection may favor the exploitation of resources (nesting beaches) proved to be successful in past generations. Gene flow and isolation can influence rookery recovery after natural and human impacts, such as nesting habitat loss, the removal of females and nests, or the colonization of new individuals from other populations (Bowen and Karl, 2007; Lohmann et al., 2013). Genetic and demographic studies suggest that female green turtles (Chelonia mydas) have the highest degree of natal homing of any sea turtle, although all exhibit it to some degree (Bowen et al., 1992; Bowen and Karl, 2007). Differences in mtDNA haplotype frequencies distinguish rookeries of green turtle nesting females around the world (Allard et al., 1994; Lahanas et al., 1994). Although mtDNA generally has higher mutation rates, it often shows lower polymorphism than nuclear loci because it has a much smaller effective population size and is maternally inherited. This accelerates lineage sorting and reduces standing variation, helping explain the lower mtDNA diversity observed.
Mechanistically, navigation and orientation processes underpinning natal homing are central to understanding these patterns. Decades of research demonstrate that marine turtles rely on a combination of geomagnetic cues—used to form an imprint of their natal region—and olfactory cues that may guide fine-scale localization upon return (Kitayama et al., 2021; Lohmann et al., 1999, Lohmann et al., 2013). This process, known as natal imprinting, provides the sensory foundation for long-distance migrations and helps explain the strong genetic structure observed among rookeries. Integrating these biological orientation mechanisms with genetic data is essential for interpreting patterns of natal homing and population connectivity in both sexes.
However, despite the great abundance of studies on females (Bowen and Karl, 2007; Avise, 2007; Lee et al., 2007; Lee et al., 2018; Jensen et al., 2013; Shamblin et al., 2012; Naro-Maciel et al., 2014), the origins of male turtles and their degree of fidelity to reproductive sites remains poorly understood, as does their natal homing (Garcia-Cruz et al., 2018). This is because they never leave the sea and are less accessible in the water than females on nesting beaches (FitzSimmons et al., 1997a; Karl et al., 1992; Roberts et al., 2004). Early investigations using a limited number of nuclear markers suggested the possibility of male-mediated gene flow due to low, but often significant, genetic structure among rookeries (Roberts et al., 2004). Other studies employing higher resolution nuclear markers have detected additional low but significant genetic structure, possibly consistent with natal homing in both sexes for several marine turtle species, including leatherbacks (Dermochelys coriacea) (Dutton et al., 2013), loggerheads (Caretta caretta) (Carreras et al., 2011), and green turtles in the Mediterranean (Bagda et al., 2012) and Pacific (Roden et al., 2013). However, none of these studies examined male natal homing directly.
Emerging evidence suggests that the spatial context of green turtle nesting—such as on isolated oceanic islands versus along continental coastlines—may significantly influence patterns of nuclear genetic structure. Island rookeries like Isla de Aves tend to exhibit greater differentiation in pairwise comparisons than regional mainland sites. This supports a hypothesis of reduced opportunities for inter-rookery mating during overlapping migrations to oceanic islands, particularly if both males and females exhibit strong natal homing (Naro-Maciel et al., 2014). In contrast, along continental coastlines, where rookeries are situated in closer proximity, males and females are more likely to encounter one another during migration, increasing the chance for mating between individuals from different rookeries and reducing nuclear differentiation. This spatial hypothesis is supported by findings from the western Atlantic, where pairwise nuclear differentiation (FST) was generally highest between southern oceanic rookeries (Atol das Rocas and Trindade, Brazil) and their northern counterparts, with Isla de Aves displaying greater differentiation than the mainland rookeries of Florida, Costa Rica, and Suriname (Naro-Maciel et al., 2014).
These findings align with observations from other regions. In the Great Barrier Reef, for example, males and females exhibit equal natal philopatry but mate opportunistically during overlapping breeding migrations, leading to nuclear gene flow between populations. As individuals pass through one another’s migratory corridors en route to their respective natal sites, intermixing occurs, shaping nuclear structure across the region (Limpus, 1993; FitzSimmons et al., 1997a). Even so, the notion that breeding behavior and biogeography jointly shape population connectivity—particularly via differences in mating opportunity between isolated islands and continuous coastlines—requires further exploration. Understanding these dynamics is critical for the delineation of conservation units and the assessment of population vulnerability to localized threats.
Unlike females, male sea turtles are very difficult to sample because once they enter the water as hatchlings, they rarely re-emerge on land and capturing them in the water can present a major challenge (García-Cruz et al., 2013; Brothers and Lohmann, 2015). Although mating occurs offshore from nesting beaches and mating sites are found in various areas, only a small number of places have been well documented as courtship sites with large and high-density aggregations of males (Limpus, 1993; García-Cruz, 2015; Delgado-Trejo et al., 2025). In this study, mating or courtship areas are defined as the geographic locations where males and females congregate at the beginning of the nesting season to reproduce (Limpus et al., 2003).
To better understand the factors influencing male natal homing, we studied Isla de Aves (AV) in Venezuela and Atol das Rocas (ADR) in Brazil—two important green turtle rookeries in the Caribbean/western Atlantic with high seasonal densities of males and females near nesting beaches in offshore courtship areas. ADR is a remote Marine Protected Area created in 1979 and World Heritage Site (WHS), occupied exclusively by researchers, where adults are present only during the brief breeding season (Grossman et al., 2019), while AV is an offshore, demographically distinct rookery and Wildlife Refuge protected by law since 1972; it hosts adults year-round, with numbers peaking during the breeding season (García-Cruz et al., 2015). These characteristics offer unique opportunities to investigate male philopatry and its demographic implications. To evaluate natal homing, we compared the frequency of haplotypes of an ~800 bp fragment of the mitochondrial control region between males and females from both locations. We also used mixed stock analysis to identify possible source rookeries for these courtship areas from 31 rookeries around the region. We used this analysis, which assumes the male population was indeed a mixed stock (in spite of there being no evidence for mixing), in order to take the most conservative approach possible to our data.
2 Materials and methods
2.1 Study area
Fieldwork was conducted at Isla de Aves (AV), Venezuela, and Atol das Rocas (ADR), Brazil (Figure 1a). Both sites are oceanic, located approximately 670 km (AV) and 266 km (ADR) offshore of the South American continent. Isla de Aves is unique in the Caribbean for its exceptionally high density of reproductive turtles: it hosts the largest nesting colony of green turtles (Chelonia mydas) in the eastern Caribbean and is the only site in the region where hundreds of adult males can be observed courting and mating in shallow, transparent waters adjacent to the nesting beach (García-Cruz et al., 2013, García-Cruz et al., 2015). At AV, sampling occurred during four reproductive seasons: June–July 2008, September–October 2009, July–August 2010, and June–July 2012, with the first and last coinciding with peak reproductive activity. At ADR, samples were collected by Projeto TAMAR during the breeding seasons of December 2004–January 2005 and December 2005–January 2006 (Naro-Maciel et al., 2012).
Figure 1
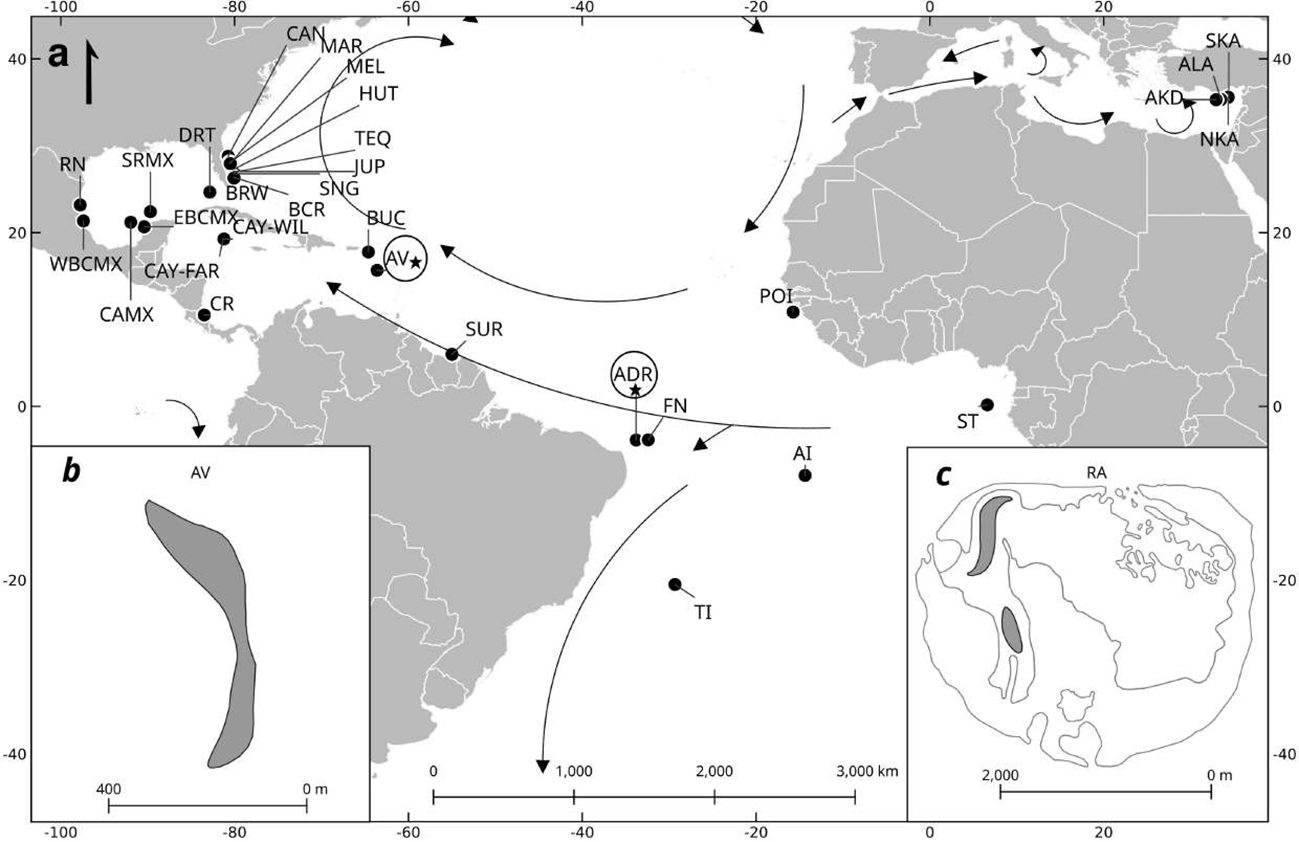
Location of rookeries (circles) and the two courtship and mating sites (stars) of Chelonia mydas in the Caribbean, Atlantic and Mediterranean, where haplotype frequencies for a fragment ~800bp of control mtDNA were estimated in this study and other publications (see Supplementary Table S1). Arrows indicate primary ocean currents (Naro-Maciel 2012). Rookeries included: a) Matapica, Suriname, SUR; Tortuguero, Costa Rica, CR; Ascension Island, United Kingdom, AI; Buck Island, USA, BUC; Tamaulipas and Veracruz, Mexico, WBCMX; Campeche and Yucatán, Mexico, EBCMX; Cayo Arcas, Campeche, Mexico, CAMX; Scorpion Reef, Yucatán, Mexico, SRMX; Rancho Nuevo, Mexico, RN; Sao Tome, ST; Canaveral National Seashore, USA, CAN; Melbourne Beach, USA, MEL; southern Hutchinson Island, USA, HUT; northern Jupiter Island, USA, JUP; Tequesta, southern Jupiter Island, USA, TEQ; Singer Island, USA, SNG; Boca Raton, USA, BCR; Hillsboro, USA, BRW; Dry Tortugas National Park, USA, DRT; Trindade Island, Brazil (TI); Fernando de Noronha, Brazil, (FN), Poilao, Guinea Bissau, (POI), South Karpaz, (SKA), Alagadi, (ALA), North Karpaz (NKA), Akdeniz, Cyprus, (AKD) Cayman Island, Wild (CAY-WIL) and Cayman Island Farm, CAY-FAR. Location of focal nesting, courtship and mating sites (stars), b) Isla de Aves (AV), Venezuela and c) Atol das Rocas (ADR), Brazil.
2.2 Sampling
2.2.1 Male sampling at AV
Adult males were captured by hand while freediving at depths of 5–20 m. At Isla de Aves, the breeding season occurs earlier in the year than at Atol das Rocas, and our sampling was conducted during the peak local courtship and mating period because of the high density of turtles in the water. Once a group of males and females engaged in courtship or mating was identified, a team of six freedivers approached slowly by swimming, to avoid disturbing the ongoing mating. In these situations, many males were observed surrounding the mating pair, attempting to court or mate with the female; typically, between 1 and 15 males were present, and these peripheral males became the primary targets for capture without interfering with the pair in copula. One freediver approached and secured the turtle by grasping the carapace, while two others immediately assisted by holding the front flippers to bring the animal to the surface (García-Cruz et al., 2013). The remaining three freedivers always stayed close for safety and to provide additional support if required. Once at the surface, with the assistance of the support boat and two additional crew members, the turtle was carefully lifted on board without causing harm. Captures were supported by a Caribe-brand inflatable boat equipped with a 70 HP outboard motor, which allowed rapid positioning near active groups. In total, 83 males were captured. Morphometric data was taking including curved carapace length notch-to-tip (CCLn-t), curved carapace width (CCW), and tail length (TLC), following Bolten (1999). Two tissue samples were collected from each individual using a 6 mm Dermapunch and preserved in 95% ethanol (Dutton, 1995). In all cases, the incision site was disinfected with 10% povidone-iodine to minimize risk of infection. Tagging followed internationally recognized guidelines for sea turtle identification: each turtle was double tagged with Monel or Inconel tags on the front flippers, applied through or between scales between the second and third scale.
2.2.2 Female sampling at AV
Nesting females were monitored as part of long-term capture–mark–recapture programs led by FUDENA (1979–1997) and MINEC (2001–ongoing). Field teams patrolled nightly (20:00–03:00 h), marking turtles while they nested—when they remain calm and less reactive to handling (García-Cruz et al., 2015). Each female was double tagged on the front flippers with Monel tags following standard protocols (Balazs, 1999) and measured for curved carapace length (CCLn-t) and width (CCW) with a flexible tape (Bolten, 1999). Tissue samples were taken from 215 nesting females, and each incision site was disinfected with 10% povidone-iodine.
2.3 Sampling at ADR
At Atol das Rocas, reproductive activity occurs later in the season than at Isla de Aves, and our sampling took place during the local peak of courtship activity. Captures were conducted in the internal lagoon of Atol das Rocas during high tides by a team of three to four researchers using a Zodiac Fastroller inflatable boat (4.2 m) powered by a Mercury 25 hp engine. 30 adult males were manually captured at depths of 1.5 to 3 m, avoiding individuals engaged in courtship or mating. At the capture site, while still in the water, Inconel tags were applied to the front flippers, carapace measurements (CCLn-t and CCW) were recorded, and tissue samples were collected using a sterile punch. All animals were released immediately after handling to minimize stress. At the time, Brazil did not have specific regulations for research involving wild animals in the wild, such as those later established by CEUA, Law No. 11,794/2008 (Arouca Law), and CONCEA standards. Data for 37 nesting females at ADR were obtained from Shamblin et al. (2015).
2.4 Laboratory analysis
We extracted total genomic DNA from samples collected using the “DNeasy tissue®” kit, following the manufacturer’s protocol (QIAGEN Inc. Valencia, CA, USA). We performed the amplification by polymerase chain reaction (PCR) of a fragment of a ~ 800 bp of mtDNA control region using primers 5’LCM15382 (GCTTAACCCTAAAGCATTGC-3’) and H950 (GTCTCGGATTTAGGGGTTTG- 3’) (Abreu-Grobois et al., 2006). In all PCRs, a negative control (DNA-free quenching reaction) and a positive control (a known sample that always amplified successfully used just for Isla de Aves samples) were used to assess contamination and ensure the fidelity of the amplified product. The sequence of both strands of the DNA fragment was obtained for each sample with the same primers in sequencing reactions analyzed with an automated sequencer (ABI 3130, Applied Biosystems, Foster City, CA, USA). A consensus sequence was prepared with Geneious 6.0 (Geneious, 2012). We used the Basic Local Alignment Search Tool (BLAST; Altschul et al., 1990) to verify each sequence that corresponded to C. mydas. (All were positive, at above 99%). We aligned sequences (Geneious 6.0) and compared them with mtDNA control region sub-haplotypes from GenBank, which were previously identified from nesting beaches of this species. We assigned haplotype identity to consensus sequences according to their matches with known Caribbean and Atlantic haplotypes from the public database managed by the Archie Carr Center for Sea Turtle Research (ACCSTR; http://accstr.ufl.edu/resources/mtdna-sequences/).
2.5 Genetic database
We next created a database containing our sequences for Isla de Aves and Atol das Rocas as well as information (published and non-published) on C. mydas haplotype frequencies for nesting sites in the Gulf of Mexico, Caribbean Sea, Atlantic Ocean and the Mediterranean Sea (n = 31 localities: Figure 2; Supplementary Material, Supplementary Table S1). This database formed the main input for differentiation analyses and Mixed Stock Analyses (MSA), below. Each set of female haplotypes from each nesting beach was considered a distinct population (or “rookery”), following previous research (Lahanas et al., 1998; Bolker et al., 2007).
Figure 2
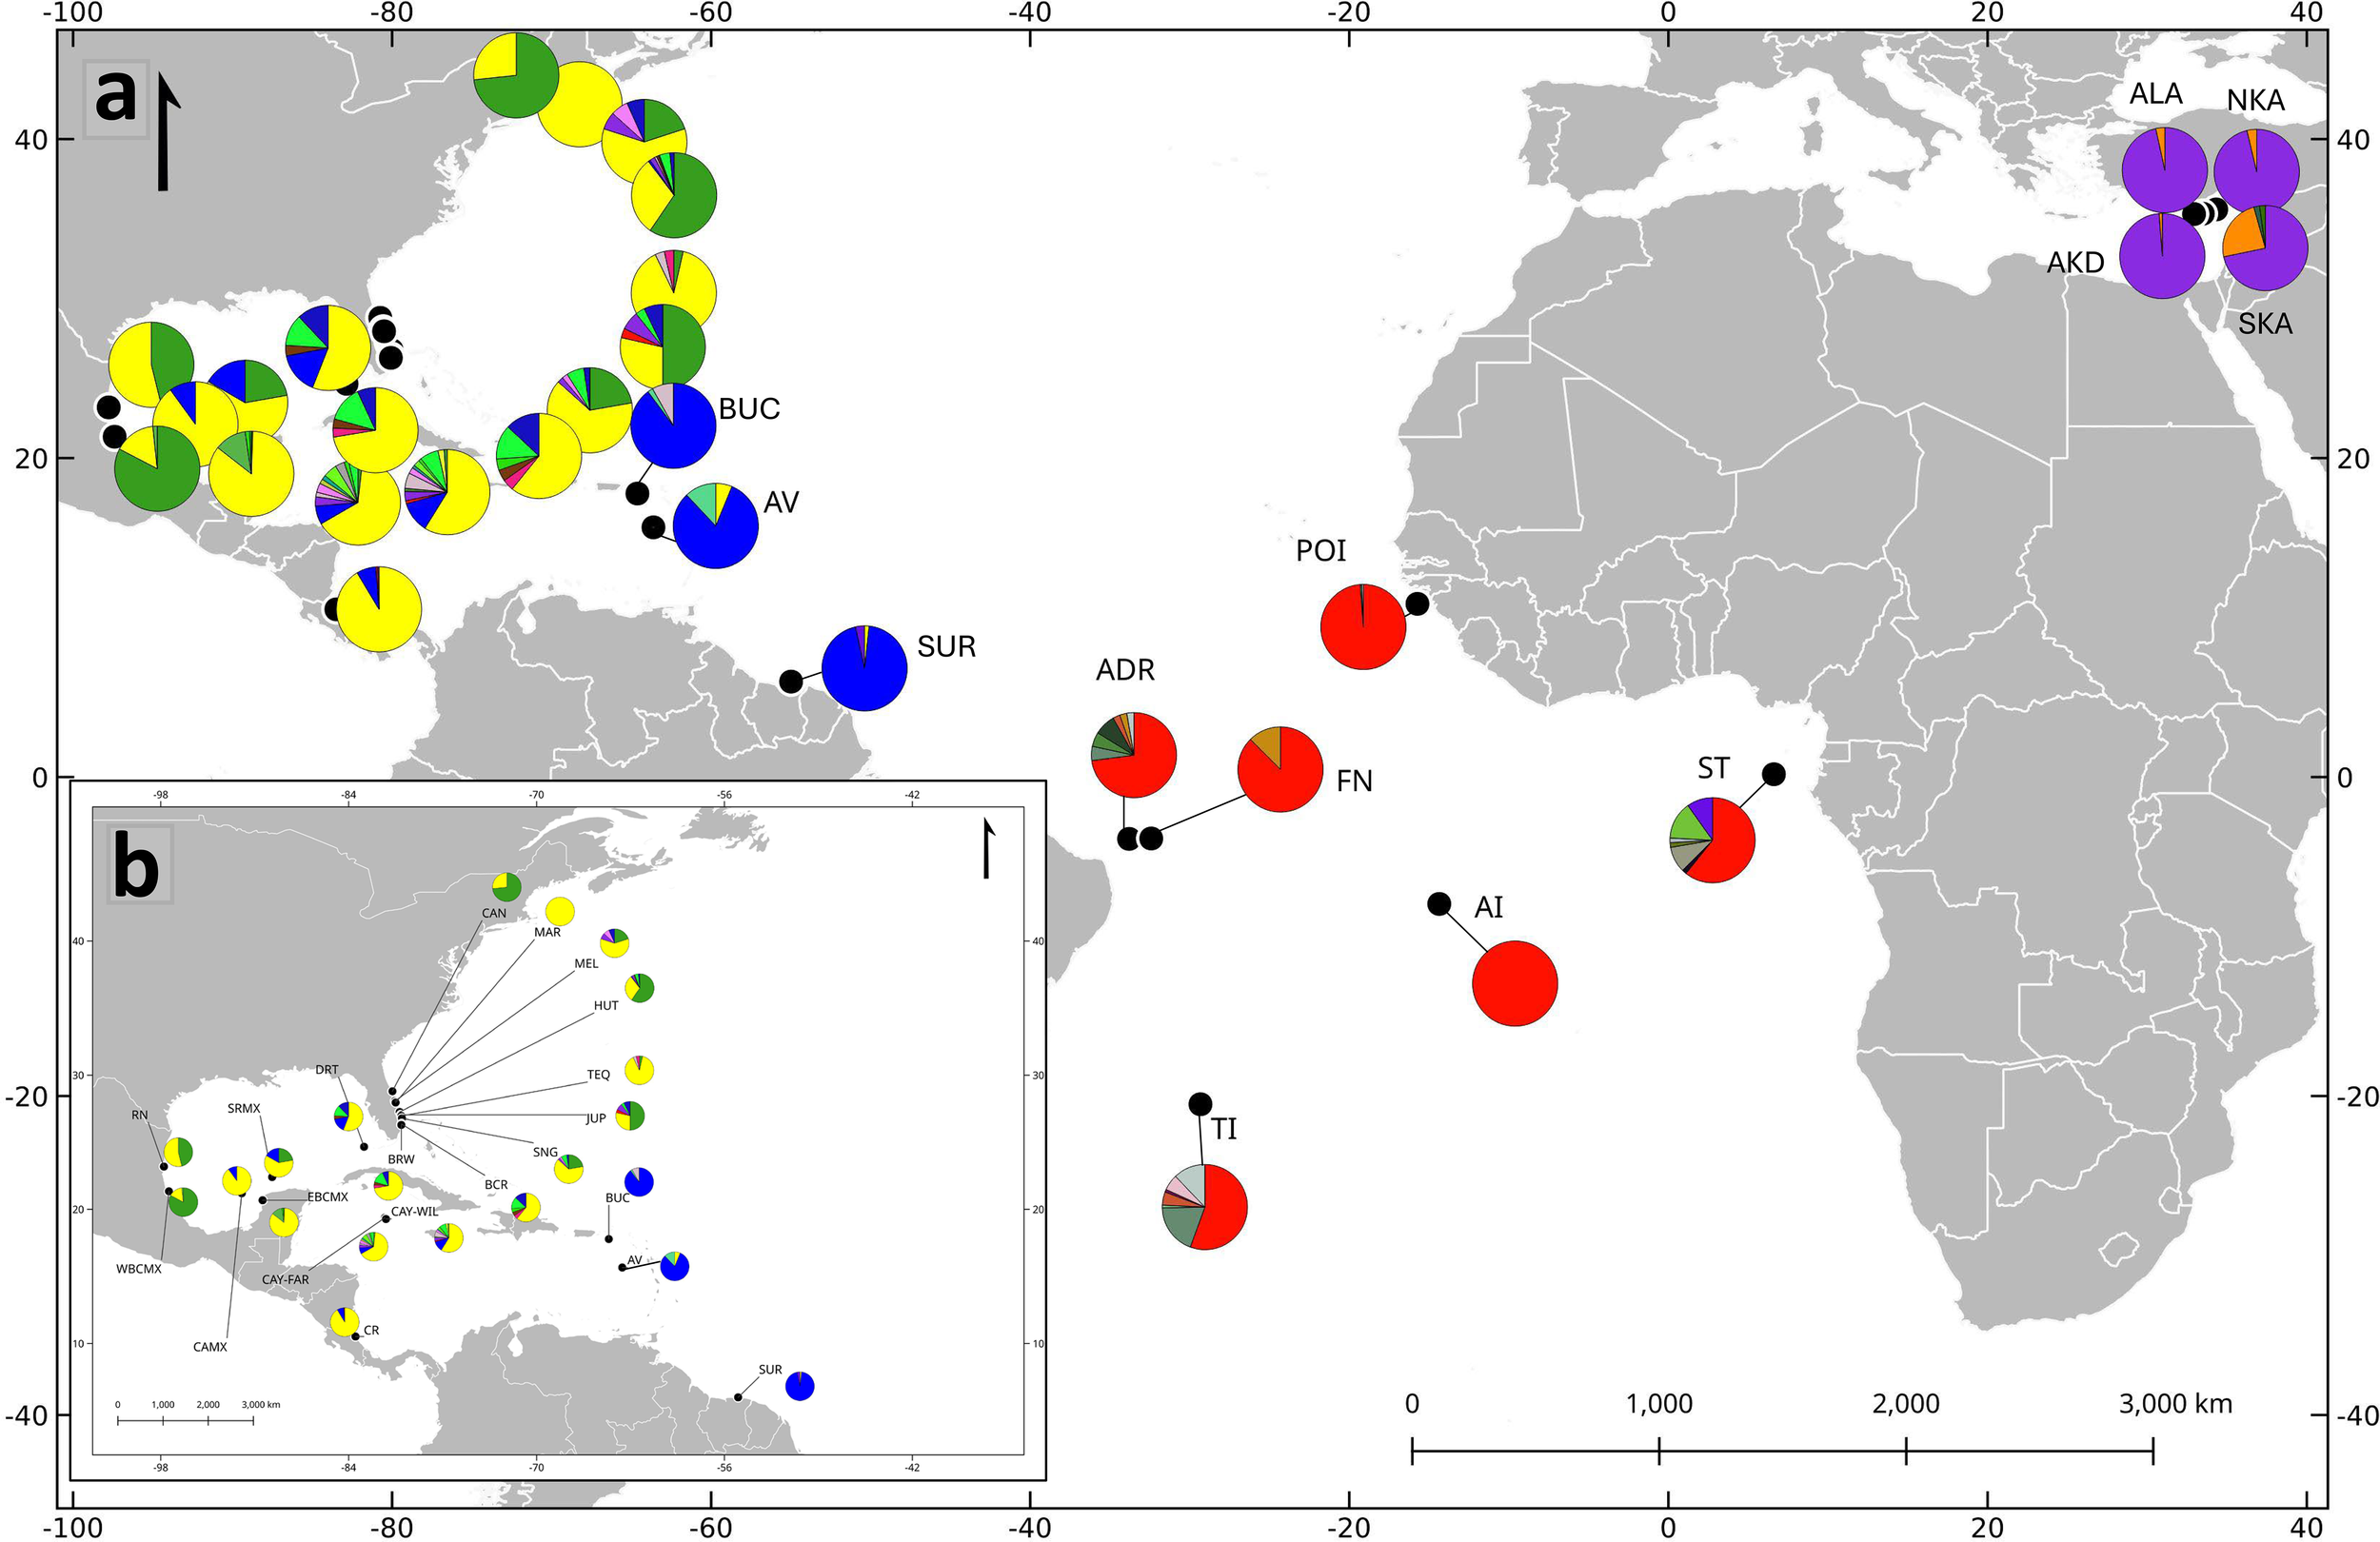
Frequency of haplotypes in an ~800 bp mtDNA fragment of the control region, estimated in the current study for two field sites (Isla de Aves, AV, and Atol das Rocas, ADR), in the context of 31 rookeries in the Caribbean, Atlantic, and Mediterranean. (a) Distribution of the four dominant haplotype groups, as defined by AMOVA, FST, and PCoA analysis (see text), indicated by colors as follows: Yellow (CM-A3.1) represents group 1, in the Gulf of Mexico and western Caribbean; Blue (CM-A5.1) represents group 2, in the southeastern Caribbean; Red (CM-A8.1) represents group 3 in the western Atlantic; and purple (CM-A13.1) represents group 4 in the Mediterranean Sea. (b) Detailed distribution of haplotype groups 1 and 2 in the Gulf of Mexico, western and southeastern Caribbean.
2.6 Haplotype composition and genetic differentiation
For both males and females from AV and ADR, in each group we calculated the number of polymorphic sites, the haplotype (h) and nucleotide (π) diversity, and haplotype frequencies (Nei, 1987), using the program DnaSP version 5.10.01 (Librado and Rozas, 2009) and ARLEQUIN version 3.01 (Excoffier et al., 2005). Because of our interest in analyzing genetic relationships and the origin of C. mydas males sampled at AV and ADR, we compared them with previously characterized C. mydas rookeries. To study variation in haplotype frequencies within and between sampling years of AV, we performed analyses of molecular variance (AMOVA) on the longer fragment data (~ 800bp) (Excoffier et al., 1992). We applied a single correction factor to the unadjusted p-values from the exact global test, using the linear step-up procedure to control the false discovery rate (Benjamini and Hochberg, 1995), which is widely used in sea turtle genetics and provides an appropriate balance between Type I and Type II error rates (Rice, 1989).
In addition to the AMOVA and the exact tests, we assessed pairwise genetic distances among sampling sites using the Weir and Cockerham (1984) estimator of the fixation index FST using the “hierfstat” R package. We conducted 999 permutations to obtain the respective p-values (Goudet, 2005) and set significance thresholds after B-Y FDR correction (Benjamini and Yekutieli, 2001). We plotted results with heatmaps and dendrograms using the “gplots” R package (Warnes et al., 2016). Also, we performed a principal coordinate analysis (PCoA) with the software GenAlEx v6.5 (Peakall and Smouse, 2012) based on FST values. We used FST instead of ФST (Weir and Cockerman, 1984), because there may be a considerable discrepancy between the estimated FST based on the haplotype frequency and ФST based on weighted genetic distance, when two highly divergent lineages exist (Shamblin et al., 2012). This haplotype distribution creates a scenario in which the inter-haplotype differences within some nesting rookeries are greater than the differences between them, thus eroding the genetic signal of the population (Shamblin et al., 2012).
2.7 Mixed stock analysis
In addition to the classical analyses of population differentiation described above, we also used a Bayesian mixed-stock analysis (MSA), as implemented in Bayes (Pella and Masuda, 2001), to assess the composition of each courtship/mating study site. Because our objective was to evaluate the natal origins of males, the MSA was performed exclusively on the male samples collected at each courtship/mating area. We used this analysis, which assumes the male population was indeed a mixed stock (in spite of there being no evidence for mixing), in order to take the most conservative approach possible to our data. MSA estimates the proportion of individuals in each courtship/mating area coming from different rookeries. Here, “individuals in courtship/mating area” refers to the males sampled in these aggregations. This analysis is useful because it allows us not only to study the genetic structure of a population but also to numerically quantify the strength of its connections to other populations (Pella and Masuda, 2001). These models incorporate mtDNA haplotype frequency data observed both in nesting sites and courtship/mating areas, adjusting the data using a Monte Carlo Markov Chain algorithm (MCMC, Pella and Masuda, 2001). We used a baseline with a total of 31 rookeries (Supplementary Material, Supplementary Table S1), analyzed in previous studies using the same mtDNA primer pair. We chose not to use a ‘many-to-many’ MSA because we wanted to compare many rookeries to just one mixed (courtship/mating) site per analysis, and the ‘many-to-many’ approach requires the inclusion of all potential mixed areas (Bolker et al., 2003; Bolker et al., 2007). We conducted the analyses considering all rookeries as independent units and considered iterated MCMC chains reliable only when the Gelman–Rubin criterion was fulfilled (G-R shrink factor <1.2 for all parameters; Gelman et al., 1996).
3 Results
3.1 Haplotype composition and genetic differentiation between males and females from Isla de Aves and Atol das Rocas
We found the same three haplotypes for females and males from Isla de Aves (Table 1). The most frequent haplotype from Isla de Aves for both sexes was CM-A5.1 (81.3% and 77.1% for females and males, respectively). The next most common one for both was CM-A5.2 (12.1 and 12.04% respectively), and finally CM-A3.1 was the least frequent (6.5 and 10.8%, respectively). The AMOVA within rookeries (Table 2), indicated that females and males from Isla de Aves had the same haplotype frequencies for all years, except for one significant difference between females sampled in 2008 vs 2010 (p = 0.012+/-0.001), and one between females sampled in 2008 and males sampled in 2012 (p = 0.005 +/- 0.000; Table 3). For females and males from AV, haplotype diversity (h) was low compared to other regional sites, which was consistent with previous studies (Bowen et al., 1992; Shamblin et al., 2012), whereas nucleotide diversity (π) was intermediate (Table 4).
Table 1
| AV | ADR | |||||||||
|---|---|---|---|---|---|---|---|---|---|---|
| 2008 | 2009 | 2010 | 2012 | 2005 | 2005 | |||||
| Haplotypes | Genbank Accession number | AVf | AVm | AVf | AVm | AVf | AVm | AVm | ADRf | ADRm |
| CM-A5.1 | JN632498 | 72 | 11 | 79 | 1 | 24 | 27 | 25 | 1 | |
| CM-A5.2 | JN632499 | 9 | 3 | 15 | 0 | 2 | 2 | 5 | 1 | |
| CM-A3.1 | JN632497 | 2 | 0 | 6 | 0 | 6 | 2 | 7 | 1 | |
| CM-A8.1 | JF308472 | 27 | 22 | |||||||
| CM-A8.3 | JF308474 | 1 | 1 | |||||||
| CM-A9.1 | JF308475 | 2 | 2 | |||||||
| CM-A10.1 | JF308476 | 2 | ||||||||
| CM-A12.1 | JF308482 | 3 | 1 | |||||||
| CM-A25.1 | JF308483 | 1 | 1 | |||||||
| CM-A32.1 | JF308480 | 1 | ||||||||
| Total | 83 | 14 | 100 | 1 | 32 | 31 | 37 | 37 | 30 | |
Haplotype frequencies of male (m) and female (f) green turtles from Isla de Aves and Atol das Rocas.
Bold values indicate the total number of individuals sampled (n) for each year, sex, and rookery.
Table 2
| Source of Variation | Degrees of freedom | Sum of Squares | Component of Variation | % Variation |
|---|---|---|---|---|
| Between years | 6 | 1.44 | 0.001 | 1.15 |
| Within years | 291 | 48.64 | 0.167 | 98.85 |
| Total | 945 | 50.07 | 0.169 | |
| FST | 0.0115 |
Percentage of variation in haplotype frequencies explained within and between sampling years, in all C. mydas from Isla de Aves, Venezuela (regardless of sex) for a ~800bp fragment of the mitochondrial control region, as estimated with exact tests of differentiation (AMOVA).
Bold values indicate FST (Fixation index).
Table 3
| AVf (2008) | AVm (2008) | AVf (2009) | AVf (2010) | AVm (2010) | AVm (2012) | |
|---|---|---|---|---|---|---|
| AVf (2008) | * | |||||
| AVm (2008) | 0.53956+-0.0047 | * | ||||
| AVf (2009) | 0.30810+-0.0049 | 0.74299+-0.0026 | * | |||
| AVf (2010) | 0.01218+-0.0011 | 0.09197+-0.0032 | 0.06500+-0.0019 | * | ||
| AVm (2010) | 0.48615+-0.0030 | 0.37081+-0.0037 | 0.51431+-0.0047 | 0.34035+-0.0025 | * | |
| AVm (2012) | 0.00507+-0.0004 | 0.22935+-0.0039 | 0.08798+-0.0036 | 0.62850+-0.0045 | 0.18013+-0.0039 | * |
P-values for exact tests of differentiation (AMOVA) in the frequency of haplotypes of an ~800bp fragment of the mitochondrial control region, between years for female and male C. mydas from Isla de Aves.
Significantly different values after correction for multiple comparisons are indicated in bold.
Table 4
| Sample Size | Locality | H | h +/- SD | π +/- SD | Range of CCLn-t in cm (mean) |
|---|---|---|---|---|---|
| 215 | AVf | 3 | 0.31 +/- 0.03 | 0.0018 +/- 0.0004 | 110.7-115.6 (113.15) |
| 83 | AVm | 3 | 0.33 +/- 0.06 | 0.0027 +/- 0.00007 | 92-116.7 (105.2) |
| 30 | ADRm | 7 | 0.46 | 0.0030 | 97-112 (104.5) |
| 37 | ADRf | 8 | 0.46 +/- 0.1 | 0.0020 +/- 0.00024 | 96-132 (114.5) |
Mean estimates (+/- standard deviation, SD) of number of haplotypes (h), haplotype diversity (H) and nucleotide (π) diversity in a ~800bp fragment of the control region of mitochondrial DNA in C. mydas individuals sampled as follows: AVf, AVm: female and male turtles from Isla de Aves, respectively; ADRf, ADRm: female and male turtles from Atol das Rocas, respectively.
In contrast, females from Atol das Rocas had seven haplotypes, with CM-A8.1 the most frequent (73%), followed by CM-A12.1 (8.1% Table 1), while males had eight different haplotypes. The most frequent was CM-A8.1 (73.2%), followed by CM-A9.1 (6.6%), with the remaining six at low frequencies (3.3% each). All haplotypes matched those previously described in the international haplotype database (ACCSTR DataBase; http://accstr.ufl.edu/resources/mtdna-sequences/), with no new haplotypes observed. For females and males from Atol das Rocas, values of h were higher but the π values were also similar (Table 4).
Comparisons of pairwise FST values (Supplementary Material, Supplementary Table S2) among the 31 locations in our genetic database clearly revealed four regional groups, each one characterized by one or two major haplotypes, with the highest and significant genetic distances among populations of different groups, and the lowest FST values among populations within the same group (Figures 2–4). We designated these groups as 1: the rookeries included in Gulf of Mexico and western Caribbean (with CM-A3.1 and CM-A1.1 most frequent); group 2: southeastern Caribbean (CM-A5.1 predominating); group 3: western Atlantic/Africa (CM-A8.1 predominating); and group 4: Mediterranean Sea (CM-A13.1 predominating). When comparing males and females from the same location, we found no differences between Isla de Aves males and females (FST=0.004, p-value =0.22) nor between Atol das Rocas males and females (FST=-0.012, p-value =0.71).
Figure 3
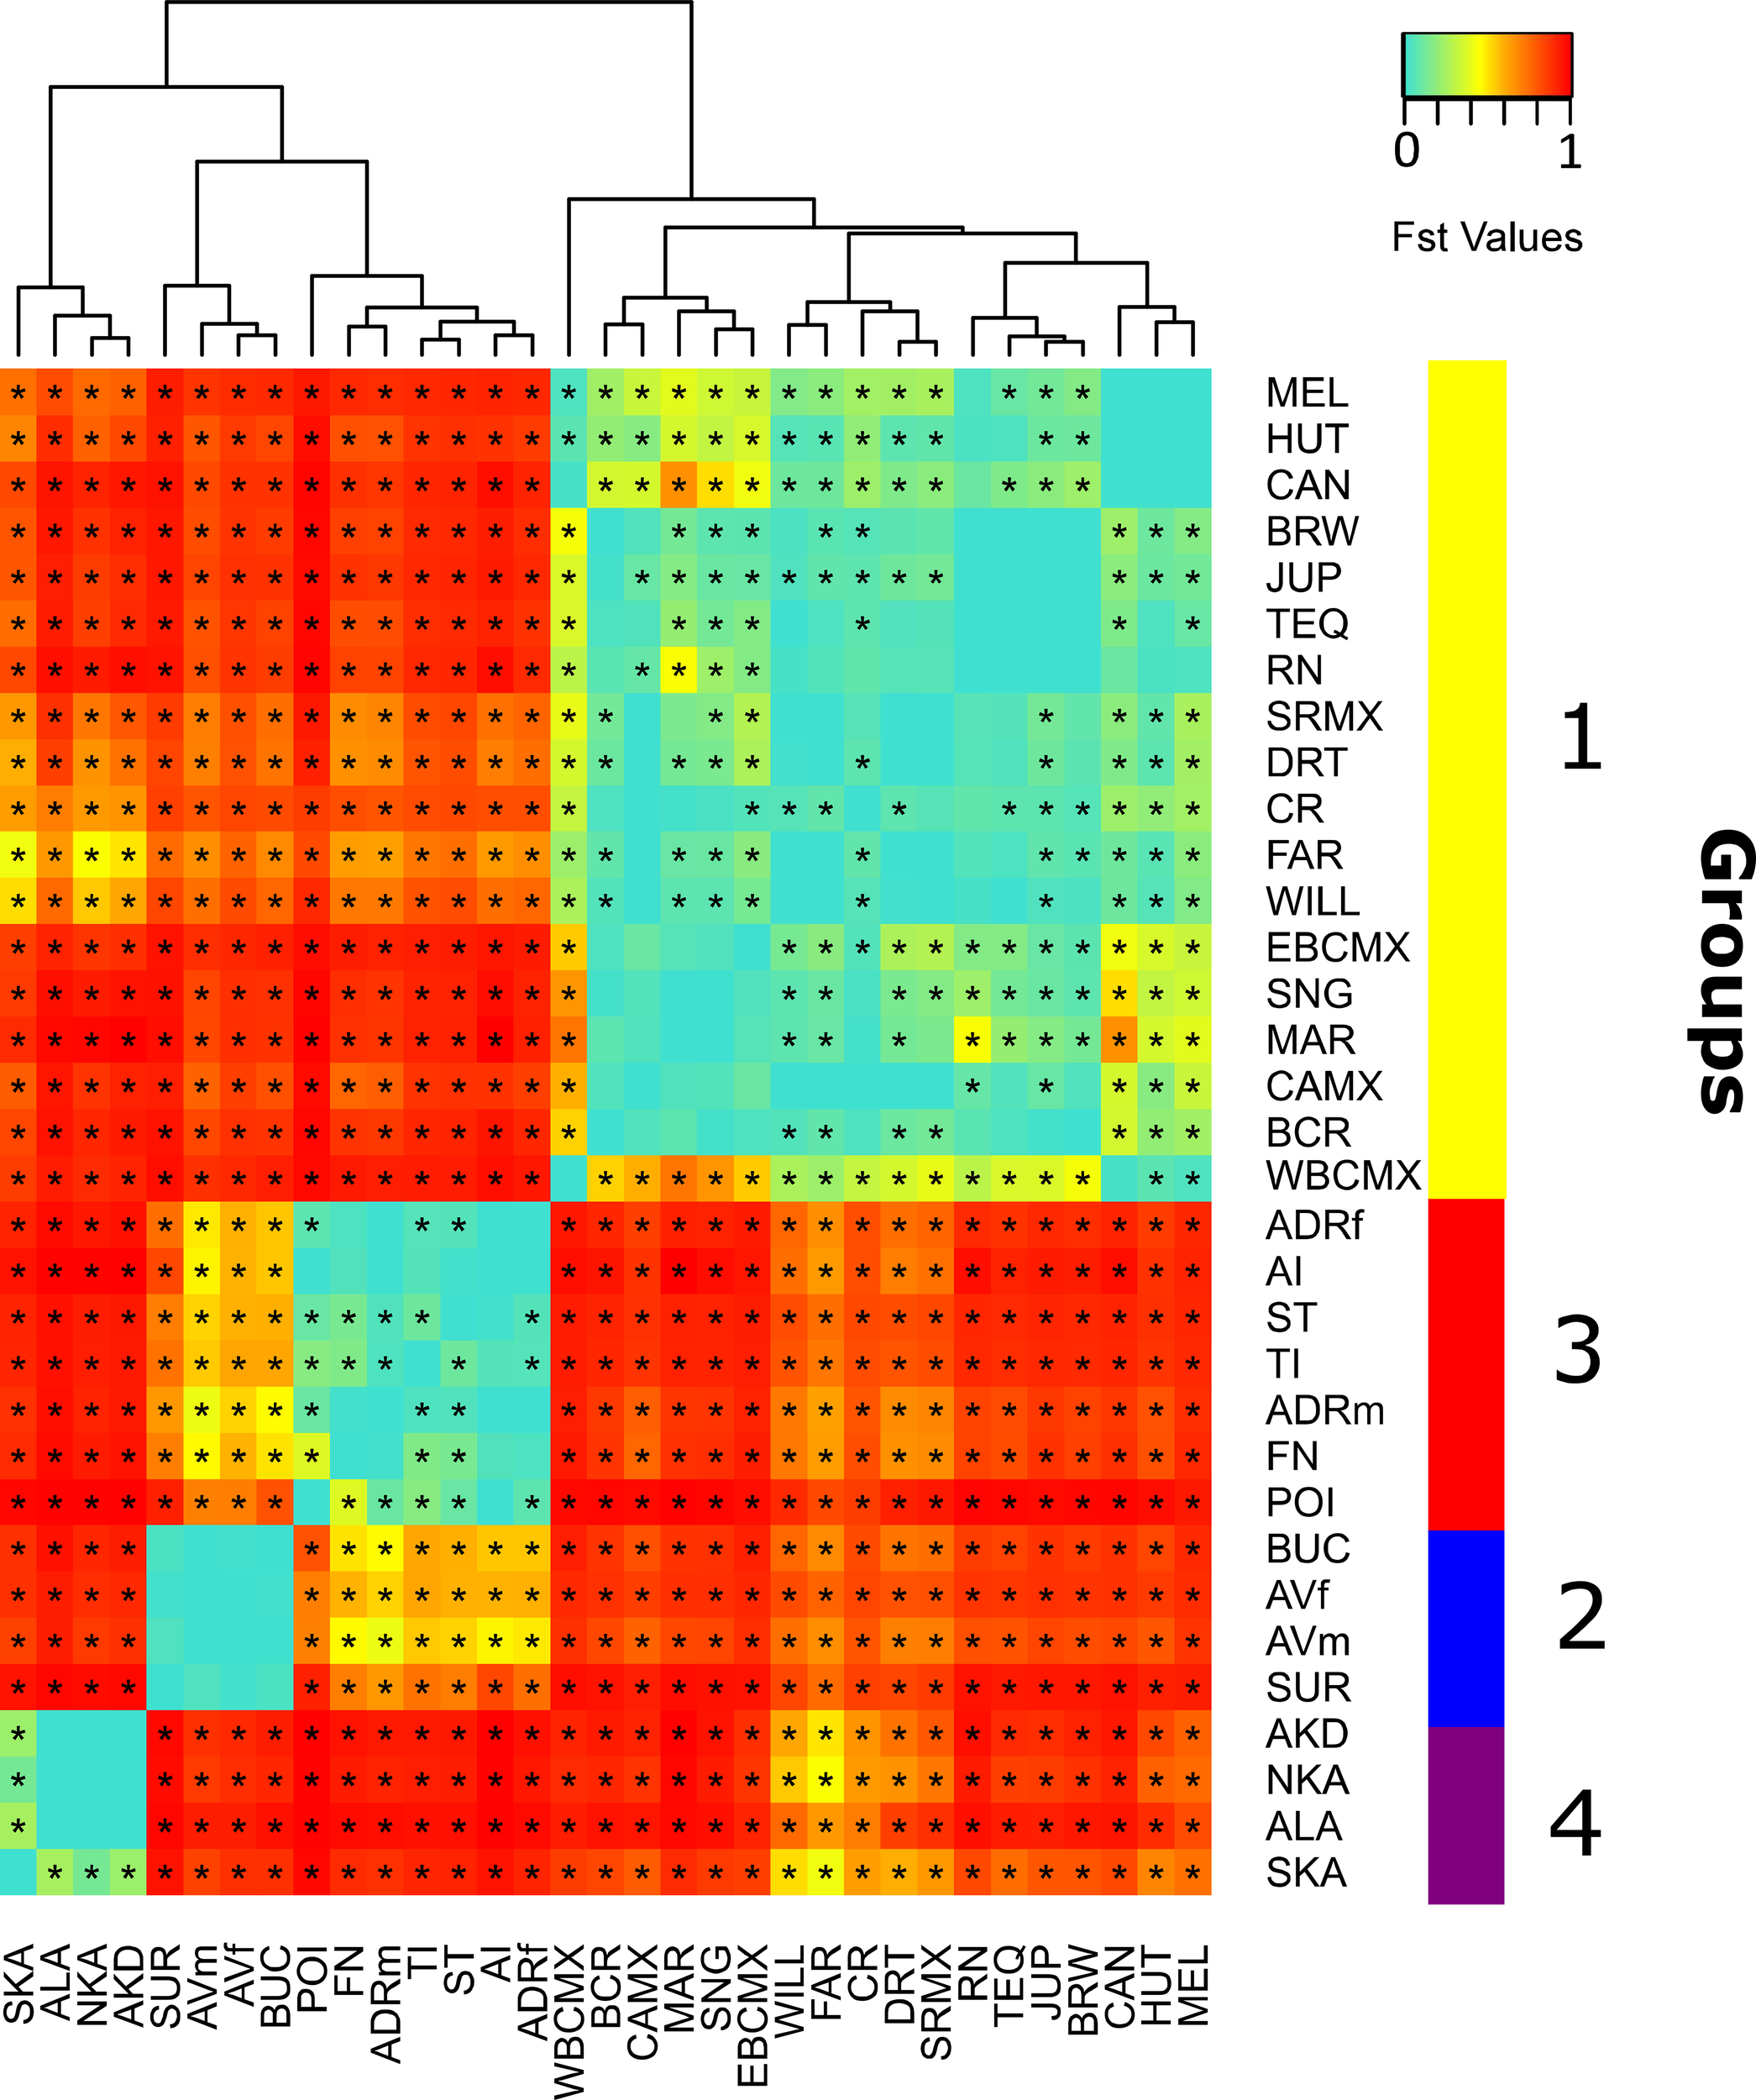
Heatmap of FST values among all 31 nesting and 2 courtship/mating sites of C. mydas in the Caribbean, western Atlantic, and Mediterranean, listed in order of relationship based on the FST values shown at the top of the heatmap. The geographic location of each of the identified regional groups is plotted on the y axis at the right side of the heatmap. The four major groups were: the Gulf of Mexico and western Caribbean (yellow; group 1), eastern Caribbean (blue; group 2), western Atlantic (red; group 3) and Mediterranean Sea (purple, group 4). Abbreviations of nesting and courtship/mating sites are as described in Figures 1, 2. FST values significantly above zero are indicated with an asterisk.
Figure 4
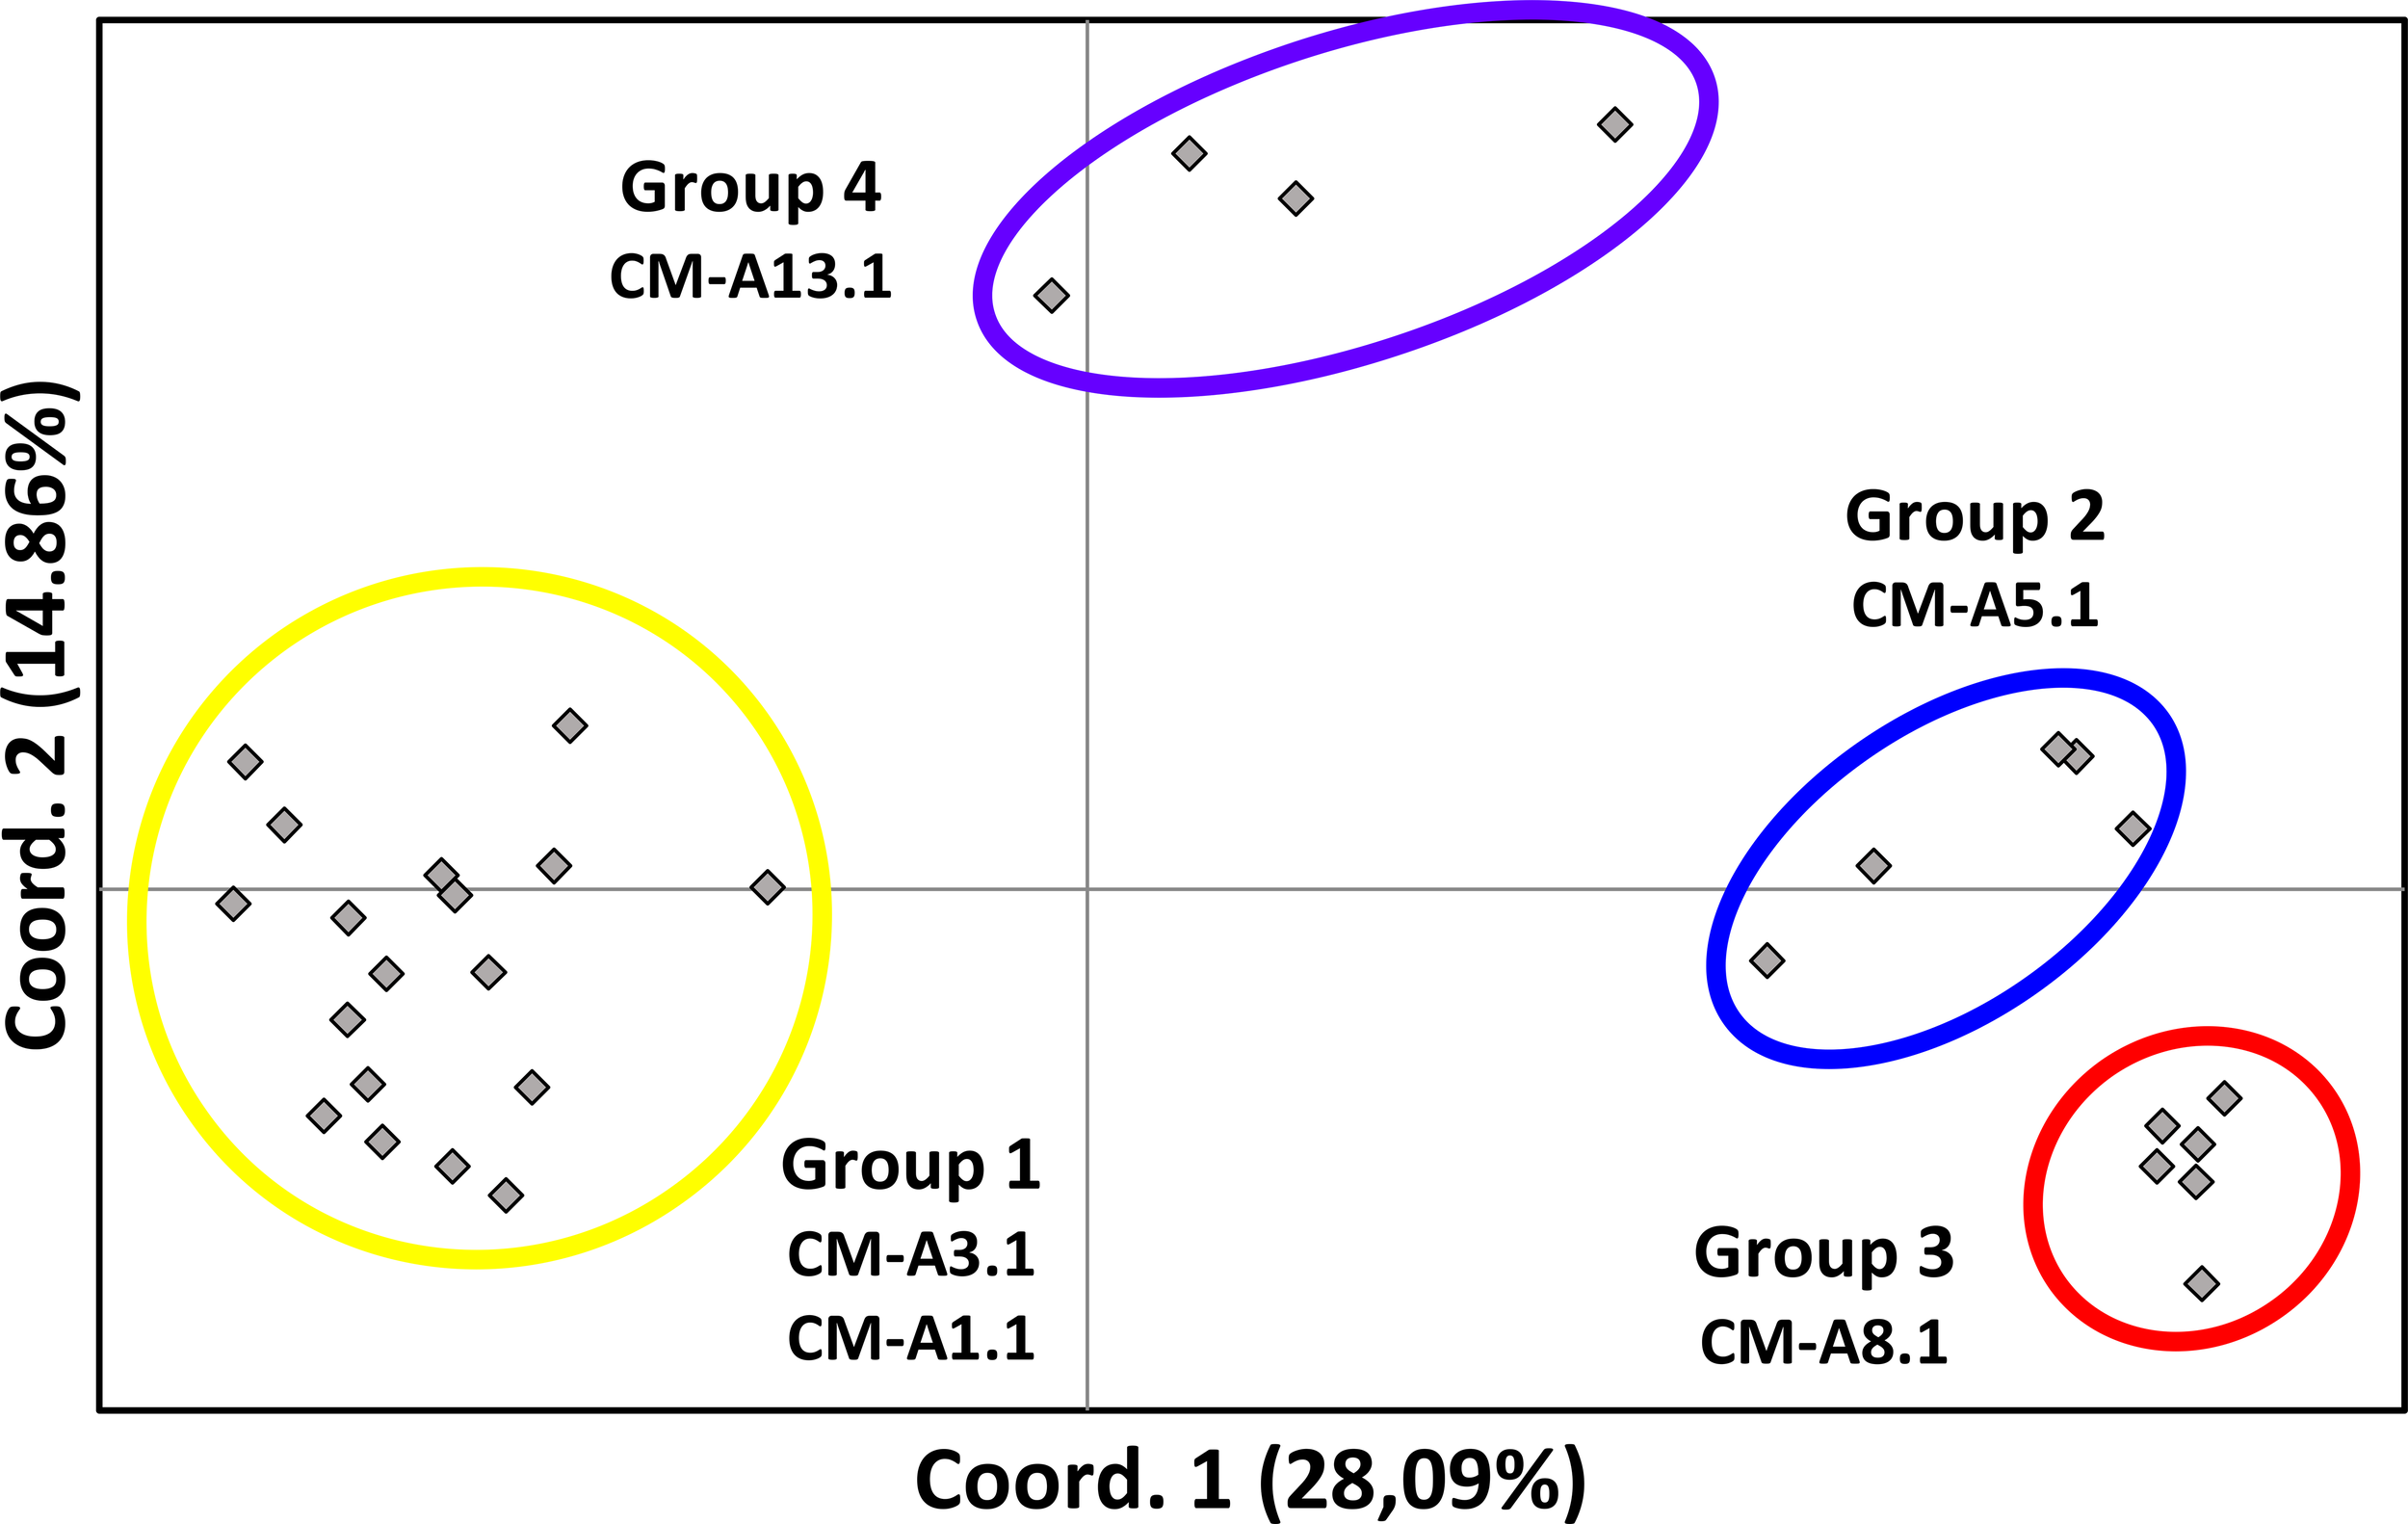
Principal Coordinate Analysis (PCoA) based on the genetic distances (FST) obtained by genotyping a ~800bp fragment of the mtDNA control region, in C. mydas at 31 nesting and 2 courtship/mating sites in the Caribbean, Atlantic, and Mediterranean. The percent of variation explained for each principal component is shown in parenthesis. Colored circles indicate the major clusters identified. The four major groups were: the Gulf of Mexico and western Caribbean (yellow; group 1), eastern Caribbean (blue; group 2), western Atlantic (red; group 3) and Mediterranean Sea (purple, group 4).
3.2 Mixed stock analysis
Results from MSA models revealed that most Isla de Aves males (AVm) originated from the Isla de Aves rookery (AVf; 95.26%), while a small portion originated from Suriname (0.85%) and Buck Island (0.37%). Males from Atol das Rocas (ADRm) came also mainly from Atol das Rocas rookery (ADRf; 74.50%), Isla de Aves (5.63%), and Fernando de Noronha (4.31%), but also from Trindade Island, Brazil (2.57%), Poilão in Guinea Bissau (3.80%) and Ascension Island (3.48%) (Figure 5; Supplementary Material, Supplementary Table S3). The 95% confidence intervals of the putative origins other than ADR included 0 and were very wide.
Figure 5
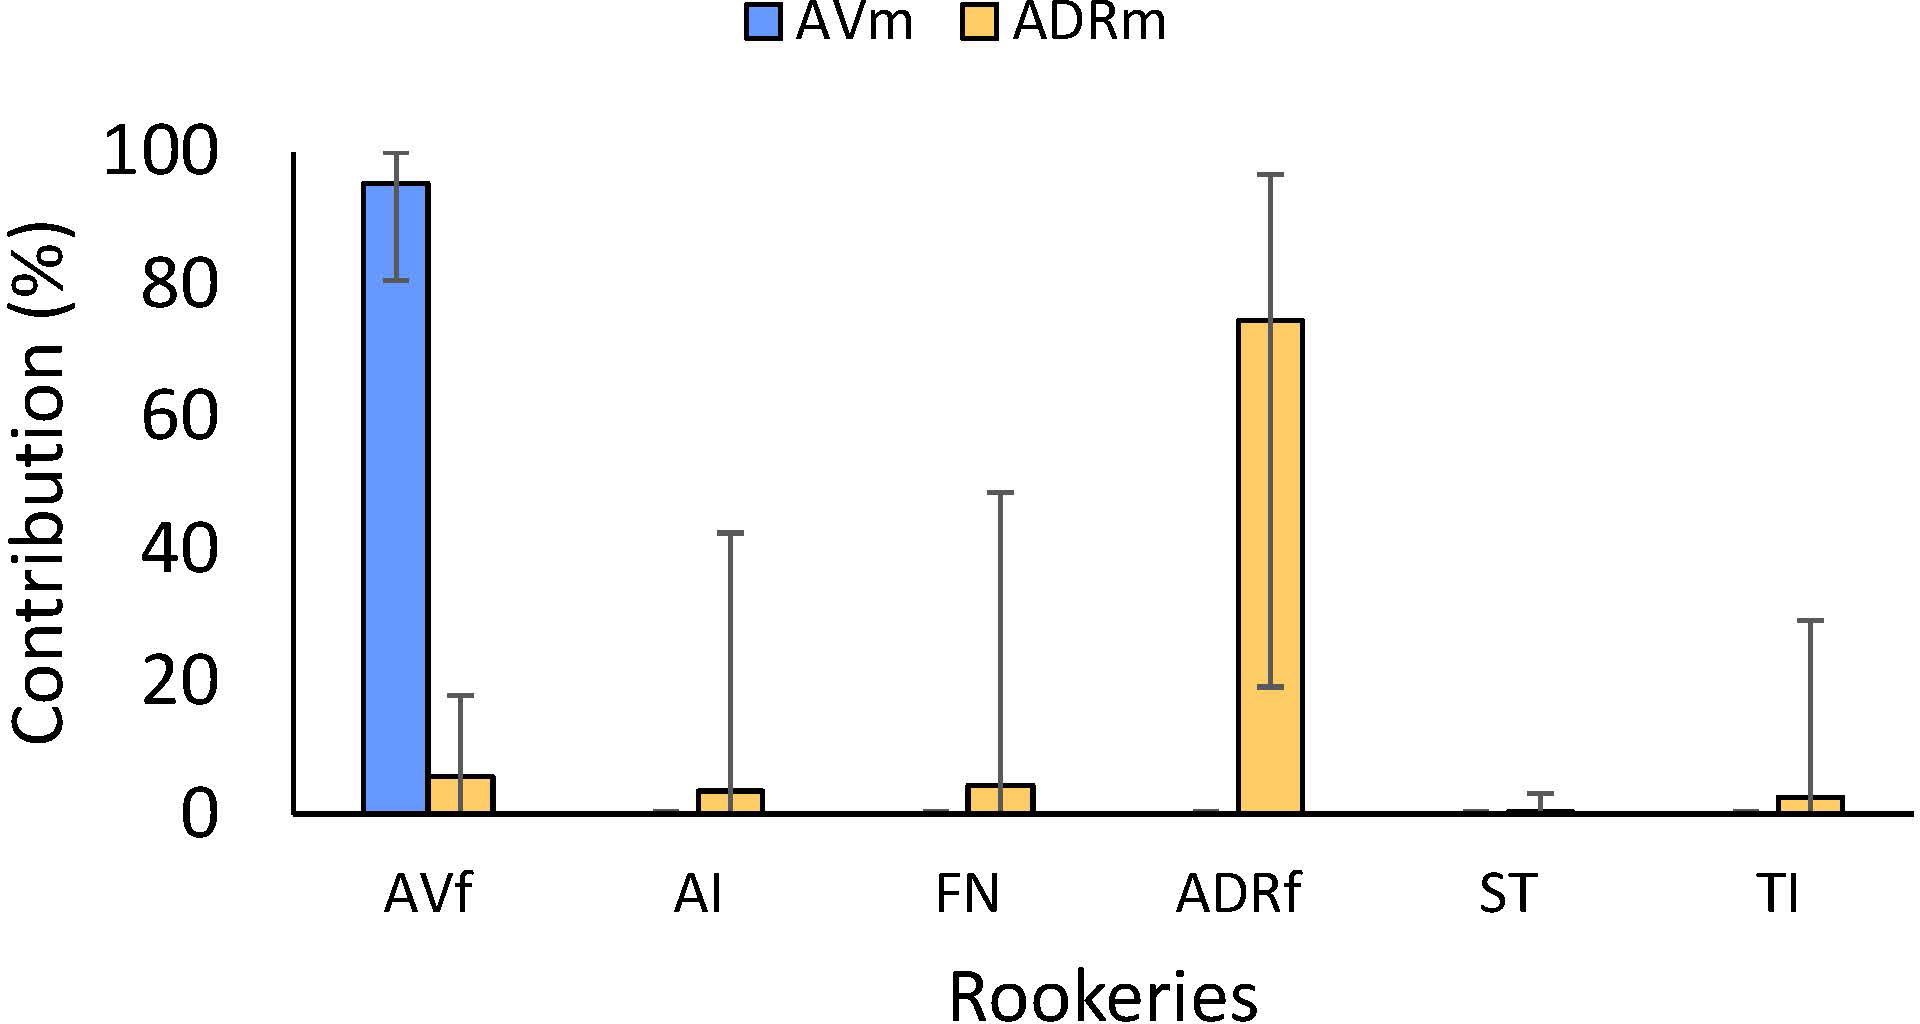
Mixed stock analysis of males from two courtship/mating aggregations in the Atlantic: Isla de Aves (AVm) and Atol das Rocas (ADRm). Only rookeries where contributions were higher than 1% from at least one of the aggregations are shown: Isla de Aves (AV), Ascension Island (AI), Fernando de Noronha (FN), Poilao (POI) and Trindade Island, Brazil. Detailed contributions from all potential rookeries are provided in Supplementary material, Supplementary Table S3.
These genetic patterns are consistent with the distinct seasonal reproductive phenology of the two study sites. At Isla de Aves, the short and highly synchronized breeding season corresponds with the low haplotype diversity and strong local assignment of males observed in our analyses. In contrast, Atol das Rocas exhibits a more extended reproductive season, which increases the likelihood of temporal overlap with males from other rookeries. This is reflected in the higher haplotype diversity in ADR males and in the broader range of MSA contributions detected at this site.
4 Discussion
This study provides the first direct evidence of male green turtle natal homing to courtship and mating areas in the Caribbean. Our findings also support the earlier suggestion by Naro-Maciel et al. (2012), who hypothesized male natal homing behaviour in the western Atlantic, specifically at Atol das Rocas. While our results show no significant genetic differentiation between males and females within each breeding population, the presence of a greater number of haplotypes in males from Atol das Rocas — despite a smaller sample size — highlights the limitations of the current dataset and points to the need for further research on male-mediated connectivity. Our data do not support these patterns as clear evidence of different levels of natal homing between male aggregations. Instead, we emphasize that both Isla de Aves and Atol das Rocas may serve as ecologically important and geographically constrained mating grounds. The genetic signal observed at Atol das Rocas could reflect the convergence of individuals from different origins along overlapping migratory routes. Given that both AV and ADR are more separate from other stocks than previously appreciated, with both males and females returning to natal areas for reproduction, future recruitment will need to come from within to maintain them, so their designations as formal protected areas (ADR as a UNESCO World Heritage Site and AV as a Wildlife Refuge) will remain essential for their future conservation.
4.1 Natal homing and evolutionary history
Although our findings suggest some variation in haplotype composition between the two sites, these should be interpreted cautiously. The greater number of haplotypes in Atol das Rocas males, including one found at Isla de Aves, may point to current connectivity between populations or recently shared history. Our data do not support this as conclusive evidence of reduced natal homing of males from Atol das Rocas. Instead, it may reflect broader evolutionary and demographic patterns, influenced by regional colonization history, local environmental conditions, and migratory overlap. In Atol das Rocas, the proximity of other breeding sites such as Fernando de Noronha and Ascension Island along adult migratory routes may also contribute to the observed genetic mix. Historical patterns of green turtle colonization in the Atlantic, particularly the west-to-east dispersal model (Shamblin et al., 2012), could explain why Isla de Aves may have a more established and stable rookery than Atol das Rocas. Isla de Aves is one of the largest rookeries in the Caribbean (García-Cruz et al., 2015), while Atol das Rocas is smaller, which may influence the diversity and dynamics of individuals returning to mate. However, caution is warranted in making inferences about fidelity based solely on rookery size or mtDNA diversity. These questions highlight the importance of incorporating broader genetic and ecological data, including nuclear DNA, mitogenomic analysis and behavioral tracking, to fully understand male natal homing and dispersal patterns. To advance our understanding of these mechanisms, future research should prioritize the inclusion of additional male mating aggregations, increased sample sizes in Atol das Rocas, and the use of high-resolution genomic tools and satellite telemetry in both populations.
4.2 Haplotype composition, genetic differentiation
At Isla de Aves, we observed some temporal variation in haplotype frequencies in both males and females. Although overall AMOVA results showed no significant inter-annual differences, certain pairwise comparisons were significant, possibly due to sampling variation or demographic fluctuations. Nonetheless, genetic structure between Isla de Aves and Atol das Rocas was clear and supported by PCoA and MSA results. MSA indicated that most AV males originated from AV, suggesting strong natal homing. In contrast, Atol das Rocas males appeared to derive from a broader range of western Atlantic and African rookeries. While these results may suggest wider dispersal, several caveats must be considered when interpreting MSA.
First, MSA assumes that baseline datasets accurately represent haplotype frequencies across all potential rookeries. This assumption may be violated due to limited or uneven sampling or temporal shifts in haplotype frequencies. In the case of Atol das Rocas, the absence of haplotypes such as CM-A3.1, CM-A5.1, and CM-A5.2 in the small ADRf sample does not preclude their occurrence in the rookery. Their presence in ADR males likely reflects natal origins outside ADR, but it may also result from incomplete sampling of ADR females. Thus, limited baseline representation could lower the apparent contribution of ADRf in the MSA. Second, the method is sensitive to shared haplotypes across rookeries—common in sea turtles—since mtDNA haplotypes are often widespread and not unique to individual nesting colonies. This can create uncertainty or bias in rookery assignment. Third, because MSA relies exclusively on maternal markers (mtDNA), it does not capture male-mediated gene flow, which is particularly relevant when assessing connectivity in courtship or mating areas. Fourth, the approach assumes a mixture of sources; however, in some cases—such as the male aggregations at Atol das Rocas—there is no genetic differentiation from the local nesting population, strongly suggesting a single origin and equal natal homing in both sexes. Additionally, recent shared ancestry among rookeries—likely shaped by historical contractions into glacial refugia and post-glacial expansions (Naro-Maciel et al., 2014)—can confound estimates of gene flow, leading to broad confidence intervals that often include zero and thus provide limited statistical support for multiple sources.
Although there was a rationale for exploring MSA given the initial uncertainty in male origins, these limitations undermine its validity when males and females are genetically indistinguishable and most likely derive from the same rookery. For these reasons, MSA results should be interpreted as indicative rather than conclusive, and always corroborated with complementary genetic, ecological, and behavioral data. In such cases, the principle of parsimony (Occam’s Razor; Sober, 2001) suggests that the simplest explanation—namely, that the males originate from the same rookery as the females—is a plausible explanation over more complex scenarios that invoke multiple origins without supporting evidence.
4.3 Reproductive behavior
Our findings contribute to a growing understanding of male reproductive behavior in sea turtles. Previous studies have shown that male green turtles may exhibit natal homing similar to that of females (FitzSimmons et al., 1997a; Wright et al., 2012). Our results indicate that males also exhibit natal homing in our two studied populations, suggesting that the selective pressures that drive females to return to natal beaches may also influence males. The coordinated behavior of males and females can be of particular importance in isolated and demographically distinct nesting environments like Isla de Aves, where synchronized migrations of both sexes could enhance mating success. However, male reproductive strategies are likely more variable than those of females and may depend on the spatial configuration of foraging and breeding habitats.
In some populations, if feeding and breeding areas overlap, males may remain near their foraging grounds and engage in opportunistic mating with females migrating through these areas (FitzSimmons et al., 1997a, FitzSimmons et al., 1997b). In others, younger or less experienced males may follow conspecifics to breeding areas, as suggested by the social facilitation model initially proposed for females (Hendrickson, 1958; Owens et al., 1982; Meylan et al., 1990). Long-term field studies in the southern Great Barrier Reef suggest a third scenario: that males return consistently to regional courtship areas, such as offshore reefs, where they interact with females that later disperse to a range of rookeries (Limpus, 1993). This strategy appears to be characteristic of open or mixed-stock systems and is supported by telemetry and paternity studies showing that some males range widely and mate across multiple rookeries. Similarly, in the Mediterranean, Wright et al. (2012) documented male green turtles traveling between rookeries and mating at regional scales. These patterns of male-mediated gene flow are consistent with lower genetic structure at nuclear compared to mitochondrial markers, suggesting greater plasticity in male natal homing.
By contrast, in the western Atlantic, genetic evidence points to more localized male fidelity. In this context, at least three plausible scenarios for male mating behavior have emerged: 1) mating along female migration routes, where males intercept females en route to nesting beaches; 2) mating at shared feeding areas, when breeding and foraging habitats overlap and 3) mating near nesting beaches or in regional courtship areas, where males and females seasonally aggregate to reproduce. For Isla de Aves, the third scenario appears most likely, given the strong male natal homing, spatial proximity between courtship and nesting areas, and the synchronized seasonal presence of both sexes (García-Cruz et al., 2015). The second scenario seems unlikely, and while the first has been suggested for other populations, such as those in the Mediterranean, no behavioral data currently support its occurrence at either Isla de Aves or Atol das Rocas. Satellite tracking of males and further nuclear genetic analyses will be critical to evaluating these hypotheses and understanding the spatial scale of reproductive behavior in green turtles.
4.4 Seasonal and environmental influence
Reproductive behavior in green turtles is also shaped by environmental and geographic variation. In equatorial regions, nesting and mating can vary significantly over small distances (Troeng and Chaloupka, 2007; Hatase and Tsukamoto, 2008; Hatase et al., 2013). Green turtle reproduction is hormonally regulated and temporally limited — females typically breed for 40 days, and males for 1–2 months or more (Dizon and Balazs, 1982; Comuzzie and Owens, 1990). In our study, turtles at Isla de Aves reproduce between June and November, while those at Atol das Rocas do so from December to May/June (Bellini et al., 1996; Bellini et al., 2013). Similar patterns of seasonal bimodality have been documented in Australian green turtle populations (e.g., Great Barrier Reef and Gulf of Carpentaria), where synchrony in male and female timing is likely under strong selective pressure (FitzSimmons et al., 1997a, FitzSimmons et al., 1997b). Consequently, our results of male philopatry may be the evolutionary results of both geographical end seasonal constraints that favor temporal and spatial coordination of both males and females.
5 Conclusions
Our study provides new insights into the reproductive ecology and genetic connectivity of male green turtles in the southeastern Caribbean and western Atlantic. While our findings suggest that male turtles return to their natal regions to reproduce, particularly at Isla de Aves, this represents an important expansion of current understanding, which has historically focused almost entirely on female natal homing. Demonstrating that males also exhibit natal-region fidelity has direct implications for population dynamics: it indicates that both sexes may contribute to maintaining rookery-specific genetic structure, influencing effective population size, gene flow, and the resilience of subpopulations to localized threats. We emphasize that observed differences in haplotype diversity should be interpreted cautiously, given the limitations of mitochondrial markers, small sample sizes, and shared haplotypes across rookeries. These limitations also constrain the extent to which our findings can be generalized to other localities or populations, as mtDNA alone may not fully capture male-mediated gene flow and small or uneven sampling can obscure finer-scale demographic patterns. Consequently, our conclusions should be viewed as robust for Isla de Aves and Atol das Rocas, but caution is warranted when extrapolating them to broader regions without complementary nuclear or genomic data. From a conservation perspective, these results highlight the importance of protecting both Isla de Aves and Atol das Rocas as critical reproductive habitats. The identification and protection of associated foraging grounds and migratory corridors are also essential. As climate change continues to alter environmental conditions and skew sex ratios (Hays et al., 2023), preserving known male aggregation areas becomes even more vital. Our results further underscore the need to integrate male behavior into conservation planning. Management actions could include the identification and legal protection of recurrent male aggregation sites, incorporation of male migratory corridors into marine spatial planning, and targeted protection of courtship habitats that overlap with major movement routes. Establishing protected migratory corridors between nesting beaches, courtship areas, and key foraging grounds would help maintain demographic connectivity and reduce exposure to threats during critical reproductive periods. On a research front, satellite telemetry of males, high-resolution genomic approaches, and long-term genetic monitoring across multiple courtship sites will be essential to refine models of male-mediated connectivity and improve the delineation of conservation units. A comprehensive understanding of both male and female life histories is necessary to support science-based conservation and management of this globally threatened species.
Statements
Data availability statement
The datasets presented in this study can be found in online repositories. The names of the repository/repositories and accession number(s) may be found in this article’s Supplementary Material.
Ethics statement
The animal study was approved by the Ministerio del Poder Popular para el Ambiente (permits #41-0495, #2325, #2012), which was the competent authority in Venezuela at the time. At the time the fieldwork was conducted, the Instituto Venezolano de Investigaciones Científicas (IVIC) did not yet have an operational Animal Ethics Committee (COBIANIM). Although the Council Directive ordering the creation of COBIANIM was issued in 2009, a formal review process was not in place until after the completion of this project. All research activities were carried out in compliance with the national regulations in force in Venezuela and in accordance with international standards of animal welfare. To further document this, we have attached the official Research Committee and Ethical Procedure Certification issued by the Ecology Center of IVIC, confirming adherence to applicable ethical standards. The study was conducted in accordance with the local legislation and institutional requirements.
Author contributions
MG-C: Conceptualization, Data curation, Formal analysis, Funding acquisition, Investigation, Methodology, Project administration, Resources, Software, Supervision, Validation, Visualization, Writing – original draft, Writing – review & editing. KR-C: Conceptualization, Investigation, Methodology, Project administration, Supervision, Validation, Visualization, Writing – original draft, Writing – review & editing, Data curation, Funding acquisition. KB: Conceptualization, Methodology, Resources, Supervision, Validation, Visualization, Writing – review & editing. AB: Conceptualization, Resources, Supervision, Validation, Writing – review & editing. EN-M: Conceptualization, Investigation, Methodology, Resources, Supervision, Validation, Visualization, Writing – original draft, Writing – review & editing. CB: Writing – review & editing. BS: Conceptualization, Investigation, Methodology, Software, Supervision, Validation, Visualization, Writing – original draft, Writing – review & editing. CC: Conceptualization, Data curation, Formal analysis, Investigation, Methodology, Project administration, Resources, Software, Supervision, Validation, Visualization, Writing – original draft, Writing – review & editing.
Funding
The author(s) declared that financial support was received for this work and/or its publication. This research was supported by the Venezuelan Institute of Scientific Research (IVIC), Precomprimido CA, Helmerich Payne of Venezuela, and The Boyd Lyon Sea Turtle Fund, which provided research funds and equipment. The contributions from Precomprimido CA and Helmerich Payne of Venezuela were made as part of the LOCTI (Ley Orgánica de Ciencia, Tecnología e Innovación) program. This research was also funded by the projects GenoMarTur (CNS2022-135205 funded by MICIU/AEI/10.13039/501100011033 and the ‘European Union NextGenerationEU/PRTR’) and the project BlueDNA (PID2023-146307OB) funded by MCIN/AEI/10.13039/501100011033 and ERDF/EU, both of them from the Spanish Government. The Fundación para la Defensa de la Naturaleza (FUDENA) and the Ministerio del Poder Popular para el Ambiente (MINPPA) issued the required permits (#41-0495, #2325, #2012). The National Bolivarian Navy (ANB) provided logistical support. CC is member of the research group SGR2021-01271 funded by the Generalitat de Catalunya. The funders had no role in study design, data collection and analysis, decision to publish, or preparation of the manuscript.
Acknowledgments
This article is dedicated to the memory of Dr. Alan B. Bolten, from the Archie Carr Center for Sea Turtle Research, whose guidance, constructive feedback, and insightful discussions greatly enriched the content of this manuscript. We thank the Ministerio del Poder Popular para el Ambiente (MINPPA) for issuing the research permits (#41-0495, #2325, #2012) and for their long-term collaboration in sea turtle conservation. We are also grateful to the Instituto Venezolano de Investigaciones Científicas (IVIC) and its Centro de Estudios Avanzados (CEA) for their institutional support. We also acknowledge the contributions of the many volunteers who assisted with tagging and in-water male turtle captures, including Robert Van Dam, Luis Felaco, Verónica de los Llanos, Vanessa Francisco, Julie Belmont, Javier Medina, Michelle Barany, Eneida Fajardo, Carlos Coste, Gabriela Contreras, Rafael Montesinos, and Jorge Barbosa. We thank Sergio Zambrano for his assistance with mapping, and the volunteers and researchers of Projeto TAMAR for their support in the field and during sample collection at Atol das Rocas.
Conflict of interest
The author(s) declared that this work was conducted in the absence of any commercial or financial relationships that could be construed as a potential conflict of interest.
Generative AI statement
The author(s) declared that generative AI was used in the creation of this manuscript. The author(s) verify and take full responsibility for the use of generative AI in the preparation of this manuscript. Generative AI was used exclusively to assist with language editing, grammar correction, and improving clarity of expression, as the corresponding author is not a native English speaker. The intellectual content, data analysis, interpretation of results, and scientific conclusions are entirely the responsibility of the authors.
Any alternative text (alt text) provided alongside figures in this article has been generated by Frontiers with the support of artificial intelligence and reasonable efforts have been made to ensure accuracy, including review by the authors wherever possible. If you identify any issues, please contact us.
Publisher’s note
All claims expressed in this article are solely those of the authors and do not necessarily represent those of their affiliated organizations, or those of the publisher, the editors and the reviewers. Any product that may be evaluated in this article, or claim that may be made by its manufacturer, is not guaranteed or endorsed by the publisher.
Supplementary material
The Supplementary Material for this article can be found online at: https://www.frontiersin.org/articles/10.3389/fmars.2025.1700885/full#supplementary-material
Supplementary Table 1Number of individuals in different years with each haplotype of an ~ 800 bp fragment in the mtDNA control region of C. mydas in males and females from Isla de Aves (AVm and AVf, respectively), and Atol das Rocas (ADRm and ADRf, respectively).
Supplementary Table 2Pairwise FST values among 31 green turtle rookeries, revealing four regional groups.
Supplementary Table 3Detailed mixed stock analysis (MSA) contributions of male green turtles from Isla de Aves and Atol das Rocas courtship/mating aggregations, showing all potential source rookeries.
References
1
Abreu-Grobois F. A. Horrocks J. A. Formia A. Dutton P. H. LeRoux R. Vé lez Zuazo X. et al . (2006). “ New mtDNA D-loop primers which work for a variety of marine turtle species may increase the resolution of mixed stock analysis,” in Proceedings of the 26th annual symposium on sea turtle biology, Island of Crete, GreeceBook of Abstracts, 26th ISTS Symposium, International Sea Turtle Society, Athens, Greece, Vol. 179 (ISTS).
2
Allard M. W. Miyamoto M. M. Bjorndal K. A. Bolten A. B. Bowen B. W. (1994). Support for natal homing in green turtles from mitochondrial-DNA sequences. Copeia.1994, 34–41. doi: 10.2307/1446668
3
Altschul S. F. Gish W. Miller W. Myers E. W. Lipman D. J. (1990). Basic local alignment search tool. J. Mol. Biol.215, 403–410. doi: 10.1016/S0022-2836(05)80360-2
4
Avise J. C. (2007). “ Conservation genetics of marine turtles - 10 years later,” in Wildlife science: linking ecological theory and management applications. Eds. FullbrightT.HewittD. ( CRC Press, Boca Raton), 295–314.
5
Bagda E. Bardakci F. Turkozan O. (2012). Lower genetic structuring in mitochondrial DNA than nuclear DNA among the nesting colonies of green turtles (Chelonia mydas) in the Mediterranean. Biochem. Syst. Ecol.43, 192–199. doi: 10.1016/j.bse.2012.03.015
6
Balazs G. H. (1999). Factors to consider in the tagging of sea turtles. In: EckertK. L.Abreu-GroboisA.DonnellyM. (eds.) Research and management techniques for the conservation of sea turtles. Washington, DC: IUCN/SSC Marine Turtle Specialist Group, 101–109.
7
Bellini C. Marcovaldi M. A. Sanches T. M. Grossman A. Sales G. (1996). Atol das Rocas Biological Reserve: second largest Chelonia rookery in Brazil. Mar. Turtle. Newsl.72, 1–2.
8
Bellini C. Santos A. J. B. Grossman A. Marcovaldi M. A. Barata P. C. R. (2013). Green turtle (Chelonia mydas) nesting on Atol das Rocas, north-eastern Brazil 1990–2008. J. Mar. Biol. Assoc. U.K.93, 1117–1132. doi: 10.1017/S002531541200046X
9
Benjamini Y. Hochberg Y. (1995). Controlling the false discovery rate: a practical and powerful approach to multiple testing. J. R. Stat. Soc B57, 289–300. doi: 10.1111/j.2517-6161.1995.tb02031.x
10
Benjamini Y. Yekutieli D. (2001). The control of the false discovery rate in multiple testing under dependency. Ann. Stat.29, 1165–1188. doi: 10.1214/aos/1013699998
11
Bjorndal K. A. Bolten A. B. Chaloupka M. Y. (2005). Evaluating trends in abundance of immature green turtles, Chelonia mydas, in the greater Caribbean. Ecol. Appl.15, 304–314. doi: 10.1890/04-0059
12
Bolker B. Okuyama T. Bjorndal K. A. Bolten A. B. (2003). Sea turtle stock estimation using genetic markers: accounting for sampling error of rare genotypes. Ecol. Appl.13, 763–775. doi: 10.1890/1051-0761(2003)013[0763:STSEUG]2.0.CO;2
13
Bolker B. M. Okuyama T. Bjorndal K. A. Bolten A. B. (2007). Incorporating multiple mixed stocks in mixed stock analysis: “many-to-many. analyses. Mol. Ecol.16, 685–695. doi: 10.1111/j.1365-294X.2006.03161.x
14
Bolten A. B. (1999). Techniques for measuring sea turtles. In: EckertK. L.Abreu-GroboisA.DonnellyM. (eds.) Research and management techniques for the conservation of sea turtles. Washington, DC: IUCN/SSC Marine Turtle Specialist Group, 110–114.
15
Bowen B. W. Karl S. A. (2007). Population genetics and phylogeography of sea turtles. Mol. Ecol.16, 4886–4907. doi: 10.1111/j.1365-294X.2007.03542.x
16
Bowen B. W. Meylan A. B. Ross J. P. Limpus C. J. Balazs G. H. Avise J. C. (1992). Global population-structure and the natural history of the green turtle (Chelonia mydas) in terms of matriarchal phylogeny. Evolution.46, 865–881. doi: 10.1111/j.1558-5646.1992.tb00605.x
17
Brothers J. R. Lohmann K. J. (2015). Evidence for geomagnetic imprinting and magnetic navigation in the natal homing of sea turtles. Curr. Biol.25, 392–396. doi: 10.1016/j.cub.2014.12.035
18
Carreras C. Pascual M. Cardona L. Aguilar A. Margaritoulis D. Rees A. F. et al . (2011). Living together but remaining apart: Atlantic and Mediterranean loggerhead sea turtles (Caretta caretta) in shared feeding grounds. J. Hered.102, 666–677. doi: 10.1093/jhered/esr089
19
Comuzzie D. K. C. Owens D. W. (1990). A quantitative analysis of courtship behavior in captive green sea turtles (Chelonia mydas). Herpetologica.46, 195–202. Available online at: https://www.jstor.org/stable/3892904.
20
Delgado-Trejo C. Reyes-López M. A. Pérez-Ishiwara D. G. Lemus-Fernández R. Camacho-Sánchez F. Y. Bedolla-Ochoa C. (2025). The first comprehensive examination of male morphometrics and the operational sex ratio of the black sea turtle (Chelonia mydas agassizii) population in Colola, Michoacan, Mexico. Animals.15, 2. doi: 10.3390/ani15010002
21
Dizon A. Balazs G. (1982). Radio telemetry of Hawaiian green turtles at their breeding rookery. Mar. Fish. Rev.44, 13–20.
22
Dolfo V. Gaspar C. Tatarata M. Boissin E. Planes S. (2025). Parentage analysis in a green sea turtle (Chelonia mydas) population from French Polynesia reveals a tendency for inbreeding and unexpected plasticity in reproductive behaviour. Ecol. Evol.15, e70855. doi: 10.1002/ece3.70855
23
Dutton P. H. (1995). “ Methods for collection and preservation of samples for sea turtle genetic studies,”. Eds. BowenB. W.WitzellW. N.Proceedings of the 15th ISTS Symposium, NOAA TM NMFS-SEFSC-387 (Miami, FL, USA: NOAA Tech).
24
Dutton P. H. Roden S. E. Stewart K. R. LaCasella E. Tiwari M. Formia A. et al . (2013). Population stock structure of leatherback turtles (Dermochelys coriacea) in the Atlantic revealed using mtDNA and microsatellite markers. Conserv. Genet.14, 625–636. doi: 10.1007/s10592-013-0456-0
25
Encalada S. E. Lahanas P. N. Bjorndal K. A. Bolten A. B. Miyamoto M. M. Bowen B. W. (1996). Phylogeography and population structure of the Atlantic and Mediterranean green turtle Chelonia mydas: a mitochondrial DNA control region sequence assessment. Mol. Ecol.5, 473–483. doi: 10.1111/j.1365-294X.1996.tb00340.x
26
Excoffier L. Laval G. Schneider S. (2005). Arlequin (version 3.0): an integrated software package for population genetics data analysis. Evol. Bioinform.1, 47–50. doi: 10.1177/117693430500100003
27
Excoffier L. Smouse P. E. Quattro J. (1992). Analysis of molecular variance inferred from metric distances among DNA haplotypes: application to human mitochondrial DNA restriction data. Genetics.131, 479–491. doi: 10.1093/genetics/131.2.479
28
FitzSimmons N. N. Limpus C. J. Norman J. A. Goldizen A. R. Miller J. D. Moritz C. (1997a). Natal homing of male marine turtles inferred from mitochondrial DNA markers. Proc. Natl. Acad. Sci. U.S.A.94, 8912–8917. doi: 10.1073/pnas.94.16.8912
29
FitzSimmons N. N. Moritz C. Limpus C. Pope L. Prince R. I. T. (1997b). Geographic structure of mitochondrial and nuclear gene polymorphisms in Australian green turtle population and male biased gene flow. Genetics.147, 1843–1854. doi: 10.1093/genetics/147.4.1843
30
Fuentes M. Beal M. Patricio A. (2025). The elusive sex: satellite tracking contributions to male sea turtle spatial ecology. Endanger. Species Res.57, 273–287. doi: 10.3354/esr01417
31
García-Cruz M. A. (2015). Demography, genetics, and epibionts of the green turtle (Chelonia mydas) population breeding at Isla de Aves, Venezuela (Doctoral dissertation). (Altos de Pipe, Venezuela: Venezuelan Institute for Scientific Research (IVIC)).
32
García-Cruz M. A. Lampo M. Peñaloza C. L. Kendall W. L. Solé G. Rodríguez-Clark K. M. (2015). Population trends and survival of nesting green sea turtles Chelonia mydas on Aves Island, Venezuela. Endang. Species Res.29, 103–116. doi: 10.3354/esr00695
33
García-Cruz M. G. Medina J. De Los Llanos V. Van Dam R. P. Lampo M. Mavárez J. et al . (2013). “ Catching male green turtles (Chelonia mydas) near Isla de Aves, Venezuela,” in Proceedings of the Thirty-Third Annual Symposium on Sea Turtle Biology and Conservation, Baltimore, Maryland, USA, 5–8 February 2013Proceedings of the 33rd ISTS Symposium, NOAA TM NMFS-SEFSC-645, 134 (Miami, FL, USA: NOAA Technical Memorandum), NMFS-SEFSC-645.
34
Gelman A. Carlin J. Stern H. S. Rubin D. B. (1996). Bayesian data analysis (New York: Chapman and Hall).
35
Geneious (2012). Biomatters. Available online at: http://www.geneious.com/ (Accessed January 17, 2026).
36
Goudet J. (2005). Hierfstat, a package for R to compute and test hierarchical F-statistics. Molecular Ecology Notes5, 184–186. doi: 10.1111/j.1471-8286.2004.00828.x
37
Gow E. A. Wiebe K. L. (2014). Males migrate farther than females in a differential migrant: an examination of the fasting endurance hypothesis. R. Soc Open Sci.1, 140346. doi: 10.1098/rsos.140346
38
Grossman A. Daura-Jorge F. G. De Brito Silva M. Longo G. O. (2019). Population parameters of green turtle adult males in the mixed ground of Atol das Rocas, Brazil. Mar. Ecol. Prog. Ser.609, 197–207. doi: 10.3354/meps12821
39
Hatase H. Tsukamoto K. (2008). Smaller longer, larger shorter: Energy budget calculations explain intrapopulation variation in remigration intervals for loggerhead sea turtles (Caretta caretta). Canadian Journal of Zoology86, 595–600. doi: 10.1139/Z08-035
40
Hatase H. Omuta K. Tsukamoto K. (2013). A mechanism that maintains alternative life histories in a loggerhead sea turtle population. Ecology.94, 2583–2594. doi: 10.1890/12-1588.1
41
Hays G. C. Broderick A. C. Godley B. J. Lovell P. Martin C. McConnell B. J. et al . (2002). Biphasal long-distance migration in green turtles. Anim. Behav.64, 895–898. doi: 10.1006/anbe.2002.1975
42
Hays G. C. Laloë J.-O. Lee P. L. M. Schofield G. (2023). Evidence of adult male scarcity associated with female-skewed offspring sex ratios in sea turtles. Current Biology33, R14–R15. doi: 10.1016/j.cub.2022.11.035
43
Hays G. C. Hawkes L. A. (2018). Satellite tracking sea turtles: opportunities and challenges to address key questions. Front. Mar. Sci.5. doi: 10.3389/fmars.2018.00432
44
Hendrickson J. R. (1958). The green sea turtle, Chelonia mydas (Linn.), in Malaya and Sarawak. Journal of the Linnean Society of London, Zoology44, 451–472. doi: 10.1111/j.1096-3642.1958.tb00583.x
45
Jensen M. P. FitzSimmons N. M. Dutton P. H. (2013). “ Molecular genetics of sea turtles,” in The biology of sea turtles, Vol. III. Eds. WynekenJ.LohmannC. M. F.MusickJ. ( CRC Press, Boca Raton).
46
Karl S. A. Bowen B. W. Avise J. C. (1992). Global population genetic structure and male-mediated gene flow in the green turtle (Chelonia mydas): RFLP analyses of anonymous nuclear loci. Genetics.131, 163–173. doi: 10.1093/genetics/131.1.163
47
Kitayama C. Tomiyasu J. Bochimoto H. Kondo S. Tokuda K. Ogawa R. et al . (2021). Histological findings of sperm storage in green turtle (Chelonia mydas) oviduct. Sci. Rep.11, 19416. doi: 10.1038/s41598-021-98917-6
48
Lahanas P. N. Bjorndal K. A. Bolten A. B. Encalada S. E. Miyamoto M. M. Valverde R. A. et al . (1998). Genetic composition of a green turtle (Chelonia mydas) feeding ground population: evidence for multiple origins. Mar. Biol.130, 345–352. doi: 10.1007/s002270050254
49
Lahanas P. N. Miyamoto M. M. Bjorndal K. A. Bolten A. B. (1994). Molecular evolution and population genetics of greater Caribbean green turtles (Chelonia mydas) as inferred from mitochondrial DNA control region sequences. Genetica.94, 57–66. doi: 10.1007/BF01429220
50
Lande R. (1988). Genetics and demography in biological conservation. Science.241, 1455–1460. doi: 10.1126/science.3420403
51
Lee P. L. M. Luschi P. Hays G. C. (2007). Detecting female precise natal philopatry in green turtles using assignment methods. Mol. Ecol.16, 61–74. doi: 10.1111/j.1365-294X.2006.03115.x
52
Lee P. L. M. Schofield G. Haughey R. I. Mazaris A. D. Hays G. C. (2018). A review of patterns of multiple paternity across sea turtle rookeries. Adv. Mar. Biol.79, 1–31. doi: 10.1016/bs.amb.2017.09.004
53
Librado P. Rozas J. (2009). DnaSP v5: a software for comprehensive analysis of DNA polymorphism data. Bioinformatics.25, 1451–1452. doi: 10.1093/bioinformatics/btp187
54
Limpus C. (1993). The green turtle, Chelonia mydas, in Queensland: breeding males in the southern Great Barrier Reef. Wildl. Res.20, 513–523. doi: 10.1071/WR9930513
55
Limpus C. J. Miller J. D. Parmenter C. J. Limpus D. J. (2003). The green turtle, Chelonia mydas, population of Raine Island and the northern Great Barrier Reef: 1843-2001. Mem. Queensl. Mus.49, 349–440.
56
Lohmann K. J. Hester J. T. Lohmann C. M. (1999). Long-distance navigation in sea turtles. Ethol. Ecol. Evol.11, 1–23. doi: 10.1080/08927014.1999.9522838
57
Lohmann K. J. Lohmann C. M. F. Brothers R. J. Putman N. F. (2013). “ Natal homing and imprinting in sea turtles,” in The biology of sea turtles, Vol. III. Eds. WynekenJ.LohmanK. J.MusickJ. A. ( CRC Press, Boca Raton, FL).
58
Luschi P. Hays G. C. (2018). Behaviour: Migration and navigation (sea turtles). Encycl. Reprod.6, 95–101. doi: 10.1016/B978-0-12-809633-8.20541-4
59
Meylan A. B. Bowen B. W. Avise J. C. (1990). A genetic test of the natal homing versus social facilitation models for green turtle migration. Science.248, 724. doi: 10.1126/science.2333522
60
Miller J. (1997). “ Reproduction in sea turtles,” in The biology of sea turtles. Eds. LutzP.MusickJ. A. ( CRC Press, Boca Raton, FL).
61
Naro-Maciel E. Bondioli A. C. Martin M. Almeida A. D. Baptistotte C. Bellini C. et al . (2012). The interplay of homing and dispersal in green turtles: a focus on the southwestern Atlantic. J. Hered.103, 792–805. doi: 10.1093/jhered/ess068
62
Naro-Maciel E. Reid B. N. Alter S. E. Amato G. Bjorndal K. A. Bolten A. B. et al . (2014). From refugia to rookeries: phylogeography of Atlantic green turtles. J. Exp. Mar. Biol. Ecol.461, 306–316. doi: 10.1016/j.jembe.2014.08.020
63
Nei M. (1987). Molecular evolutionary genetics (New York: Columbia University Press).
64
Owens D. W. Grassman M. A. Hendrickson J. R. (1982). The imprinting hypothesis and sea turtle reproduction. Herpetologica.38, 124–135. Available online at: https://www.jstor.org/stable/389236.
65
Peakall R. Smouse P. E. (2012). GenAlEx 6.5: Genetic analysis in Excel. Population genetic software for teaching and research—an update. Bioinformatics28, 2537–2539. doi: 10.1093/bioinformatics/bts460
66
Pella J. Masuda M. (2001). Bayesian methods for analysis of stock mixtures from genetic characters. Fish. Bull.99, 151–167.
67
Prugnolle F. de Meeûs T. (2002). Inferring sex-biased dispersal from population genetic tools: a review. Heredity.88, 161–165. doi: 10.1038/sj.hdy.6800060
68
Rice W. R. (1989). Analysing tables of statistical tests. Evolution.43, 223–225. doi: 10.1111/j.1558-5646.1989.tb04220.x
69
Roberts M. A. Schwartz T. S. Karl S. A. (2004). Global population genetic structure and male-mediated gene flow in the green sea turtle (Chelonia mydas): analysis of microsatellite loci. Genetics.166, 1857–1870. doi: 10.1093/genetics/166.4.1857
70
Roden S. E. Morin P. A. Frey A. Balazs G. H. Zarate P. Cheng I. J. et al . (2013). Green turtle population structure in the Pacific: new insights from SNPs and microsatellites. Endanger. Species Res.22, 227–234. doi: 10.3354/esr00500
71
Schofield G. Hobson V. J. Fossette S. Lilley M. K. S. Katselidis K. A. Hays G. C. (2010). Fidelity to foraging sites, consistency of migration routes and habitat modulation of home range by sea turtles. Diversity Distrib.16, 840–853. doi: 10.1111/j.1472-4642.2010.00694.x
72
Shamblin B. M. Bjorndal K. A. Bolten A. B. Hillis-Starr Z. M. Lundgren I. Naro-Maciel E. et al . (2012). Mitogenomic sequences better resolve stock structure of southern Greater Caribbean green turtle rookeries. Mol. Ecol.21, 2330–2340. doi: 10.1111/j.1365-294X.2012.05530.x
73
Shamblin B. M. Dutton P. H. Bjorndal K. A. Bolten A. B. Naro-Maciel E. Santos A. J. B. et al . (2015). Deeper mitochondrial sequencing reveals cryptic diversity and structure in Brazilian green turtle rookeries. Chelonian Conservation and Biology14, 167–172. doi: 10.2744/CCB-1152.1
74
Sober E. (2001). The principle of parsimony. Br. J. Philos. Sci.32, 145–156. doi: 10.1093/bjps/32.2.145
75
Troeng S. Chaloupka M. (2007). Variation in adult annual survival probability and remigration intervals of sea turtles. Mar. Biol.151, 1721–1730. doi: 10.1007/s00227-007-0611-6
76
Warnes G. R. Bolker B. Bonebakker L. Gentleman R. Liaw W. H. A. Lumley T. et al . (2016). gplots: Various R programming tools for plotting data. R package version 3.0.1.
77
Webster M. S. Marra P. P. (2005). “ The importance of understanding migratory connectivity and seasonal interactions,” in Birds of Two Worlds: The Ecology and Evolution of Migration. Eds. GreenbergR.MarraP. P. ( Johns Hopkins University Press, Baltimore, MD), 199–209.
78
Webster M. S. Marra P. P. Haig S. M. Bensch S. Holmes R. T. (2002). Links between worlds: unraveling migratory connectivity. Trends Ecol. Evol.17, 76–83. doi: 10.1016/S0169-5347(01)02380-1
79
Weir B. S. Cockerham C. C. (1984). Estimating F-statistics for the analysis of population structure. Evolution.38, 1358–1370. doi: 10.2307/2408641
80
Wright L. I. Stokes K. L. Fuller W. J. Godley B. J. McGowan A. Snape R. et al . (2012). Turtle mating patterns buffer against disruptive effects of climate change. Proc. R. Soc B.279, 2122–2127. doi: 10.1098/rspb.2011.2285
Summary
Keywords
conservation genetics, genetic connectivity, green turtle (Chelonia mydas), male sea turtles, natal homing
Citation
Garcia-Cruz MA, Rodriguez-Clark KM, Bjorndal KA, Bolten AB, Naro-Maciel E, Bellini C, Shamblin B and Carreras C (2026) Natal homing in male green turtles (Chelonia mydas) from two neotropical islands. Front. Mar. Sci. 12:1700885. doi: 10.3389/fmars.2025.1700885
Received
07 September 2025
Revised
02 December 2025
Accepted
30 December 2025
Published
13 February 2026
Volume
12 - 2025
Edited by
Guillermo Luna-Jorquera, Universidad Católica del Norte, Chile
Reviewed by
Tomoko Hamabata, Tohoku University, Japan
Cibele Monteiro, Federal University of Ceara, Brazil
Updates
Copyright
© 2026 Garcia-Cruz, Rodriguez-Clark, Bjorndal, Bolten, Naro-Maciel, Bellini, Shamblin and Carreras.
This is an open-access article distributed under the terms of the Creative Commons Attribution License (CC BY). The use, distribution or reproduction in other forums is permitted, provided the original author(s) and the copyright owner(s) are credited and that the original publication in this journal is cited, in accordance with accepted academic practice. No use, distribution or reproduction is permitted which does not comply with these terms.
*Correspondence: Marco A. Garcia-Cruz, marcogarcia@ufl.edu; Carlos Carreras, carreras@ub.edu
Deceased
Disclaimer
All claims expressed in this article are solely those of the authors and do not necessarily represent those of their affiliated organizations, or those of the publisher, the editors and the reviewers. Any product that may be evaluated in this article or claim that may be made by its manufacturer is not guaranteed or endorsed by the publisher.