Abstract
Ocean color remote sensing is vital for monitoring marine ecosystems, but accurate retrieval of ocean color parameters remains challenging in regions affected by strongly absorbing aerosols such as dust, biomass burning, and industrial pollution. To address this issue, we leveraged the Ocean Color–XGBoost with Radiative Transfer simulation (OC-XGBRT) atmospheric correction (AC) algorithm to improve the accuracy of remote sensing reflectance ((λ)) in blue bands (412, 443, and 488 nm) from the Moderate Resolution Imaging Spectroradiometer (MODIS) sensor under the absorbing aerosol conditions. We integrated the OC-XGBRT AC algorithm with traditional bio-optical retrieval models (Ocean Color Index (OCI), KD2M, and Quasi-Analytical Algorithm (QAA)) to estimate chlorophyll-a concentration (CHL), diffuse attenuation coefficient for downwelling irradiance at 490 nm (), and absorption coefficient of detritus and gelbstoff at 443 nm (), and further compared the retrieval results with those derived from three widely used AC algorithms (NASA NIR, OC-SMART, and POLYMER). Results of validation against in situ measurements from the SeaWiFS Bio-optical Archive and Storage (SeaBASS), Aerosol Robotic Network-Ocean Color (AERONET-OC), and GLObal Reflectance community dataset for Imaging and optical sensing of Aquatic environments (GLORIA) demonstrated that the OC-XGBRT outperformed three comparative AC algorithms (NASA NIR, OC-SMART, and POLYMER) under the absorbing aerosol conditions. Specifically, the proposed algorithm achieved markedly higher coefficient of determination (R2) values (0.57 for CHL and 0.45 for ) and lower Mean Absolute Percentage Deviation (MAPD) values (58.4% for CHL and 63.7% for ), representing a clear improvement over other algorithms under absorbing aerosol conditions. Applications in five typical oceanic regions frequently influenced by absorbing aerosols, including the west coast of North Africa, the Persian Gulf, the west coast of North America, the Black Sea, and the Chinese Bohai-Yellow Sea, showed that the proposed approach substantially improved the spatial coverage and temporal continuity of ocean color products, especially for , which is most sensitive to the interference of absorbing aerosol. Overall, OC-XGBRT algorithm provides an effective solution for improving ocean color products in complex atmospheric conditions and supports more reliable monitoring of coastal ecosystems.
1 Introduction
Over the past four decades, a succession of satellite ocean color sensors has built an extensive global database of ocean optical and biogeochemical properties, greatly advancing our understanding of global ocean ecosystems (McClain, 2009). Early satellite missions like the Coastal Zone Color Scanner (CZCS, 1978–1986) and Ocean Color and Temperature Scanner (OCTS, 1996–1997) laid foundational groundwork (Mitchell, 1994; Shimada et al., 2002), while subsequent sensors expanded coverage and precision, including the Sea-viewing Wide Field-of-view Sensor (SeaWiFS, 1997–2010) (McClain et al., 2004), the Moderate Resolution Imaging Spectroradiometer (MODIS) onboard the Terra and Aqua satellites (MODIS-Terra, 1999–present; MODIS-Aqua, 2002–present) (Salomonson et al., 1989), the Medium-Resolution Imaging Spectrometer (MERIS, 2002–2012) (Rast et al., 1999), the Visible Infrared Imaging Radiometer Suite (VIIRS) onboard the Suomi National Polar-orbiting Partnership satellite (VIIRS-SNPP, 2011–present) (Wang et al., 2013), and the recent Ocean Color Instrument onboard the Plankton, Aerosol, Cloud, ocean Ecosystem satellite (PACE-OCI, 2024–present) (McClain et al., 2022), generating key ocean color products through atmospheric correction (AC) and bio-optical models.
Ocean color remote sensing has become an indispensable technology for monitoring marine ecosystems at global and regional scales, as it enables the estimation of key bio-optical properties (e.g., chlorophyll-a concentration (CHL) and absorption and backscattering coefficients of phytoplankton, gelbstoff, and non-algal particles) with high spatiotemporal coverage that is unattainable through conventional in situ measurements (McClain, 2009). The reliability of these ocean color retrievals hinges on the accurate AC of satellite-observed upwelling spectral radiation, a critical process that subtracts atmospheric path radiance (includes Rayleigh scattering and aerosol scattering) and sea surface reflected radiance from the satellite measured radiance at the top-of-atmosphere (TOA) (Gordon and Wang, 1994; Gordon, 1997; Pahlevan et al., 2021; Lathif and Alshehhi, 2024). While traditional AC algorithms perform well under the atmospheric conditions dominated by non or weak-absorbing aerosols (e.g., maritime aerosol model, primarily composed of sea salt), they face significant challenges in the oceanic regions affected by strongly absorbing aerosols, such as desert dust, black carbon from biomass burning, and organic carbon aerosols from industrial emissions (Gordon et al., 1997; Duforêt et al., 2007; Wang and Jiang, 2018). These aerosols exhibit strong absorption (single scattering albedo is below 0.8) at the short blue bands (400–450 nm) (Dubovik et al., 2006), and thereby leading to the overestimation of aerosol scattering contributions and subsequent underestimation of water-leaving radiance at blue wavelengths, ultimately introducing substantial uncertainties into the retrieval of ocean color parameters (Wang, 2010).
Absorbing aerosols occur widely and frequently in ecologically and climatologically important marine regions, such as the West coast of North Africa, the Black Sea, the Bohai-Yellow Sea, and the western coast of North America (Song et al., 2020; Song et al., 2022), where the large deviations of ocean color products pose a major barrier to the accurate long-term monitoring of marine ecosystems, carbon cycling, and coastal environmental changes. Therefore, improving the accuracy of ocean color products is critical for monitoring oceanic ecosystems in these regions. As traditional AC algorithms (e.g., NASA NIR) ignored strong absorbing aerosols, inadequate separation of atmospheric path radiance and water-leaving radiance leads to a severe underestimation or even negative values of remote sensing reflectance (Rrs(λ)) in blue bands (Duforêt et al., 2007; Song et al., 2022). To address the AC deviations induced by absorbing aerosols, we combined coupled atmosphere-ocean radiative transfer simulations with large-scale machine learning training and developed an AC algorithm specifically for the oceanic regions in the presence of strong absorbing aerosols, named OC-XGBRT (Song et al., 2023). Different from traditional AC algorithms, OC-XGBRT considered the vertical distribution of absorbing aerosols and outperformed most of current AC algorithms [e.g., NASA NIR, Ocean Color-Simultaneous Marine and Aerosol Retrieval Tool (OC-SMART), and POLYnomial-based approach established for the atmospheric correction of MERIS data (POLYMER)] under the conditions of absorbing aerosols (Song et al., 2023). OC-XGBRT basically resolved the issues of underestimated and negative Rrs(λ), and when verified against the in situ measurements, it showed significant improvement in short wavelength bands of visible light (Song et al., 2023). Given these advantages, applying the Rrs(λ) corrected by the OC-XGBRT to retrieve ocean color parameters (e.g., CHL, absorption coefficient of detritus and gelbstoff at 443 nm (), and diffuse attenuation coefficient for downwelling irradiance at 490 nm ()) is necessary to mitigate the residual deviations from the traditional AC algorithms, thereby ensuring more reliable and consistent results for monitoring marine ecosystems in regions affected by absorbing aerosols.
With an attempt to improve the ocean color products under complex atmospheric conditions containing absorbing aerosols, this study aims to: 1) combine the OC-XGBRT with traditional ocean color retrieval algorithms to derive ocean color parameters, and 2) evaluate the retrieval accuracy of the CHL, , and in the complex waters with absorbing aerosols, and compare them with other AC algorithms. The structure of the contents is as follows. Section 2 introduces the data collection, OC-XGBRT algorithm and ocean color parameter retrieval algorithms, and evaluation metrics. Section 3 provides the results, including the validations by in situ data, and applications in West coast of North Africa, Persian Gulf, West coast of North America, Black Sea, and Chinese Bohai and Yellow Seas. Finally, the comparisons, applicability, and limitations are discussed in Section 4.
2 Data and methods
2.1 Data acquisition, matchups, and study areas
We obtained the Level-1B MODIS-Aqua satellite remote sensing data at 1 km spatial resolution from NASA Level-1 and Atmosphere Archive and Distribution System (LAADS) Distributed Active Archive Center (DAAC). The MODIS-Aqua comprises 36 medium-resolution spectral bands that span the visible light, near infrared and shortwave infrared wavelengths (Salomonson et al., 1989), enhancing the detection of absorbing aerosols and turbid waters in coastal oceans.
In situ Rrs(λ) data were retrieved from the normalized water-leaving radiance (Lwn) using Equation 1 for both the SeaBASS and AERONET-OC measurements (Werdell and Bailey, 2005; Zibordi et al., 2009), the in situ Rrs(λ) data were further converted to the ocean color parameters (e.g., CHL, , and ) based on established retrieval algorithms (see Section 2.2 for detail). Figure 1F illustrates the geographical position of the selected SeaBASS and AERONET-OC stations, along with the average CHL derived from the in situ(λ).
Figure 1
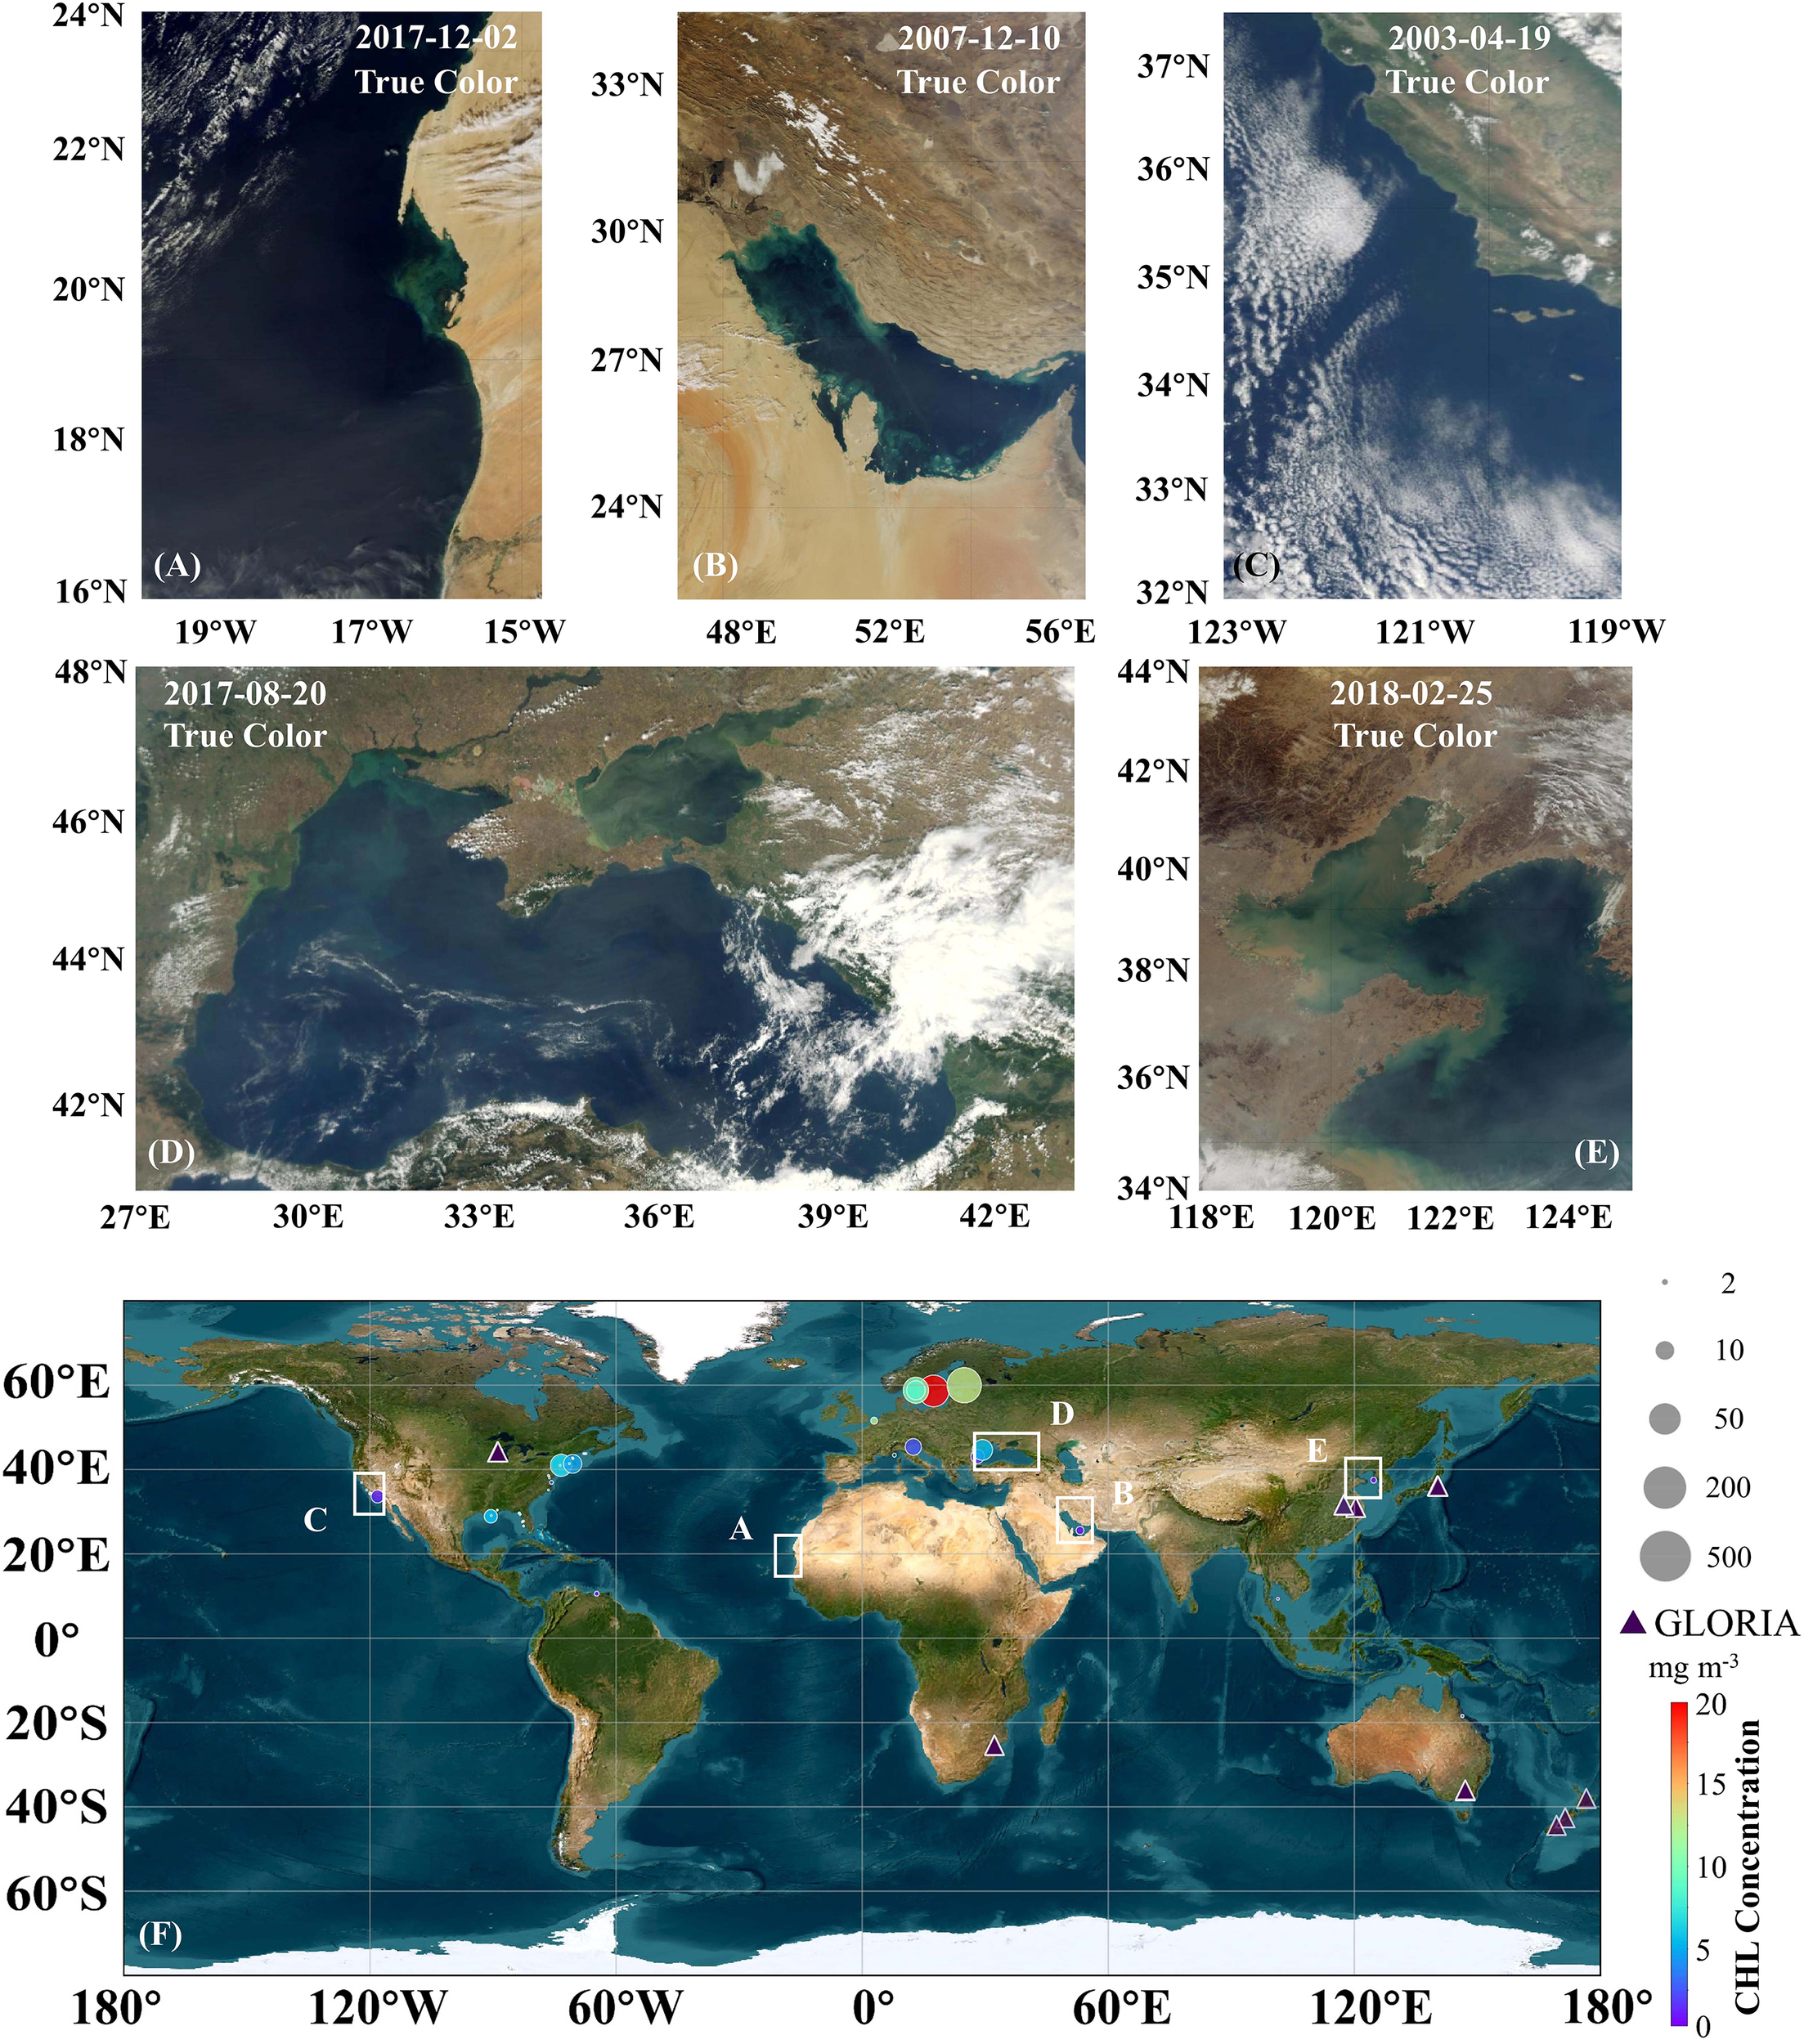
(A-E) MODIS satellite images of the study regions, including (A) West coast of North Africa, (B) Persian Gulf, (C) West coast of North America, (D) Black Sea, and (E) Chinese Bohai and Yellow Seas. (F) Spatial distributions of the CHL calculated from the in situ measured (λ) of the SeaBASS and AERONET-OC (mark with circles), and the location of the GLORIA measurements (mark with triangles). Circle size represents the quantity of matchup data. White squares indicate the five regions (A-E).
where is the mean extraterrestrial solar irradiance.
To further improve the validation effectiveness of model-retrieved CHL and , we additionally collected and matched up a small portion of in situ CHL and from the GLObal Reflectance community dataset for Imaging and optical sensing of Aquatic environments (GLORIA) dataset (Lehmann et al., 2023) (available at https://doi.pangaea.de/10.1594/PANGAEA.948492), whose locations are marked with triangles in Figure 1F. The GLORIA dataset complemented the SeaBASS and AERONET-OC. The CHL was measured spectrophotometrically or fluorometrically following solvent-based extraction (e.g., 90% acetone), aided by mechanical grinding (Lehmann et al., 2023). was determined using the method of Mitchell et al. (2003) (Mitchell et al., 2003). The GLORIA dataset was used to evaluate the retrieval performance under the complex atmospheric conditions containing absorbing aerosols.
To ensure reliable matchups, in situ and satellite observations were matched within ±2 h, with a pixel coefficient of variation below 0.15. Clear-sky conditions were ensured by requiring at least 50% valid satellite pixels and a modeled–measured irradiance difference under 20%. The thresholds for viewing and solar zenith angles and wind speed were 60°, 75°, and 35 m/s, respectively (Moore et al., 2015; Song et al., 2023). Table 1 summarized the number of valid matching samples for the ocean color products. Figure 2 presents the spectral distributions of the in situ(λ) and the sample number distributions of each ocean color parameters matchup. The number of valid match-up samples for each major oceanic region is presented in Supplementary Table S1.
Table 1
| Ocean color products | Dataset | Number |
|---|---|---|
| CHL | SeaBASS & AERONET-OC | 1566 |
| GLORIA | 53 | |
| SeaBASS & AERONET-OC | 1566 | |
| SeaBASS & AERONET-OC | 1483 | |
| GLORIA | 53 |
Number of valid matching samples for the ocean color products.
Figure 2
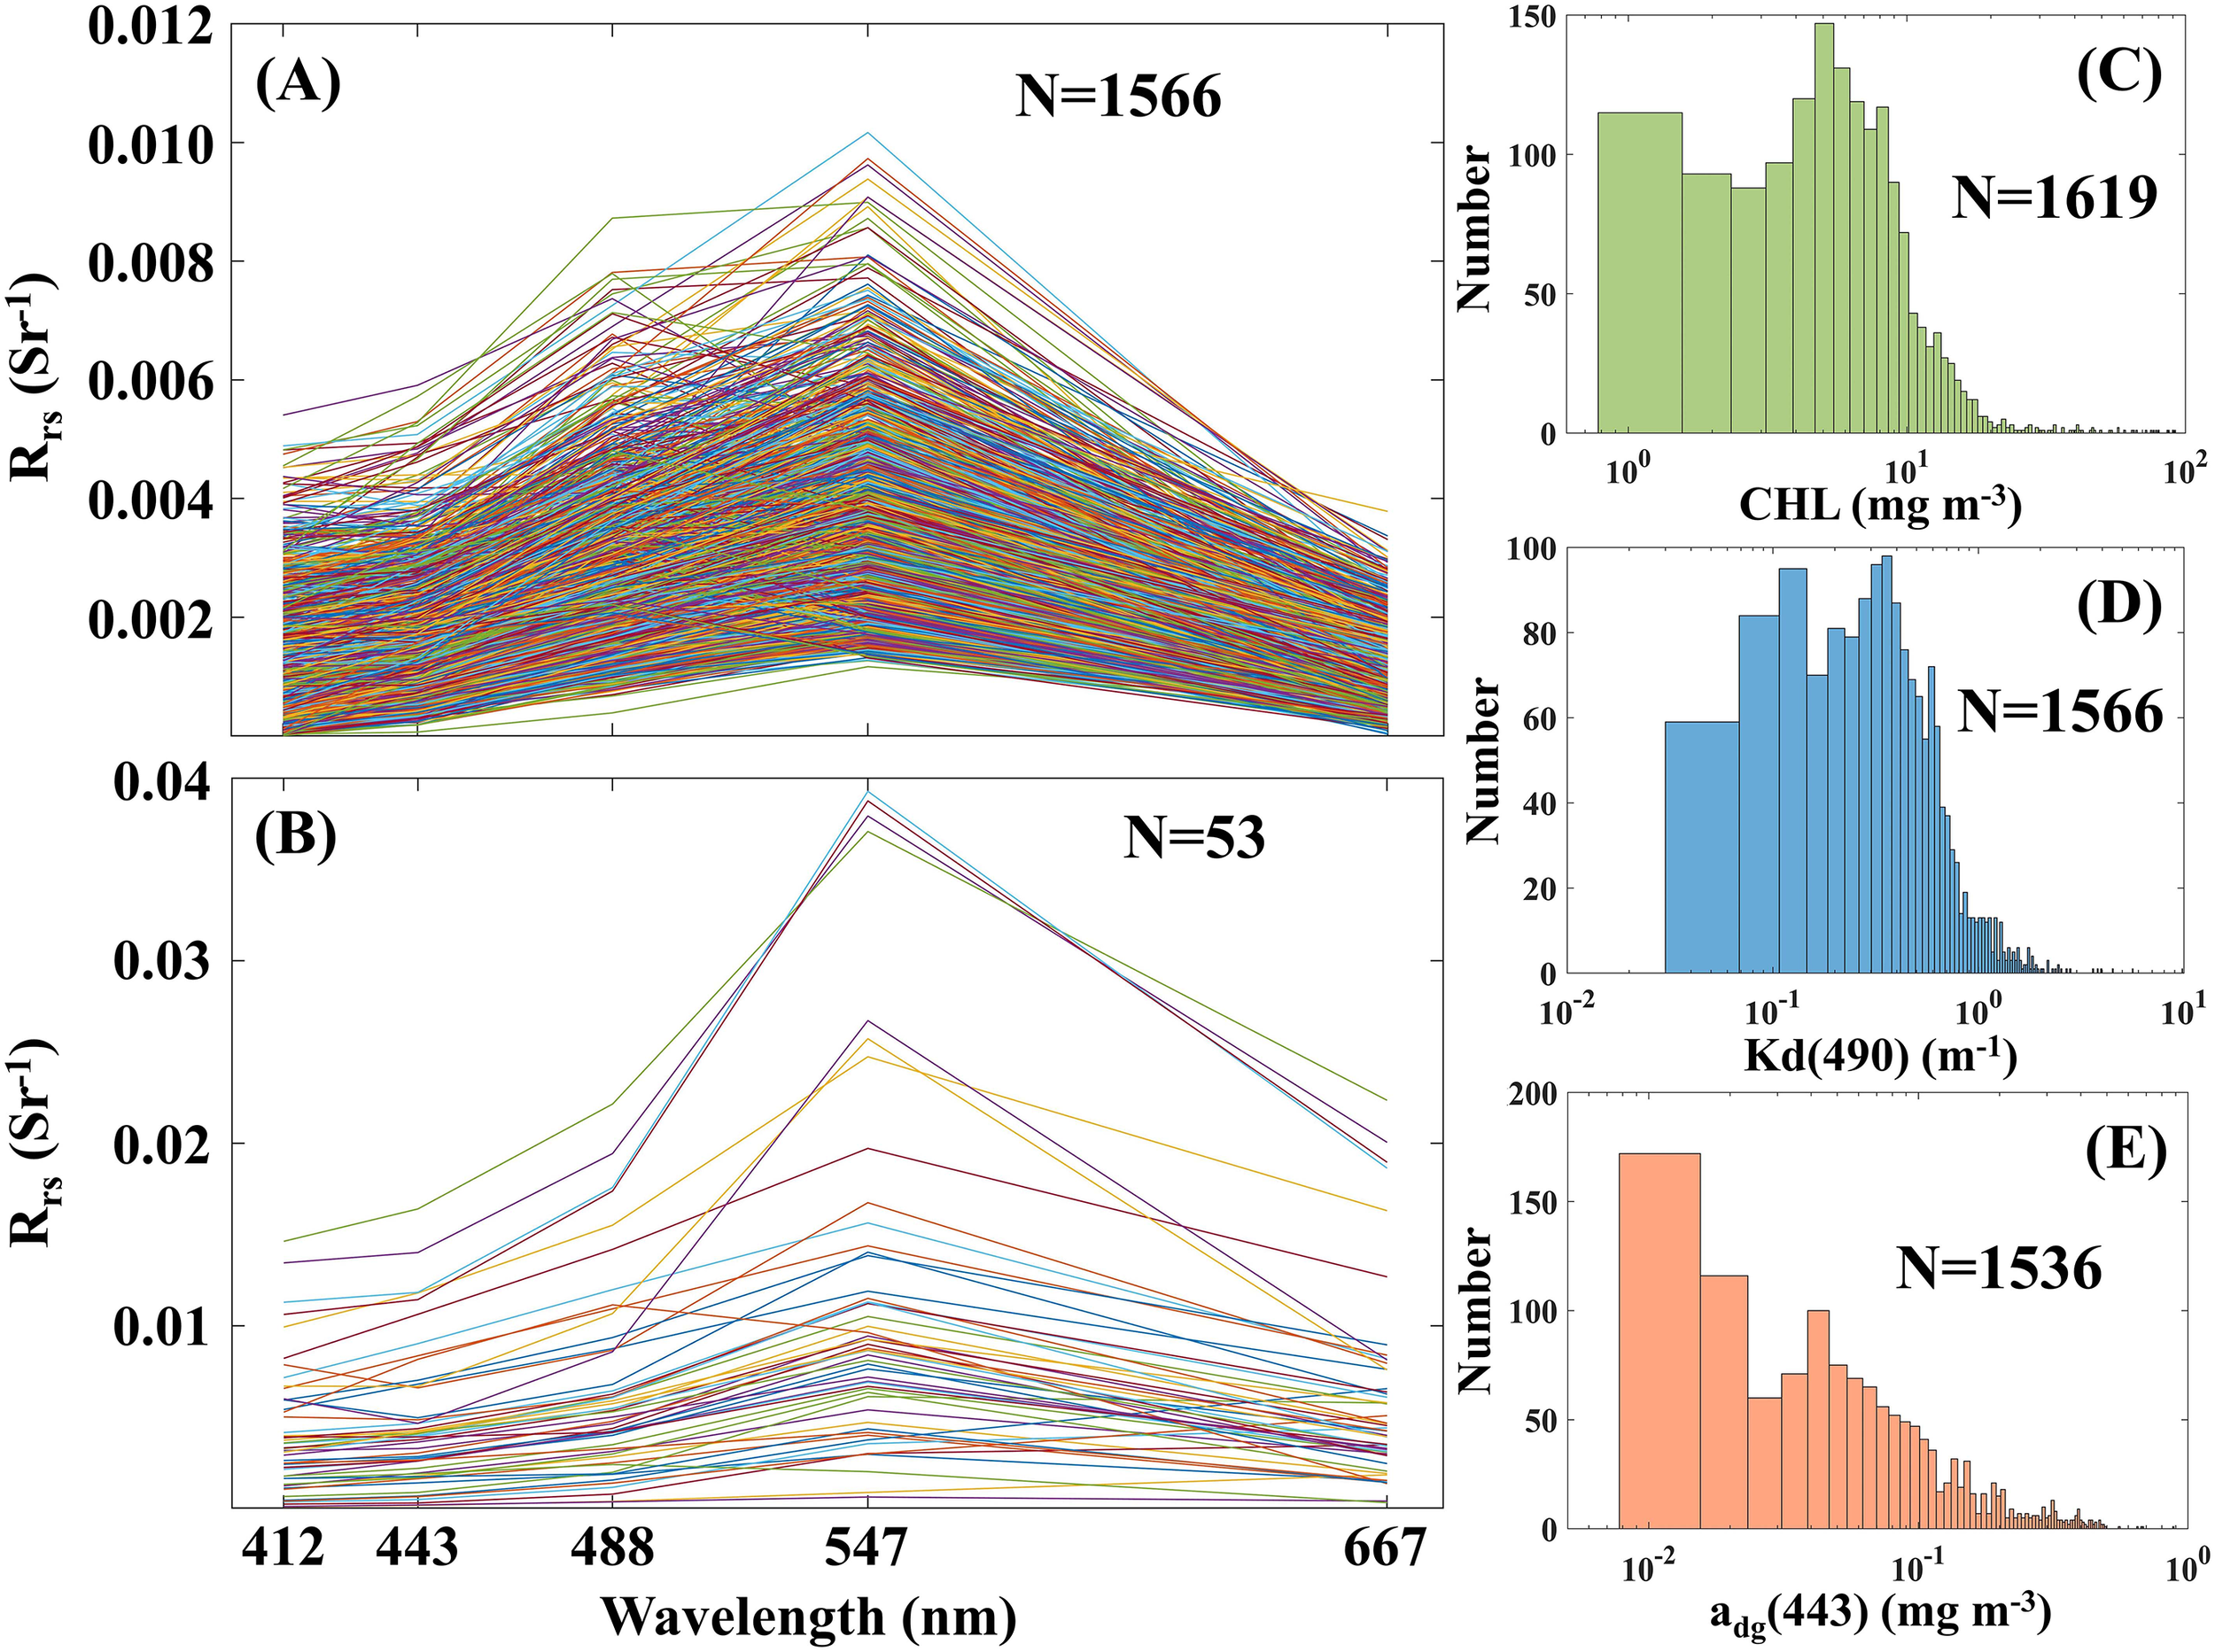
Spectra of in the matchups for (A) SeaBASS and AERONET-OC and (B) GLORIA; Histograms of (C) CHL, (D), and (E) in the matchups for the three datasets.
As illustrated in Supplementary Figure S1, the annual occurrence frequencies of absorbing aerosols are basically more than ~ 20% over the West coast of North Africa, Persian Gulf, West coast of North America, Black Sea, and Chinese Bohai-Yellow Seas. Recent studies also selected these waters to investigate the AC of absorbing aerosols (Zhao et al., 2023; Lv et al., 2024; Li et al., 2025). Thus, we selected them as typical study areas affected by absorbing aerosols, whose true color images acquired by MODIS-Aqua were presented in Figures 1A–E.
2.2 OC-XGBRT atmospheric correction algorithm
Recently, we developed a new AC algorithm, named OC-XGBRT, specifically designed for the complex atmospheric environment containing absorbing aerosols (Song et al., 2023). This AC algorithm integrated coupled atmosphere-ocean radiative transfer simulations (OSOAA model) with large-scale machine learning training to retrieve Rrs(λ) in short wavelength bands of visible light, explicitly considering the vertical distributions and types of absorbing aerosols (dust, smoke, and urban aerosols) (Song et al., 2023). The retrieval model of Rrs(λ) in OC-XGBRT were trained on millions of radiative transfer simulation data covering various atmospheric and ocean conditions, thus possessing strong applicability and robustness. OC-XGBRT AC algorithm detects the absorbing aerosols by Shi and Wang (2007) method (Shi and Wang, 2007), and then identifies the dust, smoke, and urban aerosols based on XGBoost classification model trained using large-scale radiative transfer simulations, and further performs corresponding corrections for different types of absorbing aerosols using XGBoost regression model.
In this study, NASA NIR (SeaDAS v7.5) (Gordon and Wang, 1994; Gordon, 1997), and POLYMER (v4.13) (Steinmetz et al., 2011) AC algorithms were applied based on their standard parameter settings, including default aerosol-correction options, iteration controls, and adjacency or sky-reflectance treatments, without manual adjustments. NASA NIR and POLYMER relied on standard aerosol models representing mostly non-absorbing or weakly absorbing aerosols (Shettle and Fenn, 1979; Ahmad et al., 2010). OC-SMART, a neural network–based AC algorithm (Fan et al., 2021), applied upper limits on solar and viewing zenith angles (70°) to exclude extreme angular conditions and incorporated additional polluted and desert aerosol types, but did not consider the vertical distribution of absorbing aerosols. In contrast, OC-XGBRT explicitly accounts for absorbing aerosols and their vertical distribution, improving retrieval accuracy in coastal and nearshore regions affected by absorbing aerosols. As shown in Supplementary Table S2 and Supplementary Figure S2, OC-XGBRT AC algorithm outperforms the NASA NIR (Gordon and Wang, 1994; Gordon, 1997), OC-SMART (Fan et al., 2021), and POLYMER (Steinmetz et al., 2011) AC algorithms in the presence of absorbing aerosols, with MAPD and Root Mean Square Error (RMSE) values below 36.9% and 5.5 × 10⁻⁴ sr-1, respectively (Song et al., 2023). Validation against in situ Rrs(λ) confirmed substantial enhancement in accuracy and spatial coverage, indicating its robustness for challenging complex atmospheric conditions.
2.3 Ocean color parameter retrieval algorithms
In this study, CHL, , and were selected as evaluation parameters to analyze the impact of absorbing aerosols on the ocean color retrieval. These three parameters characterize the key bio-optical properties of optically complex waters, corresponding to phytoplankton biomass, colored dissolved organic matter (CDOM) and detritus absorption, and water-column light attenuation, respectively. Their distinct spectral sensitivities facilitate our systematic evaluation of how absorbing aerosols propagate from the (λ) deviations into ocean color products. Their widespread application in atmospheric correction performance evaluations of ocean color remote sensing further ensured the comparability of our results with previous studies (Wang and Jiang, 2018) (Zhang et al., 2019; Joshi and D’Sa, 2020; Yao et al., 2025).
Tables 2 , 3 detail the ocean color parameter retrieval algorithms and their symbols definitions utilized in this study. Gordon et al. (1980) initially proposed a CHL retrieval algorithm using the ratio of blue-to-green band remote sensing reflectance (Gordon et al., 1980), and then O’Reilly et al. (1998) improved it by employing the maximum blue band reflectance to create the OCx (x is the number of bands in model) algorithm (O’Reilly et al., 1998), while Hu et al. (2012) introduced the Color Index (CI) algorithm to enhance accuracy at low CHL concentrations (Hu et al., 2012). O’Reilly and Werdell (2019) updated the OCx algorithm with sensor-specific empirical models (O’Reilly and Werdell, 2019). Hu et al. (2019) combined the advantages of the OC4 and CI algorithms to build the Ocean Color Index (OCI) CHL retrieval algorithm effectively, which retains high-concentration CHL estimations from the blue-green ratios while improving the accuracy at low concentrations (Hu et al., 2019). As for MODIS-Aqua, the OCI algorithm uses the (λ) at the 443, 488, 547, and 667 nm bands as inputs. In a similar approach to the OCx CHL retrieval algorithm, was calculated using a quadratic polynomial fit between the blue-green (λ) ratio and in situ (Morel et al., 2007). Differently, for the input of the retrieval algorithm, the maximum value of (443) and (488) was replaced by (488). Quasi-Analytical Algorithm (QAA), developed by Lee et al. (2002, 2007), relied on the (λ) to retrieve the absorption and backscattering coefficients of the various components (Lee et al., 2002; Lee, 2006; Lee et al., 2007), providing robust performance in complex and highly variable waters. QAA firstly calculated the total absorption coefficient () at the reference wavelength (λ0) and then extrapolated it to shorter wavelengths, and then decomposed the total absorption into individual component contributions. This flexibility makes QAA suitable for diverse marine environments, especially in regions with complex water conditions.
Table 2
| Ocean color parameters | Retrieval algorithm |
|---|---|
| CHL |
|
The retrieval algorithms for ocean color parameters.
Table 3
| Symbol | Definition | Symbol | Definition |
|---|---|---|---|
| Absorption coefficient of the total | Absorption coefficient of gelbstoff and detritus | ||
| Absorption coefficient of pure seawater | Backscattering coefficient of the total | ||
| Backscattering coefficient of suspended particles | Backscattering coefficient of pure seawater | ||
| Color Index | Above-surface remote sensing reflectance | ||
| Below-surface remote sensing reflectance | Spectral slope for gelbstoff absorption coefficient | ||
| Ratio of backscattering coefficient to the sum of absorption and backscattering coefficients | Reference wavelength | ||
| Spectral power for particle backscattering coefficient | Ratio of the absorption coefficient of phytoplankton pigments at 410 nm to that at 440 nm | ||
| Ratio of to | Difference between and for pure seawater |
Definitions of symbols used in the retrieval algorithms for ocean color products.
2.4 Accuracy evaluation
The retrieval accuracy was evaluated using three statistical parameters, which are the R2, RMSE, and MAPD calculated from Equations 2–4:
where and are the retrieved values and in situ measured values, respectively. and are the standard deviations of and , respectively.
To evaluate the impact of absorbing aerosols on the ocean color parameter retrieval, we calculated the relative percentage deviation () in the retrievals of CHL, , and between the NASA NIR and OC-XGBRT algorithms. It can be calculated from Equation 5:
where and are the ocean color parameters retrieved by OC-XGBRT and NASA NIR algorithms, respectively.
3 Results
3.1 Validation of satellite-retrieved ocean color parameters with in situ data
All matchup samples (~1500) used for validation were identified to occur under absorbing aerosol conditions by the OC-XGBRT algorithm, which integrated satellite-derived aerosol optical properties and radiative transfer simulations to classify aerosol types. As illustrated in Supplementary Figure S3, the selected matchups covered diverse absorbing aerosol environments, including dust-, smoke-, and urban-dominated conditions. Figures 3A–F present a comprehensive comparison and validation of the ocean color parameters (CHL, and ) retrieved using the NASA NIR and OC-XGBRT algorithms against those calculated by in situ(λ) data in the presence of absorbing aerosols. The ocean color parameters retrieved by the OC-XGBRT AC algorithm exhibited significantly smaller deviations (the MAPDs of ocean color parameters are less than 63.7%), effectively improving the accuracy and increasing the amount of valid data. As for the CHL, the OC-XGBRT algorithm showed superior performance with an R2 value of 0.48, RMSE of 6.3 mg m-3, and MAPD of 58.4%, outperforming the NASA NIR algorithm, which had R2, RMSE, and MAPD values of 0.32, 9.2 mg m-3, and 75.3%, respectively. The discrepancies in statistical indicators for between the NASA NIR and OC-XGBRT algorithm are relatively small, as evidenced by RMSEs of 1.04 m-1 for NASA NIR and 0.82 m-1 for OC-XGBRT. As shown in Figures 3C, F, the OC-XGBRT algorithm provided a markedly better retrieval of , with R2, RMSE, and MAPD values of 0.45, 0.08 m-1, and 63.7%, compared to the NASA NIR algorithm, which yielded R2, RMSE, and MAPD values of 0.03, 0.19 m-1, and 207.8%, respectively. These results highlighted the improvement in retrieving ocean color parameters of the OC-XGBRT algorithm, particularly in its ability to effectively address the absorbing aerosol conditions in coastal waters, where traditional algorithms generally struggled to maintain consistent performance. The relatively lower accuracy resulted from negative (λ) being included in retrieval, and these physically meaningless (λ) values were retained only to compare and assess the performance of AC algorithms.
Figure 3
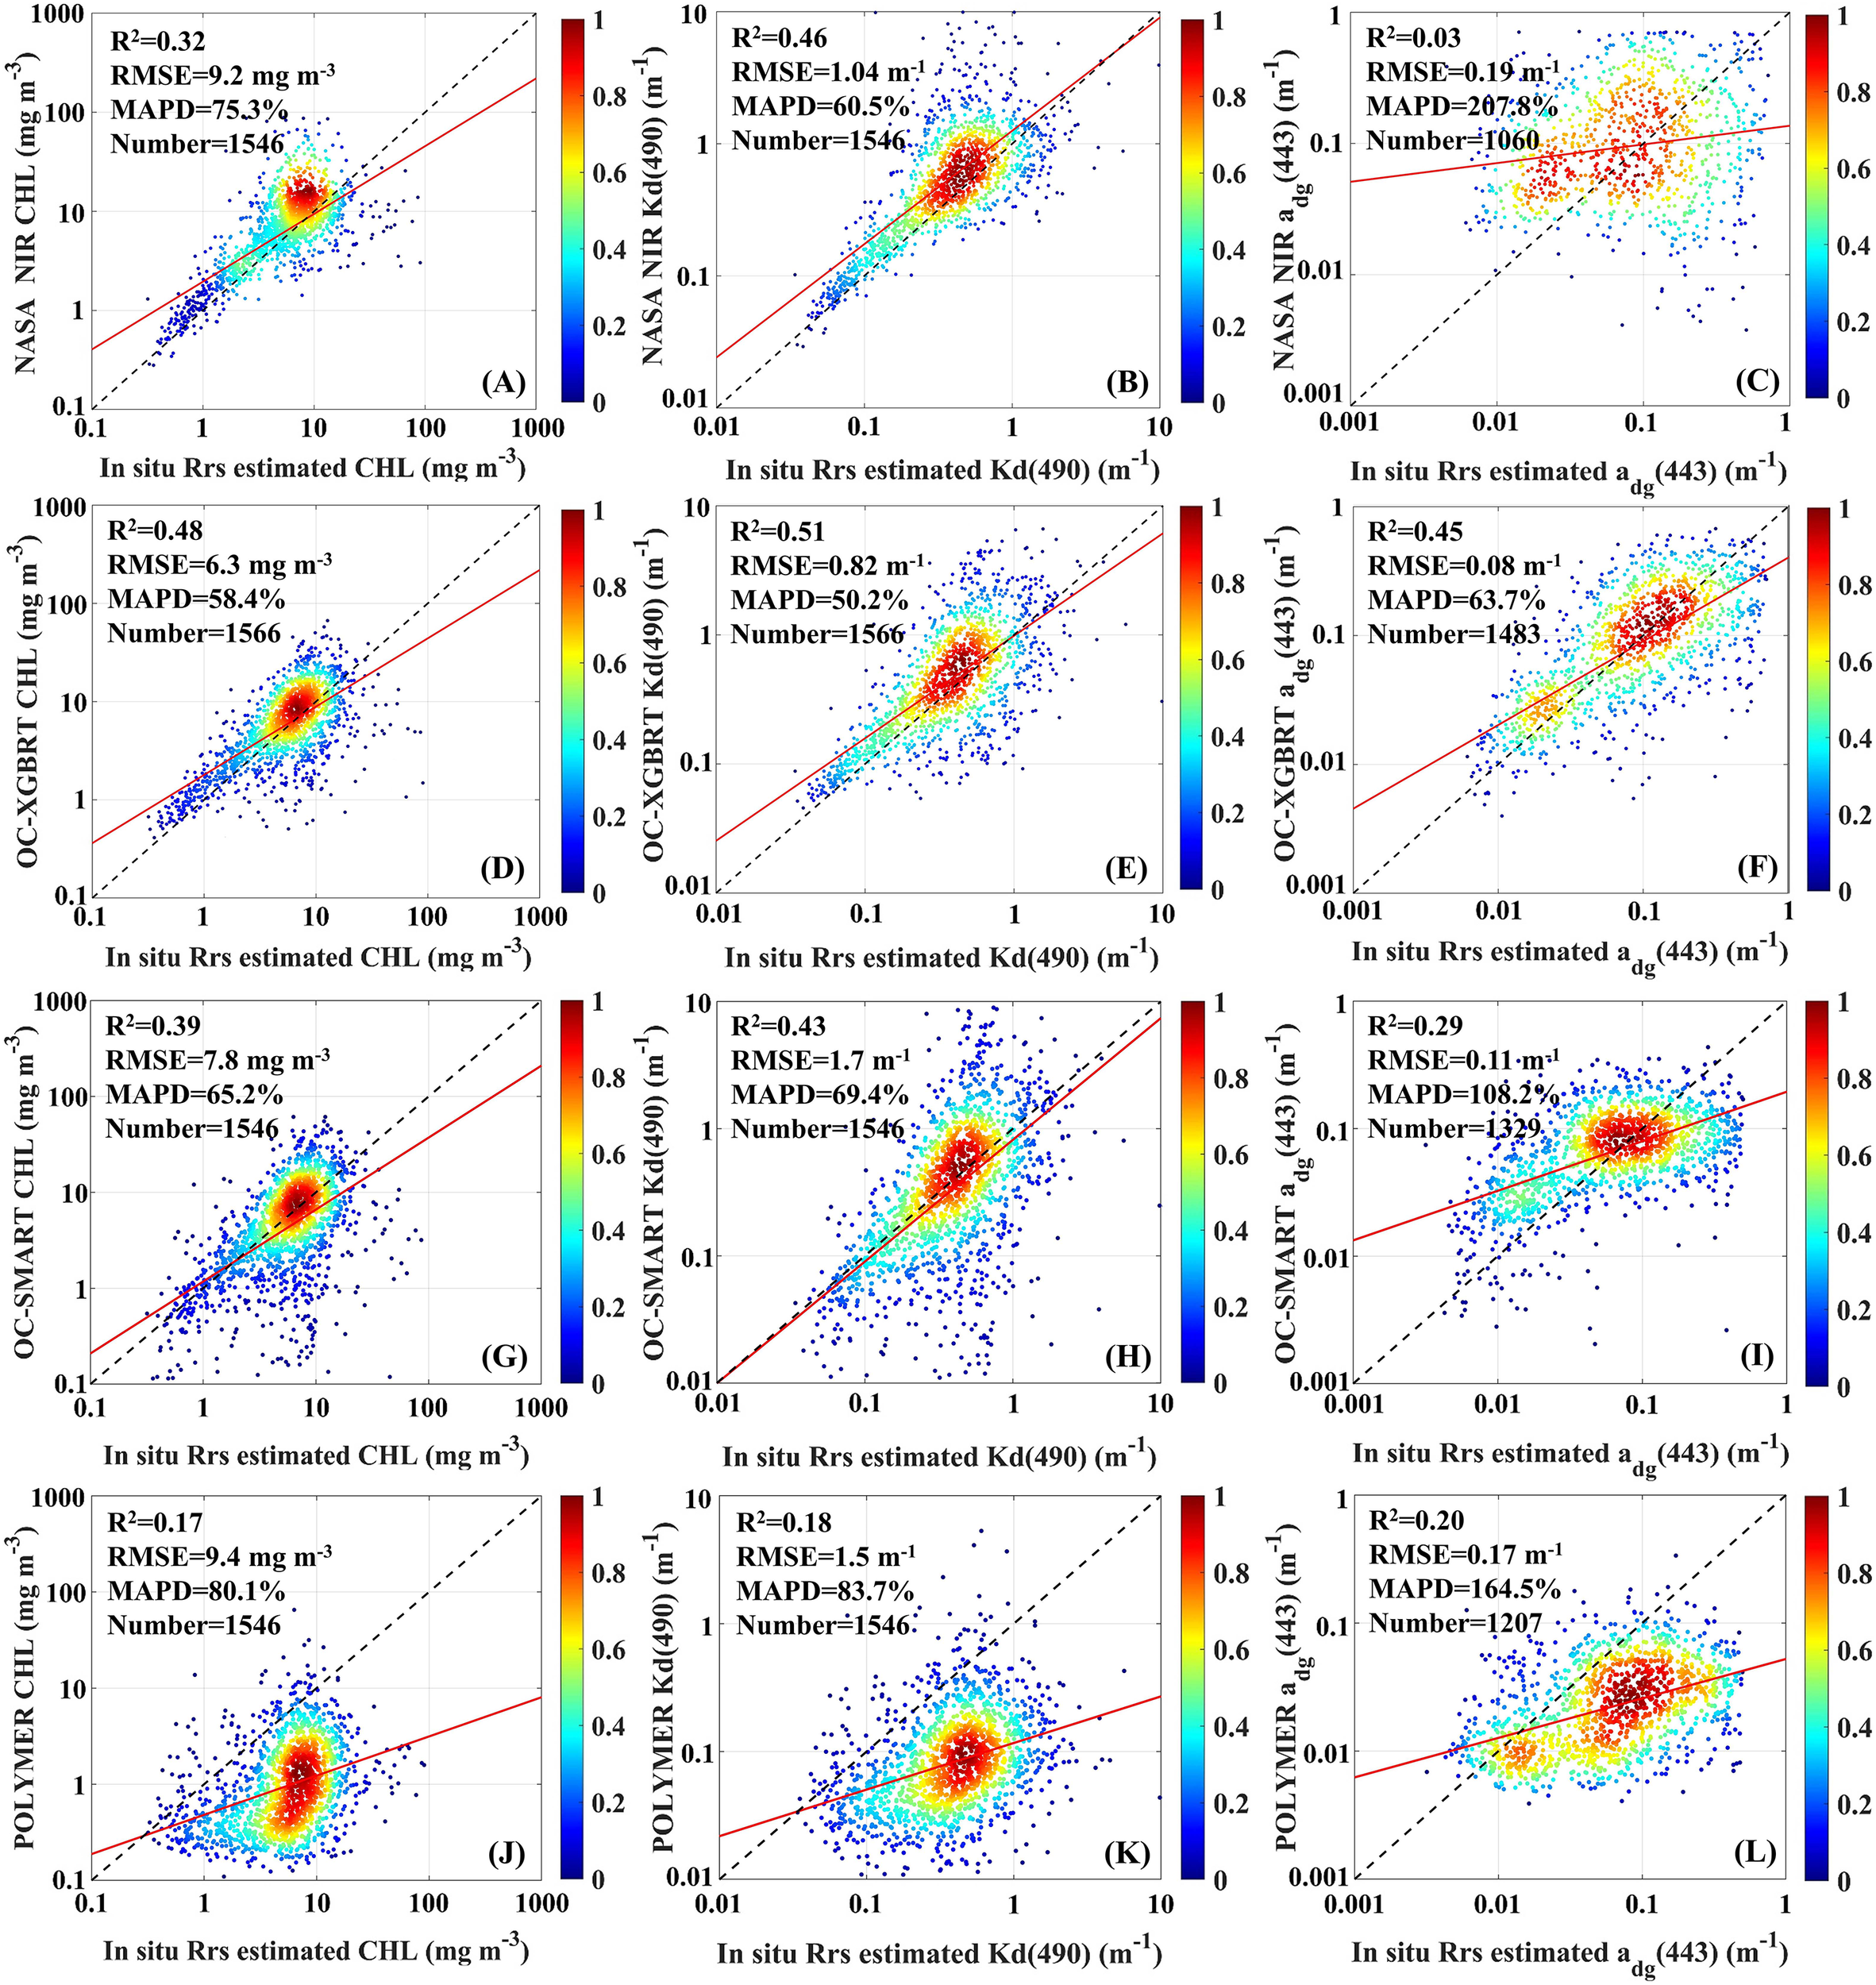
Validation of the ocean color parameters retrieved by (A–C) NASA NIR, (D–F) OC-XGBRT, (G–I) OC-SMART, and (J–L) POLYMER AC algorithms against those calculated from the in situ measured (λ) of SeaBASS and AERONET-OC. (A, D, G, J) CHL; (B, E, H, K); (C, F, I, L). The color bar beside each subplot indicates the data density.
A comparison between Figures 3A–F showed that the OC-XGBRT AC algorithm effectively reduced deviations in the retrievals of CHL, , and , with more substantial improvements in the data consistency and stability. Among the three ocean color parameters, the retrieval of was least affected by absorbing aerosols mainly due to the exclusion of the (λ) at short blue band in its retrieval algorithm (Morel et al., 2007), which reduced the interferences of absorbing aerosols. In contrast, was most sensitive to absorbing aerosols, as its algorithm involved both (λ) at 412 and 443 nm (Lee et al., 2002)- (Lee, 2006), while CHL retrievals were primarily influenced by (443), resulting in a more moderate sensitivity to absorbing aerosols. These variations in sensitivity are inherently linked to the different methodologies and spectral bands used in each retrieval algorithm. The OC-XGBRT AC algorithm demonstrated a clear advantage in improving the retrieval accuracy of ocean color parameters in coastal waters with absorbing aerosols.
We further compared the retrieval accuracies of the ocean color parameters using the (λ) derived from OC-SMART and POLYMER AC algorithms against those obtained from OC-XGBRT. As shown in Figures 3G–I, the OC-SMART AC algorithm improved the retrieval performance for CHL (R2 = 0.39, RMSE = 7.8 mg m-3, and MAPD = 65.2%) and (R2 = 0.29, RMSE = 0.11 m-1, and MAPD = 108.2%) compared with the NASA NIR AC algorithm, which might be attributed to the partial enhancement of negative (λ) values (Fan et al., 2021; Song et al., 2023). However, OC-XGBRT can further address the issue of underestimated or negative (λ) caused by the absorbing aerosols, thereby achieving higher accuracy than the OC-SMART AC algorithm. As shown in Figures 3J–L, the performance improvement of POLYMER is limited overall, with noticeable benefit only for compared to the NASA NIR AC algorithm (R2 = 0.20, RMSE = 0.17 m-1, and MAPD = 164.5%). Although the POLYMER and OC-SMART outperform NASA NIR in some ocean color parameter retrievals, they still exhibit a significant discrepancy compared to OC-XGBRT AC algorithm.
To further extend the validation of the CHL and retrieved by the OC-XGBRT AC algorithm, we compared them with the in situ values from the GLORIA under the complex atmospheric conditions with absorbing aerosols. As shown in Figures 4A, B, the statistical indicators of CHL retrieved by the OC-XGBRT (R2 = 0.57, RMSE = 10.3 mg m-3, and MAPD = 62.5%) were superior to those of the NASA NIR AC algorithm (R2 = 0.15, RMSE = 30.9 mg m-3, and MAPD = 182.9%). Within the same time range, the number of match-up samples for ocean color parameters derived by the OC-XGBRT (N = 53) is greater than that obtained through the NASA NIR (N = 6). For comparison, CHL products derived from OC-SMART and POLYMER were also evaluated against GLORIA observations (Figures 4D, F). Both algorithms exhibited lower performance than OC-XGBRT, with OC-SMART (R2 = 0.35, RMSE = 14.5 mg m-3, and MAPD = 90.8%) for and POLYMER (R2 = 0.34, RMSE = 13.1 mg m-3, and MAPD = 98.6%). As the derived from the NASA NIR and QAA algorithms failed to match the GLORIA data due to negative (412), their comparisons were not presented in the results. The retrieved by the OC-XGBRT AC algorithm exhibited relatively high accuracy with an R2 value of 0.46, RMSE of 0.31 m-1, and MAPD of 78.2% (Figure 4B). The retrieval results from OC-SMART (R2 = 0.14, RMSE = 0.37 m-1, and MAPD = 127.2%) and POLYMER (R2 = 0.12, RMSE = 0.29 m-1, and MAPD = 85.4%) showed weaker correlations and larger uncertainties (Figures 4E, G) than those of OC-XGBRT. Overall, the OC-XGBRT AC algorithm has ability to improve the data quality and valid data coverage of the ocean color parameters and reduce the deviations caused by absorbing aerosols.
Figure 4
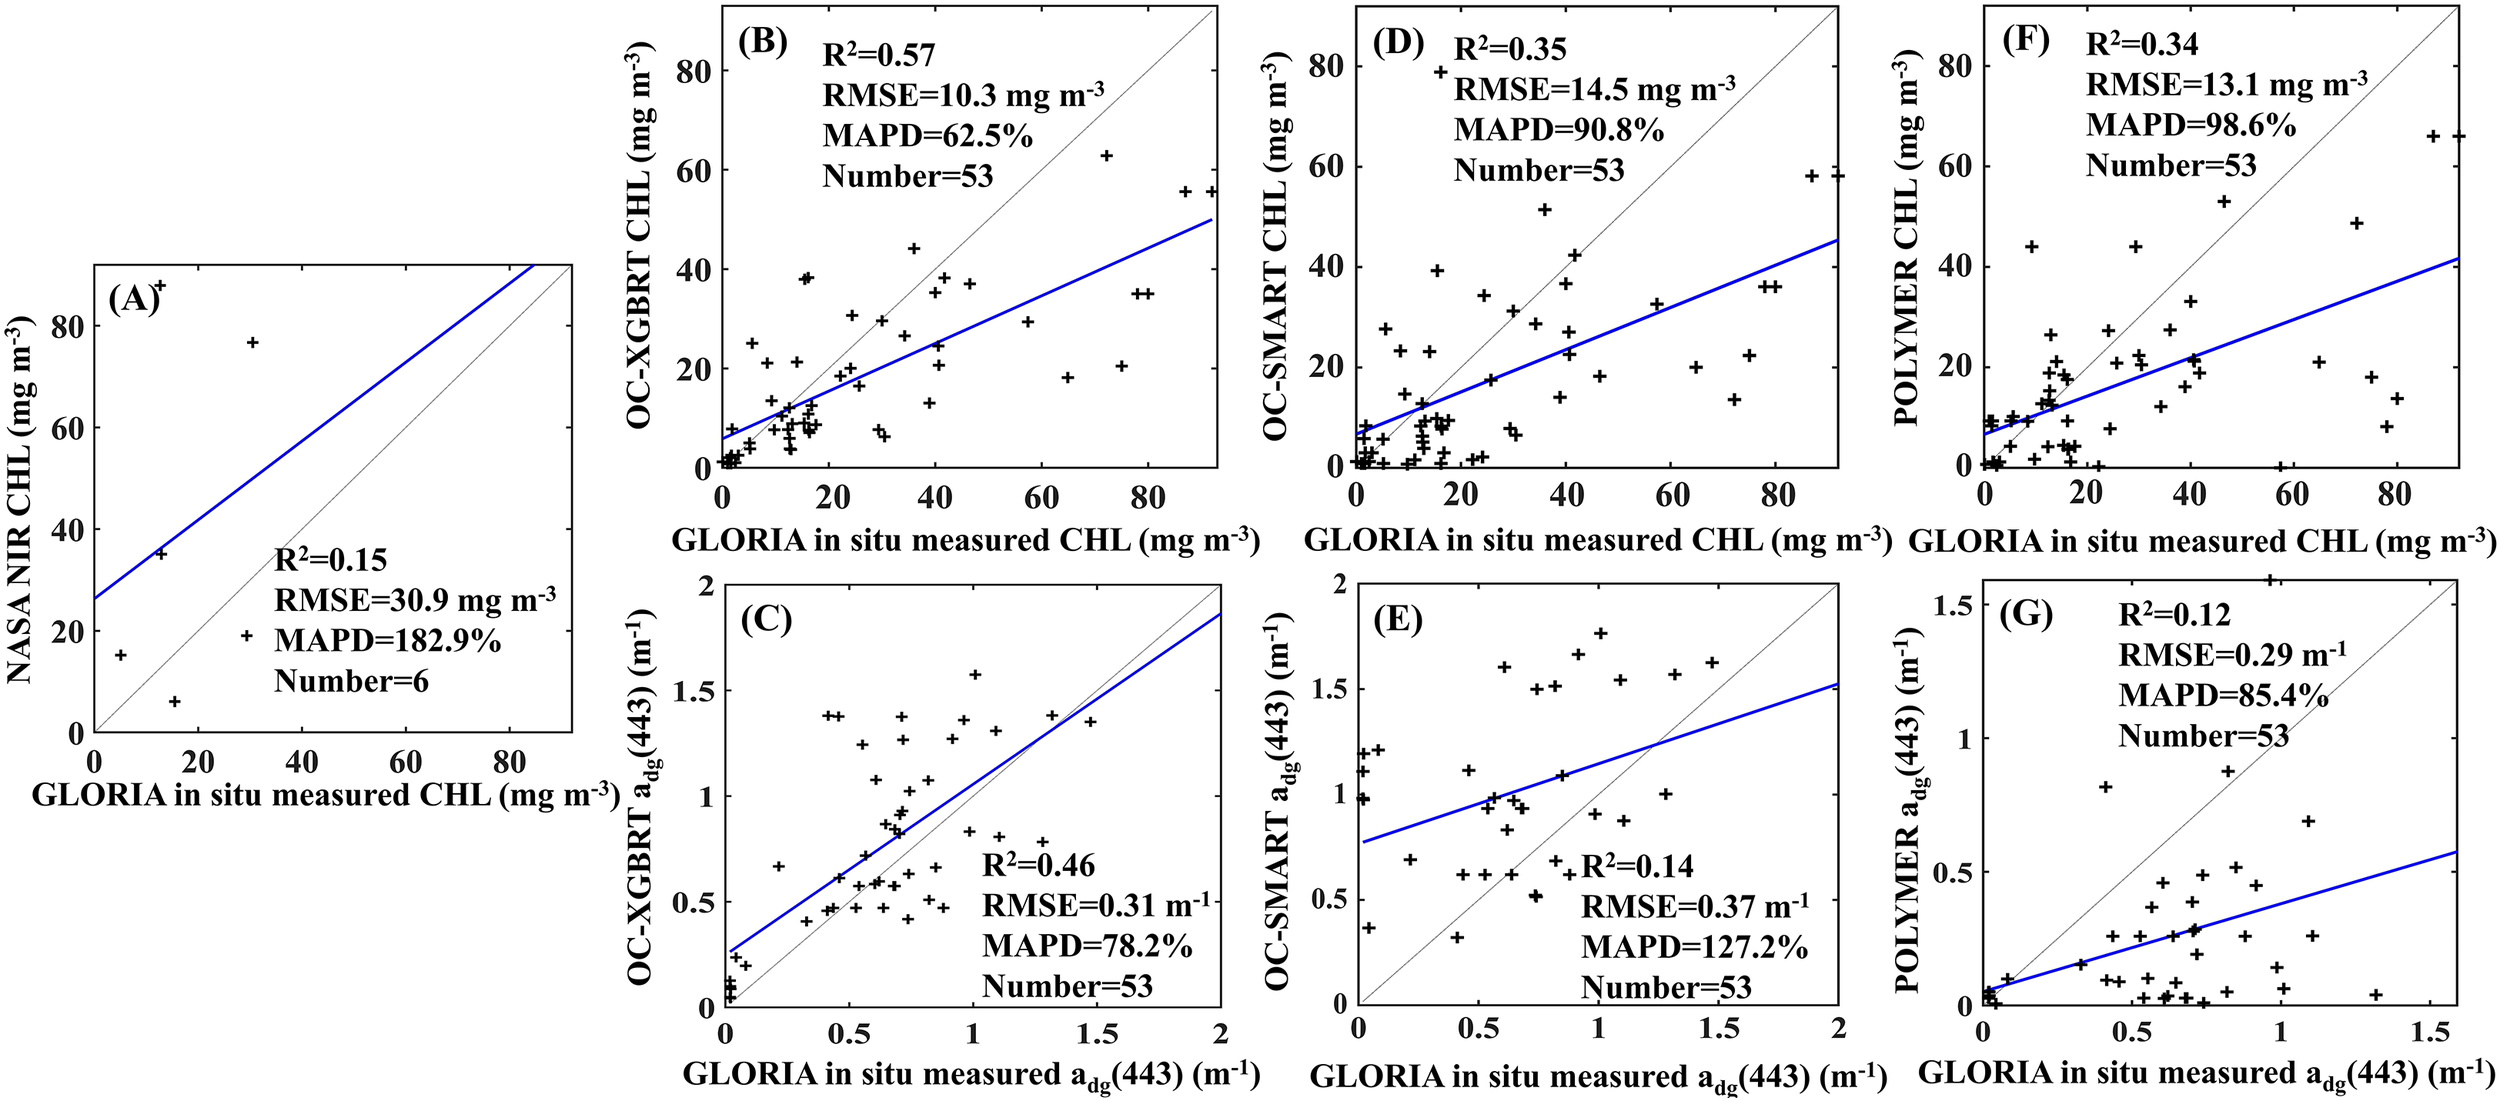
Validation of the (A, B, D, F) CHL and (C, E, G) retrieved by (A) NASA NIR and (B, C) OC-XGBRT, (D, E) OC-SMART, and (F, G) POLYMER AC algorithms against the GLORIA measurements.
3.2 Application in West coast of North Africa
Along the west coast of North Africa, the transport of dust from the Sahara reaches an extremely severe level (Prospero et al., 2002; Prospero and Mayol-Bracero, 2013), posing notable challenges to the accurate retrieval of ocean color parameters. Figures 5A–F illustrate a comparative application case that focuses on the three ocean color parameters (CHL, , and ) retrieved from the (λ) obtained by the NASA NIR and OC-XGBRT algorithms over the west coast of North Africa. A comparison between Figures 5A, D for CHL and Figures 5B, E for indicates that the OC-XGBRT retrievals show region-dependent deviations from those obtained using the NIR AC algorithm, with positive differences in some areas and negative differences elsewhere. Given the OC-XGBRT has been validated to be closer to in situ(λ) (Song et al., 2023) and outperforms the NIR algorithm (Figures 3, 4), this discrepancy suggests that the NIR algorithm may lead to large uncertainty for the retrievals of the CHL and in the presence of Sahara dust. However, the retrieval of (shown in Figures 5C, F) was seriously affected by the dust aerosol. Specifically, the negative and underestimated (λ) at the blue band caused large deviations of the retrieval, with the relative percentage deviation () reaching approximately ±80% shown in Figure 5I. In contrast, Figures 5G–I show that is relatively lower (about ±25%), which is smaller than that of CHL and . Our results indicated that the retrieval of was less affected by the dust aerosol compared to the other two parameters in the west coast of North Africa.
Figure 5
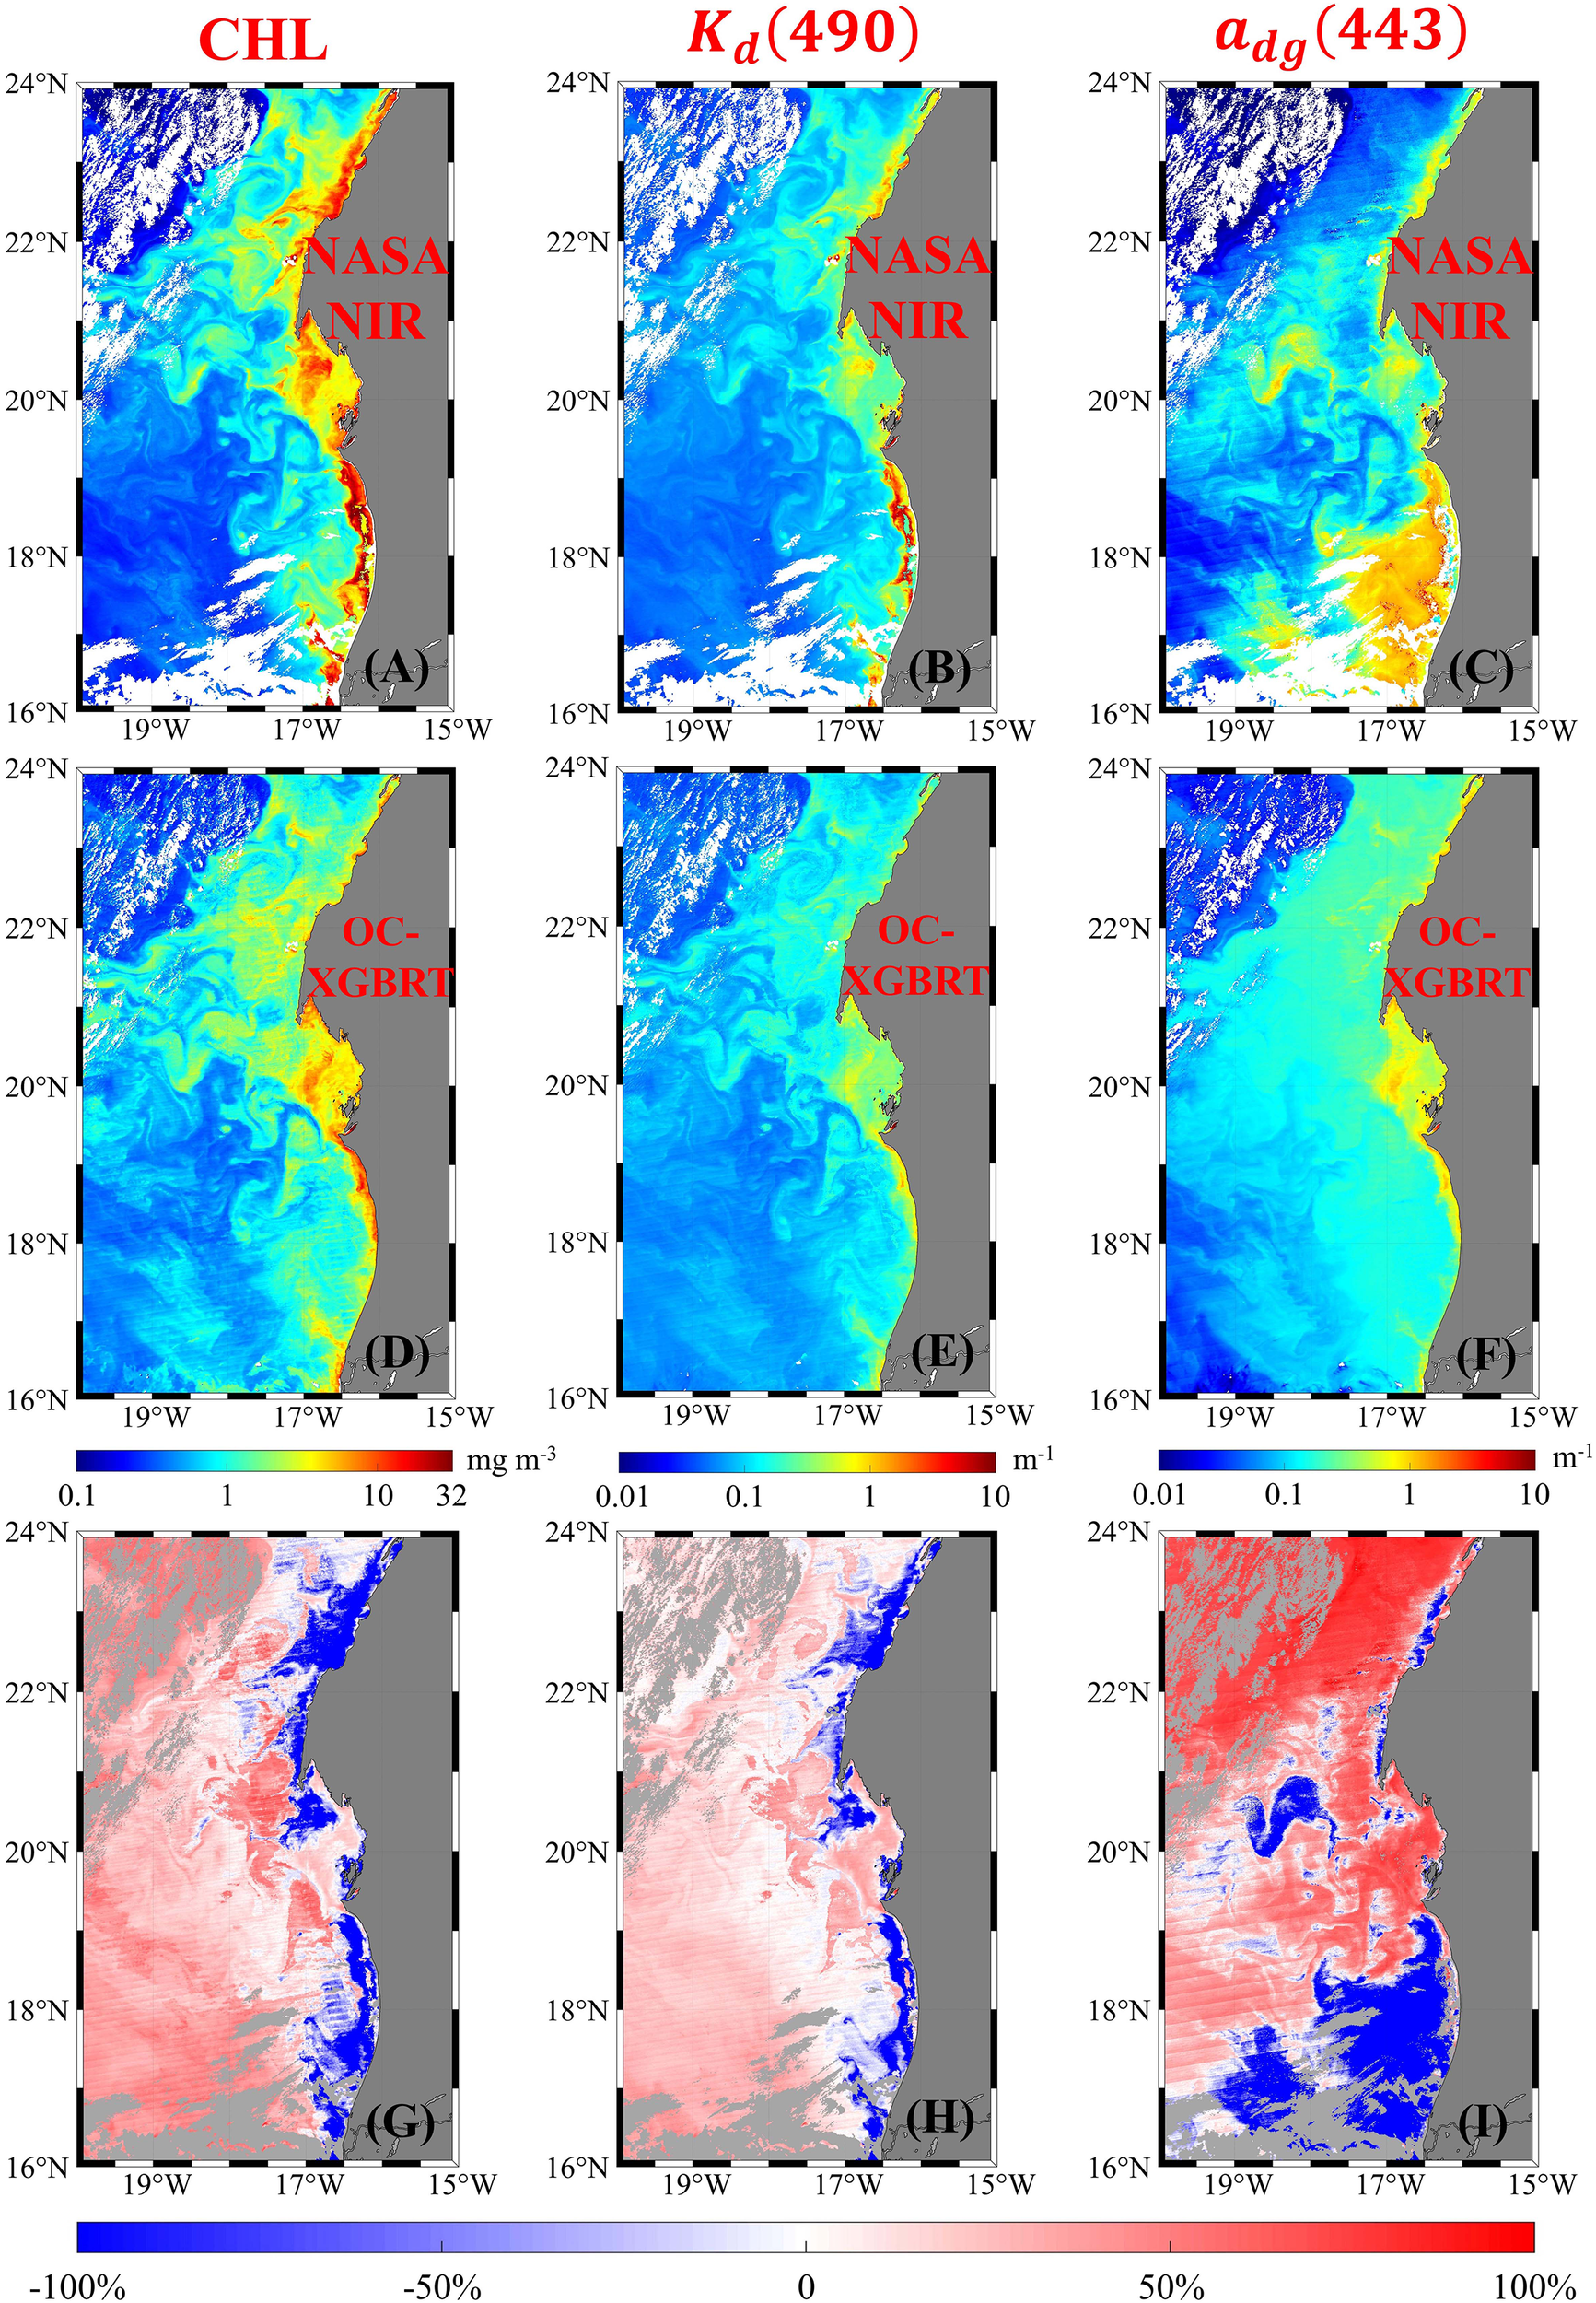
Comparison of CHL, , and derived from (λ) retrieval using (A–C) NASA NIR and (D–F) OC-XGBRT algorithms over the west coast of North Africa at 14:30 UTC on December 2, 2017. Relative percentage deviation of the (G) CHL, (H), and (I) between the retrievals from the (λ) obtained by the NASA NIR and OC-XGBRT algorithms.
Given the intense transport of the Sahara dust into the west coast of North Africa throughout the year (Prospero et al., 2002) (Prospero and Mayol-Bracero, 2013),, a long-term analysis of the impact of absorbing aerosols on the retrieval of ocean color parameter is essential for capturing robust patterns. Figures 6A–F compare the differences in the annual average spatial distributions of CHL, , and retrieved from the (λ) obtained by the NASA NIR and OC-XGBRT algorithms from 2003 to 2022. The annual average ocean color parameters retrieved from the NASA NIR algorithm were relatively lower than those from the OC-XGBRT algorithm, with maximum relative deviations () reaching 60%. As shown in Figures 6G–I, the and range from -10% to 60% and from -15% to 60%, respectively. Their regionally averaged biases are nearly comparable, at approximately 46.5% and 48.3%, respectively. Among the three parameters, the retrieval of was least affected by the absorbing aerosols, with an average of 29.8%. Notably, compared with the retrievals of single-orbit remote sensing data, the annual average results exhibited more stable spatial consistency. This stability arises from mitigating short-term variability induced by year-round absorbing aerosols, which contributes to the reliability of long-term trend analysis.
Figure 6
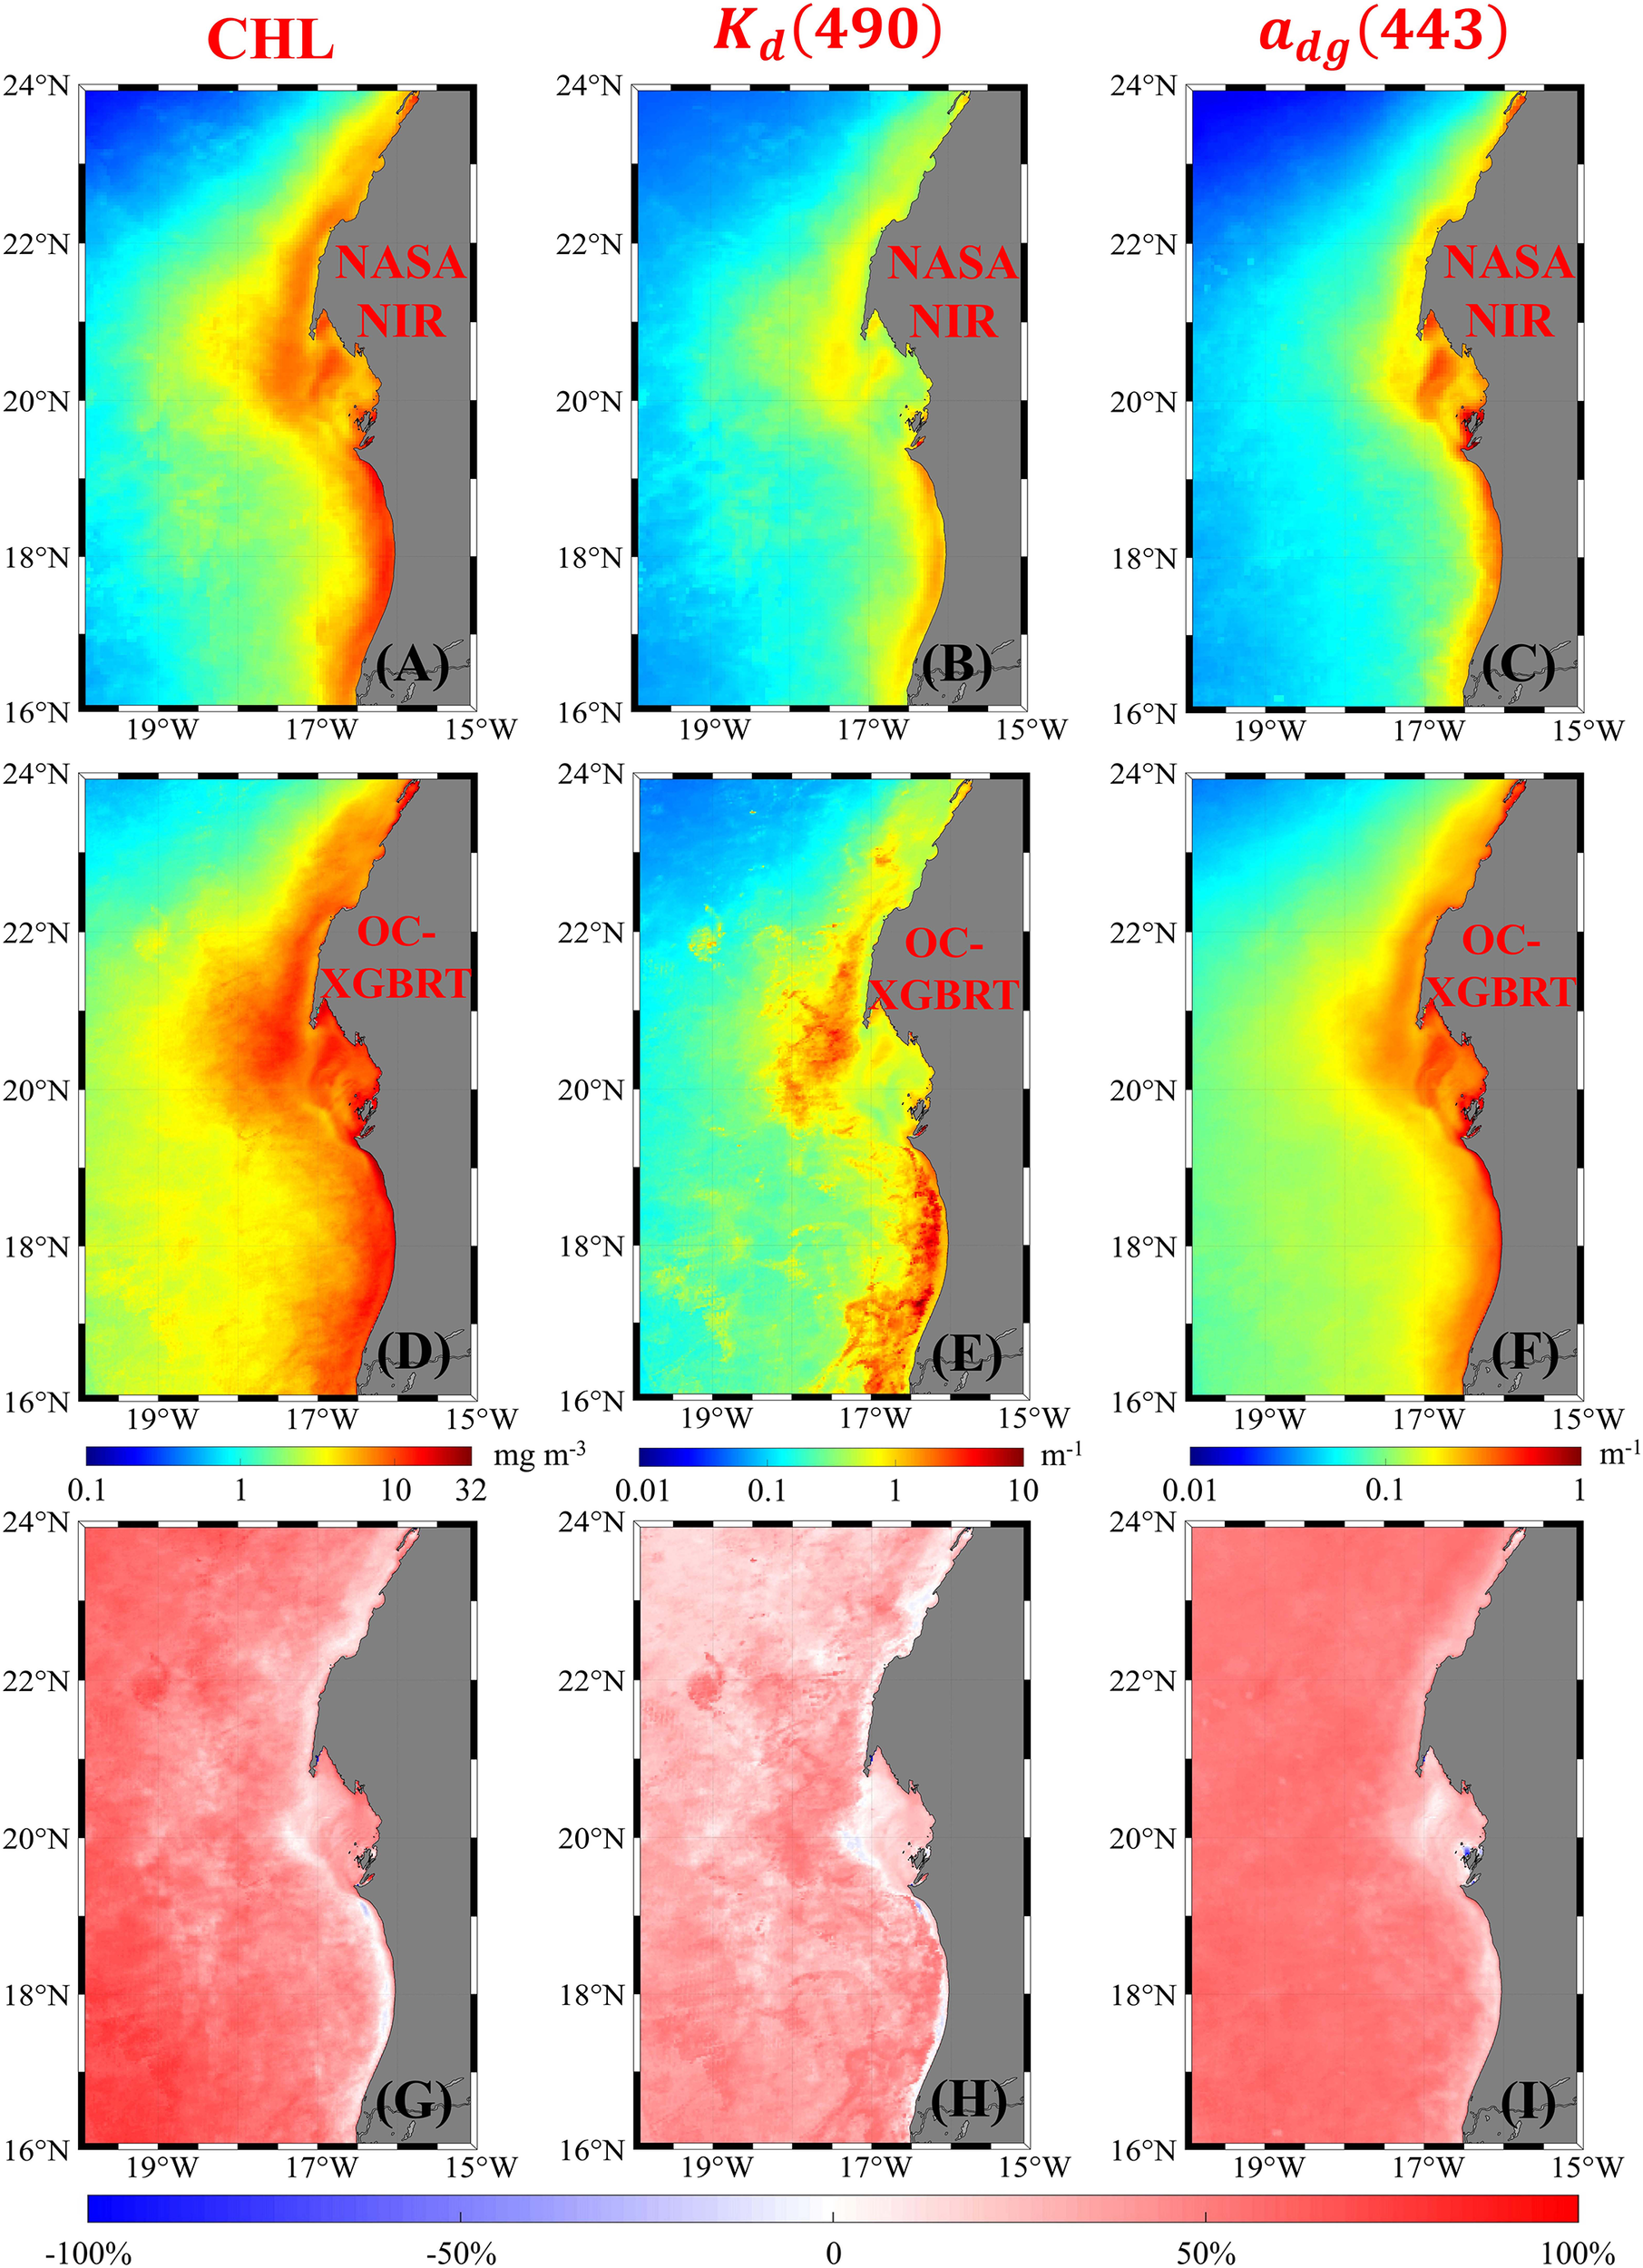
Comparison of average annual CHL, , and derived from (λ) retrieval using (A–C) NASA NIR and (D–F) OC-XGBRT algorithms from 2003 to 2022 over the west coast of North Africa. Relative percentage deviation of the (G) CHL, (H), and (I) between the retrievals from the (λ) obtained by the NIR and OC-XGBRT algorithms.
To investigate the long-term variations of the ocean color parameters, Figures 7A–F depict the spatial distributions of the relative change rates of the CHL, , and retrieved by the NASA NIR and OC-XGBRT algorithms during 2003-2022. Quantitative analysis in Figure 7 revealed that the long-term trends of these ocean color retrievals from the two algorithms showed generally similar spatial characteristics within the selected oceanic regimes of this study. However, the spatial distributions of the grid points passing the statistical significance test (p < 0.05) were substantially different between the NASA NIR and OC-XGBRT algorithms. Specifically, as illustrated in Figure 7G, the p-value associated with CHL retrievals from the OC-XGBRT algorithm was reduced from 0.37 (using the NASA NIR algorithm) to 0.002. The reduction in p-value demonstrated a marked enhancement in the statistical significance of the long-term trends of ocean color parameters derived from the OC-XGBRT algorithm. Spatially, most oceanic regions exhibited increasing trends for all three parameters, with annual relative change rates ranging approximately from 2% to 6% per year. Differently, a decreasing trend was observed in the Bay of Arguin and its adjacent southern coastal waters, where the annual relative rates of changes of these parameters fallen within the range of about 1% to 4% per year.
Figure 7
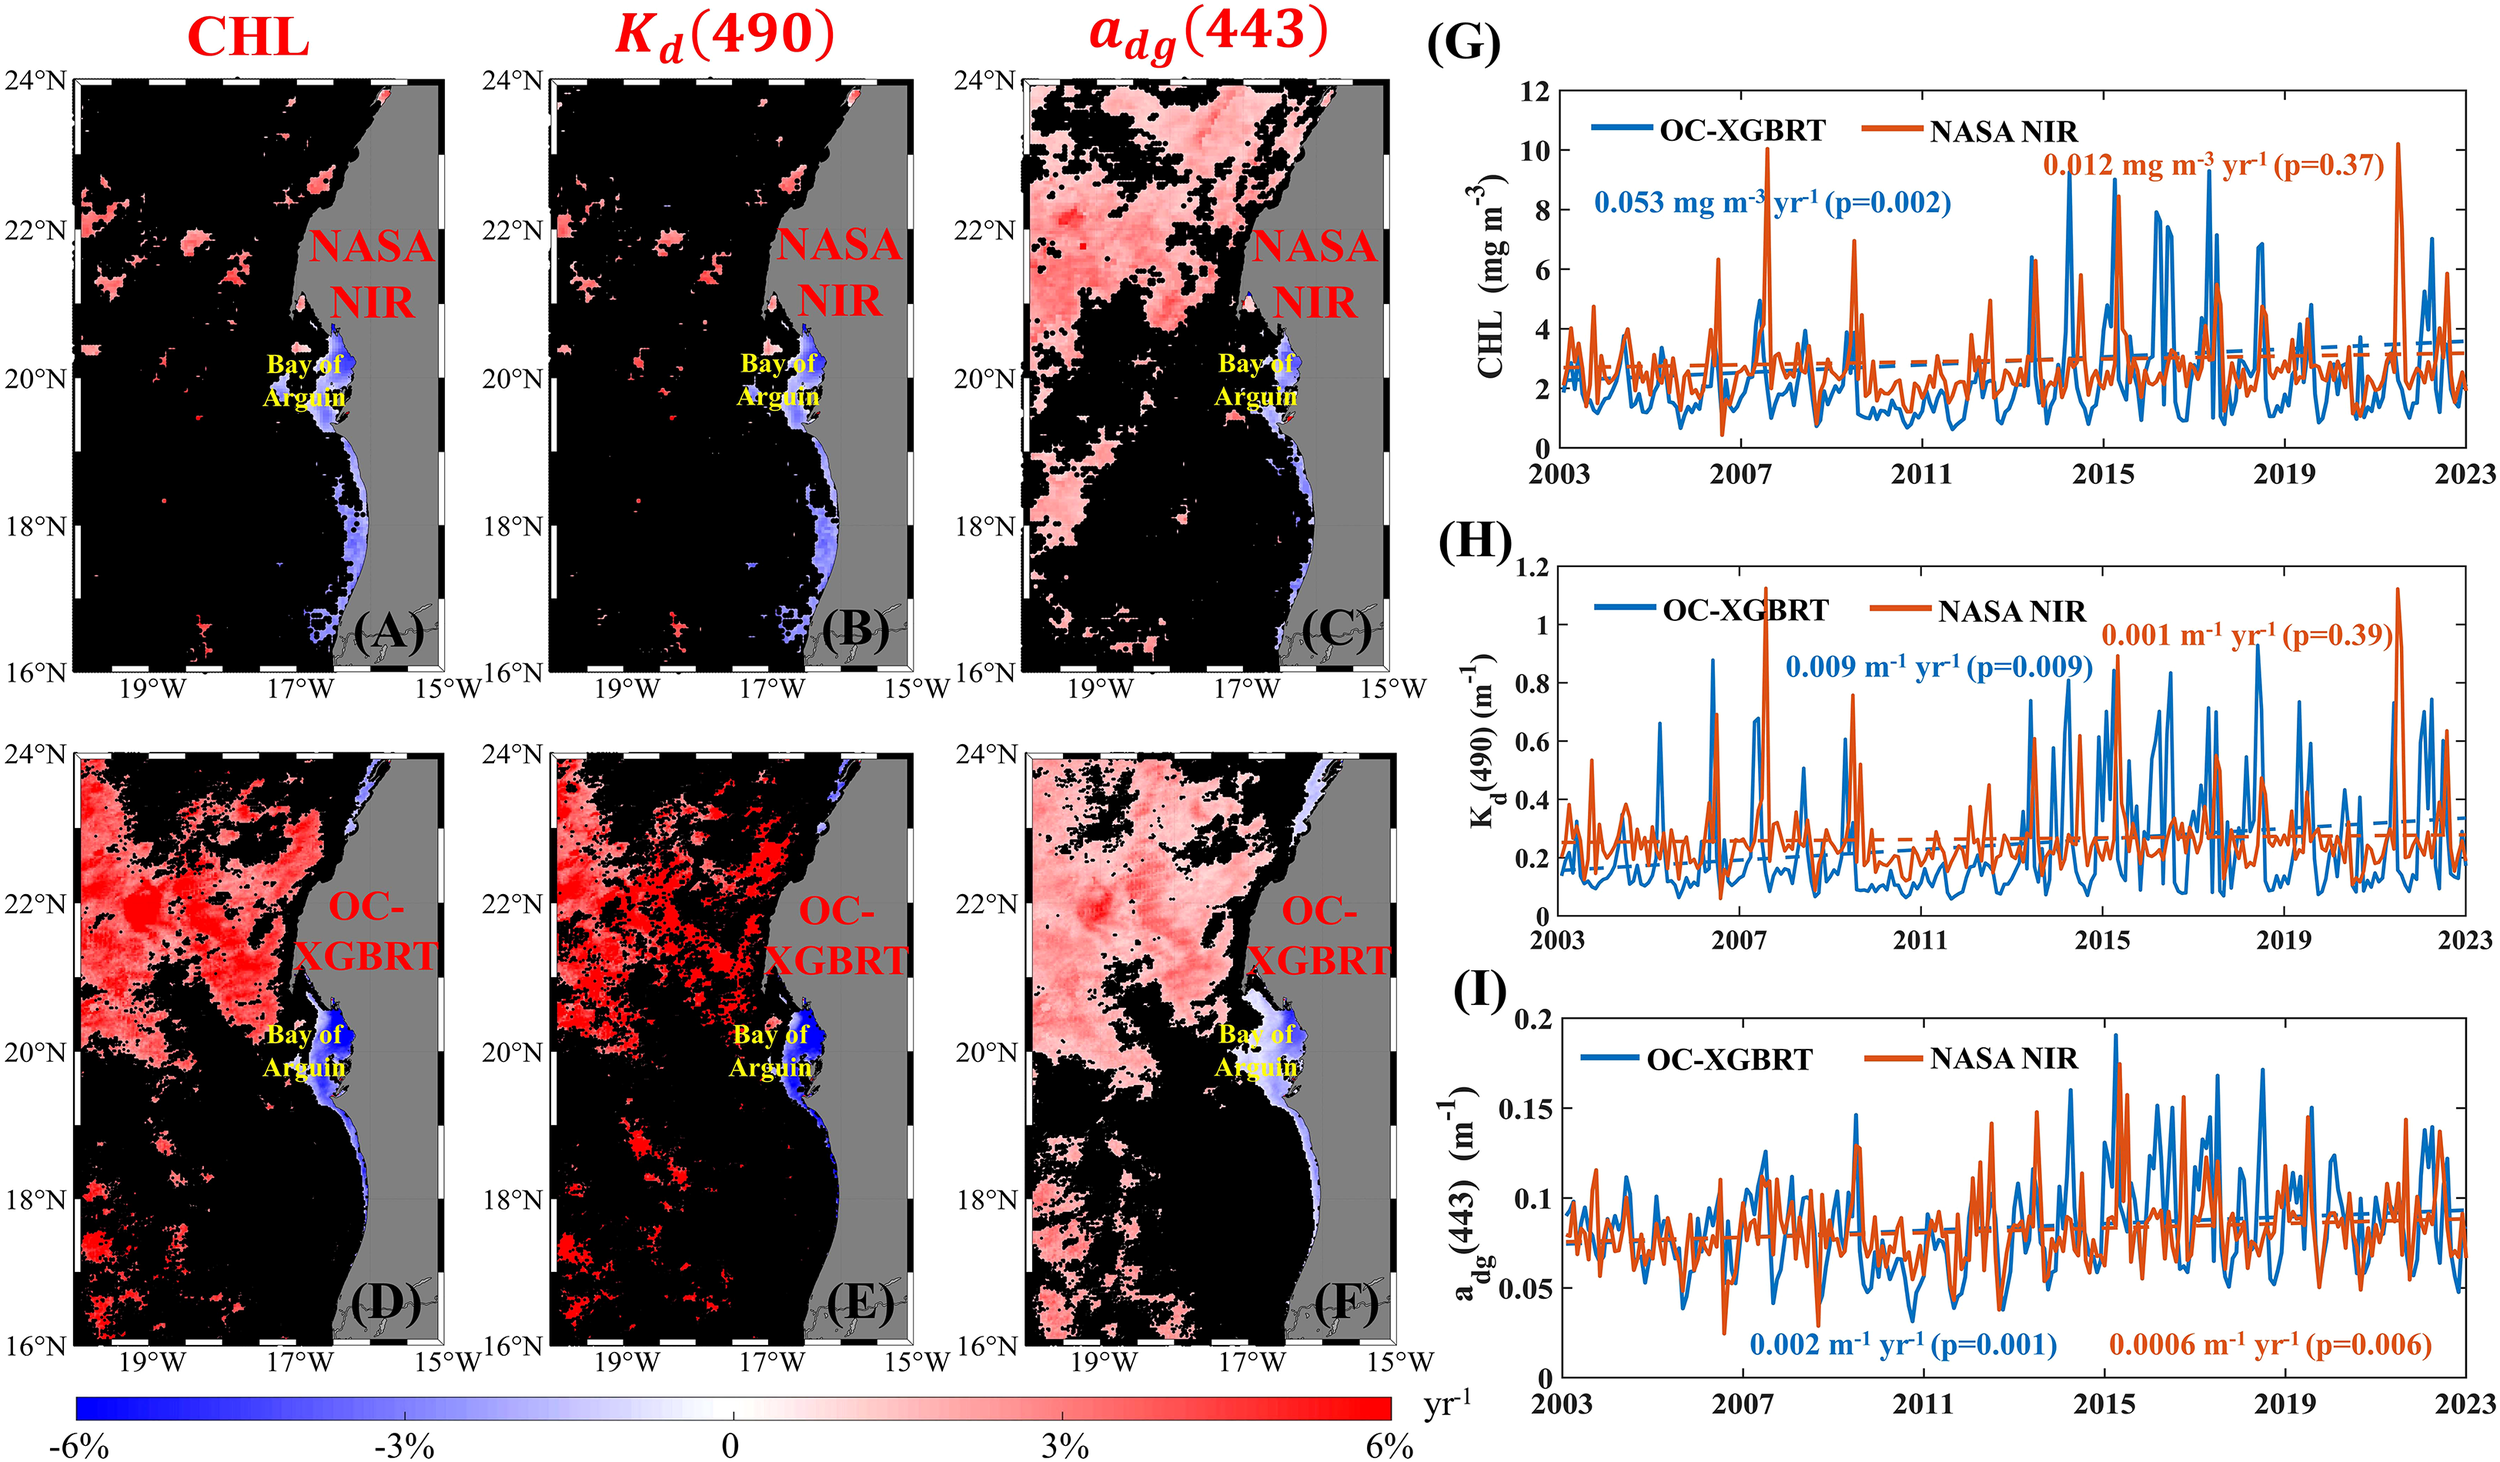
Relative rates of changes of the CHL, , and derived from (λ) retrieval using (A–C) NASA NIR and (D–F) OC-XGBRT algorithms from 2003 to 2022 over the west coast of North Africa. (G–I) Long-term change trends of CHL, , and from 2003 to 2022 over the west coast of North Africa. It needs to be noted that the black area failed the significance test (p>0.05).
3.3 Application in Persian Gulf
The Persian Gulf is constantly influenced by the dust emissions from the Arabian Desert (Jish Prakash et al., 2015; Banks et al., 2017), and the substantial dust input introduces strong interference to the ocean color remote sensing, ultimately resulting in low-quality satellite products in this region. Figure 8 compares the CHL, , and retrievals derived from the NASA NIR and OC-XGBRT algorithms in the Persian Gulf. Similar to the west coast of North Africa, the CHL and retrieved by the OC-XGBRT were relatively higher than those of the NASA NIR in most regions of the Persian Gulf, with the ranging about from 15% to 70%. This enhancement in retrievals from the OC-XGBRT algorithm is more evident over the coastal waters of the gulf. Among the three ocean color parameters, the discrepancies in retrievals between the two algorithms are the smallest, as the relative difference () consistently remains below 15%. In contrast, as depicted in Figures 8C, F, I, retrievals were the most severely affected by the absorbing aerosols (dominated by desert dust), exhibiting a notable relative deviation () of approximately ±70%.
Figure 8
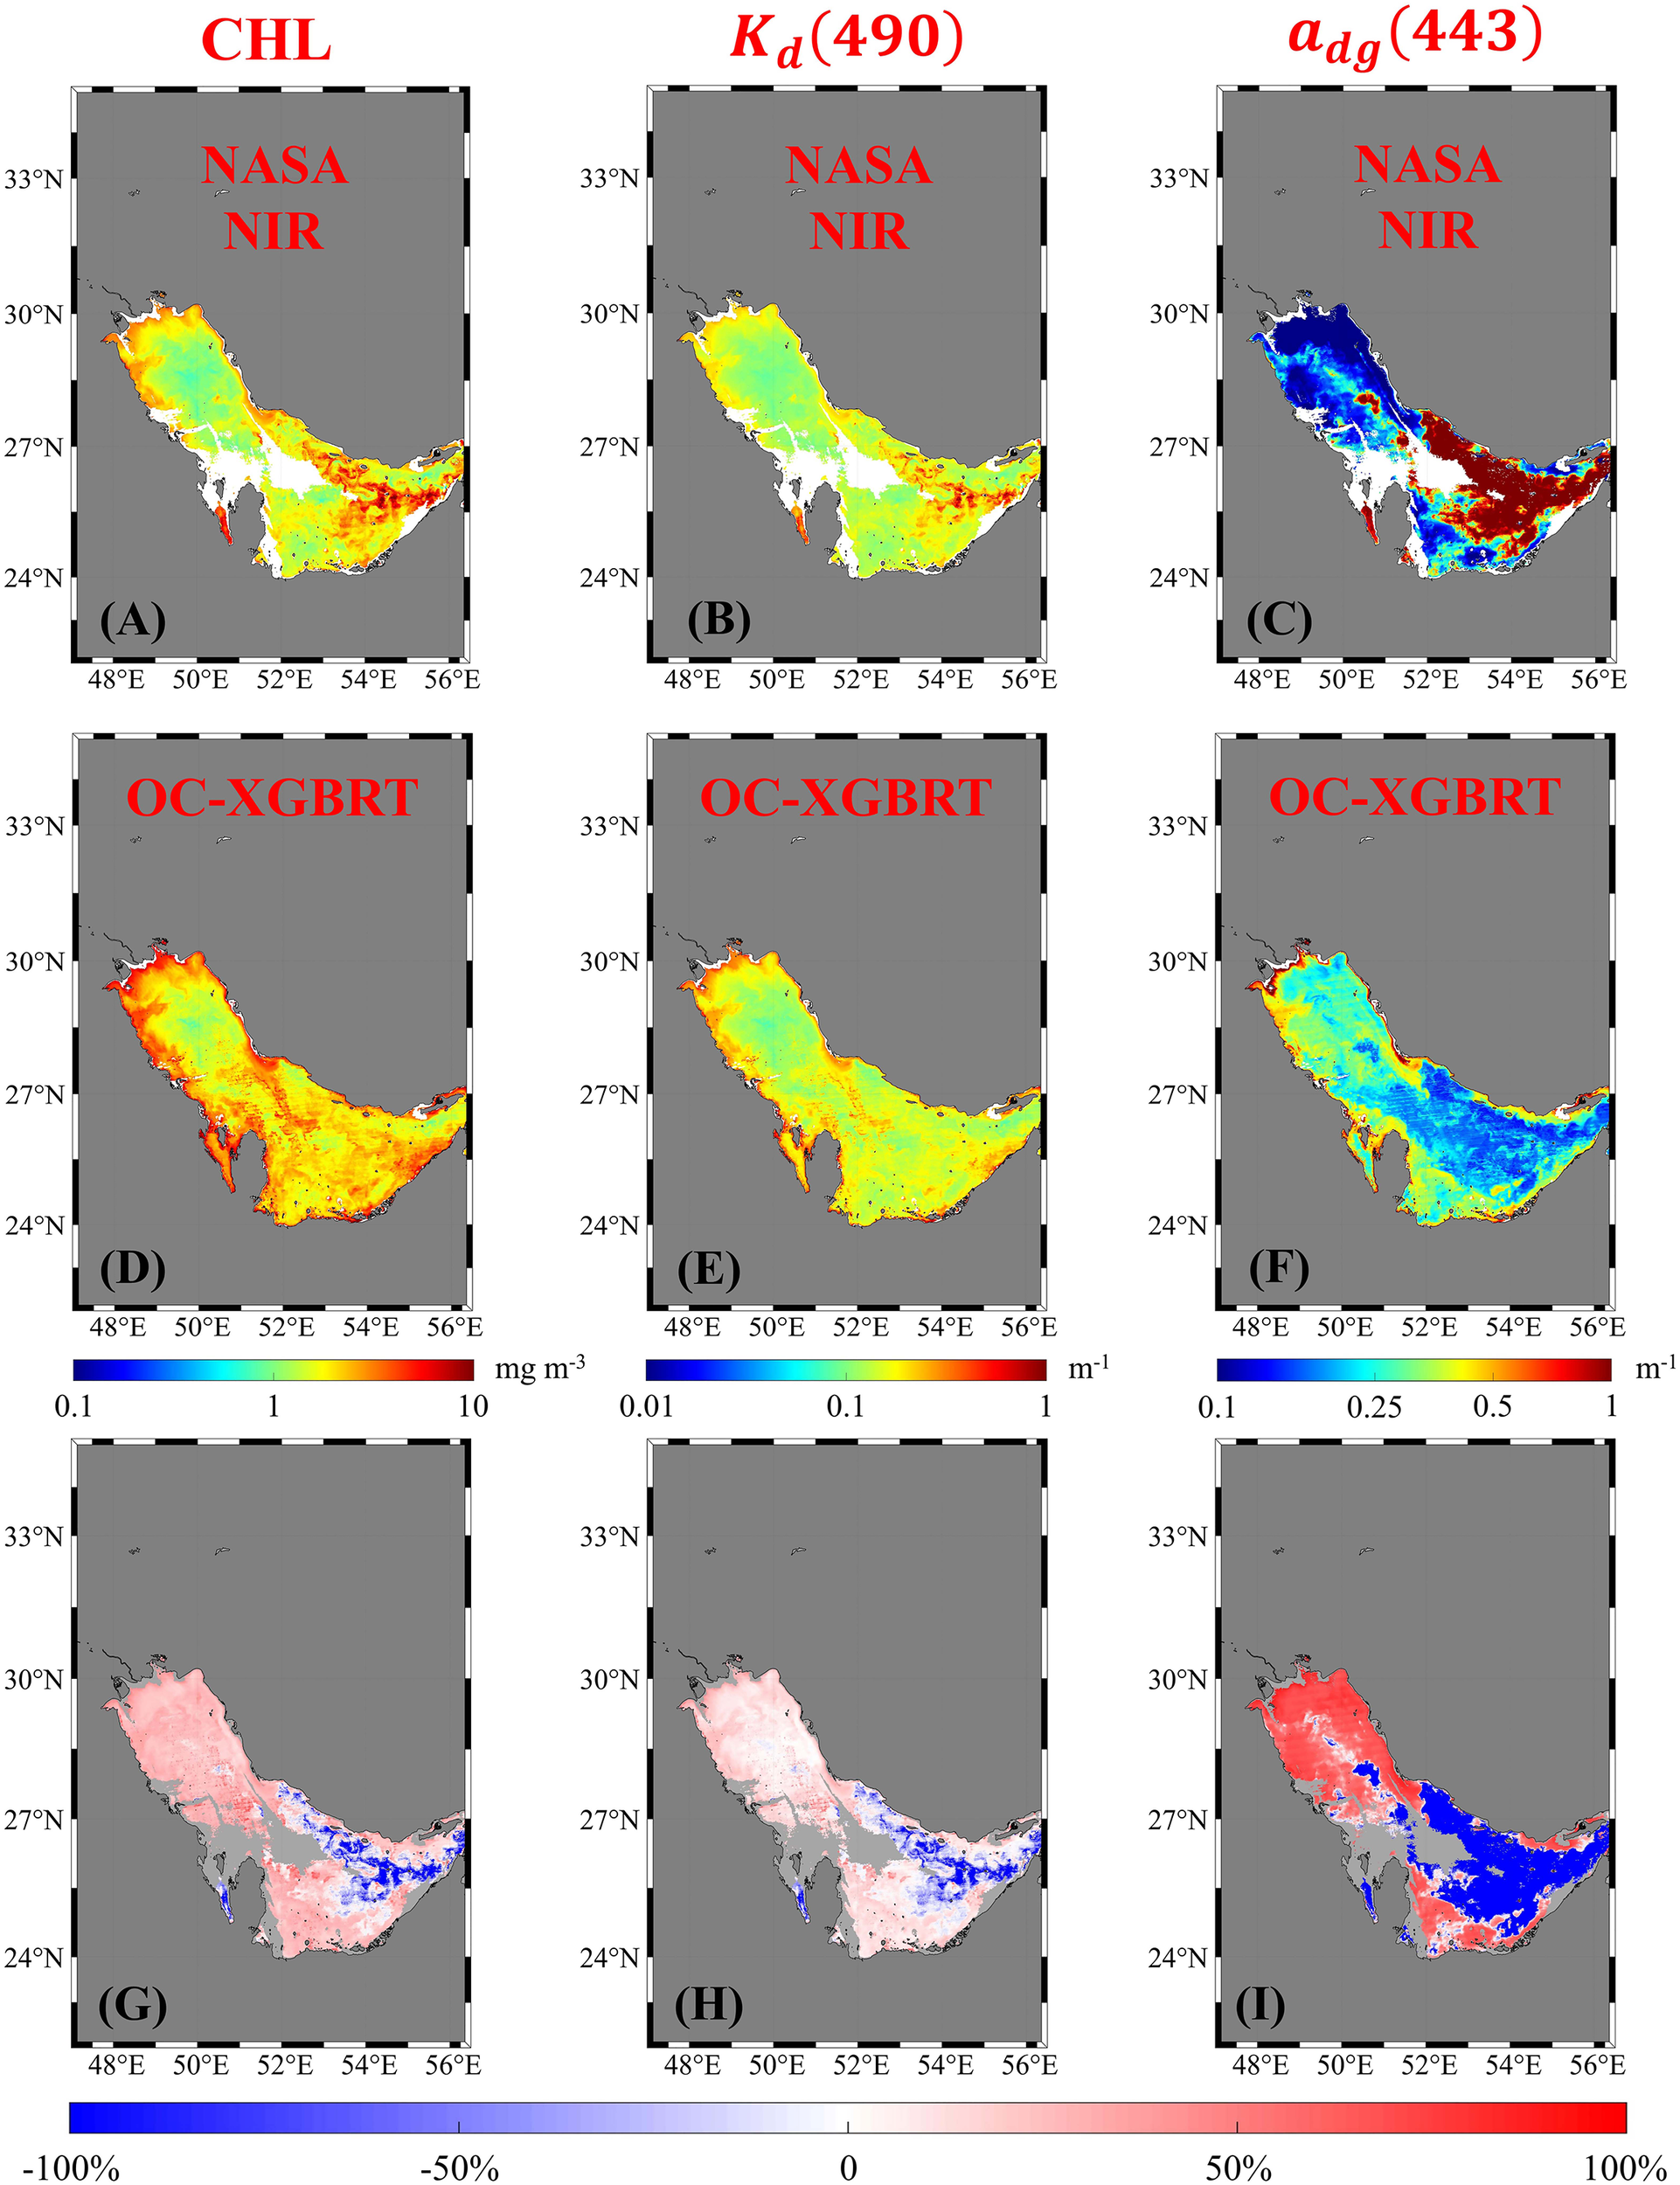
Comparison of CHL, Kd (490), and adg (443) derived from Rrs(λ) retrieval using (A–C) NASA NIR and (D–F) OC-XGBRT algorithms over the Persian Gulf at 10:05 UTC on December 10, 2007. Relative percentage deviation of the (G) CHL, (H)Kd (490), and (I)adg (443) between the retrievals from the Rrs(λ) obtained by the NASA NIR and OC-XGBRT algorithms.
Considering the persistent intrusion of desert dust originating from the Arabian Desert into the Persian Gulf throughout the year (Jish Prakash et al., 2015; Banks et al., 2017), a long-term analysis of how absorbing aerosols affect the ocean color retrieval is critical for improving our understanding of the biogeochemical information in this region. Figure 9 illustrates the spatial patterns of annually CHL, , and retrieved from the NASA NIR and OC-XGBRT algorithms in the Persian Gulf during 2003–2022. In analogy with the west coast of North Africa, the three ocean color parameters retrieved by the OC-XGBRT exhibit larger values than those by the NASA NIR algorithm, with the ranging from 10% to 65%. This enhancement is particularly obvious for the retrieval, with reaching up to 65% in the coastal regions of the gulf. A comparison of Figures 9G–I further shows that is the smallest among the three parameters ( less than 25%), which is consistent with the single-orbit remote sensing retrievals shown in Figures 8G–I.
Figure 9

Comparison of average annual CHL, Kd (490), and adg (443) derived from Rrs(λ) retrieval using (A–C) NASA NIR and (D–F) OC-XGBRT algorithms from 2003 to 2022 over the Persian Gulf. Relative percentage deviation of the (G) CHL, (H)Kd (490), and (I)adg between the retrievals from the Rrs(λ) obtained by the NIR and OC-XGBRT algorithms.
Figure 10 shows the relative change rates and long-term trends of the three ocean color parameters derived from the NASA NIR and OC-XGBRT algorithms in the Persian Gulf from 2003 to 2022. Different from the patterns observed along the west coast of North Africa, the CHL, , and all exhibit decreasing trends in most regions of the Persian Gulf, with annual change rates ranging approximately from -1% to -4% yr-1. The long-term trends of ocean color products retrieved from the two algorithms show good agreement, which is similar to those observed in the west coast of North Africa. In addition, the number of pixel points where the OC-XGBRT results passed the significance test (p < 0.05) was also greater than that of the NIR algorithm. As illustrated in Figures 10G–I, the trends of CHL and derived from the OC-XGBRT are basically congruent with those from the NASA NIR AC algorithm. In contrast, displays relatively larger differences in the magnitude of change trends (OC-XGBRT: -0.0017 m-1 yr-1; NIR: -0.0001 m-1 yr-1) than CHL and shown in Figure 10I. The larger discrepancy in the long-term trends between the two algorithms for than for CHL and indicates that the retrieval of is more susceptible to interference from absorbing aerosols in the Persian Gulf.
Figure 10
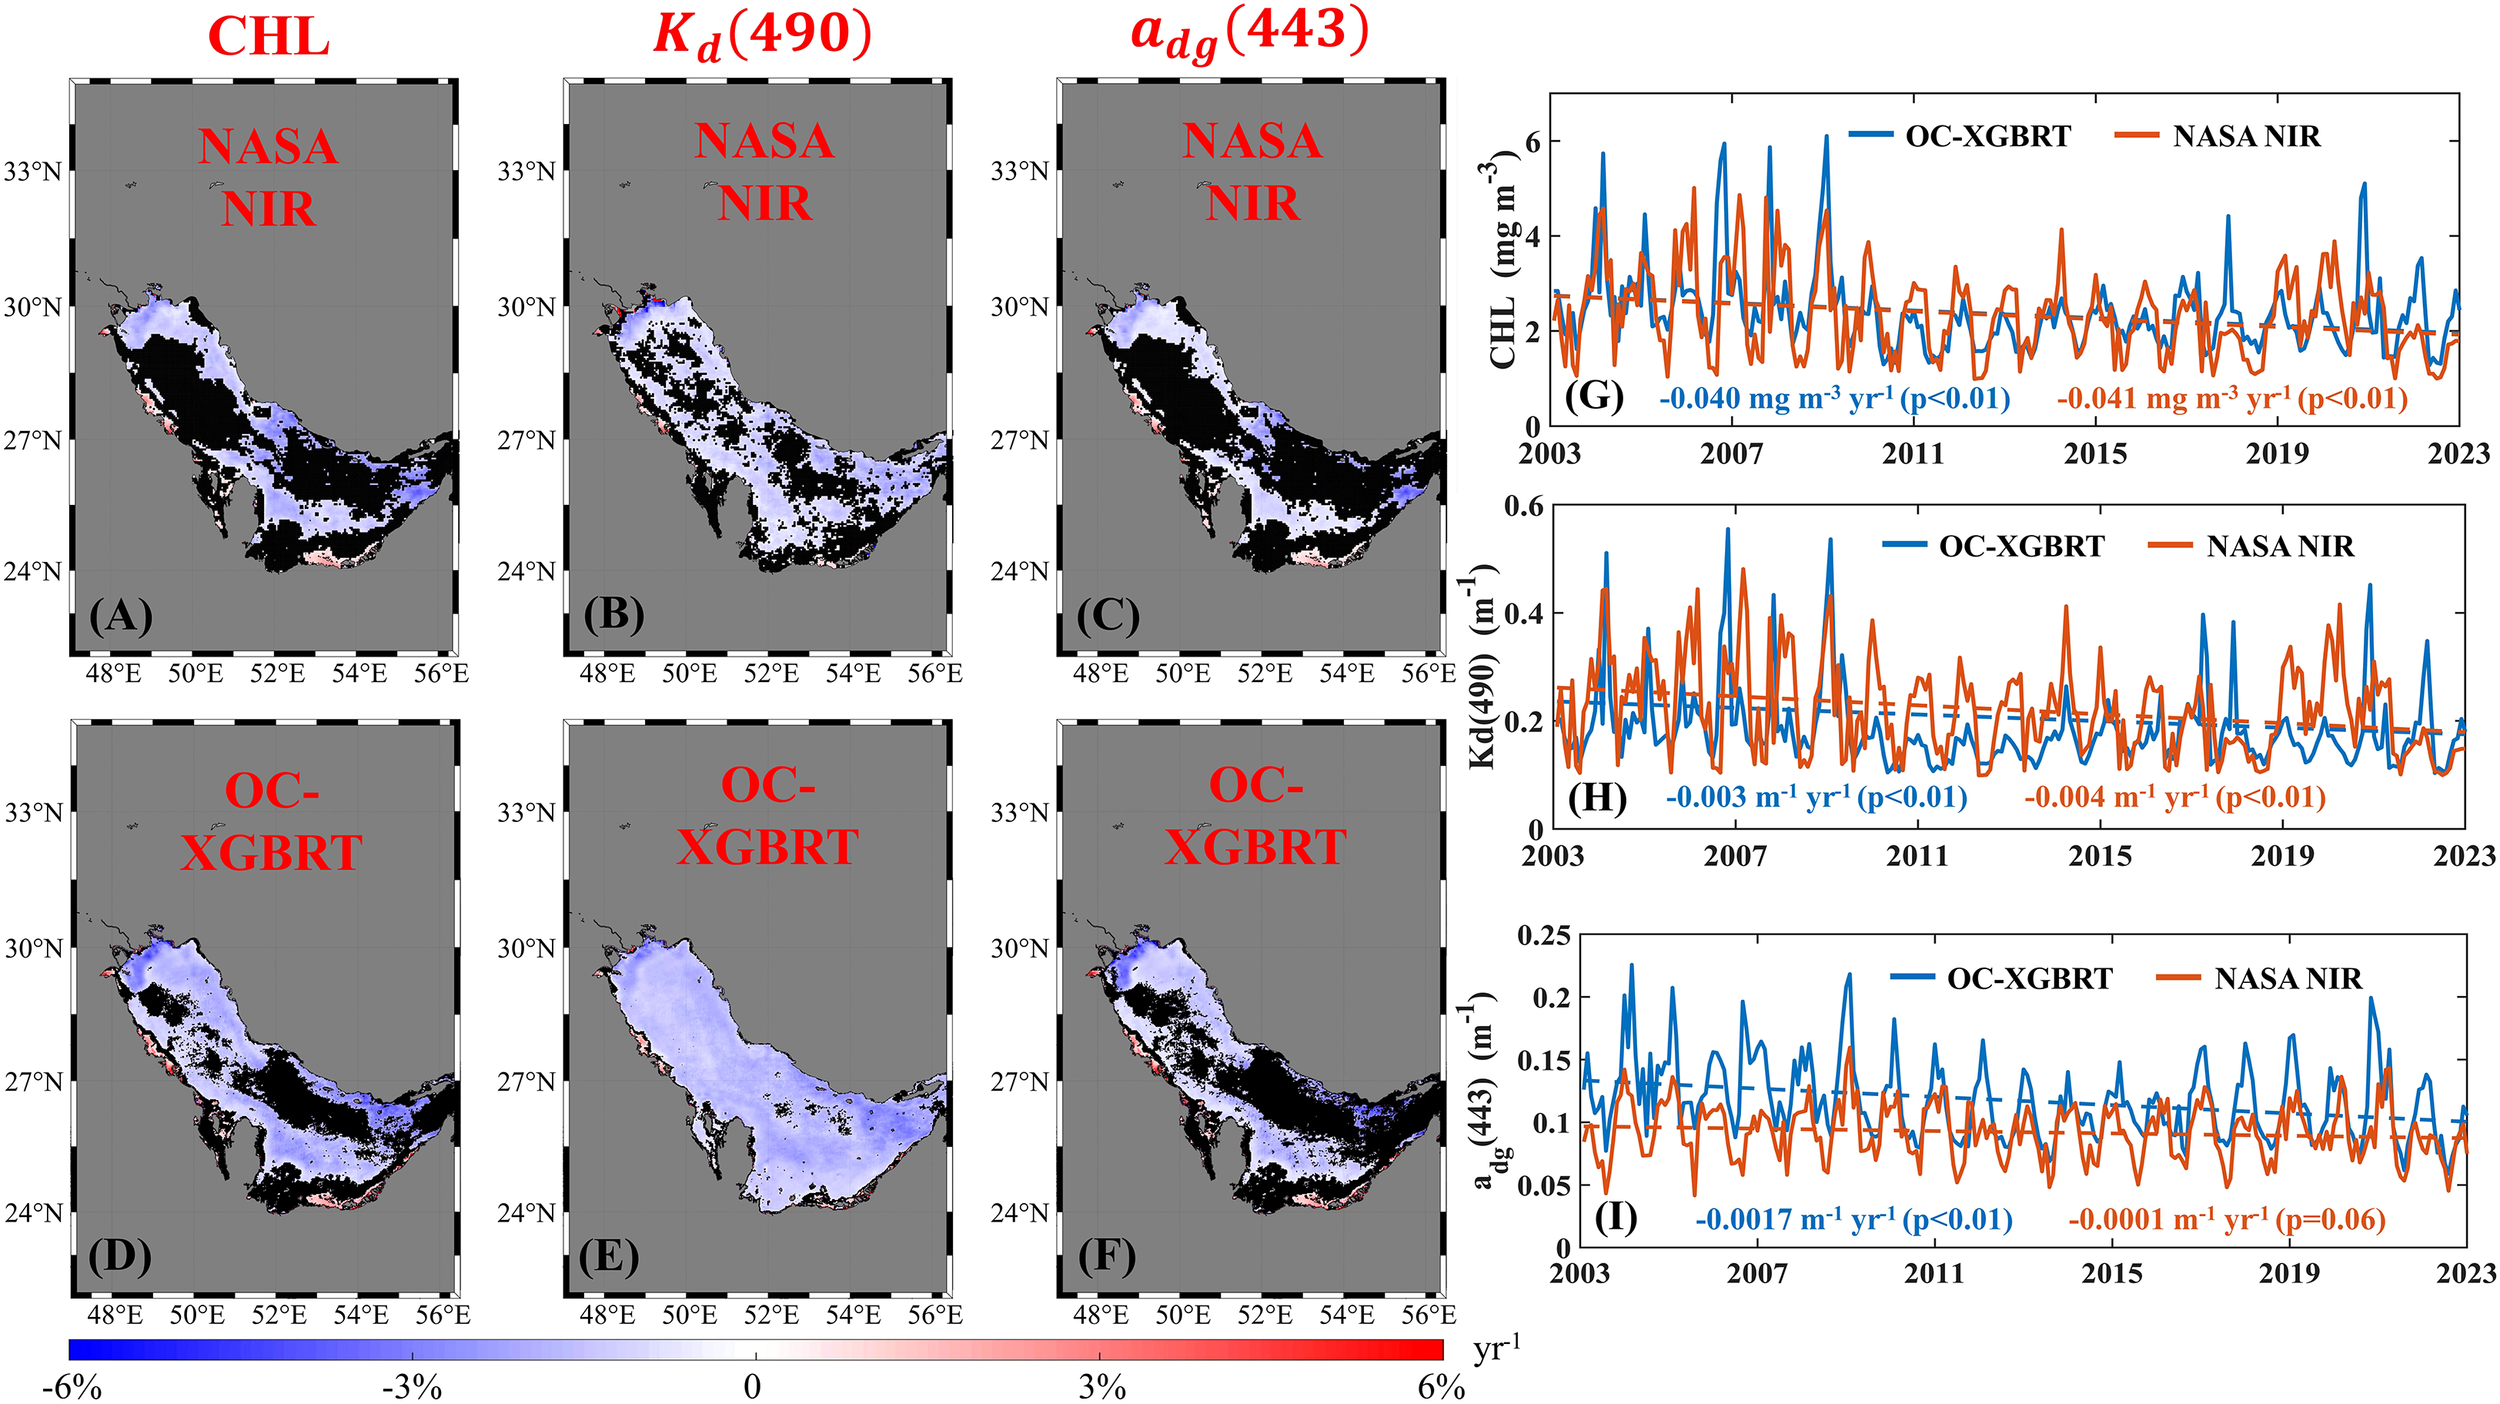
Relative rates of changes of the CHL, Kd (490), and adg (443) derived from Rrs(λ) retrieval using (A–C) NASA NIR and (D–F) OC-XGBRT algorithms from 2003 to 2022 over the Persian Gulf. (G–I) Long-term change trends of CHL, Kd (490), and adg (443) from 2003 to 2022 over the west coast of North Africa. It needs to be noted that the black area failed the significance test (p>0.05).
3.4 Application in West coast of North America, Black Sea, and Chinese Bohai-Yellow Sea
The west coast of North America, Black Sea, and Chinese Bohai-Yellow Sea are influenced by surrounding biomass burning, industrial pollution emissions, and dust from nearby deserts, with a certainty seasonal change (Agbor et al., 2014; Bezberdaya et al., 2024; Luan et al., 2024). These multiple aerosol sources collectively lead to the formation of complex aerosol mixtures (including smoke, mineral dust, and urban anthropogenic aerosols) over these regions, threatening the accuracy of satellite ocean color retrievals. Figures 11–13 illustrate the single-orbit comparisons of the CHL, , and retrieved by the NASA NIR and OC-XGBRT algorithms over the West coast of North America, Black Sea, and Chinese Bohai-Yellow Sea, respectively. Similar to the West coast of North Africa and Persian Gulf, the retrieval of is the most strongly affected by the absorbing aerosols among the three ocean color parameters. However, the impact is less pronounced compared to the coastal waters nearby large deserts, with about ±65%. In addition, the differences in CHL and retrievals between the NASA NIR and OC-XGBRT algorithms () are relatively low, with ranging from -25% to 25%. As for the west coast of North America (Figure 11), the three ocean color retrievals of NASA NIR all were overestimated (with approximately -75%) along the nearshore regions.
Figure 11
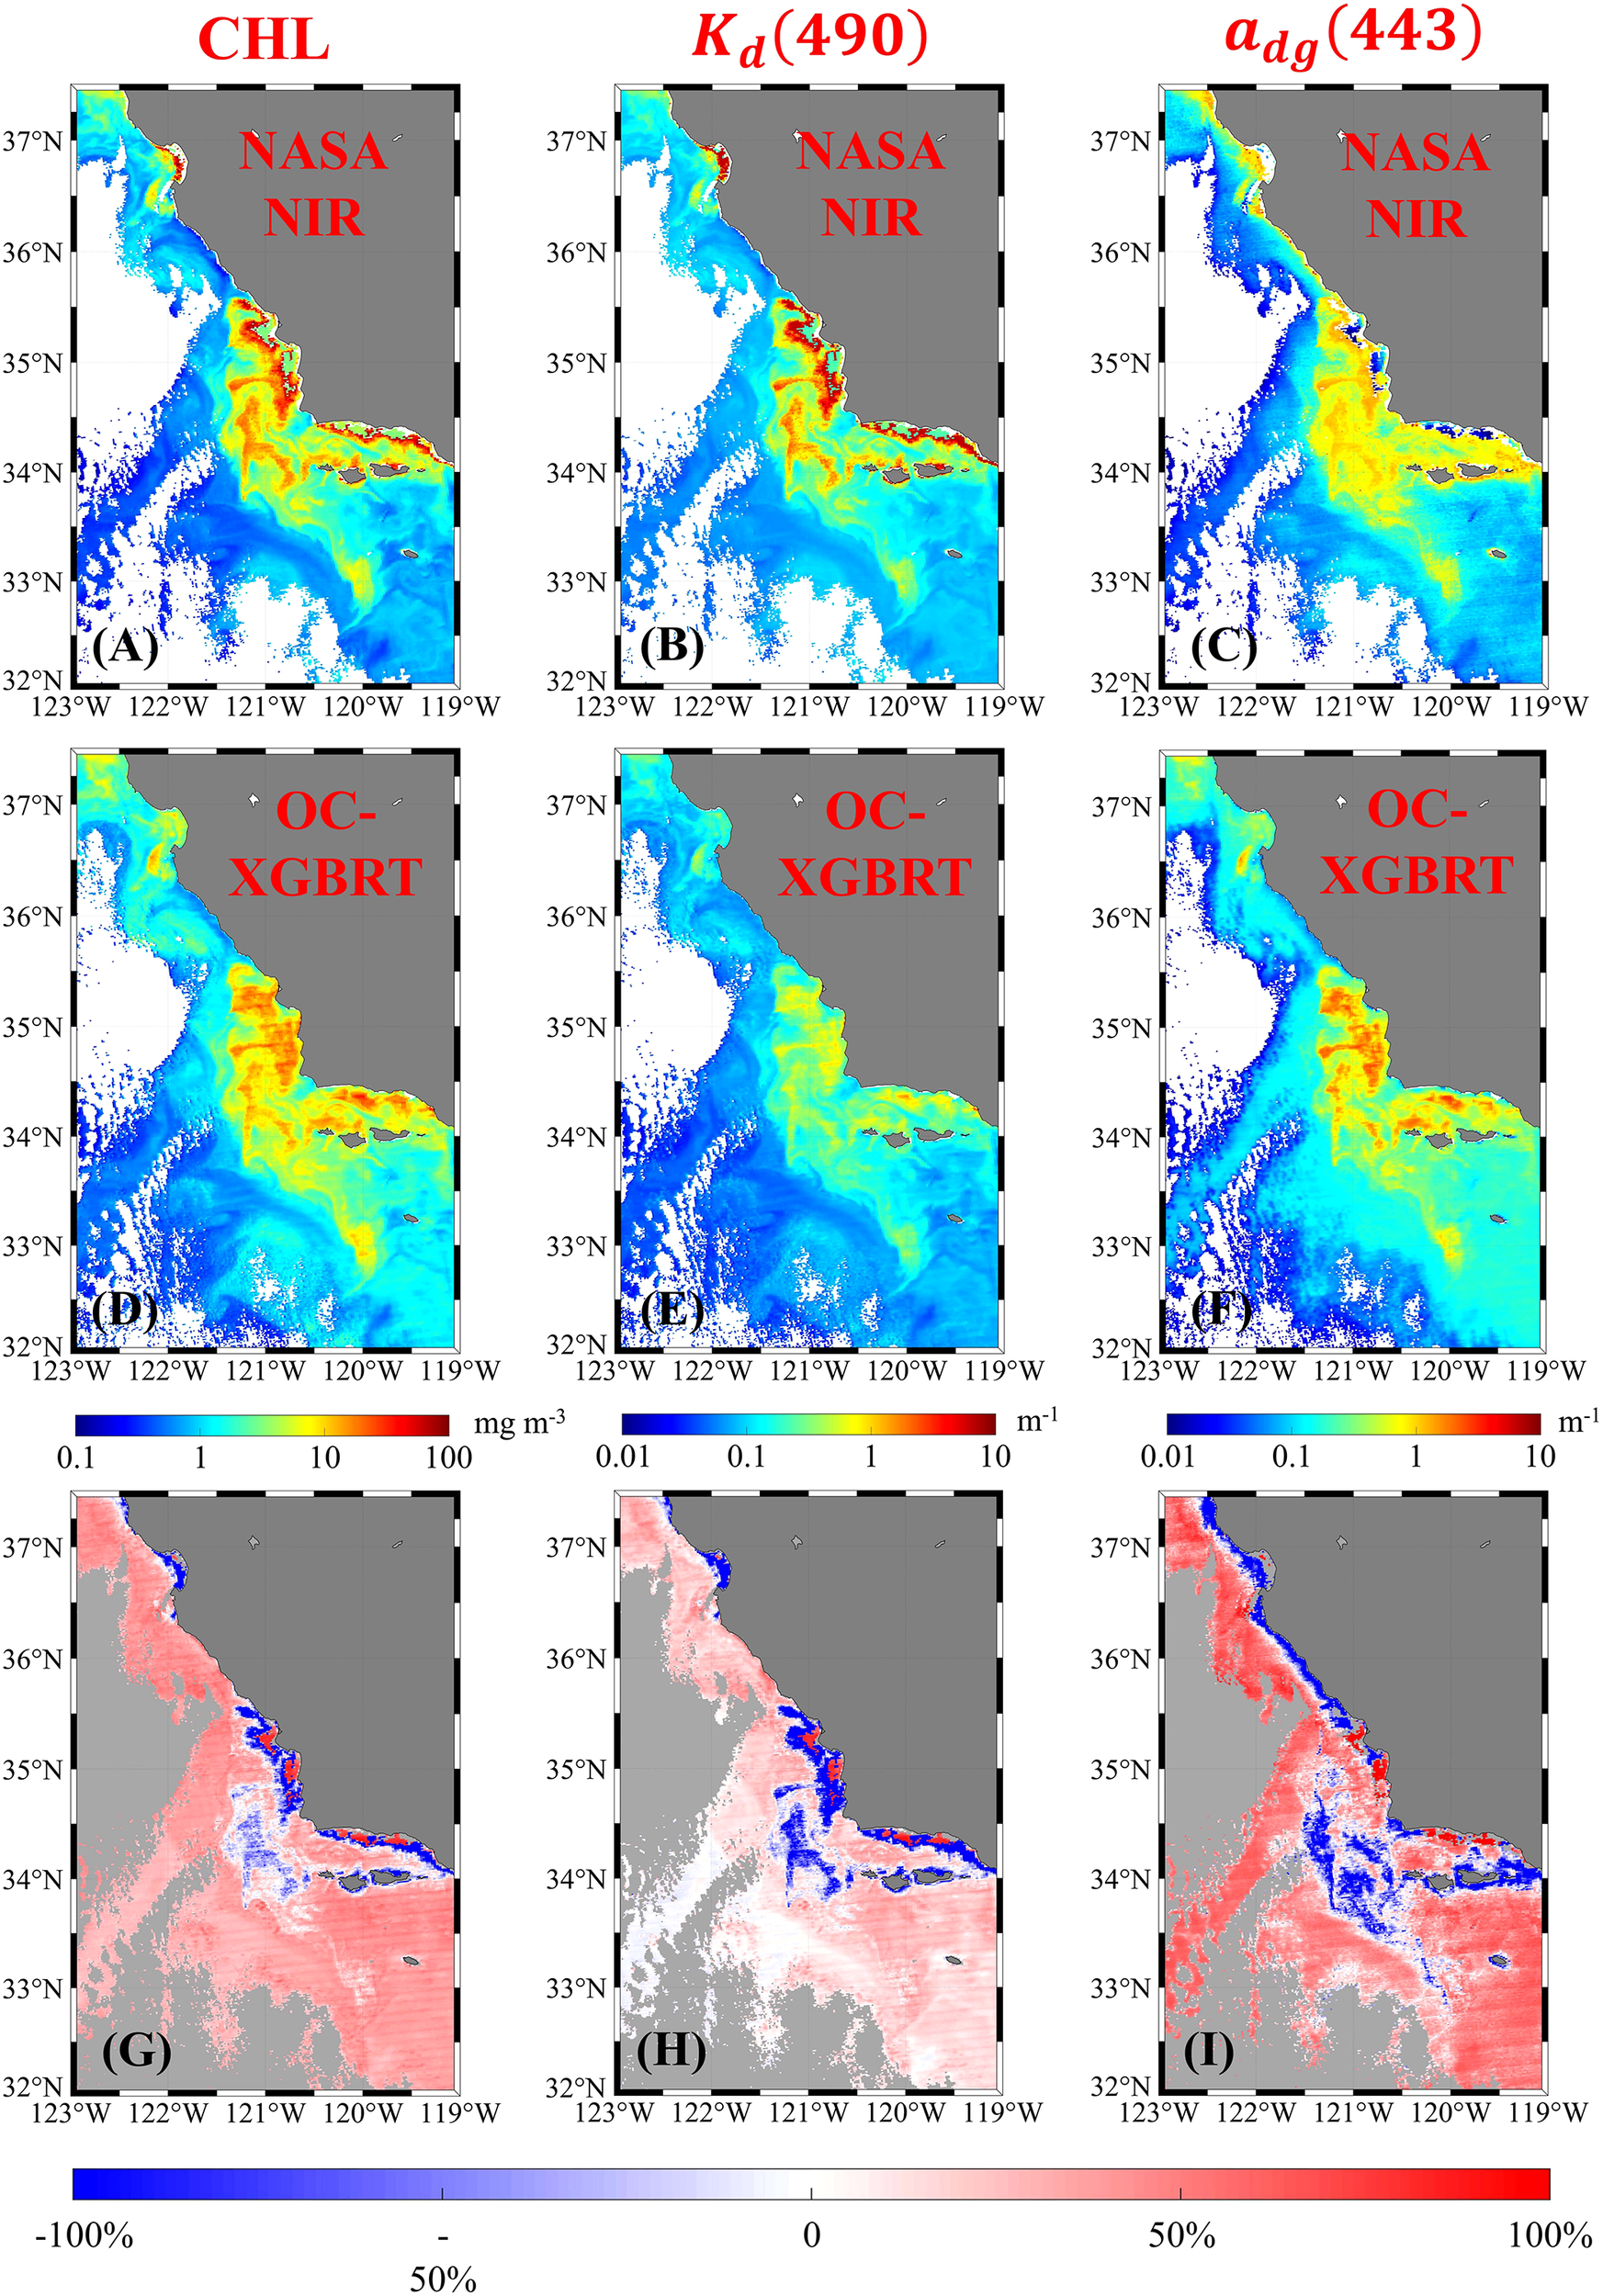
Comparison of CHL, Kd (490), and adg (443) derived from Rrs(λ) retrieval using (A–C) NASA NIR and (D–F) OC-XGBRT algorithms over the West coast of North America at 21:35 UTC on April 19, 2003. Relative percentage deviation of the (G) CHL, (H)Kd (490), and (I)adg (443) between the retrievals from the Rrs(λ) obtained by the NASA NIR and OC-XGBRT algorithms.
Figure 12
Comparison of CHL, Kd (490), and adg (443) derived from Rrs(λ) retrieval using (A–C) NASA NIR and (D–F) OC-XGBRT algorithms over the Black Sea at 10:30 UTC on August 20, 2017. Relative percentage deviation of the (G) CHL, (H)Kd (490), and (I)adg (443) between the retrievals from the Rrs(λ) obtained by the NASA NIR and OC-XGBRT algorithms.
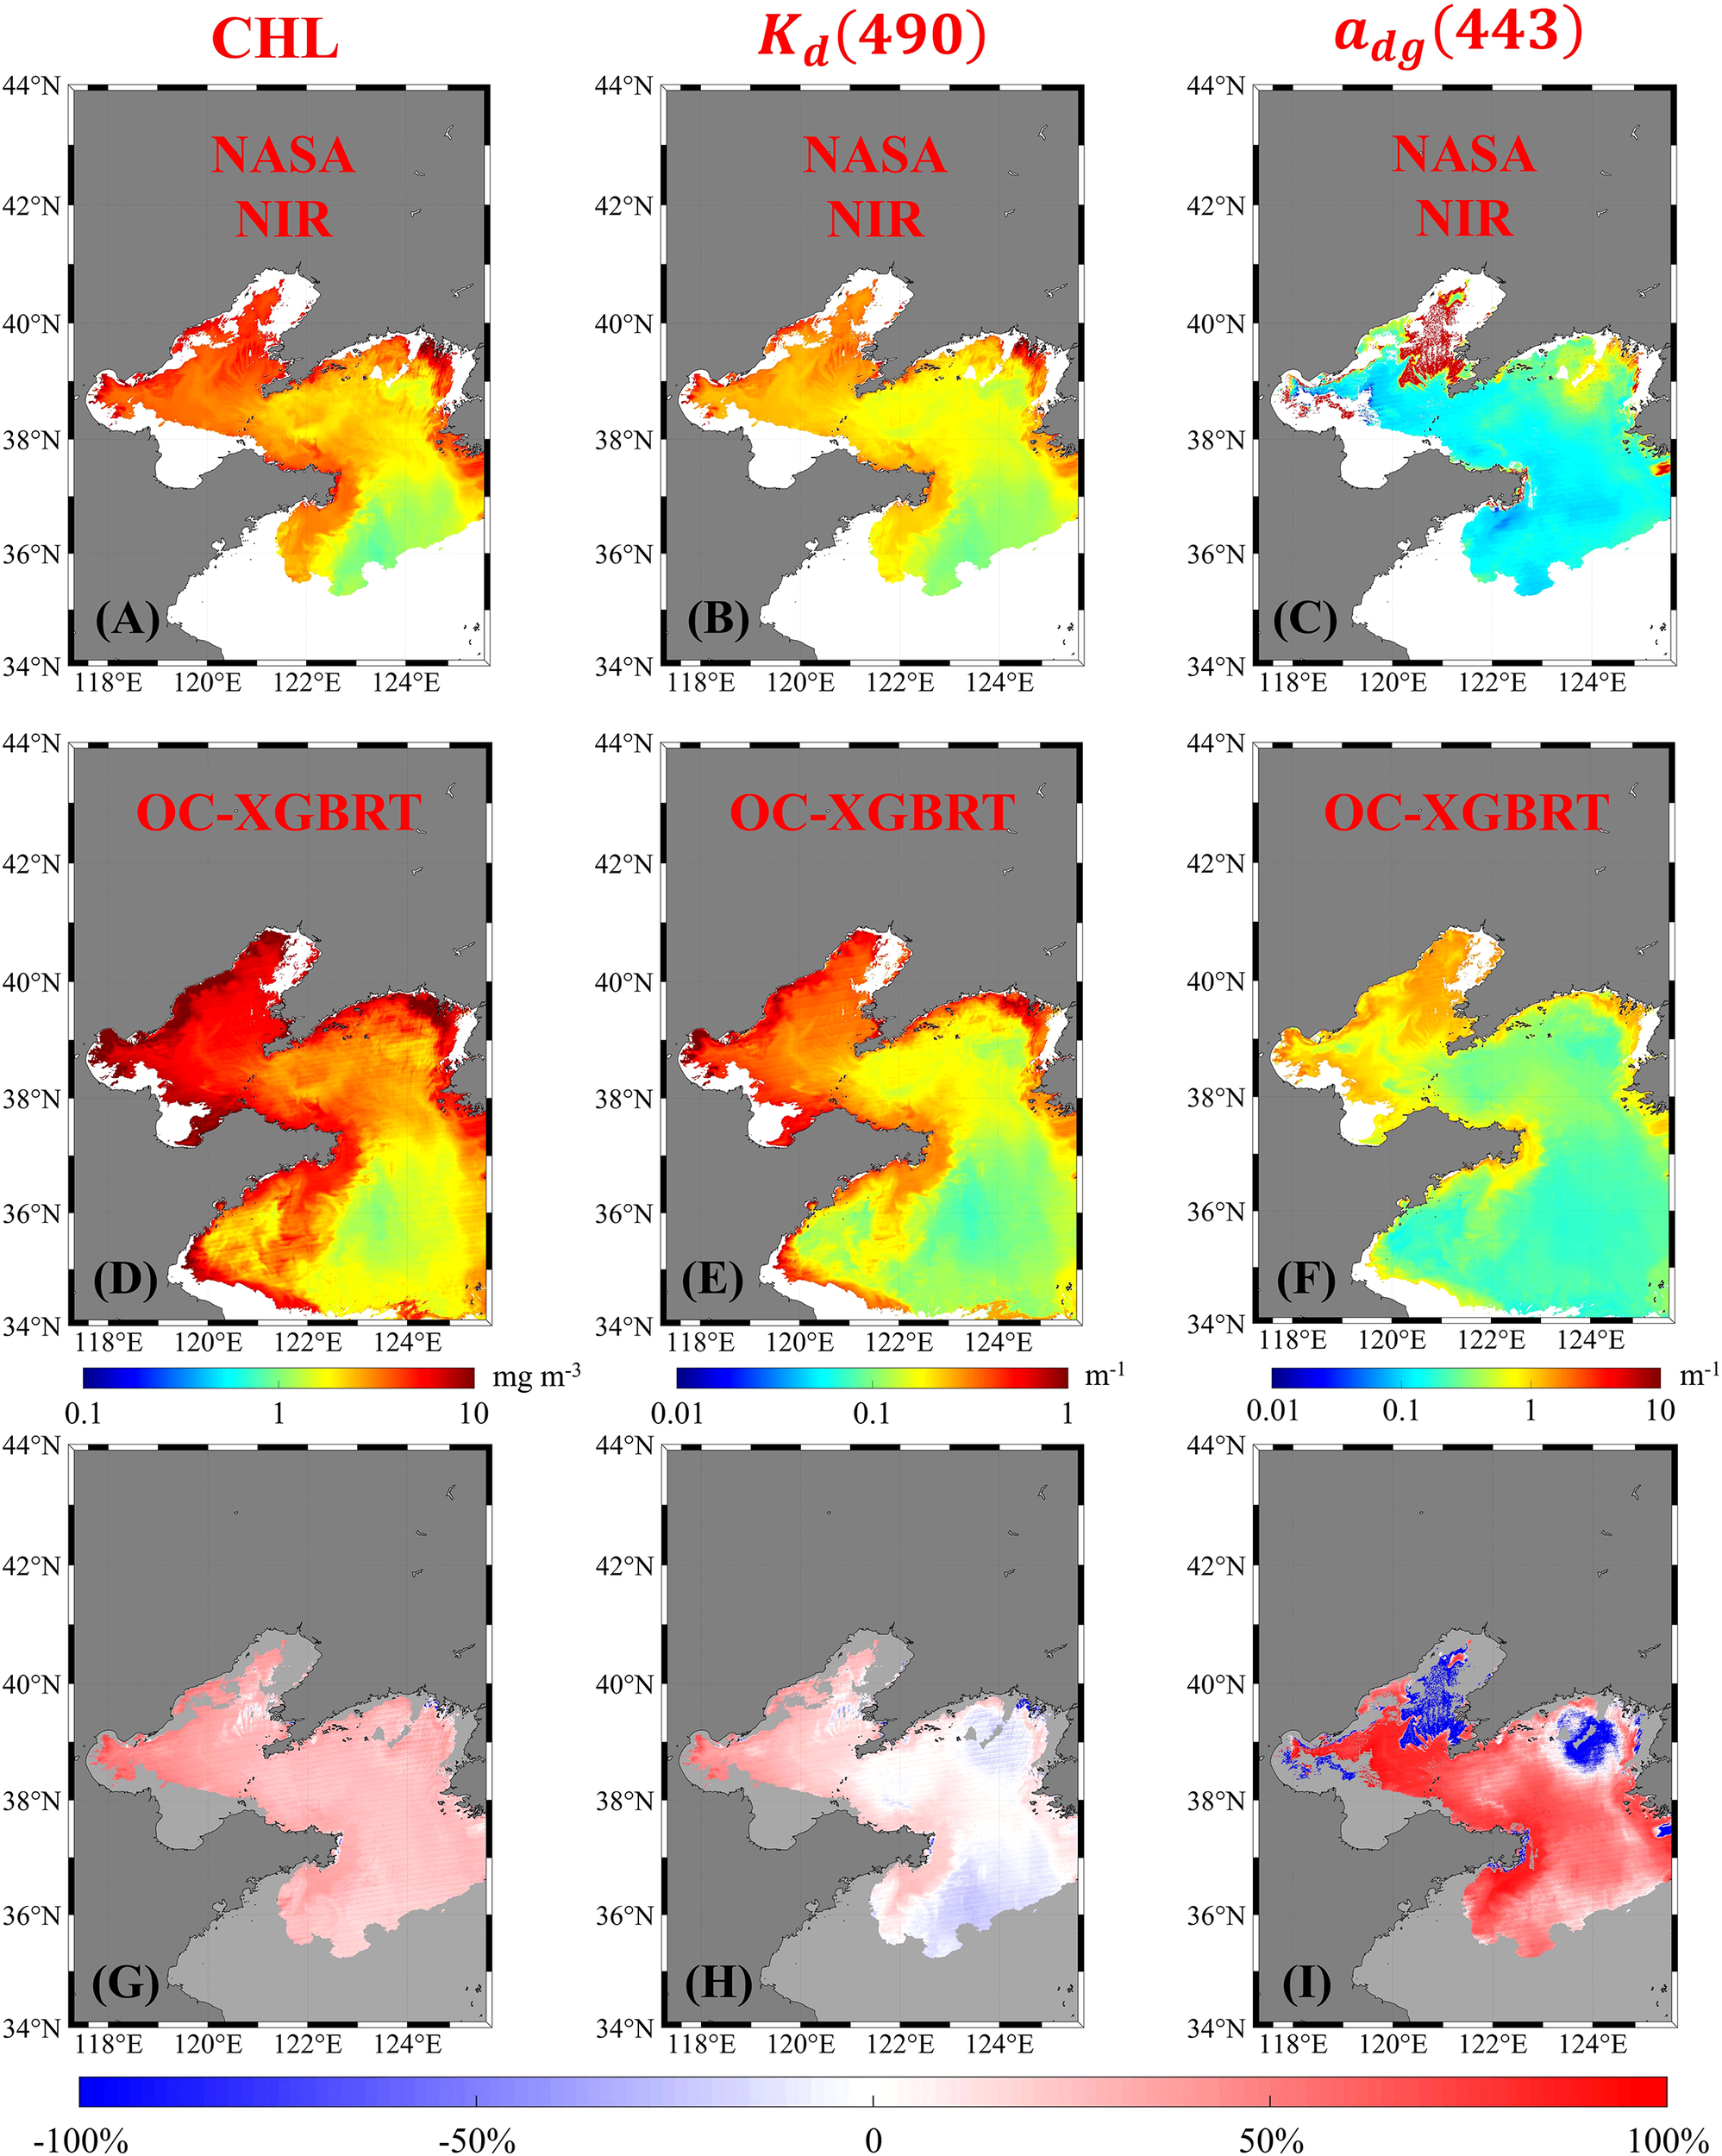
Figure 13
Comparison of CHL, Kd (490), and adg (443) derived from Rrs(λ) retrieval using (A–C) NASA NIR and (D–F) OC-XGBRT algorithms over the Chinese Bohai-Yellow Sea at 05:00 UTC on February 25, 2018. Relative percentage deviation of the (G) CHL, (H)Kd (490), and (I)adg (443) between the retrievals from the Rrs(λ) obtained by the NASA NIR and OC-XGBRT algorithms.
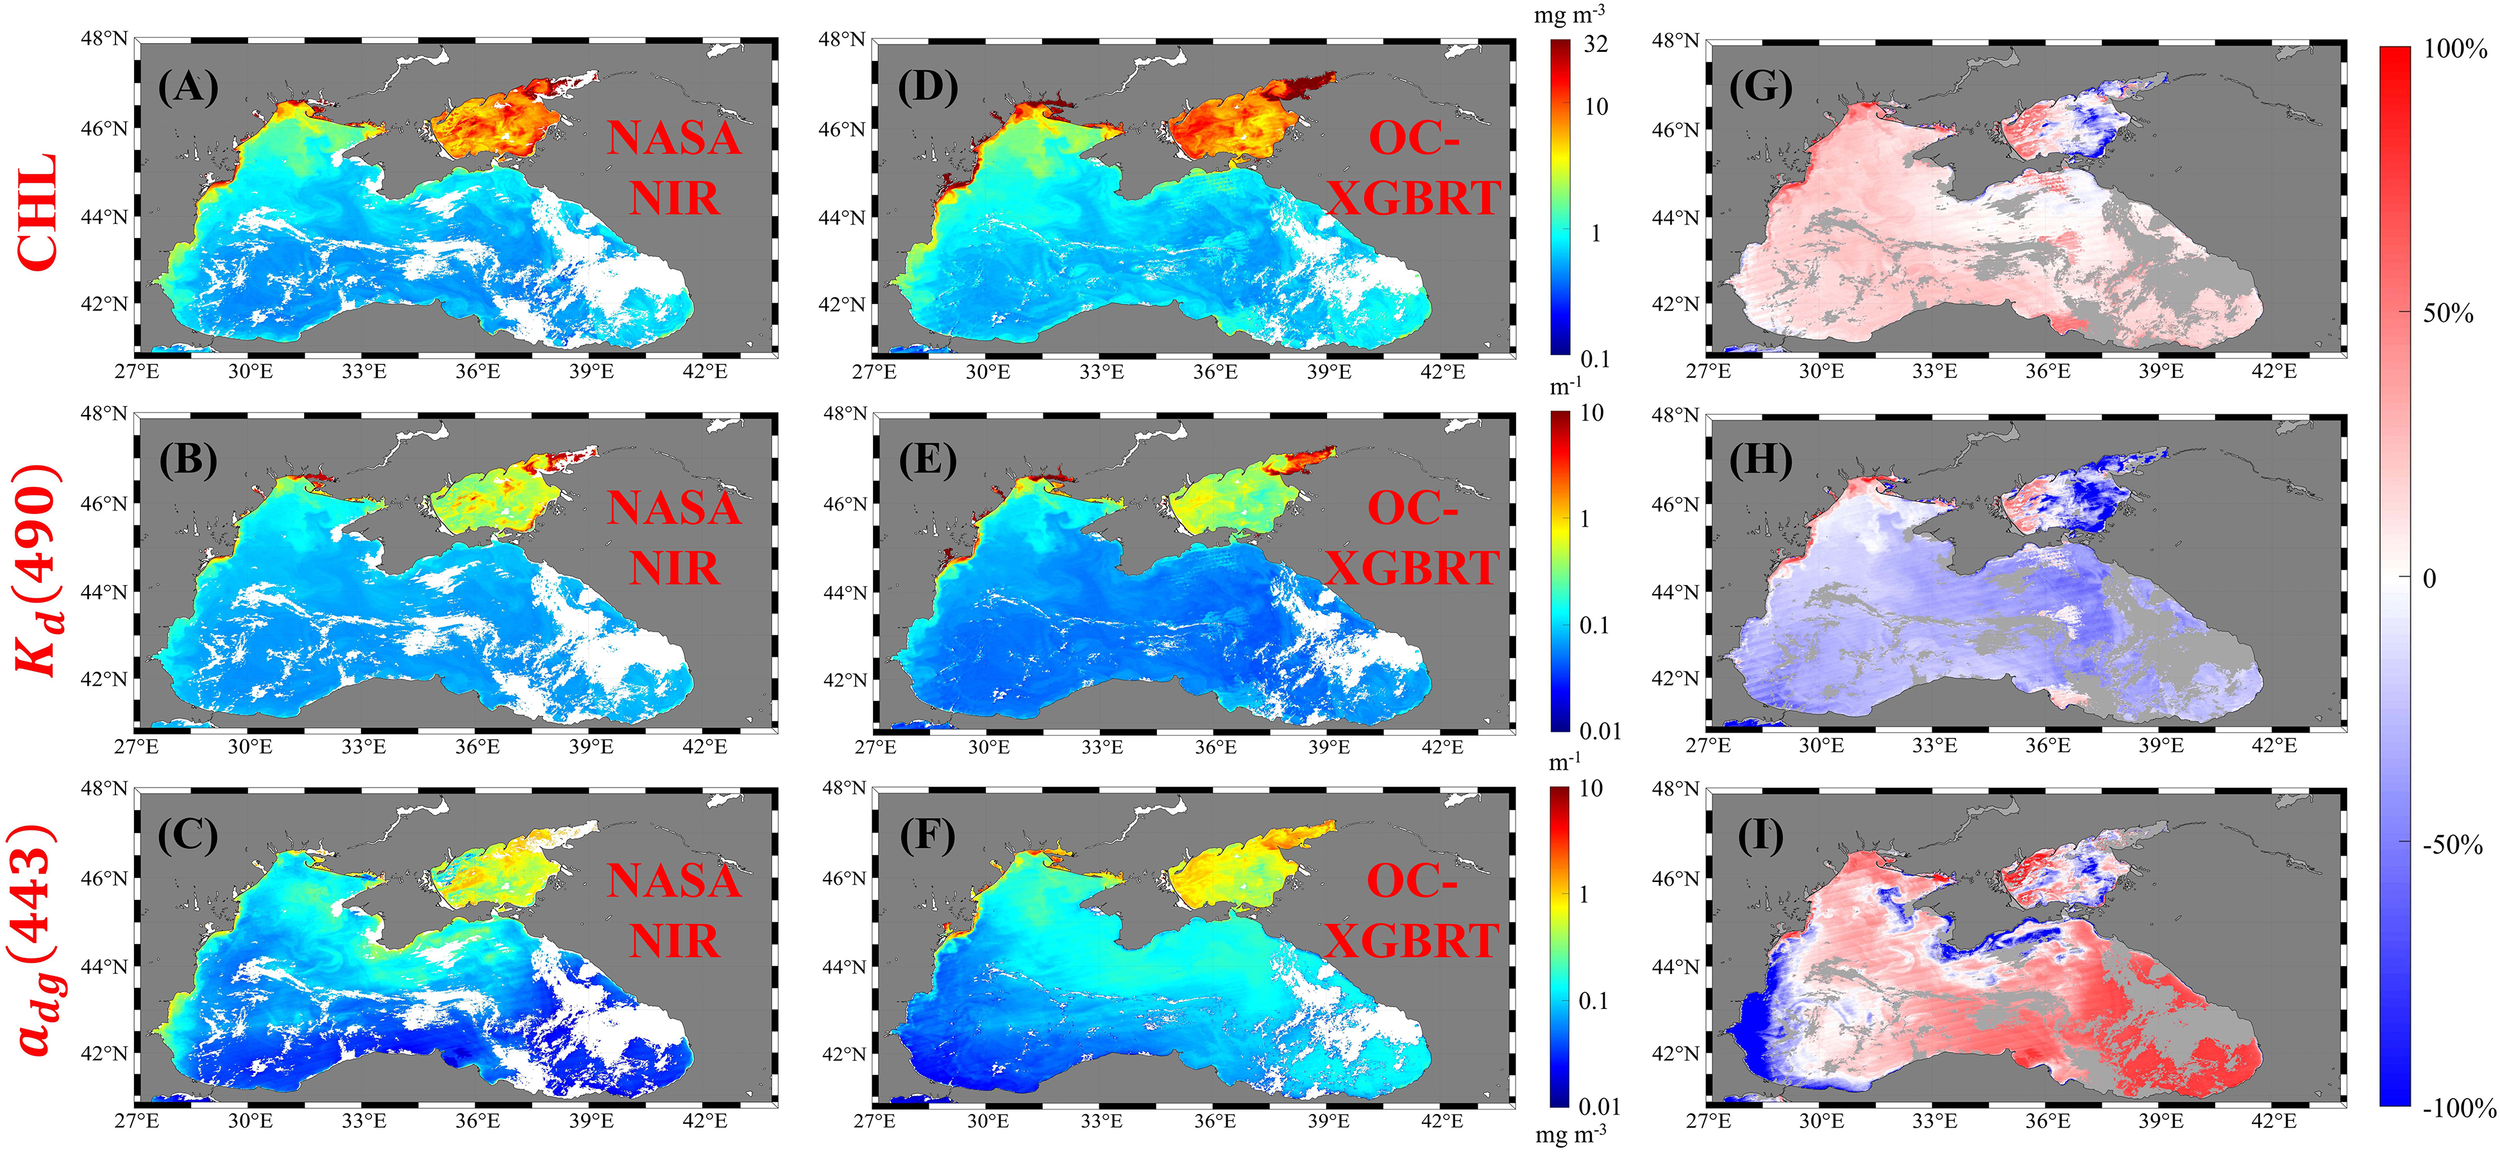
Figure 12 presents the spatial distributions of CHL, , and retrievals using the NASA NIR and OC-XGBRT algorithms over the Black Sea. Notably, the NIR algorithm failed to retrieve valid ocean color parameters in regions affected by high-loading absorbing aerosols, as exemplified by the smoke plume with some white filamentous structures in the central region of the Black Sea (Figure 1D). The overall spatial differences of the three ocean color parameters are not obvious, but exhibit deviations in some local regions. As shown in Figures 12G–I, three ocean color parameters show relatively large deviations ( ranges from -75% to 50%) near the Sea of Azov. Unlike the CHL and underestimated by the NASA NIR algorithm, the NASA-derived may exhibit some overestimation, as indicated by the range of -35% to -5% in Figure 12H. The relatively large retrieval deviations of in the Black Sea are mainly attributed to the regional complex optical properties influenced by river discharge, high CDOM concentrations, and suspended sediments (Korchemkina and Kalinskaya, 2022). Moreover, retrieval was the most affected by the absorbing aerosols among the three parameters mainly due to the deviations of the (412) and (443).
Figure 13 compares the CHL, , and retrievals between the NASA NIR and OC-XGBRT algorithms in the Chinese Bohai-Yellow Sea. The spatial patterns of CHL and derived by the NASA NIR are basically consistent with the those of the OC-XGBRT algorithm, and the deviations between the two algorithms are within 25%. Similar to the previous cases, the spatial coverage of the ocean color products retrieved by OC-XGBRT has greatly improved compared to that of the NASA NIR algorithm. Furthermore, the ocean color parameters retrieved by the NASA NIR are generally underestimated in most regions of the Chinese Bohai-Yellow Sea, especially for the retrieval of ( is up to 70%). Different from the NASA NIR algorithm, the OC-XGBRT algorithm can effectively avoid the abnormally elevated (over 9 m-1) in the Bohai Sea and northern Yellow Sea, thereby obtaining more stable and reliable ocean color satellite products.
4 Discussion
This study applied the OC-XGBRT AC and traditional retrieval algorithms to derive the ocean color parameters over the five typical coastal regions and validated their accuracy in the presence of absorbing aerosols. The application results presented in Figures 5-13 indicate that the combination of the OC-XGBRT AC and traditional retrieval algorithms have ability to achieve higher accuracy retrieval of ocean color parameters under the condition of absorbing aerosols. Compared with the NASA NIR AC algorithm, OC-XGBRT has obvious advantages in reflecting their long-term changes characteristics for the CHL, , and . As shown in Figures 7 and 10, the OC-XGBRT retrieval results revealed more extensive regions where the changes are statistically significant (p < 0.05), which is of great significance for analyzing the long-term trends of the aquatic ecosystem. This is mainly attributed to the fact that the OC-XGBRT algorithm can effectively reduce the impact of absorbing aerosols on the AC process, therefore, the retrieval accuracy of (412) and (443) were greatly superior to those of the other AC algorithms (Song et al., 2023).
In particular, the advantages of OC-XGBRT are more pronounced under conditions of high aerosol optical thickness (AOT). As shown in Figure 14, areas with relatively high AOT at 547 nm (AOT(547)) values (more than 0.3) are widely distributed and basically consistent with the dust and smoke plume patterns observed in Figures 1A–E. Larger AOT(547) values indicate stronger aerosol loading, which can more severely affect the accuracy of conventional AC algorithms and introduce greater uncertainties in the retrieval of ocean color parameters. Figure 14F presents the single scattering albedo spectra at the available AERONET sites near this study areas. Aerosols exhibit strong absorption (single scattering albedo is less than or close to 0.9) in these five regions, especially at 440 nm. Compared with the NASA AC algorithm, OC-XGBRT compensated for the missing data under conditions of high AOT-absorbing aerosols, ensuring reliable retrievals even in complex atmospheric environments. As for those ocean color parameters (e.g., ) that do not employ the (λ) at the short blue band in their retrieval algorithms (Morel et al., 2007), the improvement effect of OC-XGBRT on the accuracy is not very obvious (Figure 2), but it can still increase the effective coverage of data (Figures 5, 8, 11–13). By contrast, the CHL and retrievals were more susceptible to interference from the absorbing aerosols mainly due to the dependence of the OCI and QAA algorithms on the (412) and (443) (Lee et al., 2002; Lee et al., 2007; Morel et al., 2007; Hu et al., 2019). Validation results of the CHL and against the AERONET-OC, SeaBASS, and GLORIA measurements (Figures 3, 4) further demonstrated that the (λ) derived by the OC-XGBRT was more suitable to retrieve the ocean color parameters than those of the current AC algorithms (e.g., NASA NIR, POLYMER, and OC-SMART) under the complex atmospheric conditions containing absorbing aerosols. While an R2 range of 0.4–0.5 (Figures 3, 4) seems modest for standard ocean color applications, it is reasonable under the challenging absorbing aerosol conditions, which substantially limit retrieval accuracy. In addition, the OC-XGBRT AC model has ability to implicitly identify the sub-types of absorbing aerosols through large-scale radiative transfer simulation covering various regions and atmospheric conditions (Song et al., 2023). The improvement in retrieval accuracy across the regions with different absorbing aerosol characteristics (e.g., dust- and smoke-dominated areas) demonstrates that the model effectively accounts for such variability. As shown in Supplementary Figure S4, dust, smoke, urban, and maritime aerosols were classified by OC-XGBRT model over the West coast of North Africa, Persian Gulf, West coast of North America, Black Sea, and Chinese Bohai and Yellow Seas, respectively. Combined with single scattering albedo (below 0.9) in Figure 14F, OC-XGBRT model can basically accurately identify the waters with absorbent aerosols. The consistent performance improvement of OC-XGBRT across these regions suggests that the model effectively learned region-specific aerosol optical properties through its training dataset, thereby enhancing the retrieval accuracy of the ocean color products.
Figure 14
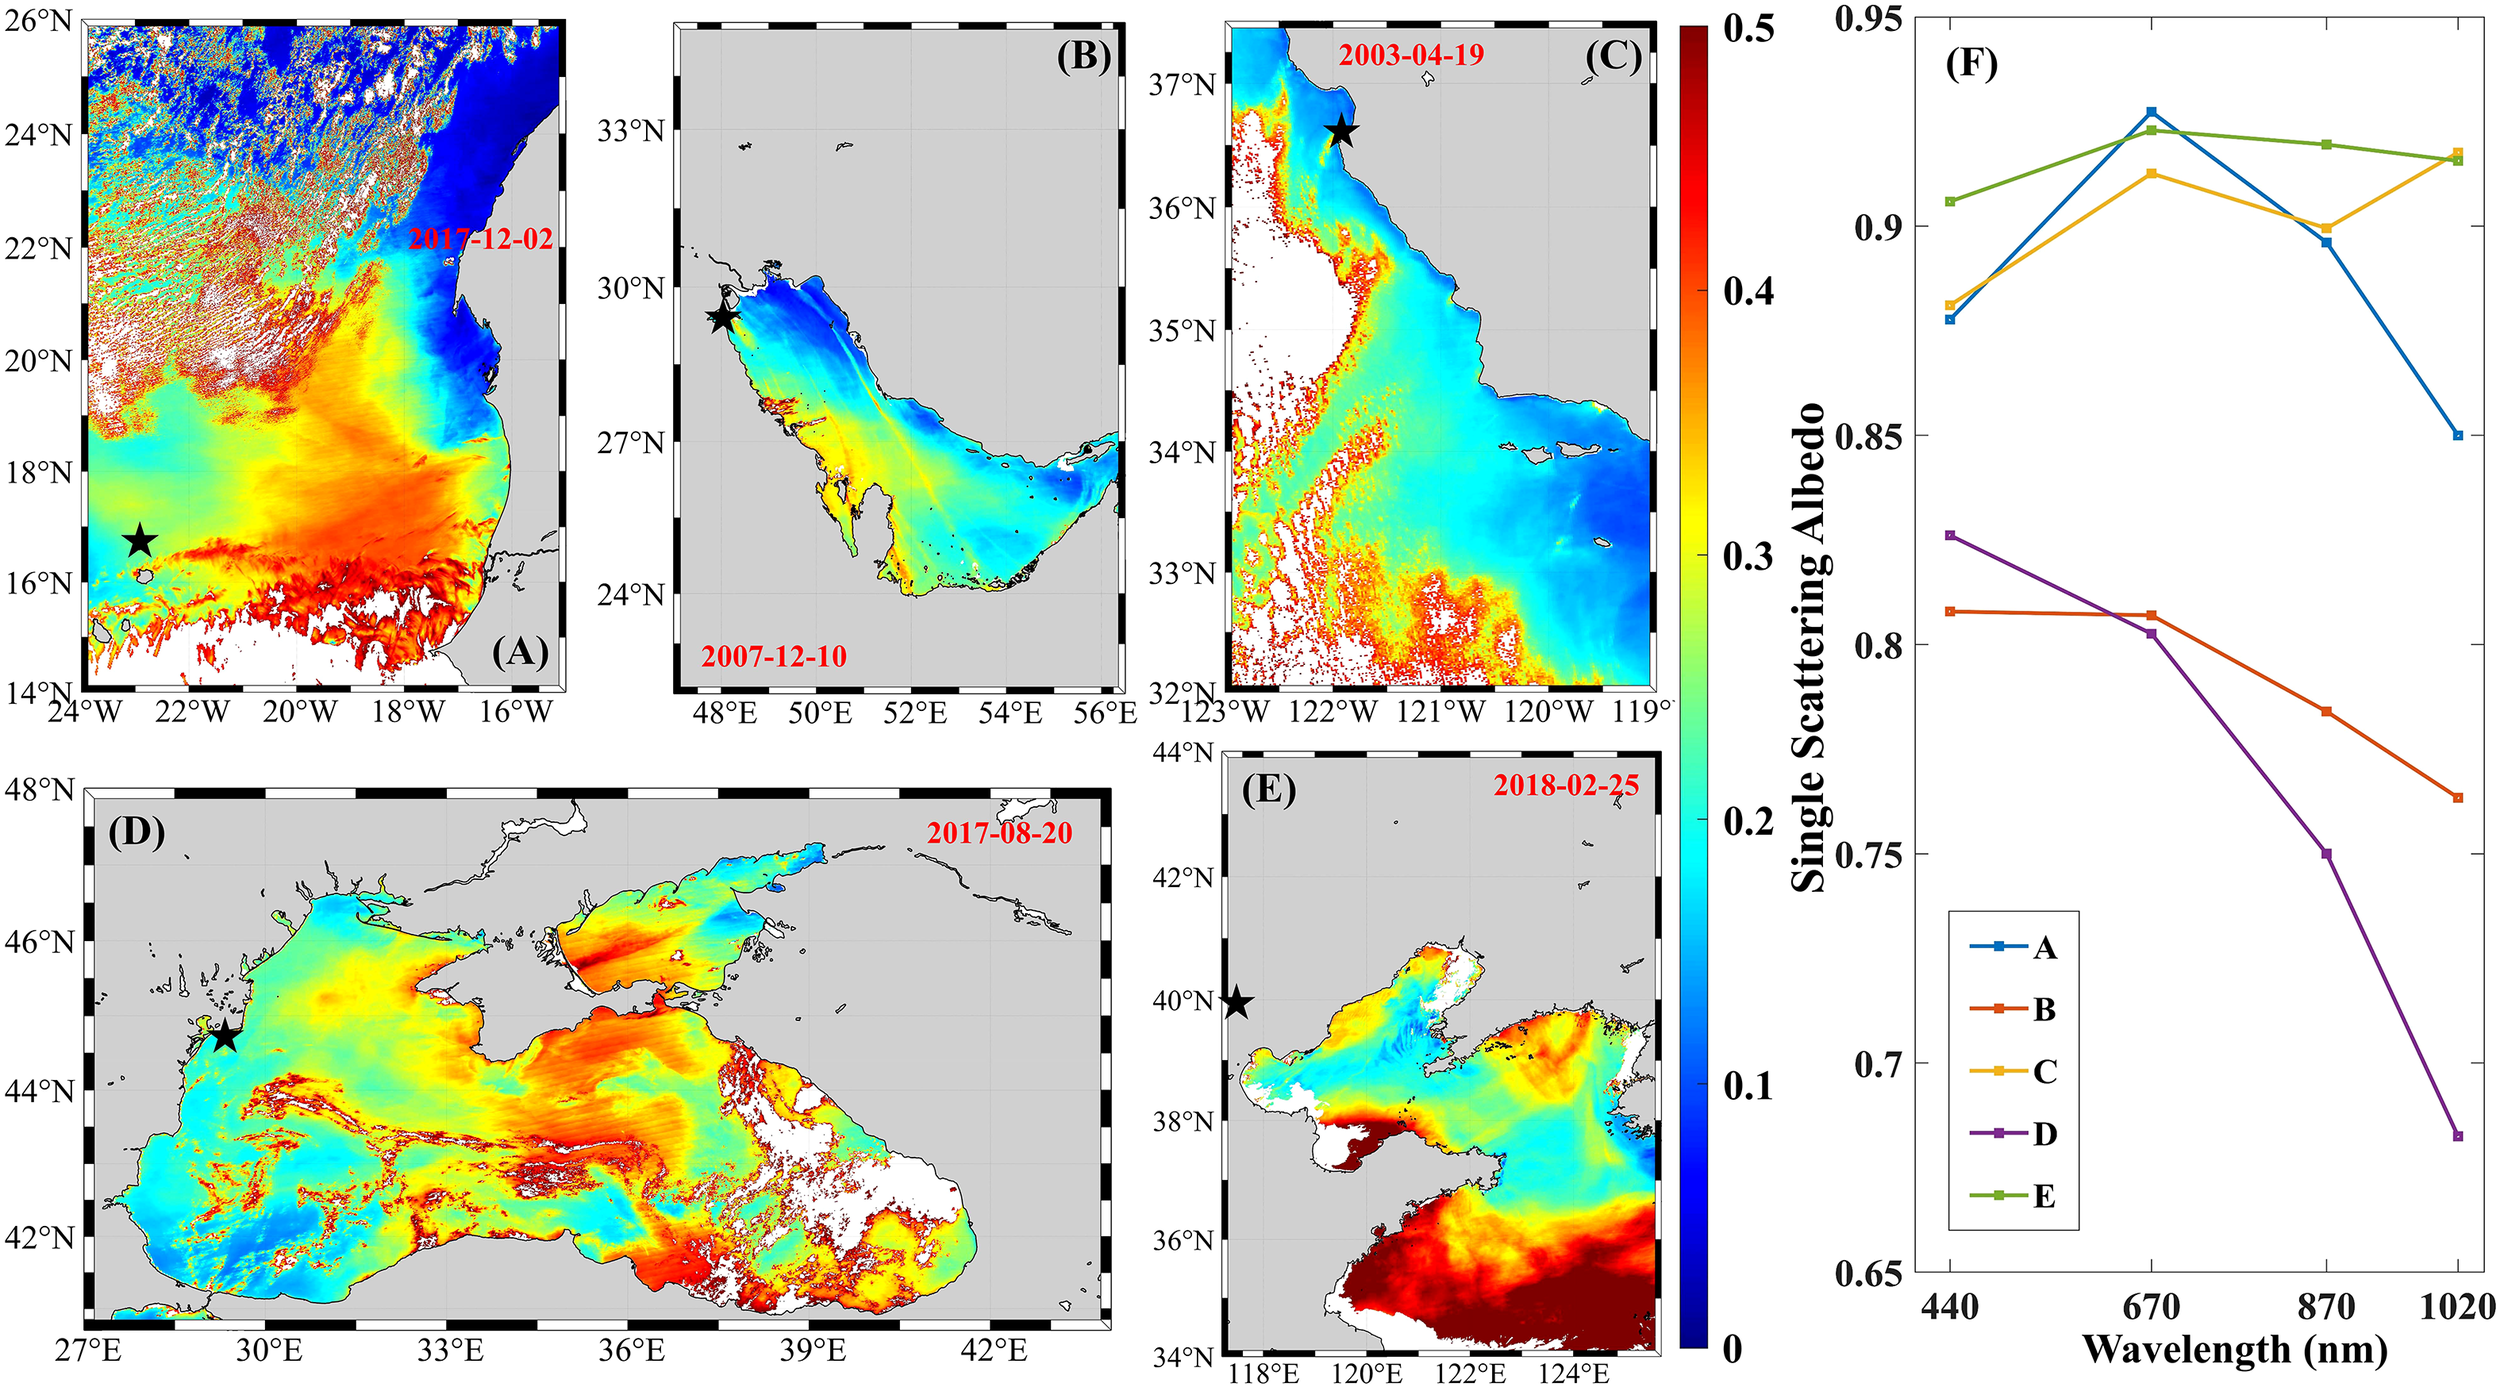
Spatial distributions of AOT at 547 nm (AOT(547)) over the (A) West coast of North Africa, (B) Persian Gulf, (C) West coast of North America, (D) Black Sea, and (E) Chinese Bohai and Yellow Seas, respectively, corresponds to the true color images in Figures 1A–E. (F) Single scattering albedo spectra in the AERONET sites marked with black stars in (A–E).
Recent studies have made progress in improving atmospheric correction under the conditions of absorbing aerosol. Zhao et al. (2023) established global gridded aerosol models for AC over inland and nearshore coastal waters, revealing substantial spatial and seasonal variability in the optical properties of absorbing aerosols (Zhao et al., 2023). On this basis, Lv et al. (2024) further validated and applied these aerosol models across multiple satellites, demonstrating their effectiveness in reducing the overcorrection caused by absorbing aerosols and improved AC accuracy (Lv et al., 2024). Li et al. (2025) developed an AC algorithm named ACA-SIM, using satellite–in situ matchups and neural networks to capture sensor-specific effects and diverse water and aerosol optical conditions, outperforming NASA NIR and OC-SMART AC algorithms in turbid and absorbing aerosol-affected waters (Li et al., 2025). Wang et al. (2018) developed the (λ) enhancement method with great effectiveness at short blue bands and was integrated into the standard AC (Wang and Jiang, 2018). However, their approach did not consider the vertical distribution of absorbing aerosols in the radiative transfer simulation, whereas OC-XGBRT model incorporated this effect, thereby improving retrieval accuracy in the presence of absorbing aerosols. Moreover, this study achieved higher retrieval accuracy (with an MAPD more than ~ 64%) for CHL and in the presence of absorbing aerosols that was basically comparable to the performance of previous studies in turbid coastal waters (Komick et al., 2009; Betancur-Turizo et al., 2018), despite the significant challenge posed by the complex atmospheric conditions. Thus, our results confirmed that the OC-XGBRT AC algorithm offered a robust enhancement in ocean color retrievals under the conditions of absorbing aerosols, particularly for key biogeochemical parameters ( and CHL) that are highly sensitive to the blue wavelength signals (Lee et al., 2007; Hu et al., 2019). The performance of OC-XGBRT algorithm underscores the importance of developing aerosol models that explicitly account for the vertical structure and optical properties of absorbing aerosols (Song et al., 2020; Song et al., 2022), moving beyond the limitations of traditional methods that rely on the NIR/SWIR black-pixel assumptions (Gordon and Wang, 1994; Gordon, 1997; Wang, 2010).
Nevertheless, future refinements to the OC-XGBRT AC algorithm could address several key challenges. Although the OC-XGBRT substantially improves ocean color retrievals in the presence of absorbing aerosols, its accuracy may still be constrained in extreme aerosol loading events (e.g., intense dust outbreaks) or in highly turbid coastal waters where the optical complexity of atmosphere and water column is exceptionally high. Additionally, as the OC-XGBRT AC algorithm was trained on the radiative transfer simulations, its application to the conditions not well-represented in training dataset (e.g., systematic noise) may introduce uncertainties (Kabir et al., 2020). Future work will focus on integrating more in situ data from diverse coastal regions to further refine and validate the model, and we will expand the approach for application to the latest satellite sensors, such as the PACE-OCI, which offers enhanced spectral capabilities. Despite these limitations, our findings of this study have practical implications for the long-term monitoring of marine ecosystems. The improved accuracy and expanded spatial coverage of ocean color products enable more confident trend analyses in ecologically sensitive coastal regions, thereby further enhancing our understanding of the impacts of dust and smoke aerosols on marine phytoplankton productivity, thus supporting more insightful decisions for coastal management and global climate change research.
5 Conclusion
In this study, the OC-XGBRT AC algorithm was employed to retrieve the CHL, , and and improved the accuracy under complex atmospheric conditions with strongly absorbing aerosols. Validation against in situ measurements demonstrated that the OC-XGBRT outperformed other common AC algorithms, including NASA NIR, OC-SMART, and POLYMER, with higher R2 values (more than 0.45) and lower RMSE and MAPD (less than 63.7%). Applications in five representative regions affected by absorbing aerosols, including the west coast of North Africa, Persian Gulf, west coast of North America, Black Sea, and Chinese Bohai-Yellow Sea, consistently showing great enhancement in the spatial coverage of valid data. Our study significantly decreased the deviation of retrieval (R2, RMSE, and MAPD are 0.45, 0.08 m-1, and 63.7%, respectively), and also moderately improved CHL (RMSE decreased from 9.2 mg m-3 to 6.3 mg m-3) and (RMSE decreased from 1.04 m-1 to 0.82 m-1). More importantly, our study is capable of conducting a statistically robust analysis of the long-term trend (2003–2022), with an increased significance levels (p < 0.05) and stronger spatial consistency. Moreover, the absorbing aerosols affected the three parameters to different extents, with being most sensitive, followed by CHL, while was least impacted, consistent with the different dependence of their retrieval algorithms on the short blue band. Based on the integrated framework, the accuracy and continuity of the satellite ocean color products were effectively enhanced, enabling operational and long-term assessment of aquatic ecosystems in complex environments containing absorbing aerosols.
Statements
Data availability statement
The original contributions presented in the study are included in the article/Supplementary Material. Further inquiries can be directed to the corresponding author.
Author contributions
ZS: Conceptualization, Data curation, Methodology, Software, Validation, Writing – original draft. WM: Funding acquisition, Resources, Supervision, Writing – review & editing. FG: Data curation, Software, Validation, Writing – review & editing. QN: Formal Analysis, Funding acquisition, Writing – review & editing. ZL: Funding acquisition, Investigation, Writing – original draft. XD: Funding acquisition, Resources, Writing – review & editing. YJ: Investigation, Project administration, Writing – original draft. YZ: Writing – review & editing. XZ: Supervision, Writing – review & editing.
Funding
The author(s) declared that financial support was received for this work and/or its publication. This work was supported by the Natural Science Foundation of Fujian Province (Grants #2021H0026, #2025J011276, #2024J011194, and #2023J011427), and the Natural Resources Science and Technology Innovation Project of Fujian Province (Grants # KY-030000-04-2025-022).
Acknowledgments
We gratefully acknowledge NASA for providing MODIS-Aqua remote sensing data and thank the PIs of the AERONET-OC sites used in this study (Alexander Gilerson, Bill Gibson, Brent Holben, Burton Jones, Dimitry Van der Zande, Giuseppe Zibordi, Hak-Yeol You, Heidi Sosik, Hui Feng, Jae-Seo Shim, Joo-Hyung Ryu, Kohei Arai, Matthew Ragan, Menghua Wang, Nima Pahlevan, Rodney Forster, Sherwin Ladner, Steve Ruberg, and Tim Moore) and AERONET team for their extensive efforts in maintaining the network and running the sites. We thank NASA OBPG for developing the SeaDAS software package and processing the AERONET-OC and SeaBASS validation datasets. We also acknowledge Moritz K. Lehmann for providing GLORI measurements.
Conflict of interest
The author(s) declared that this work was conducted in the absence of any commercial or financial relationships that could be construed as a potential conflict of interest.
Generative AI statement
The author(s) declared that generative AI was not used in the creation of this manuscript.
Any alternative text (alt text) provided alongside figures in this article has been generated by Frontiers with the support of artificial intelligence and reasonable efforts have been made to ensure accuracy, including review by the authors wherever possible. If you identify any issues, please contact us.
Publisher’s note
All claims expressed in this article are solely those of the authors and do not necessarily represent those of their affiliated organizations, or those of the publisher, the editors and the reviewers. Any product that may be evaluated in this article, or claim that may be made by its manufacturer, is not guaranteed or endorsed by the publisher.
Supplementary material
The Supplementary Material for this article can be found online at: https://www.frontiersin.org/articles/10.3389/fmars.2025.1714670/full#supplementary-material
References
1
Agbor E. Zhang X. Kumar A. (2014). A review of biomass co-firing in North America. Renewable Sustain. Energy Rev.40, 930–943. doi: 10.1016/j.rser.2014.07.195
2
Ahmad Z. Franz B. A. McClain C. R. Kwiatkowska E. J. Werdell J. Shettle E. P. et al . (2010). New aerosol models for the retrieval of aerosol optical thickness and normalized water-leaving radiances from the SeaWiFS and MODIS sensors over coastal regions and open oceans. Appl. optics49, 5545–5560. doi: 10.1364/AO.49.005545
3
Banks J. R. Brindley H. E. Stenchikov G. Schepanski K. (2017). Satellite retrievals of dust aerosol over the Red Sea and the Persian Gulf (2005–2015). Atmospheric Chem. Phys.17, 3987–4003. doi: 10.5194/acp-17-3987-2017
4
Betancur-Turizo S. P. González-Silvera A. Santamaría-del-Ángel E. Tan J. Frouin R. (2018). Evaluation of semi-analytical algorithms to retrieve particulate and dissolved absorption coefficients in Gulf of California optically complex waters. Remote Sens.10, 1443. doi: 10.3390/rs10091443
5
Bezberdaya L. Chernitsova O. Lychagin M. Aseeva E. Tkachenko A. Kasimov N. (2024). Pollution of a Black Sea coastal city: potentially toxic elements in urban soils, road dust, and their PM10 fractions. J. Soils Sediments24, 3485–3506. doi: 10.1007/s11368-024-03893-9
6
Dubovik O. Sinyuk A. Lapyonok T. Holben B. N. Mishchenko M. Yang P. et al . (2006). Application of spheroid models to account for aerosol particle nonsphericity in remote sensing of desert dust. J. Geophysical Research: Atmospheres111, D11208. doi: 10.1029/2005JD006619
7
Duforêt L. Frouin R. Dubuisson P. (2007). Importance and estimation of aerosol vertical structure in satellite ocean-color remote sensing. Appl. Optics46, 1107–1119. doi: 10.1364/AO.46.001107
8
Fan Y. Li W. Chen N. Ahn J. H. Park Y. J. Kratzer S. et al . (2021). OC-SMART: A machine learning based data analysis platform for satellite ocean color sensors. Remote Sens. Environ.253, 112236. doi: 10.1016/j.rse.2020.112236
9
Gordon H. R. (1997). Atmospheric correction of ocean color imagery in the Earth Observing System era. J. Geophysical Research: Atmospheres102, 17081–17106. doi: 10.1029/96JD02443
10
Gordon H. R. Clark D. K. Mueller J. L. Hovis W. A. (1980). Phytoplankton pigments from the Nimbus-7 Coastal Zone Color Scanner: comparisons with surface measurements. Science210, 63–66. doi: 10.1126/science.210.4465.63
11
Gordon H. R. Du T. Zhang T. (1997). Remote sensing of ocean color and aerosol properties: resolving the issue of aerosol absorption. Appl. Optics36, 8670–8684. doi: 10.1364/AO.36.008670
12
Gordon H. R. Wang M. (1994). Retrieval of water-leaving radiance and aerosol optical thickness over the oceans with SeaWiFS: a preliminary algorithm. Appl. Optics33, 443–452. doi: 10.1364/AO.33.000443
13
Hu C. Feng L. Lee Z. Franz B. A. Bailey S. W. Werdell P. J. et al . (2019). Improving satellite global chlorophyll a data products through algorithm refinement and data recovery. J. Geophysical Research: Oceans124, 1524–1543. doi: 10.1029/2019JC014941
14
Hu C. Lee Z. Franz B. (2012). Chlorophyll algorithms for oligotrophic oceans: A novel approach based on three-band reflectance difference. J. Geophysical Research: Oceans117, C01011. doi: 10.1029/2011JC007395
15
Jish Prakash P. Stenchikov G. Kalenderski S. Osipov S. Bangalath H. (2015). The impact of dust storms on the Arabian Peninsula and the Red Sea. Atmospheric Chem. Phys.15, 199–222. doi: 10.5194/acp-15-199-2015
16
Joshi I. D. D’Sa E. J. (2020). Optical properties using adaptive selection of NIR/SWIR reflectance correction and quasi-analytic algorithms for the MODIS-aqua in estuarine-ocean continuum: application to the Northern Gulf of Mexico. IEEE Trans. Geosci. Remote Sens.58, 6088–6105. doi: 10.1109/TGRS.2020.2973157
17
Kabir S. Leigh L. Helder D. (2020). Vicarious methodologies to assess and improve the quality of the optical remote sensing images: A critical review. Remote Sens.12, 4029. doi: 10.3390/rs12244029
18
Komick N. M. Costa M. P. F. Gower J. (2009). Bio-optical algorithm evaluation for MODIS for western Canada coastal waters: An exploratory approach using in situ reflectance. Remote Sens. Environ.113, 794–804. doi: 10.1016/j.rse.2008.12.005
19
Korchemkina E. N. Kalinskaya D. V. (2022). Algorithm of Additional correction of level 2 remote sensing reflectance data using modelling of the optical properties of the Black Sea waters. Remote Sens.14, 831. doi: 10.3390/rs14040831
20
Lathif S. A. Alshehhi M. R. (2024). Sensitivity assessment of atmospheric corrections for clear and moderately turbid optical waters. IEEE J. Selected Topics Appl. Earth Observations Remote Sens.18, 1174–1195. doi: 10.1109/JSTARS.2024.3492322
21
Lee Z. P. (2006). Remote Sensing of Inherent Optical Properties: Fundamentals, Tests of Algorithms, and Applications. ( International Ocean Color Coordinating Group (IOCCG)).
22
Lee Z. Carder K. L. Arnone R. A. (2002). Deriving inherent optical properties from water color: a multiband quasi-analytical algorithm for optically deep waters. Appl. optics41, 5755–5772. doi: 10.1364/AO.41.005755
23
Lee Z. Weidemann A. Kindle J. Arnone R. Carder K. L. Davis C. (2007). Euphotic zone depth: Its derivation and implication to ocean-color remote sensing. J. Geophysical Research: Oceans112, C03009. doi: 10.1029/2006JC003802
24
Lehmann M. K. Gurlin D. Pahlevan N. Alikas K. Conroy T. Anstee J. et al . (2023). GLORIA-A globally representative hyperspectral in situ dataset for optical sensing of water quality. Sci. Data10, 100. doi: 10.1038/s41597-023-01973-y
25
Li X. Lee Z. Xie J. Wang T. Zheng L. Wang D. et al . (2025). Atmospheric correction of coastal waters based on satellite-AERONET-OC matchups. J. Remote Sensing.5, 0886. doi: 10.34133/remotesensing.0886
26
Luan K. Cao Z. Shen W. Zhou P. Qiu Z. Wan H. et al . (2024). Application of multiplatform remote sensing data over East Asia Ocean: aerosol characteristics and aerosol types. Environ. Sci. pollut. Res.31, 37175–37195. doi: 10.1007/s11356-024-33458-9
27
Lv J. Feng L. Zhao D. (2024). Validation of global gridded aerosol models in inland/coastal water atmospheric correction for MODIS, VIIRS and landsat. IEEE Trans. Geosci. Remote Sens.62, 1–10. doi: 10.1109/TGRS.2024.3427836
28
McClain C. R. (2009). A decade of satellite ocean color observations. Annu. Rev. Mar. Sci.1, 19–42. doi: 10.1146/annurev.marine.010908.163650
29
McClain C. R. Feldman G. C. Hooker S. B. (2004). An overview of the SeaWiFS project and strategies for producing a climate research quality global ocean bio-optical time series. Deep Sea Res. Part II: Topical Stud. Oceanography51, 5–42. doi: 10.1016/j.dsr2.2003.11.001
30
McClain C. R. Franz B. A. Werdell P. J. (2022). Genesis and evolution of NASA’s satellite ocean color program. Front. Remote Sens.3, 938006. doi: 10.3389/frsen.2022.938006
31
Mitchell B. G. (1994). Coastal zone color scanner retrospective. J. Geophysical Research: Oceans99, 7291–7292. doi: 10.1029/93JC03259
32
Mitchell B. G. Mati K. John W. Malgorzata S. (2003). Determination of spectral absorption coefficients of particles, dissolved material and phytoplankton for discrete. Ocean optics Protoc. satellite ocean color sensor validation4, 39–64.
33
Moore T. S. Campbell J. W. Feng H. (2015). Characterizing the uncertainties in spectral remote sensing reflectance for SeaWiFS and MODIS-Aqua based on global in situ matchup data sets. Remote Sens. Environ.159, 14–27. doi: 10.1016/j.rse.2014.11.025
34
Morel A. Huot Y. Gentili B. Werdell P. J. Hooker S. B. Franz B. A. (2007). Examining the consistency of products derived from various ocean color sensors in open ocean (Case 1) waters in the perspective of a multi-sensor approach. Remote Sens. Environ.111, 69–88. doi: 10.1016/j.rse.2007.03.012
35
O’Reilly J. E. Maritorena S. Mitchell B. G. Siegel D. A. Carder K. L. Garver S. A. et al . (1998). Ocean color chlorophyll algorithms for SeaWiFS. J. Geophysical Research: Oceans103, 24937–24953. doi: 10.1029/98JC02160
36
O’Reilly J. E. Werdell P. J. (2019). Chlorophyll algorithms for ocean color sensors-OC4, OC5 & OC6. Remote Sens. Environ.229, 32–47. doi: 10.1016/j.rse.2019.04.021
37
Pahlevan N. Mangin A. Balasubramanian S. V. Smith B. Alikas K. Arai K. et al . (2021). ACIX-Aqua: A global assessment of atmospheric correction methods for Landsat-8 and Sentinel-2 over lakes, rivers, and coastal waters. Remote Sens. Environ.258, 112366. doi: 10.1016/j.rse.2021.112366
38
Prospero J. M. Ginoux P. Torres O. Nicholson S. E. Gill T. E. (2002). Environmental characterization of global sources of atmospheric soil dust identified with the Nimbus 7 Total Ozone Mapping Spectrometer (TOMS) absorbing aerosol product. Rev. geophysics40, 2–1. doi: 10.1029/2000RG000095
39
Prospero J. M. Mayol-Bracero O. L. (2013). Understanding the transport and impact of African dust on the Caribbean Basin. Bull. Am. Meteorological Soc.94, 1329–1337. doi: 10.1175/BAMS-D-12-00142.1
40
Rast M. Bezy J. L. Bruzzi S. (1999). The ESA Medium Resolution Imaging Spectrometer MERIS a review of the instrument and its mission. Int. J. Remote Sens.20, 1681–1702. doi: 10.1080/014311699212416
41
Salomonson V. V. Barnes W. L. Maymon P. W. Montgomery H. E. Ostrow H. (1989). MODIS: Advanced facility instrument for studies of the Earth as a system. IEEE Trans. Geosci. Remote Sens.27, 145–153. doi: 10.1109/36.20292
42
Shettle E. P. Fenn R. W. (1979). Models for the aerosols of the lower atmosphere and the effects of humidity variations on their optical properties (No. 676). Optical Phys. Division Air Force Geophysics Lab.
43
Shi W. Wang M. (2007). Detection of turbid waters and absorbing aerosols for the MODIS ocean color data processing. Remote Sens. Environ.110, 149–161. doi: 10.1016/j.rse.2007.02.013
44
Shimada M. Oaku H. Mitomi Y. Murakami H. Kawamura H. (2002). Calibration of the ocean color and temperature scanner. IEEE Trans. Geosci. Remote Sens.37, 1484–1495. doi: 10.1109/36.763261
45
Song Z. He X. Bai Y. Dong X. Wang D. Li T. et al . (2023). Atmospheric correction of absorbing aerosols for satellite ocean color remote sensing over coastal waters. Remote Sens. Environ.290, 113552. doi: 10.1016/j.rse.2023.113552
46
Song Z. He X. Bai Y. Wang D. Gong F. Zhu Q. et al . (2022). Effect of the vertical distribution of absorbing aerosols on the atmospheric correction for satellite ocean color remote sensing. IEEE Trans. Geosci. Remote Sens.60, 1–12. doi: 10.1109/TGRS.2022.3151219
47
Song Z. He X. Bai Y. Wang D. Hao Z. Gong F. et al . (2020). Changes and predictions of vertical distributions of global light-absorbing aerosols based on CALIPSO observation. Remote Sens.12, 3014. doi: 10.3390/rs12183014
48
Steinmetz F. Deschamps P. Y. Ramon D. (2011). Atmospheric correction in presence of sun glint: application to MERIS. Optics express19, 9783–9800. doi: 10.1364/OE.19.009783
49
Wang M. (2010). Atmospheric correction for remotely-sensed ocean-color products. Rep. Monogr. Int. Ocean-Color Coordinating Group (IOCCG).
50
Wang M. Jiang L. (2018). Atmospheric correction using the information from the short blue band. IEEE Trans. Geosci. Remote Sens.56, 6224–6237. doi: 10.1109/TGRS.2018.2833839
51
Wang M. Liu X. Tan L. Jiang L. Son S. Shi W. et al . (2013). Impacts of VIIRS SDR performance on ocean color products. J. Geophysical Research: Atmospheres118, 10–347. doi: 10.1002/jgrd.50793
52
Werdell P. J. Bailey S. W. (2005). An improved bio-optical data set for ocean color algorithm development and satellite data product variation. Remote Sens. Environ.98, 122–140. doi: 10.1016/j.rse.2005.07.001
53
Yao Y. Li T. Xu Q. Xing X. Zhu X. Qiu Y. (2025). Evaluation and improvement of ocean color algorithms for chlorophyll-a and diffuse attenuation coefficients in the arctic shelf. Remote Sens.17, 2606. doi: 10.3390/rs17152606
54
Zhang M. Hu C. Barnes B. B. (2019). Performance of POLYMER atmospheric correction of ocean color imagery in the presence of absorbing aerosols. IEEE Trans. Geosci. Remote Sens.57, 6666–6674. doi: 10.1109/TGRS.2019.2907884
55
Zhao D. Feng L. He X. (2023). Global gridded aerosol models established for atmospheric correction over inland and nearshore coastal waters. J. Geophysical Research: Atmospheres128, e2023JD038815. doi: 10.1029/2023JD038815
56
Zibordi G. Mélin F. Berthon J. F. Holben B. Slutsker I. Giles D. et al . (2009). AERONET-OC: a network for the validation of ocean color primary products. J. Atmospheric Oceanic Technol.26, 1634–1651. doi: 10.1175/2009JTECHO654.1
Summary
Keywords
absorbing aerosols, absorption coefficient of detritus and gelbstoff, atmospheric correction, chlorophyll-a concentration, ocean color remote sensing, remote sensing reflectance
Citation
Song Z, Man W, Gong F, Nie Q, Li Z, Du X, Jiang Y, Zeng Y and Zhang X (2026) Improving satellite ocean color remote sensing products under absorbing aerosol conditions. Front. Mar. Sci. 12:1714670. doi: 10.3389/fmars.2025.1714670
Received
28 September 2025
Revised
23 December 2025
Accepted
29 December 2025
Published
22 January 2026
Volume
12 - 2025
Edited by
Maryam Alshehhi, Khalifa University, United Arab Emirates
Reviewed by
Hiroto Higa, Yokohama National University, Japan
Srinivas Kolluru, Florida Atlantic University, United States
Shahira Abdul Lathif, Khalifa University, United Arab Emirates
Updates
Copyright
© 2026 Song, Man, Gong, Nie, Li, Du, Jiang, Zeng and Zhang.
This is an open-access article distributed under the terms of the Creative Commons Attribution License (CC BY). The use, distribution or reproduction in other forums is permitted, provided the original author(s) and the copyright owner(s) are credited and that the original publication in this journal is cited, in accordance with accepted academic practice. No use, distribution or reproduction is permitted which does not comply with these terms.
*Correspondence: Wang Man, manwang@xmut.edu.cn
Disclaimer
All claims expressed in this article are solely those of the authors and do not necessarily represent those of their affiliated organizations, or those of the publisher, the editors and the reviewers. Any product that may be evaluated in this article or claim that may be made by its manufacturer is not guaranteed or endorsed by the publisher.