Abstract
Accurate prediction of weather and climate conditions is vital for ensuring the safety of human environments. In this study, we developed a regional air-sea coupled weather forecasting model and conducted a preliminary evaluation of its performance concerning basic variables such as precipitation, typhoons, and 10-meter wind fields. The forecasting system covers the region from 15° to 40°N latitude and 108° to 146°E longitude, utilizing the Weather Research and Forecasting Model (WRF) for atmospheric components and the Regional Ocean Modeling System (ROMS) for oceanic components, integrated via the National Center for Atmospheric Research Coupler version 7 (CPL7). The system operates at a horizontal resolution of approximately 3 km. We performed daily rolling 96-hour forecast experiments, starting at 00:00 each day from January 1, 2024, to December 31, 2024. The results indicate that the annual mean rainfall root mean square error (RMSE) for the entire region is 13.7 mm/day for a 24-hour forecast and 16.3 mm/day for a 96-hour forecast. Spatially, the RMSE is generally smaller in the northwest land area of the region (inland China) compared to the ocean, with notably larger RMSE near Taiwan and the Philippines due to higher average precipitation in these areas. Southern Japan also exhibits relatively large RMSE values. The forecast skill demonstrates significant seasonal variation, with higher RMSE in summer compared to winter. For typhoon forecasts, the mean error distance is 74.1 km for 24–48 hours and 118.9 km for 48–72 hours. The RMSE of 10-meter wind over the oceans shows similar patterns to rainfall, with an annual mean RMSE of 1.5 m/s for a 24-hour forecast and 2.5 m/s for a 96-hour forecast.
1 Introduction
The ocean and the atmosphere are the two important components of the earth system model (ESM), which is of complexly interact with each other and plays pivotal impact on Earth’s weather and climate. The coupled ocean and atmosphere numerical models are the most comprehensive and useful tools to understand and predict the atmosphere and oceanic weather and climate phenomenon (Fu et al., 2021). Due to computational limitation, current global ESMs typically have coarse horizontal resolutions and simplify the complex processes of oceanic and atmospheric physics through parameterizations, which are primarily established for studying the interactions of large-scale atmospheric and oceanic physical processes, as well as climatic evolution (Kay et al., 2015; Peng et al., 2012). In contrast, regional ESMs are configured with higher resolution with the aim of resolving finer-scale topography, circulation patterns, and thermodynamic structures to provide more accurate regional climate information and weather applications (Feser et al., 2011; Giorgi, 2019; Gutowski et al., 2020).
Regional air-sea coupled models have evolved significantly since their early development in the mid-1980s (Neelin et al., 1992), initially focusing on phenomena like tropical air-sea interactions (e.g., ENSO). A key driver for developing high-resolution regional coupled models, such as the one presented here, is the need for detailed, short-term weather forecasts over specific areas (Feser et al., 2011; Gutowski et al., 2020). While global ESMs with coarser resolution are indispensable for long-term climate projections and studying large-scale interactions (Kay et al., 2015; Peng et al., 2012), regional models configured with higher resolution aim to resolve finer-scale topography, circulation patterns, and thermodynamic structures to provide more accurate regional weather information and applications. Recent advancements in regional coupled modeling include incorporating additional Earth system components, such as sea ice, atmospheric chemistry, and ecosystems, to investigate their complex interactions (Giorgi, 1995). Hostetler et al. (1993) coupled a lake thermal model with a regional climate model. Giorgi et al. (2003) incorporated a chemistry aerosol model with a regional climate model to assess direct and indirect effects of anthropogenic sulfate on the climate of east Asia. Smith et al. (2010) implemented a novel vegetation dynamics scheme within the regional climate models. Multiple regional ocean-atmospheric coupling models are also developed based on different components and coupling methods (Warner et al., 2010; Dai et al., 2019; Jin et al., 2023).
More studies have incorporated regional ocean-atmosphere coupling into their weather and climate research conducted in the regions of East Asia and the western North Pacific (Fang et al., 2010; Zou and Zhou, 2013; 2016; Cha et al., 2016). The ocean-atmosphere interaction over East Asia and western Northern Pacific is crucial especially for warm sea surface temperature (SST) condition, in which the atmospheric forcing significantly influences SST variability (Lu and Lu, 2015; He et al., 2015; Lee and Cha, 2020; Kong et al., 2024). Some studies indicates that the ocean-atmosphere coupling can better reproduce and predict the precipitation and large-scale circulation in the East Asian summer monsoon regions (Yao and Zhang, 2008; Jin et al., 2023). Zou and Zhou (2016) pointed out that the ocean-atmosphere coupling model can better simulate the low-level summer monsoon circulation in the western Northern Pacific region. Peng et al. (2023) demonstrated sea–air coupling leads to a decrease in precipitation in East Asia under present day conditions. Jin et al. (2023) illustrates that the sea–air coupling model has better performance in simulating the monthly changes of the western Pacific subtropical high and related precipitation compared to that by stand-alone atmosphere model. Long et al. (2024) indicates that ocean-atmosphere coupling also significantly improves summer precipitation over ocean.
Currently, the regional atmospheric general circulation models driven by the observed SST are widely used to predict the weather and climate, especially for the landfalling tropical cyclone and precipitation forecast (Dowell et al., 2022; Tapiador et al., 2022; Zhang et al., 2022). The absence of ocean coupling in regional coupled models leads to suboptimal precipitation simulations in East Asia and affects intensity of typhoon (Sun et al., 2019; Peng et al., 2023), which limits understanding of atmosphere-ocean interactions. In addition to SST, the warm upper ocean thermal condition, warm or cold eddy conglomeration may partly influence intensity evolution of typhoon (Shay et al., 2000; Wu et al., 2007; Ma et al., 2019; Liu et al., 2023). It also needs ocean model to depict the upper ocean thermal and dynamical change. To address these limitations, we used a coupled regional climate model, including atmosphere and ocean components, to predict weather over East Asia and the western North Pacific. The purpose of this article is to evaluate the accuracy of regional air-sea coupling model weather prediction.
While advanced operational systems such as NOAA’s HWRF/HAFS (featuring three-way atmosphere–ocean–wave coupling for tropical cyclones) and COAMPS (designed for multi-component coastal and offshore prediction) exemplify the current state of the art in regional coupled modeling, our current effort focuses on developing and evaluating a pragmatic, high-resolution (3 km) two-way atmosphere–ocean coupled system specifically for the East Asia and western North Pacific region. This configuration serves as a foundational step, with the integration of wave physics — a key feature in both HWRF/HAFS and COAMPS — planned as a critical future enhancement to improve the fidelity of air–sea interaction representation, particularly for typhoon intensity forecasting.
The structure of this paper is as follows. Section 2 outlines the model, experimental setup and observation datasets. In Section 3, the performances and forecast skill of the model are evaluated, including precipitation, typhoon and 10-m wind speed. Finally, Section 4 renders discussion and section 5 provides a summary of the findings and conclusions.
2 Methods
2.1 Model system description
The prediction system is based on the air-sea coupled model of Jin et al. (2023), the atmospheric component is Weather Research and Forecasting Model (WRF) and the oceanic component is Regional Ocean Modeling System (ROMS), coupled through the National Center for Atmospheric Research Coupler version 7 (CPL7). The horizontal resolution of both WRF and ROMS is 3 km. WRF has 51 vertical layers with the model top at 10 hPa, while ROMS has 41 vertical layers. The main region of the prediction system covers the East Asia and western North Pacific (108-146°E, 15-40°N, Figure 1). The detailed coupled model settings are listed in Table 1, and a comprehensive description can be found in Jin et al. (2023). The coupling is accomplished through the NCAR CPL7 flux coupler every 3-hour. WRF exports to ROMS: 10-m wind components (u, v), surface air temperature, specific humidity, surface pressure, net short- and long-wave radiation, and accumulated precipitation. ROMS exports to WRF: sea-surface temperature and sea-surface roughness (computed from surface current and elevation). Surface turbulent heat and momentum fluxes are calculated by the COARE 3.0 bulk algorithm inside CPL7 using the most recent exchanged fields, ensuring simultaneous consistency of atmospheric forcing and ocean boundary conditions.
Figure 1
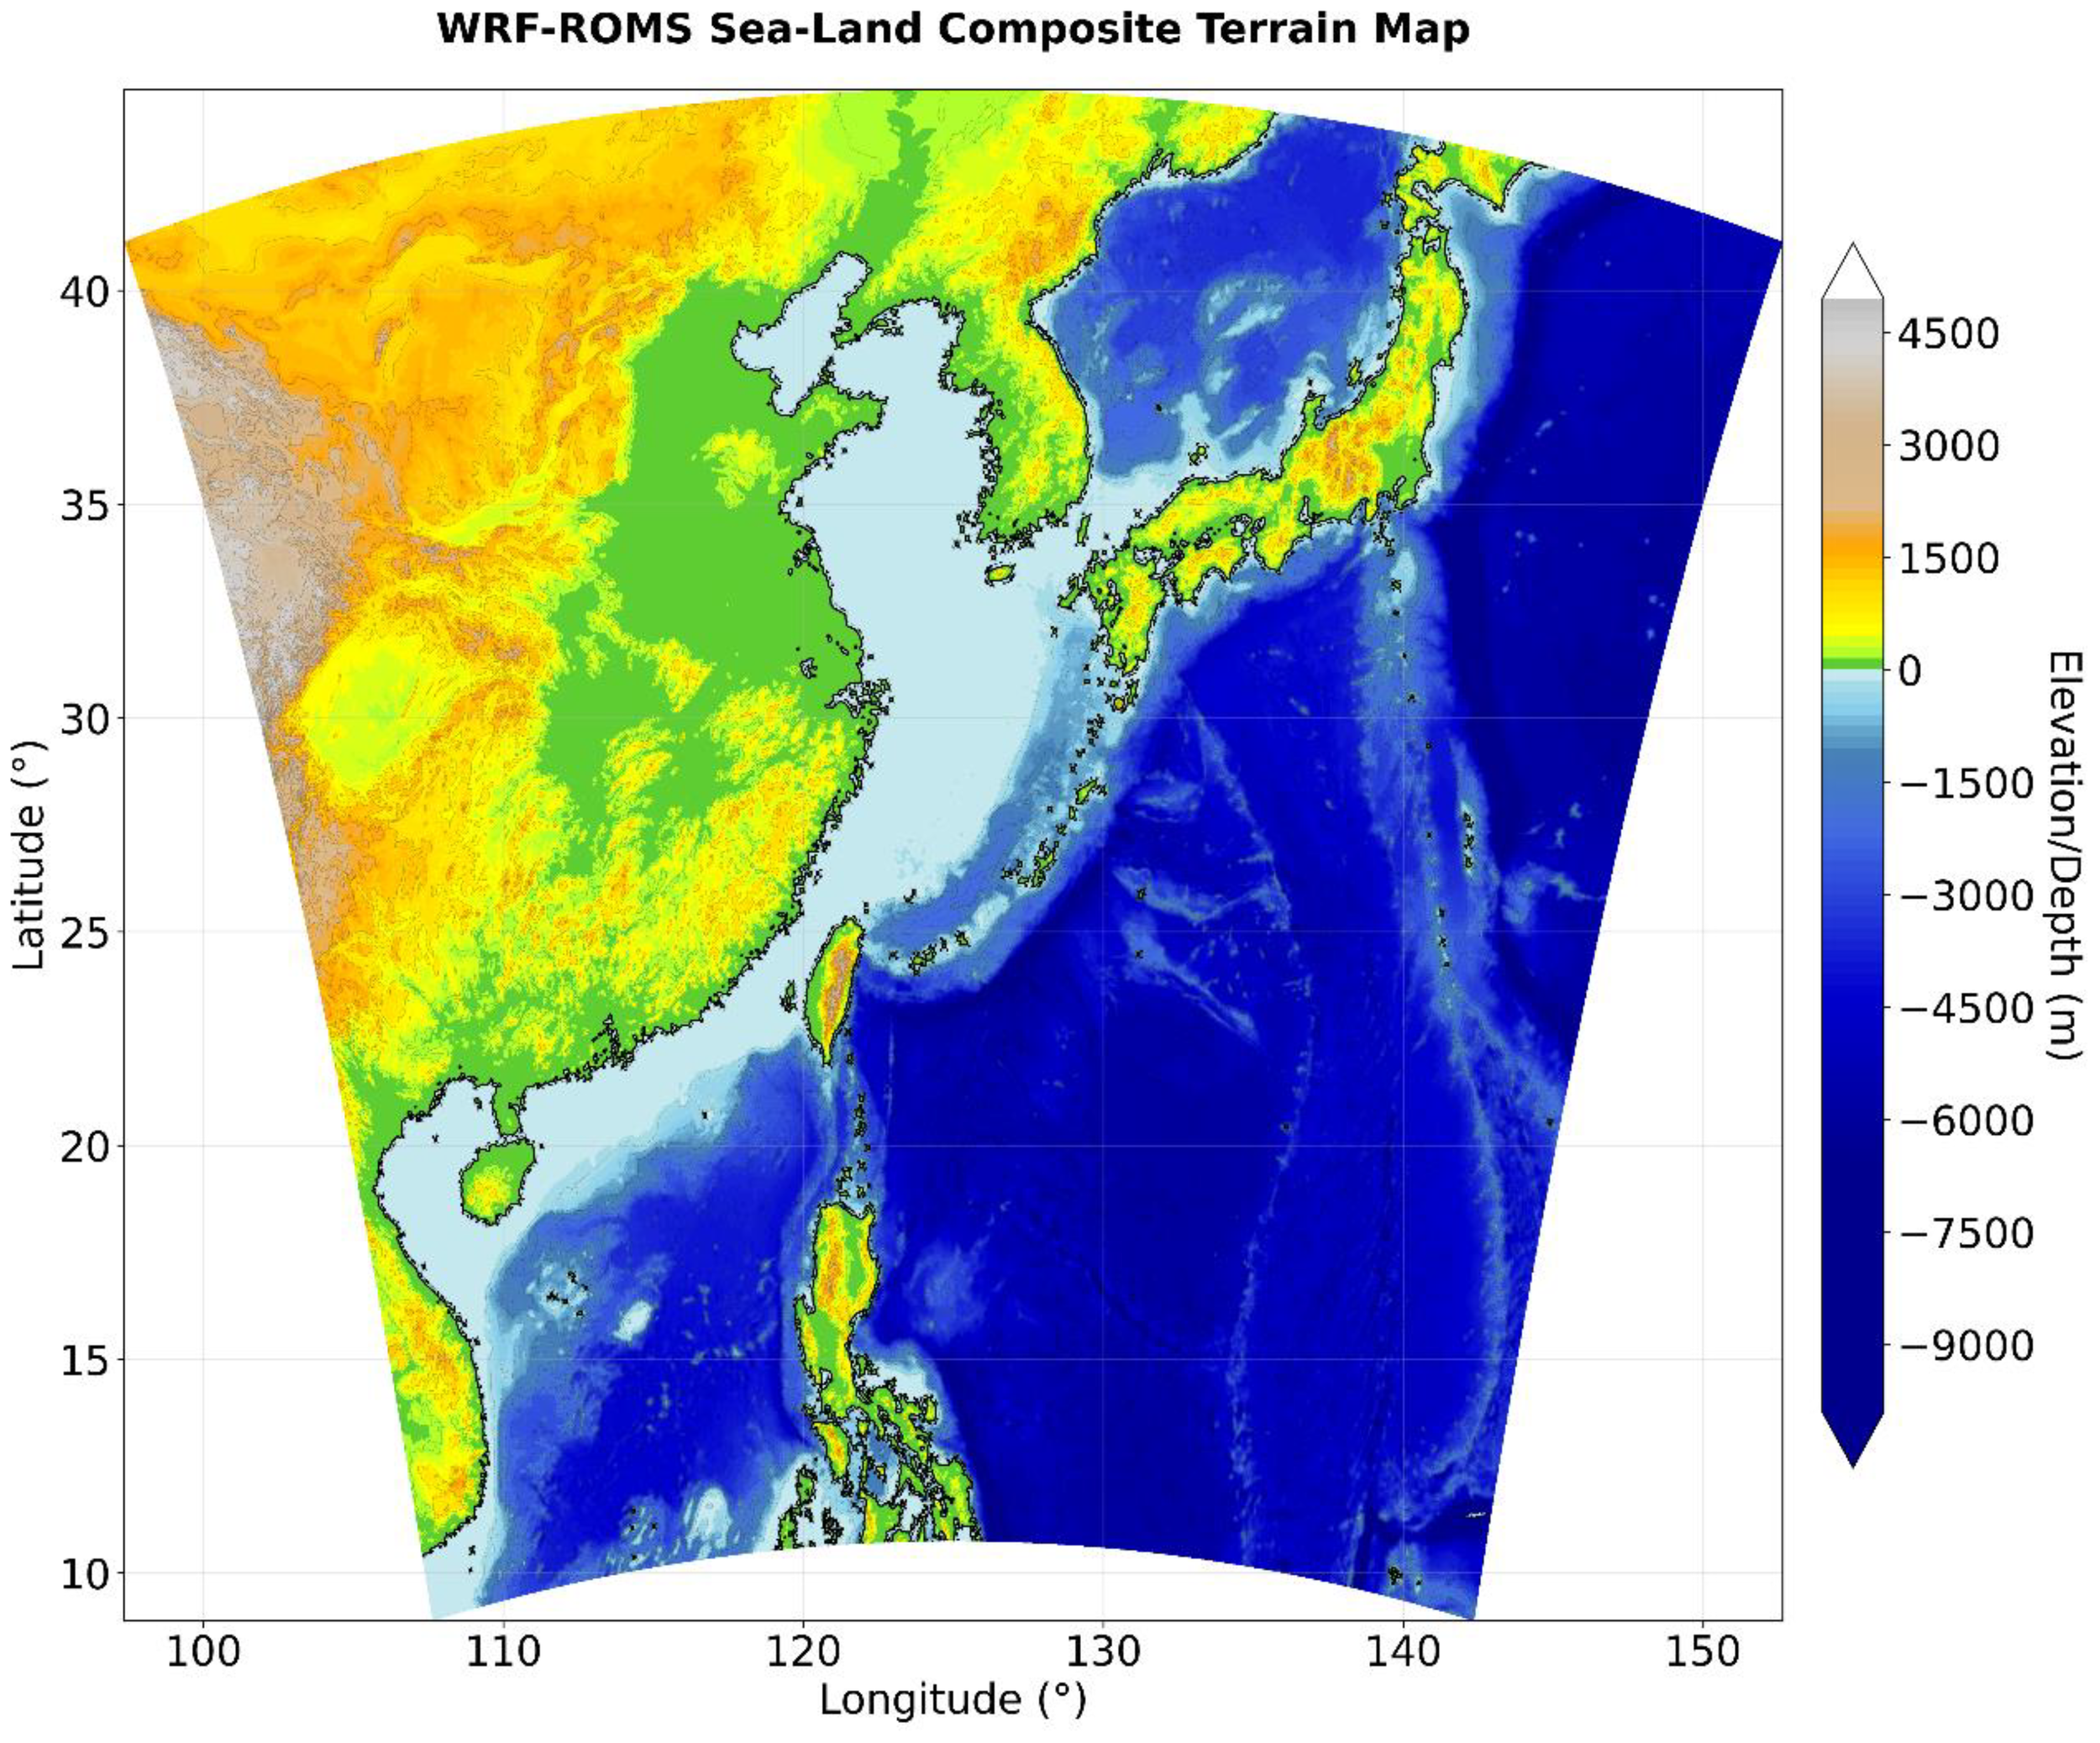
Forecasting focus area and the topography (Unit: m).
Table 1
| Parameter type | Parameters |
|---|---|
| WRF integration scheme | 3rdorder Runge–Kutta |
| WRF microphysics scheme | 2-moment Morrison |
| WRF boundary layer | YSU |
| WRF surface scheme | Monin-Obukhov |
| WRF land surface scheme | NOAH |
| WRF radiation scheme | RRTMG/RRTMG |
| WRF lateral boundary scheme | Specified |
| ROMS vertical mixing | LMD_MIXING |
| ROMS horizontal mixing | UV_VIS4 and MIX_GEO_TS |
| ROMS lateral boundary scheme | Chapman for free surface, Flather for 2d momentum, radiation nudging for current and tracer, Closure for mixing TKE |
| Air-sea coupling flux calculation | Large and Yeager, 2004 |
| Coupling frequency | Once every 3 hours |
| WRF and ROMS projection | Lambert |
| Grid | WRF/ROMS 3km, WRF 10hPa with 51 layers, ROMS 41 layers |
Model major parameter configurations.
Initialization of prediction system applied atmosphere assimilation procedure mainly focusing on the short-term (from 24 to 96-hour) weather forecast. The initialization consists of data preprocessing and assimilation processes. The data preprocessing process is mainly composed of atmospheric preprocessing and oceanic preprocessing programs, whose main function is to prepare the initial fields and lateral boundary fields for the regional coupled model. The atmospheric preprocessing programs are WPS and REAL. WPS and REAL process the global atmospheric forecast data into the forms of initial fields and lateral boundary fields specified by WRF, which are then provided to the assimilation subsystem for processing. The oceanic preprocessing process developed independently by the authors transforms RTOFS(Real-Time Ocean Forecast System) forecast data into initial and boundary fields that are ready for use with ROMS. Bicubic Interpolation is used to interpolate data from RTOFS onto the ROMS grid. The data involved includes sea surface height, sea temperature, sea salinity, and ocean currents. The assimilation subsystem adopts GSI3.7.1 (Gridpoint Statistical Interpolation). Using the initial fields and lateral boundary fields generated by the WRF preprocessing as background fields, the assimilation subsystem further assimilates satellite and conventional observation data. These observations are incorporated as analysis increments added to the background fields, resulting in improved atmospheric initial fields and lateral boundary fields suitable for WRF. A critical issue in model initialization, especially when coupled, is that models started from external data (GFS(Global Forecast System) for atmosphere, RTOFS for ocean) require a “spin-up” period to adjust from the external data’s dynamical equilibrium to the model’s own dynamical equilibrium. This is because external data may not fully align with the internal physical parameterizations and grid-scale processes of the coupled system, leading to transient biases if directly used for forecasting. At present, the system addresses this by implementing 12-hour spin-up periods, during which flux exchanges between model components are gradually activated to avoid external data struggling to align with the coupled system’s internal dynamics.
It should be noted that the system’s operational setup is critically dependent on real-time data streams, GDAS (Kleist et al., 2009), RTOFS (Garraffo et al., 2020) and GFS (Zhou et al., 2022) from NOMAD on NOAA/NCEP.
2.2 Forecast experiments
This paper presents a preliminary analysis and evaluation of the atmospheric results of a daily rolling 96-hour forecast experiments, which starts daily at 00:00 from January 1, 2024 to December 31, 2024. Although a 4-day simulation window is relatively short for the ocean to undergo large-scale thermodynamic changes, coupling is implemented to capture the critical, high-frequency air-sea feedbacks (e.g., SST cooling under typhoons, momentum fluxes) that can significantly impact short-term atmospheric forecasts, particularly for high-impact events like typhoons. This setup also provides a foundation for extending forecasts to longer lead times in future work.
The data preprocessing subsystem processes the 0.25° GFS global atmospheric forecast data (obtained from https://nomads.ncep.noaa.gov/pub/data/nccf/com/gfs/prod) and RTOFS global oceanic forecast data (obtained from https://nomads.ncep.noaa.gov/pub/data/nccf/com/rtofs/prod/) into the initial fields and lateral boundary fields for WRF/ROMS. The assimilation subsystem, based on the WRF initial fields and lateral boundary fields provided by the data preprocessing subsystem, further assimilates satellite and conventional observation data (obtained from https://nomads.ncep.noaa.gov/pub/data/nccf/com/obsproc/prod and listed in the Table 2) to form the atmospheric initial fields and lateral boundary fields used for forecasting.
Table 2
| Filename | Description |
|---|---|
| gdas.t00z.prepbufr.nr | Preprocessed BUFR-format observation dataset generated by the Global Data Assimilation System (GDAS) at 00Z UTC |
| gdas.t00z.satwnd.tm00.bufr_d | Satellite-derived atmospheric motion/wind vectors |
| gdas.t00z.1bamua.tm00.bufr_d | AMSU-A (Advanced Microwave Sounding Unit-A) Level 1B radiance data |
| gdas.t00z.1bhrs4.tm00.bufr_d | HIRS/4 (High-Resolution Infrared Radiation Sounder) Level 1B radiance data |
| gdas.t00z.1bmhs.tm00.bufr_d | MHS (Microwave Humidity Sounder) Level 1B radiance data |
| gdas.t00z.1bamub.tm00.bufr_d | AMSU-B (Advanced Microwave Sounding Unit-B) Level 1B radiance data |
| gdas.t00z.ssmisu.tm00.bufr_d | SSMIS (Special Sensor Microwave Imager/Sounder) unified preprocessed data |
| gdas.t00z.airsev.tm00.bufr_d | AIRS/AMSU/HSB (Atmospheric Infrared Sounder) retrieved products |
| gdas.t00z.sevcsr.tm00.bufr_d | CERES (Clouds and Earth’s Radiant Energy System) radiation budget data |
| gdas.t00z.iasidb.tm00.bufr_d | IASI (Infrared Atmospheric Sounding Interferometer) data (EUMETSAT mission) |
| gdas.t00z.gpsro.tm00.bufr_d | GPS Radio Occultation atmospheric bending angle data |
| gdas.t00z.amsr2.tm00.bufr_d | AMSR2 (Advanced Microwave Scanning Radiometer 2) microwave imager data |
| gdas.t00z.atms.tm00.bufr_d | ATMS (Advanced Technology Microwave Sounder) cross-track scanning data |
| gdas.t00z.geoimr.tm00.bufr_ | GEO/IMR (Geostationary Earth Orbit - Imagery/Microwave Radiance) data |
| gdas.t00z.gome.tm00.bufr_d | GOME (Global Ozone Monitoring Experiment) ozone profile data |
| gdas.t00z.omi.tm00.bufr_d | OMI (Ozone Monitoring Instrument) total column ozone data |
| gdas.t00z.osbuv8.tm00.bufr_ | SBUV/2 (Solar Backscatter Ultraviolet Radiometer) ozone layer data |
| gdas.t00z.eshrs3.tm00.bufr_ | EUMETSAT HIRS/3 (High-Resolution Infrared Radiation Sounder) data |
| gdas.t00z.esamua.tm00.bufr_ | EUMETSAT AMSU-A (Advanced Microwave Sounding Unit-A) data |
| gdas.t00z.esmhs.tm00.bufr_d | EUMETSAT MHS (Microwave Humidity Sounder) data |
Assimilated data in the forecast system.
2.3 Validation data sets
The datasets used in this study for evaluation include the original forecast output, the ERA5 atmospheric hourly reanalysis dataset (0.25°×0.25°, Hersbach et al., 2020, https://cds.climate.copernicus.eu/datasets), Global Precipitation Climatology Project (GPCP) daily precipitation dataset V1.3 and the best track dataset of tropical cyclones from the China Meteorological Administration Tropical Cyclone Data Center (https://tcdata.typhoon.org.cn/zjljsjj.html). Daily GPCP Satellite-Gauge Combined Precipitation dataset is provided by the NOAA Climate Data Record (CDR) with 1°×1° spatial resolution from 1996 to present (Huffman et al., 2001).
3 Results
Precipitation and typhoons are the climatic phenomena with the most significant impact on human activities in the Northwest Pacific region. This paper evaluates the performance of the forecasting system concerning precipitation and typhoons in the Northwest Pacific monsoon area. Additionally, wind speed over the ocean significantly influences maritime activities, including fishing, which necessitates accurate wind speed forecasting. Therefore, the effectiveness of the forecasting system in predicting wind speed will also be examined.
3.1 Rainfall
Figure 2 shows the spatial distribution of the root mean square error (RMSE) of precipitation for the annual average 24-hour forecast, 48-hour forecast, 72-hour forecast, and 96-hour forecast. The following characteristics of the model forecast can be observed. Firstly, the RMSE on the northwest land of the region is generally smaller than that on the ocean, especially the RMSE near Taiwan to the Philippines is relatively larger. This is likely due to the higher average precipitation in this region (Kosaka, 2021). The 24-hour RMSE over the land in China is generally smaller than 20 mm/day, similar to the previous studies using the raw ECMWF forecasts (Tian et al., 2024). There is also a region with a large RMSE in southern Japan, which is also a precipitation center and a component of the summer monsoon precipitation belt. In addition, it can be seen that the RMSE in the ocean east of the Philippines is relatively small, because this is the coverage area of Pacific Subtropical High, and the precipitation is relatively smaller than in the northwest Pacific monsoon region. It can be seen that the RMSE shows an increasing trend from 24-hour forecast to 96-hour forecast, which is also reasonable. The results indicate that the annual mean rainfall root mean square error (RMSE) for the entire region is 13.7 mm/d for a 24-hour forecast and 16.3 mm/d for a 96-hour forecast.
Figure 2
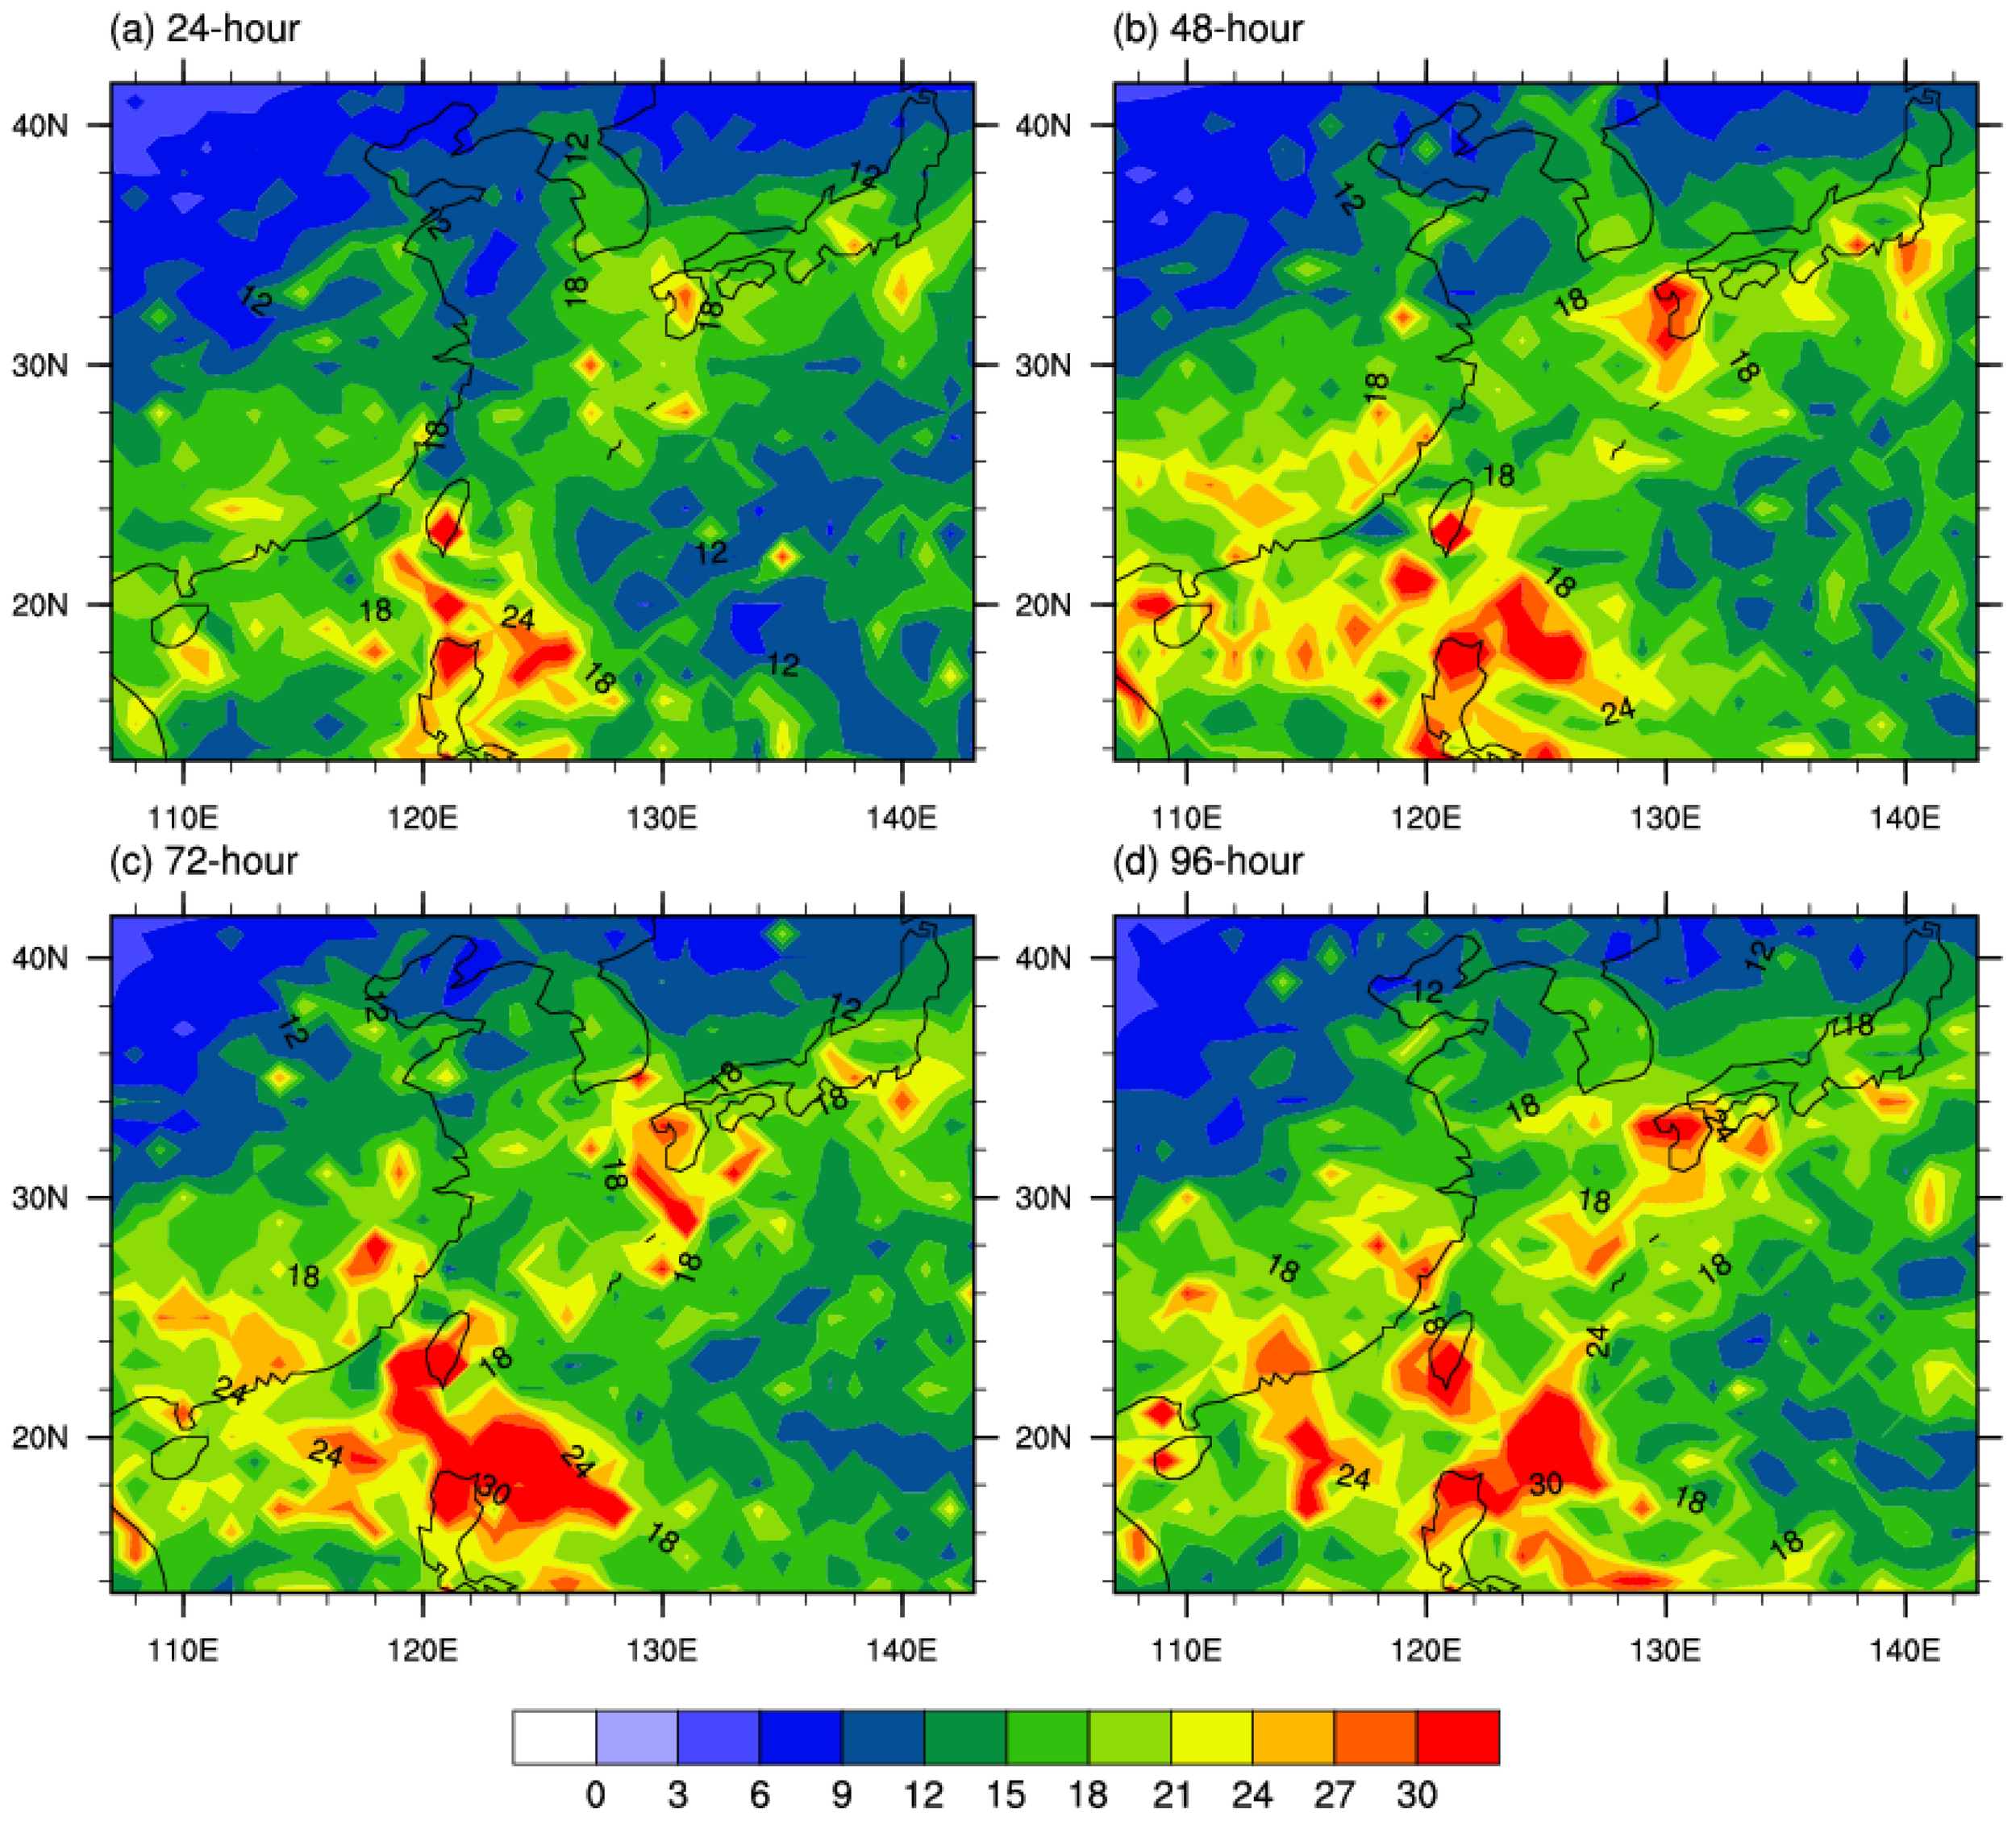
Rainfall RMSE for (a) 24-hour, (b) 48-hour, (c) 72-hour and (d) 96-hour forecast. (Units: mm/day).
Figure 3 shows the distribution characteristics of 24-hour forecast RMSE in different seasons, including the average results from January to March, April to June, July to September, and October to December. The RMSE from January to March is relatively small, with the high value area located in the belt shaped region from southeastern China to Japan, basically below 20 mm/day. In spring and summer, RMSE significantly increases, especially in the southeastern region of China, where the maximum RMSE value exceeds 30 mm/day. This is likely related to the large amount of precipitation brought by the summer monsoon. The RMSE of the Philippine Sea has also increased to a certain extent, but it is smaller than the belt shaped high-value area from southeastern China to Japan. In early summer and autumn, the RMSE of the entire region generally increases, with the northwest Pacific being the maximum area, surpassing the north. This may be related to the decrease in precipitation in the north accompanied by monsoon retreat. In winter, the RMSE on land in China is significantly lower, which may be related to the decrease in precipitation in the northern regions., with the highest values located on the tropical ocean surface. Overall, the forecasted RMSE is closely related to the magnitude of precipitation, with larger RMSE in summer and smaller RMSE in winter (e.g., Yang, 2002; Ding and Chan, 2005). The seasonal variation characteristics for 48, 72 and 96 hours forecast are similar to the 24-hour forecast, and figures are omitted here. The magnitude of RMSE is closely proportional to local climatological mean rainfall. In active monsoon regions such as the Philippine Sea and southern Japan during summer (JAS), where the observed mean precipitation exceeds 8–10 mm/day (GPCP), the 24-hour RMSE typically ranges from 18 to 24 mm/day—approximately 2 to 2.5 times the mean rainfall. This scaling behavior is consistent with findings in Wu et al. (2023) and Tian et al. (2024), who reported similar RMSE-to-mean ratios in high-resolution precipitation forecasts over East Asia. In contrast, winter RMSE over inland China remains below 10 mm/day, reflecting both lower rainfall amounts and reduced convective activity. The seasonal variation characteristics of RMSE mentioned above can also be seen from the time series in Figure 4. In winter, RMSE generally gradually increases to about 10 mm/day, while in summer it remains around 20–30 mm/day. Afterwards, RMSE also decreases significantly with the retreat of the summer monsoon. At the same time, it can be seen that the RMSE time series of experiments with different forecast time periods exhibit similar changing characteristics, and the longer the forecast time period, the larger the RMSE. An interesting phenomenon is that RMSE exhibits certain seasonal variation characteristics, for example, from summer to autumn, the RMSE in August and October is significantly lower than before and after the period, which may also reflect the seasonal variation characteristics of precipitation. The RMSE of precipitation for 24, 48, 72 and 96 hours forecast in each month is shown in Table 3. In previous studies, it was also found that the precipitation RMSE is relatively larger in the Meiyu period (June-July) than the rainy season of North China (July-August) which is related to more precipitation in the Meiyu period than that in the rainy season of North China (Wu et al., 2023). This indicates that the RMSE is related to the climate mean rainfall amount. Wetter regions or seasons may be associated with higher forecast RMSE.
Figure 3
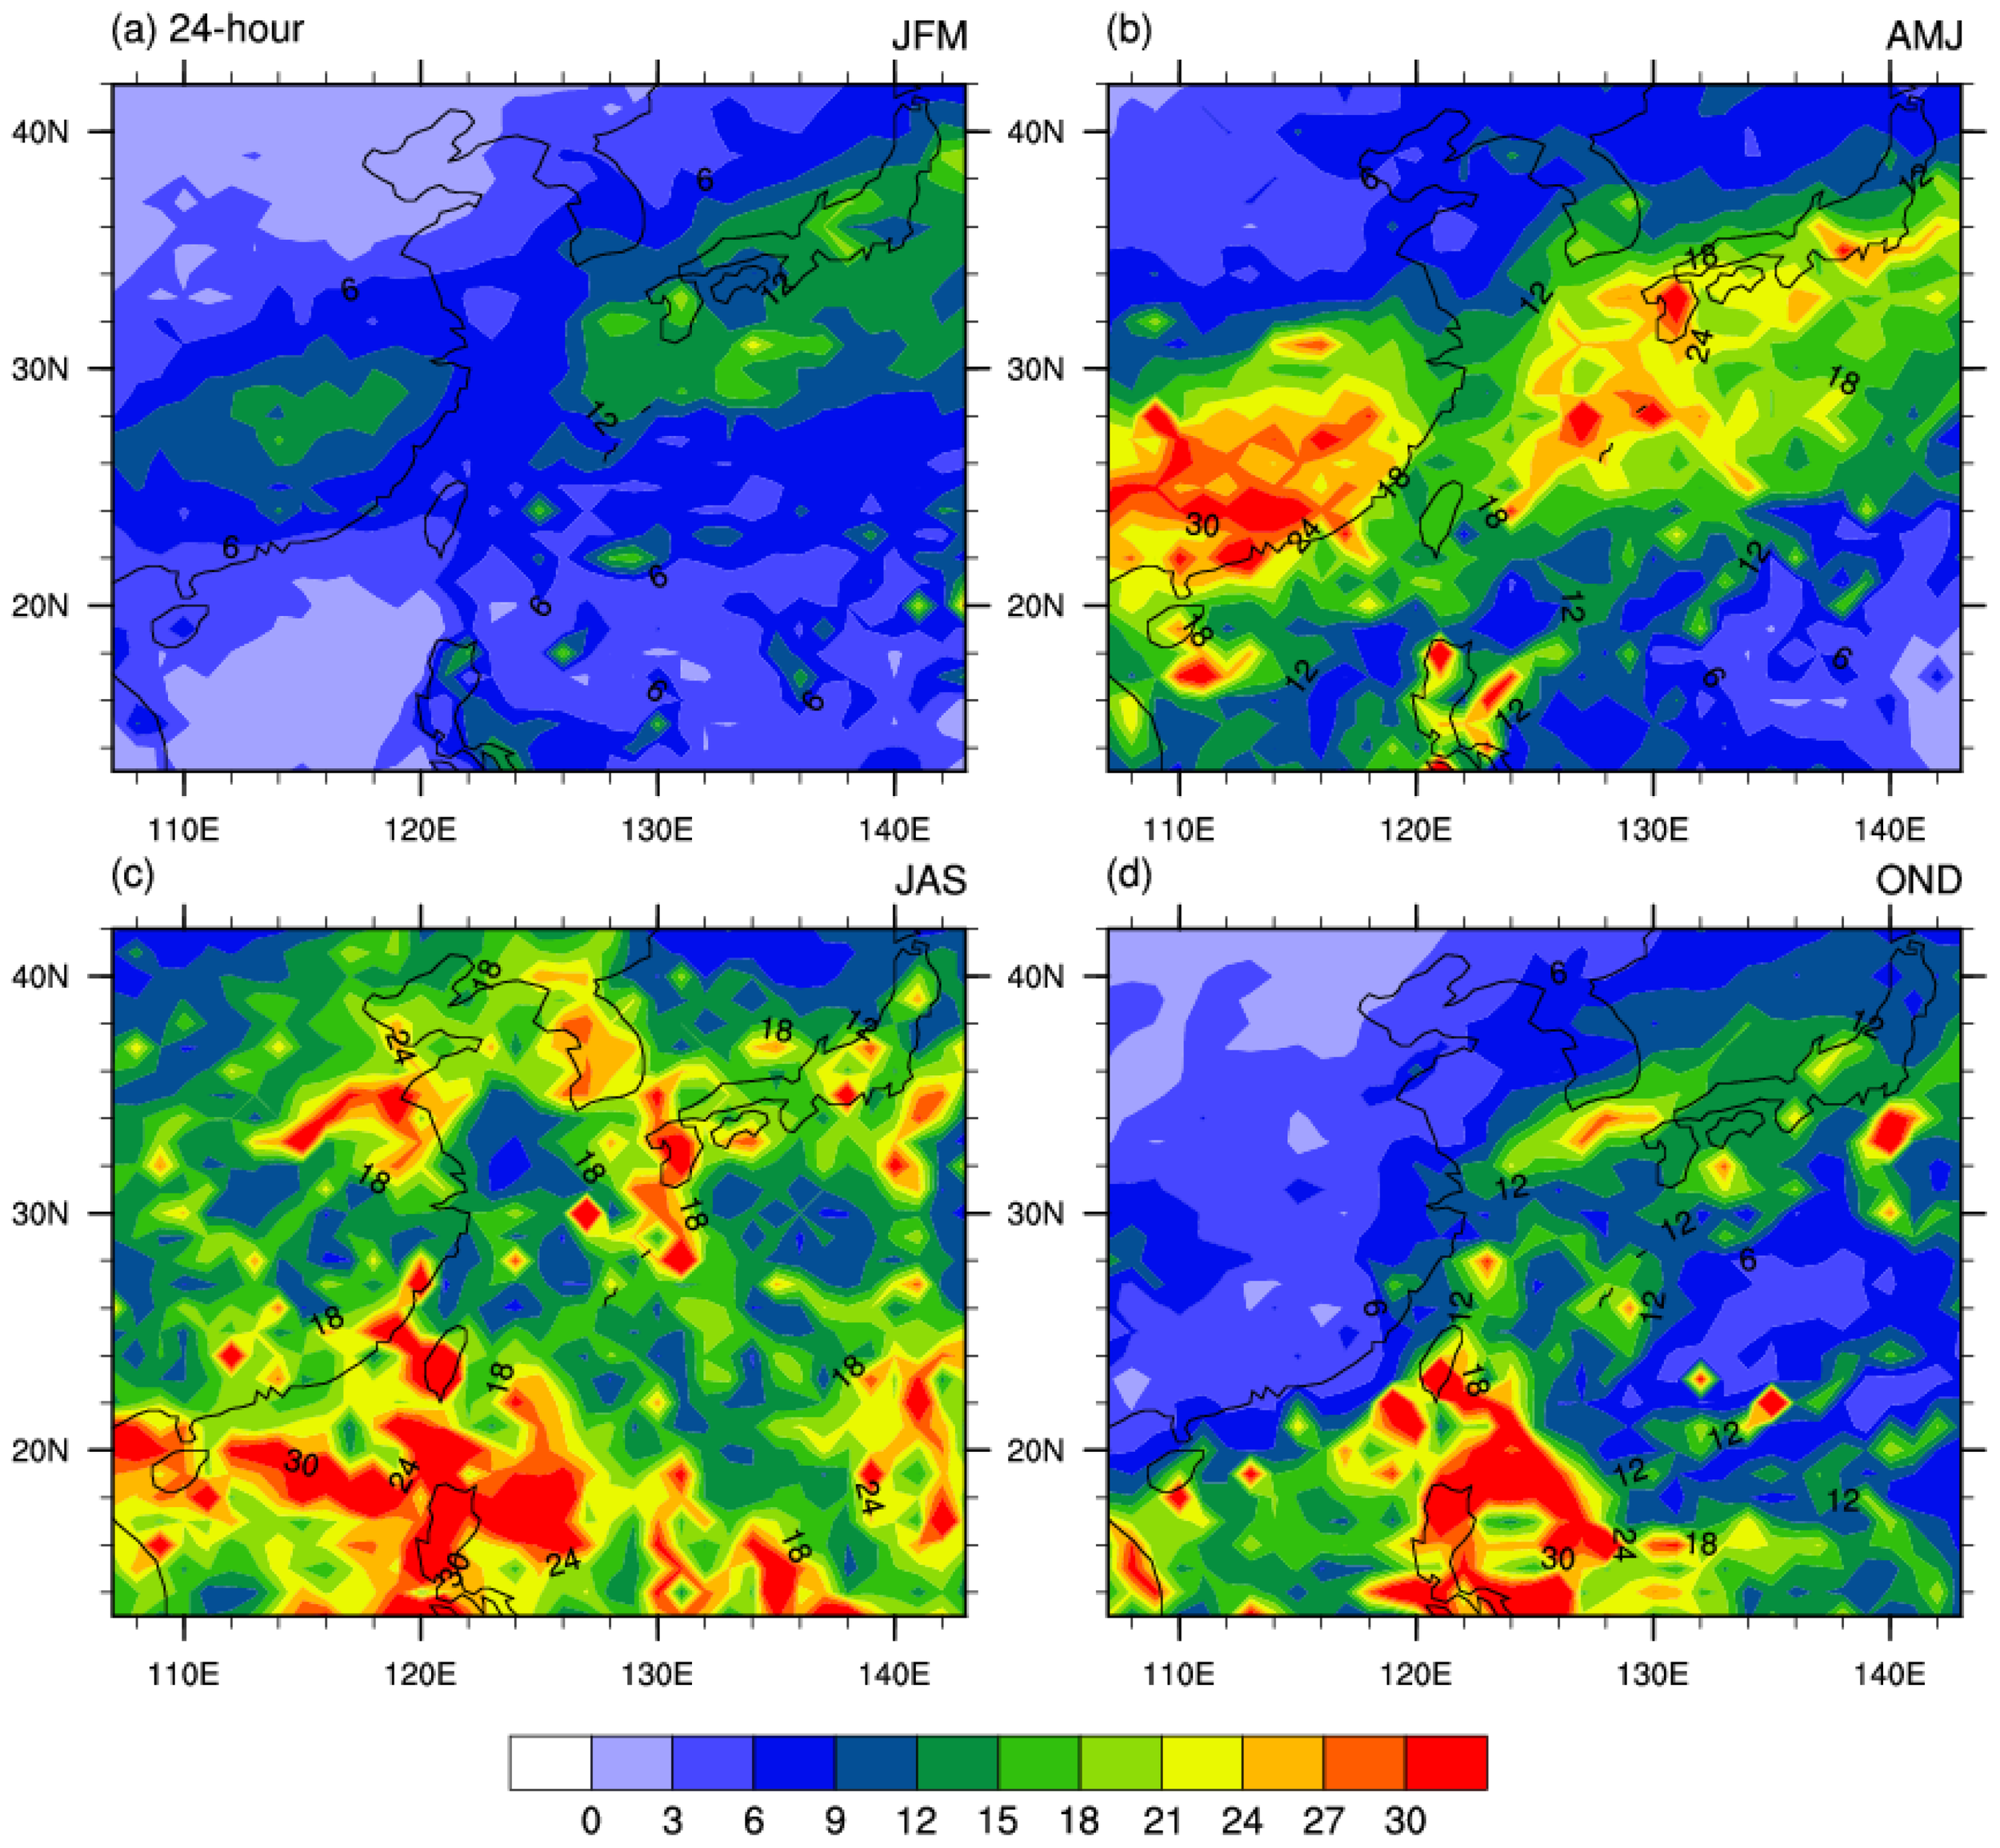
Rainfall RMSE for seasonal mean (a) [January-March (JFM), (b) April-June (AMJ), (c) July-September (JAS), and (d) October-December (OND)] in 24-hour forecast. (Units: mm/day).
Figure 4
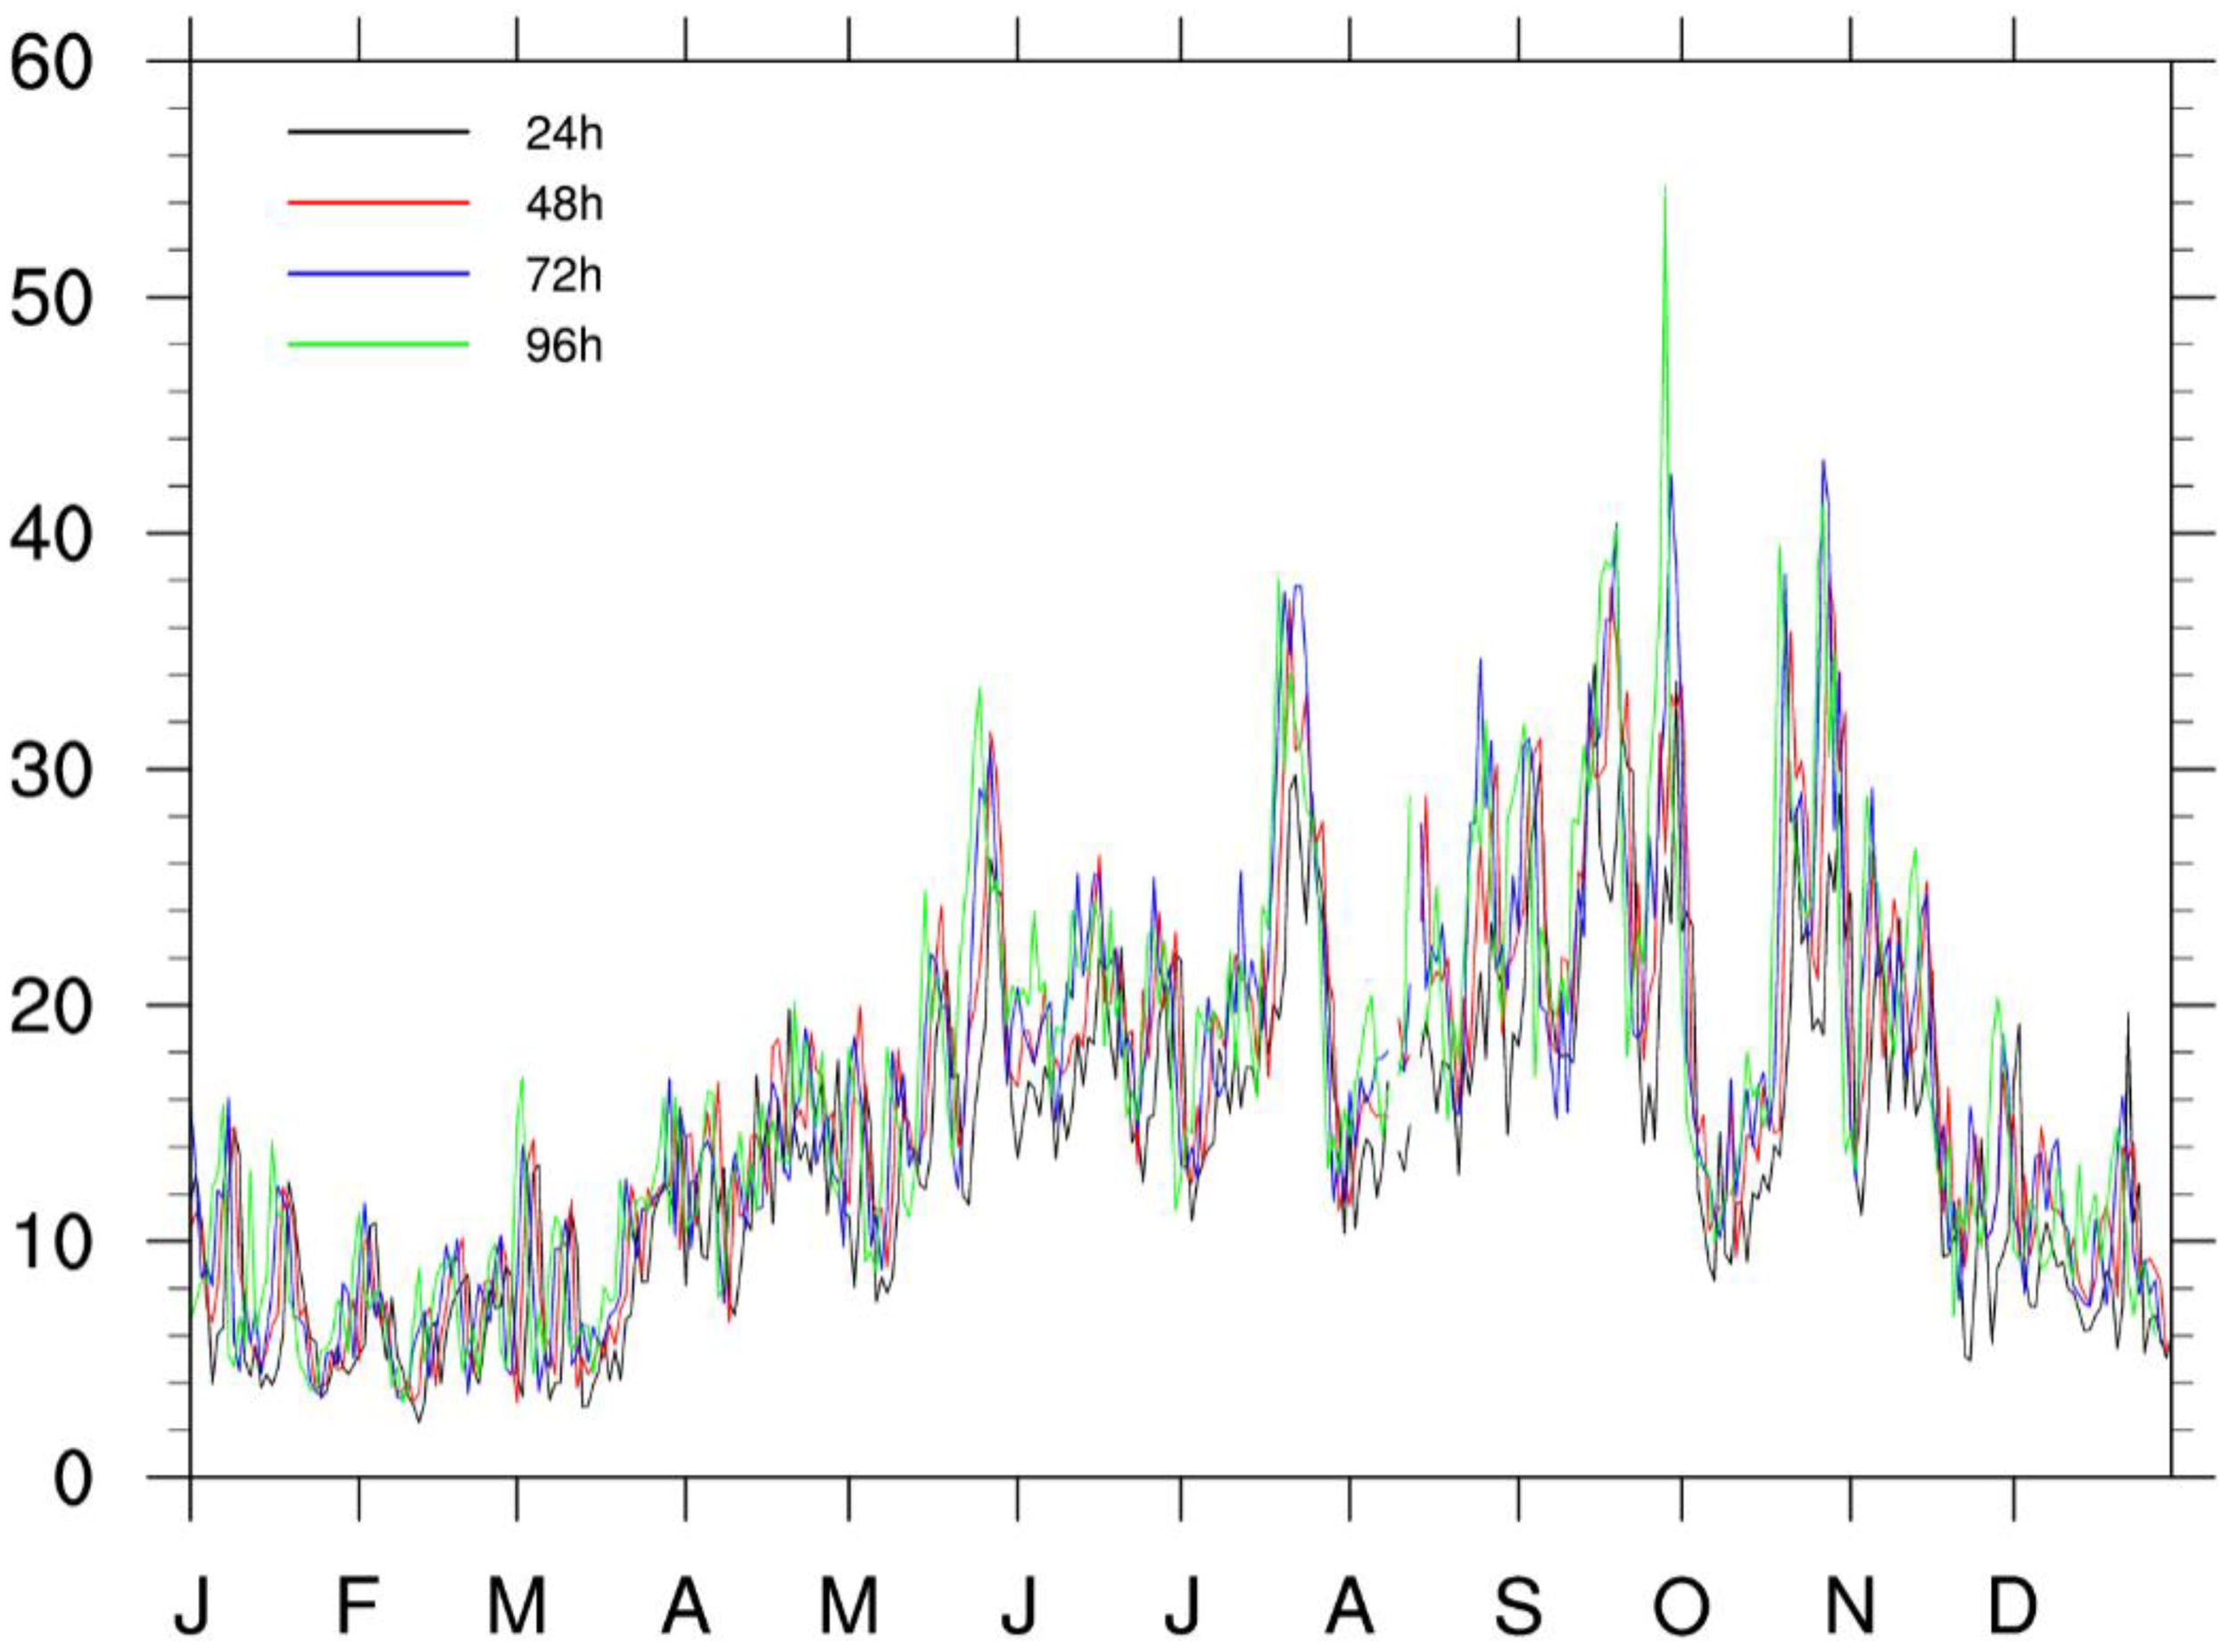
Timeseries of rainfall RMSE in 2024 forecast (black: 24-hour, red: 48-hour, blue: 72-hour and green: 96-hour). (Units: mm/day).
Table 3
| Forecast lead time/Month | 1 | 2 | 3 | 4 | 5 | 6 | 7 | 8 | 9 | 10 | 11 | 12 |
|---|---|---|---|---|---|---|---|---|---|---|---|---|
| 24h | 7.1 | 6.2 | 7.6 | 12.6 | 15.1 | 17.1 | 18.9 | 16.4 | 23.8 | 16.8 | 14.0 | 8.8 |
| 48h | 7.7 | 6.6 | 8.6 | 14.2 | 17.7 | 19.5 | 21.3 | 19.8 | 26.6 | 20.8 | 16.6 | 10.3 |
| 72h | 7.9 | 6.8 | 9.0 | 13.3 | 18.0 | 20.2 | 22.0 | 21.1 | 26.8 | 21.5 | 16.8 | 10.2 |
| 96h | 7.8 | 6.7 | 9.7 | 13.7 | 18.7 | 20.1 | 21.7 | 21.1 | 28.6 | 21.0 | 17.3 | 10.1 |
Rainfall RMSE (unit: mm/day) in each month for 24h, 48h, 72h and 96h forecast.
3.2 Typhoon
The Northwest Pacific is one of the primary regions for the formation of typhoons globally, thus it is imperative to evaluate the effectiveness of forecasting systems in predicting typhoons.
Since forecasts are only performed once per day, the sample size is insufficient to allow for error comparisons every 12 hours as is standard in operational practice. Therefore, this study calculates errors over the 24–48-hour and 48–72-hour intervals. Taking the 24–48-hour error calculation as an example, the specific procedure is as follows: for a forecast initialized at 00:00 UTC, the model outputs at 24, 30, 36, 42, and 48 hours lead time are compared with the corresponding observations valid at those times. The prediction errors for typhoon landfall locations 24–48 hours in advance (Figure 5a) indicate that the forecasting system exhibits relatively high accuracy within this time frame. The mean error distance of all typhoons within the forecast domain over the 24–48-hour lead time is 74.1 km, with errors concentrated between 23.7 km and 154.6 km, showing a relatively tight distribution. Most prediction errors cluster within 60–90 km, suggesting that the model effectively captures typhoon track characteristics at shorter lead times. However, certain typhoons (e.g., Ewiniar and Shanshan) exhibit errors significantly exceeding the mean, highlighting the impact of track complexity on prediction accuracy. Overall, 24-48-hour predictions demonstrate stability, though attention must focus on high-uncertainty cases to refine forecasting methodologies and enhance performance under extreme conditions.
Figure 5
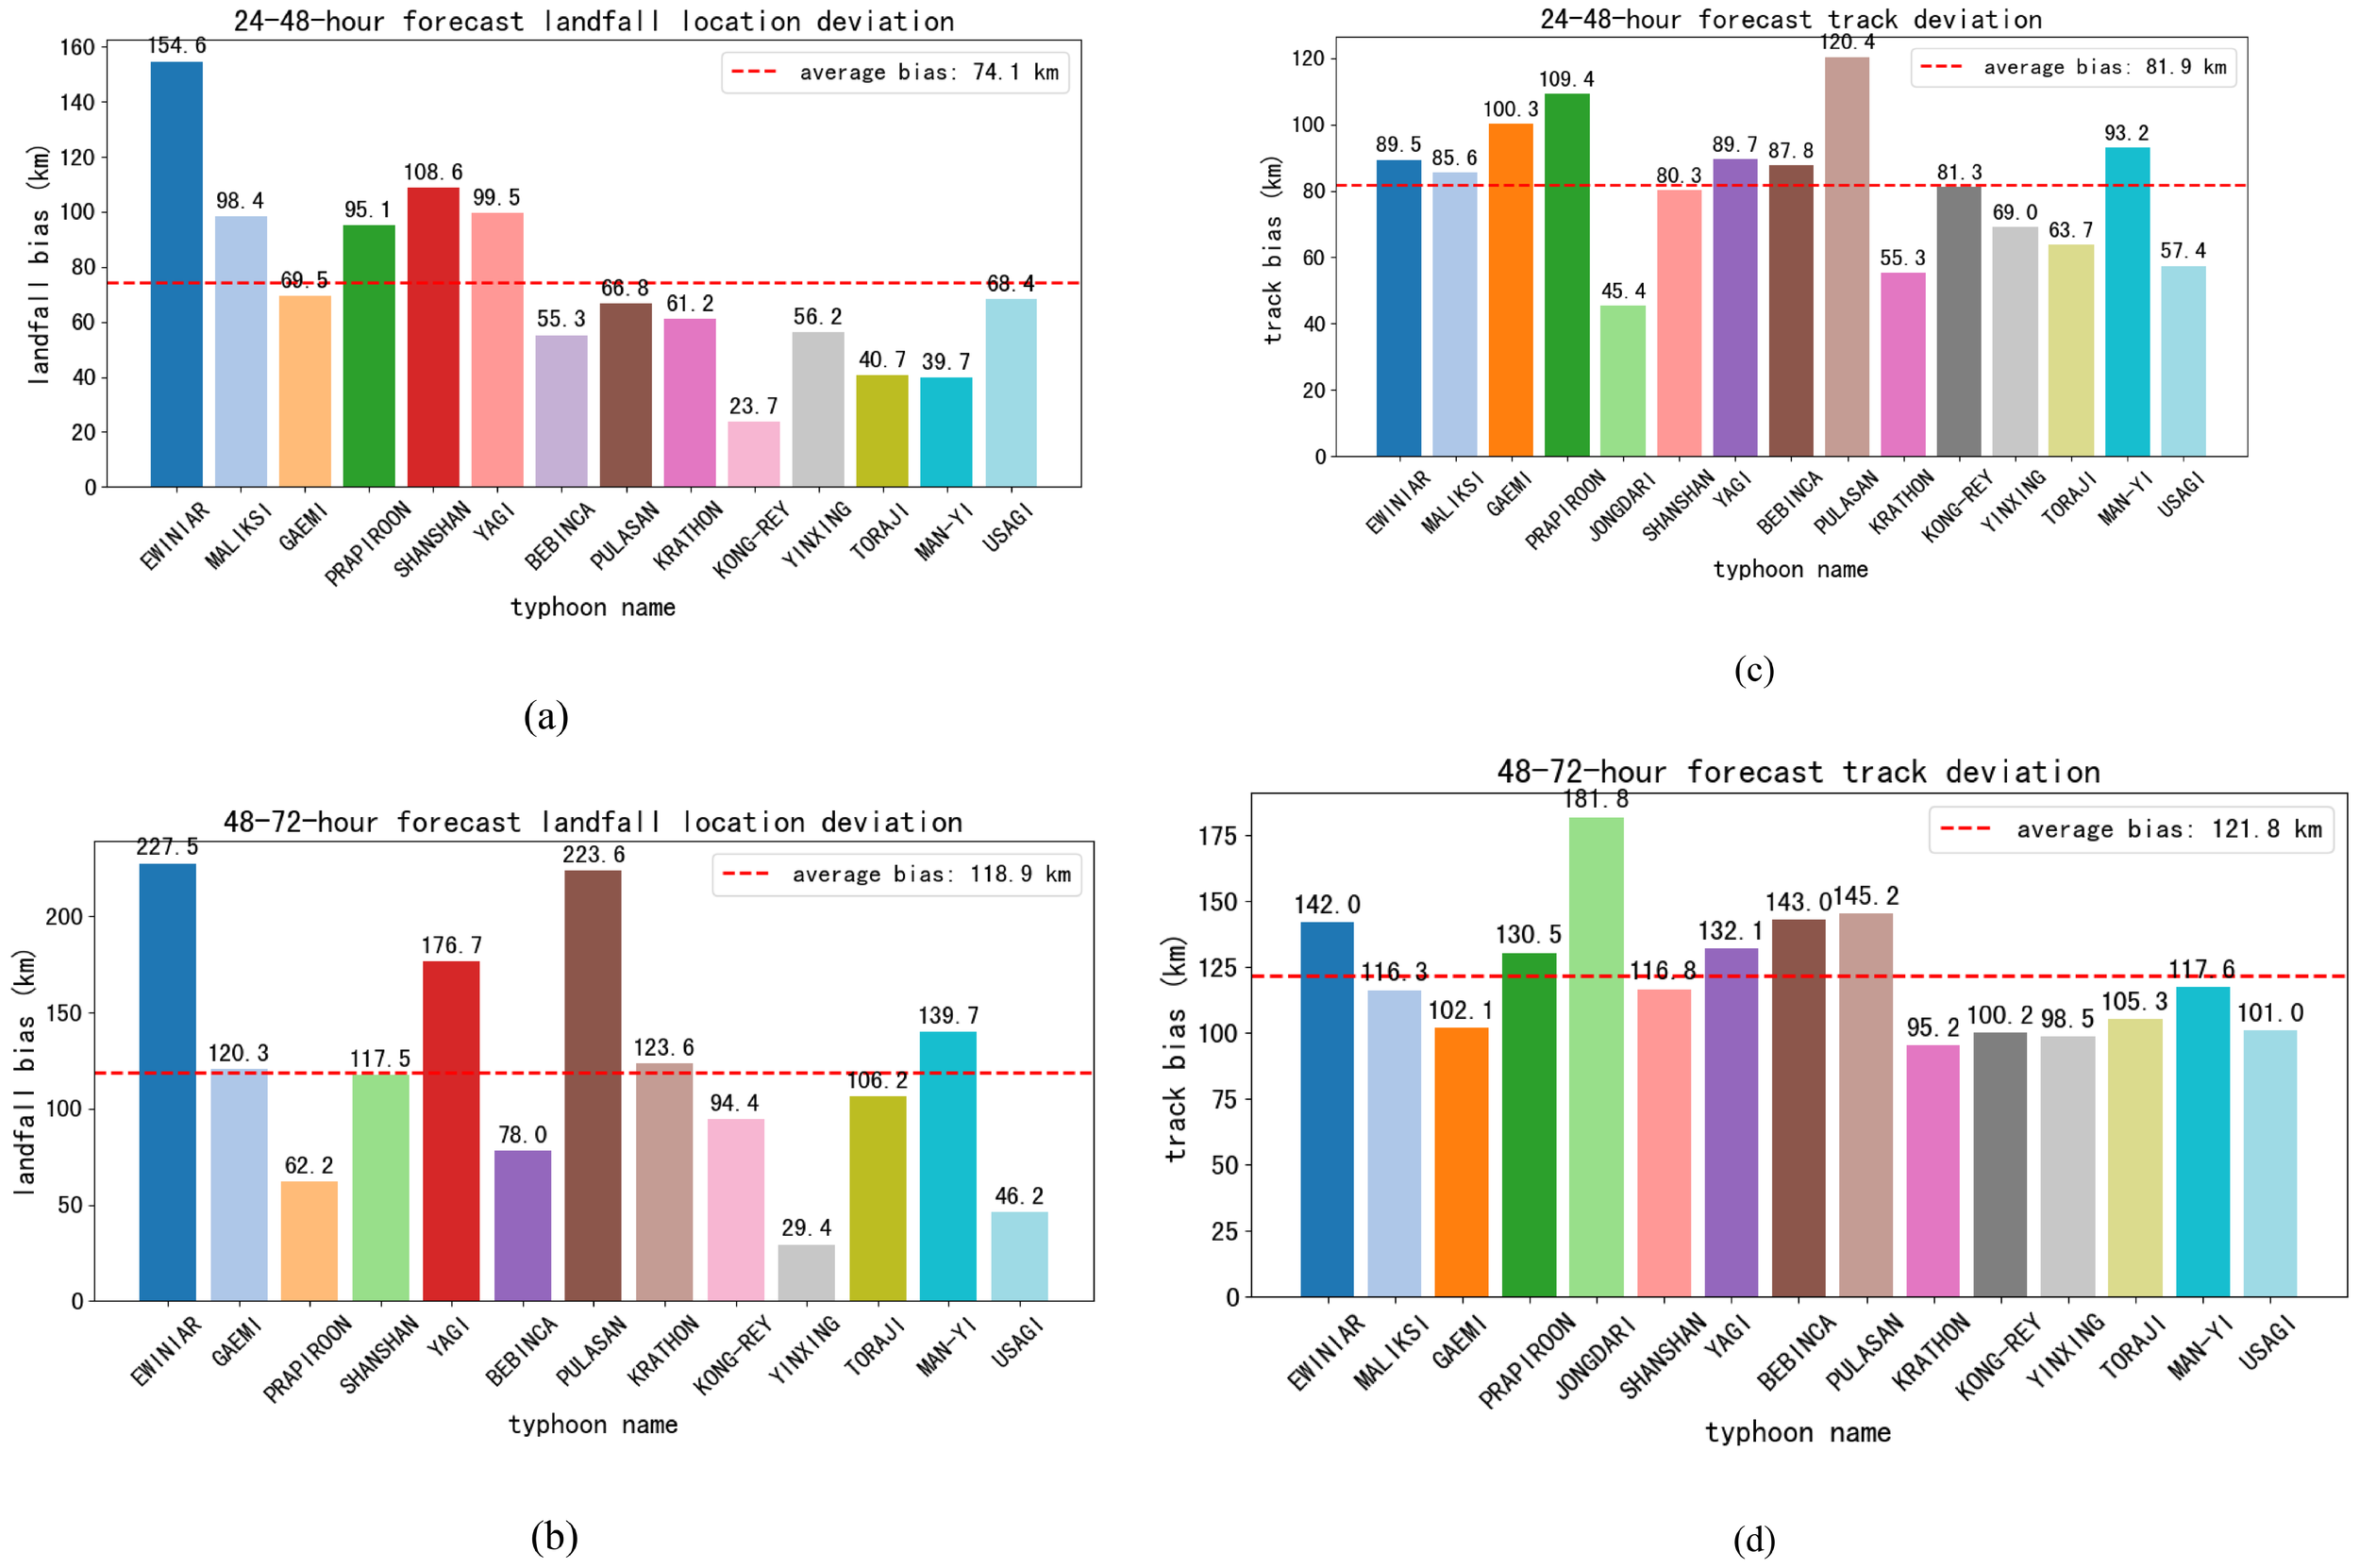
(a) Prediction deviation of 24-48-hour forecast landfall location; (b) Prediction deviation of 48-72-hour forecast landfall location; (c) Prediction deviation of 24-48-hour forecast track; (d) Prediction deviation of 48-72-hour forecast track. The x-axis represents typhoon names, and the y-axis denotes error distances. The red dashed line indicates the mean error. Unit: km.
For predictions 48–72 hours in advance (Figure 5b), system accuracy declines notably. The mean error distance of all typhoons within the forecast domain increases to 118.9 km (a ~60% rise from 24-48-hour predictions), with the error range expanding to 29.4-227.5 km, indicating greater dispersion. Errors for some typhoons (e.g., Ewiniar and Pulasan) far exceed the maximum values of 24–48-hour predictions, reflecting amplified uncertainties in typhoon tracks due to atmospheric circulation and topographic influences over longer lead times. While a few typhoons (e.g., Kong-Rei, Man-yi and Troji) exhibit smaller errors, overall error variability intensifies, aligning with the increased sensitivity of numerical models to complex weather systems over extended periods. This undermines the reliability of 48-72-hour predictions.
Analysis of full-life-cycle track predictions 24-48-hour in advance (Figure 6c) reveals stable model performance overall, yet significant disparities exist among typhoons. The mean error distance of 81.9 km suggests general alignment with observed tracks, though outliers persist. For instance, Prapiroon and Pulasan exhibit errors of 109.4 km and 120.4 km, respectively, underscoring challenges in predicting tracks influenced by complex synoptic systems or topography. Conversely, Jongdari and Krathon show minimal errors (45.4 km and 55.3 km), indicating predictable trajectories and robust model performance.
Figure 6
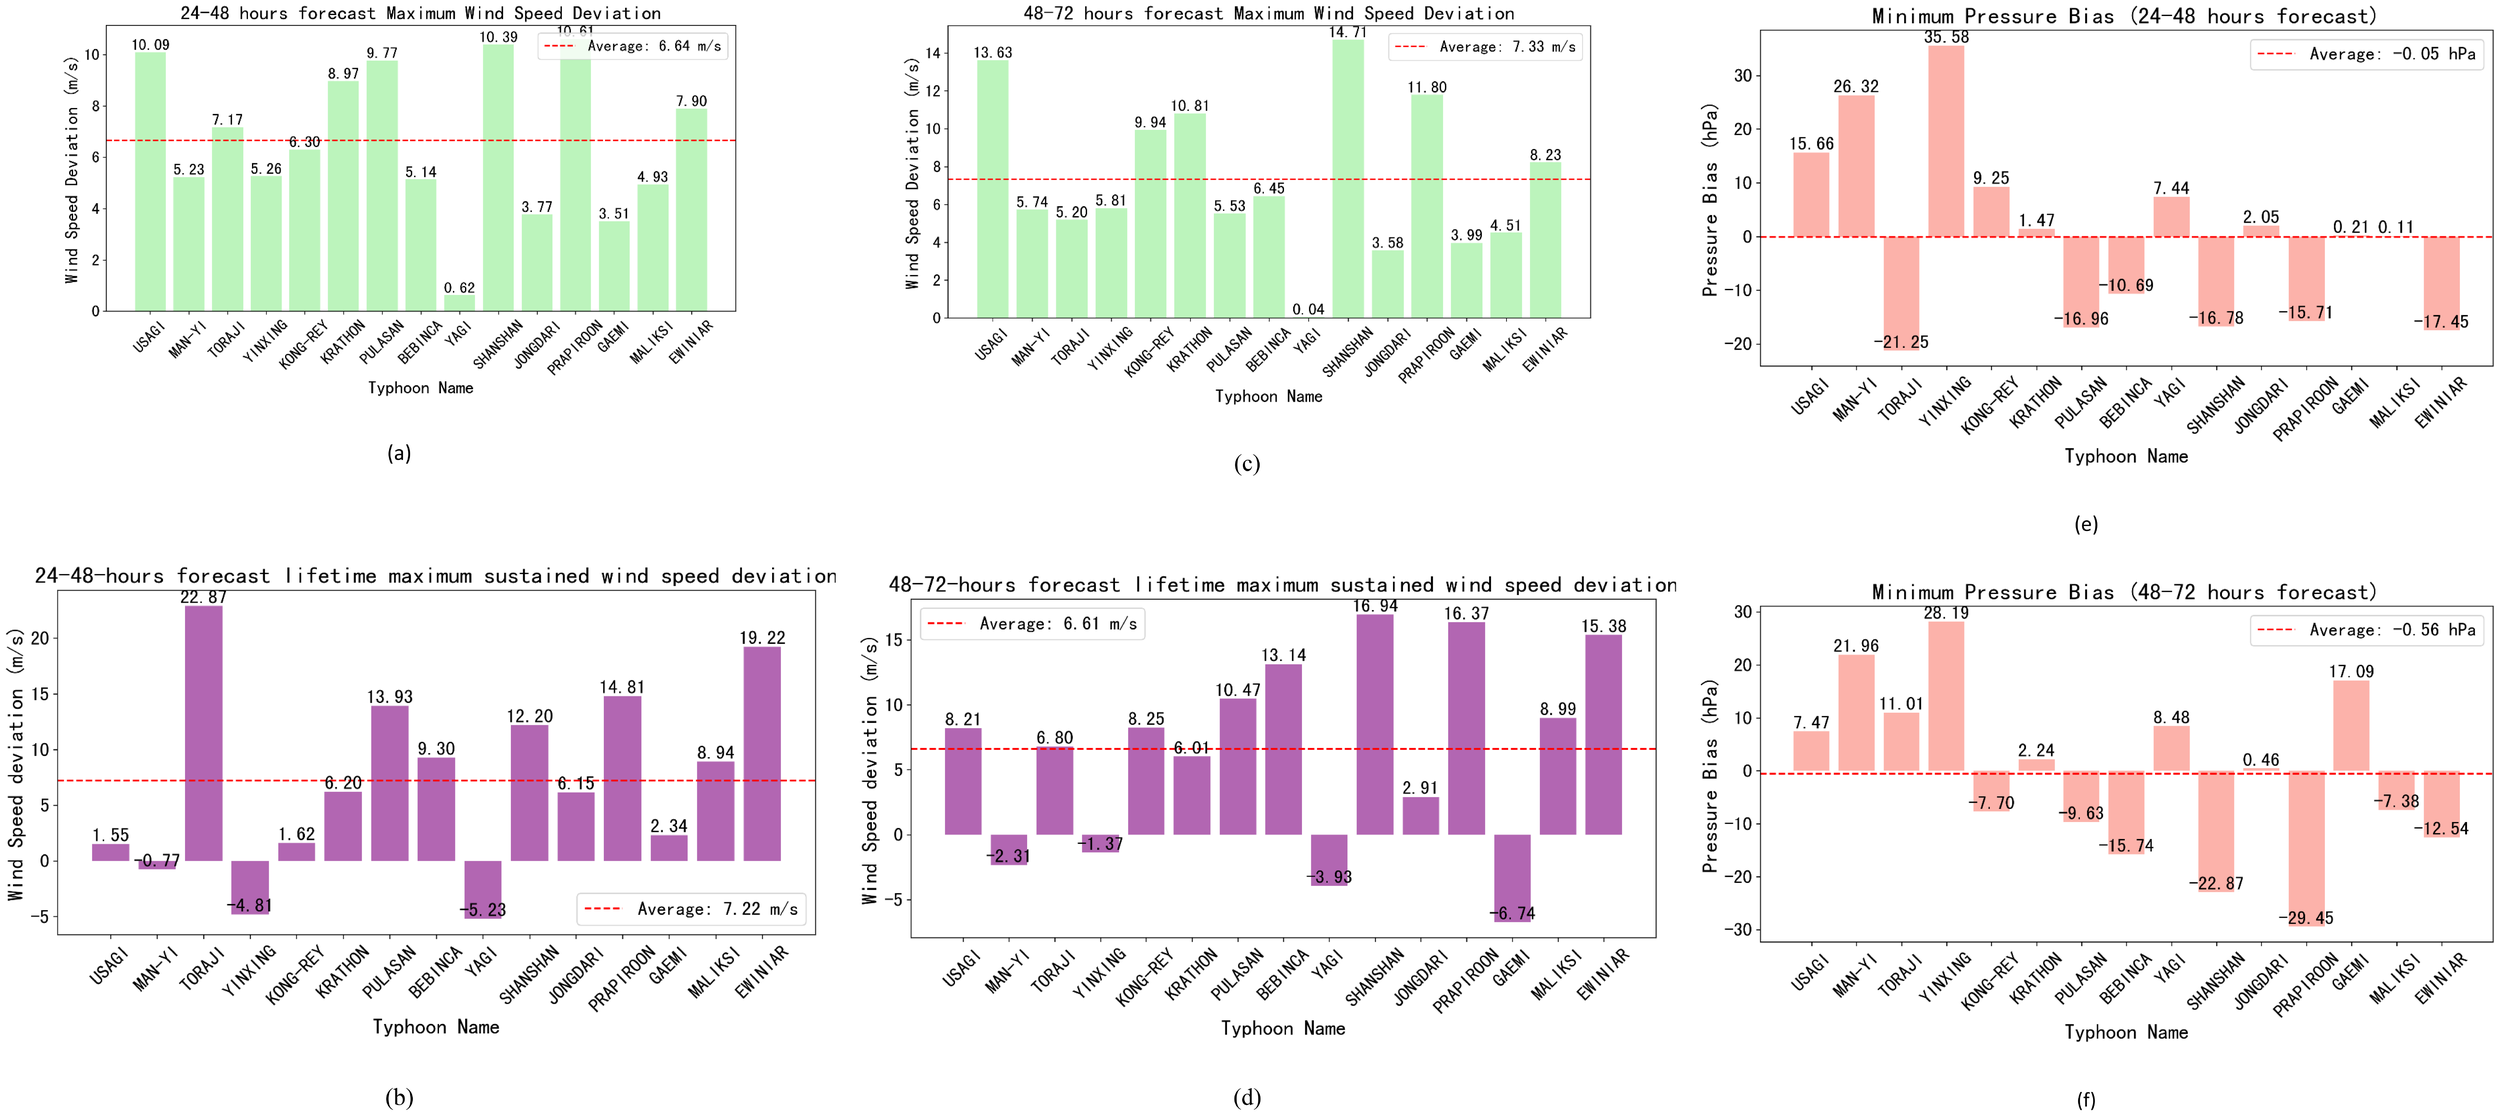
(a) Prediction deviation of 24-48-hour forecast maximum wind speed; (b) Prediction deviation of 24-48-hour forecast Lifetime Maximum Sustained Wind Speed. (LMWS); (c) Prediction deviation of 48-72-hour forecast maximum wind speed; (d) Prediction deviation of 48-72-hour forecast LMWS. (e) Mean bias of predicted minimum central pressure for 24–48-hour lead time; (f) as in (e) but for 48–72-hour lead time. Positive (negative) values denote overestimation (underestimation) of cyclone depth. Dashed red line indicates the sample-mean bias. The x-axis represents typhoon names, and the y-axis denotes error. The red dashed line indicates the mean error. In (a-d), Unit: m/s. In (e, f), Unit: hPa.
Extending predictions to 48-72hour (Figure 5d) yields a ~49% increase in mean error distance (124.4 km vs. 81.9 km for 24-48-hours), signaling diminished reliability. Most errors cluster between 100–150 km, though outliers like Jongdari (181.8 km) and Pulasan (145.2 km) highlight exacerbated uncertainties over longer timeframes. Error dispersion widens compared to 24–48-hour predictions. For example, Usagi’s error grows from 57.4 km to 101 km, and Ewiniar’s from 89.5 km to 142.0 km, reflecting the model’s waning ability to resolve track evolution and the overall decline in prediction precision is pronounced.
These results, derived from limited open-source observational datasets, underscore the challenges inherent in forecasting. The model’s sensitivity to initial conditions and its limited capacity to characterize atmospheric circulation dynamics contribute to reduced accuracy, particularly for typhoons with complex or erratic tracks.
The reported track forecast errors are comparable to the current global operational and regional typhoon/hurricane track forecast accuracy. For example, The Met Office, as a global leader in numerical weather prediction, has demonstrated remarkable accuracy in typhoon track forecasting. In 2024, their Northern Hemisphere verification report showed a 24-hour track error of 74 km, 48-hour error of 107 km, and 72-hour error of 163 km on North-west Pacific basin storms (Met Office, 2024). Yang et al. (2024) analyzed the track and intensity forecast errors of global operational models such as CMA-GFS, NCEP-GFS, ECMWF-IFS, UKMO-MetUM, and JMA-GSM, as well as regional operational models such as SHTM, CMA-TRAMS, CMA-TYM, and HWRF, for typhoons over the western North Pacific in 2022 at forecast lead times of 24-hour, 48-hour, and 72-hour. According to Table 6 of Yang et al. (2024), for global models, the 24-hour track forecast errors range from 60 km to 88 km, the 48-hour track forecast errors range from 114 km to 150 km, and the 72-hour track forecast errors range from 179 km to 236 km. ECMWF-IFS performs the best in all periods, with errors of 63.3 km, 114.8 km, and 179.7 km,respectively. In contrast, the corresponding errors of NCEP-GFS in these periods are 67.4 km, 134.2 km, and 194.0 km, respectively. For regional models, the 24-hour track forecast errors range from 55 km to 83 km, the 48-hour track forecast errors range from 104 km to 175 km, and the 72-h track forecast errors range from 180 km to 257 km. CMA-TRAMS performs the best in all periods, with errors of 55.3 km, 104.4 km, and 180.9 km, respectively. In contrast, the corresponding errors of HWRF in these periods are 83.7 km, 175.4 km, and 251.5 km, respectively. It’s noted that The NCEP Global Forecast System (GFS) analysis and forecasts provide initial and boundary conditions for the HWRF model. But HWRF is not better than GFS generally. For example, the 24, 48, 72-hour track bias of GFS is better than those of HWRF, where 67.4(GFS)/83.7(HWRF) km, 134.2(GFS)/175.4(HWRF)km, and 194.0(GFS)/251.5(HWRF).
Figure 6 illustrates the prediction mean absolute biases of typhoon maximum wind speeds simulated by the model for lead times of 24–48 hours and 48–72 hours. In this study, the maximum 10-meter wind speed within the typhoon-affected area derived from model outputs is compared against the observed maximum wind speed at corresponding time instances. Figure 6a depicts the temporal mean of prediction biases for the maximum wind speed at each synoptic time step of typhoons with a 24-48-hour lead time, with the overall mean of these temporal averages calculated as 6.64 m/s. A prevalent overestimation characteristic is evident, with particularly pronounced biases observed for typhoon Shanshan (10.39 m/s) and Prapiroon (10.61 m/s). Only a limited number of typhoons, such as Yagi (0.62 m/s), exhibit near-zero bias. This indicates a systematic tendency of the model to overestimate the maximum wind speed in its overall predictions.
Figure 6b presents the prediction biases for the Lifetime Maximum Sustained Wind Speed (LMWS), with the overall mean of these biases being 7.22 m/s. The bias varies markedly across storms: Toraji exhibits a strong overestimation (+22.87 m/s), while Yagi is underestimated by −5.23 m/s, highlighting significant case-dependent deviations in intensity prediction. However, on the whole, the model’s predictions of typhoon maximum wind speeds lean toward overestimation. Figure 6c shows the temporal mean of prediction biases for the maximum wind speed at each time step of typhoons with a 48–72-hour lead time, with the overall mean of these biases reaching 7.33 m/s. Figure 6d displays the prediction biases for typhoon LMWS with a 48–72-hour lead time, with the mean of these biases being 6.61 m/s. Prediction errors remain highly variable among storms: Gaemi is underestimated by −6.74 m/s, whereas Shanshan and Prapiroon are substantially overestimated, indicating inconsistent model performance across different cyclone environments. The intensity bias of the system is comparable to the operational system. According to Table 4 of Yang et al. (2024), for objective forecasts in 2022 over the Western North Pacific and the South China sea, the 24-hour mean absolute error (MAE) of intensity for global models ranges from 6.5 m/s to 11.0 m/s, the 48-hour MAE ranges from 9.2 m/s to 11.6 m/s, and the 72-hour MAE ranges from 7.0 m/s to 10.9 m/s. NCEP-GFS performs the best in all periods, with MAEs of 6.7 m/s, 7.7 m/s, and 7.0 m/s, respectively. In contrast, the corresponding MAEs of ECMWF-IFS in these periods are 11.0 m/s, 11.6 m/s, and 10.9 m/s, respectively. For regional models, the 24-hour MAE of intensity ranges from 5.8 m/s to 8.4 m/s, the 48-hour MAE ranges from 6.9 m/s to 8.0 m/s, and the 72-hour MAE ranges from 7.1 m/s to 7.6 m/s. CMA-TRAMS performs the best in all periods, with MAEs of 5.8 m/s, 6.9 m/s, and 7.1 m/s, respectively. In contrast, the corresponding MAEs of HWRF in these periods are 6.2 m/s, 7.9 m/s, and 7.6 m/s, respectively. Our result is comparable to these global and regional operational forecast. Again, the intensity bias of GFS vs HWRF is 6.7(GFS)/6.2(HWRF) m/s, 7.7(GFS)/7.9(HWRF) m/s, and 7.0(GFS)/7.6(HWRF) m/s, Overall, the system tends to predict stronger typhoons than observed, which reflects inherent deficiencies in the model’s representation of typhoon dynamic-thermodynamic processes. Nevertheless, underestimations in LMWS predictions occur for certain typhoons, indicating that the model’s predictive performance fluctuates across different typhoon cases.
In addition to track and 10 -meter wind speed verification, the model’s prediction of minimum central pressure (MCP) was evaluated as a supplementary intensity metric. Over the 24–48-hour and 48–72-hour forecast windows, the mean bias in MCP is −0.05 hPa and −0.56 hPa, respectively, indicating a marginal overestimation of cyclone intensity (Figures 6e, f). While the mean bias remains close to zero, per-case deviations are considerable, with absolute errors exceeding 20 hPa for several storms (e.g., Man-Yi, Toraji, and Yinxing). These discrepancies align with the model’s systematic positive bias in maximum sustained winds, suggesting that deficiencies in inner-core dynamics and surface flux parameterizations affect both wind and pressure representations. However, MCP verification was not included in the primary verification suite; hence, these results are presented only as diagnostic context, not as a comprehensive assessment.
In terms of intensity prediction, the systematic overestimation of typhoon strength reflects challenges in regional coupled models (Gramer et al., 2024). Those model still struggle with accurately representing inner-core dynamics, air-sea interactions, and cloud microphysical processes, leading to systematic intensity biases (Chen and Li, 2024; Zhao et al., 2017; Tan et al., 2025).
3.3 10-meter wind speed
Due to the significant impact of offshore wind speed on ship navigation, the main focus is on offshore wind speed forecasting. According to the forecast results of wind speeds of 10-meter over the sea, the RMSE in the northwest Pacific Ocean far from land is relatively small, while the RMSE around Japan, Taiwan Island, and the Philippines Island is relatively large (Figure 7). The RMSE of the 24-hour to 96-hour forecast shows an increasing trend, with the RMSE of the 24-hour forecast generally below 2 m/s, and the maximum RMSE area of the 96-hour forecast can exceed 3 m/s. The RMSE of 10-meter wind over the oceans shows similar patterns to rainfall, with an annual mean RMSE of 1.5 m/s for a 24-hour forecast and 2.5 m/s for a 96-hour forecast. From the monthly RMSE of the wind field in Table 4, it can be seen that it has obvious seasonal variation characteristics, with winter being smaller than summer, similar to rainfall (Table 3). It is interesting that the forecast RMSE in September is the highest of the year, which can also be seen in the precipitation forecast (Figure 4). This seasonal features of RMSE can also be seen in the ECMWF 10-meter wind forecasts. They evaluated the northern extratropical 10-meter wind speed RMSE and found the RMSE in boreal winter is higher than summer (Haiden et al., 2024). Whether the seasonal characteristics observed in our forecast experiments are valid for other years’ forecasts deserves further research.
Figure 7
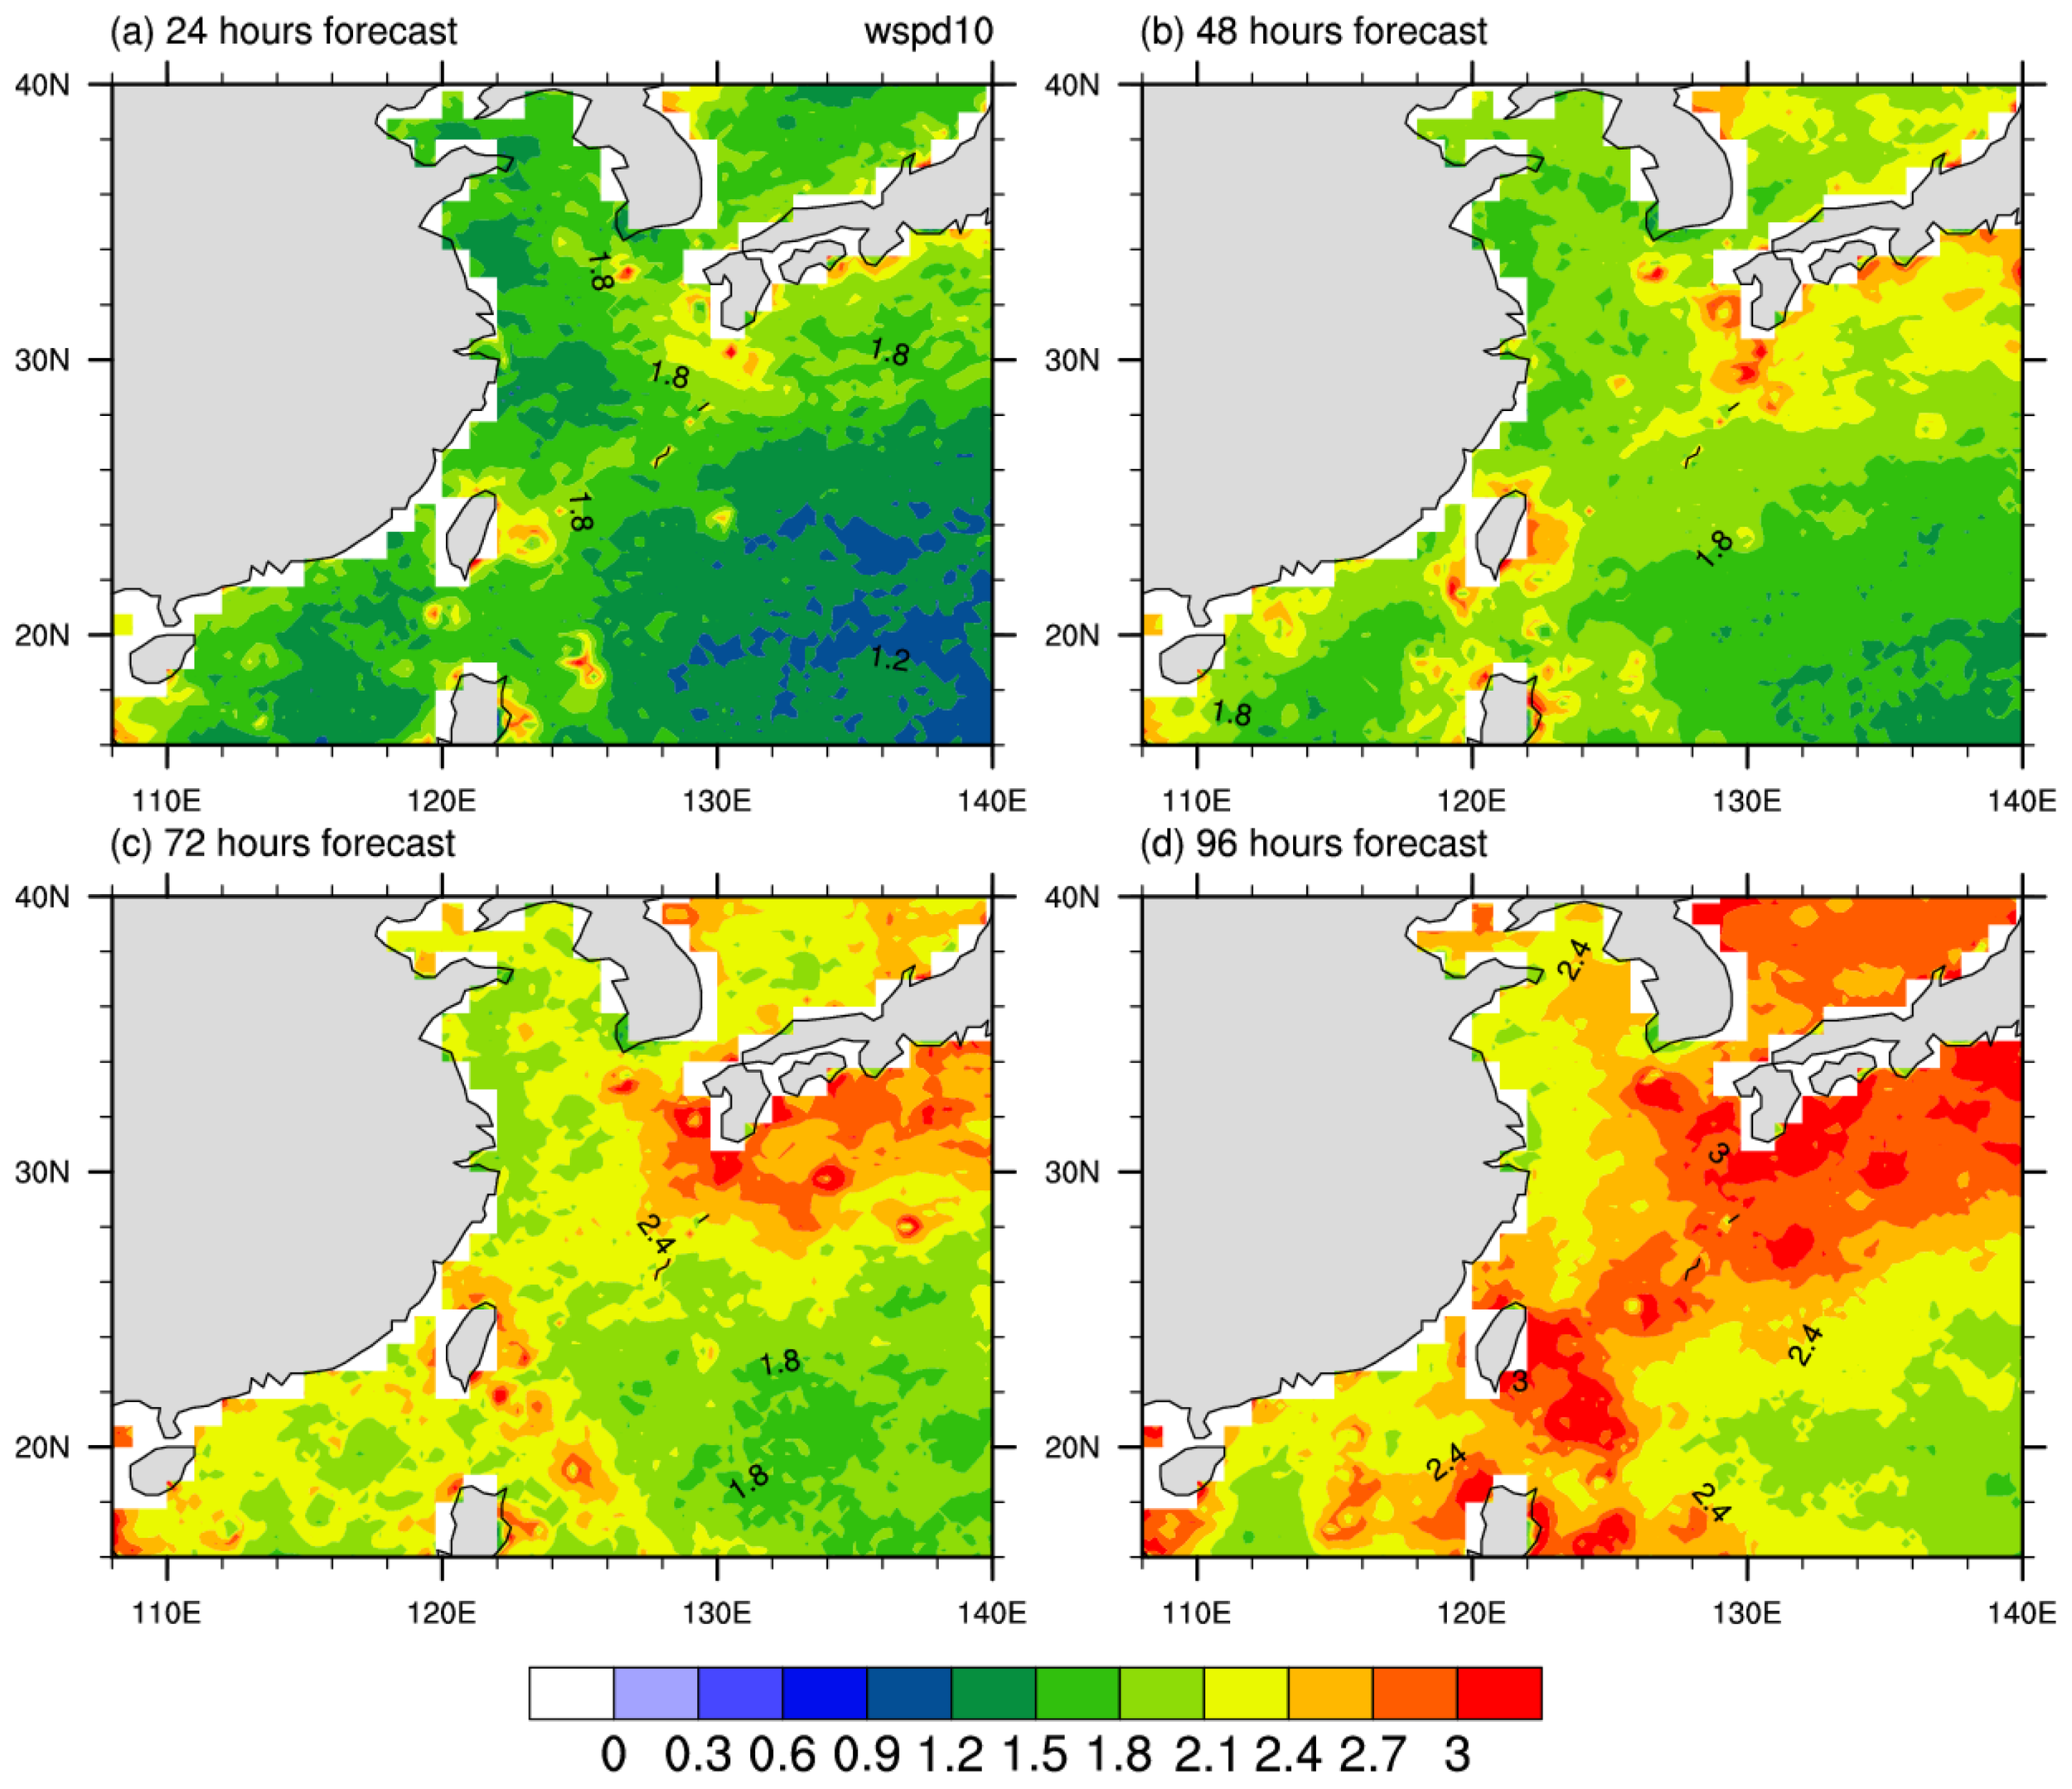
RMSE of wind speed at 10-meter height in 2024 forecast for (a) 24-hour, (b) 48-hour, (c) 72-hour and (d) 96-hour (Units: m/s).
Table 4
| Forecast lead time/Month | 1 | 2 | 3 | 4 | 5 | 6 | 7 | 8 | 9 | 10 | 11 | 12 |
|---|---|---|---|---|---|---|---|---|---|---|---|---|
| 24h | 1.4 | 1.4 | 1.5 | 1.6 | 1.6 | 1.6 | 1.7 | 1.6 | 1.9 | 1.7 | 1.6 | 1.4 |
| 48h | 1.7 | 1.8 | 1.8 | 1.8 | 1.9 | 1.8 | 1.9 | 2.0 | 2.2 | 1.8 | 2.0 | 1.7 |
| 72h | 1.8 | 1.9 | 2.0 | 2.0 | 2.1 | 2.0 | 2.1 | 2.3 | 2.7 | 2.2 | 2.2 | 1.9 |
| 96h | 2.0 | 2.0 | 2.1 | 2.3 | 2.4 | 2.3 | 2.4 | 2.9 | 3.2 | 2.6 | 2.4 | 3.7 |
RMSE for 10-meter wind speed (unit: m/s) forecast.
4 Discussion
4.1 Interpretation of key results
The forecast performance of the coupled system aligns with expectations for a 3 km resolution regional model, but also reflects characteristics linked to model design and regional weather features:
Precipitation RMSE patterns: Smaller errors over inland China (northwest of the domain) and larger errors near Taiwan, the Philippines, and southern Japan are consistent with the spatial distribution of precipitation intensity—wetter regions (influenced by summer monsoons and typhoons) inherently have higher forecast uncertainty [Jin et al., 2023; Tian et al., 2024; Wu et al., 2023]. Seasonal variations (higher RMSE in summer) further confirm that the model’s precipitation errors are closely tied to the complexity of convective processes in the East Asian monsoon (Peng et al., 2023).
Typhoon forecast performance: Track errors (74.1 km for 24–48 hours, 118.9 km for 48–72 hours) indicate the system’s ability to capture large-scale steering flows. However, systematic overestimation of maximum wind speed (mean bias: 6.64–7.33 m/s) highlights deficiencies in simulating typhoon inner-core dynamics—likely due to the absence of wind-wave coupling (wave-induced surface drag would reduce simulated wind speeds, Zhao et al., 2017).
10-meter wind speed errors: Larger RMSE near coastal regions (Japan, Taiwan, Philippines) reflect the challenge of resolving complex terrain-ocean-atmosphere interactions, while the increasing trend of RMSE with forecast lead time is a common feature of short-term numerical models (Chen et al., 2020).
4.2 Limitations and unresolved issues
4.2.1 Initialization-related biases
External data from GFS and RTOFS may not fully converge to the coupled system’s dynamic equilibrium state within the 12-hour spin-up window, leading to transient biases in the first 24 hours of forecasting (e.g., slight overestimation of coastal precipitation). This issue is widespread in regional coupled models and cannot be fully resolved, but future improvements could include:
-
Ensemble-based initialization: Generating 10–20 ensemble members with perturbed initial conditions (e.g., ± 0.5 °C SST adjustments) and subtracting the ensemble mean to eliminate systematic trends;
-
Assimilating ocean in-situ data: Integrating Argo float profiles and moored buoy observations into ROMS initialization to reduce reliance on RTOFS and improve the oceanic initial state’s consistency with the coupled system.
4.2.2 Trade-off between coupling complexity and forecast lead time
For 96-hour forecasts, the utility of ocean-atmosphere coupling has been questioned (e.g., whether simple SST schemes could suffice). While our current evaluation does not include explicit sensitivity experiments comparing coupled and uncoupled configurations, the reasonable representation of typhoon intensity—despite known biases—and the model’s ability to resolve air–sea feedbacks suggest that coupling likely contributes positively during high-impact events. This interpretation is consistent with previous studies showing that the ocean–atmosphere interaction improves typhoon forecasts (Shay et al., 2000; Wu et al., 2007; Liu et al., 2023). Rigorous quantification of this benefit will be addressed in future work through controlled experiments.
4.2.3 Absence of wind-wave coupling
The systematic overestimation of typhoon maximum wind speed (approximately 6–7 m s−¹) is likely attributable to the absence of explicit wind-wave coupling in the current atmosphere–ocean (AO) configuration. As demonstrated by Li et al. (2022) and Xu et al. (2023), incorporating wave-coupled physics—particularly wave-state-dependent surface drag, sea spray from breaking waves, and non-breaking wave-induced turbulence—can significantly reduce wind speed forecast errors. However, in our AO-only forecasting system, wind-wave coupling (including the sea wave component) is not included. Consequently, the model likely overestimates surface stress under typhoon conditions due to an unrealistically linear increase in the drag coefficient with wind speed. This missing “natural brake” on momentum transfer leads to excessive wind intensification and contributes substantially to the observed positive bias. To address this limitation, future development will integrate a spectral wave model (e.g., SWAN) to enable wave-state-dependent air–sea flux parameterizations, thereby achieving a more physically consistent representation of high-wind air–sea interactions and mitigating the systematic intensity error.
5 Summary
In this work, we developed a regional air-sea coupled weather forecasting model for the western north Pacific region (15-40°N, 108-146°E). The atmospheric component of the coupled model is WRF model and the oceanic component is ROMS model. The horizontal resolution is ~3 km. A daily rolling 96-hour forecast experiments, which starts daily at 00:00 from January 1, 2024 to December 31, 2024 is conducted and a preliminary evaluation is provided in this study. Results show that the annual mean rainfall RMSE for the whole region is 13.7 (16.3) mm/day for 24 (96) hours forecast. For the spatial pattern of RMSE, on the northwest land of the region (inland China) is generally smaller than that on the ocean, especially the RMSE near Taiwan, and the Philippines is relatively larger, which is associated with the average high precipitation near Taiwan Island to the Philippines Island region. The RMSE in southern Japan is also relatively large. The forecast skill is featured by notable seasonal variation, with higher RMSE in summer than winter. For typhoon forecast, the mean error distance for 24–48 hours forecast is 74.1 km (23.7-154.6 km) and 118.9 km (29.4–227.5 km) for 48–72 hours forecast. The system tends to predict stronger typhoons than observed, which reflects inherent deficiencies in the model’s representation of typhoon dynamic-thermodynamic processes. Nevertheless, underestimations in LMWS predictions occur for certain typhoons, indicating that the model’s predictive performance fluctuates across different typhoon cases. The annual mean 10-meter wind RMSE for 24 (96) hours forecast is 1.5 (2.5) m/s. For the spatial features, the RMSE in the northwest Pacific Ocean far from land is relatively small, while the RMSE around Japan, Taiwan Island, and the Philippines Island is relatively large.
The model discrepancies are primarily attributable to the prototype’s limitations. First, the model relies on every limited observational data, a far cry from the Met Office’s comprehensive global network of satellites, buoys, and aircraft reconnaissance. Such data scarcity compromises the accuracy of initial conditions, a cornerstone of accurate track forecasting. Second, as an ocean - atmosphere coupled system in its infancy, the prototype grapples with underdeveloped data assimilation, unrefined parameterization and lack of wave model and ensemble forecasting capability. In contrast, the operation model has spent decadently optimizing their model, refining physics schemes, integrating diverse observational datasets to enhance model fidelity, and employing very complex ensemble strategy.
To address the above limitations and systematic forecast bias identified in this study, the prototype system urgently requires several improvements. First, integrating a wind-wave component may be critical to mitigate the typhoon intensity bias. Second, implementing ensemble-based initialization enhances initial conditions and optimize spin-up process. It mitigates biases arising from the “attractor problem” — where initial conditions from uncoupled global models (GFS, RTOFS) require time to adjust to the coupled system’s internal dynamics Third. incorporating the latest parameterization schemes, such as those developed by the China Meteorological Administration (CMA) for boundary layer and cloud physics, could significantly reduce intensity biases (Tan et al., 2025). Fourth, considering advanced ocean assimilation approach into this regional air-sea coupled weather forecasting model is our future work in order to strengthen the ROMS component by providing a more accurate and dynamically consistent oceanic initial state. Last, integrating machine - learning algorithms, offers great potential for improving both track and intensity forecasts (Xu et al., 2025; Niu et al., 2025). By leveraging these advancements, the prototype may gradually approach the accuracy standards set by the Met Office and other leading forecasting centers.
Statements
Data availability statement
The raw data supporting the conclusions of this article will be made available by the authors, without undue reservation.
Author contributions
JH: Conceptualization, Formal Analysis, Funding acquisition, Investigation, Methodology, Software, Writing – original draft, Writing – review & editing. JJ: Project administration, Resources, Software, Supervision, Writing – original draft, Writing – review & editing. XD: Data curation, Formal Analysis, Software, Visualization, Writing – original draft, Writing – review & editing. DZ: Software, Writing – review & editing. XZ: Funding acquisition, Project administration, Supervision, Writing – review & editing. GZ: Conceptualization, Funding acquisition, Project administration, Supervision, Writing – review & editing.
Funding
The author(s) declare financial support was received for the research and/or publication of this article. The National Key Research and Development Program of China (Grant 2022YFC3104803; Grant 2024YFF0809004) the Strategic Priority Research Program of the Chinese Academy of Sciences, Grant No. XDA0500201, the Youth Innovation Promotion Association of the Chinese Academy of Sciences (Grant2022074). The National Large Scientific and Technological Infrastructure project “Earth System Numerical Simulation Facility” (https://cstr.cn/31134.02.EL).
Acknowledgments
This work is jointly supported by the National Key Research and Development Program of China (Grant 2022YFC3104803; Grant 2024YFF0809004), the Strategic Priority Research Program of the Chinese Academy of Sciences, Grant No. XDA0500201, the Youth Innovation Promotion Association of the Chinese Academy of Sciences (Grant2022074). We acknowledge the National Large Scientific and Technological Infrastructure project “Earth System Numerical Simulation Facility” (https://cstr.cn/31134.02.EL) for supporting the simulations in this study.
Conflict of interest
The authors declare that the research was conducted in the absence of any commercial or financial relationships that could be construed as a potential conflict of interest.
Generative AI statement
The author(s) declare that no Generative AI was used in the creation of this manuscript.
Any alternative text (alt text) provided alongside figures in this article has been generated by Frontiers with the support of artificial intelligence and reasonable efforts have been made to ensure accuracy, including review by the authors wherever possible. If you identify any issues, please contact us.
Publisher’s note
All claims expressed in this article are solely those of the authors and do not necessarily represent those of their affiliated organizations, or those of the publisher, the editors and the reviewers. Any product that may be evaluated in this article, or claim that may be made by its manufacturer, is not guaranteed or endorsed by the publisher.
References
1
Cha D. H. Jin C. S. Moon J. H. Lee D. K. (2016). Improvement of regional climate simulation of East Asian summer monsoon by coupled air-sea interaction and large-scale nudging. Int. J. Climatol.36, 334–345. doi: 10.1002/joc.4349
2
Chen J. Wang J. Du J. Xia Y. Chen F. Hongqi L. (2020). Forecast bias correction through model integration: A dynamical wholesale approach. Q. J. R. Meteorol. Soc.146, 1149–1168. doi: 10.1002/qj.3730
3
Chen S. Li W. (2024). A review of typhoon inner core characteristics and their relationship with intensity changes. Atmosphere15, 1522. doi: 10.3390/atmos15121522
4
Dai Y. Li H. Sun L. (2019). The simulation of East Asian summer monsoon precipitation with a regional ocean-atmosphere coupled model. J. Geophys. Res. Atmos.123, 11362–11376. doi: 10.1029/2018JD029161
5
Ding Y. Chan J. C. L. (2005). The East Asian summer monsoon: an overview. Meteorol. Atmos. Phys.89, 117–142. doi: 10.1007/s00703-005-0125-z
6
Dowell D. C. Alexander C. R. James E. P. Weygandt S. S. Benjamin S. G. Manikin G. S. et al . (2022). The high-resolution rapid refresh (HRRR): an hourly updating convection-allowing forecast model. Part I: motivation and system description. Wea. Forecasting37, 1371–1395. doi: 10.1175/WAF-D-21-0151.1
7
Fang G. Susanto R. D Wirasantosa S. Qiao F. Supangat A. Fan B. et al . (2010). Volume, heat, and freshwater transports from the South China Sea to Indonesian seas in the boreal winter of 2007-2008. J. Geophys. Res.115, C12020. doi: 10.1029/2010JC006225
8
Feser F. Rockel B. von Storch H. Winterfeldt J. Zahn M. (2011). Regional climate models add value to global model data: A review and selected examples. Bull. Amer. Meteor. Soc.92, 1181–1192. doi: 10.1175/2011BAMS3061.1
9
Fu D. Small J. Kurian J. Liu Y. Kauffman B. Gopal A. et al . (2021). Introducing the new regional community earth system model, R-CESM. Bull. Amer. Meteor. Soc.102, 1821–1843. doi: 10.1175/BAMS-D-20-0104.1
10
Garraffo Z. D. Cummings J. A. Paturi S. Hao Y. Iredell D. Spindler T. et al . (2020). “ RTOFS-DA: real time ocean-sea ice coupled three dimensional variational global data assimilative ocean forecast system,” in Research Activities in Earth System Modelling. Ed. AstakhovaE. ( WMO, Geneva).
11
Giorgi F. (1995). Perspectives for regional earth system modeling. Glob. Planet. Change10, 23–42. doi: 10.1016/0921-8181(94)00016-3
12
Giorgi F. (2019). Thirty years of regional climate modeling: Where are we and where are we going next? J. Geophys. Res. Atmos.124, 5696–5723. doi: 10.1029/2018JD030094
13
Giorgi F. Bi X. Qian Y. (2003). Indirect vs. direct effects of anthropogenic sulfate on the climate of east Asia as simulated with a regional coupled climate-chemistry/aerosol model. Clim. Change58, 345–376. doi: 10.1023/A:1023946010350
14
Gramer L. Steffen J. Aristizabal Vargas M. Kim H. (2024). The impact of coupling a dynamic ocean in the Hurricane Analysis and Forecast System. Front. Earth Sci.12. doi: 10.3389/feart.2024.1418016
15
Gutowski W. J. Ullrich P. Hall A. Leung L. Y. O'Brien T. A. Patricola C. et al .(2020). The ongoing need for high-resolution regional climate models: process understanding and stakeholder information. Bull. Amer. Meteor. Soc.101, E664–E683.
16
Haiden T. Janousek M. Vitart F. Tanguy M. Prates F. Chevallier M. et al . (2024). “ Evaluation of ECMWF forecasts,” in European Centre for Medium Range Weather Forecasts Technical Memoranda. (Reading: ECMWF) 918.
17
He C. Zhou T. Wu B. (2015). The key oceanic regions responsible for the interannual variability of the western north pacific subtropical high and associated mechanisms. J. Meteor. Res.29, 562–575. doi: 10.1007/s13351-015-4117-8
18
Hersbach H. Bell B. Berrisford P. Hirahara S. Horányi A. Muñoz-Sabater J. et al . (2020). The ERA5 global reanalysis. Q. J. R. Meteorol. Soc.146, 1999–2049. doi: 10.1002/qj.3803
19
Hostetler S. W. Bates G. T. Giorgi F. (1993). Interactive coupling of a lake thermal model with a regional climate model. J. Geophys. Res. Atmos.98, 5045–5057. doi: 10.1029/92JD02843
20
Huffman G. J. Adler R. F. Morrissey M. M. Bolvin D. T. Curtis S. Joyce R. et al . (2001). Global precipitation at one-degree daily resolution from multi-satellite observations. J. Hydrometeor.2, 36–50. doi: 10.1175/1525-7541(2001)002<0036:GPAODD>2.0.CO;2
21
Jiangbo J. Dong X. He J. Gao X. Zhang B. Zeng Q. et al . (2023). A Regional Air-Sea coupled Model developed for the East Asia and Western North Pacific Monsoon Region. J. Geophys. Res. Atmos.128, e2022JD038199. doi: 10.1029/2022JD038199
22
Kay J. E. Deser C. Phillips A. Mai A. Hannay C. Strand G. et al . (2015). The Community Earth System Model (CESM) large ensemble project: A community resource for studying climate change in the presence of internal climate variability. Bull. Amer. Meteor. Soc.96, 1333–1349. doi: 10.1175/BAMS-D-13-00255.1
23
Kleist D. T. Parrish D. F. Derber J. C. Treadon R. Wu W. S. Lord S. (2009). Introduction of the GSI into the NCEP global data assimilation system. Wea. Forecasting24, 1691–1705. doi: 10.1175/2009WAF2222201.1
24
Kong X. H. Jin J. B. Wang A. H. Dong X. Bi X. Q. Zhang H. (2024). Impacts of nudged sea surface temperature on tropical precipitation, moisture and vertical velocity in an earth system model. J. Clim37, 457–473. doi: 10.1175/JCLI-D-23-0123.1
25
Kosaka Y. (2021). Chapter 13 – Coupling of the Indian, western North Pacific, and East Asian summer monsoons. Indian Summer Monsoon Variability, El-Nino Teleconnections and Beyond. Eds. ChowdaryJ.ParekhA.GnanaseelanC. ( Elsevier) 263–286. Available online at: https://www.sciencedirect.com/book/edited-volume/9780128224021/indian-summer-monsoon-variability.
26
Large W. G. Yeager S. G. (2004). Diurnal to Decadal Global Forcing for Ocean and Sea-Ice Models: The Data Sets and Flux Climatologies. NCAR Technical Note, NCAR/TN-460+STR. (Boulder: NCAR). doi: 10.5065/D6KK98Q6
27
Lee D. K. Cha D. H. (2020). Regional climate modeling for Asia. Geosci. Lett.7, 1–12. doi: 10.1186/s40562-020-00158-4
28
Li Z. Tam C. Y. Li Y. Lau N. C. Chen J. Chan S. T. et al . (2022). How does air-sea wave interaction affect tropical cyclone intensity? An atmosphere-wave-ocean coupled model study based on super typhoon Mangkhut, (2018). Earth Space Sci.9, e2021EA002136. doi: 10.1029/2021EA002136
29
Liu X. Sun C. Zuo J. (2023). The interactions between ocean and three consecutive typhoons affecting Northeast Asia in 2020 from a model perspective. J. Geophys. Res. Atmos.128, e2022JD036442. doi: 10.1029/2022JD036442
30
Long M. Yu K. Lu Y. Wang S. Tang J. (2024). High resolution regional climate simulation over CORDEX East Asia phase II domain using the COAWST Ocean-atmosphere coupled model. Clim. Dyn.63, 123–145. doi: 10.1007/s00382-024-07356-2
31
Lu R. Lu S. (2015). Asymmetric relationship between Indian Ocean SST and the western North Pacific Summer Monsoon. J. Clim28, 1383–1395. doi: 10.1175/JCLI-D-14-00048.1
32
Ma Z. Fei J. Huang X. et al (2019). A study of the interaction between typhoon Francisco (2013) and a cold core eddy. Part I: Rapid weakening. J. Atmos. Sci.77, 2865–2883. doi: 10.1175/JAS-D-19-0339.1
33
Met Office . (2024). Tropical Cyclone Verification Northern Hemisphere 2024. Available online at: https://www.metoffice.gov.uk/research/weather/tropical-cyclones/verification/summaries/nhem2024 (Accessed March 15, 2024).
34
Neelin J. D. Latif M. Allaart M. A. F. Cane M. A. Cubasch U. Gates W. L. et al . (1992). Tropical air-sea interaction in general circulation models. Clim. Dyn.7, 73–104. doi: 10.1007/BF00209600
35
Niu Z. Wang D. Mu M. Huang W. Fan X. Yang M. et al . (2025). Machine-learning (ML)-physics fusion model accelerates the paradigm shift in typhoon forecasting with a CNOP-based assimilation framework. Geophys. Res. Lett.52, e2025GL115926. doi: 10.1029/2025GL115926
36
Peng J. Li K. Dan L. Tang X. Xu Z. Zou L. et al . (2023). Sea-air coupling leads to a decrease in precipitation in East Asia under present day conditions that is partially alleviated in future simulations. NPJ Clim. Atmos. Sci.6, 174. doi: 10.1038/s41612-023-00498-w
37
Peng S. Q. Liu D. L. Sun Z. B. Li Y. N. (2012). Recent advances in regional air-sea coupled models. Sci. China Earth Sci.55, 1391–1405. doi: 10.1007/s11430-012-4414-3
38
Shay L. K. Goni G. J. Black P. G. (2000). Effects of a warm oceanic feature on hurricane Opal. Mon. Wea. Rev.128, 1366–1383. doi: 10.1175/1520-0493(2000)128<1366:EOAWOF>2.0.CO;2
39
Smith B. Samuelsson P. Wramneby A. Rummukainen M. (2010). A model of the coupled dynamics of climate, vegetation and terrestrial ecosystem biogeochemistry for regional applications. Tellus A63, 87–106. doi: 10.1111/j.1600-0870.2010.00477.x
40
Sun J. He H. Hu X. Wang D. Gao C. Song J. (2019). Numerical simulations of typhoon Hagupit, (2008) using WRF. Wea. Forecasting34, 999–1015. doi: 10.1175/WAF-D-18-0174.1
41
Tan X. Gao Z. Li Y. (2025). Typhoon Kompasu, (2118) simulation with planetary boundary layer and cloud physics parameterization improvements. Atmos. Ocean. Sci. Lett., 100592. doi: 10.1016/j.aosl.2025.100592
42
Tapiador F. J. Navarro A. Martín R. Hristova-Veleva S. Haddad Z. S. (2022). Predicting tropical cyclone rapid intensification from satellite microwave data and neural networks. IEEE Trans. Geosci. Remote Sens.60, 1–13. doi: 10.1109/TGRS.2021.3125333
43
Tian Y. Ji Y. Gao X. Yuan X. Zhi X. (2024). Post-processing of short-term quantitative precipitation forecast with the multi-stream convolutional neural network. Atmos. Res.309, 107584. doi: 10.1016/j.atmosres.2024.107584
44
Warner J. C. Armstrong B. He R. Zambon J. B. (2010). Development of a coupled Ocean-Atmosphere-Wave-Sediment Transport (COAWST) modeling system. Ocean Model.35, 230–244. doi: 10.1016/j.ocemod.2010.07.010
45
Wu C. Lee C. Lin I. I. (2007). The effect of the ocean eddy on tropical cyclone intensity. J. Atmos. Sci.64, 3562–3578. doi: 10.1175/JAS4051.1
46
Wu Q. Zheng Z. Li L. Wu S. Liu Y. (2023). Prediction skill and predictability of precipitation during Meiyu and rainy season in North China using ECMWF subseasonal forecasts. Clim. Dyn.61, 5429–5441. doi: 10.1007/s00382-023-06858-9
47
Xu X. Voermans J. J. Zhang W. Zhao B. Qiao F. Liu Q. et al . (2023). Tropical Cyclone modeling with the inclusion of wave-coupled processes: Sea spray and wave turbulence. Geophys. Res. Lett.50, e2023GL106536. doi: 10.1029/2023GL106536
48
Xu H. Zhao Y. Dajun Z. Duan Y. Xu X. (2025). Exploring the typhoon intensity forecasting through integrating AI weather forecasting with regional numerical weather model. NPJ Clim. Atmos. Sci.8, 38. doi: 10.1038/s41612-025-00926-z
49
Yang S. (2002). Variations of the East Asian jet stream and Asian–Pacific–American winter climate anomalies. J. Climate15, 306–325. doi: 10.1175/1520-0442(2002)015<0306:VOTEAJ>2.0.CO;2
50
Yang M. Chen G. Zhang X. Tang L. Bai L. Guo R. (2024). Verification on typhoon forecasts over the western north Pacific and the South China Sea in 2022. Meteorol. Mon.50, 630–641. doi: 10.7519/j.issn.1000-0526.2024.031404
51
Yao S. X. Zhang Y. C. (2008). Simulation of China summer precipitation with a regional air-sea coupled model. Acta Meteorol. Sin.66, 131–142.
52
Zhang Y. Wu Z. Zhang L. Zheng H. (2022). A comparison of spectral bin microphysics versus bulk parameterization in forecasting typhoon In-Fa (2021) before, during, and after its landfall.Remote Sens.14, 2169.
53
Zhao B. Qiao F. Cavaleri L. Wang G. Bertotti L. Liu L. et al . (2017). Sensitivity of typhoon modeling to surface waves and rainfall. J. Geophys. Res. Oceans122, 1702–1723. doi: 10.1002/2016JC012262
54
Zhou X. Zhu Y. Hou D. Fu B. Li W. Guan H. et al . (2022). The development of the NCEP global ensemble forecast system version 12. Wea. Forecasting37, 1069–1084. doi: 10.1175/WAF-D-21-0112.1
55
Zou L. Zhou T. (2013). Can a Regional ocean-atmosphere coupled Model improve the Simulation of the Interannual variability of the western North Pacific Summer Monsoon? J. Clim26, 2353–2367. doi: 10.1175/JCLI-D-11-00767.1
56
Zou L. Zhou T. (2016). A regional ocean atmosphere coupled model developed for CORDEX East Asia: assessment of Asian summer monsoon simulation. Clim. Dyn.47, 3627–3640. doi: 10.1007/s00382-016-3034-6
Summary
Keywords
ROMS, regional coupled model, WRF, precipitation, typhoon
Citation
He J, Jin J, Dong X, Zhang D, Zeng X and Zhou G (2025) The development of a high-resolution regional ocean –atmosphere forecast system for the East Asia and western North Pacific. Front. Mar. Sci. 12:1715903. doi: 10.3389/fmars.2025.1715903
Received
30 September 2025
Revised
05 November 2025
Accepted
10 November 2025
Published
28 November 2025
Volume
12 - 2025
Edited by
Chunyan Li, Louisiana State University, United States
Reviewed by
Hailun He, Ministry of Natural Resources, China
Mangala Amunugama, Kabushiki Kaisha ECOH, Japan
Updates
Copyright
© 2025 He, Jin, Dong, Zhang, Zeng and Zhou.
This is an open-access article distributed under the terms of the Creative Commons Attribution License (CC BY). The use, distribution or reproduction in other forums is permitted, provided the original author(s) and the copyright owner(s) are credited and that the original publication in this journal is cited, in accordance with accepted academic practice. No use, distribution or reproduction is permitted which does not comply with these terms.
*Correspondence: Jiangbo Jin, jinjiangbo@mail.iap.ac.cn; Xiao Dong, dongxiao@mail.iap.ac.cn
Disclaimer
All claims expressed in this article are solely those of the authors and do not necessarily represent those of their affiliated organizations, or those of the publisher, the editors and the reviewers. Any product that may be evaluated in this article or claim that may be made by its manufacturer is not guaranteed or endorsed by the publisher.