Abstract
Quantification of the size and overlap of trophic niches of species with similar diets is crucial to understand food web dynamics. However, there are difficulties in determining all food resources used by each species over time and resolving competition suggested by niche overlap. In this study, we compare niche estimations in zooplankton and four species of planktivorous fish using stable carbon and nitrogen isotopes analyzed in bulk tissue samples with those using stable nitrogen isotopes in amino acids. Samples were collected in spring 2021 and 2022 in two areas of the northwestern Iberian shelf (Galicia) and southern Bay of Biscay (mar Cantábrico) with different influence of the seasonal upwelling. Estimations of trophic niches using both methods were complementary, revealing interspecific differences among fish species in the exploitation of food web resources. For instance, marked differences in the sources of carbon and nitrogen and low niche overlap indicated local feeding for zooplankton and some fish species (sardine and chub mackerel), while other species showed large variability in sources and niche overlap across zones (anchovy and mackerel). The apparent competition of fish species for resources suggested by these results can be explained by differences in their mobility, particularly in mackerel and anchovy, when the isotopic signal is not equilibrated with the new diet.
1 Introduction
Identifying all the resources and environmental factors that shape a species’ ecological niche is challenging (Hutchinson, 1978). However, some factors relevant to explain the persistence of species can be detected. For instance, quantifying the trophic niche of populations is critical for understanding food web dynamics and assessing the functional roles of species (Layman et al., 2012). Competition and resource availability can influence trophic niche size. Small trophic niches are indicative of high dietary specialization, as a mechanism to avoid competition, while large niches are found in generalist feeders (Lesser et al., 2020). Coexisting species can have overlapping niches across various dimensions when resources are scarce, but they must differ in at least one to prevent competitive exclusion (Hutchinson, 1978).
Variability in the use of trophic resources (e.g. generalist vs. specialist feeding strategies) can be assessed using the natural abundance of stable isotopes in organisms; by measuring isotopes of two or more elements, the isotopic niche provides a multidimensional space to estimate the trophic niche dimension of the species or populations of interest (Layman et al., 2012). Different metrics can be computed on this space, allowing numerical analysis and comparisons among species, communities and habitats (Jackson et al., 2011). These metrics were typically applied to isotopic measurements in bulk organisms or tissues to identify potential competition and species differences in habitat exploitation (González et al., 2023; Masski et al., 2024) but there are still uncertainties in their interpretation (Lesser et al., 2020). In the case of nitrogen and carbon, employed in most studies, their isotopic signatures are generally assumed to represent the trophic level and the food source to the consumer, respectively (Layman et al., 2012). However, the variability in nitrogen isotopes is related not only to the trophic position (TP) of a particular species but also to the composition of the sources of nitrogen for a particular food web. In addition, the carbon isotope composition of organic tissues is affected by metabolic processes, as the temporal storage of lipids which are depleted in the heavy carbon isotope (Sweeting et al., 2006; Smyntek et al., 2007).
The determination of stable isotopes in specific compounds can improve the differentiation between trophic enrichment and source changes, as shown by nitrogen stable isotopes in amino acids (McMahon and McCarthy, 2016). Some amino acids in the consumer tissues show relatively large differences in nitrogen isotopes with those in the feeding resources (i.e. trophic amino acids), and such differences are consistent across trophic steps in the food web. Other amino acids display low variability in their nitrogen isotope composition across trophic levels (i.e. source amino acids) and are thus indicative of the nitrogen sources used by the primary producers of a particular food web. The separation of trophic and source components of the nitrogen isotope composition allows for precise determinations of the consumer TP but also for estimations of the exploitation of different food webs characterized by their different nitrogen sources (Xing et al., 2020). Therefore, nitrogen isotopes in trophic and source amino acids provide relevant dimensions of the trophic niche; however, to date, they have not been applied to analyses of the trophic niche. Omnivorous organisms challenge the concept of a stable trophic niche structuring biological communities (e.g., Gaston and Chown, 2005) because of their diet plasticity (i.e. large variety of prey depending of local availability).
In marine ecosystems, zooplankton and planktivorous mid-trophic level fish are important examples of this omnivorous feeding. They play a key role in food webs by channeling resources bottom-up and top-down (Cury et al., 2000). Mesozooplankton is defined as the planktonic fraction between 200 and 2000 µm. It represents a key component in marine food webs due to its high abundance and variable TP, acting as a critical link between phytoplankton and planktivorous fish species (Alcaraz and Calbet, 2007). These fish are also important food resources for top consumers, such as dolphins (Saavedra et al., 2022) and other commercial fisheries (ICES, 2023). Among these mid trophic level fish, anchovy (Engraulis encrasicolus) and sardine (Sardina pilchardus) represent two of the most exploited pelagic species in the northeastern Atlantic. Also, other planktivore species, such as Atlantic chub mackerel (Scomber colias) and Atlantic mackerel (Scomber scombrus) represent large part of the fish landings (ICES, 2023). The TP and trophic niche of anchovy, sardine, chub mackerel and mackerel have been previously analyzed (Bode et al., 2007, 2018; Lopez-Lopez et al., 2017; Ohshimo et al., 2021; Masski et al., 2024), but the results differ between areas and seasons because of their feeding plasticity, confirming that either TP or niche size cannot be extrapolated beyond the time frame and spatial dimension of each study. In addition, most of these species display seasonal migrations for feeding and reproduction (Whitehead et al., 1984; Carrera and Porteiro, 2003; Jansen et al., 2012; Martins et al., 2013). These migrations would likely affect their exploitation of different food webs.
Changes in the diet and TP of mid trophic level fish (Lerner et al., 2022) and zooplankton (Hunt et al., 2017; Décima, 2022; García-Seoane et al., 2023) are related to ecosystem productivity. For instance, the highly productive upwelling ecosystems support large populations of zooplankton and fish with large fluctuations in abundance related to upwelling dynamics (Cury et al., 2000). In the case of the Canary Current Upwelling System, extending from the northwestern African coast to the northwestern Iberian Peninsula, annual variations in the biomass of sardine populations were related to both climatic and biological factors mainly affecting the recruitment of young individuals (Carrera and Porteiro, 2003; Bode et al., 2018). In the Atlantic Iberian shelf, the seasonal upwelling is forced by northern winds from March to October. The upwelling produces significant inputs of nutrients (Álvarez-Salgado et al., 2002), enhancing phytoplankton productivity and subsequently modifying trophic dynamics (García-Seoane et al., 2023). However, the intensity of the upwelling differs across regions. In the northern region (mar Cantábrico), the upwelling events are spatially and temporally limited (Botas et al., 1990), resulting in a comparatively lower impact. In contrast, the Western shelf (Portugal and Galicia) experiences more intensive upwelling, which significantly influences mesozooplankton communities by increasing both their abundance and biomass, particularly of copepods (García-Seoane et al., 2023). This group shows large diet plasticity, which affects the structure and function of marine food webs (Prowe et al., 2018). However, fish species respond differently to these changes; for instance, sardine recruitment can be either positively or negatively affected. During upwelling events, northern winds transport the eggs and larvae offshore, reducing larval survival rates due to the displacement from productive coastal areas (Guisande et al., 2001). However, southerly winds tend to retain fish larvae at the coast, where production is higher (Fernández et al., 1993), thereby increasing their chances of survival.
The objective of this study is to compare niche metrics of zooplankton and several species of planktivorous fish between two shelf areas (northwestern Iberian Peninsula and Southern Bay of Biscay) with distinct oceanic conditions, using stable isotopes of carbon and nitrogen in bulk samples and nitrogen isotopes in amino acids. We hypothesize that the niches of zooplankton and fish are shaped by different factors. While the size of the zooplanktonic niche will be related mainly with the variability of the sources of carbon and nitrogen within shelf zones, the size of the niche of fish will be also influenced by their alimentary specialization and by the migration patterns of local populations. Niche metrics were computed using Bayesian models applied to verify the zonal variability in relation to the upwelling intensity.
2 Material and methods
2.1 Sample collection
During the PELACUS cruises in spring (March-April) 2021 and 2022, mesozooplankton and four species of small and medium-sized pelagic fish were sampled across two areas of the northwestern Iberian shelf (Galicia) and southern Bay of Biscay (mar Cantábrico). These cruises are multidisciplinary surveys aimed at characterizing and assessing the main fishery resources and environmental conditions along the northern and northwestern Spanish shelf (Bode et al., 2007, 2018; ICES, 2023). Plankton stations were distributed over the shelf and adjacent ocean waters to characterize prey items available to the target fish species, that were collected in shelf waters (Figure 1).
Figure 1
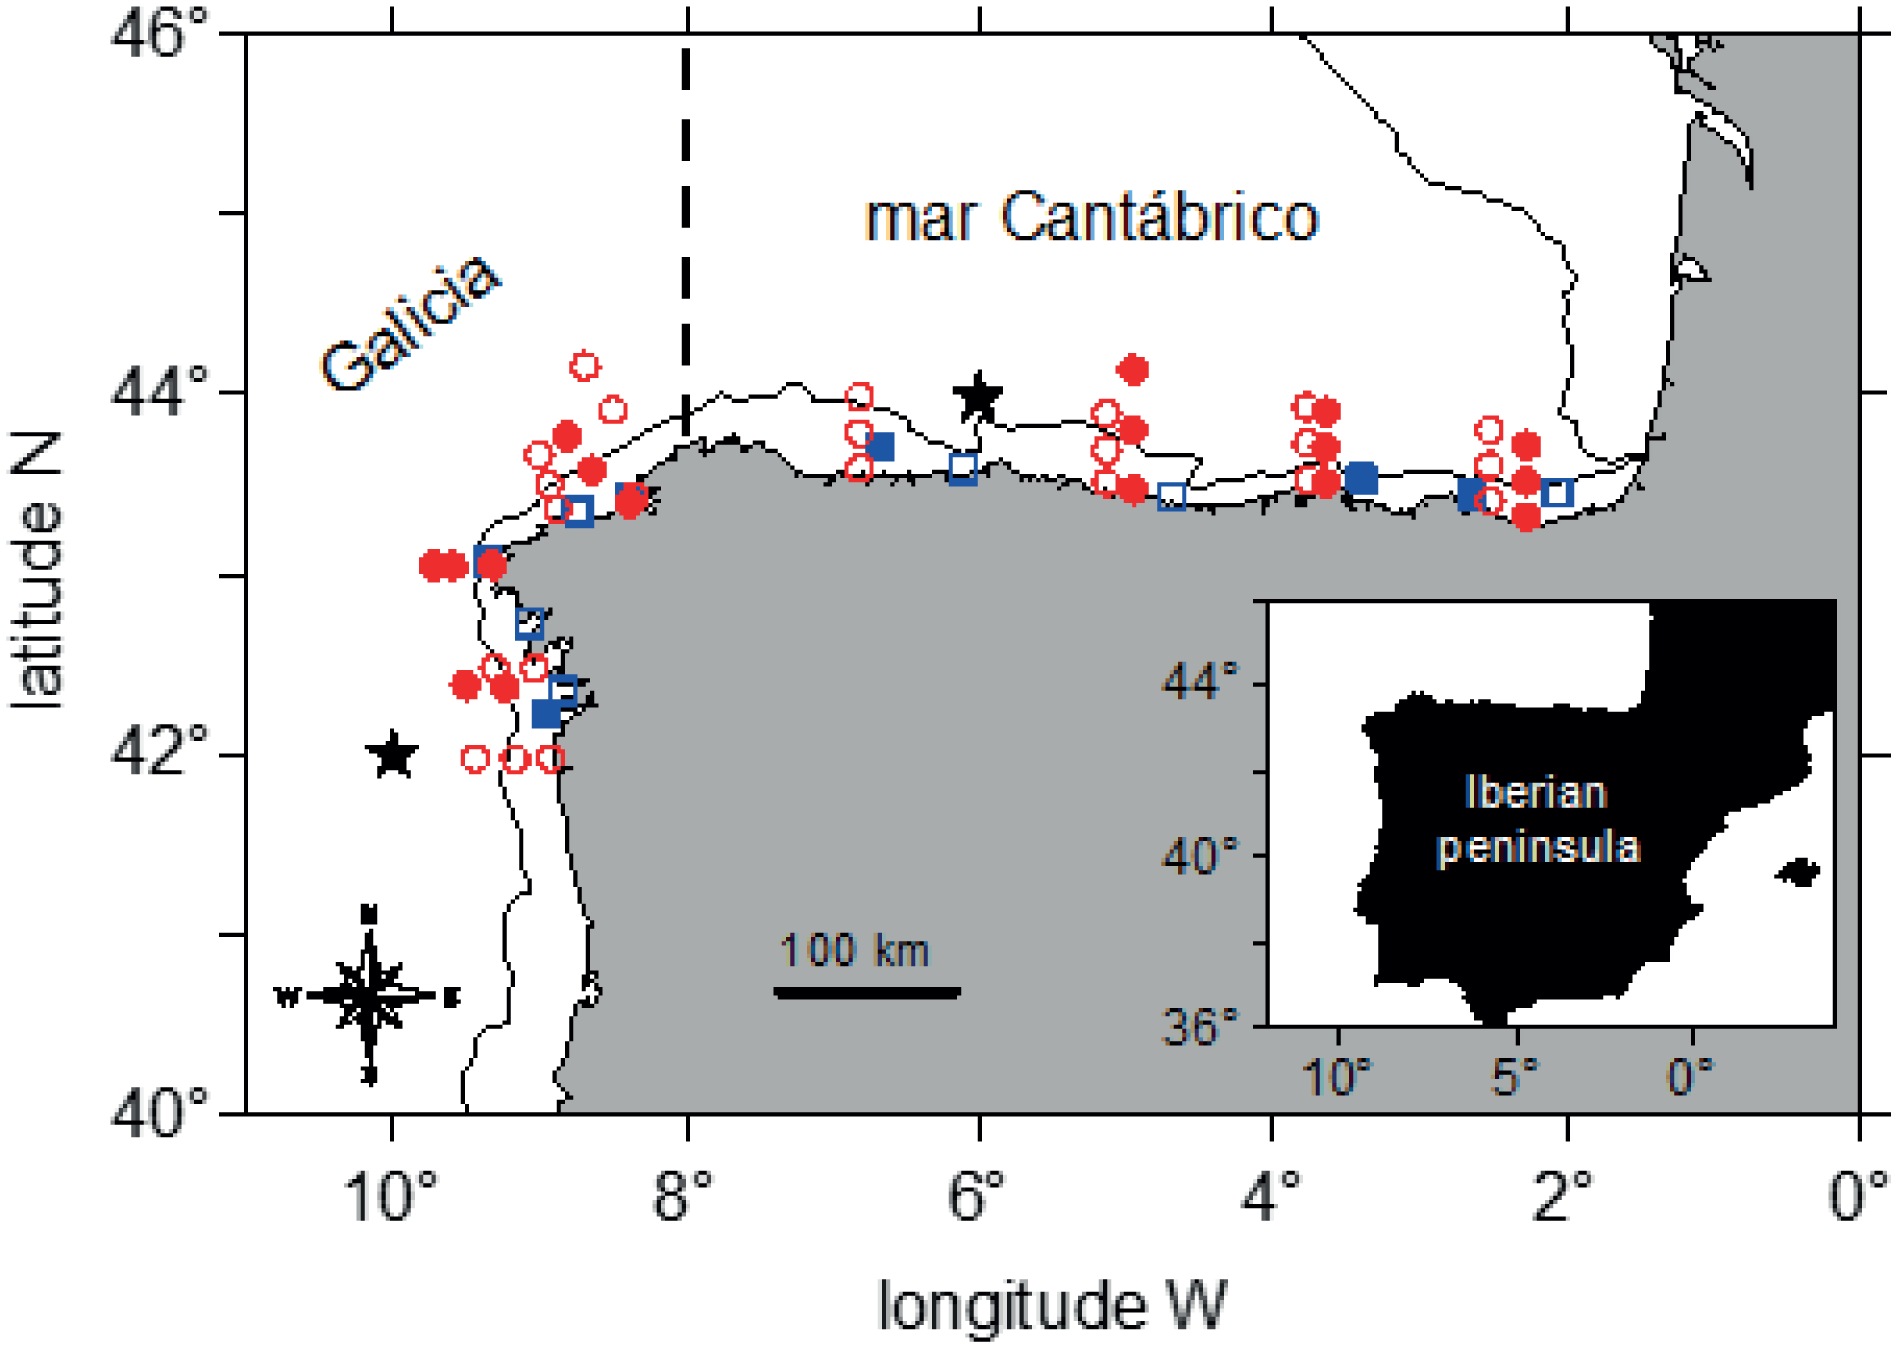
Position of stations and study areas (Galicia, mar Cantábrico) for zooplankton (red circles) and fish samples (blue squares) collected during PELACUS0321 (closed symbols) and PELACUS0322 (open symbols). The center of 1°x 1° grids used for computing the upwelling index of each study area are indicated by black stars. The dashed line separates both study areas. The continuous line indicates the 200 m isobath.
Mesozooplankton was collected using a WP2 net (50 cm diameter, 200 µm mesh size) from 100 m depth (or from 5 m from the bottom in shallower stations) to the surface at the stations distributed along the shelf up to the shelf break during the night (Bode et al., 2007). The samples were fractionated by a 500 µm sieve to select the 200–500 µm size fraction, carefully washed with prefiltered seawater, transferred to glass-fiber filters and stored frozen (-20°C). This fractionation aimed to select mainly primary consumers, according to previous studies in this region (Bode et al., 2018).
Four species of planktivorous fish were collected: European sardine Sardina pilchardus (PIL), European anchovy Engraulis encrasicolus (ANE), Atlantic mackerel Scomber scombrus (MAC), and Atlantic chub mackerel Scomber colias (VMA). All of them were sampled during daytime, after detecting the schools with onboard acoustic instruments. Fish species were captured between 30 and 80 m depth by a midwater trawl using a pelagic net with a ca. 30 m2 opening and equipped with graded-mesh netting, ranging from 30 mm to 4 mm. Fish individuals of similar length and weight were selected to minimize the potential influence of these variables in posterior analyses. A total of 69 individuals were analyzed, 45 from Galicia and 24 from the mar Cantábrico. For each specimen, weight, length, sex, and maturity stage were determined (Table 1). From fish samples, portions of white muscle tissue from the dorsal spine were dissected on board and stored frozen (-20 °C).
Table 1
| Species | FAO code | Zone | Sex | N | Length | Weight | Maturity |
|---|---|---|---|---|---|---|---|
| Sardina pilchardus | PIL | Galicia | M | 11 | 19.39 ± 1.58 | 57.08 ± 12.44 | 5.0 ± 0.0 |
| F | 4 | 20.80 ± 1.04 | 69.30 ± 7.70 | 4.8 ± 0.5 | |||
| mar Cantábrico | M | 2 | 19.60 ± 1.41 | 56.95 ± 14.78 | 5.0 ± 0.0 | ||
| F | 4 | 19.90 ± 0.32 | 62.78 ± 9.12 | 5.0 ± 0.0 | |||
| Engraulis encrasicolus | ANE | Galicia | M | 5 | 16.78 ± 0.96 | 30.60 ± 4.92 | 5.0 ± 0.0 |
| F | 5 | 17.64 ± 0.61 | 37.42 ± 3.56 | 5.0 ± 0.0 | |||
| mar Cantábrico | M | 2 | 14.70 ± 2.26 | 22.05 ± 12.52 | 5.0 ± 0.0 | ||
| F | 3 | 14.63 ± 1.57 | 20.73 ± 8.83 | 5.3 ± 0.6 | |||
| Scomber scombrus | MAC | Galicia | M | 4 | 35.23 ± 5.66 | 333.98 ± 135.84 | 4.5 ± 1.0 |
| F | 8 | 32.43 ± 6.49 | 278.08 ± 153.94 | 4.3 ± 1.4 | |||
| mar Cantábrico | M | 7 | 36.74 ± 1.98 | 355.80 ± 61.13 | 4.4 ± 1.1 | ||
| F | 3 | 39.23 ± 0.90 | 405.67 ± 46.85 | 5.0 ± 0.0 | |||
| Scomber colias | VMA | Galicia | M | 5 | 29.46 ± 1.10 | 220.36 ± 31.94 | 4.2 ± 2.1 |
| F | 3 | 27.63 ± 4.69 | 190.13 ± 89.74 | 2.0 ± 1.0 | |||
| mar Cantábrico | M | 2 | 31.00 ± 1.98 | 228.75 ± 47.02 | 5.5 ± 0.7 | ||
| F | 1 | 29.50 ± 0.00 | 202.50 ± 0.00 | 13.0± 0.0 |
Mean (± SD) of length (cm), weight (g) and maturity stage of all individuals within the category (1: early development, 2: low development, 3: advanced development, 4: pre-spawning, 5: spawning, and 6: post-spawning) by sex (M: males, F: female) and study area (Galicia, mar Cantábrico) of the studied fish species.
n: number of individuals.
2.2 Stable isotope analysis and trophic position estimations
Plankton and fish samples were freeze-dried, ground and homogenized prior to determinations of natural abundance of carbon and nitrogen isotopes in bulk tissues and nitrogen isotopes in amino acids. No acidification of delipidation treatments were applied to bulk samples (Bode et al., 2003). Isotope ratios and the carbon and nitrogen content were determined in relation to weighted standards of acetanilide and glycine calibrated to international reference materials. Isotopic ratios for carbon and nitrogen were expressed as δ13C and δ15N (‰) values relative to PDB (PeeDee Belemnite carbonate) standard and atmospheric N2, respectively (Coplen, 2011). An elemental analyzer (Carlo Erba CHNSO 1108) coupled to an isotopic-ratio mass spectrometer (Finnigan Matt Delta Plus) was used for bulk isotope analysis. Isotope standards from the International Atomic Energy Agency (IAEA-600, urea, and L-alanine), and internal standards (acetanilide and cyanobacteria) of known isotope composition were employed for each analytical run. Precision (± SE) of replicate determinations for standards and samples was< 0.1 and< 0.4 ‰, for δ13C and δ15N, respectively. The influence of lipids on δ13C values was accounted for using specific mass-balance equations for plankton (Smyntek et al., 2007) and fish (Sweeting et al., 2006). These equations were obtained from the analysis of delipidized samples from previous cruises (Supplementary Figures S1, S2).
For δ15N amino acid determinations, freeze-dried aliquots (10 mg) were processed following the method of McCarthy et al. (2007). Sample preparation included hydrolysis with 6 N HCl (20 h, 110 °C) and the formation of trifluoroacetyl/isopropyl ester derivatives. L-norleucine, an internal amino acid standard with a known isotopic composition, was added to each sample. The hydrolyzed extracts were filtered through 0.20 µm hydrophilic filters and dried under a N2 stream at 60°C. Subsequently, esterification was performed using 2.5 mL of 1:5 acetyl chloride:2-propanol under N2 at 110°C for 60 min. Samples were dried at room temperature under a N2 stream for the acylation step. Amino acids were purified by solvent extraction in 3 mL of 1:2 chloroform:phosphate buffer mixture (Na2HPO4 + NaH2PO4 in Milli-Q water, pH 7.4). After centrifugation (17,000 × g, 10 min), the acyl derivatives within the chloroform phase were collected in a clean vial and evaporated at room temperature under a stream of N2. The acyl-derivatives and the chloroform were collected in a clean vial after centrifugation (17,000 x g, 10 min) and evaporated at room temperature under a stream of N2. Finally, samples were stored at -20 C in 3:1 DCM: TFAA until isotope analysis. The products were injected into a mass spectrometer (Thermo Fisher DeltaV Advantage) coupled to a gas chromatograph (Thermo Fisher Scientific DeltaV Advantage) by a continuous flow interface and a combustion module (Thermo Fisher Scientific GCIsolink). A TraceGOLD TG-5MS chromatographic column (60 m, 0.32 mm ID, 1.0 μm film) was used to separate individual amino acids. δ15N of each amino acid was calibrated using isolated standards, which were analyzed by combustion following the same procedure as bulk analysis. Precision (± SE) of duplicate samples was<1 ‰ per individual amino acids. δ15N values were determined for alanine (Ala), valine (Val), lysine (Lys), leucine (Leu), isoleucine (Ile), proline (Pro), methionine (Met), phenylalanine (Phe), and the mixtures of glutamine (Gln) and glutamic acid (Glu), and of asparagine (Asn) and aspartic acid (Asp). The latter mixtures were termed as Glx and Asx, respectively. The molar fraction of each amino acid was determined along with the δ15N values by calibrating the spectrometric signals with amino acid mixtures, using certified standards and cyanobacterial standards, following the same approach as in the bulk analysis. All isotopic determinations were carried out at the Servicio de Análisis Instrumental of the Universidade da Coruña (Spain).
Amino acids were categorized as source or trophic (McMahon and McCarthy, 2016). Trophic amino acids include Asx, Ala, Glx, Ile, Leu, Pro and Val. Source amino acids include Lys, Phe, and Met. The weighted average of δ15N in trophic (δ15Ntrp) and source(δ15Nsrc) amino acids was computed using the analytical error for the determination of each amino acid (Bradley et al., 2015).
Trophic positions were estimated from δ15N values in amino acids as proposed by Chikaraishi et al. (2009). To calculate the TP in mesozooplankton, the model suggested by Décima and Landry (2020) was applied using the equation 1:
where δ15NGlx and δ15NPhe are the N isotopic values of mesozooplankton samples, βGlx is the difference between Glx and Phe in primary producers (3.4 ‰) and TEFsGlx is the trophic enrichment factor for plankton (i.e. isotopic enrichment in 15N with each trophic step) (6.1 ‰).
For fish species, TP was calculated using the multi-TDF equation 2 suggested by McMahon and McCarthy (2016):
where δ15NGlx and δ15NPhe are the N isotopic values in the muscle tissue of the fishes and TEFp are the trophic enrichment factor for fishes. We used mean values from the literature: 3.6 ‰ for βGlx (Bradley et al., 2015), 7.6‰ for TEFp (McMahon and McCarthy, 2016) and 5.7‰ for TEFsGlx (Bradley et al., 2015).
2.3 Environmental data
Environmental conditions in each of the study areas were represented monthly, between January 2020 and May 2022, by the upwelling strength, sea surface temperature, and surface chlorophyll concentrations. The Upwelling Index (UI), used as an indicator of the upwelling strength, was derived from Ekman transport (m3 s-1 km-1) estimates based on surface wind data (Instituto Español de Oceanografía, http://www.indicedeafloramiento.ieo.es) in 1° latitude × 1° longitude cells (González-Nuevo et al., 2014) at locations of Galicia and mar Cantábrico zones (black stars in Figure 1). Monthly averages of sea surface temperature (SST, °C) and surface chlorophyll-a concentrations (Chla, mg m-3) were obtained from the NOAA Earth System Research Laboratory (https://psl.noaa.gov/data/gridded/data.noaa.oisst.v2.highres.html), and from the GlobColour Project (https://hermes.acri.fr/), respectively, and were averaged over Galicia (41-45°N; 8-11°W) and mar Cantábrico (43.5-45°N, 2-8°W). Optimum interpolation SST data were available at daily 0.25° latitude x 0.25° longitude grid resolution from a combination of satellite and in situ measurements (Huang et al., 2021). Chla was obtained from the MODIS-Aqua sensor satellite data at 1 km grid resolution (Maritorena et al., 2010).
2.4 Statistical analysis
The environmental comparison of the sampling zones was assessed considering the accumulated differences between Galicia and Mar Cantábrico in monthly mean values during the previous 9 months of UI, SST and Chla. We selected this period as it includes the previous summer season to each cruise, when the intensity of upwelling is expected to be maximal (Botas et al., 1990; Álvarez-Salgado et al., 2002). Student’s-t test was used to evaluate the significance of each accumulated difference against the null hypothesis of no differences between zones (i.e. a distribution with the same SD and mean = 0 for each cruise).
Isotopic data of both years were pooled by areas because the main objective was to test differences among species and shelf areas. However, variability between sampling years is expected but, unfortunately there were not enough data to test all combinations of years, species and areas simultaneously.
The variance of the residuals was checked for normality and homoscedasticity using the Shapiro-Wilk and Levene tests, respectively. As most distributions were not normal and homogeneity of variances was not achieved, the non-parametric test Kruskal-Wallis was used to analyze differences among species and the Mann-Whitney test to analyze differences between zones, sexes and maturity stages (above or below stage 5). Since no significant differences were observed between sexes and maturity stages, the potential influence of these factors was not considered in the subsequent analyses (Supplementary Table S1) Further exploration of pairwise differences was made using the Dunn’s post hoc test. Spearman’s rank correlation was used to assess the relationship among isotopic variables, considering data from all species and both zones together.
Trophic niche width was estimated by the Bayesian Standard Ellipse Area (SEAB, ‰2) (Jackson et al., 2011). This metric takes into account the uncertainty of the sampling process, allowing robust comparison between groups with different sample sizes. SEAB was computed either using bulk δ13C and δ15N, or δ15Ntrp and δ15Nsrc. Niche overlap represents the probability that an individual from one species will be found in the niche of the other species (Lysy et al., 2023). SEAB and niche overlap were calculated using 40% of the niche region sizes in order to reduce the influence of outliers and make it more representative of the species’ diet and behavior.
Statistical analyses were performed with the software PAST (v 4.17) (Hammer et al., 2001). Niche width and niche overlap were analyzed in R-4.4.0 (R Core Team, 2024) with “SIBER” (v 2.1.9) (Jackson and Parnell, 2025) and “nicheROVER” (v 1.1.2) (Lysy et al., 2023) packages, respectively.
3 Results
3.1 Environmental conditions
Negative values of UI (downwelling) prevailed in the winter months preceding the cruises (Figure 2A). In contrast, positive UI values indicated the onset of the upwelling season in both areas in March 2021, and in Galicia in April 2022, extending to mar Cantábrico in April 2022 and May 2023. Upwelling conditions prevailed between March and September in both zones but generally with higher intensity in Galicia. Surface waters were also colder in Galicia than in the mar Cantábrico during the upwelling season. However, the latter reached lower temperature values in winter and early spring (i.e. December to March, Figure 2B). In turn, mean Chla concentrations were higher in Galicia during late summer and autumn (i.e. July to December) while zonal differences were less apparent in spring (Figure 2C). Notwithstanding the large variability in these series, the differences between zones assessed by the accumulated differences in the monthly values, showed significant values, indicating higher UI and Chla and lower SST in Galicia compared to mar Cantábrico (Table 2).
Figure 2
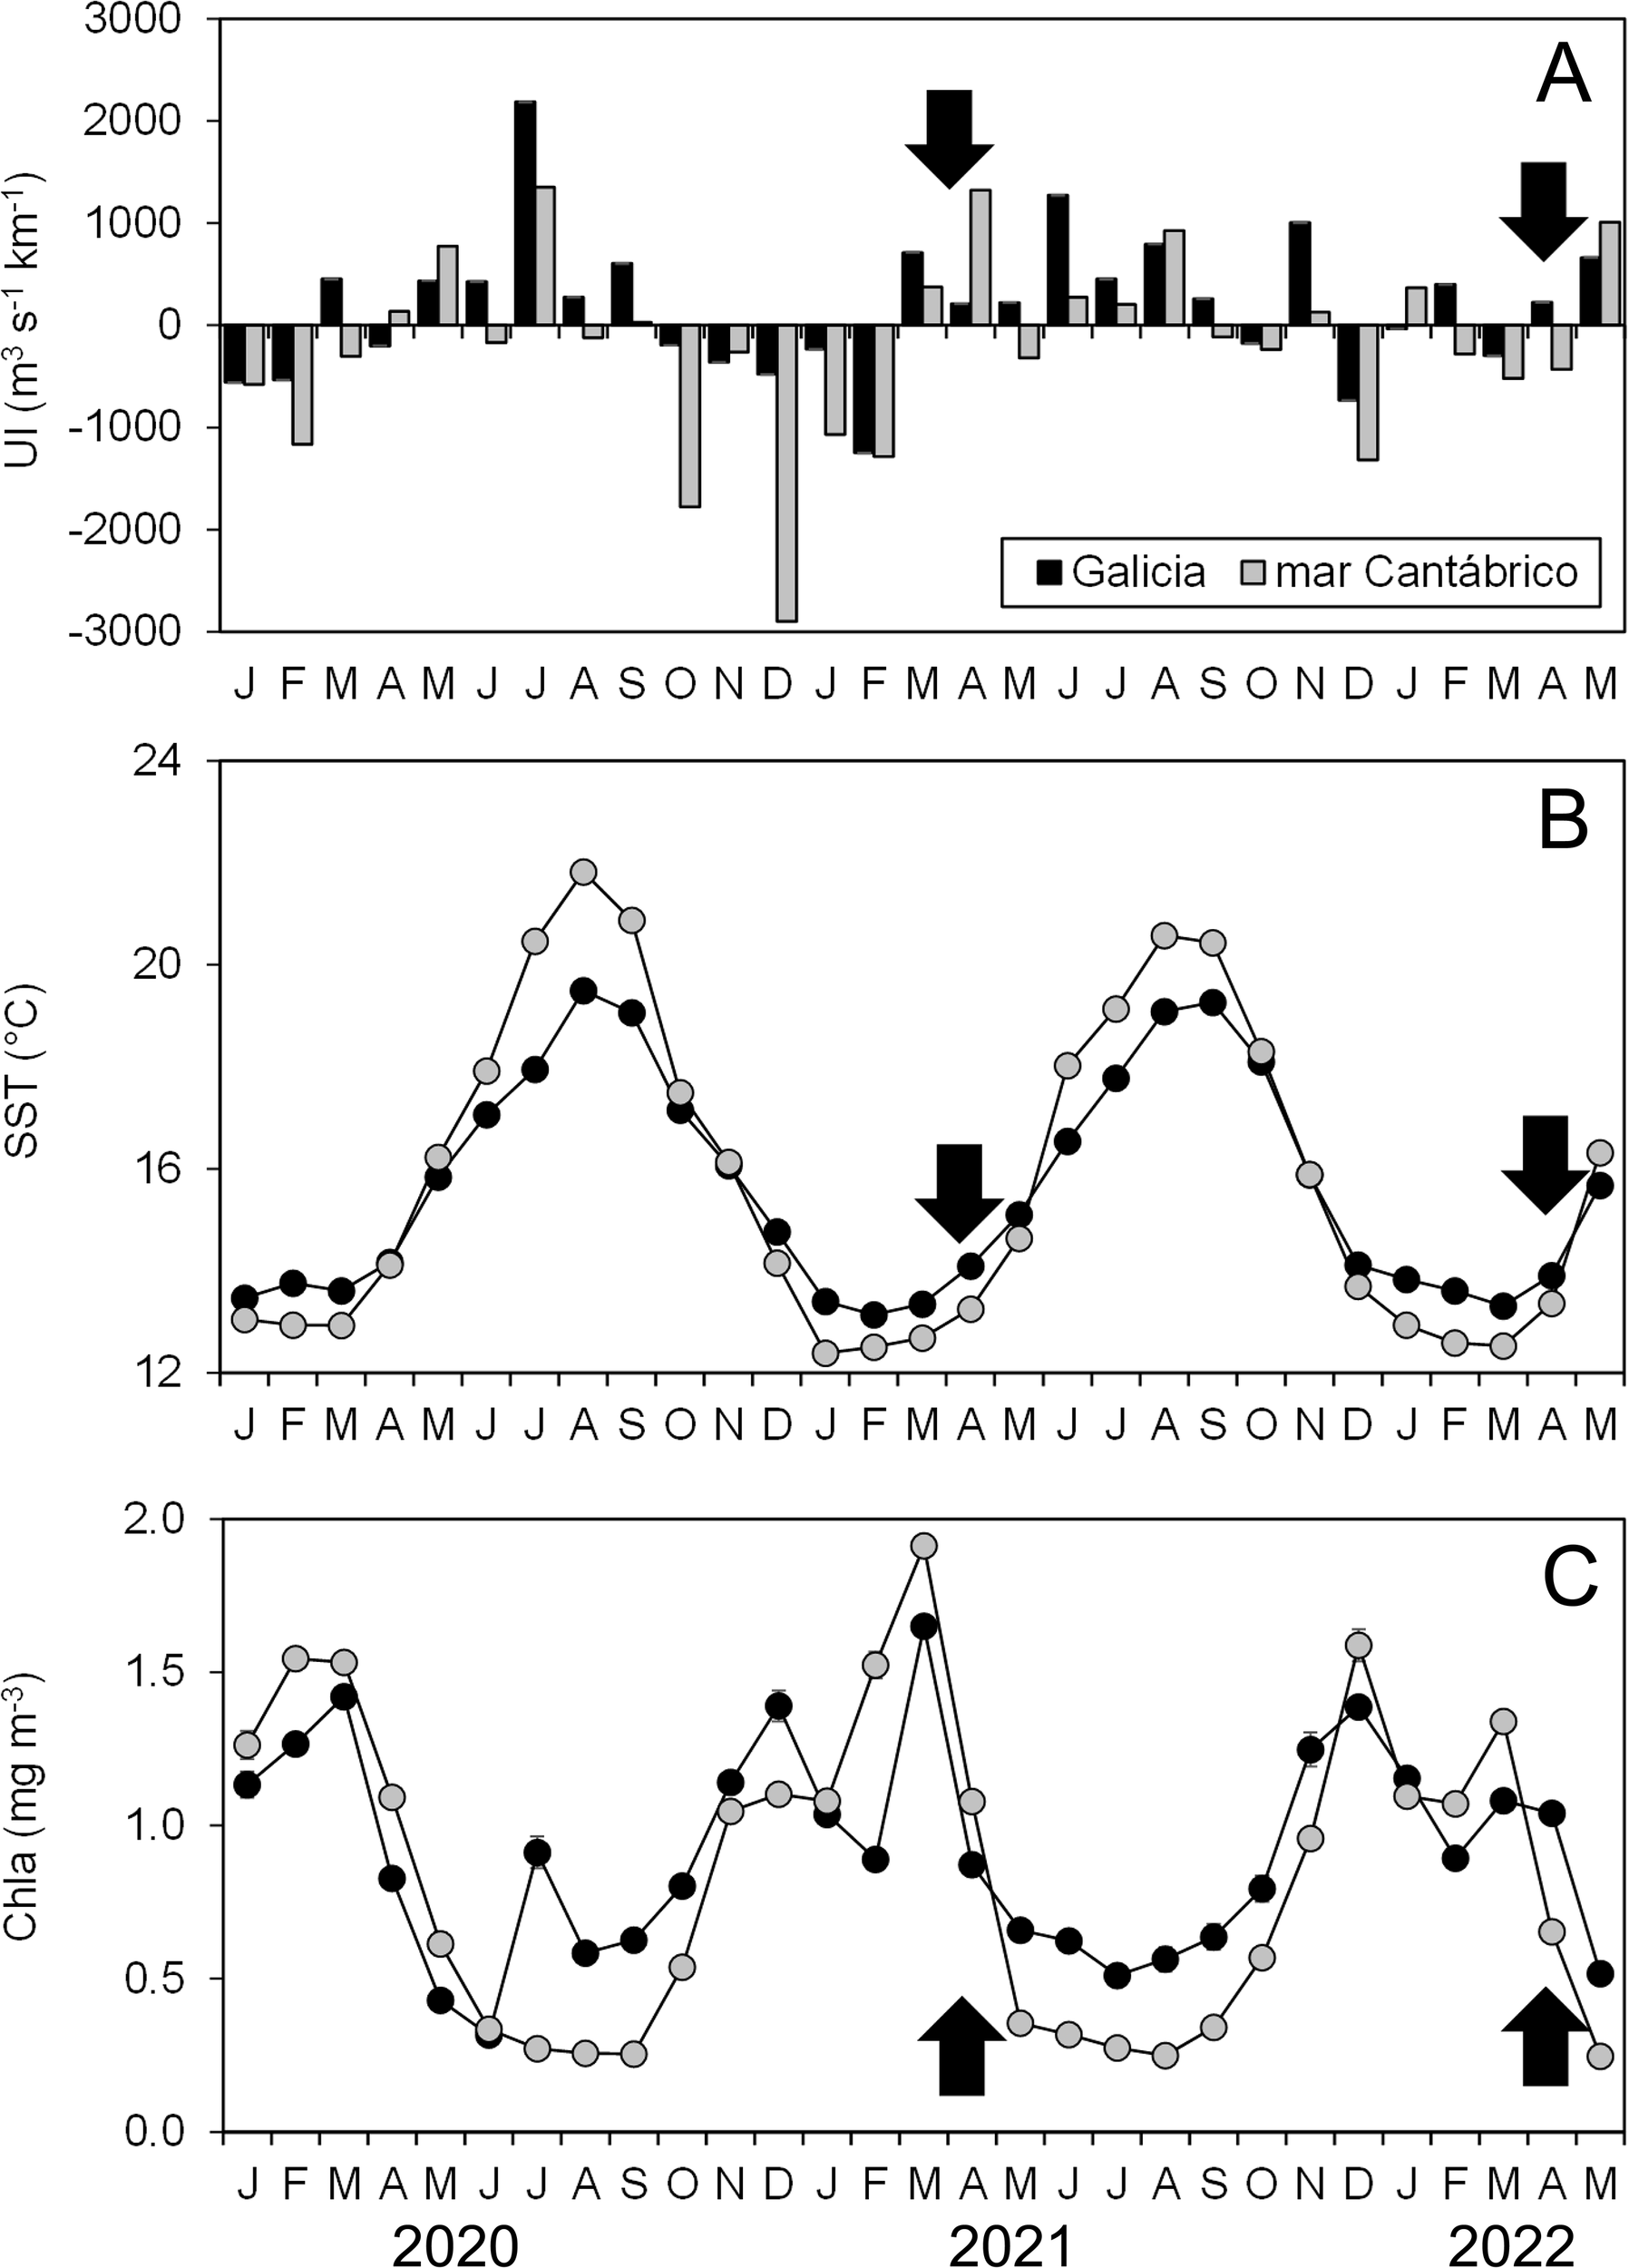
Monthly averaged values of (A) upwelling index (UI, m3 s-1 km-1), (B) sea surface temperature (SST, °C), and (C) surface chlorophyll-a concentrations (Chla, mg m-3) for the years 2020 to 2022 in Galicia and mar Cantábrico. The arrows mark the dates of the PELACUS cruises considered in this study. Standard errors of the mean SST and Chla are indicated when exceeding the symbol size.
Table 2
| PELACUS 2021 | PELACUS 2022 | |||||
|---|---|---|---|---|---|---|
| Mean ± sd | t | p | Mean ± SD | t | p | |
| ΔUI | 6922.5 ± 1596.5 | 9.20 | 0.000 | 2515.9 ± 832.6 | 6.41 | 0.000 |
| ΔSST | -4.15 ± 0.63 | -13.92 | 0.000 | -1.11 ± 0.61 | -3.87 | 0.000 |
| ΔChl-a | 1.05 ± 0.48 | 4.64 | 0.000 | 0.78 ± 0.54 | 3.07 | 0.007 |
Mean (± SD) of the 9 months accumulated difference between mean values for Galicia and mar Cantábrico zones of the upwelling index (ΔUI, m3 s-1 km-1), sea surface temperature (ΔSST, °C) and surface chlorophyll-a (ΔChl-a, µg L-1) previous to each PELACUS cruise, 2021 and 2022.
Significance (p-values) and tvalues from Student’s-t tests are also indicated.
3.2 Stable isotopes and trophic position
Considering the two zones, mean values of stable isotopes for zooplankton were significantly lower than those of fish, (Figure 3), while the inverse was found for C:N ratios (Supplementary Table S2). The difference in mean δ15N between zooplankton and fish was > 4‰, both for bulk and amino acid values. All fish species had similar mean values across variables, except for bulk δ15N and δ13C in Galicia (Supplementary Table S2). Higher mean values of δ13C were found for zooplankton and sardine samples from Galicia compared to those from mar Cantábrico (Figure 3A), while the differences in δ13C for other fish species were non-significant. In turn, mean values of zooplankton δ15N and δ15Nsrc for sardine and chub mackerel from Galicia were lower than mean values from mar Cantábrico (Figure 3B). However, no significant differences were found for mean values of δ15Ntrp for any of the species considered between zones (Supplementary Table S3).
Figure 3
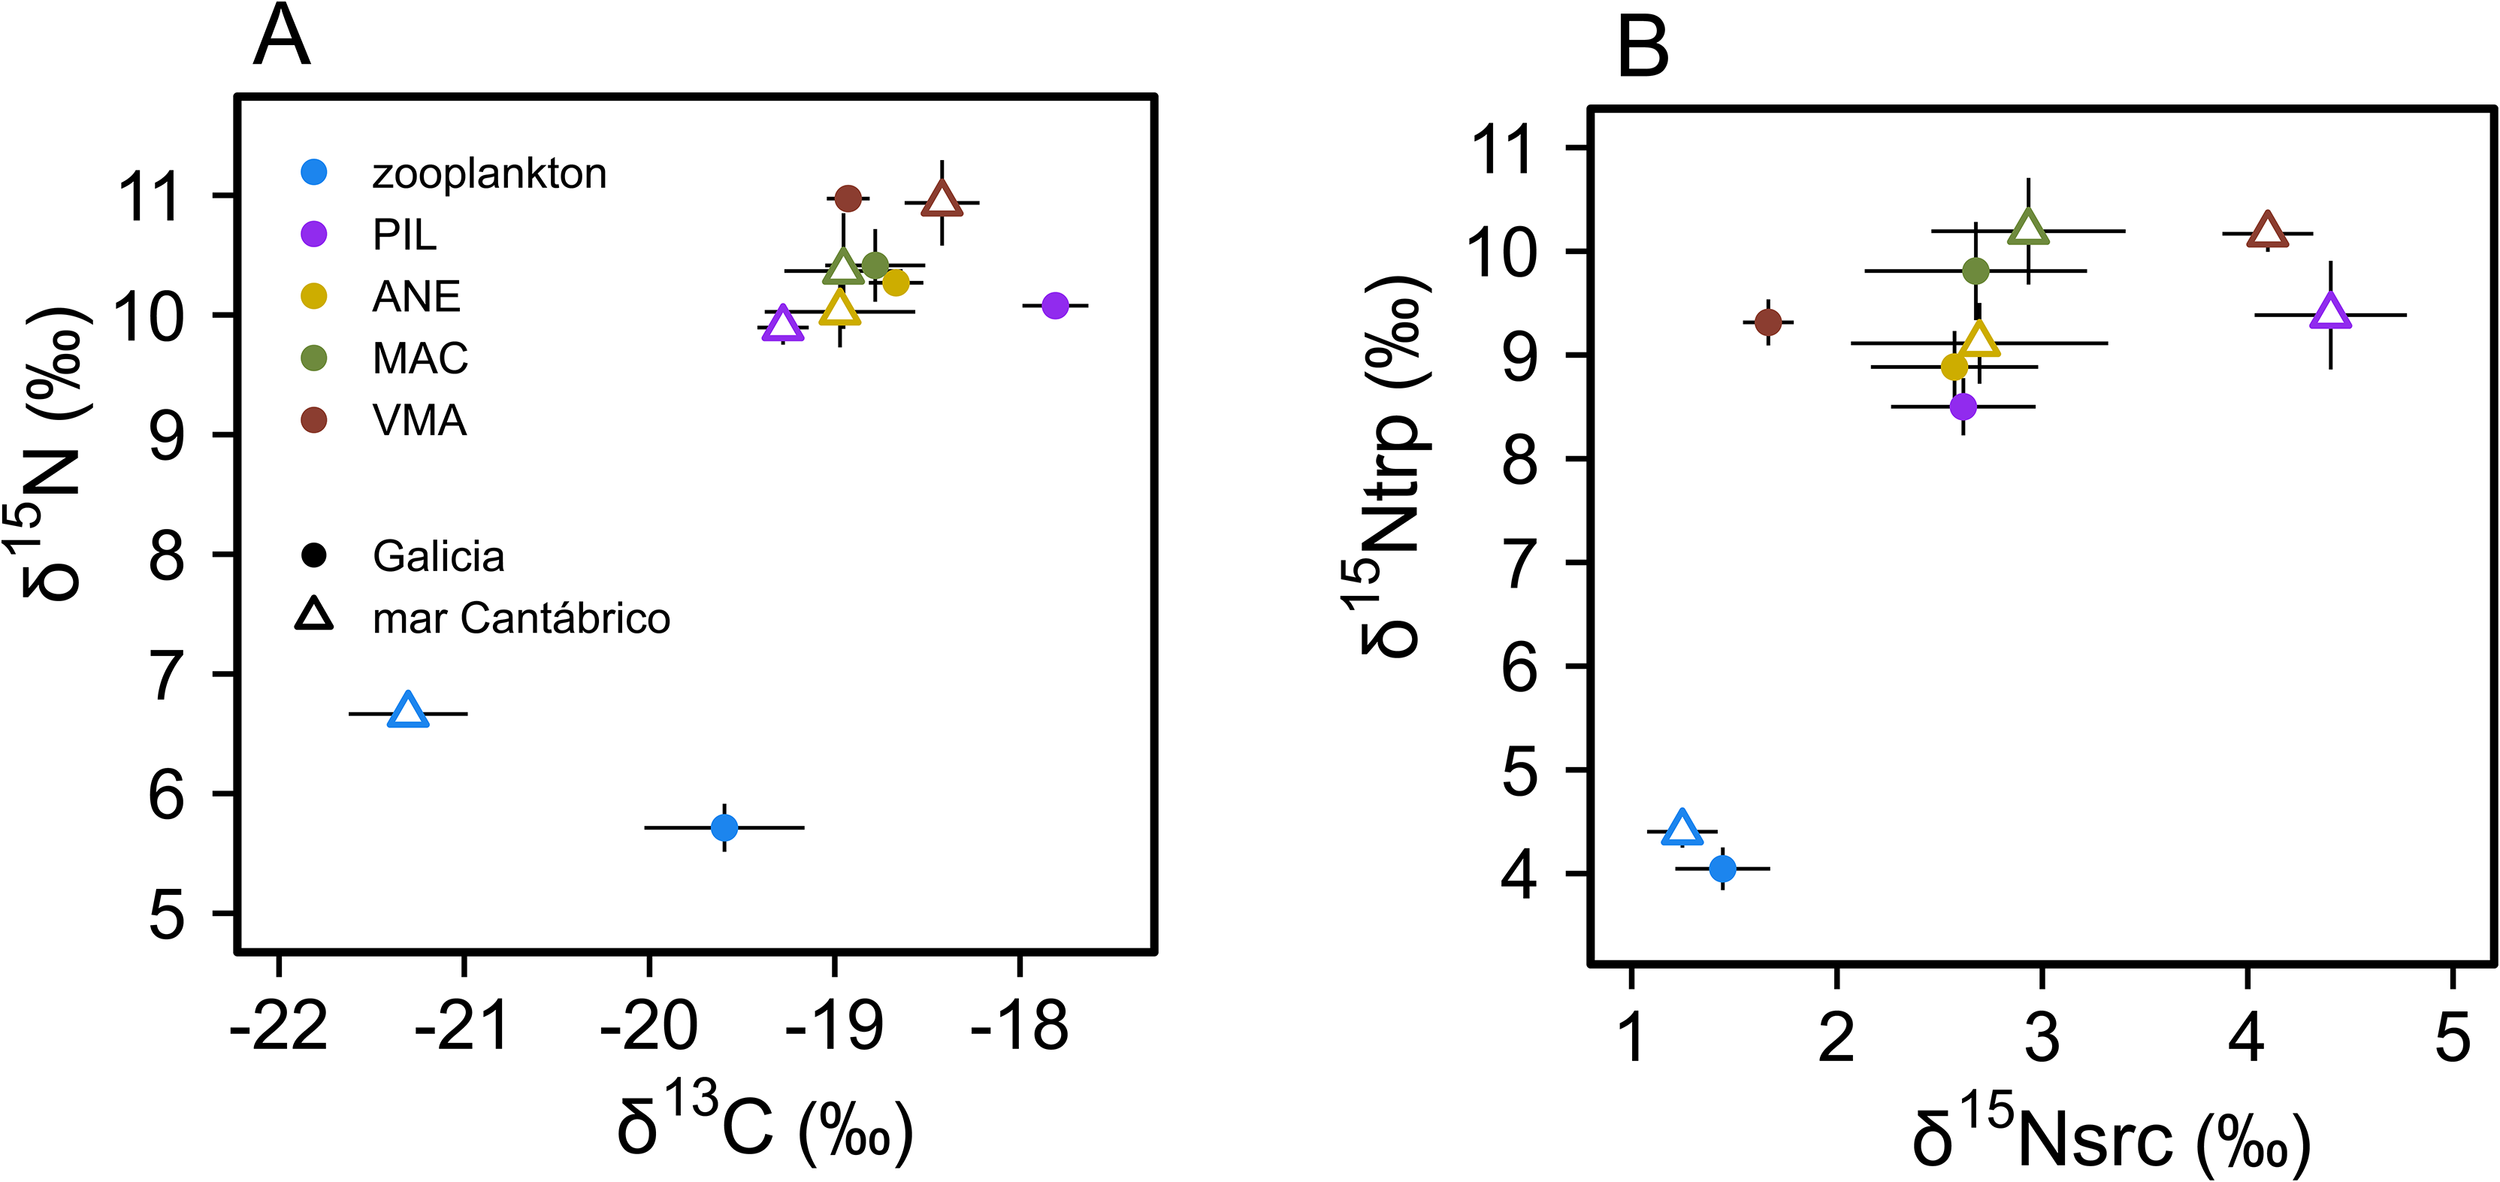
Mean (± SE) of (A) bulk δ15N and δ13C values and (B) δ15N in trophic (δ15Ntrp) and source (δ15Nsrc) amino acids for zooplankton and fish species in Galicia and mar Cantábrico areas. PIL, Sardina pilchardus; ANE, Engraulis encrasicolus; MAC, Scomber scombrus; VMA, Scomber colias.
When considering all species from both zones (n=109), bulk δ15N was mainly correlated with δ15Ntrp (Spearman’s ρ = 0.799, p< 0.001) and secondarily with δ15Nsrc (Spearman’s ρ = 0.425, p< 0.001).
Mean TP ranged from 1.94, observed for mesozooplankton, and 3.20 for mackerel, both in Galicia (Figure 4). Across species, the lowest TPs were observed for mesozooplankton, followed by sardine and anchovy and the highest TPs for mackerel and chub mackerel in both areas. Significant differences were found between mesozooplankton and all fish species in Galicia, and only with mackerel in mar Cantábrico (Figure 4). All fish groups showed slightly higher values in Galicia than in mar Cantábrico but no significantly differences were detected across areas. However, mesozooplankton showed significantly higher TP in mar Cantábrico than in Galicia (Supplementary Table S3).
Figure 4
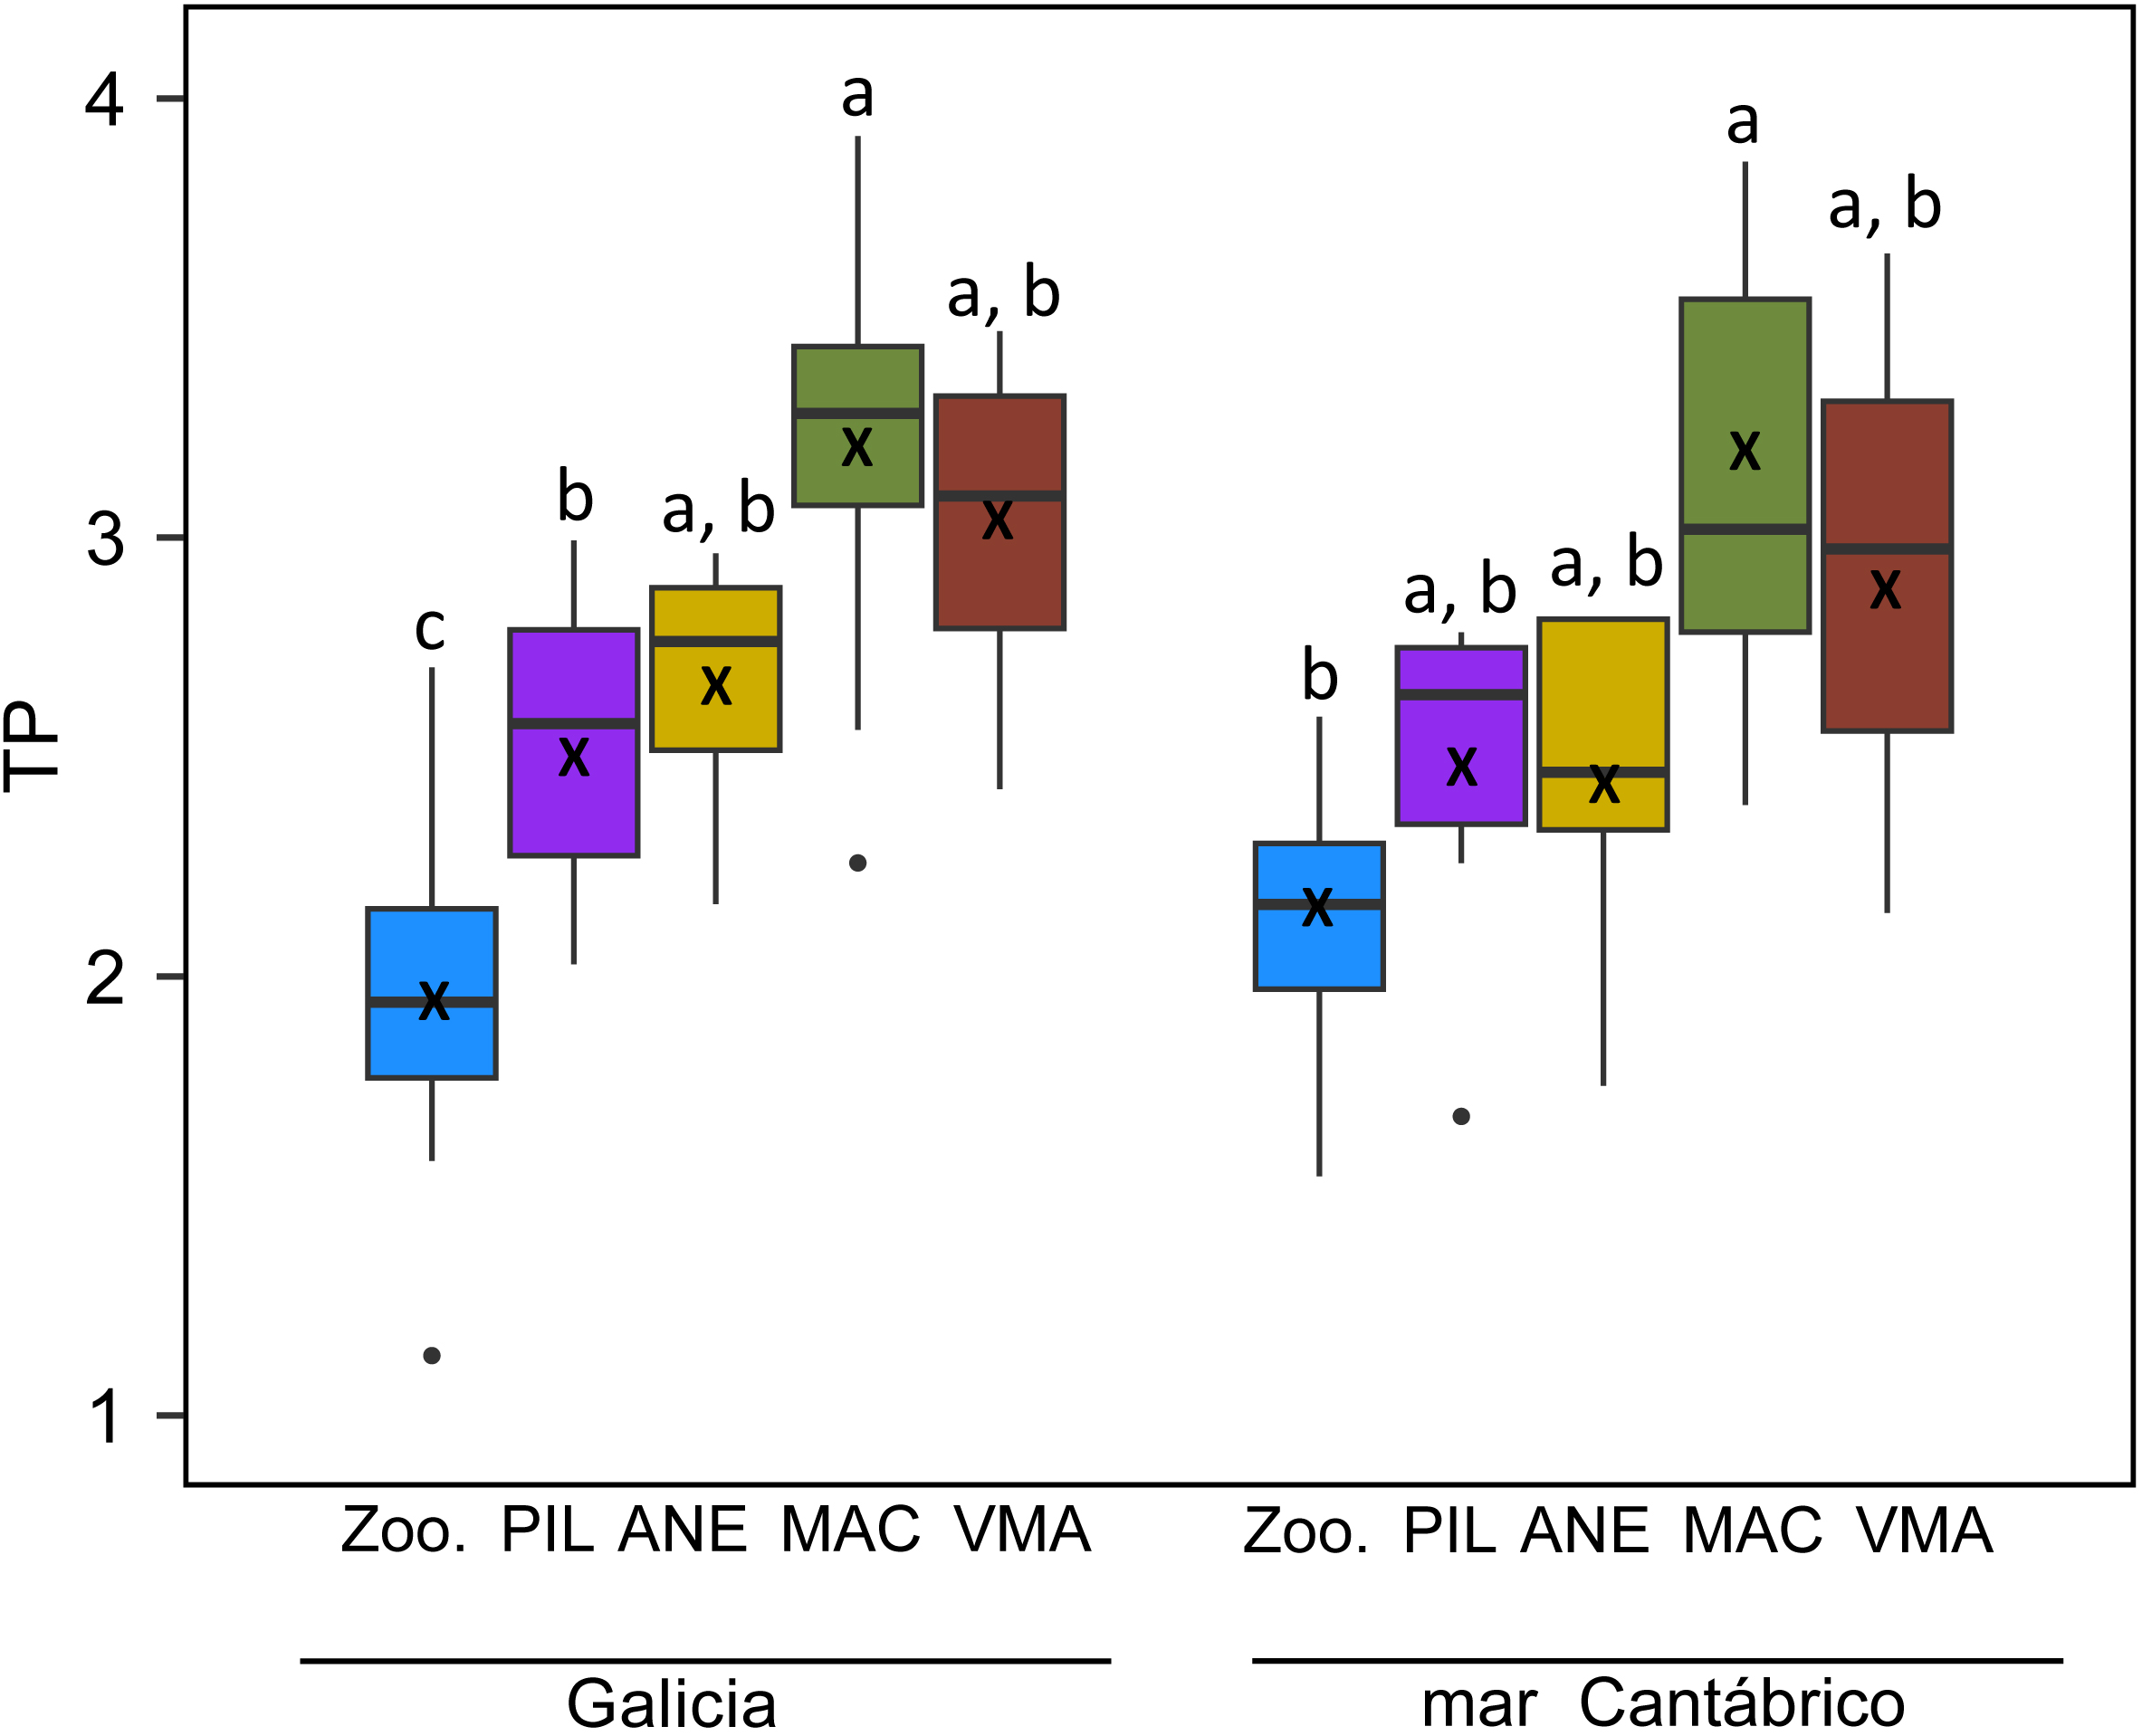
Trophic positions (TP) for zooplankton and fish species estimated from δ15N values in amino acids for both study areas. Different letters indicate significantly different means among species (Kruskal-Wallis test p < 0.05). Each box encompasses the range between 25% and 75% percentiles, horizontal bars within the boxes indicate the median values, vertical bars indicate the range of values and black crosses indicate mean values. Species codes as in Figure 3.
3.3 Isotopic niches
The standard ellipses for zooplankton were larger than those for fish species when using bulk δ13C and δ15N (Figure 5A) but not when computed using δ15N in amino acids (Figure 5B). In all cases, the center of gravity of zooplankton ellipses were located at lower isotopic values than those for fish. Interestingly, fish species ellipses showed greater separation when using amino acid δ15N compared to bulk isotopes. Clear differences also appeared in the ellipses by zones (Figures 5C-F). In the case of zooplankton there was a marked segregation of values for Galicia (with lower δ15N and higher δ13C) compared to those for mar Cantábrico when using bulk isotopes (Figure 5C). Such differences were also evident for some fish species (e.g. sardine) but, in general, all fish ellipses showed some overlap between areas (Figure 5D). When computed using amino acid δ15N the zooplankton ellipses showed greater isotopic overlap (Figure 5E), whereas the separation among the fish species ellipses by area was more evident (Figure 5F).
Figure 5
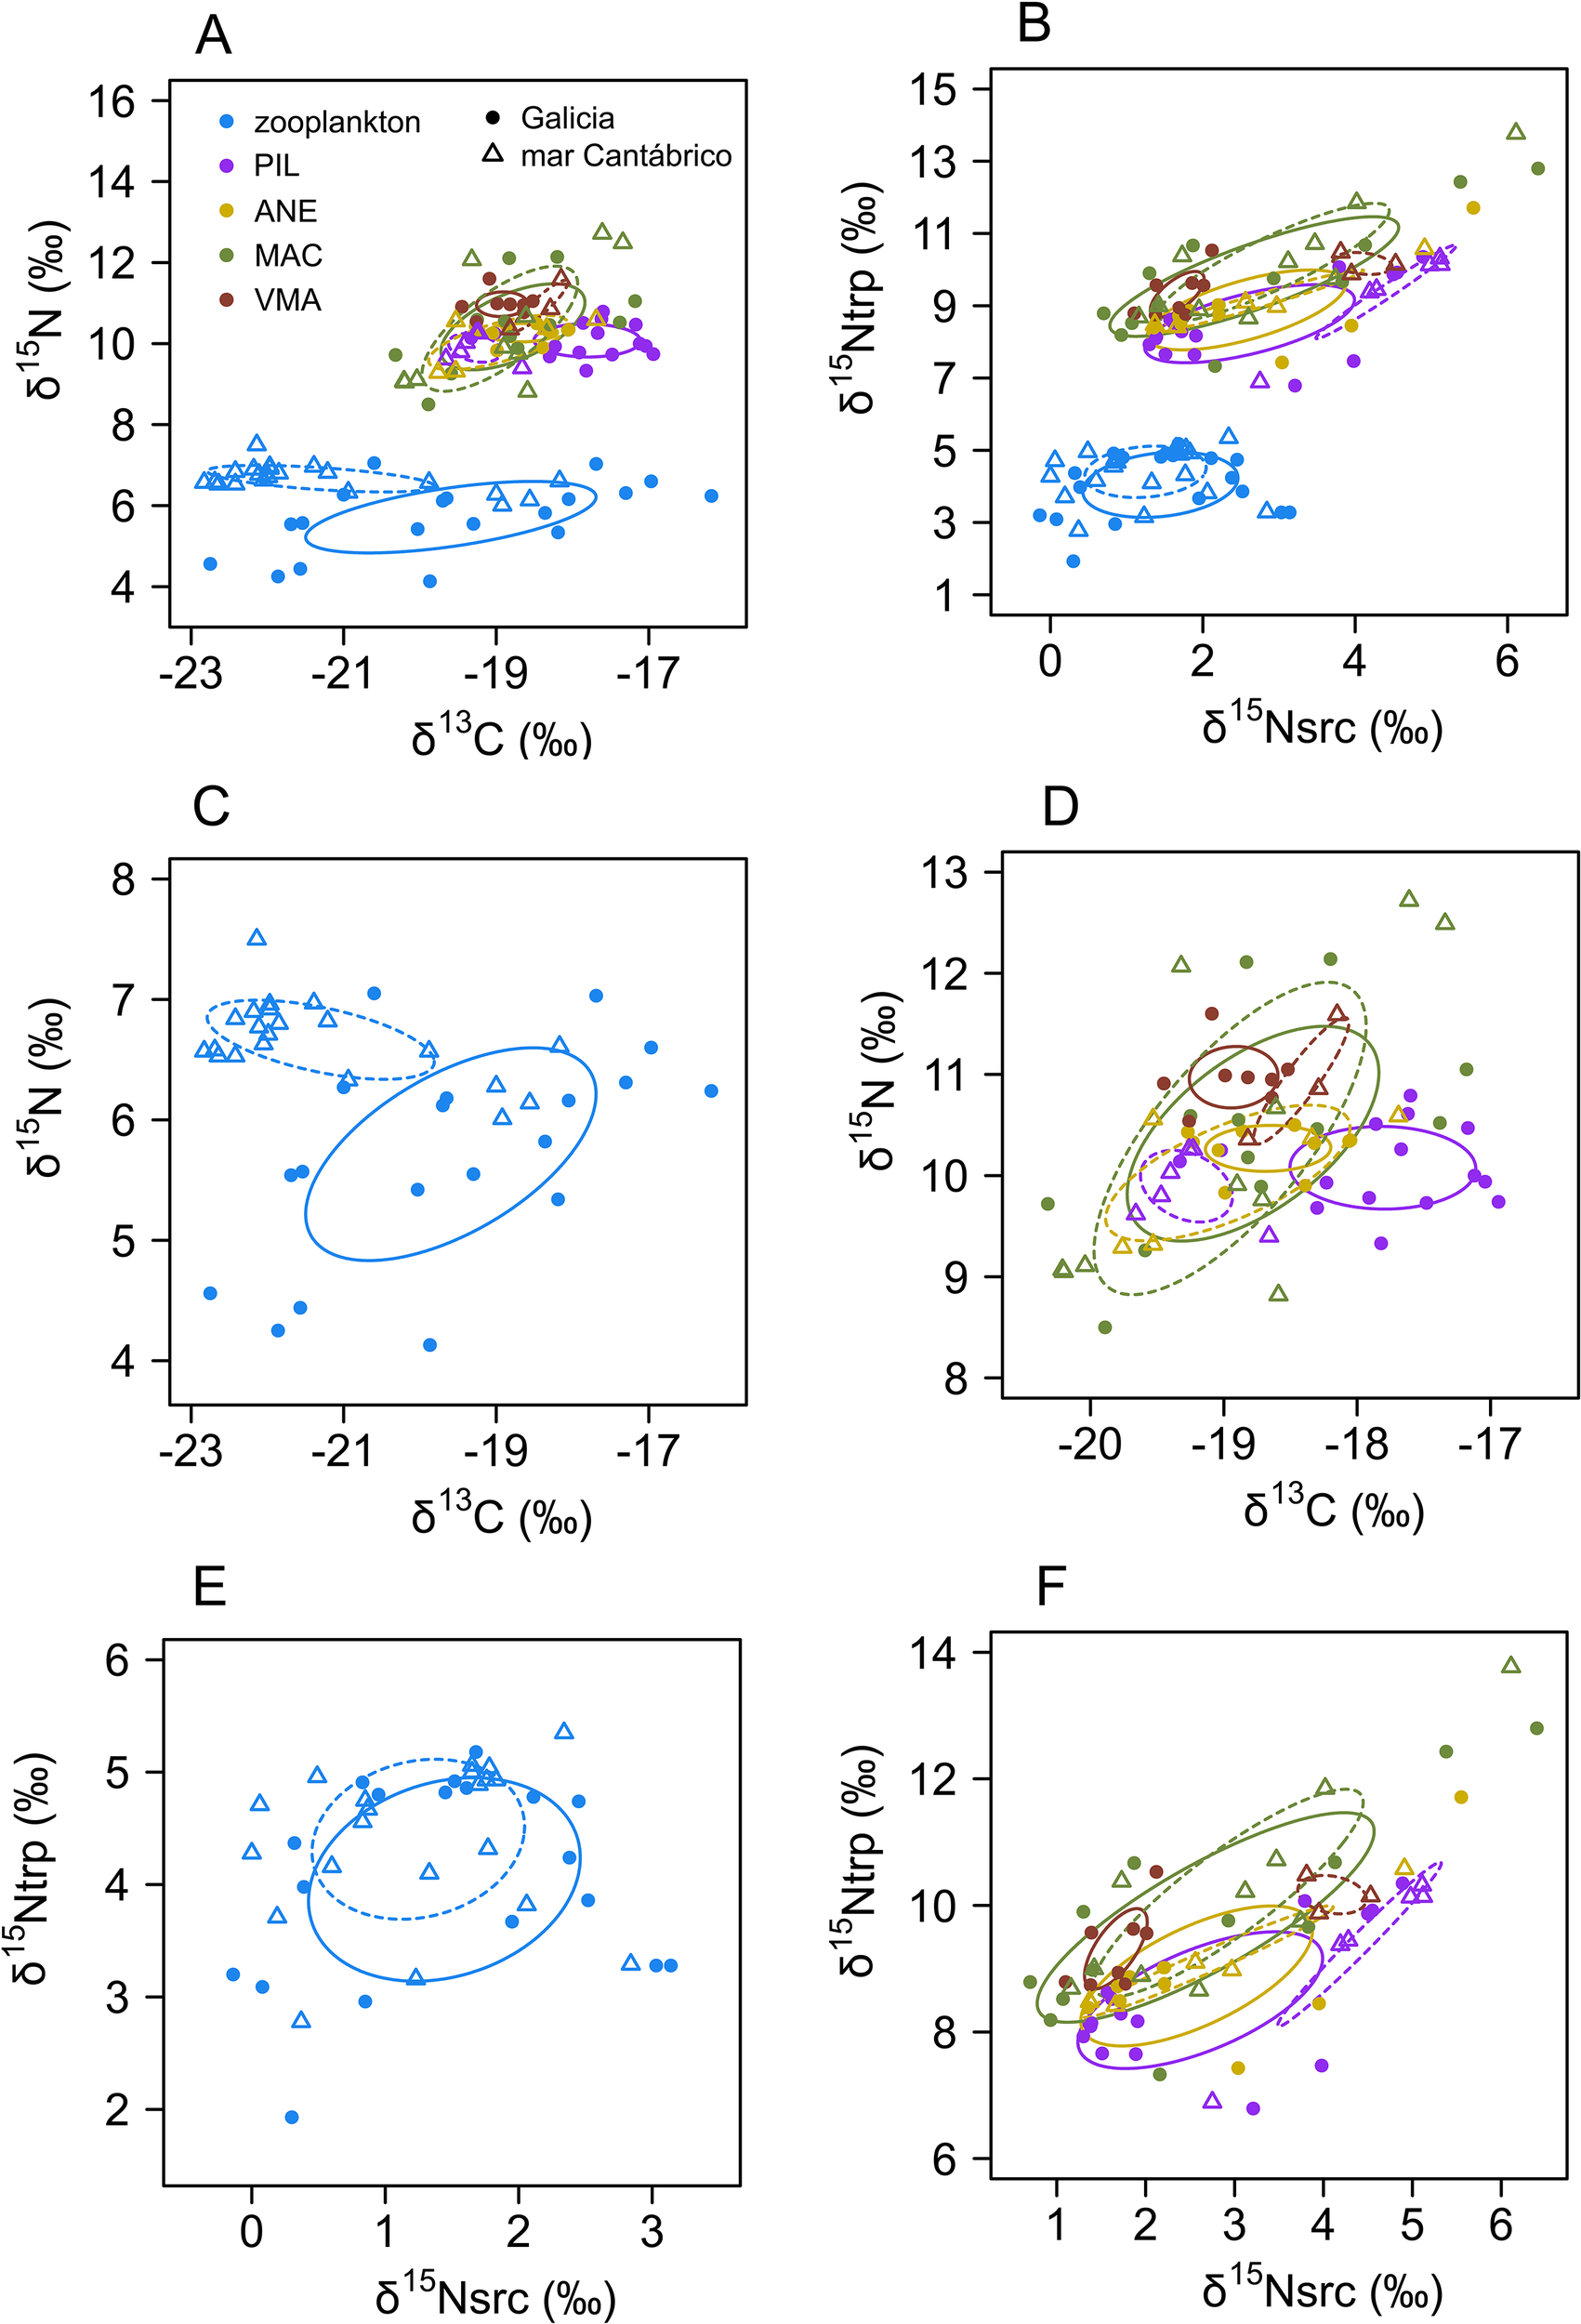
Standard ellipses for zooplankton and fish species determined by (A) bulk δ15N and δ13C or (B) by δ15N in trophic (δ15Ntrp) and source amino acids (δ15Nsrc) including all areas and cruises. Standard ellipses determined by bulk δ15N and δ13C and by areas for zooplankton (C) or fish (D), or by δ15Ntrp and δ15Nsrc for zooplankton (E) or fish (F). Continuous line indicates the trophic niche in Galicia and the dashes line in mar Cantábrico. Panels (C, D) show enlarge parts of previous panels. y-axis differs among panels. Species codes as in Figure 3.
The SEAB estimations from bulk δ13C and δ15N indicated a marked difference in the size of the trophic niche of zooplankton between zones, showing a larger niche observed in Galicia and a small niche for mar Cantábrico (Figure 6A). Such differences were less marked in the case of fish, with the notable exception of Atlantic mackerel, which had a broader niche in Galicia than in the mar Cantábrico. When SEAB was calculated from amino acid δ15N, the ellipse size was similar across zones for each species, with the largest differences in the case of zooplankton and anchovy (Figure 6B). In particular, zooplankton showed a larger niche in Galicia, while anchovy showed a broader niche in mar Cantábrico.
Figure 6
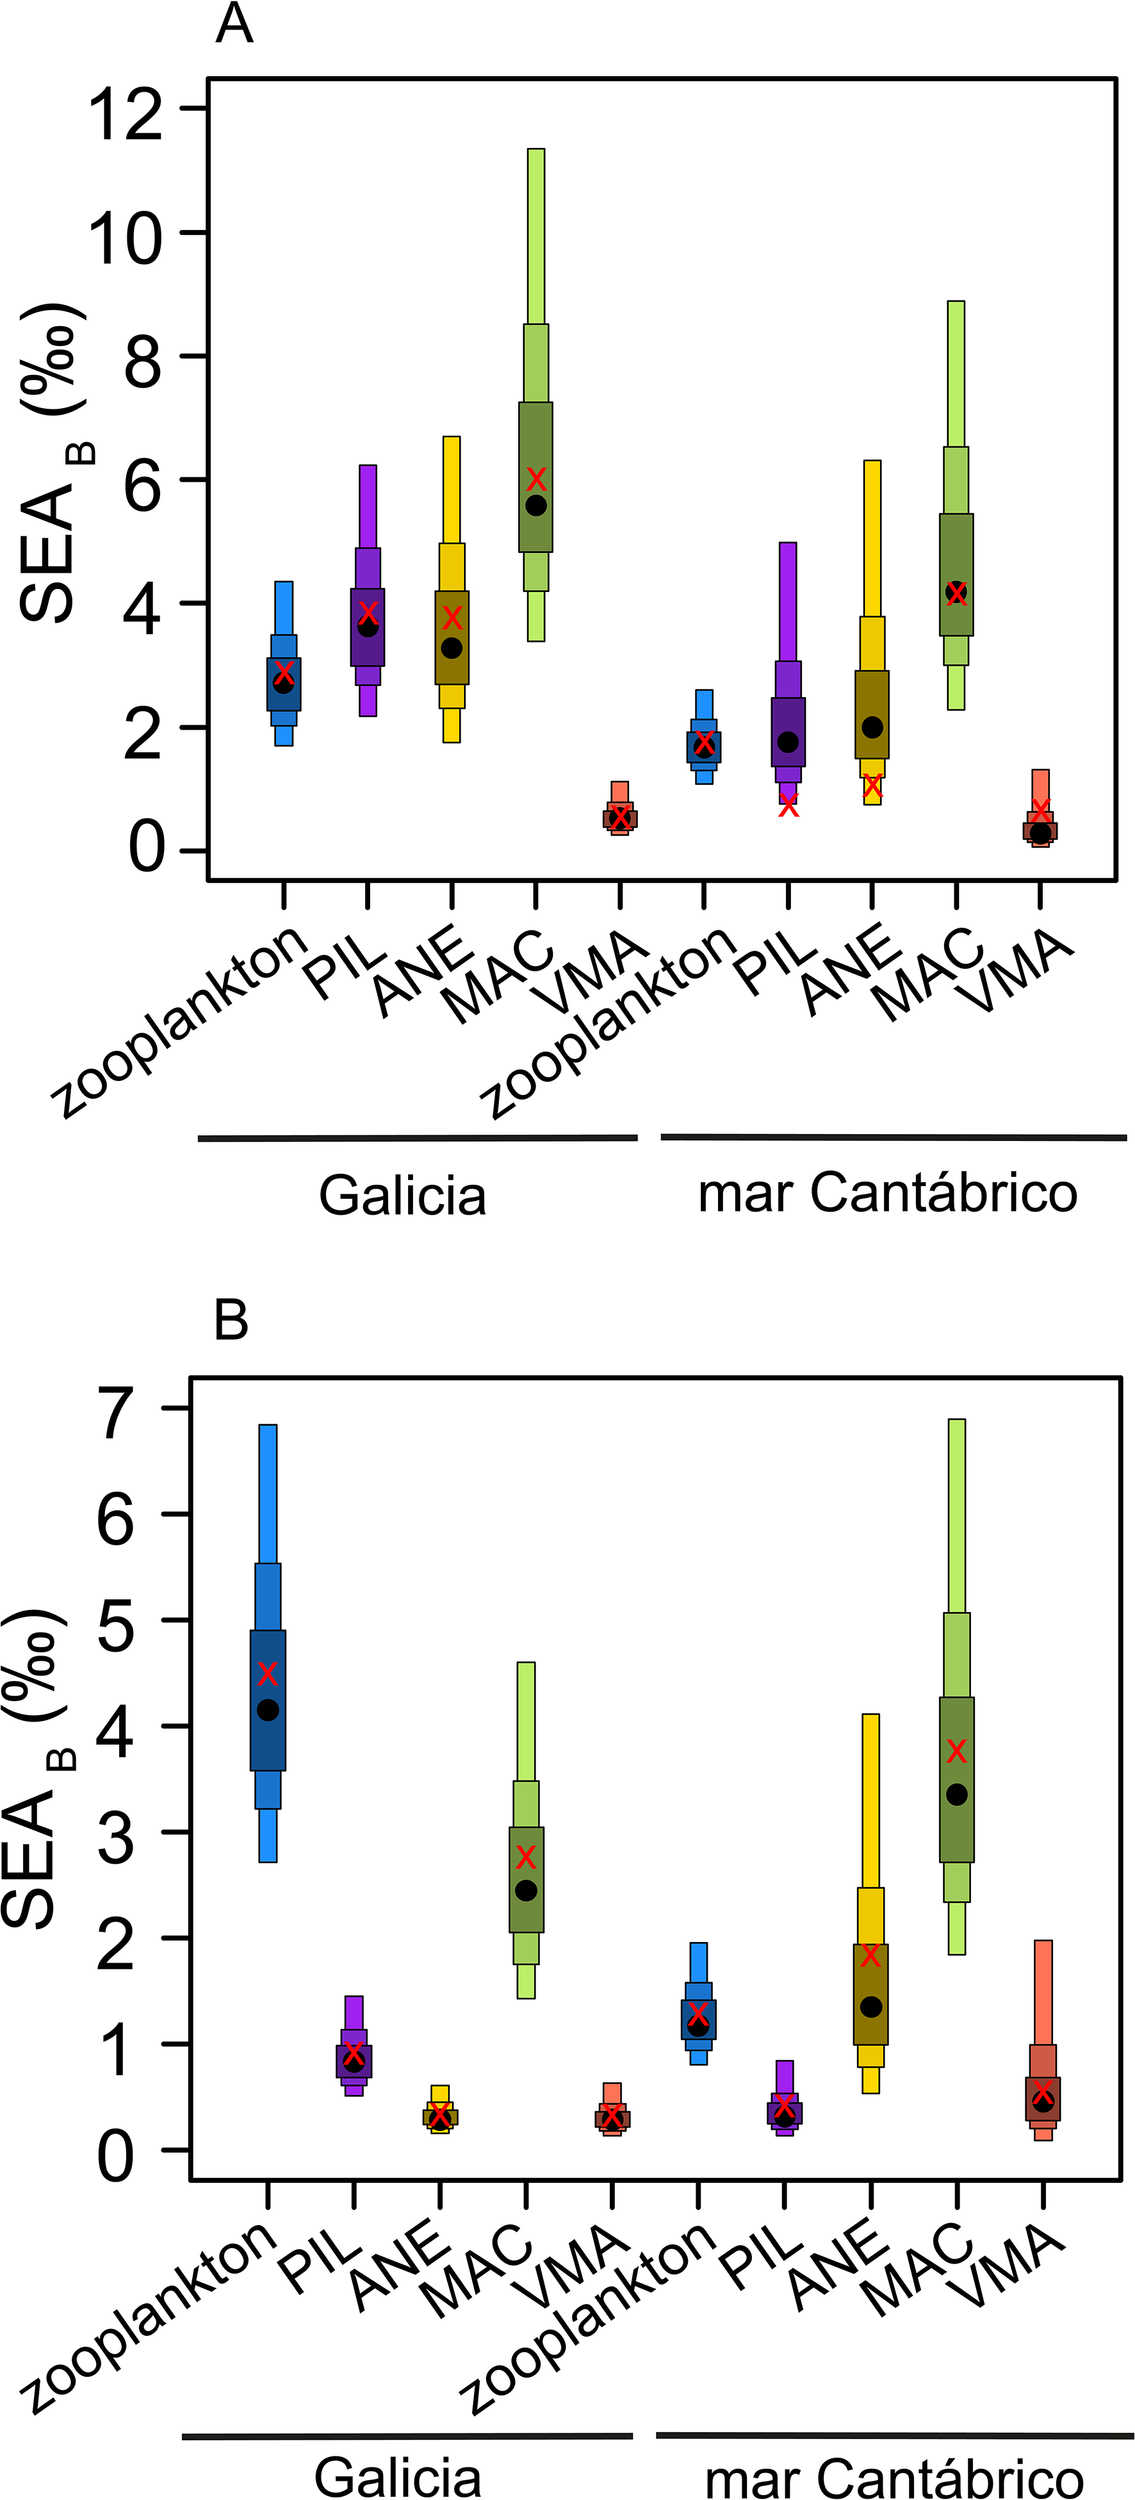
Posterior estimates of Bayesian Standard Ellipse Area (SEAB) of zooplankton and fish species for the study areas computed using (A) bulk δ15N and δ13C or (B) δ15N in trophic and source amino acids. The maximum likelihood estimate for the corresponding SEAB is indicated by red crosses, whereas black points indicate the mean standard ellipse area. The boxes represent the 25%, 50% and 95% credible intervals from inside to outside. Species codes as in Figure 3.
3.4 Isotopic niche overlap
The isotopic niche for zooplankton estimated from bulk δ13C and δ15N in the mar Cantábrico overlapped, on average, 10.8% over the niche for Galicia, while the latter only overlapped 2.2% over the niche for mar Cantábrico (Supplementary Figure S3). The corresponding estimates using amino acid δ15N increased the mean overlap to 44.2% and 23.3%, respectively. Bulk isotopes in fish showed greater overlap (mean values > 50%) of anchovy and chub mackerel over mackerel in Galicia (Figure 7A, Supplementary Figure S3), while in the mar Cantábrico the main overlaps were between sardine and chub mackerel on mackerel (Figure 7B). Lower overlap values were obtained, in general, from estimations using amino acid δ15N (Supplementary Figure S4). The species showing the largest overlap were the same as those identified using bulk isotopes in Galicia (Figure 7C). However, in the case of mar Cantábrico, the main overlaps were between chub mackerel and anchovy on mackerel. Interestingly, the use of amino acid δ15N ellipses detected a nearly symmetric overlap between sardine and anchovy in both zones but particularly in Galicia (ca. 30%).
Figure 7
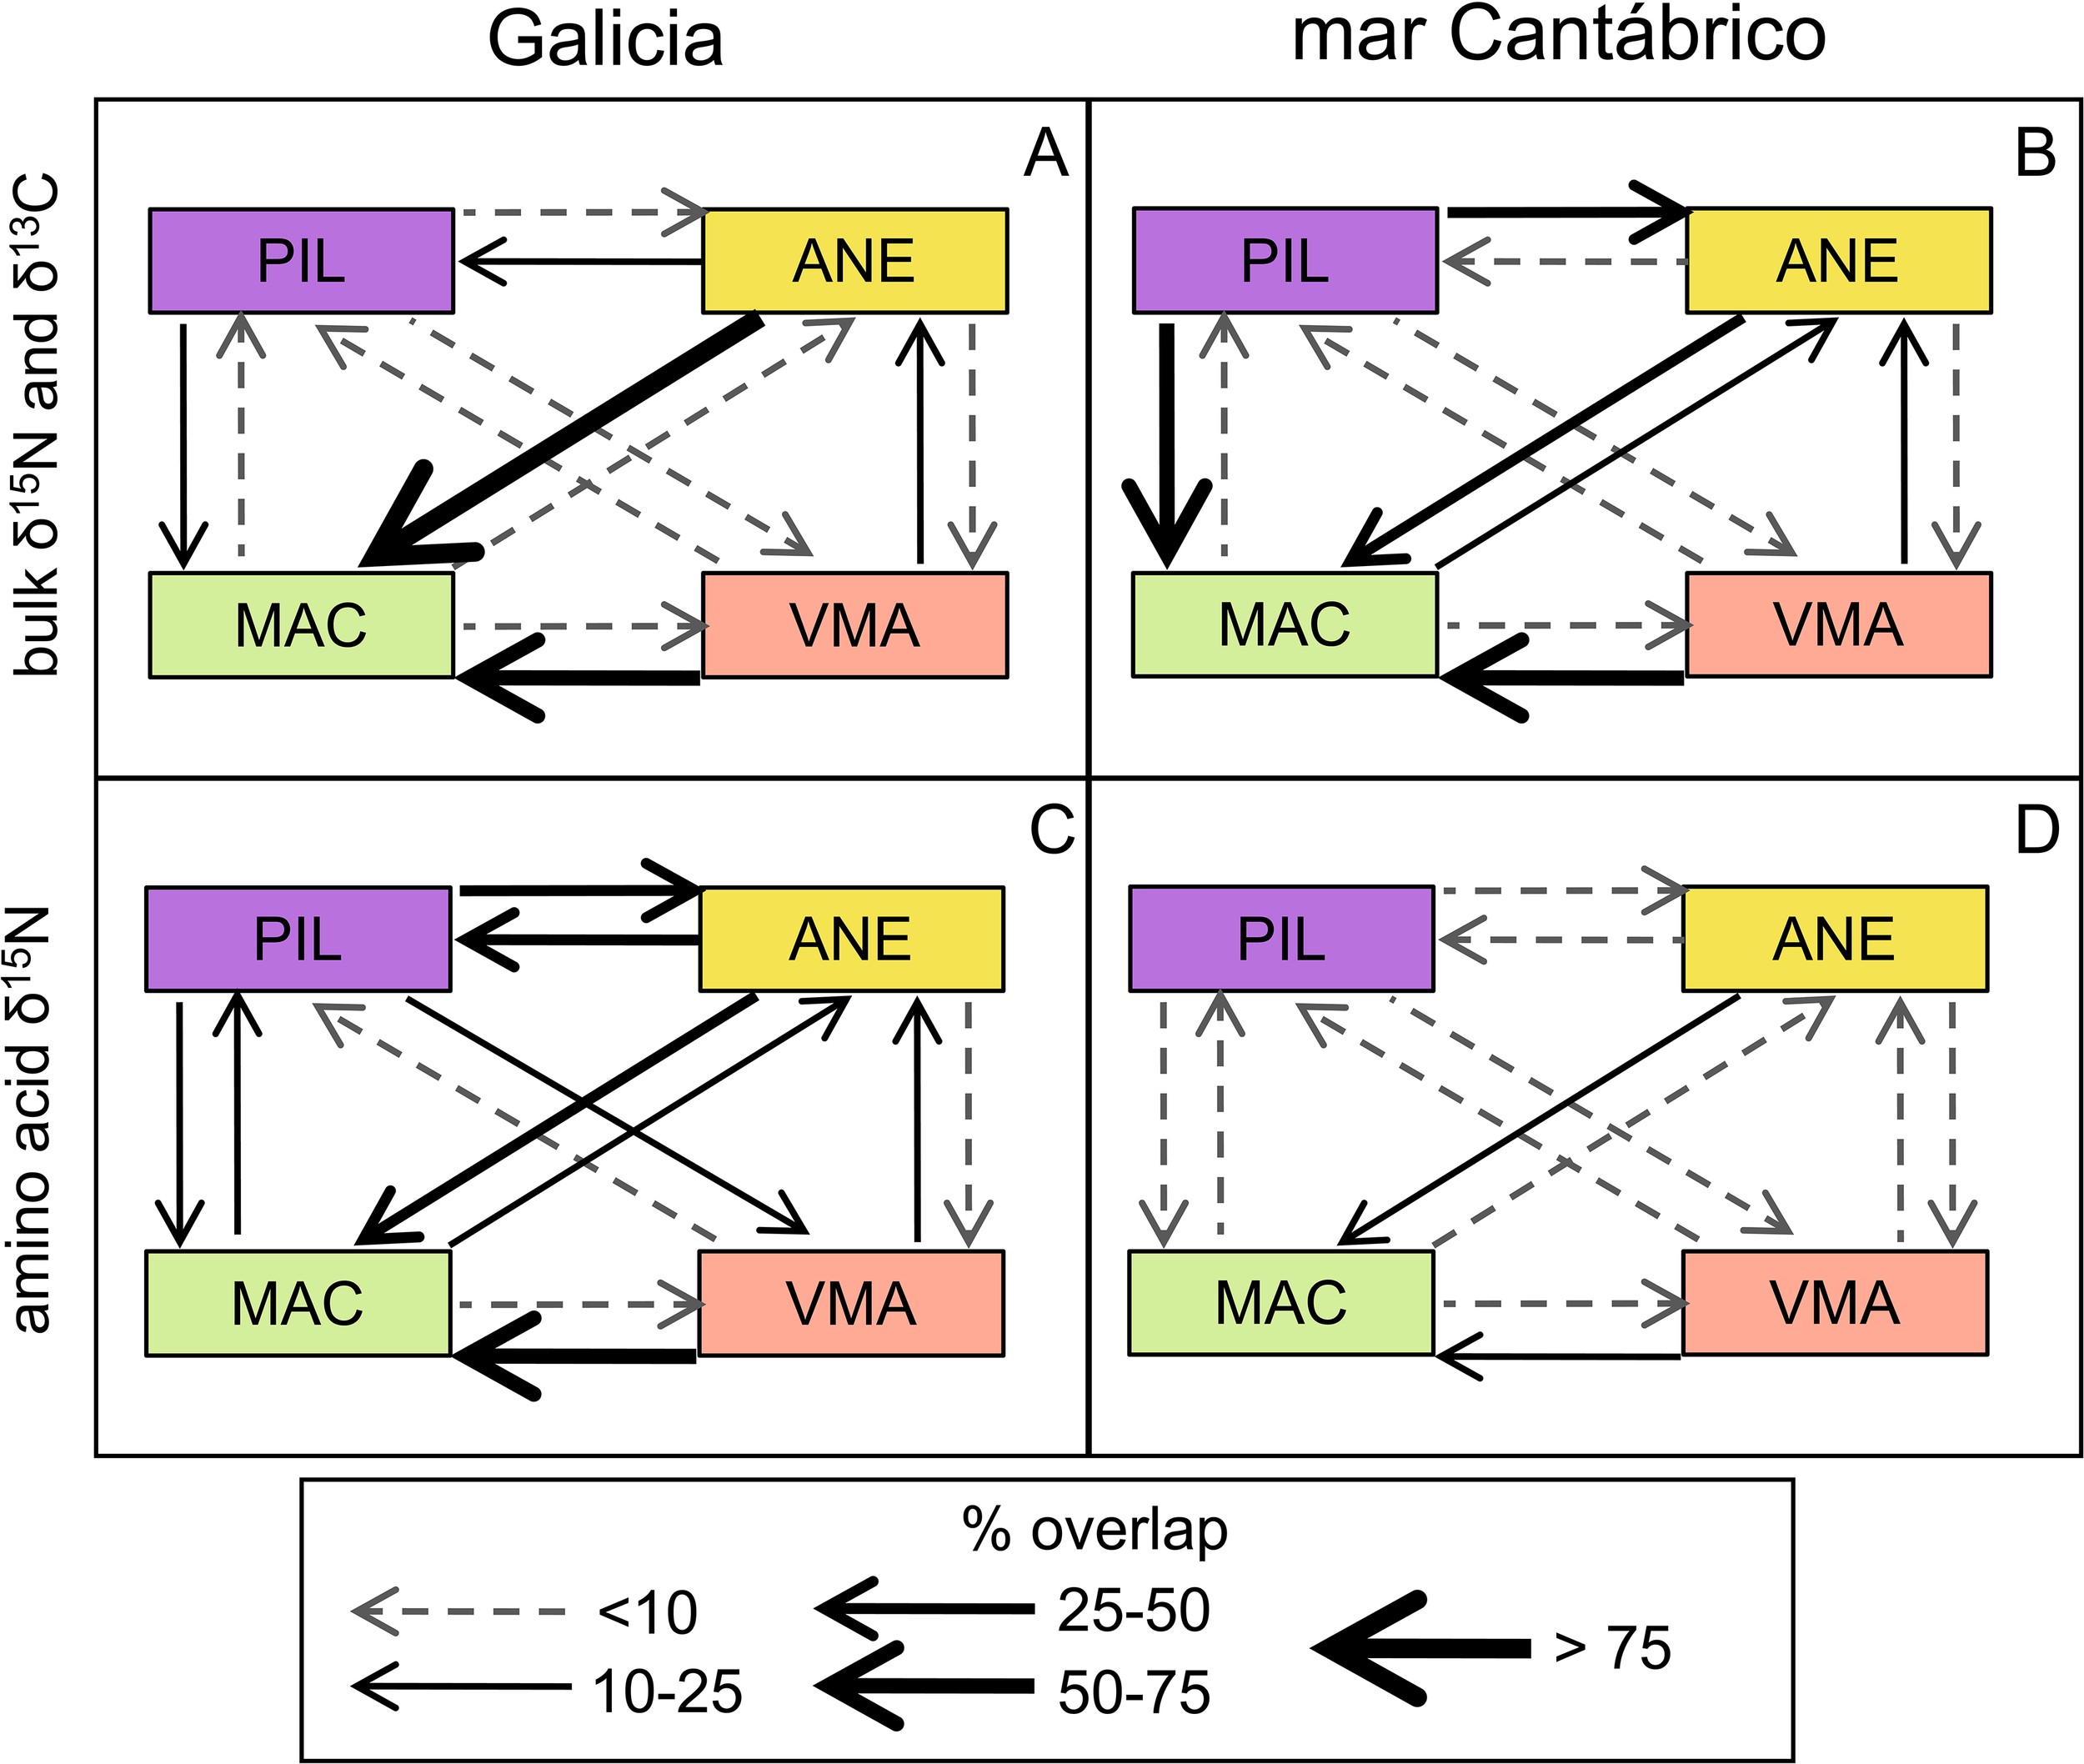
Mean overlap between standard ellipses for fish species within each study area computed using (A, B) bulk δ15N and δ13C or (C, D) δ15N in trophic (δ15Ntrp) and source amino acids (δ15Nsrc). Species codes as in Figure 3.
4 Discussion
4.1 Niche characterization with bulk vs. amino acid isotopes
This study compared, for the first time, two different estimations of trophic niche size and overlap using stable carbon and nitrogen isotopes. The classical estimation used δ13C and δ15N in bulk samples, while we here introduced a new estimate based on the weighted average of δ15N in trophic and source amino acids. The results indicate that both approaches are complementary, as they provide additional variables to identify potential food competition among fish species.
Most of previous studies of niche characterization based on stable isotopes estimated the size and overlap of the ellipses defined by the δ13C and δ15N plot measured in bulk samples. There are many examples in zooplankton (González et al., 2023) and fish (e.g. Masski et al., 2024). In contrast, studies using δ15N values in amino acids mostly focused on estimating the TP of species and the source nutrients for the food web supporting zooplankton (e.g. McCarthy et al., 2007; Mompeán et al., 2016; Décima, 2022; García-Seoane et al., 2023) or fish (e.g. Bradley et al., 2015). These studies generally used only selected amino acids or averaged values. In contrast, only a few studies exploited the full potential of the isotopic composition of all amino acids to characterize the trophic niche, and these were mostly based on carbon isotopes (Larsen et al., 2020). To our knowledge, there were no previous studies that used nitrogen isotopes in amino acids to characterize the trophic niche.
The obtained niche estimates with both methods revealed differences in sensitivity depending on the species. Those based on bulk isotopes showed high variability in size, in principle allowing for a better discrimination among species. Nevertheless, the standard ellipses were also highly overlapped, thus reducing niche separation. In contrast, ellipses based on amino acid δ15N were of similar size but showed less overlap, allowing for a better differentiation among species. In both cases, the vertical axis (δ15N or δ15Ntrp) can be used as a proxy for TP, particularly within zones, because of the low correlation between δ15N and δ15Nsrc indicates that bulk δ15N values reflect mainly TP. The differences in ellipses’ size and overlap between both methods highlight the importance of separating baseline from TP effects, as discussed below.
Zonal separation of niches was affected by the baseline estimations of each method. The lack of significant correlation between δ13C and δ15Nsrc indicates that carbon and nitrogen baselines were not equivalent in the studied region. Therefore, different food webs are expected for fish collected in Galicia, with generally higher δ13C and lower δ15Nsrc than fish collected in mar Cantábrico. This result differs from previous findings of a gradient of decreasing δ13C in demersal fish and sediments from Galicia to mar Cantábrico (Ortiz et al., 2024). However, δ13C in plankton is affected by multiple factors, including the concentration and origin of inorganic carbon in the water, but also by growth rate and species composition. High carbon isotope fractionation can be expected when inorganic carbon concentrations are high, because primary producers take up preferentially lighter isotopes, and will cause low δ13C values (Popp et al., 1998). This fractionation increases δ13C of the already 13C-depleted CO2 introduced by upwelling in surface waters (Gruber et al., 1999). In addition, phytoplankton cells growing at high rates, particularly diatoms, are less selective for carbon isotopes and show high δ13C (Fry and Wainright, 1991). The latter has been observed across multiple size fractions of plankton in upwelling regions (Mompeán et al., 2016) and during coastal blooms (Hunt et al., 2017), indicating the existence of a well-defined food web based on diatoms. Therefore, our results indicate that the organic matter originated by blooms in the upwelling events can be traced in the pelagic food web using the high δ13C values typical from Galicia, due to high phytoplankton growth rates and diatom dominance (Otero et al., 2018). The low raw δ13C values reported by Ortiz et al. (2024) in Galicia could be attributed to the dominance of samples related to benthic food webs and to the presence of lipids, typically depleted in 13C (Sweeting et al., 2006; Smyntek et al., 2007). In fact, another study in the same region found decreasing δ13C from Galicia to mar Cantábrico for several demersal fish and krill species (Lopez-Lopez et al., 2017). The use of a carbon baseline was revealed as essential for discriminating local populations of sardine in our study, otherwise undistinguishable when using only bulk nitrogen.
The low overlap for ellipses based on amino acid δ15N is indicative of their sensitivity to separate changes in TP from those caused by the observed variability in nitrogen sources. Therefore, separation with amino acid ellipses within each zone is thus more reliable than when using bulk isotopes (Figure 7). Identification of differences in local food webs is also facilitated by the use of δ15Nsrc as baseline. This is illustrated by the chub mackerel, showing clearly distinct δ15Nsrc values in Galicia and in mar Cantábrico but similar δ15Ntrp values in both zones (Figure 5F). Indeed, all fish species (except anchovy) had relatively high δ15Nsrc in mar Cantábrico. In contrast, zooplankton showed similar variability in nitrogen sources between zones but a higher TP in mar Cantábrico compared to samples from Galicia, which is consistent with a dominance of herbivorous species in the zone with more persistent upwelling (García-Seoane et al., 2023). High zooplankton δ15Nsrc has been shown to be indicative of the prevalence of nitrate provided by upwelling, particularly in areas with high denitrification (Décima, 2022). In Galicia, a significant difference in mesozooplankton δ15Nsrc between upwelling and no upwelling periods was also described (García-Seoane et al., 2023). In this case, the difference was small (< 2‰), likely due to the reduced impact of denitrification and thus the relatively low δ15N of the upwelled nitrate (Viana and Bode, 2013). Nevertheless, the high values δ15Nsrc in fish collected in mar Cantábrico in the present study suggests their feeding on plankton based on upwelling nitrogen. The mismatch between the geographic pattern of δ15Nsrc found for zooplankton and fish may be explained by their different time-integration and mobility factors, as detailed below.
The difference in baselines between zooplankton and fish can be attributed to the different time integrated by the isotopes in each species due to the tissue turnover time and growth rates (Vander Zanden et al., 2015). Zooplankton integrates the isotopic signal over scales of weeks (Tiselius and Fransson, 2016), while fish may integrate over several months (Bode et al., 2007). In this way, the geographic pattern obtained for zooplankton in this study represents only a small fraction of the feeding resources available for the fish sampled concurrently, because seasonal changes in upwelling conditions were shown to affect the isotopic composition of zooplankton (García-Seoane et al., 2023). Therefore, we may expect that fish isotopes would reflect their feeding across previous upwelling and non-upwelling periods.
4.2 Trophic niche size and upwelling
Previous studies found a marked zonation in the northern Iberian shelf, reflecting differences in water masses, nutrients, chlorophyll, phytoplankton species and seston particle size distributions (Bode et al., 2002) and other ecosystem variables such as zooplankton composition (Vandromme et al., 2014) or stable isotopes in plankton and fish (Bode et al., 2007; Ortiz et al., 2024; Lopez-Lopez et al., 2017). However, because of the dynamic nature of water masses and the upwelling in this region, the differences between zones vary from cruise to cruise, but generally show a marked difference between Galicia and mar Cantábrico. In this study, we used series of monthly values of UI, SST and Chla to provide a description of the environment more closely related to the dynamics of the food web (as stable isotopes are accumulated over time) than using variables (discrete values) measured during sampling. By considering the conditions over the 9 months prior to each cruise, which includes the previous upwelling season, we were able to confirm the higher intensity of upwelling in Galicia compared to mar Cantábrico at a time scale compatible with the time frame of stable isotope signature in the tissues analyzed.
Moreover, zooplankton showed different TP and isotopic values between zones, revealing the existence of contrasting upwelling systems and two different food webs across the study areas (Bode et al., 2007). Independently of the method used for the estimation, the fish species and zooplankton analyzed showed variable niche size values across the study zones. The large size of the zooplankton niche in Galicia could be due to the variability of the species composition in the zone with prevalent upwelling conditions, where the productivity is higher (Álvarez-Salgado et al., 2002). This concurs with the findings in southern areas of the Canary Current upwelling (Masski et al., 2024). However, in other ecosystems the zooplankton niche was narrower in the shallow upwelling coastal zone compared to the niche in deep oceanic waters where the diversity of habitats increased (González et al., 2023). In this way, our results seem to contradict the ‘niche-width hypothesis’ predicting a narrower niche at high levels of productivity because the abundant resources would favor diet specialization and thus low trophic niche breadth and overlap (Lesser et al., 2020). This apparent contradiction may be explained by the high temporal variability of productivity observed in the Canary Current upwelling, where phytoplankton blooms are produced and consumed over relatively short time periods (Armengol et al., 2019) with the result of a similar community composition for different upwelling areas when averaged over seasonal or longer time scales (García-Seoane et al., 2023).
The high availability of zooplankton species in the upwelling zone would explain the large niche size of sardine in Galicia, as found in southern areas (Masski et al., 2024). The sardine is one of the opportunistic planktivorous species with great dietary plasticity which diet depends on the prey availability (Garrido et al., 2015). Adaptation to local diet was shown to affect zonal isotopic signatures at geographic scales of hundreds of kilometers (Masski et al., 2024) and it would explain the clear separation of zonal niches for sardine, but also for chub mackerel, in this study. Other species, as mackerel and anchovy, apparently did not have different niches in each zone.
All the studied fish species occupy similar TP and showed relatively large niches and overlap (particularly when using bulk isotopes) suggesting resource competition. This similarity in TP reflects the consumption of similar prey types. However, while these species have been shown to share some prey types in this region, a number of factors have been invoked to release trophic competition, including selective preference for large prey or intra-guild predation (Bachiller and Irigoien, 2015). For instance, our results concur with those reporting a high overlap between the isotopic niches for sardine and anchovy in the Bay of Biscay (Plounevez and Champalbert, 1999) but also in other upwelling zones (Masski et al., 2024). Both species are planktivorous species and undergo ontogenetic changes in their diet. Juvenile sardines are primarily zoophagous while adults incorporate small phytoplankton into their diet (Garrido et al., 2015). In contrast, adult anchovies have a greater predation capacity (Nikolioudakis et al., 2014) and a lower filtration capacity (Bachiller and Irigoien, 2015).
4.3 Other sources of variability of fish trophic niches
Migration between zones with different food webs, however, can also cause an apparent overlap in trophic niche, particularly when the permanence of fish in each zone is lower than the time required for isotopic equilibration with a new diet. The species considered in this study display seasonal feeding and spawning migrations along the northern Iberian shelf. These migrations are well documented for sardine (Carrera and Porteiro, 2003) and mackerel (Jansen et al., 2012) but less known for anchovies (Whitehead et al., 1984) and chub mackerel (Martins et al., 2013). Seasonal migrations are generally triggered by temperature (Trenkel et al., 2014) which display large variations in this region and may explain the apparent alternation or substitution of species (Martins et al., 2013). Feeding on different food webs would cause an increase in the variability of the isotopic content, and therefore overlapping niches would be expected. This seems to be the case for chub mackerel in the Moroccan coast (Masski et al., 2024) but not in our study, as the niches for chub mackerel in Galicia and mar Cantábrico are clearly separated, as also observed for sardine. On the contrary, the large niches for anchovy and mackerel in mar Cantábrico, and the overlap between its own niches and similar TP across zones, could be explained by the seasonal migration of these species to Galician waters. This result contrasts with the high fidelity to zonal feeding grounds reported for these species in southern waters (Masski et al., 2024). All these findings point out to the importance of considering the time spent by each species feeding in different food webs to interpret potential competition for food resources, as shown for large migrants (Revill et al., 2009).
Previous studies in planktivorous fish from the Bay of Biscay suggest that the isotopic signatures of a given species may be more linked to the variation in the food supply than to feeding specialization. This pattern is likely due to the high interannual variability in δ15N values and the lack of a stable isotopic baseline, which makes it difficult to attribute isotopic variation to trophic behavior alone (Ortiz et al., 2024). Indeed, the overlap between the niche of these species seems to be mainly determined by prey availability (Bachiller and Irigoien, 2015). Our results partly support this hypothesis, because the large overlap of niches in anchovy and mackerel across the study area and their similar TP suggest the consumption of prey obtained in a variety of food webs. The different carbon and nitrogen source amino acid baselines found for sardine and chub mackerel in Galicia and mar Cantábrico imply a large fidelity to local food webs, at least during the time required for the equilibration of their isotopic composition with their plankton prey. However, explaining isotopic niches for both generalist or specialized feeding strategies requires the consideration of fish mobility across the shelf zones and isotopic turnover. Temporal and geographic variations in isotopic baselines were reported to affect the stable isotope composition of planktivorous fish in other ecosystems (Ohshimo et al., 2021). This further supports the analysis of stable isotopes in species with different life span and growth rates to reveal temporal changes in food webs, as each species and tissue allows for complementary integration windows of diet (Vander Zanden et al., 2015).
5 Conclusion
The implementation of the novel method based on the weighted average of δ15N in trophic and source amino acids provides a more precise resolution of the trophic niches, clarifying the difference between nitrogen sources and TP. Together, this new approach and the traditional bulk isotope method offer complementary insights understanding food web interactions between fish and zooplankton, as well as potential competition among planktivorous fish species. Zooplankton showed wide niches and clear spatial segregation by zones, especially in bulk isotopes analyses. All the studied fish species showed relatively large niches and overlap (particularly when using bulk isotopes) suggesting resource competition. However, differential migration patterns may alleviate this apparent competition and explain why some species showed marked geographic differences in their isotopic composition.
Statements
Data availability statement
The datasets presented in this study can be found in online repositories. The raw data on upwelling strength computed by the Instituto Español de Oceanografía (IEO-CSIC) is available at http://www.indicedeafloramiento.ieo.es. Satellite sea surface temperature and chlorophyll-a concentrations were obtained from the NOAA Earth System Research Laboratory (https://psl.noaa.gov/data/gridded/data.noaa.oisst.v2.highres.html) and from the GlobColour Project (https://hermes.acri.fr/), respectively. Stable isotope data is available at the PANGAEA repository (https://doi.pangaea.de/10.1594/PANGAEA.972845).
Ethics statement
The animal study was approved by EU Common Fisheries Policy and Ministerio de Agricultura, Pesca y Alimentación (Spain), which approved the collection of fish samples as part of routine fishery survey cruises. Fish handling procedures were approved as standard fishery survey practices. No additional collection of samples was required for the research described in this manuscript. The study was conducted in accordance with the local legislation and institutional requirements.
Author contributions
NM: Conceptualization, Data curation, Formal analysis, Visualization, Writing – original draft, Writing – review & editing. IV: Conceptualization, Data curation, Methodology, Writing – review & editing. RG: Investigation, Methodology, Writing – review & editing, Data curation. JO: Data curation, Investigation, Writing – review & editing. AB: Conceptualization, Funding acquisition, Writing – review & editing.
Funding
The author(s) declared that financial support was received for this work and/or its publication. PELACUS surveys (Spanish Institute of Oceanography, Spain) are co-funded by the European Union through the Data Collection Framework. This research was supported by MCIN/AEI/10.13039/501100011033 (Spain) through the QLOCKS (PID2020-115620RB-100) and MTL-FISH (PID2023-147149NB100) projects. RG-S. received funding from a Juan de la Cierva-Formación postdoctoral grant (FJC2019-040921-I) from MCIN/AEI and the EU NextGeneration/PRTR programs, as well as from the Spanish Ministry of Science, Innovation and Universities through the José Castillejo mobility program (CAS21/00543). She is currently supported by the European Union’s Horizon Europe research and innovation program under a Marie Skłodowska-Curie Postdoctoral Fellowship 2023 (grant agreement No 101150001-PelCon). IV was supported by a Juan de la Cierva-Incorporación postdoctoral grant (IJC2019-040554-I) from MCIN/AEI. NM was supported by a predoctoral grant (PREP2023-001364) from MCIN/AEI.
Acknowledgments
We are grateful to the chief scientists and all to the participant in the PELACUS cruises allowing to the collection of samples. We are particularly indebted to Angel F. Lamas for his assistance in plankton and fish sample preparation.
Conflict of interest
The authors declared that this work was conducted in the absence of any commercial or financial relationships that could be construed as a potential conflict of interest.
Generative AI statement
The author(s) declared that generative AI was not used in the creation of this manuscript.
Any alternative text (alt text) provided alongside figures in this article has been generated by Frontiers with the support of artificial intelligence and reasonable efforts have been made to ensure accuracy, including review by the authors wherever possible. If you identify any issues, please contact us.
Publisher’s note
All claims expressed in this article are solely those of the authors and do not necessarily represent those of their affiliated organizations, or those of the publisher, the editors and the reviewers. Any product that may be evaluated in this article, or claim that may be made by its manufacturer, is not guaranteed or endorsed by the publisher.
Supplementary material
The Supplementary Material for this article can be found online at: https://www.frontiersin.org/articles/10.3389/fmars.2025.1718402/full#supplementary-material
References
1
Alcaraz M. Calbet A. (2007). “ Large zooplankton: its role in pelagic food webs,” in Encyclopedia of Life Support Systems: Fisheries and Aquaculture (Oxford, UK: Eolss Publishers), 243–265.
2
Álvarez-Salgado X. A. Beloso S. Joint I. Nogueira E. Chou L. Pérez F. F. et al . (2002). New production of the NW Iberian shelf during the upwelling season over the period 1982-1999. Deep Sea Res.49, 1725–1739. doi: 10.1016/S0967-0637(02)00094-8
3
Armengol L. Calbet A. Franchy G. Rodríguez-Santos A. Hernández-León S. (2019). Planktonic food web structure and trophic transfer efficiency along a productivity gradient in the tropical and subtropical Atlantic Ocean. Sci. Rep.9, 2044. doi: 10.1038/s41598-019-38507-9
4
Bachiller E. Irigoien X. (2015). Trophodynamics and diet overlap of small pelagic fish species in the Bay of Biscay. Mar. Ecol. Prog. Ser.534, 179–198. doi: 10.3354/meps11375
5
Bode A. Alvarez-Ossorio M. T. Cunha M. E. Garrido S. Peleteiro J. B. Porteiro C. et al . (2007). Stable nitrogen isotope studies of the pelagic food web on the Atlantic shelf of the Iberian Peninsula. Prog. Oceanogr.74, 115–131. doi: 10.1016/j.pocean.2007.04.005
6
Bode A. Carrera P. González-Nuevo G. Nogueira E. Riveiro I. Santos M. B. (2018). A trophic index for sardine (Sardina pilchardus) and its relationship to population abundance in the southern Bay of Biscay and adjacent waters of the NE Atlantic. Prog. Oceanogr.166, 139–147. doi: 10.1016/j.pocean.2017.08.005
7
Bode A. Carrera P. Lens S. (2003). The pelagic foodweb in the upwelling ecosystem in Galicia (NW Spain) during spring: natural abundance of stable carbon and nitrogen isotopes. ICES J. Mar. Sci.60, 11–22. doi: 10.1006/jmsc.2002.1326
8
Bode A. Varela M. Casas B. González N. (2002). Intrusions of eastern North Atlantic central waters and phytoplankton in the north and northwestern Iberian shelf during spring. J. Mar. Syst.36, 197–218. doi: 10.1016/S0924-7963(02)00187-2
9
Botas J. A. Fernández E. Bode A. Anadon R. (1990). A persistent upwelling off the Central Cantabrian Coast (Bay of Biscay). Estuar. Coast. Shelf Sci.30, 185–199. doi: 10.1016/0272-7714(90)90063-W
10
Bradley C. J. Wallsgrove N. J. Choy C. A. Drazen J. C. Hetherington E. D. Hoen D. K. et al . (2015). Trophic position estimates of marine teleosts using amino acid compound specific isotopic analysis. Limnol. Oceanogr. Methods13, 476–493. doi: 10.1002/lom3.10041
11
Carrera P. Porteiro C. (2003). Stock dynamic of the Iberian sardine (Sardina pilchardus, W.) and its implication on the fishery off Galicia (NW Spain). Sci. Mar.67, 245–258. Available online at: http://hdl.handle.net/10261/327987 (Accessed September 15, 2025).
12
Chikaraishi Y. Ogawa N. O. Kashiyama Y. Takano Y. Suga H. Tomitani A. et al (2009). Determination of aquatic food-web structure based on compound-specific nitrogen isotopic composition of amino acids. Limnol. Oceanogr. Methods7 (11), 740–750. doi: 10.4319/lom.2009.7.740
13
Coplen T. B. (2011). Guidelines and recommended terms for expression of stable isotope-ratio and gas-ratio measurement results. Rapid Commun. Mass Spectrom.25, 2538–2560. doi: 10.1002/rcm.5129
14
Cury P. Bakun A. Crawford R. J. Jarre A. Quiñones R. A. Shannon L. J. et al . (2000). Small pelagics in upwelling systems: patterns of interaction and structural changes in “wasp-waist” ecosystems. ICES J. Mar. Sci.57, 603–618. doi: 10.1006/jmsc.2000.0712
15
Décima M. (2022). Zooplankton trophic structure and ecosystem productivity. Mar. Ecol. Prog. Ser.692, 23–42. doi: 10.3354/meps14077
16
Décima M. Landry M. (2020). Resilience of plankton trophic structure to an eddy-simulated diatom bloom in the North Pacific Subtropical Gyre. Mar. Ecol. Prog. Ser.643, 33–48. doi: 10.3354/meps
17
Fernández E. Cabal J. Acuña J. L. Bode A. Botas C. García-Soto C. (1993). Plankton distribution across a slope current-induced front in the southern Bay of Biscay. J. Plankton Res.15, 619–641. doi: 10.1093/plankt/15.6.619
18
Fry B. Wainright S. C. (1991). Diatom sources of 13C-rich carbon in marine food webs. Mar. Ecol. Prog. Ser.76, 149–157. doi: 10.3354/meps076149
19
García-Seoane R. Viana I. G. Bode A. (2023). Seasonal upwelling influence on trophic indices of mesozooplankton in a coastal food web estimated from δ15N in amino acids. Prog. Oceanogr.219, 103149. doi: 10.1016/j.pocean.2023.103149
20
Garrido S. Silva A. Pastor J. Dominguez R. Silva A. V. Santos A. M. (2015). Trophic ecology of pelagic fish species off the Iberian coast: diet overlap, cannibalism and intraguild predation. Mar. Ecol. Prog. Ser.539, 271–285. doi: 10.3354/meps11506
21
Gaston K. J. Chown S. L. (2005). Neutrality and the niche. Funct. Eco.19, 1–6. doi: 10.1111/j.0269-8463.2005.00948.x
22
González C. E. Bode A. Fernández-Urruzola I. Hidalgo P. Oerder V. Escribano R. (2023). The lateral transport of zooplankton explains trophic and taxonomic similarities over the zonal gradient of central Chile. J. Mar. Syst.238, 103840. doi: 10.1016/j.jmarsys.2022.103840
23
González-Nuevo G. Gago J. Cabanas J. M. (2014). Upwelling index: a powerful tool for marine research in the NW Iberian upwelling system. J. Oper. Oceanogr.7, 45–55. doi: 10.1080/1755876X.2014.11020152
24
Gruber N. Keeling C. D. Bacastow R. B. Guenther P. R. Lueker T. J. Wahlen M. et al . (1999). Spatiotemporal patterns of carbon-13 in the global surface oceans and the oceanic Suess effect. Glob. Biogeochem. Cycles.13, 307–335. doi: 10.1029/1999GB900019
25
Guisande C. Cabanas J. M. Vergara A. R. Riveiro I. (2001). Effect of climate on recruitment success of Atlantic Iberian sardine Sardina pilchardus. Mari. Ecol. Prog. Sers.223, 243–250. doi: 10.3354/meps223243
26
Hammer Ø. Harper D. A. T. Ryan P. D. (2001). PAST: Paleontological statistics software package for education and data analysis. Palaeontologia Electronica.4, 9 pp. Available online at: http://palaeo-electronica.org/2001_1/past/issue1_01.htm (Accessed April 10, 2025).
27
Huang B. Liu C. Banzon V. Freeman E. Graham G. Hankins B. et al . (2021). Improvements of the daily optimum interpolation sea surface temperature (DOISST) version 2.1. J. Clim.34, 2923–2939. doi: 10.1175/JCLI-D-20-0166.1
28
Hunt B. P. V. Carlotti F. Donoso K. Pagano M. D’Ortenzio F. Taillandier V. et al . (2017). Trophic pathways of phytoplankton size classes through the zooplankton food web over the spring transition period in the north-west Mediterranean Sea. J. Geophys. Res. Oceans.122, 6309–6324. doi: 10.1002/2016JC012658
29
Hutchinson G. E. (1978). An introduction to population ecology (New Haven: Yale University Press).
30
ICES (2023). Working group for the Bay of Biscay and the Iberian waters ecoregion (WGBIE). ICES Sci. Rep.5, 1–803. doi: 10.17895/ices.pub.23541168
31
Jackson A. L. Inger R. Parnell A. C. Bearhop S. (2011). Comparing isotopic niche widths among and within communities: SIBER – Stable Isotope Bayesian Ellipses in R. J. Anim. Ecol.80, 595–602. doi: 10.1111/j.1365-2656.2011.01806.x
32
Jackson A. Parnell A. (2025). Stable Isotope Bayesian Ellipses in R. Version 2.1.9 (Oxford, UK: CRAN Repository). Available online at: https://cran.r-project.org/web/packages/SIBER/SIBER.pdf (Accessed October 15, 2024).
33
Jansen T. Campbell A. Kelly C. Hátún H. Payne M. R. (2012). Migration and fisheries of north East Atlantic mackerel (Scomber scombrus) in autumn and winter. PloS One7, e51541. doi: 10.1371/journal.pone.0051541
34
Larsen T. Hansen T. Dierking J. (2020). Characterizing niche differentiation among marine consumers with amino acid δ13C fingerprinting. Ecol. Evol.10, 7768–7782. doi: 10.1002/ece3.6502
35
Layman C. A. Araujom M. S. Boucek R. Hammerschlag-Peyer C. M. Harrison E. Jud Z. R. et al . (2012). Applying stable isotopes to examine food-web structure: an overview of analytical tools. Biol. Rev.87, 545–562. doi: 10.1111/j.1469-185X.2011.00208.x
36
Lerner J. E. Marchese C. Hunt B. P. V. (2022). Stable isotopes reveal that bottom-up omnivory drives food chain length and trophic position in eutrophic coastal ecosystems. ICES J. Mar. Sci.79, 2311–2323. doi: 10.1093/icesjms/fsac171
37
Lesser J. S. James W. R. Stallings C. D. Wilson R. M. Nelson J. A. (2020). Trophic niche size and overlap decreases with increasing ecosystem productivity. Oikos129, 1303–1313. doi: 10.1111/oik.07026
38
Lopez-Lopez L. Preciado I. Muñoz I. Decima M. Molinero J. C. Tel E. (2017). Does upwelling intensity influence feeding habits and trophic position of planktivorous fish? Deep Sea Res.122, 29–40. doi: 10.1016/J.DSR.2017.01.017
39
Lysy M. Stasko A. Swanson H. (2023). Niche Region and Niche Overlap Metrics for Multidimensional Ecological Niches. Version: 1.1.2 ( GitHub). Available online at: https://github.com/mlysy/nicheROVER (Accessed October 08, 2024).
40
Maritorena S. d’Andon O. H. F. Mangin A. Siegel D. A. (2010). Merged satellite ocean color data products using a bio-optical model: Characteristics, benefits and issues. Remote Sens. Environ.114, 1791–1804. doi: 10.1016/j.rse.2010.04.002
41
Martins M. M. Skagen D. Marques V. Zwolinksi J. Silva A. (2013). Changes in the abundance and spatial distribution of the Atlantic chub mackerel (Scomber colias) in the pelagic ecosystem and fisheries off Portugal. Sci. Mar.77, 551–563. doi: 10.3989/scimar.03861.07B
42
Masski H. Giménez J. de Stephanis. R. Coll M. Ragmane S. Abdellaoui S. et al . (2024). Trophic level, niche width, and site fidelity of Moroccan forage fish in two contrasting upwelling systems. Estuar. Coast. Shelf Sci.300, 108703. doi: 10.1016/j.ecss.2024.108703
43
McCarthy M. D. Benner R. Lee C. Fogel M. L. (2007). Amino acid nitrogen isotopic fractionation patterns as indicators of heterotrophy in plankton, particulate, and dissolved organic matter. Geochim. Cosmochim Acta71, 4727–4744. doi: 10.1016/j.gca.2007.06.061
44
McMahon K. W. McCarthy M. D. (2016). Embracing variability in amino acid δ15N fractionation: mechanisms, implications, and applications for trophic ecology. Ecosphere7, e01511. doi: 10.1002/ecs2.1511
45
Mompeán C. Bode A. Gier E. McCarthy M. D. (2016). Bulk vs. aminoacid stable N isotope estimations of metabolic status and contributions of nitrogen fixation to size-fractionated zooplankton biomass in the subtropical N Atlantic. Deep Sea Res.114, 137–148. doi: 10.1016/j.dsr.2016.05.005
46
Nikolioudakis N. Somarakis S. Isari S. (2014). Trophodynamics of anchovy in a non-upwelling system: direct comparison with sardine. Mar. Ecol. Prog. Ser.500, 215–229. doi: 10.3354/meps10604
47
Ohshimo S. Kodama T. Yasuda T. Kitajima S. Tsuji T. Kidokoro H. et al . (2021). Potential fluctuation of δ13C and δ15N values of small pelagic forage fish in the Sea of Japan and East China Sea. Mar. Freshw. Res.72, 1811–1823. doi: 10.1071/MF20351
48
Ortiz J. J. Preciado I. Hidalgo M. González-Irsuta J. M. Rabanal I. M. López-López L. (2024). Estimating spatial variability of baseline isoscapes from fish isotopic signatures at the community level. Prog. Oceanogr.221, 103205. doi: 10.1016/j.pocean.2024.103205
49
Otero J. Bode A. Álvarez-Salgado X. A. Varela M. (2018). Role of functional traits variability in the response of individual phytoplankton species to changing environmental conditions in a coastal upwelling zone. Mar. Ecol. Prog. Ser.596, 33–47. doi: 10.3354/meps12542
50
Plounevez S. Champalbert G. (1999). Feeding behavior and trophic environment of Engraulis encrasicolus (L.) in the Bay of Biscay. Estuar. Coast. Shelf Sci.49, 177–191. doi: 10.1006/ecss.1999.0497
51
Popp B. N. Laws E. A. Bidigare R. R. Dore J. E. Hanson K. L. Wakeham S. G. (1998). Effect of phytoplankton cell geometry on carbon isotopic fractionation. Geochim. Cosmochim. Acta62, 69–77. doi: 10.1016/S0016-7037(97)00333-5
52
Prowe A. E. F. Visser A. W. Andersen K. H. Chiba S. Kiørboe T. (2018). Biogeography of zooplankton feeding strategy. Limnol. Oceanogr.64, 661–678. doi: 10.1002/lno.11067
53
R Core Team (2024). R: A language and environment for statistical computing (Vienna, Austria: R Foundation for Statistical Computing).
54
Revill A. T. Young J. W. Lansdell M. (2009). Stable isotopic evidence for trophic groupings and bio-regionalization of predators and their prey in oceanic waters off eastern Australia. Mar. Biol.156, 1241–1253. doi: 10.1007/s00227-009-1166-5
55
Saavedra C. García-Polo M. Giménez J. Mons J. L. Castillo J. J. Fernández-Maldonado C. et al . (2022). Diet of striped dolphins (Stenella coeruleoalba) in southern Spanish waters. Mar. Mamm. Sci.169, 101996. doi: 10.1111/mms.12945
56
Smyntek P. M. Teece M. A. Schulz K. L. Thackeray J. (2007). A standard protocol for stable isotope analysis of zooplankton in aquatic food web research using mass balance correction models. Limnol. Oceanogr.52, 2135–2146. doi: 10.4319/lo.2007.52.5.2135
57
Sweeting C. J. Polunin N. V. C. Jennings S. (2006). Effects of chemical lipid extraction and arithmetic lipid correction on stable isotope ratios of fish tissues. Rapid Commun. Mass. Spectrom.20, 595–601. doi: 10.1002/rcm.2347
58
Tiselius P. Fransson K. (2016). Daily changes in δ15N and δ13C stable isotopes in copepods: equilibrium dynamics and variations of trophic level in the field. J. Plankton Res.38, 751–761. doi: 10.1093/plankt/fbv048
59
Trenkel V. M. Huse G. MacKenzie B. R. Alvarez P. Arrizabalaga H. Castonguay M. et al . (2014). Comparative ecology of widely distributed pelagic fish species in the North Atlantic: Implications for modelling climate and fisheries impacts. Prog. Oceanogr.129, 219–243. doi: 10.1016/j.pocean.2014.04.030
60
Vander Zanden M. J. Clayton M. K. Moody E. K. Solomon C. T. Weidel B. C. (2015). Stable isotope turnover and half-life in animal tissues: A literature synthesis. PloS One10, e0116182. doi: 10.1371/journal.pone.0116182
61
Vandromme P. Nogueira E. Huret M. Lopez-Urrutia A. González-Nuevo G. Sourisseau M. et al . (2014). Spring-time zooplankton size structure over the continental shelf of the Bay of Biscay. Ocean Sci.10, 821–835. doi: 10.5194/os-10-821-2014
62
Viana I. G. Bode A. (2013). Stable nitrogen isotopes in coastal macroalgae: geographic and anthropogenic variability. Sci. Total Environ.443, 887–895. doi: 10.1016/j.scitotenv.2012.11.065
63
Whitehead P. J. P. Bauchot M.-L. Hureau J.-C. Nielsen J. Tortonese E. (1984). Fishes of the north-eastern Atlantic and the Mediterranean Vol. 1 (Paris, France: UNESCO).
64
Xing D. Choi B. Takizawa Y. Fan Y. Sugaya S. Tsuchiya M. et al . (2020). Trophic hierarchy of coastal marine fish communities viewed via compound-specific isotopic analysis of amino acids. Mar. Ecol. Prog. Ser.652, 137–144. doi: 10.3354/meps13475
Summary
Keywords
amino acids, fish, NE Atlantic, plankton, stable isotopes, trophic niche
Citation
Mondéjar N, Viana IG, García-Seoane R, Otero J and Bode A (2026) Trophic niche characterization of zooplankton and planktivorous fish: a comparative approach using stable isotopes in bulk and amino acid samples. Front. Mar. Sci. 12:1718402. doi: 10.3389/fmars.2025.1718402
Received
03 October 2025
Revised
28 November 2025
Accepted
09 December 2025
Published
15 January 2026
Volume
12 - 2025
Edited by
Alberto Basset, University of Salento, Italy
Reviewed by
Kyung-Hoon Shin, Hanyang University, Republic of Korea
Maria Protopapa, Hellenic Centre for Marine Research (HCMR), Greece
Edoardo Calizza, Sapienza University of Rome, Italy
Updates
Copyright
© 2026 Mondéjar, Viana, García-Seoane, Otero and Bode.
This is an open-access article distributed under the terms of the Creative Commons Attribution License (CC BY). The use, distribution or reproduction in other forums is permitted, provided the original author(s) and the copyright owner(s) are credited and that the original publication in this journal is cited, in accordance with accepted academic practice. No use, distribution or reproduction is permitted which does not comply with these terms.
*Correspondence: Nuria Mondéjar, nuria.mondejar@ieo.csic.es
Disclaimer
All claims expressed in this article are solely those of the authors and do not necessarily represent those of their affiliated organizations, or those of the publisher, the editors and the reviewers. Any product that may be evaluated in this article or claim that may be made by its manufacturer is not guaranteed or endorsed by the publisher.