Abstract
Underwater image degradation resulting from light absorption and scattering in water significantly affects the visual perception of autonomous underwater vehicles (AUVs), subsea infrastructure inspections, and marine environmental monitoring. We propose a lightweight enhancement algorithm (UIVE) for underwater images and videos through a lightweight design of residual block replacement BN layer. The innovation of this study is reflected in the dynamic combination of downsampling features and upsampling process through multi-scale jump connection, which effectively retains multi-scale detail information. Replacing the batch normalization (BN) layer strategy with residual blocks effectively reduces computational complexity while maintaining model performance and significantly enhances the effectiveness of feature migration. The adaptive brightness correction module is introduced to compensate for the problem of image brightness reduction after the nonlinear mapping model. Experiments show that UIVE achieves a PSNR value of 18.57 dB and a SSIM value of 0.91 on the UIEB dataset, respectively, and especially demonstrates an obvious advantage in removing bias color. In terms of real-time processing, UIVE achieves a frame rate of 36.23 frames per second (FPS) with a video resolution of 640×480 pixels and can be deployed on embedded systems in AUV or ROV. Experimental results demonstrate that UIVE excels in color correction and detail reproduction, making it particularly well-suited for applications in underwater environments within marine engineering.
1 Introduction
Underwater imaging has emerged as a fundamental technology for the operation and maintenance of marine infrastructure, playing a crucial role in applications such as offshore pipeline inspection, subsea cable installation, ship hull corrosion monitoring, and autonomous underwater vehicle (AUV) navigation (Luo et al., 2024). However, significant attenuation and scattering of light from challenging underwater optical environments results in significant degradation of image quality, which directly affects the reliability of visual data utilized for structural integrity assessment and risk quantification in marine engineering projects (Tian et al., 2024).
When sunlight or other artificial light sources enter a water medium, the selective absorption properties of the water cause significant differences in the attenuation coefficients of various wavelengths of light (Yin et al., 2022). This wavelength-dependent attenuation effect directly contributes to severe color distortion in underwater images, primarily characterized by a blue-green hue (Gao et al., 2023). The presence of suspended particulate matter and dissolved substances in the water column induces significant optical scattering phenomena, resulting in a non-deterministic deflection of the light wave propagation trajectory. This optical phenomenon directly results in underwater images exhibiting typical degradation features, such as contrast attenuation and loss of detail. The challenges posed by these impacts have significantly complicated the development of offshore projects. Consequently, underwater image enhancement technology, a crucial method for improving the quality of underwater visual perception, has emerged as a research hotspot in interdisciplinary fields. Among these approaches, the physical model-driven method focuses on developing a quantitative description of underwater optical transmission. This involves constructing an imaging degradation model and theoretically achieving compensatory correction by analyzing the mechanisms through which the water medium affects light scattering and absorption. Non-physical model-based methods directly manipulate features in the pixel or transform domain to enhance subjective visual quality. Data-driven methods employ machine learning techniques to learn the mapping for image enhancement from relationships within large-scale datasets (Zhuang et al., 2022).
Recently, the scope of underwater vision tasks has expanded significantly beyond conventional enhancement. For instance, WaterCycleDiffusion leverages vision–text fusion to guide semantic-aware underwater image generation (Wang et al., 2026). Histogram-similarity-guided color compensation combined with multi-attribute adjustment has been proposed to achieve more natural chromatic restoration (Wang et al., 2023). Compact graph-based architectures such as S2G-GCN integrate spectral-to-graph modeling and graph convolutional networks for high-frequency sonar waveform representation (HFSWR)-based underwater classification (Li et al., 2025). And joint detection-and-tracking paradigms empowered by reinforcement learning have been explored using compact HFSWR features for autonomous underwater perception (Li et al., 2024). While these advances demonstrate remarkable performance in specialized scenarios, they often involve complex multimodal pipelines, high computational overhead, or reliance on paired training data—making them less suitable for real-time deployment in resource-constrained marine engineering environments.
Aiming to meet the demand for real-time, high-quality visual data monitoring in underwater engineering, this study conducts innovative research on underwater image enhancement algorithms utilizing a data-driven approach. Simultaneously, it integrates the theoretical advantages of physical models to construct a hybrid processing model that compensates for the limitations of a single approach. The design of the hybrid model emphasizes real-time processing requirements, aiming to better satisfy the stringent demands of underwater engineering application scenarios regarding the practicality of the algorithm. Building on this foundation, this paper proposes a lightweight framework for underwater image and video enhancement algorithms. Specifically, the initial feature enhancement is first achieved through an improved convolutional neural network architecture. This is followed by the optimization of intermediate representations using an adaptive luminance correction module, which ultimately produces enhanced images with significantly improved visual quality. The main contributions of this paper can be summarized in the following three aspects:
-
A novel algorithmic framework for underwater image enhancement based on deep learning has been proposed.
-
The model is optimized based on the ESRGAN network architecture by incorporating a residual connection module in place of the traditional batch normalization layer, thereby effectively reducing the computational complexity.
-
Design and implement an adaptive brightness adjustment algorithm module to effectively improve the visual comfort of the enhancement results.
2 Related work
2.1 Physical model-based approach
The physical model-based approach involves constructing mathematical models grounded in the physical principles of underwater optics to enhance and improve underwater images. This is achieved by modeling and simulating the physical processes of light propagation, scattering, and absorption in underwater environments. He et al. based on dark channel a priori (DCP) knowledge in conjunction with the atmospheric scattering model to accurately estimate fog concentration distribution and achieve a high-quality defogging effect. This approach offers an effective solution to the problem of single-image defogging (Single image haze removal using dark channel prior, 2016). A visual quality enhancement framework (UDCP) for underwater images, based on a statistical prior, was proposed by Drews et al. The method quantitatively analyzes color shifts and contrast degradation features by constructing a statistical distribution model specific to underwater environments. It also designs an adaptive correction strategy to achieve effective visual quality enhancement (Drews et al., 2016). Song et al. proposed an improved algorithm for the underwater dark channel prior (NUDCP), which innovatively combines a multi-dimensional physical parameter constraint mechanism. For transmittance map estimation, the team constructed a manually labeled undersea lighting database (MABL) and employed a feature matching strategy to obtain the initial transmittance distribution of the redlight channel. To address the issue of error accumulation in this initial estimation, the team further integrated depth a priori information derived from the Underwater Light Attenuation Physical Model (ULAP), supplemented by the optimized Anti-saturation Correction Module (ARSM), to create a multi-stage joint optimization framework. Finally, through the iterative optimization of the white balance parameters, the spatial adaptive correction of the transmission map for the red light channel was effectively achieved (Song et al., 2020). Zhou et al. proposed a variational model that integrates pixel distribution remapping with multi-prior Retinex (PDRMRV). This model constructs a unified variational framework to decompose an image into illumination and reflectance components, introducing pixel distribution remapping and multiple priors to jointly constrain the optimization process, thereby effectively restoring image color and details while suppressing noise (Zhou et al., 2024). Liu et al. have innovatively developed a systematic image reconstruction framework based on contrast optimization. This scheme employs a quadtree decomposition strategy to achieve adaptive estimation of the underwater light field. It accurately solves the parameter space of the transmittance map, maximizing the contrast of the local region while preserving texture details by constructing a nonlinear optimization objective function (Liu, 2016).
2.2 Non-physical model-based approach
Non-physical model-based methods concentrate on enhancing the visualization of images without depending on a specific underwater optical imaging process. These methods typically improve color, contrast, and brightness by adjusting pixel values, making the images more discernible to the human eye and more amenable to machine analysis. Inspired by the Retinex framework, Fu et al. constructed a variational optimization model to achieve a structured separation of the reflection component and the illumination component of a single underwater image. This framework enhances both reflectance and illumination through various strategies to address issues such as underexposure and blurring, ultimately producing a final enhanced image by combining the improved reflectance and illumination. The enhancement process is further refined through color correction, brightening of dark areas, preservation of naturalness, and enhancement of edges and details (Fu et al., 2014). Zhang et al. proposed an enhancement method known as LAB-MSR, which combines bilateral and trilateral filtering techniques. This model effectively integrates color space characterization with a mechanism for preserving local structures. The core of the method is the development of an adaptive weight assignment strategy based on the physical-optical properties of the Lab component of the CIELAB color space. This approach enables the characterization of different color channels through spectral response modeling and effectively mitigates issues related to color dispersion and contrast attenuation in underwater images (Zhang et al., 2017). Ancuti et al. developed a multiscale fusion strategy to enhance various underwater images with high accuracy by integrating color compensation and white balance versions from two degraded images along with their associated weight maps (Prasad et al., 2020). Fu et al. proposed an efficient color restoration algorithm based on segmented linear transformations, aimed at correcting the non-uniform color shift problem in underwater imaging. They further designed an innovative contrast enhancement framework that optimizes light intensity distribution through nonlinear mapping. This framework effectively suppresses the generation of artifacts and achieves both information enhancement and visual quality improvement in low-contrast regions (Fu et al., 2017).
2.3 Data-driven approach
Data-driven approaches have garnered increasing attention in recent years. These methods are particularly significant in underwater image enhancement, as they leverage extensive datasets of underwater images to learn and develop models that improve visual quality. Typically, this enhancement is achieved through the use of convolutional neural networks, adversarial neural networks, and transfer learning techniques. Liu et al. proposed a lightweight, scalable network composed of a color compensation layer (CCL), a packet color compensation encoder, and a channel fusion decoder (GCCF) (Liu et al., 2024). The core mechanism of Water-Net, a gated fusion network architecture, involves the dynamic integration of confidence distributions predicted by the residual module. Simultaneously, it utilizes a multi-scale feature fusion unit to intelligently reconstruct the input features, thereby enhancing the visual quality of underwater degraded images (Li et al., 2019). Li et al. propose the UColor multimodal color correction network, marking the first instance of cooperative modeling across RGB, HSV, and Lab color spaces. The architecture innovatively integrates complementary features from these color spaces into an end-to-end trainable framework, effectively decoupling the issues of color shift and contrast degradation. However, the high computational complexity resulting from the joint modeling of multi-space features restricts its potential application in real-time scenarios (Li et al., 2021). To address the issue of limited training data for underwater images, researchers have investigated data enhancement techniques based on Generative Adversarial Networks (GANs). Liu et al. innovatively combined deep residual networks with CycleGAN to propose a self-supervised underwater image synthesis framework. This framework generates high-quality synthesized training data to mitigate the shortage of real data through unsupervised learning. Additionally, to enhance the model’s feature extraction capabilities, the study incorporates a super-resolution reconstruction model (VDSR) into the enhancement process. Experiments demonstrate that this multitasking strategy significantly improves color reproduction accuracy and refines the microstructure of the images (Liu et al., 2021). Liu et al., inspired by the ability of twin reflections to retain more informative features of an image, proposed an underwater enhancement method based on object-guided twin-adversarial contrast learning. This approach simplifies the requirement for pairwise data in an unsupervised manner (Liu et al., 2022). Peng et al. pioneered the introduction of the Transformer architecture in the field of underwater image enhancement UIE and developed the first end-to-end U-shaped Transformer processing framework (Peng and Zhu, 2023).
3 Proposed model
This section begins with an overview of the structure of the proposed UIVE model, followed by a detailed description of the residual block, the network layers, the loss function, and the luminance-adjusted post-processing module.
3.1 Model architecture
Figure 1 systematically illustrates the overall network architecture of the UIVE model proposed in this study. The UIVE model employs a lightweight design and consists primarily of two core components: the main network layer and the adaptive brightness adjustment post-processing module. The UIVE model is built upon an enhanced U-shaped network structure, which incorporates the classical jump connection mechanism (Ronneberger and Fischer, 2017). The main network utilizes an encoder-decoder architecture. During the encoding stage, the input image is initially processed by a convolutional layer, followed by feature extraction through three successive downsampling modules. In the decoding phase, the encoded features are progressively restored to their original spatial resolution through three corresponding upsampling modules. To facilitate cross-layer connectivity, the outputs from the first and second downsampling stages of the encoder are jump-connected to the corresponding stages of the decoder, while the initial convolutional result is fused with the third upsampled output. In the post-processing stage, an adaptive brightness adjustment module is employed to enhance the visual experience.
Figure 1
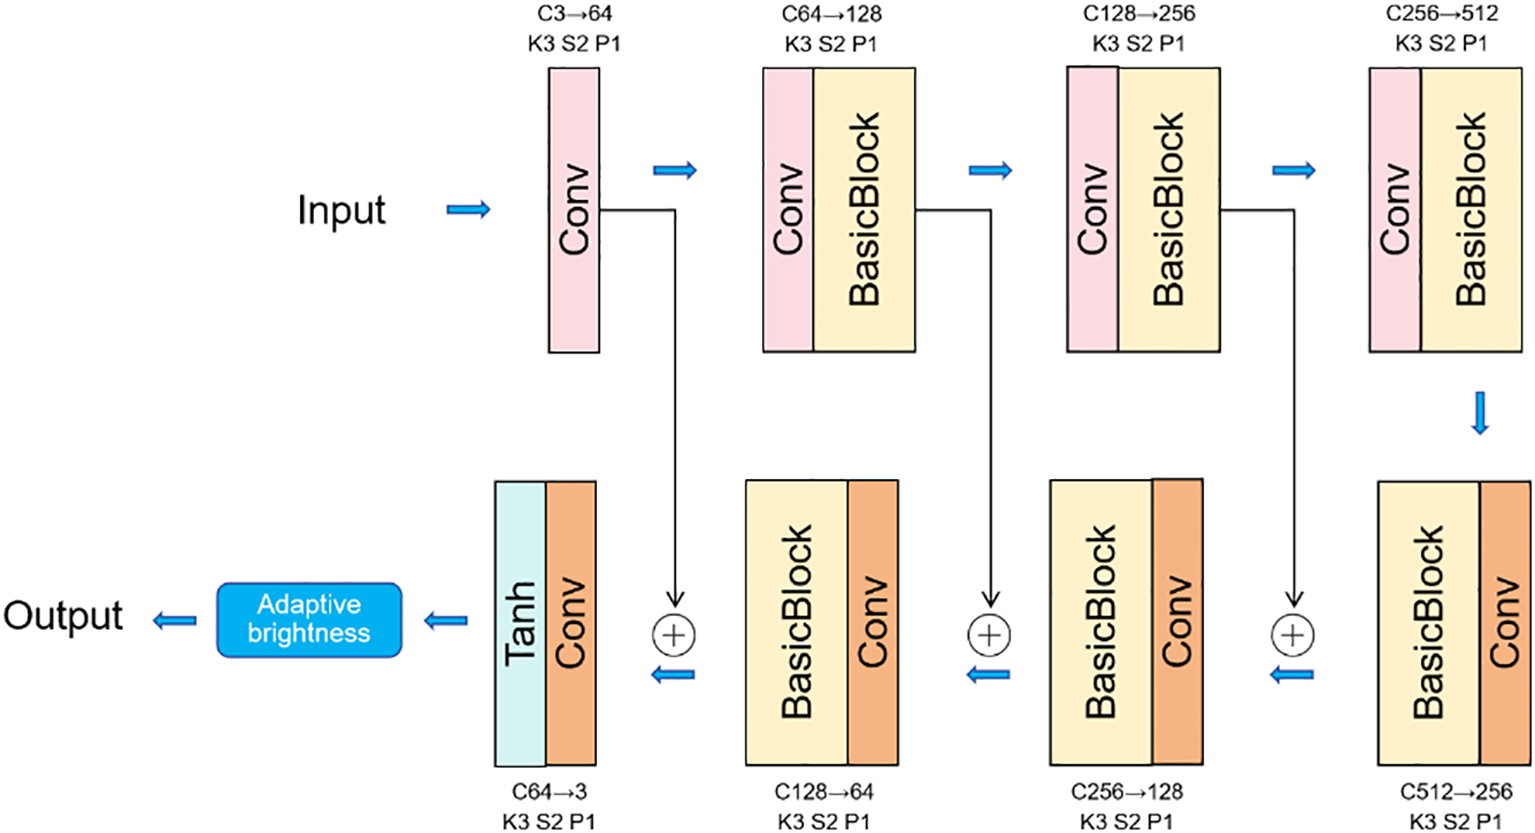
Flowchart of the proposed method.
3.1.1 Residual blocks
Inspired by the Residual-in-Residual Dense Block (RRDB) (Wang et al., 2018), this model features an enhanced residual structure, as illustrated in Figure 2. Its core components include jump connections comprising two sets of convolutional layers (kernel size = 3×3, stride = 1, padding = 1) stacked with Leaky ReLU activation functions. A notable aspect of our model is the replacement of BN layers with residual blocks, which enhances both training efficiency and overall performance. The innovative removal of the BN layer, which typically introduces additional computational overhead and increases parameter size, aligns with our goal of maintaining a lightweight design. Furthermore, this approach helps to mitigate the risk of artificial artifacts that may arise when there is a significant statistical disparity between the training and test sets. The residual connections effectively address the vanishing gradient problem and accelerate model convergence, among other design considerations. Experimental results demonstrate that this design can more sensitively capture subtle feature changes and significantly enhance the model’s generalization ability in complex underwater environments.
Figure 2
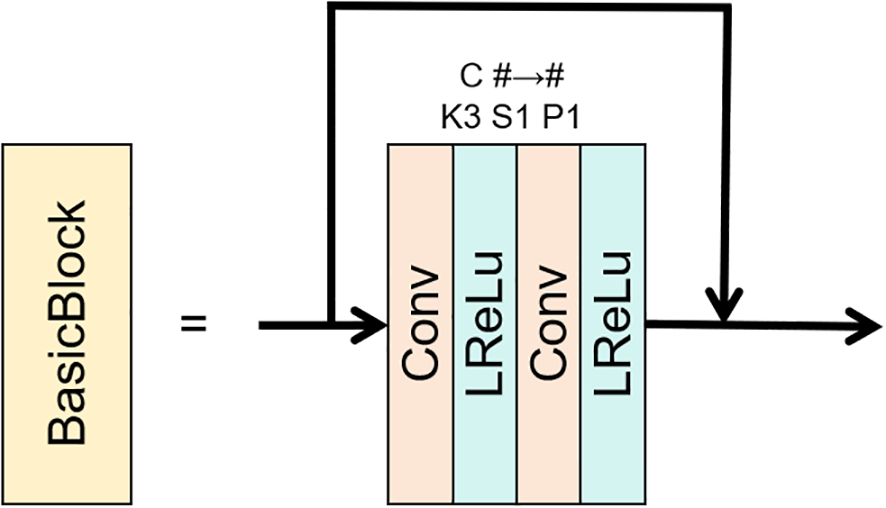
Residual block structure.
3.1.2 Network layer
According to the model structure diagram presented, the network architecture in this study comprises multiple convolutional layers and activation function layers arranged in a systematic order. Different colored modules in the figure distinguish the fundamental processing units, which consist of convolution operations and activation functions. The initial convolutional layer employs a convolutional kernel of 3 × 3, with a stride of 2 and a padding size of 1. The input image is expanded from 3 RGB channels to 64 feature channels. In the downsampling stage, there are three levels, each utilizing a 3×3 convolution kernel with a stride of 2 and a padding of 1. The first level increases the number of channels from 64 to 128, the second level expands the channels from 128 to 256, and the third level further increases the channels from 256 to 512. A residual block is connected after downsampling at each level to facilitate feature refinement. In the upsampling stage, there are three levels, each implemented using transposed convolution. The convolution kernel for each stage’s convolution layer is 3×3, with a stride of 2 and a padding of 1. The first stage reduces the number of channels from 512 to 256, the second stage reduces it from 256 to 128, and the third stage reduces it from 128 to 64 channels. Identical residual blocks are connected for feature optimization after upsampling at each stage. In the output processing stage, a transposed convolutional layer is employed at the end, utilizing a 3×3 convolution kernel, a stride of 2, and a padding of 1, followed by the application of the Tanh activation function. This design constructs a comprehensive encoding-decoding process through systematic transformations of channel dimensions and adjustments of spatial resolution, in which the cascading use of residual blocks significantly enhances feature transfer and fusion capabilities.
3.2 Network losses
The UIVE model proposed in this study utilizes a dual-loss supervision mechanism that significantly enhances the perceptual quality of the results. This is achieved by jointly optimizing the l2 loss and the Structural Similarity Index (SSIM) loss function, while maintaining reconstruction accuracy at the pixel level (Zhao et al., 2016). The l2 loss function establishes a pixel-level reconstruction error metric by calculating the Euclidean distance between the enhanced image U and the true reference image I. Its mathematical expression is defined as follows (Equation 1):
where H and W denote the height and width of the image, respectively, and (m, n) represents the spatial coordinates of the pixels. This loss function effectively constrains the low-level visual features of the image. To preserve maintain the textural and structural features of the enhanced image, we introduce the SSIM metrics based on grayscale images. For each pixel x, the SSIM value is computed within its 13 × 13 local neighborhood as defined in Equation 2:
where and denote local regional means, and denote local variances, denotes the covariance, , are stability constants.
The final optimization objective is a weighted combination of the two components, and the final loss L can be expressed as follows (Equation 3):
where the weighting coefficients ω1 and ω2 were experimentally determined to be 0.4 for ω1 and 0.6 for ω2.
3.3 Post-processing
In our model, we extensively utilize upsampling, downsampling, and skip connections, along with data normalization to enhance the model’s stability. We observe a significant decay in luminance in the output image following deep neural network processing. In practical engineering applications, achieving higher clarity and more vibrant colors is essential. To address this issue, we introduce adaptive brightness adjustment, considering that we are developing a lightweight network, rather than employing complex color space transformations. We implement a common adaptive luminance enhancement method based on statistical properties, which achieves dynamic range adjustment through luminance pre-evaluation and robust luminance statistics, followed by adaptive contrast stretching via normalization operations. This approach effectively resolves the luminance decay issue in the model while maintaining computational efficiency. Comprehensive experimental results are presented in Section 4.5.
4 Experimentation
This study employed a rigorous experimental protocol to validate the proposed methods. In this section, the experimental configuration includes standard dataset partitioning, detailed training parameter settings, and a comprehensive comparison with six representative methods: three traditional methods—MLLE (Zhang et al., 2022), PCDE (Zhang et al., 2023), EUICCCLF (Hu et al., 2024), and PDRMRV (Zhou et al., 2024), and three deep learning-based methods—UIESS (Chen, 2022), FUnIE-GAN (Islam and Xia, 2020), and UWCNN (Li and Anwar, 2020). The evaluation process employs a combination of qualitative analysis and quantitative measurements, while the contribution of each module is verified through ablation experiments. This study further validates the proposed method from two perspectives: model complexity analysis and practical scenario testing. The empirical results demonstrate that the method effectively balances the utilization of computational resources with the actual execution outcomes of tasks. Additionally, it offers an optimization scheme that holds significant practical value for underwater image processing tasks.
4.1 Implementation details
In the model training phase, we employed the following standard configuration: the input image was randomly cropped to obtain a local patch of 128×128 pixels and normalized to a range of [0, 1]. The Adam optimizer was employed for model training, utilizing momentum parameters β1 = 0.5 and β2 = 0.999. A fixed learning rate of 1 × 10⁻⁴ was maintained throughout the training process, and the batch size was set to 8. All experiments were conducted using the PyTorch framework, with the hardware platform consisting of an NVIDIA GeForce RTX 4070 Ti graphics card and an Intel Core i9-14900KF processor.
4.1.1 Data sets
The UIEB dataset comprises 950 images of authentic underwater scenes, including 890 reference images with expert annotations, while the remaining 60 images serve as a challenge dataset (Li et al., 2019). The RUIE dataset features a diverse array of marine life samples that encompass a wide range of typical underwater scenarios (Liu et al., 2020). The EUVP dataset consists of 3,700 real underwater images captured using seven different types of underwater cameras, representing a broad spectrum of ocean exploration scenarios (Islam and Xia, 2020). The SUID dataset is a large-scale synthetic underwater image collection containing 900 images, each exhibiting various degradation types and turbidity levels (Hou et al., 2020).
The diversity and representativeness of the training dataset are ensured to provide a richer variety of dataset compositions and a more balanced distribution of different types. Our training set comprises 90% of the UIEB dataset, supplemented by 1,000 randomly selected reference images from the EUVP dataset, along with the complete SUID dataset.
For the test set, we select the remaining 10% of the UIEB dataset that includes reference images, along with 200 images from the RUIE dataset, 200 self-constructed real underwater images, and 300 images from the EUVP dataset, ensuring that none overlap with the training set. The 200 self-constructed real underwater images are referred to as O200. This data division guarantees the diversity of the training data and the representativeness of the test data.
4.1.2 Assessment of indicators
In this study, a comprehensive image quality assessment index system is employed to objectively evaluate the enhancement results. For datasets containing reference images, both full-reference and non-reference evaluation indices are utilized. These include the Peak Signal-to-Noise Ratio (PSNR), Structural Similarity Index (SSIM), Underwater Color Image Quality Evaluation (UCIQE) (Yang, 2015), Underwater Image Quality Measure (UIQM) (Panetta and Gao, 2015), Natural Image Quality Evaluator (NIQE) (Mittal and Soundararajan, 2013), Patch-based Contrast Quality Index (PCQI) (Wang et al., 2015), and Ranking-based Underwater Image Quality Assessor(URanker) (Guo et al., 2022). For datasets lacking reference images, non-reference evaluation metrics are selected, which consist of information entropy, UCIQE, UIQM, NIQE, and PCQI. In order to comprehensively validate model performance, this study utilizes the EUVP dataset as an experimental benchmark to systematically evaluate algorithm performance. The focus is specifically on core metrics, including model parameter sizes, floating point operations (FLOPs), and inference time.
The evaluation system in this study employs multi-dimensional quantitative indicators. The PSNR and the SSIM characterize the degree of agreement between the enhanced image and the reference image in terms of pixel-level fidelity and structural similarity, respectively. The information entropy index objectively reflects the richness of the visual information contained in the image. Additionally, the quality assessment score of the underwater color image comprehensively evaluates the image across three key dimensions: color reproduction, the effectiveness of contrast enhancement, and the optimization of saturation quality. An increase in underwater image quality measurements implies that the image quality aligns more closely with human visual perception characteristics. Conversely, lower NIQE scores indicate images with better visual quality. Higher PCQI values, on the other hand, directly reflect the degree of improvement in image contrast characteristics.
4.2 Comparative analysis of UIEB datasets
Figures 3 –5 illustrate the comparative results of various enhancement methods applied to the UIEB benchmark dataset. The experimental results indicate that traditional methods such as MLLE, PCDE, EUICCCLF and PDRMRV effectively correct color deviations in regions with rich content; however, they generate new color distortions in background areas devoid of content. The deep learning method UIESS exhibits significant red color oversaturation, while FUnIE-GAN continues to experience yellow-green hue distortion, and the overall performance of UWCNN is subpar. In contrast, the UIVE demonstrates strong performance in color correction and brightness enhancement, effectively addressing the issue of color bias. As shown in Table 1, the quantitative assessment results clearly demonstrate that the UIVE methodology significantly outperforms existing comparative methodologies in the core evaluation metrics of PSNR, SSIM, and underwater image quality measure. This fully substantiates the method’s superior performance in preserving image texture details and content features.
Figure 3
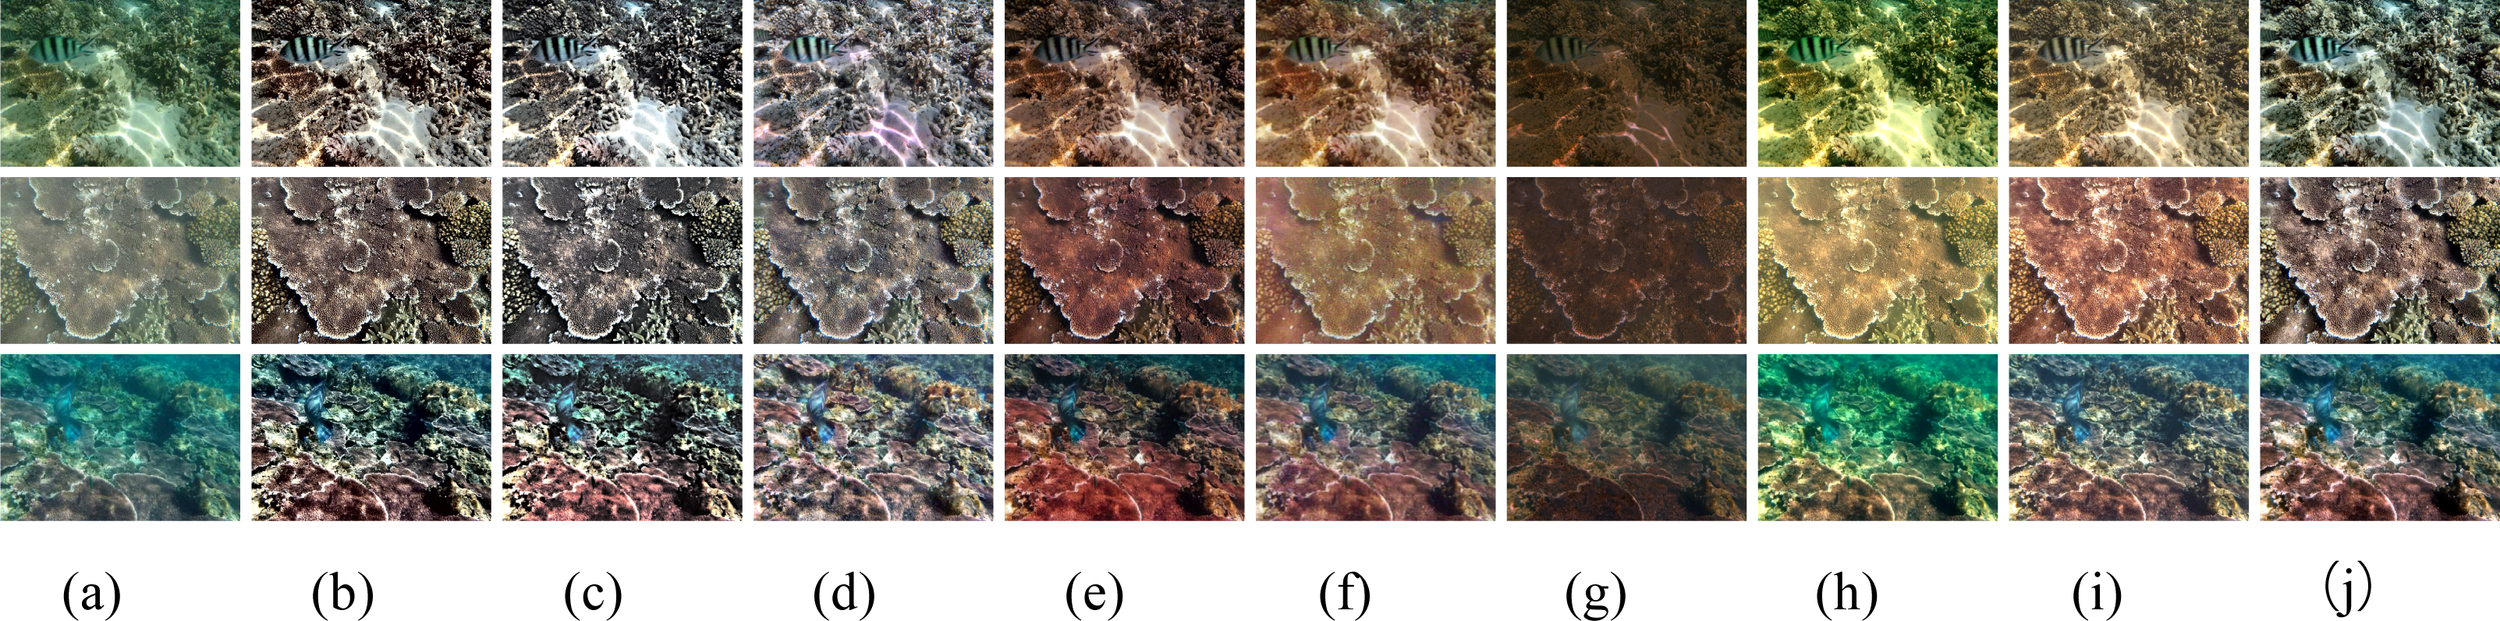
Qualitative comparisons in the UIEB dataset—light color tones. From (a) to (j), the images are as follows: (a) raw underwater image, (b) MLLE, (c) PCDE, (d) EUICCCLF, (e) UIESS, (f) FUnIE-GAN, (g) UWCNN, (h) PDRMRV, (i) proposed UIVE, and (j) reference image.
Figure 4
Qualitative comparison in the UIEB dataset - green tone. From (a) to (j), the images are as follows: (a) raw underwater image, (b) MLLE, (c) PCDE, (d) EUICCCLF, (e) UIESS, (f) FUnIE-GAN, (g) UWCNN, (h) PDRMRV, (i) proposed UIVE, and (j) reference image.
Figure 5
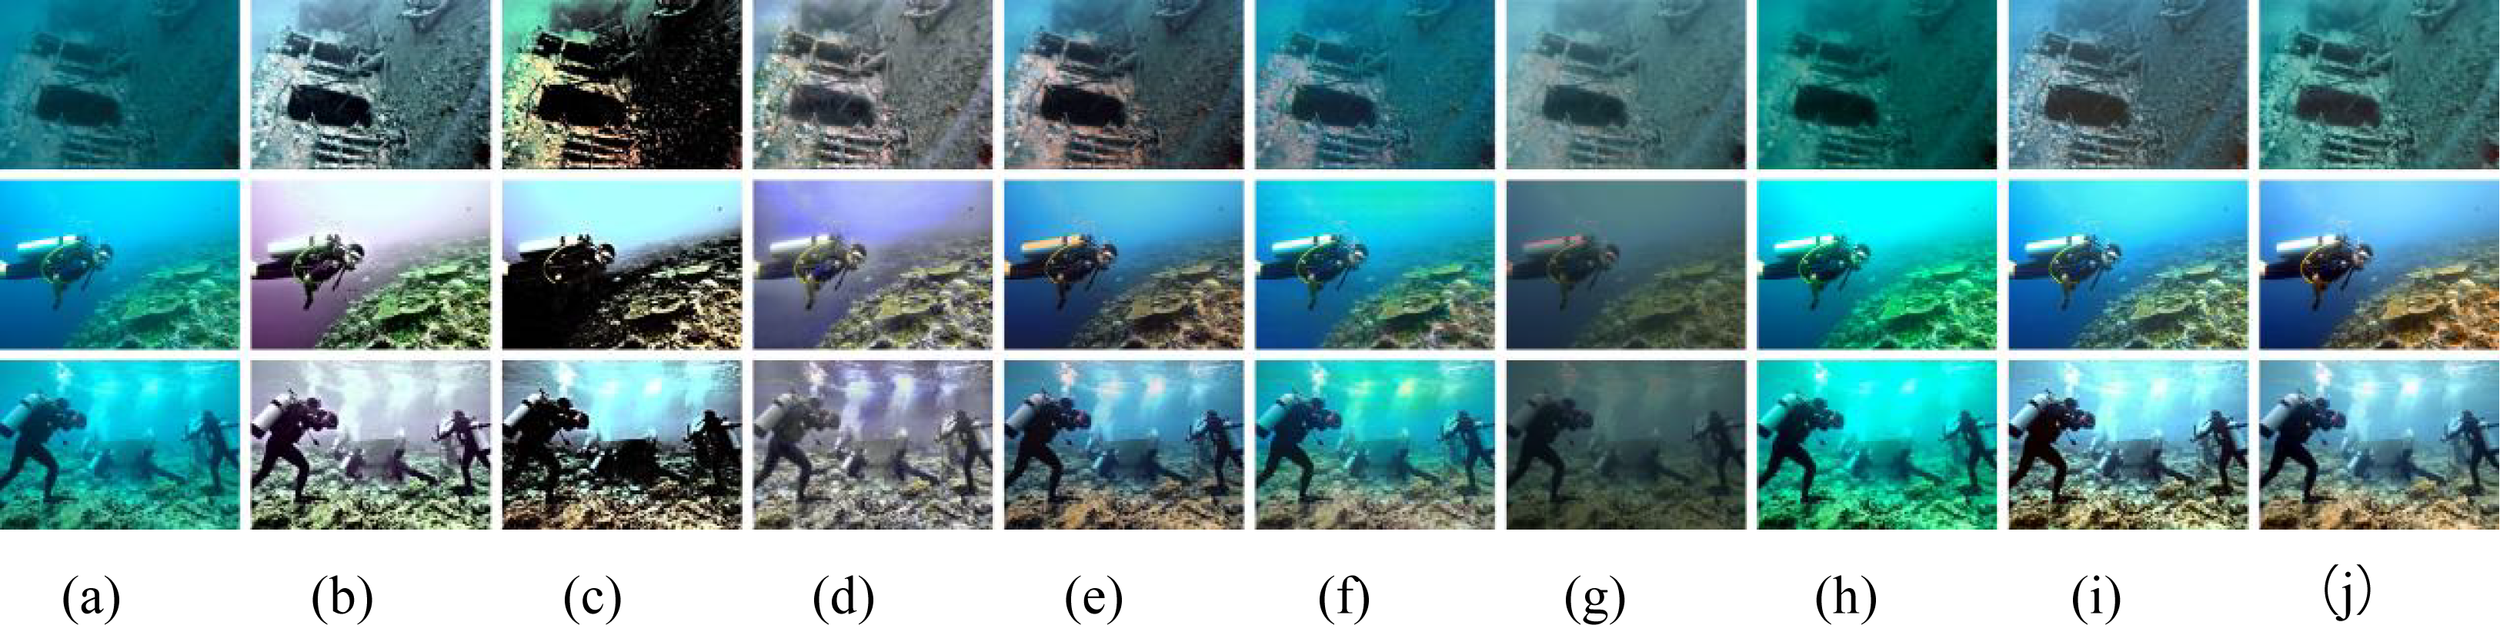
Qualitative comparison in the UIEB dataset - blue tint. The images from (a) to (j) include: (a) a raw underwater image, (b) MLLE, (c) PCDE, (d) EUICCCLF, (e) UIESS, (f) FUnIE-GAN, (g) UWCNN, (h) PDRMRV, (i) proposed UIVE, and (j) reference image.
Table 1
| Methods | PSNR↑ | SSIM↑ | Entropy↑ | NIQE↓ | UIQM↑ | UCIQE↑ | PCQI↑ | URanker↑ |
|---|---|---|---|---|---|---|---|---|
| MLLE | 17.86 | 0.83 | 7.55 | 14.04 | 0.69 | 0.93 | 1.21 | 0.94 |
| PCDE | 15.79 | 0.78 | 7.29 | 12.18 | 0.77 | 0.90 | 1.12 | 0.84 |
| EUICCCLF | 17.52 | 0.91 | 7.35 | 14.60 | 0.64 | 0.70 | 1.08 | 0.82 |
| PDRMRV | 9.66 | 0.21 | 7.29 | 20.69 | 0.42 | 0.42 | 0.98 | 0.73 |
| UIESS | 18.51 | 0.86 | 7.26 | 17.05 | 0.60 | 0.73 | 0.90 | 0.64 |
| FUnIE-GAN | 18.03 | 0.87 | 7.09 | 42.59 | 0.58 | 0.84 | 0.93 | 0.58 |
| UWCNN | 13.44 | 0.76 | 6.38 | 14.48 | 0.37 | 0.91 | 0.71 | 0.46 |
| Ours | 18.57 | 0.91 | 7.22 | 12.82 | 0.79 | 0.86 | 1.18 | 0.78 |
Quantitative comparisons on the UIEB dataset are presented, with red values indicating the best results and green values representing the second-best results.
The symbol '↑' indicates that the higher the value of the indicator, the better. The symbol '↓'indicates that the lower the value of the indicator, the better.
The yellow highlights indicate new experimental results added in response to the reviewers’ comments for additional comparative analysis.
4.3 Comparative analysis of the RUIE dataset
In this study, the RUIE dataset is utilized as an independent test set to assess the generalization capability of the model, which was not included in the model training process. As illustrated in Figures 6, 7, with the exception of the FUnIE-GAN and UWCNN methods, the other comparison methods demonstrate varying degrees of color bias correction ability, each exhibiting distinct deficiencies: the PCDE method reveals significant color distortion; the EUICCCLF method introduces a slight red bias in the green-tone region, accompanied by blurred details; the PDRMRV method suffers from detail loss and color oversaturation in certain scenarios; the UIESS method shows an overall brown-yellow tone shift; and the PDRMRV method suffers from detail loss and color oversaturation in certain scenarios. In contrast, the UIVE exhibits outstanding performance in color correction, brightness enhancement, and contrast enhancement, although there is still potential for improvement in the defogging effect. The quantitative evaluation results presented in Table 2 indicate that UIVE achieves optimal outcomes across all objective evaluation metrics, thereby substantiating its comprehensive performance advantage in cross-dataset testing.
Figure 6
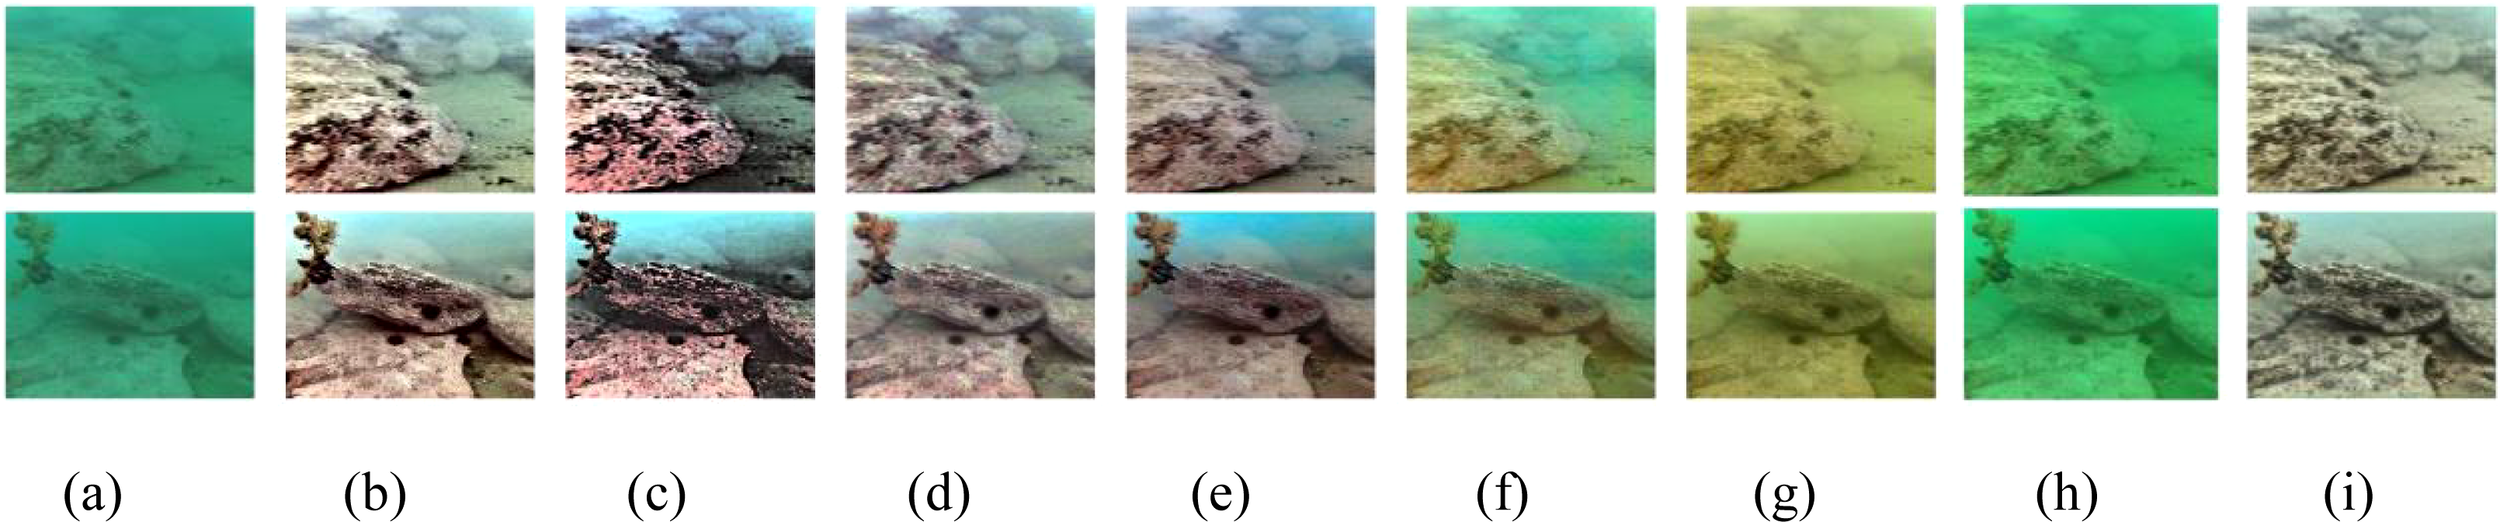
Qualitative comparison in the RUIE dataset - green tone. The images from (a) to (i) include: (a) raw underwater image, (b) MLLE, (c) PCDE, (d) EUICCCLF, (e) UIESS, (f) FUnIE-GAN, (g) UWCNN, (h) PDRMRV, and (i) the proposed UIVE, respectively.
Figure 7
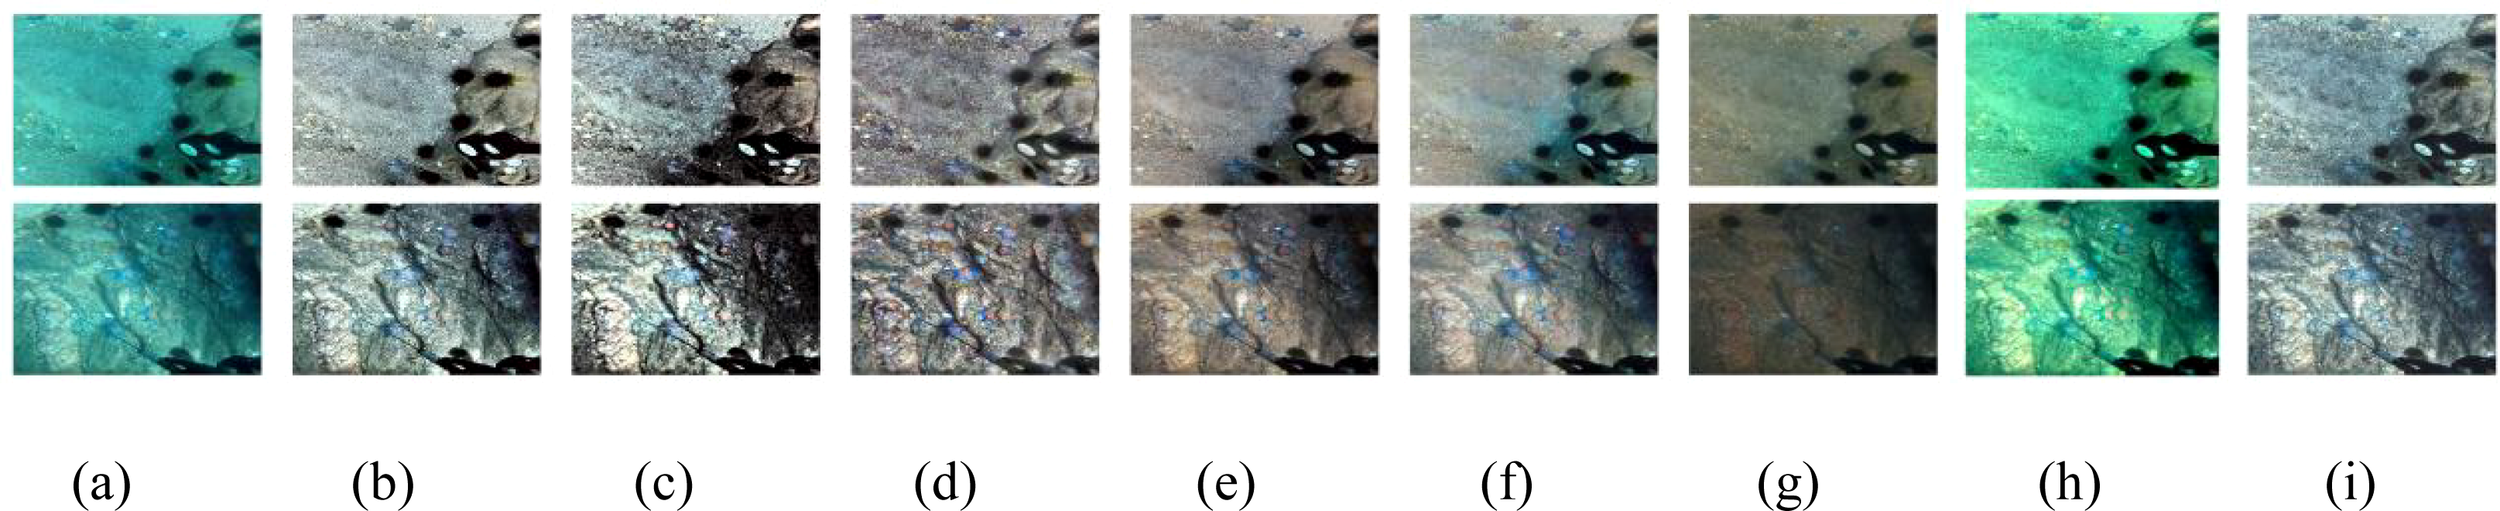
Qualitative comparison in the RUIE dataset - blue tone. The images from (a) to (i) include: (a) raw underwater image, (b) MLLE, (c) PCDE, (d) EUICCCLF, (e) UIESS, (f) FUnIE-GAN, (g) UWCNN, (h) PDRMRV, and (i) the proposed UIVE, respectively.
Table 2
| Methods | Entropy↑ | NIQE↓ | UIQM↑ | UCIQE↑ | PCQI↑ |
|---|---|---|---|---|---|
| MLLE | 7.68 | 20.74 | 0.71 | 0.60 | 1.08 |
| PCDE | 7.70 | 20.91 | 0.44 | 0.61 | 0.95 |
| EUICCCLF | 7.31 | 25.81 | 0.79 | 0.62 | 1.27 |
| PDRMRV | 6.96 | 23.74 | 0.52 | 0.40 | 1.04 |
| UIESS | 7.23 | 24.19 | 0.64 | 0.82 | 1.05 |
| FUnIE-GAN | 6.98 | 52.69 | 0.39 | 0.60 | 0.82 |
| UWCNN | 6.69 | 21.71 | 0.30 | 0.58 | 0.92 |
| Ours | 7.40 | 20.36 | 0.82 | 0.67 | 1.16 |
Quantitative comparisons of the RUIE dataset, with red values indicating the best results and green values representing the second-best results.
The symbol '↑' indicates that the higher the value of the indicator, the better. The symbol '↓'indicates that the lower the value of the indicator, the better.
The yellow highlights indicate new experimental results added in response to the reviewers’ comments for additional comparative analysis.
4.4 Comparative analysis of the O200 dataset
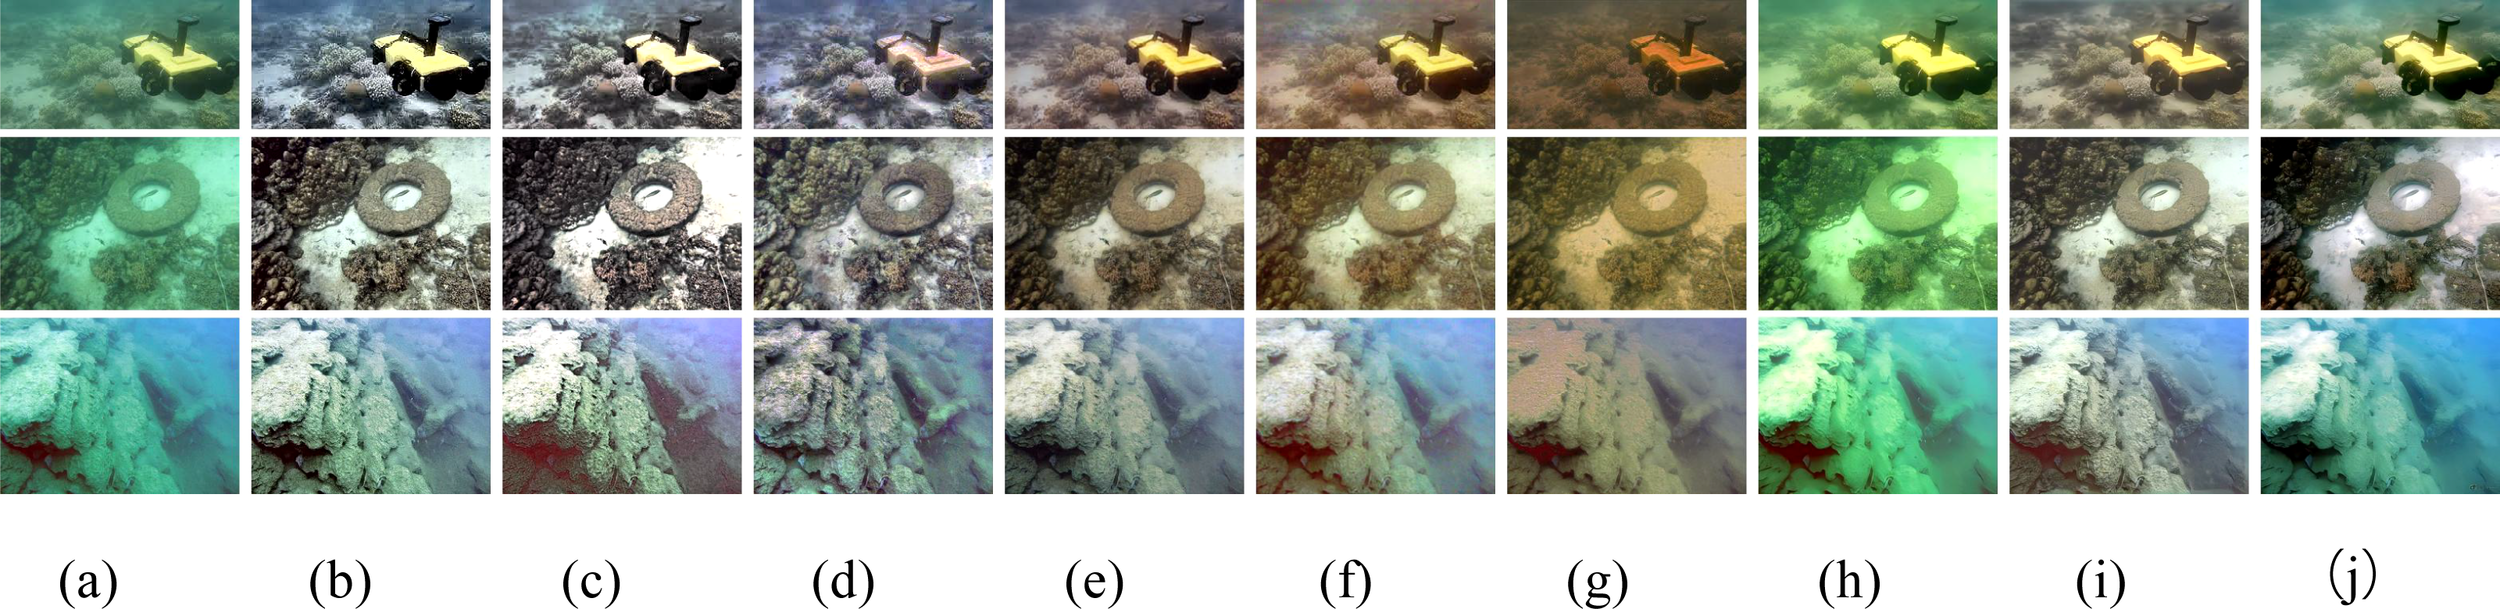
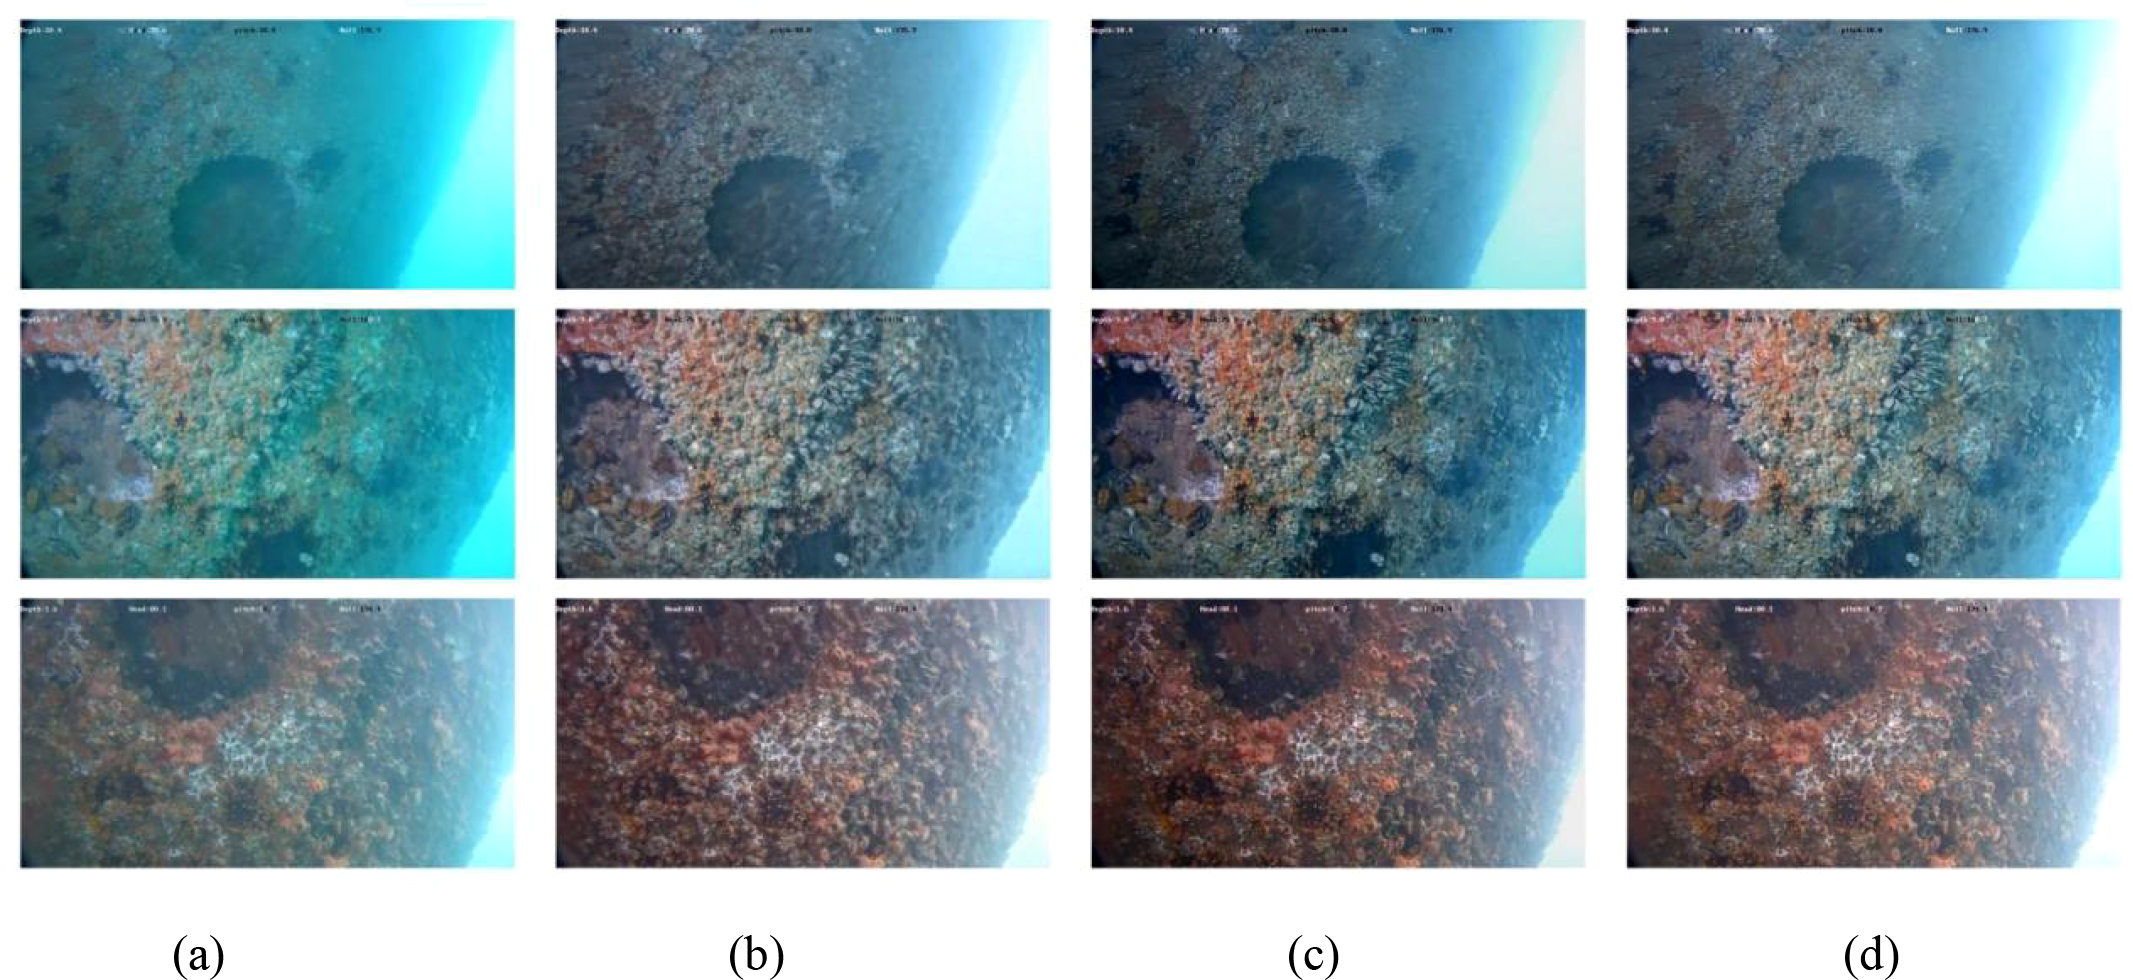
A systematic evaluation was conducted on extreme underwater images acquired using ROV equipment, as illustrated in Figure 8. These images suffer from both severe color bias and motion blur. The experimental results indicate that the MLLE, PCDE, EUICCCLF, UIESS, and PDRMRV methods all demonstrate effective color-bias correction capabilities; however, each method has notable shortcomings. The MLLE method results in overexposure in white areas, leading to a loss of detail and the introduction of fogging effects. The UIESS method exacerbates the fogging issue, while the PCDE method produces color distortion and black artifacts. The EUICCCLF method exhibits local color distortion. Additionally, the PDRMRV method shows limited enhancement capability in such extreme conditions, with insufficient color correction and noticeable detail loss. In contrast, the FUnIE-GAN and UWCNN methods perform poorly regarding visual enhancement effects. Although the UIVE method proposed in this paper does not completely eliminate color bias and exhibits slight texture non-smoothness, it effectively enhances contrast, maintains the vividness of image colors, and preserves subtle color gradient changes. The quantitative evaluation results presented in Table 3 indicate that the PCDE method performs optimally in certain metrics, while the UIVE method does not achieve the best results but still demonstrates stable enhancement performance, thereby confirming the method’s applicability in extreme underwater environments.
Figure 8
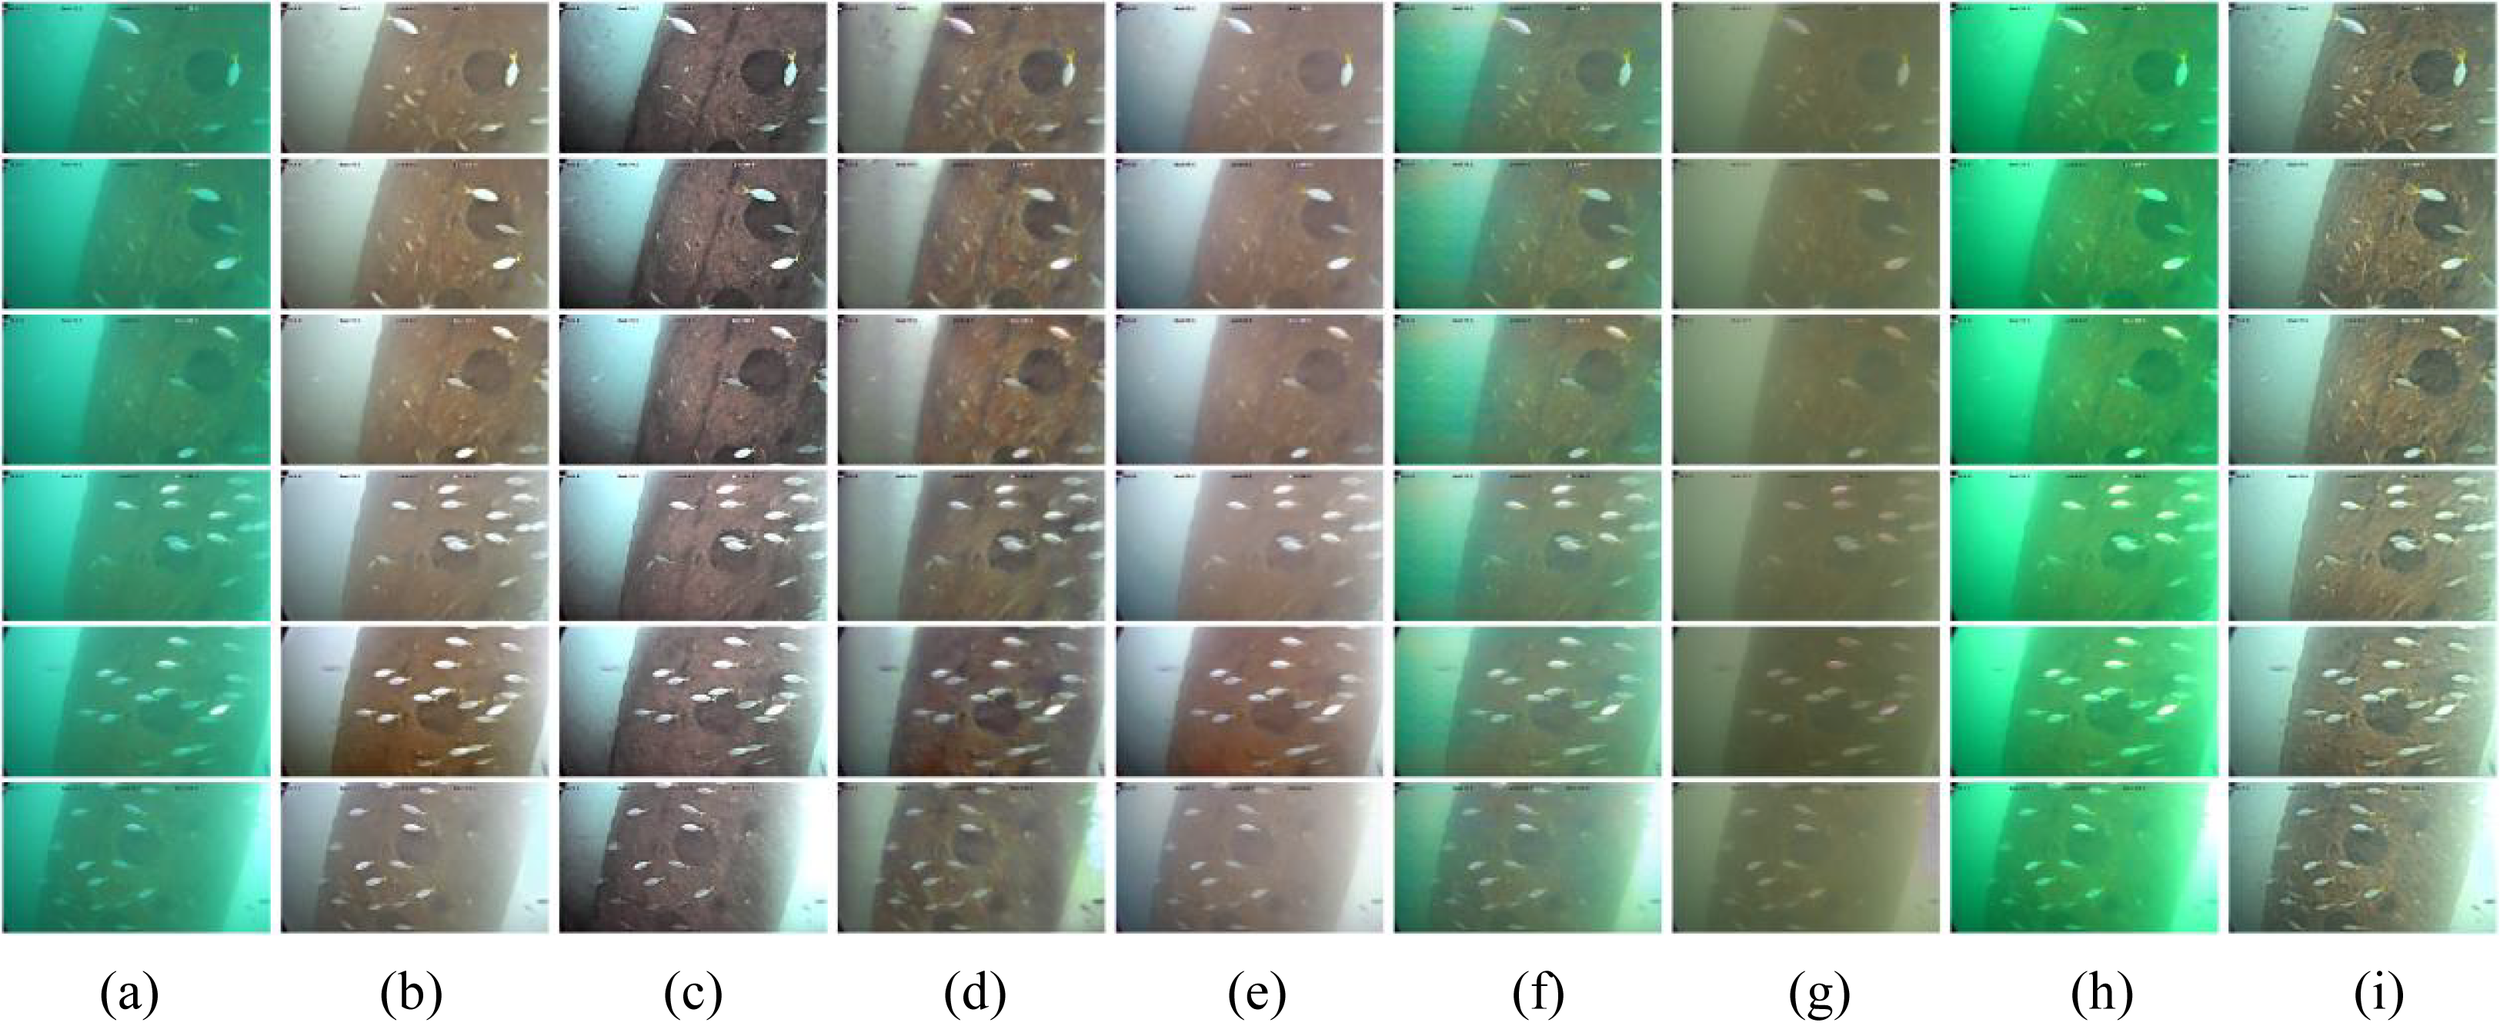
Qualitative comparison of our acquired underwater images. The images from (a) to (i) include: (a) raw underwater image, (b) MLLE, (c) PCDE, (d) EUICCCLF, (e) UIESS, (f) FUnIE-GAN, (g) UWCNN, (h) PDRMRV, and (i) the proposed UIVE, respectively.
Table 3
| Methods | Entropy↑ | NIQE↓ | UIQM↑ | UCIQE↑ | PCQI↑ |
|---|---|---|---|---|---|
| MLLE | 7.23 | 13.04 | 0.43 | 0.64 | 0.90 |
| PCDE | 7.40 | 13.71 | 0.48 | 0.79 | 0.91 |
| EUICCCLF | 6.85 | 14.27 | 0.46 | 0.65 | 0.96 |
| PDRMRV | 6.73 | 13.22 | 0.24 | 0.38 | 0.89 |
| UIESS | 7.11 | 13.61 | 0.36 | 0.69 | 0.86 |
| FUnIE-GAN | 6.92 | 13.94 | 0.27 | 0.56 | 0.81 |
| UWCNN | 6.26 | 11.04 | 0.31 | 0.54 | 0.90 |
| Ours | 7.25 | 13.65 | 0.35 | 0.60 | 0.93 |
Quantitative comparisons on our captured images, with red values indicating the best results and green values representing the second-best results.
The symbol '↑' indicates that the higher the value of the indicator, the better. The symbol '↓' indicates that the lower the value of the indicator, the better.
The yellow highlights indicate new experimental results added in response to the reviewers’ comments for additional comparative analysis.
4.5 Ablation analysis
In order to systematically validate the contribution of each core module of the UIVE framework, this study designed ablation experiments to analyze the performance of three model variants by comparing their results. A simplified version without residual blocks (w/o RB), a version without the adaptive brightness adjustment module (w/o Ab), and the complete UIVE architecture. The test samples were selected from actual underwater image datasets and included representative samples with varying degrees of color bias. The experimental results indicate that the model missing residual blocks produces noticeable black grid-like artifacts in the output image, highlighting the crucial role of residual connectivity in preserving the integrity of feature information. Additionally, the overall brightness of the output image from the model lacking the adaptive brightness adjustment module is significantly reduced, resulting in poor visual quality. Quantitative evaluation data (Table 4) and visual comparison results (Figures 9, 10) consistently demonstrate that the full version of the UIVE model achieves optimal performance across all tested metrics. Notably, in the key metric of luminance mean, the adaptive luminance adjustment module shows a significant enhancement, experimentally validating the rationale and necessity of the module’s design.
Table 4
| Methods | Luminance Mean | Entropy↑ | NIQE↓ | UIQM↑ | UCIQE↑ |
|---|---|---|---|---|---|
| raw | 121.27 | 6.86 | 15.70 | 0.29 | 0.51 |
| w/o RB | 118.27 | 6.97 | 15.83 | 0.44 | 0.60 |
| w/o Ab | 109.45 | 7.05 | 15.46 | 0.42 | 0.49 |
| UIVE | 122.88 | 7.18 | 15.35 | 0.47 | 0.62 |
An ablation study of our proposed method is presented.
The red values indicate the best results, while the green values represent the second-best results.
The symbol '↑' indicates that the higher the value of the indicator, the better. The symbol '↓' indicates that the lower the value of the indicator, the better.
Figure 9
Comparative results of the ablation study. (a) Raw underwater image (b) w/o RB (c) w/o Ab (d) UIVE.
Figure 10
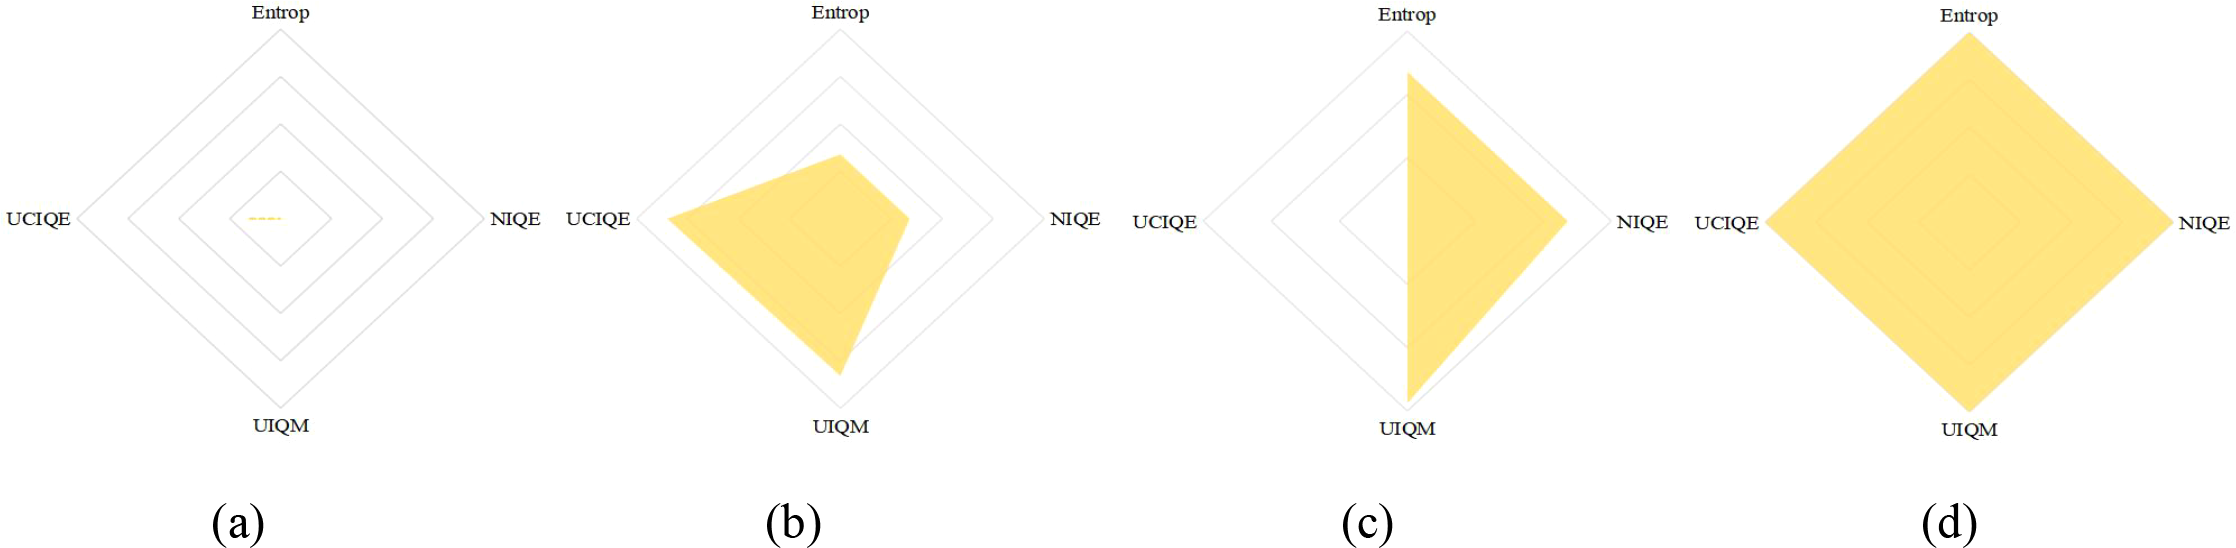
Normalized quantitative assessment of each version using the Entropy, NIQE, UIQM, and UCIQE metrics. (a) Raw underwater image (b) w/o RB (c) w/o Ab (d) UIVE.
4.6 Complexity analysis
In this study, performance evaluation was conducted using 500 images with a resolution of 256×256 pixels from an independent test set within the EUVP dataset, which is entirely separate from the 1,000 images utilized for training. The experimental platform is equipped with an Intel Core i7-13620H processor and an NVIDIA GeForce RTX 4060 graphics card. The results of the qualitative evaluation are shown in Figure 11, which shows that UIVE has a good enhancement effect. The results of the qualitative evaluation are shown in Figure 11, which shows that UIVE has a good enhancement effect. Table 5 presents the detailed performance test results, with the runtime metric indicating the average computational time required for the algorithm to process a single image frame. The experimental results demonstrate that UIVE offers significant advantages across three key performance metrics: the number of model parameters, computational complexity (FLOPs), and inference speed. It is noteworthy that UIVE achieves well-balanced performance in both conventional metrics and the URanker evaluation, underscoring its robustness in perceptual quality assessment. Com pared to other deep learning methods, UIVE achieves faster processing speeds while utilizing fewer parameters and less computational load, thereby underscoring the practical value of this method in real-time processing applications. Notably, it is important to mention that although deep learning-based methods benefit from GPU acceleration and exhibit higher operational efficiency, their model training cycles tend to be relatively long, a phenomenon confirmed by the comparison experiments. The results of the standardized quantitative evaluation, illustrated in Figure 12, further validate the combined advantages of the proposed methodology. The findings indicate that the methodology demonstrates a distinct upper-left distribution characteristic within the two-dimensional evaluation space. This feature intuitively indicates that the proposed method achieves a more streamlined model structure and enhanced computational performance while maintaining excellent image quality. It is worth mentioning that while the physics-based method PDRMRV shows competitive performance in certain full-reference metrics like PSNR and SSIM, its computational efficiency remains a limitation compared to our approach.
Figure 11
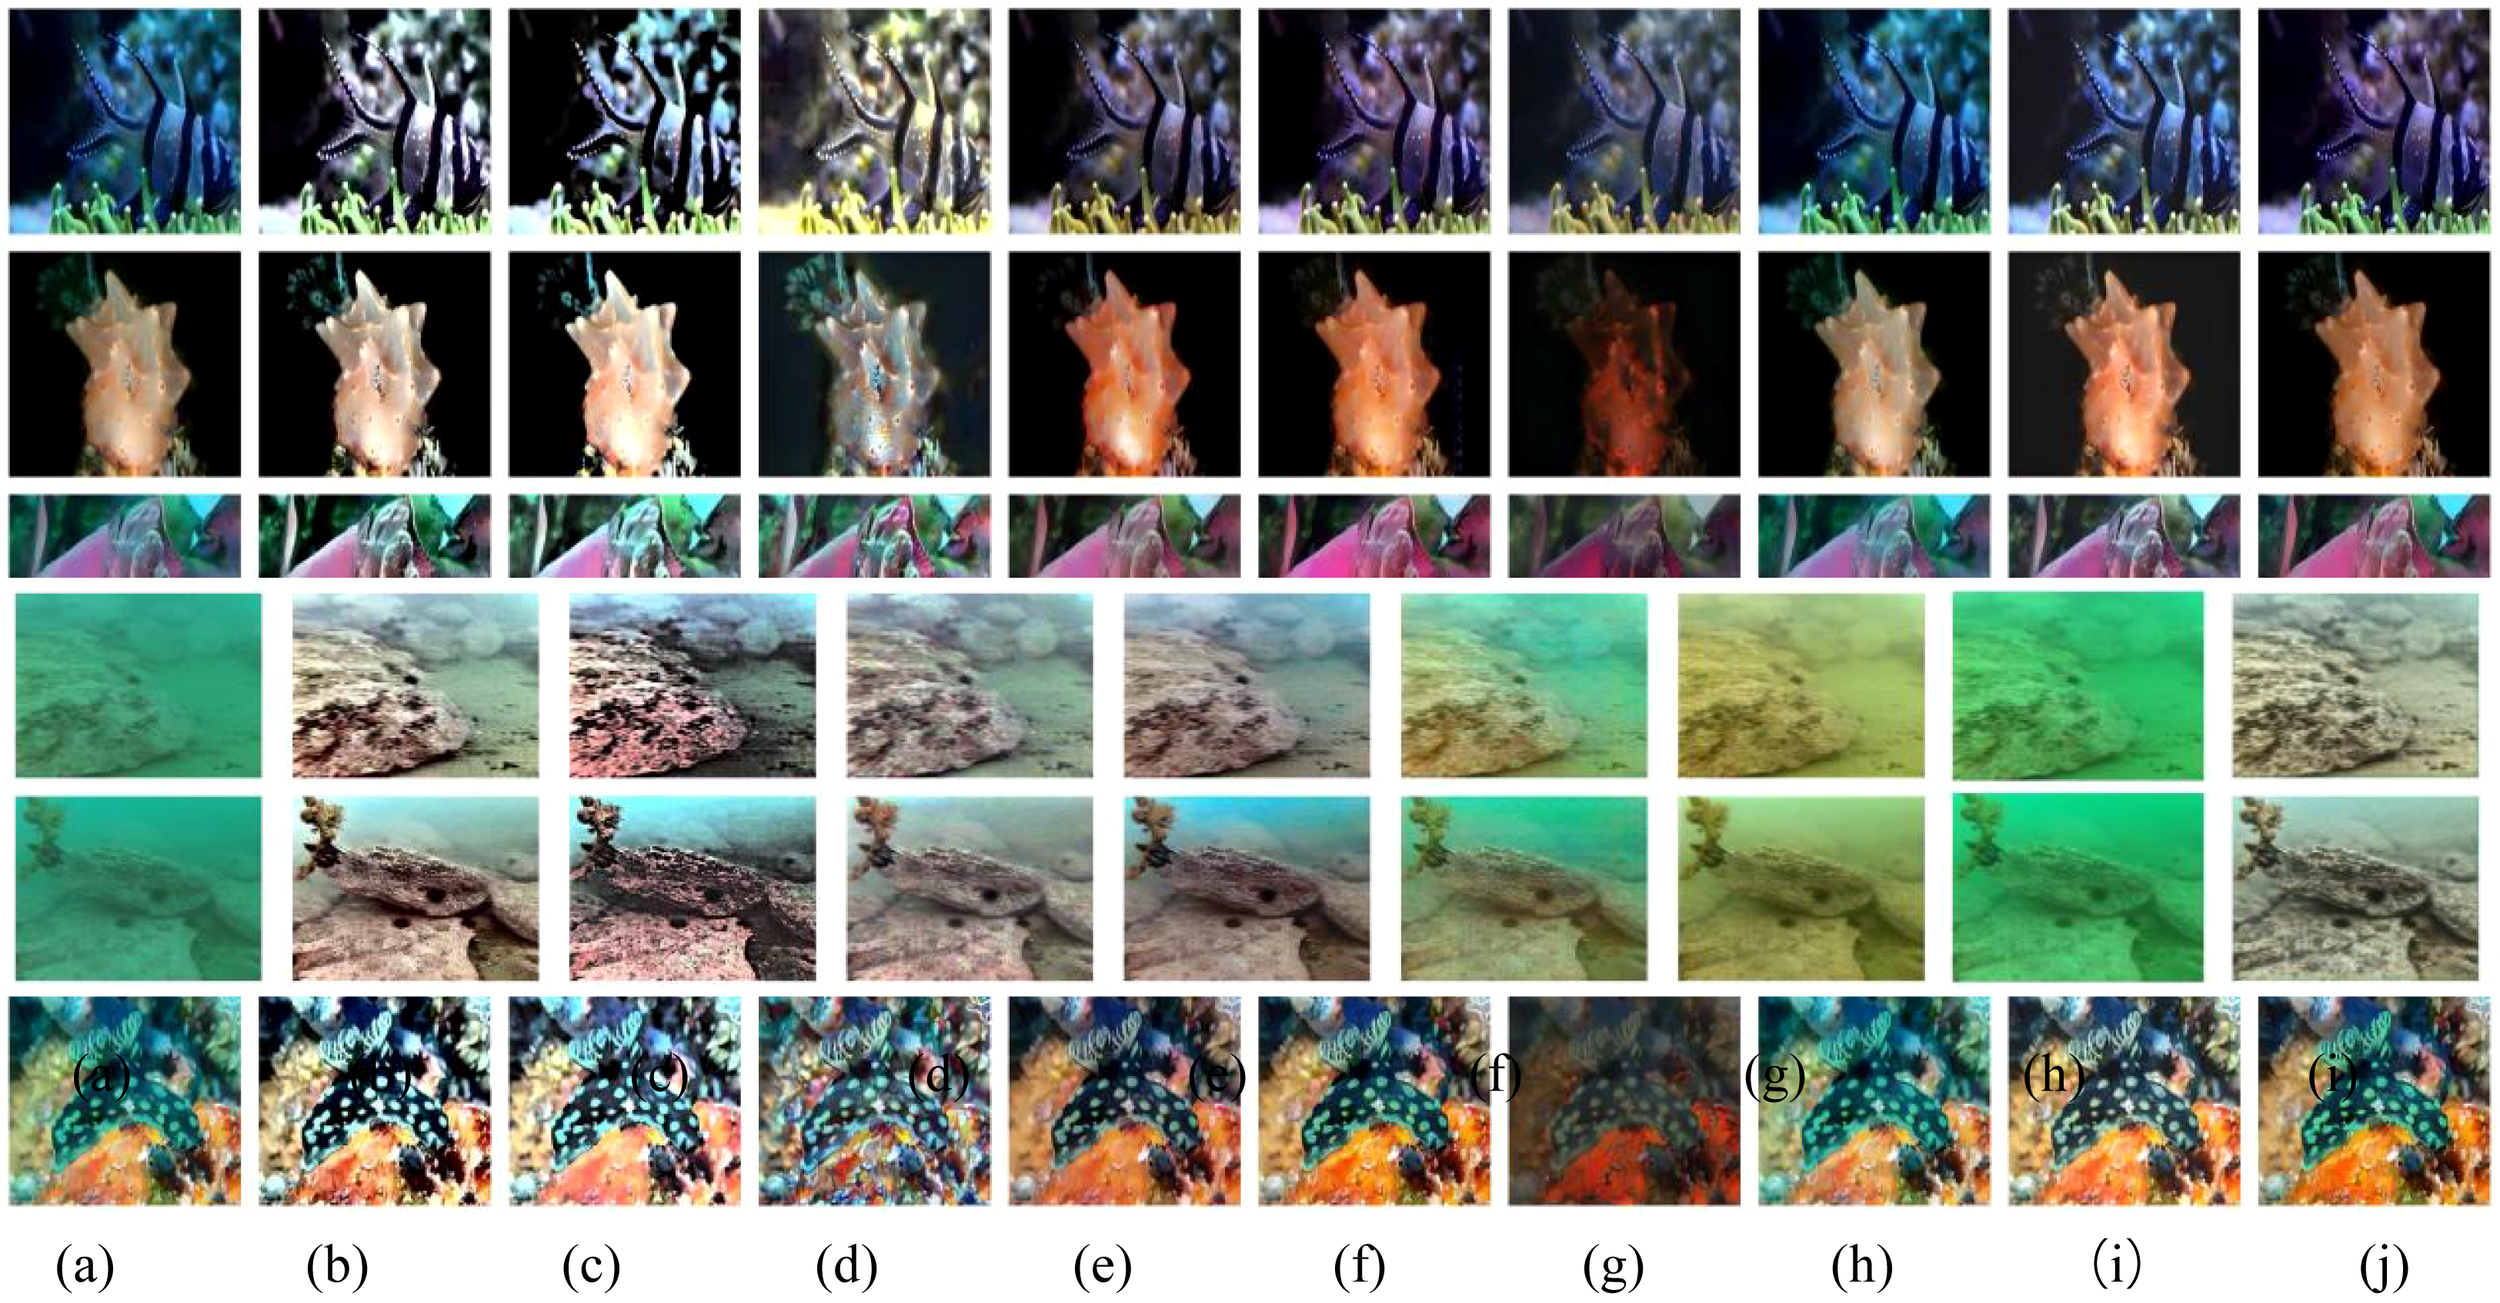
Qualitative comparison in EUVP. The images from (a) to (j) include: (a) a raw underwater image, (b) MLLE, (c) PCDE, (d) EUICCCLF, (e) UIESS, (f) FUnIE-GAN, (g) UWCNN, (h) PDRMRV, (i) the proposed UIVE, and (j) a reference image, respectively.
Table 5
| Methods | Size | Para. | FLOPs | Time↓ | Entropy↑ | NIQE↓ | UIQM↑ | UCIQE↑ | PCQI↑ | PSNR↑ | SSIM↑ | URanker↑ |
|---|---|---|---|---|---|---|---|---|---|---|---|---|
| MLLE | 256 | - | - | 0.05 | 7.56 | 47.15 | 0.83 | 1.75 | 1.16 | 15.16 | 0.73 | 0.86 |
| PCDE | 256 | - | - | 0.14 | 7.32 | 41.24 | 0.97 | 1.72 | 1.06 | 14.39 | 0.65 | 0.77 |
| EUICCCLF | 256 | - | - | 0.02 | 7.44 | 63.45 | 0.81 | 0.73 | 1.12 | 15.17 | 0.75 | 0.66 |
| PDRMRV | 256 | - | - | 0.32 | 7.03 | 49.97 | 0.41 | 0.50 | 0.98 | 22.23 | 0.87 | 0.59 |
| UIESS | 256 | 4.26M | 26.35G | 0.006 | 7.47 | 51.27 | 0.76 | 0.76 | 1.05 | 20.63 | 0.87 | 0.62 |
| FUnIE-GAN | 256 | 7.02M | 20.48G | 0.002 | 7.32 | 51.06 | 0.72 | 1.37 | 0.96 | 23.40 | 0.83 | 0.69 |
| UWCNN | 256 | 0.04M | 2.61G | 0.02 | 6.83 | 51.09 | 0.54 | 0.98 | 0.75 | 17.57 | 0.79 | 0.47 |
| Ours | 256 | 0.08M | 1.35G | 0.004 | 7.42 | 50.65 | 0.93 | 2.47 | 1.09 | 20.78 | 0.85 | 0.63 |
Model performance evaluation. Red values indicate the best results and green values indicate the second-best results.
The symbol '↑' indicates that the higher the value of the indicator, the better. The symbol '↓' indicates that the lower the value of the indicator, the better.
The yellow highlights indicate new experimental results added in response to the reviewers’ comments for additional comparative analysis.
Figure 12
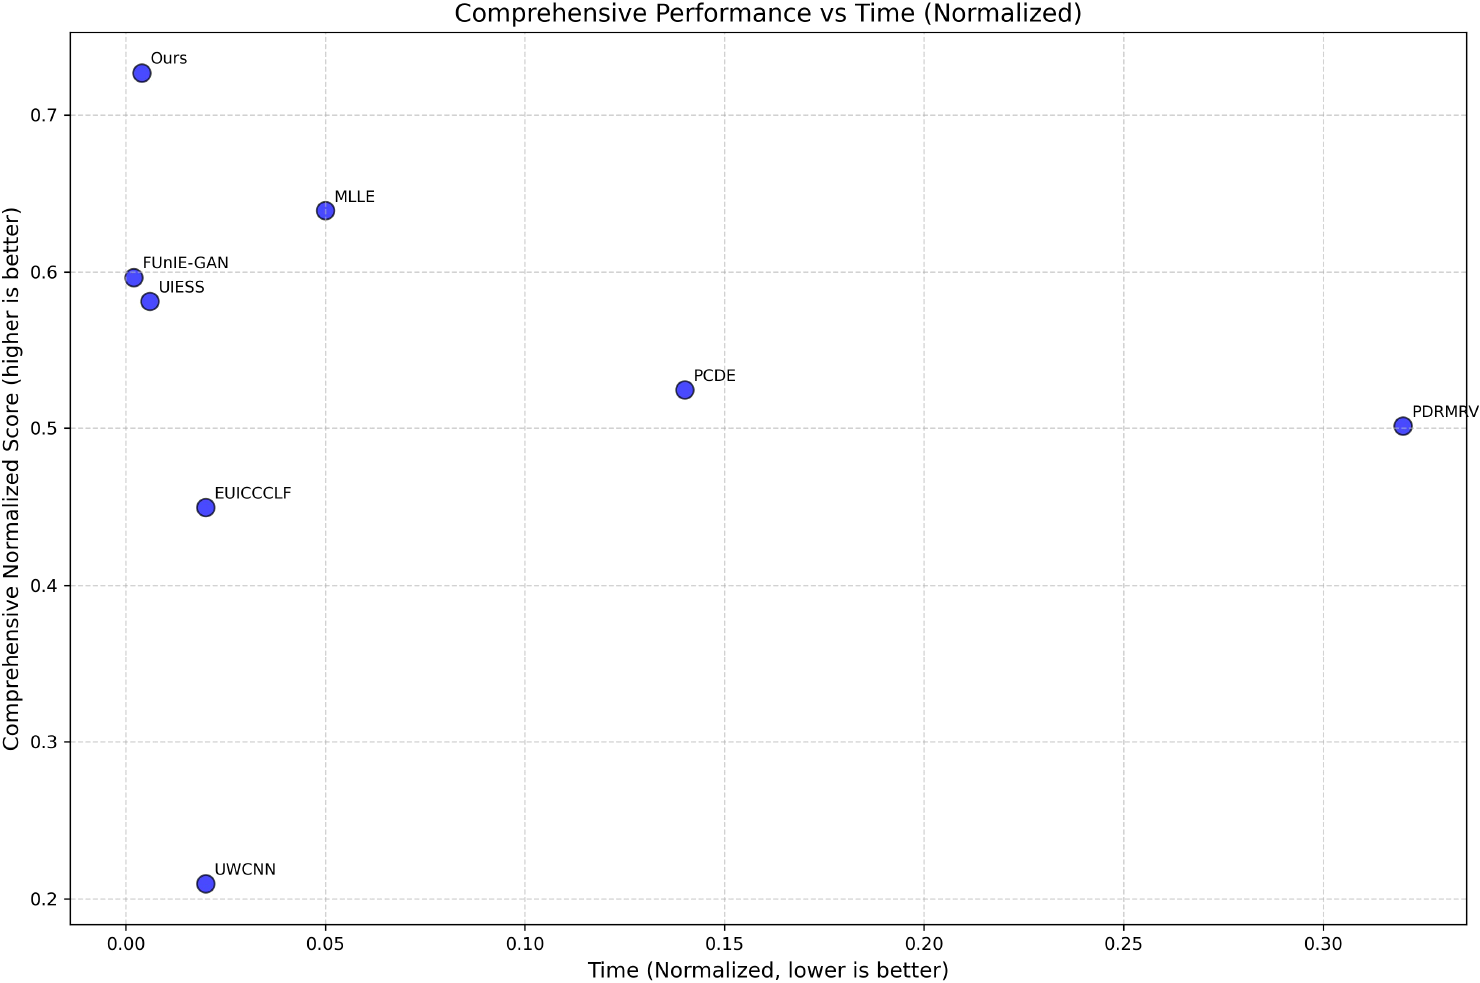
Standardized quantitative assessment. The x-axis represents the average running time, while the y-axis represents the weighted sum of the six-assessment metrics: Entropy, NIQE, UIQM, UCIQE, PCQI, URanker, PSNR, and SSIM.
4.7 Application testing
In order to comprehensively evaluate the practical application value of the enhancement algorithm, this study quantitatively analyzes the processing results from three dimensions: edge feature extraction, corner point detection, and feature point matching. Additionally, video tests are performed on the model to verify its lightweight nature. Figures 13–15 present the results of various test programs applied to two images using different testing methods.
Figure 13
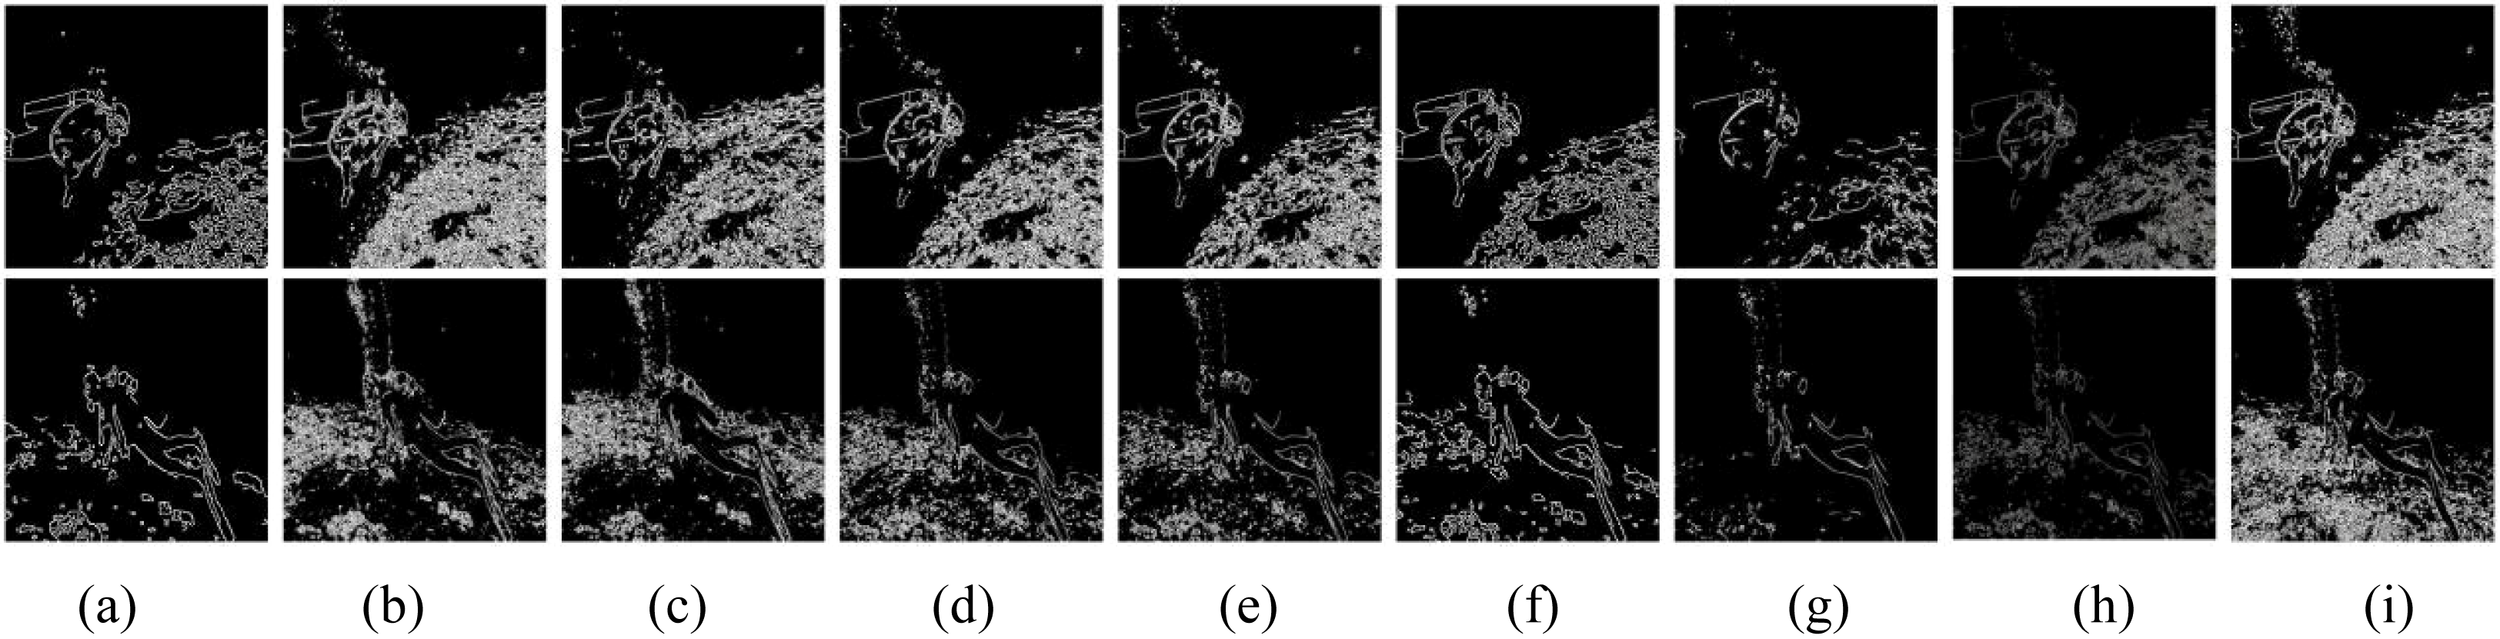
Subjective comparison of edge detection. The images from (a) to (i) include: (a) raw underwater image, (b) MLLE, (c) PCDE, (d) EUICCCLF, (e) UIESS, (f) FUnIE-GAN, (g) UWCNN, (h) PDRMRV, and (i) the proposed UIVE, respectively.
Figure 14
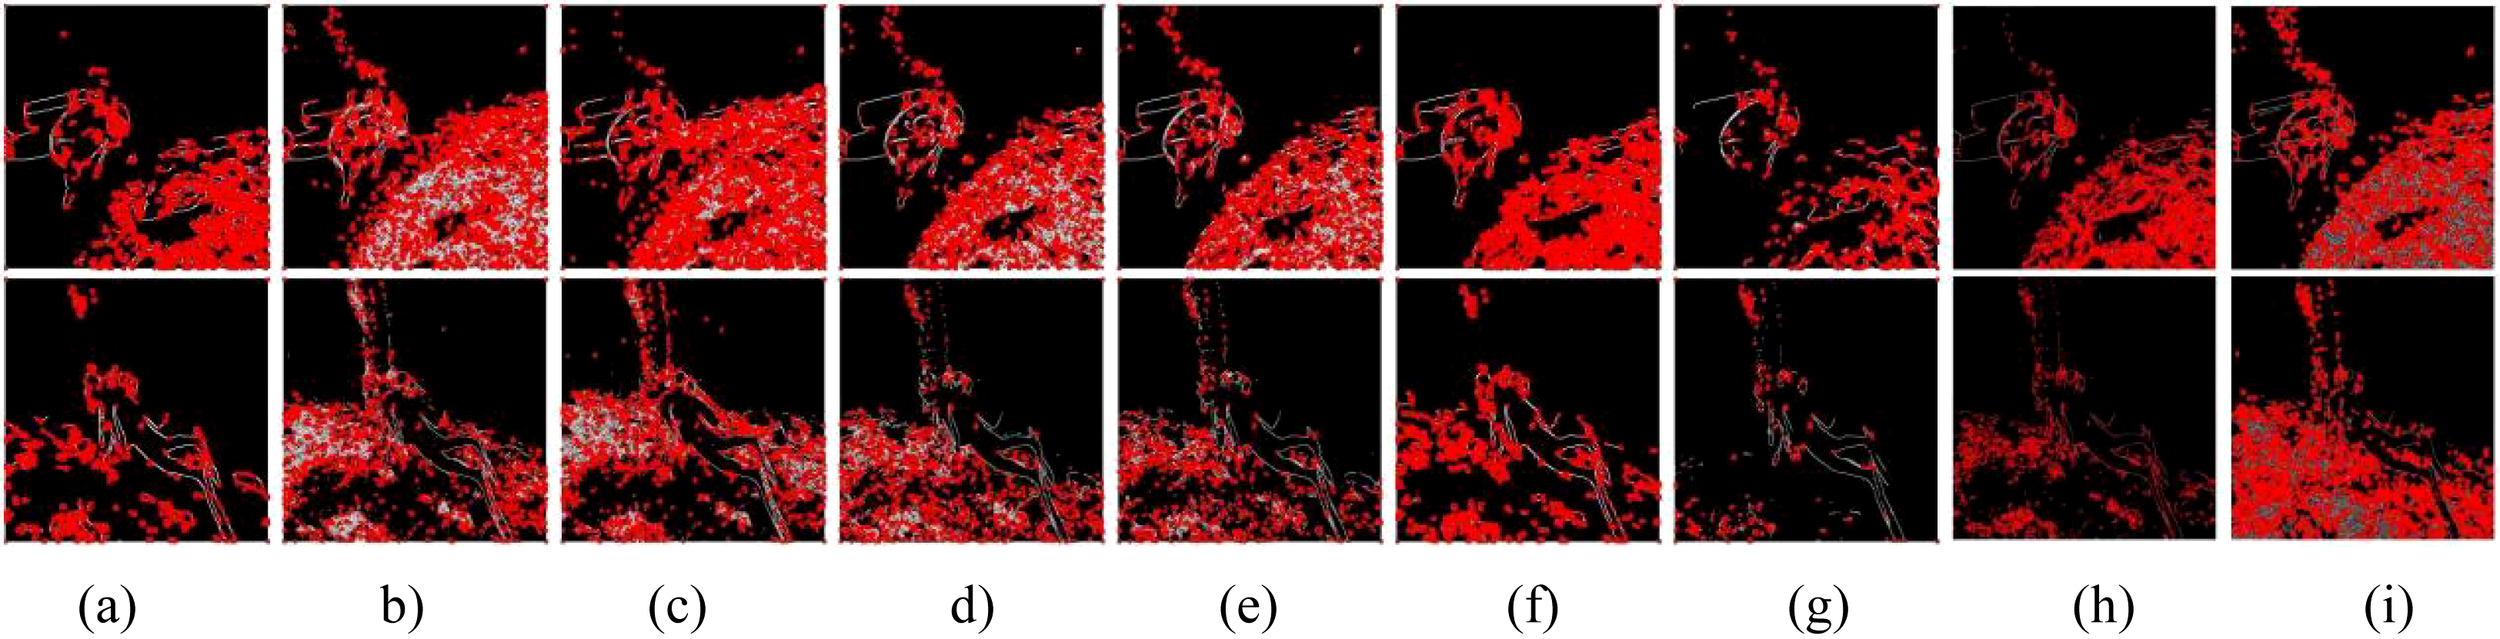
Subjective comparison of corner point detection. The images from (a) to (i) include: (a) raw underwater image, (b) MLLE, (c) PCDE, (d) EUICCCLF, (e) UIESS, (f) FUnIE-GAN, (g) UWCNN, (h) PDRMRV, and (i) the proposed UIVE, respectively.
Figure 15
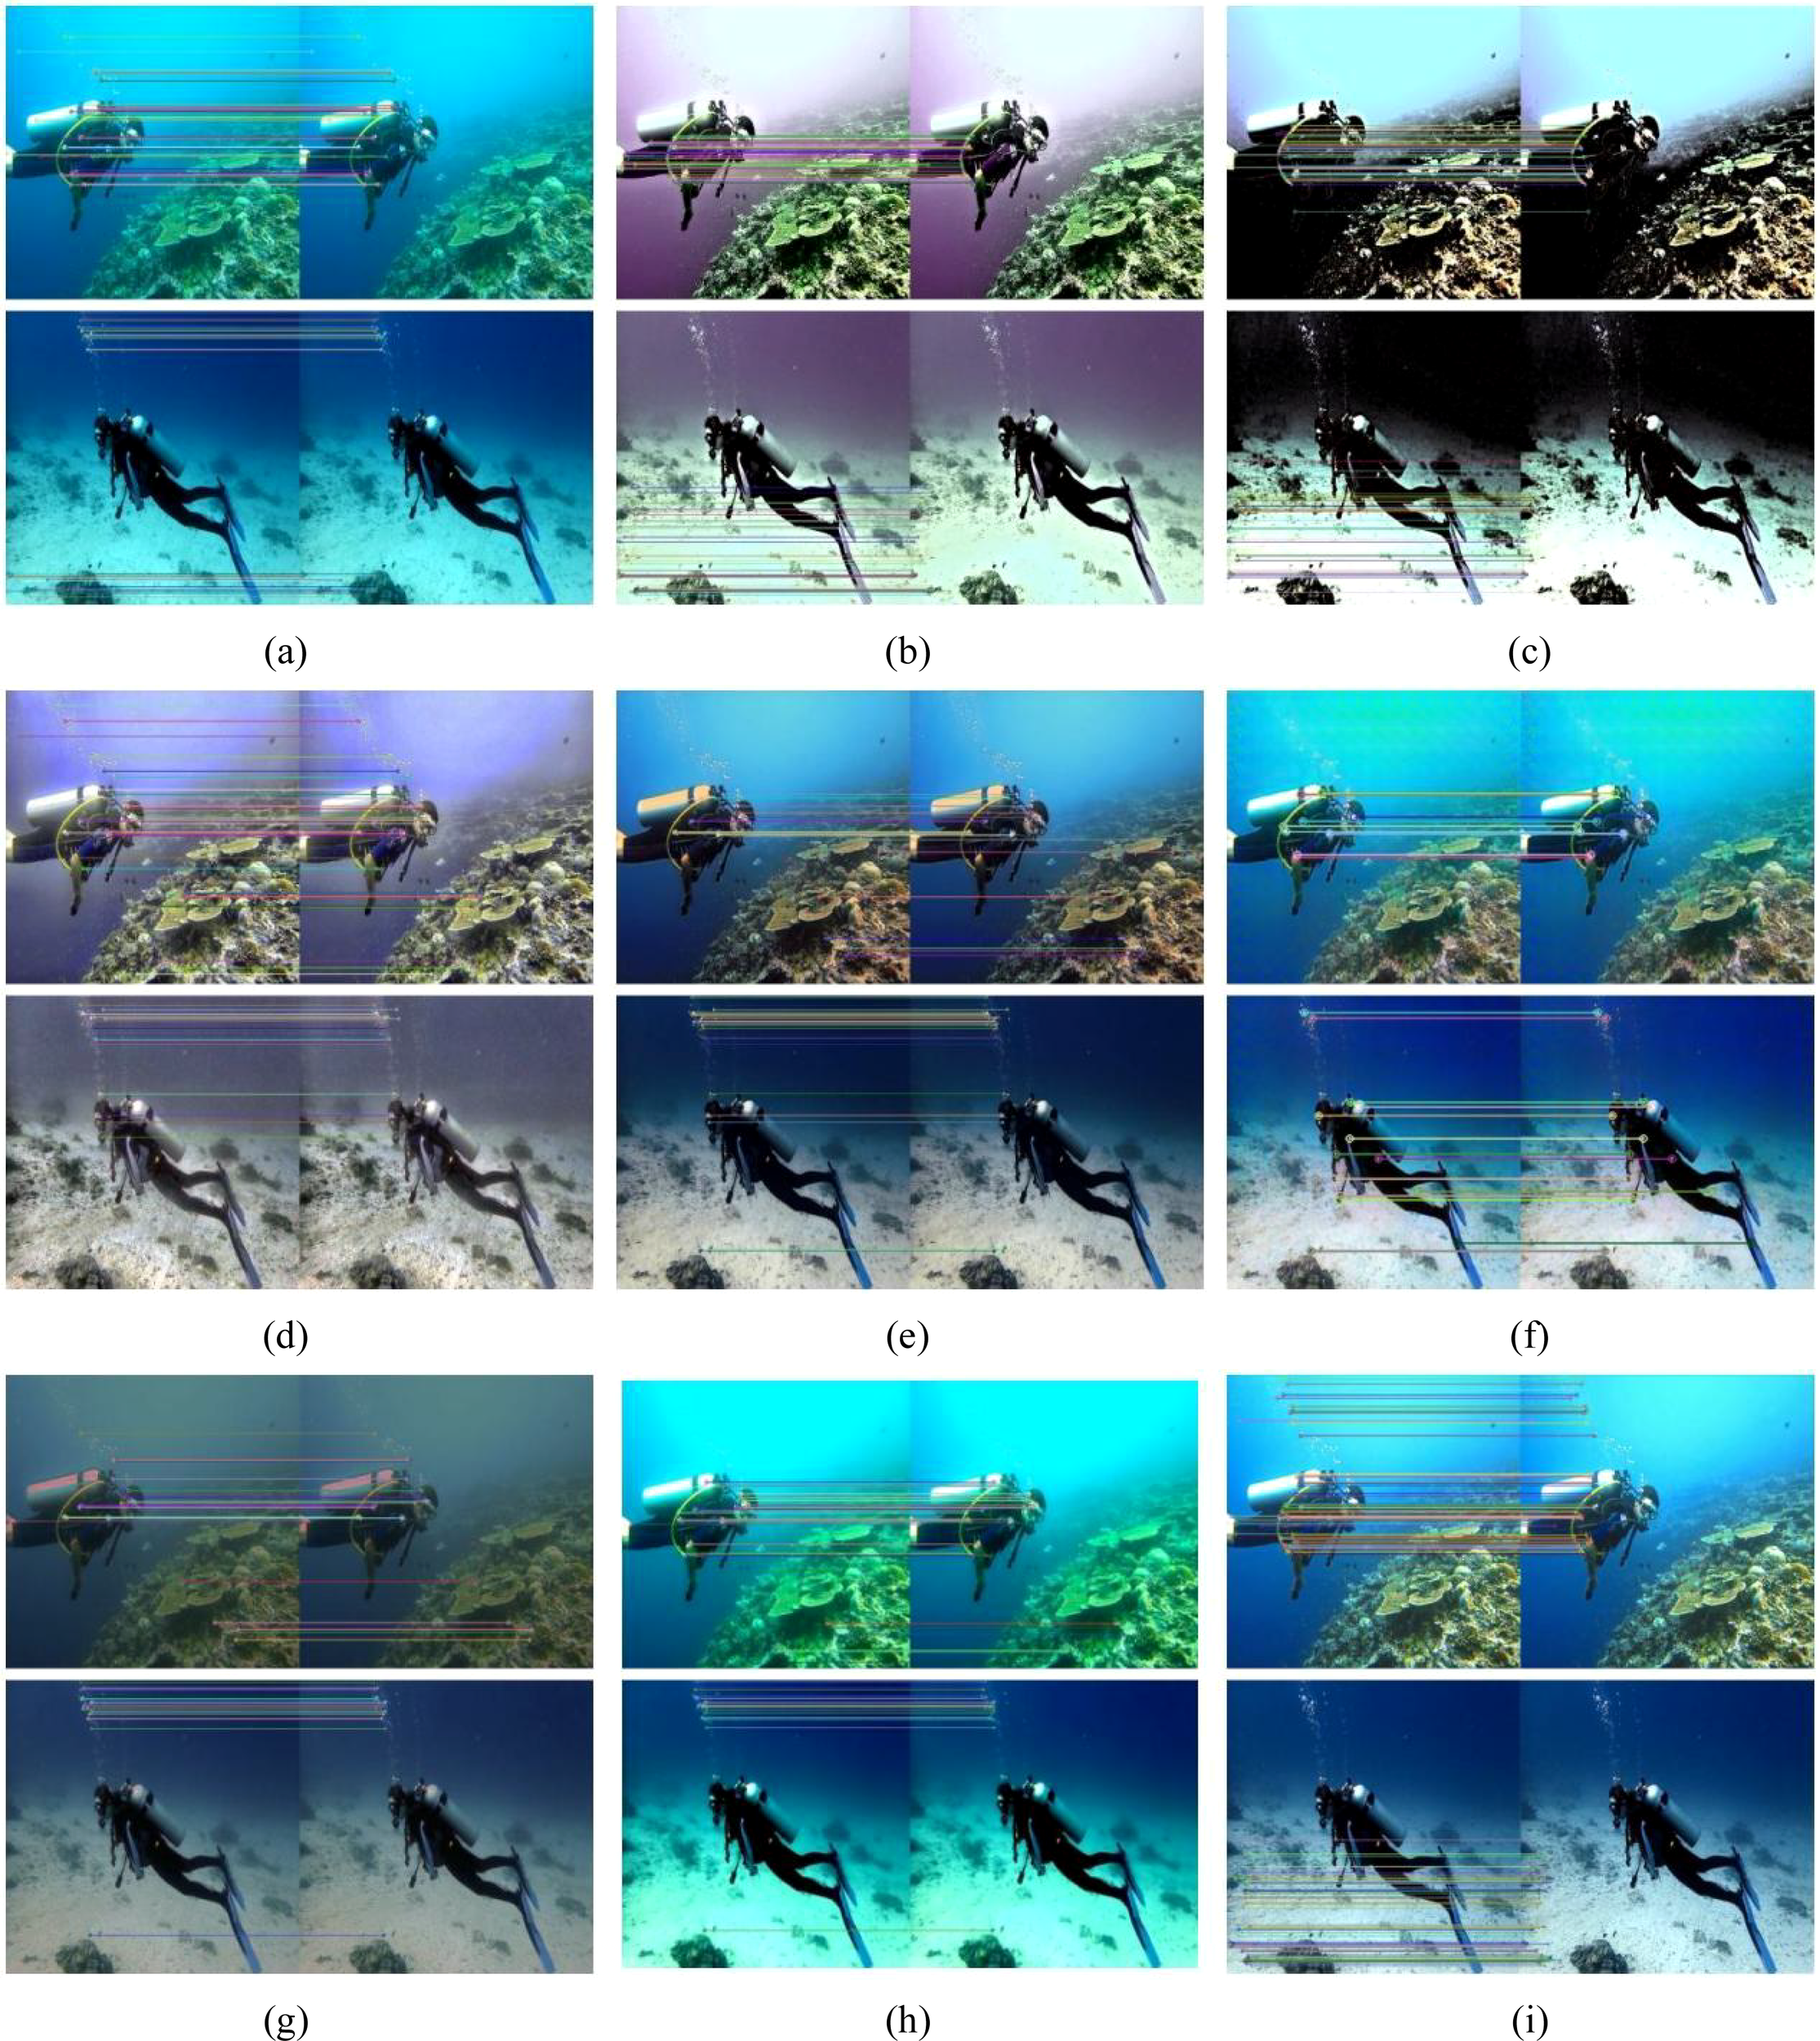
Subjective comparison of keypoint matching. The images from (a) to (i) include: (a) raw underwater image, (b) MLLE, (c) PCDE, (d) EUICCCLF, (e) UIESS, (f) FUnIE-GAN, (g) UWCNN, (h) PDRMRV, and (i) the proposed UIVE, respectively.
Edge and Corner Point Detection: Edge detection aims to identify regions with significant changes in brightness, while corner point detection is a technique used to capture distinctive features within an image. The effectiveness of the algorithm in recovering details in low-contrast regions is assessed by comparing the edge distribution of the image before and after enhancement. The quantity of corner points, along with the effectiveness of edge detection, can serve as indicators of the sharpness and overall visual quality of the image. To quantitatively evaluate the feature retention capabilities of the enhancement algorithms, this study employs two classical computer vision methods: Canny edge detection (Brooks et al., 1986) and corner point detection methods (Harris and Stephens, 1988) for performance testing. As illustrated in Figures 13 and 14, a subjective comparison reveals that all underwater image enhancement methods, with the exception of UWCNN, are capable of extracting more edge information and a greater number of corner points from the images. The corner point statistics and edge density results in Table 6 present the number of detected corner points by our corner detection algorithm and the corresponding edge density values, respectively. Our proposed method achieves the highest detection count on a single image and obtains relatively high edge density values, with overall performance positioned in the middle range. These findings indicate that our method is effective in enhancing structural features in underwater images.
Table 6
| Methods | Corner | Keypoint | Edge | |||
|---|---|---|---|---|---|---|
| Image1 | Image2 | Image1 | Image2 | Image1 | Image2 | |
| raw | 9339 | 6583 | 33 | 86 | 0.0795 | 0.0377 |
| MLLE | 17444 | 14563 | 154 | 167 | 0.1235 | 0.0681 |
| PCDE | 19430 | 14752 | 142 | 126 | 0.1104 | 0.0754 |
| EUICCCLF | 14763 | 14286 | 128 | 71 | 0.1113 | 0.1109 |
| PDRMRV | 11962 | 11986 | 100 | 135 | 0.0852 | 0.0423 |
| UIESS | 13583 | 12001 | 45 | 70 | 0.0910 | 0.0564 |
| FUnIE-GAN | 12450 | 10963 | 56 | 91 | 0.1061 | 0.0756 |
| UWCNN | 7168 | 3124 | 73 | 132 | 0.0457 | 0.0196 |
| Ours | 15691 | 16545 | 136 | 146 | 0.1107 | 0.0769 |
A comparison of values for corner point detection and keypoint matching is presented. Red values indicate the best results, while green values represent the second-best results.
The symbol '↑' indicates that the higher the value of the indicator, the better. The symbol '↓' indicates that the lower the value of the indicator, the better.
The yellow highlights indicate new experimental results added in response to the reviewers’ comments for additional comparative analysis.
Feature Point Matching: Feature point matching seeks to establish correspondences among identical physical feature points across two or more images (Lowe, 2004). This process is essential for evaluating the effects of image enhancement, as it verifies that the enhanced image maintains the structural consistency of the real scene. Figure 15 illustrates the subjective results of keypoint matching. The results of the quantitative analysis of keypoint matching, presented in Table 6, indicate that the enhanced underwater image extracts more effective feature matching points than the original image. In two sets of test images, the proposed method achieved suboptimal performance in one of the sets. Further analysis confirms that the algorithm consistently enhances image quality and structural integrity by improving the detectability of features in underwater images.
Video Test: To verify the lightweight feature of our model, we selected three underwater videos with varying resolutions for testing. All methods were deployed on an Intel i7-13620H CPU and an NVIDIA RTX 4060 GPU, operating under the PyTorch framework. As shown in Table 7, we excluded the data-driven method from the video test due to the limitations of the FUnIE-GAN method regarding input image size. In Table 7, UWCNN is also identified as a lightweight model. While both UWCNN and our method demonstrate fast processing speeds, our method achieves the fastest processing speed.
Table 7
| Resolution | Total-time | Methods | FPS | Average single-frame processing time (ms) |
|---|---|---|---|---|
| 1920×1080 | 30min | UIESS | 2.03 | 493.33 |
| UWCNN | 6.34 | 157.69 | ||
| Ours | 7.68 | 131.71 | ||
| 1280×720 | 30min | UIESS | 4.59 | 217.75 |
| UWCNN | 13.39 | 69.51 | ||
| Ours | 16.48 | 62.57 | ||
| 640×480 | 30min | UIESS | 10.01 | 99.89 |
| UWCNN | 33.53 | 29.82 | ||
| Ours | 36.23 | 28.52 |
The comparison of video tests. Red values indicate the best results, while green values represent the second-best results.
5 Conclusion
This paper proposes a lightweight processing method that integrates multi-scale feature information. The model effectively mitigates color bias and luminance attenuation in underwater image processing within marine engineering by incorporating a residual block design and an adaptive luminance adjustment mechanism. With a model size of only 0.08MB, the algorithm is compact and achieves real-time processing at 36.23 frames per second (FPS) at a resolution of 640×480, making it particularly suitable for deployment on embedded vision systems for Autonomous Underwater Vehicles (AUVs) and Remotely Operated Vehicles (ROVs) used in inspection platforms. The Peak Signal-to-Noise Ratio (PSNR) value on the Underwater Image Enhancement Benchmark (UIEB) dataset reaches 18.57 dB, while the Structural Similarity Index Measure (SSIM) value reaches 0.91. Ablation experiments demonstrate that the inclusion of the luminance adaptive module enhances luminance by 12.27%. Furthermore, this paper validates the practical application value of the proposed method in dynamic sequence processing by utilizing real underwater video data in application tests.
Although the method has demonstrated effective performance in open-source underwater image enhancement, the algorithm is specifically designed for an underwater optical system and is limited to shallow water environments. In the real underwater images we captured, there is significant color shading and high turbidity, resulting in unsatisfactory test outcomes. Therefore, it is crucial to develop more challenging benchmark datasets for deepwater images and to explore image enhancement methods tailored for complex underwater scenes in the future. These studies will contribute to the advancement of underwater vision technology across a broader array of application scenarios.
Statements
Data availability statement
The original contributions presented in the study are included in the article/supplementary material. Further inquiries can be directed to the corresponding author.
Author contributions
GL: Project administration, Resources, Writing – review & editing. HL: Formal Analysis, Methodology, Software, Visualization, Writing – original draft, Writing – review & editing. HW: Conceptualization, Data curation, Validation, Writing – review & editing. HS: Formal Analysis, Project administration, Resources, Writing – review & editing. XZ: Data curation, Project administration, Supervision, Validation, Writing – review & editing. RZ: Data curation, Formal Analysis, Resources, Visualization, Writing – review & editing. BC: Data curation, Methodology, Project administration, Software, Writing – original draft. ZJ: Funding acquisition, Resources, Writing – review & editing.
Funding
The author(s) declared that financial support was received for this work and/or its publication. This work was supported by the Shanghai Municipal Industrial Collaborative Innovation Technology Project (XTCX-KJ-2023-2-15). We sincerely thank you for your valuable help and support.
Conflict of interest
Authors HS, XZ, and RZ were employed by CNFC Overseas Fisheries Co., Ltd.
The remaining authors declared that this work was conducted in the absence of any commercial or financial relationships that could be construed as a potential conflict of interest.
Generative AI statement
The author(s) declared that generative AI was not used in the creation of this manuscript.
Any alternative text (alt text) provided alongside figures in this article has been generated by Frontiers with the support of artificial intelligence and reasonable efforts have been made to ensure accuracy, including review by the authors wherever possible. If you identify any issues, please contact us.
Publisher’s note
All claims expressed in this article are solely those of the authors and do not necessarily represent those of their affiliated organizations, or those of the publisher, the editors and the reviewers. Any product that may be evaluated in this article, or claim that may be made by its manufacturer, is not guaranteed or endorsed by the publisher.
References
1
Brooks M. A. Zhang Y. Chen L. Wang H. Liu Z. Li X. et al . (1986). A computational approach to edge detection. IEEE Transactions on Pattern Analysis and Machine Intelligence. 8, 679–698. doi: 10.1109/TIP.2016.2550526
2
Chen Y.-W. (2022). Domain adaptation for underwater image enhancement via content and style separation. IEEE Trans. Image Process.10, 90523–90534. doi: 10.1109/TIP.2022.3147890
3
Drews P. L. J. Nascimento E. R. Botelho S. S. C. (2016). Underwater depth estimation and image restoration based on single images. J. Field Robot.36, 24–35. doi: 10.1002/rob.21628
4
Fu X. Fan Z. Ling M. Huang Y. (2017). Two-step approach for single underwater image enhancement. IEEE International Symposium on Intelligent Signal Processing and Communication Systems (ISPACS). doi: 10.1109/ISPACS.2017.8266583
5
Fu X. Zhuang P. Huang Y. Liao Y. Zhang X.-P. (2014). A retinex-based enhancing approach for single underwater image. IEEE International Conference on Image Processing (ICIP). 20. doi: 10.1109/ICIP.2014.7025927
6
Gao S. Wu W. Li H. Zhu L. (2023). Atmospheric scattering model induced statistical characteristics estimation for underwater image restoration. IEEE Trans. Image Process.30, 1–15. doi: 10.1109/TIP.2023.3245678
7
Guo C. Wu R. Jin X. Han L. Chai Z. Zhang W. et al . (2022). Underwater ranker: learn which is better and how to be better. arXiv preprint arXiv:2208.08657. 14, 345–358. doi: 10.1109/TIP.2022.3145678
8
Harris C. G. Stephens M. J. (1988). A combined corner and edge detector. Alvey Vision Conf. 12, 147–151. doi: 10.5244/C.2
9
He K. Sun J. Tang X. (2016). Single image haze removal using dark channel prior. IEEE Trans. Image Process.25.
10
Hou G. Zhao X. Pan Z. Yang H. Tan L. (2020). Benchmarking underwater image enhancement and restoration, and beyond. IEEE Trans. Image Process.8, 122078–122091. doi: 10.1109/TIP.2020.2985678
11
Hu H. Wang Y. Li C. Fu X. Li Y. (2024). Enhancing underwater image via color-cast correction and luminance fusion. IEEE Transactions on Circuits and Systems for Video Technology. 49, 15–29. doi: 10.1109/JOE.2023.3306591
12
Islam M. J. Xia Y. (2020). Fast underwater image enhancement for improved visual perception. IEEE Access. 5, 89745–89756. doi: 10.1109/LRA.2020.2974710
13
Li C. Anwar S. (2020). Underwater scene prior inspired deep underwater image and video enhancement. IEEE Trans. Image Process.98, 5432–5445. doi: 10.1109/TIP.2020.2985678
14
Li C. Anwar S. Hou J. Cong R. Guo C. (2021). Underwater image enhancement via medium transmission-guided multi-color space embedding. Pattern Recognition. 30, 4985–5000. doi: 10.1016/j.patcog.2021.108090
15
Li C. Guo C. Ren W. Cong R. Hou J. (2019). An underwater image enhancement benchmark dataset and beyond. IEEE Trans. Image Process.29, 4376–4389. doi: 10.1109/TIP.2019.2955241
16
Li X. Sun W. Ji Y. Huang W. (2024). A joint detection and tracking paradigm based on reinforcement learning for compact HFSWR. IEEE J. Selected Topics Appl. Earth Observations Remote Sens.18, 1995–2009. doi: 10.1109/JSTARS.2024.3504813
17
Li X. Sun W. Ji Y. Huang W. (2025). S2G-GCN: A plot classification network integrating spectrum-to-graph modeling and graph convolutional network for compact HFSWR. IEEE Geosci. Remote Sens. Lett.22, 1–16. doi: 10.1109/LGRS.2025.3623931
18
Liu H. (2016). Underwater image restoration based on contrast enhancement. IEEE Trans. Image Process.25, 584–588. doi: 10.1109/TIP.2016.2550526
19
Liu R. Fan X. Zhu M. Hou M. (2020). Real-world underwater enhancement: challenges, benchmarks, and solutions under natural light. IEEE Trans. Image Process.30, 4861–4875. doi: 10.1109/TIP.2020.2985678
20
Liu R. Jiang Z. Yang S. (2022). Twin adversarial contrastive learning for underwater image enhancement and beyond. IEEE Trans. Multimed.31, 4922–4936. doi: 10.1109/TMM.2022.3145678
21
Liu C. Shu X. Xu D. (2024). GCCF: A lightweight and scalable network for underwater image enhancement. IEEE Trans. Pattern Anal. Mach. Intell.128, 1–14. doi: 10.1016/j.engappai.2023.107462
22
Liu P. Wang G. Qi H. Zhang C. Zheng H. (2021). Underwater image enhancement with a deep residual framework. IEEE Trans. Multimed.23, 200–206. doi: 10.1109/TMM.2021.3045678
23
Lowe D. G. (2004). Distinctive image features from scale-invariant keypoints. Int. J. Comput. Vis.60, 91–110. doi: 10.1023/B:VISI.0000029664.99615.94
24
Luo G. Li H. Wang H. Sui H. Zhang X. (2024). Design and hydrodynamic analysis of an automated polymer composite mattress deployment system for offshore oil and gas pipeline protection. IEEE Transactions on Pattern Analysis46, 1–17. doi: 10.1109/TPAMI.2024.3345678
25
Mittal A. Soundararajan R. (2013). Making A "completely blind" Image quality analyzer. IEEE Signal Processing Letters20 (3). doi: 10.1109/LSP.2012.2227726
26
Panetta K. Gao C. (2015). Human-visual-system-inspired underwater image quality measures. IEEE Trans. Image Process.41, 541–551. doi: 10.1109/TIP.2015.2413456
27
Peng L. Zhu C. (2023). U-shape transformer for underwater image enhancement. IEEE Trans. Multimed.32, 2345–2357. doi: 10.1109/TMM.2023.3245678
28
Prasad D. Jyothi S. S. Harshini V. Preethi P. (2020). Color balance and fusion for underwater image enhancement. Semantic Scholar. doi: 10.1109/TIP.2020.2985678
29
Ronneberger O. Fischer P. (2017). U-net: convolutional networks for biomedical image segmentation. Medical Image Analysis42, 3–3. doi: 10.1016/j.media.2017.03.006
30
Song W. Wang Y. Huang D. Liotta A. (2020). Enhancement of underwater images with statistical model of background light and optimization of transmission map. IEEE J. Oceanic Eng.66, 153–169. doi: 10.1109/JOE.2020.2985678
31
Tian H. Guan F. Wan F. Yang Y. (2024). The effect of corrosion defects on the collapse pressure of submarine pipelines. IEEE Transactions on Circuits and Systems for Video Technology. 310, 1–12. doi: 10.1109/TCSSVT.2024.3345678
32
Wang X. Yu K. Wu S. Gu J. Liu Y. (2018). ESRGAN: enhanced super-resolution generative adversarial networks. ECCV Workshops. 27, 4567–4580. doi: 10.1109/TIP.2018.2825678
33
Wang H. Frery A. C. Li M. Ren P. (2023). Underwater image enhancement via histogram similarity-oriented color compensation complemented by multiple attribute adjustment. Intelligent Mar. Technol. Syst.12, 456–470. doi: 10.1007/s44295-023-00015-y
34
Wang S. Ma K. Yeganeh H. Wang Z. (2015). A patch-structure representation method for quality assessment of contrast changed images. IEEE Trans. Image Process.22, 3586–3599. doi: 10.1109/TIP.2015.2413456
35
Wang H. Zhang W. Xu Y. Li H. Ren P. (2026). WaterCycleDiffusion: Visual-textual fusion empowered underwater image enhancement. Inf. Fusion127, 1–13. doi: 10.1016/j.inffus.2025.103693
36
Yang M. (2015). An underwater color image quality evaluation metric. Neurocomputing. 24, 6062–6071. doi: 10.1016/j.neucom.2015.02.034
37
Yin S. Hu S. Wang Y. Wang W. Li C. (2022). Degradation-aware and color-corrected network for underwater image enhancement. IEEE Transactions on Circuits and Systems for Video Technology. 258, 109997–109997. doi: 10.1109/TCSSVT.2022.3145678
38
Zhang W. Jin S. Zhuang P. Liang Z. Li C. (2023). Underwater image enhancement via piecewise color correction and dual prior optimized contrast enhancement. Pattern Recognition. 30, 229–233. doi: 10.1016/j.patcog.2023.108090
39
Zhang S. Wang T. Dong J. (2017). Underwater image enhancement via extended multi-scale retinex. IEEE Trans. Image Process.26, 1–9. doi: 10.1016/j.neucom.2017.03.029
40
Zhang W. Zhuang P. Sun H. Li G. Kwong S. (2022). Underwater image enhancement via minimal color loss and locally adaptive contrast enhancement. IEEE Trans. Multimed.31, 3997–4010. doi: 10.1109/TMM.2022.3145678
41
Zhao H. Gallo O. Frosio I. (2016). Loss functions for image restoration with neural networks. Neurocomputing. 3, 47–57. doi: 10.1016/j.neucom.2015.02.034
42
Zhou J. Wang S. Lin Z. Jiang Q. Sohel F. (2024). A pixel distribution remapping and multi-prior retinex variational model for underwater image enhancement. IEEE Trans. Multimedia. 28, 234–248. doi: 10.1109/TMM.2024.3372400
43
Zhuang P. Wu J. Porikli F. (2022). Underwater image enhancement with hyper-laplacian reflectance priors. IEEE Trans. Image Process.31, 5442–5455. doi: 10.1109/TIP.2022.3145678
Summary
Keywords
biascolor, engineering monitoring, marine engineering, residual block, underwater image enhancement
Citation
Luo G, Li H, Wang H, Sui H, Zhang X, Zhang R, Chen B and Jiang Z (2026) A lightweight underwater image and video enhancement method based on multi-scale feature fusion. Front. Mar. Sci. 12:1725829. doi: 10.3389/fmars.2025.1725829
Received
15 October 2025
Revised
28 November 2025
Accepted
30 November 2025
Published
05 January 2026
Volume
12 - 2025
Edited by
Debabrata Karmakar, National Institute of Technology, India
Reviewed by
Hao Wang, Laoshan National Laboratory, China
Chun Shan, Guangdong Polytechnic Normal University, China
Updates
Copyright
© 2026 Luo, Li, Wang, Sui, Zhang, Zhang, Chen and Jiang.
This is an open-access article distributed under the terms of the Creative Commons Attribution License (CC BY). The use, distribution or reproduction in other forums is permitted, provided the original author(s) and the copyright owner(s) are credited and that the original publication in this journal is cited, in accordance with accepted academic practice. No use, distribution or reproduction is permitted which does not comply with these terms.
*Correspondence: Zhe Jiang, zjiang@shou.edu.cn
Disclaimer
All claims expressed in this article are solely those of the authors and do not necessarily represent those of their affiliated organizations, or those of the publisher, the editors and the reviewers. Any product that may be evaluated in this article or claim that may be made by its manufacturer is not guaranteed or endorsed by the publisher.