Abstract
Trade cooperation represents a fundamental and crucial element within the framework of the Belt and Road Initiative. This paper selects representative countries with Belt and Road trade agreement that are under negotiation, under study, and accessible. Employing the Global Trade Analysis Project (GTAP) model, the study simulates seven distinct scenarios for the expansion of these trade agreements, analyzes the economic benefits under different scenarios, and constructs a multi-region input–output table. A Global Trade Analysis Project-Multi Region Input Output (GTAP-MRIO) model is extended to capture carbon flows from maritime trade and port-related logistics sectors. We obtain several findings. Regarding economic benefits, the expansion of the Belt and Road trade agreement can improve China’s terms of trade, increase the scale of China’s total output and total imports, increase GDP growth, and increase social welfare. Regarding industrial output, the output of technology-intensive industries is likely to increase, and the output of energy-intensive industries is predicted to increase significantly. The transfer of carbon emissions from China to other countries is predicted to decrease, and the transfer of carbon emissions from China’s exports comes mainly from energy-intensive industries. These predictions based on model analysis offer theoretical guidance and policy recommendations for the pursuit of green and high-quality sustainable development within the framework of the Belt and Road Initiative.
1 Introduction
Since 2013, when the “New Silk Road Economic Belt” and “21st Century Maritime Silk Road” cooperation initiatives were proposed, China has signed Belt and Road cooperation agreements with 150 countries and 32 international organizations. As an important form of in-depth regional economic cooperation under the Belt and Road Cooperation Initiative, the Belt and Road trade agreements play an important role in promoting global trade and economic integration. This initiative covers a wide range of regions and aims to strengthen connectivity among countries along the route, reduce trade barriers and promote trade cooperation, and is expected to create economic growth, increase employment opportunities, and promote investment flows and technology transfer for member countries.
However, the environmental issues behind the Belt and Road trade agreements cannot be ignored, such as climate change, energy consumption, and atmospheric pollution, among which carbon emissions are of great concern. Ports serve as critical nodes in the Belt and Road’s global value chain, where vessel berthing, cargo handling, and hinterland transport generate considerable carbon emissions.
Over 90% of the Belt and Road trade volume is transported by sea. The member countries of the Belt and Road are mainly developing countries, and their carbon emission changes are closely related to the achievement of the Paris Agreement’s (Rajamani, 2016) goal of “carbon peaking and carbon neutrality”. As an important international cooperation initiative, the Belt and Road needs to actively address the issue of carbon emissions and adopt a green and low-carbon sustainable development path. To achieve this, it is crucial to plan and guide member countries to strike a balance between economic development and environmental protection. Policy formulation and implementation invariably entail the dilemma of balancing economic growth with pollution control. From one perspective, the central and potentially competing objective for policy makers and planners remains economic growth and job creation (Haider et al., 2023). Conversely, the multifaceted restrictions can have a negative impact on the profitability of businesses (Chadda et al., 2024; Chen et al., 2024), potentially impinging upon the allocation of resources towards environmental conservation initiatives. Therefore, prior to the expansion of the Belt and Road Initiative’s trade agreements, it is imperative to clearly delineate their economic benefits and environmental costs. Simulations to calculate the economic benefits and the cost of carbon emissions of different member countries’ accession to the Belt and Road trade agreements will provide policy references and guidance for the development and expansion of the Belt and Road trade agreements. Given the Belt and Road’s strong reliance on seaborne trade, research should also pay attention to the potential role of maritime transport and port operations in shaping the Initiative’s overall carbon footprint.
Although shipping is the key carrier of the Belt and Road initiative, this study focuses on the impact of the Belt and Road on macroeconomic benefits and the implied carbon flow. Due to the presence of industry agglomeration constraints in the standard GTAP model, this study adopts a more comprehensive macro perspective. Simply simulating port operations is difficult to assess the impact of trade policies on overall trade-related carbon emissions. Therefore, we used the GTAP-MRIO model to capture the carbon intensity of the broader transportation industry, including some maritime activities.
Based on the above background, this study simulates the economic effects and embedded carbon flow under the scenarios of different “the Belt and Road” initiative trade agreement expansion by building an extended GTAP-MRIO model, especially focusing on the marine dominated and trade-related environmental costs. The main contribution of this article is that firstly, the system simulates the impact of multiple potential member countries joining the agreement on China’s macroeconomy, industrial output, and relationships with major trading partners. Secondly, implied carbon analysis is used to assess the cost of the expansion of the “the Belt and Road” trade agreement, with particular attention to carbon emissions based on the maritime trade model. Third, the integration of economic and environmental perspectives provides policy insights for achieving green and high-quality development under the Belt and Road framework. The structure of this article is as follows: the second part is a literature review, the third part introduces modeling methods, the fourth part presents and analyzes simulation results, and the fifth part summarizes research conclusions and proposes policy recommendations.
2 Literature review
2.1 Economic effects of the Belt and Road
The Belt and Road Initiative is likely to increase sustainable economic growth in China and the countries along the routes. Existing studies have taken two perspectives. First, from China’s perspective, the Belt and Road Initiative offers an opportunity to deploy patient capital to build infrastructure and strengthen domestic production capabilities (Calabrese et al., 2024). Concurrently, augmented investment in Chinese maritime sectors is anticipated to catalyze economic expansion in these coastal zones (Song and Fabinyi, 2022). The Belt and Road Initiative has catalyzed the digital transformation of industries in China and among participating countries along its corridors, as it not only promotes the growth of the economies of the countries along the belt, but also improves the quality of economic growth. Second, from the perspective of countries along the route, the Belt and Road Initiative can significantly enhance the economic performance of these countries, with particularly notable effects for low-income nations (Ma, 2022; Feng et al., 2022). Moreover, the initiative significantly promotes the restructuring of the global value chain between China and the countries along the route, with the effects intensifying over time (Wang et al., 2024). The economic effects of transport infrastructure construction and technology transfer for countries along the Belt and Road should not be overlooked. Infrastructure plays an essential mediating role in facilitating the initiative’s enhancement of these countries’ positioning within the global value chain (Li et al., 2024). The infrastructure development and improvement of customs environments resulting from the Belt and Road Initiative can also ameliorate the export performance of China’s digital products (Wang and Zhu, 2024; Chen et al., 2023b). Xu and Cheng (2020) found that R&D cooperation and technology transfer between countries along the Belt and Road and China can contribute to the economic growth of the countries along the Belt and Road through the enhancement of R&D capacity and knowledge stock, respectively. In the above studies, the economic impacts of the Belt and Road have been comprehensively demonstrated, but the effects of lowering tariff barriers on the economies of Belt and Road member countries and the rest of the world when potential member countries join the trade agreement have not yet been discussed and modeled.
2.2 Carbon effects of the Belt and Road initiative
Existing studies present different views on the carbon emission effects of the Belt and Road Initiative. Generally speaking, some scholars believe that the initiative can reduce the carbon emission intensity of both coastal and non-coordinated regions (Yu et al., 2023), and Chinese investments in technology and human capital along the Belt and Road are shown to reduce carbon emissions without compromising local economic growth (Khan et al., 2022). Others, however, such as Ozkan et al. (2023), by using China’s carbon efficiency as an indicator of environmental degradation, believe that trade openness has exacerbated environmental issues in both the short and long term. First, noting that the carbon emission effect of the Belt and Road has a stage-by-stage characteristic, Zhang and Chen (2022) believe that the carbon emissions of China’s export trade to the Belt and Road countries show a trend of promoting growth initially and then suppressing growth subsequently. Countries along the Belt and Road, predominantly developing nations, tend to generate higher carbon emissions during their economic development. Nonetheless, the adoption of green energy technologies can mitigate the environmental strain associated with this development trajectory (Mpeqa et al., 2023). Second, the carbon emission effect of the Belt and Road has decomposition characteristics. Liu et al. (2022) argue that, on the one hand, the scale effect of China’s outward foreign direct investment (OFDI) increases the carbon emissions of the countries along the Belt and Road, while on the other hand, the structural and base effects of OFDI suppress the carbon emissions of the countries along it. From China’s perspective, the ability of the countries along the route to influence China’s carbon emissions, as well as the total carbon emissions, is gradually strengthening. Moreover, China and the countries along the Belt and Road have already carried out in-depth cooperation in the areas of low-carbon infrastructure, clean energy, low-carbon technology, climate finance, and other areas in a win–win model. The main focus of the existing studies on carbon emissions of the Belt and Road Initiative is on national carbon emissions and carbon emission intensity or efficiency, but insufficient attention has been paid to the flow of implied carbon emissions in import and export trade. In addition, maritime transport and port operations—core components of Belt and Road trade connectivity—represent significant yet often overlooked sources of embodied carbon emissions along international supply chains.
2.3 Maritime and port-related carbon emissions
Maritime transport represents the backbone of global trade, handling over 80% of international freight volume by weight and serving as the principal conduit for economic cooperation under the Belt and Road Initiative. As the Initiative’s trade networks increasingly rely on seaborne logistics and coastal ports, carbon emissions from maritime transport and port operations have emerged as critical components of the global emission landscape (Liang and Liu, 2020; Zhang et al., 2024). Port activities, such as vessel berthing, cargo handling, warehousing, and hinterland transportation, contribute significantly to local and transboundary CO2 emissions, making ports not only gateways of trade but also hotspots of environmental pressure (Wang et al., 2023).
According to the International Maritime Organization (IMO), international shipping is estimated to contribute around 2.9% of total global anthropogenic greenhouse gas emissions, mainly due to the burning of heavy fuel oil (Fourth, 2020). In response, the IMO’s Initial Green house gas (GHG) Strategy for International Shipping has established an ambitious target of reducing total annual GHG emissions from international shipping by at least 50% by 2050 compared to 2008 levels, with the long-term vision of full decarbonization within this century (Joung et al., 2020; Nguyen, 2025). This target has prompted many Belt and Road ports (like Shanghai), to accelerate their low-carbon transition through the deployment of shore power systems, liquefied Natural Gas (LNG) bunkering infrastructure, and digital monitoring for port-level carbon inventories (Cannon et al., 2015). In addition to global maritime governance, regional mechanisms such as the European Union’s Emission Trading System (EU ETS) have recently expanded to include maritime transport (Wissner et al., 2021). From 2024 onward, ships calling at EU ports are subject to carbon pricing obligations for their CO2 emissions, which is expected to affect trade routes and shipping costs along the Belt and Road corridors that connect Europe and Asia (Flodén et al., 2024).
The carbon footprints related to international maritime supply chains have started to be measured by current scholarly investigations. Zheng et al. (2024) highlighted that embodied carbon in maritime transport represents a hidden but substantial portion of global trade emissions, often overlooked in national inventories (Yu et al., 2025). Similarly, Wang and Li (2023) developed an accounting framework for port-level carbon emissions, emphasizing the importance of integrating maritime energy use and hinterland logistics into comprehensive carbon assessments (Gäde and Klauser, 2025; Chen et al., 2025, 2023a). Other scholars have proposed hybrid input–output approaches to link seaborne trade flows with global value chain emissions (Zhou et al., 2022). These studies collectively suggest that port and maritime sectors act as key intermediaries in cross-border carbon transfers, both physically through cargo movement and economically through embodied emissions in traded goods.
Despite these advancements, limited research has incorporated maritime logistics and port operations into Global Trade Analysis Project-based (GTAP-based) simulations of the Belt and Road’s environmental impacts. Most existing GTAP or Computable General Equilibrium (CGE) models treat transport emissions as homogeneous or secondary to industrial production, neglecting the spatial and sectoral heterogeneity of maritime activities. To address this research gap, this study extends the Multi Region Input Output (MRIO) framework derived from the GTAP database by explicitly including port-related and maritime transport sectors. Through this enhancement, it becomes possible to quantify the implicit carbon emissions arising from seaborne trade and to assess how the expansion of the Belt and Road trade agreements influences the distribution of maritime carbon flows across regions.
2.4 GTAP model
The GTAP model was developed by Hertel of Purdue University (Hertel, 1997). Subsequently, McDougall (2000) reworked the equations in the model with respect to the structure of final demand. Hertel and Huff (2001) provided a further model that considered the impact of endowments and technological change on regional welfare. Hummels and Schaur (2013) considered the importance of the emergence of rapid transport or the reduction of transport barriers in the model. In response to questions about GTAP’s weak econometric foundation, Hertel et al. (2007) applied econometrics to estimate the elasticity of import substitution between different countries, combining it with a Computable General Equilibrium (CGE) model-based analysis of free trade agreements (FTAs) to produce richer and more reliable results (Li et al., 2025). Subsequently, Corong et al. (2017) extended the model to allow multiple sectors to produce the same product and for a single sector to produce multiple products.
Other studies have used GTAP to analyze the impact of exogenous shocks on specific sectors. In recent years, GTAP-based frameworks have also been extended to evaluate carbon emissions and trade impacts related to maritime transport and port logistics, reflecting the growing role of shipping in global value chains. Nguyen et al. (2024) employe the GTAP model to analyze the repercussions of energy price shocks in Southeast Asia on economic systems and supply chain dynamics. Their study delineates the complex interplay between energy pricing, economic performance, and the structural integrity of supply chains within the region. Yi (2025) utilizes the GTAP-HET model to evaluate the repercussions of the US-Japan trade agreement on production, sales, factor demand, competitive pricing, and firm structure. Moreover, GTAP can also be used to assess the economic effects of an event or shock, such as Guo et al. (2022). The GTAP model was used to assess the global economic impact of the Fukushima nuclear wastewater discharge.
The RCEP marks a new chapter in the 10-year development of the Belt and Road Initiative, serving as a collaborative platform for regional comprehensive economic partners within the framework. Zhu and Huang (2023) used the GTAP model to analyze the impact of tariff reductions in the RCEP agreement on its core and peripheral members. Other scholars have also compared RCEP and Comprehensive and Progressive Agreement for Trans-Pacific Partnership (CPTPP). Wei et al. (2022) paid more attention to the competitive effects and complementarities of RCEP and CPTPP.
Throughout the GTAP research literature on the Belt and Road Initiative mentioned above, most studies focused on modeling the impacts of different countries joining the Belt and Road Initiative on China’s macroeconomy and manufacturing sector. However, maritime transport—the dominant mode of trade among Belt and Road economies—has rarely been explicitly incorporated into these models, despite its significant contribution to embodied carbon flows between regions. The shock variables were usually reduction of tariff barriers, while the classification of industrial sectors was relatively similar, with very little division based on the main factors involved in production of the sector and insufficient attention to the carbon emission costs of expanding the Belt and Road Initiative. With the implementation of the RCEP, cooperation under the Belt and Road Initiative is poised to become more comprehensive and profound, leading to a new era of collaborative win–win from the Belt and Road trade agreements. To date, many studies have not simulated the carbon emission costs of the expansion of these agreements.
While the aforementioned studies underscore the importance of modelling the maritime and port sectors independently, doing so poses challenges within the standard GTAP-MRIO framework due to its level of sectoral aggregation. The approach taken in this study is to focus on analyzing the carbon emissions from the integrated logistics chain—which includes maritime activities—triggered by trade liberalization. This serves as an effective approximation method for capturing carbon costs associated with maritime shipping within the constraints of the existing model framework.
The contribution of this paper is mainly reflected in two aspects: in terms of methodology, this study combines the GTAP model with the MRIO model to assess the carbon emission costs associated with the expansion of the Belt and Road trade agreement. In addition, this article categorizes production factors (such as technology intensive and energy intensive) into sectors to analyze their impact on industry. In terms of research perspective, this study not only focuses on the total carbon emissions at the national level, but also tracks carbon flows in trade from the perspective of global value chains and final consumer responsibility, while examining economic benefits and environmental costs. This provides more comprehensive evidence to support the balance between development and emission reduction goals under the Belt and Road Initiative.
3 Modeling methodology
This study follows a structured methodology encompassing model construction, scenario design, simulation, and multi-faceted analysis. Figure 1 (or other designated number) below illustrates the overall technical roadmap, outlining the key steps from the initial research setup to the final derivation of conclusions and policy implications. The process begins with the construction of an integrated GTAP-MRIO model. Subsequently, a baseline scenario for the year 2030 is established, against which seven distinct policy scenarios simulating the expansion of the Belt and Road trade agreements are defined. The simulated results are then analyzed comprehensively, covering macroeconomic impacts, industrial output changes, trade flow adjustments with major partners, and the transfer of embodied carbon emissions from both global value chain and sectoral perspectives.
Figure 1
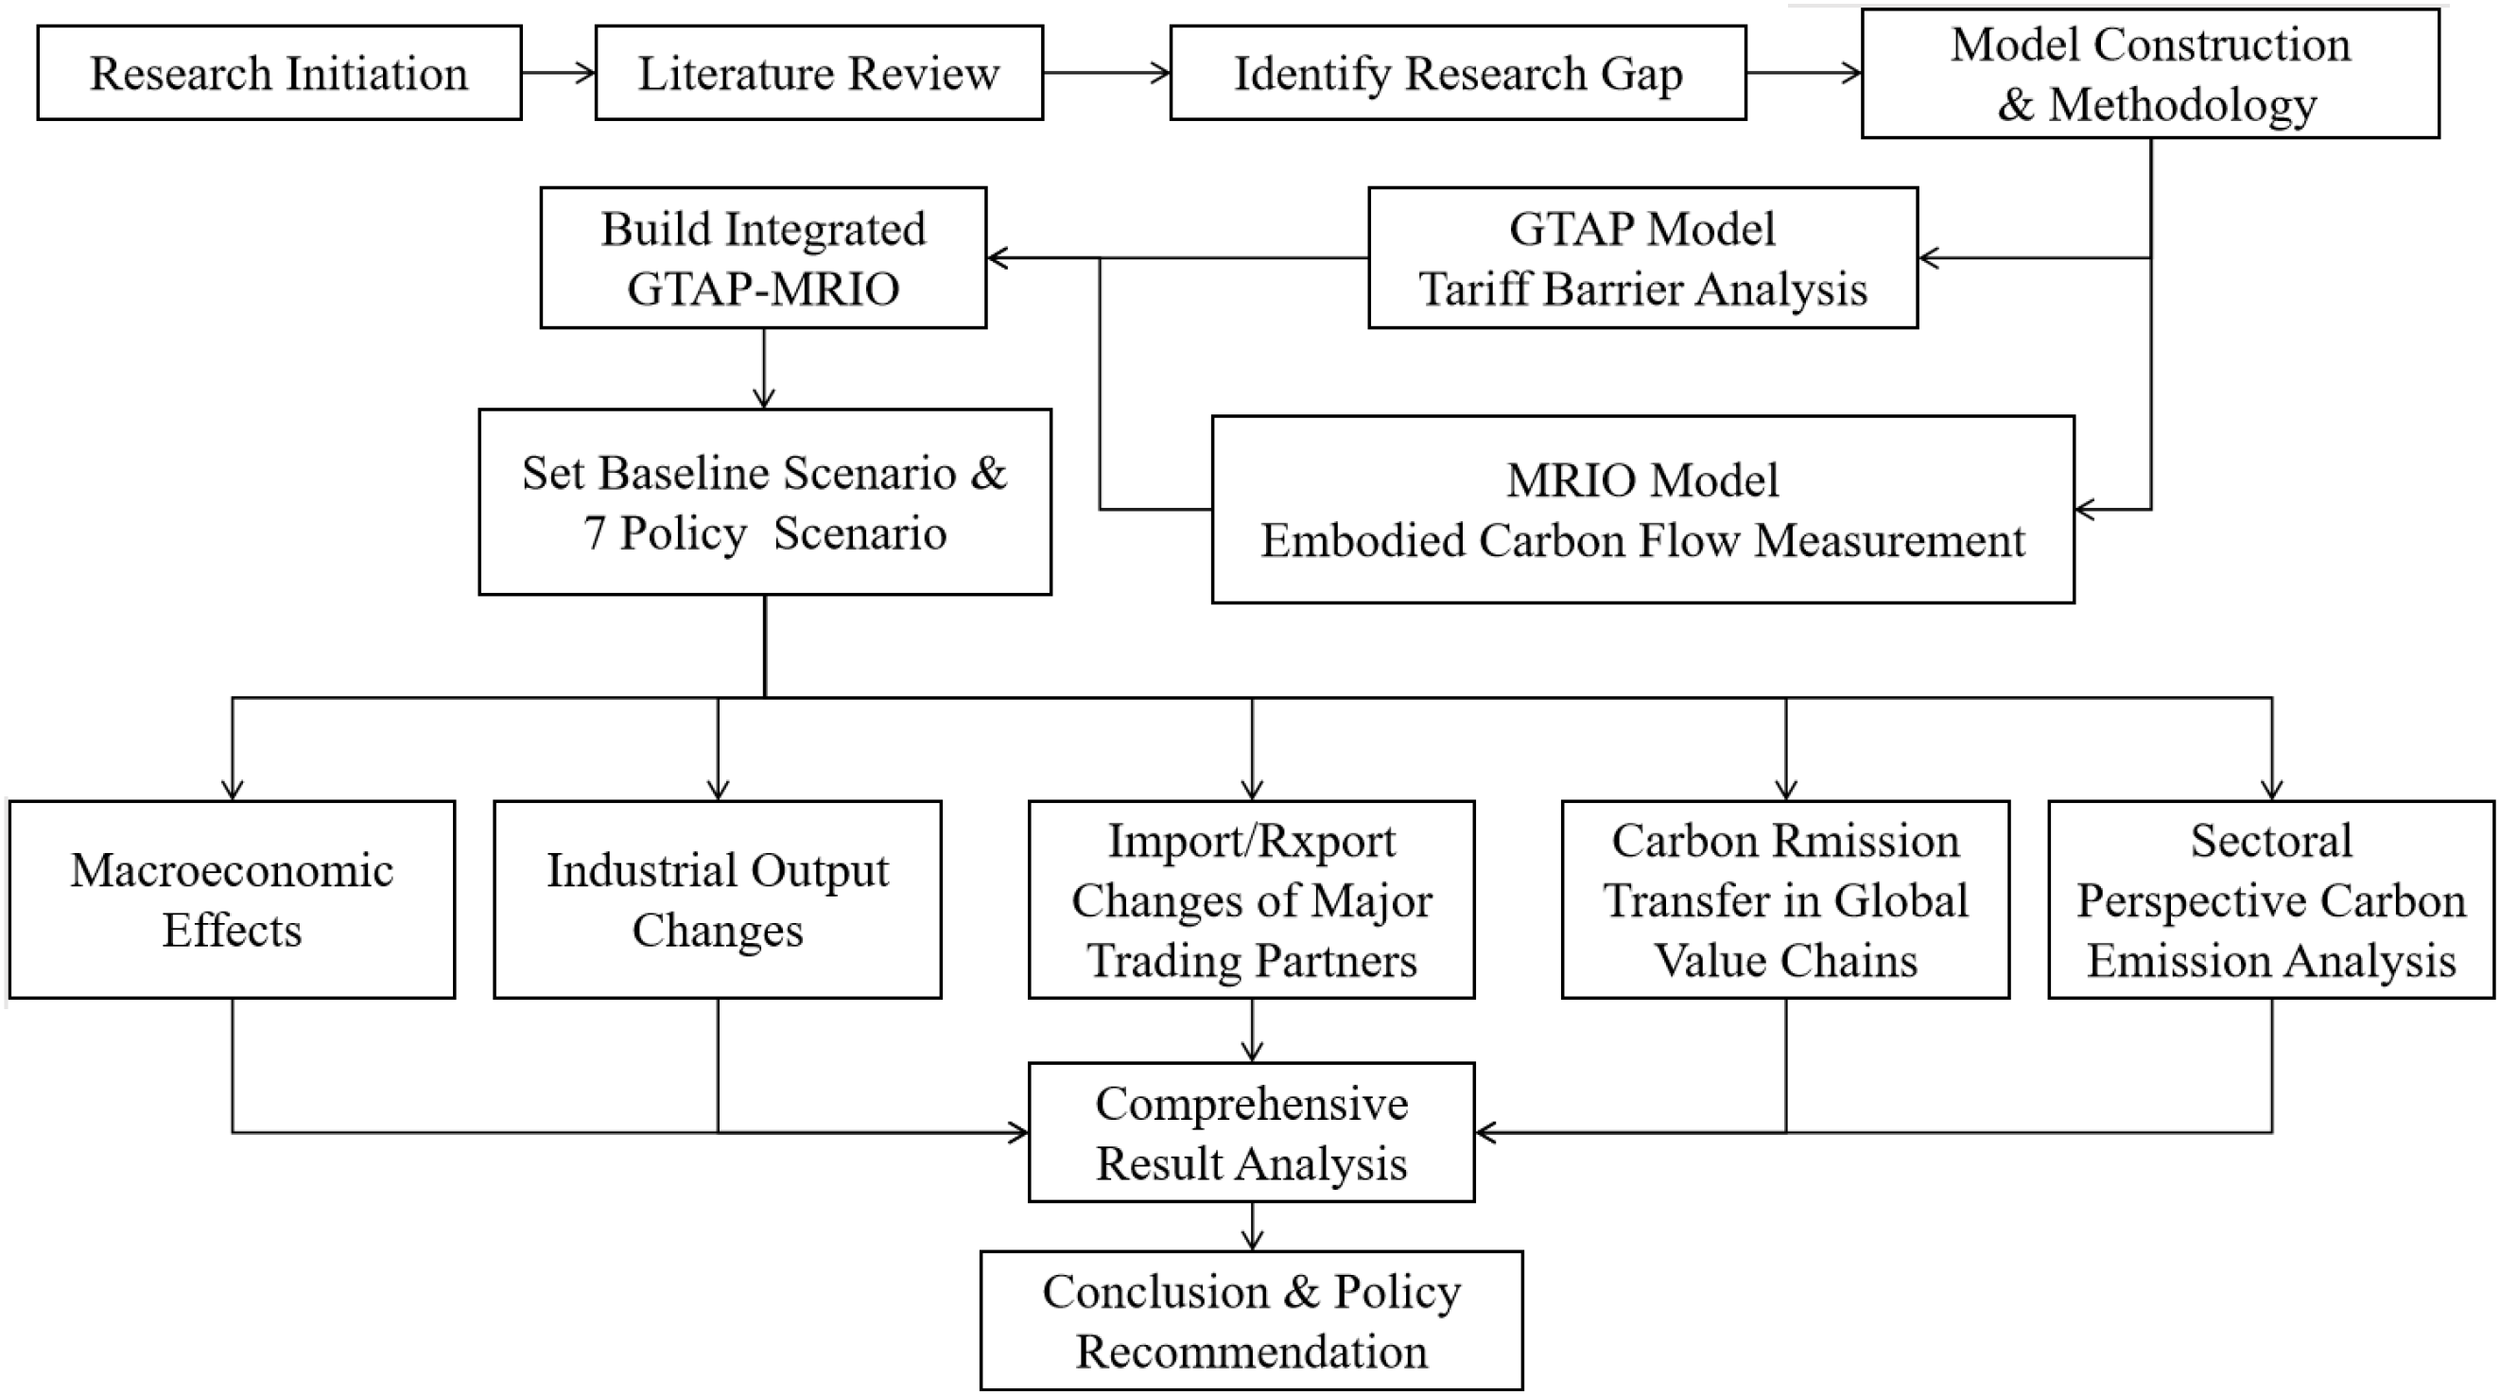
Research workflow: From GTAP-MRIO modeling and scenario design to policy impact simulation.
3.1 GTAP model tariff barrier analysis
Considering the time required for participation, negotiation, and final implementation of major international trade agreements, the time frame for this analysis is strategically set at 2030. In order to establish a forward-looking baseline scenario for this target year, the GTAP 11.0 database was extrapolated using 2017 as the base year. This extrapolation is carried out using a dynamic approach within the GTAP modeling framework, which predicts that the economy will move forward along a balanced growth path.
Specifically, the forecast data for GDP and population were sourced from the Centre d’Études Prospectives et d’Informations Internationales (CEPII) Economic Outlook Database to serve as exogenous constraints. Furthermore, the capital stock growth was calculated relative to the base period following the established methodology of Walmsley et al (Walmsley et al., 2000). By integrating these projected macroeconomic conditions, the extrapolation process ensures that the resulting 2030 baseline scenario reflects a socioeconomically consistent structure, including updated inter-sectoral input-output relationships and final demand patterns that are congruent with the overarching macroeconomic projections (Equations 1–7).
Following the method of Liu et al. (2023), the forecast data from the CEPII database and the calculated capital stocks were used as the extrapolation parameters for the model. The specific growth rates of the exogenous macroeconomic variables for each region from the base year to 2030 are presented in Table 1 below.
Table 1
| Region | Increasing rate (%) | ||||
|---|---|---|---|---|---|
| GDP | Capital stocks | Population | Unskilled labor | Skilled labor | |
| China | 121.88% | 148.25% | 3.09% | -8.80% | 46.58% |
| EU | 12.94% | 25.20% | -0.46% | -7.84% | 7.94% |
| Norway | 26.92% | 32.95% | 10.94% | 7.01% | 16.57% |
| UK | 27.31% | 28.64% | 5.63% | -0.99% | 21.21% |
| GCC | 37.80% | 71.66% | 18.87% | 10.76% | 37.34% |
| India | 186.06% | 185.70% | 12.32% | 10.05% | 59.25% |
| Eurasian Economic Union | 30.73% | 17.45% | 0.81% | -11.40% | -4.22% |
| ASEAN | 84.56% | 82.83% | 12.36% | 11.56% | 42.39% |
| US | 27.17% | 34.58% | 7.55% | -7.95% | 13.60% |
| Japan | 17.54% | 16.46% | -5.29% | -18.12% | 16.43% |
| Korea | 34.92% | 55.42% | 0.11% | -29.14% | 23.57% |
| Rest of World | 37.54% | 39.12% | 22.12% | 23.19% | 39.19% |
Macroeconomic variables used for dynamic recursion in 2017–2030 (Database: CEPII).
In Table 1, TFP is an endogenous parameter in the model. Given that the exogenous parameters are GDP, capital stocks, population, skilled labor, and unskilled labor, and considering a production function Y = F(A, K, L), where Y is output (GDP), A is technological progress (TFP), K is capital, and L is labor, since Y, K, and L are exogenously given in the model, A can be solved endogenously.
Where is the capital stock of high-tech industries and other sectors in period t, and is the capital stock in the previous period which denotes depreciation is treated at 4 percent in the reference of Walmsley et al. (2000).
Where is the FOB price of commodity i from country r to country z, and is the export price of commodity i in country r, and is the export tariff of commodity i from country r to country z, and is the CIF price of commodity i exported from country r to country z, and is the transport cost of commodity i from country r to country z. is the import price of commodity i imported by country z from country r, and is the import tariff of commodity i imported from country r by country z.
When there is zero tariff on good i between countries r and z, then
At this point, the price of commodity i exported from country r to country z within country z is equal to the domestic price in country r plus the cost of transporting commodity i between r and z.
3.2 MRIO modeling and implied carbon flow measurement
According to Peters et al. (2011) proposed method of constructing MRIO through the GTAP database, the construction of an MRIO model consisting of m countries (regions) can be expressed as (Equations 8–14):
can be abbreviated to the form of a block matrix:
Chunking Matrix A represents the world production consumption matrix, and its diagonal matrix is the mutual demand matrix between production sectors in region r, and the off-diagonal matrix is the matrix of mutual demand between production sectors in region s and production sectors in r, reflecting the consumption of output in region r for the production of unit output in region s (r, s = 1, 2, …, m). The submatrix i, j denotes the consumption of output in sector i of region r for the production of unit output in sector j of region s (i, j = 1, 2, …, n). can reflect the inputs and outputs of intermediate goods in each country. is the column vector of total final product output in each country, which can be decomposed into the output column vector of each region, where the column vector represents the output produced by each sector in the region to satisfy domestic final demand. (r≠s) represents the output produced in each sector in region r to satisfy country s. represents the column vector of the world output, where is the column vector of output by sectors in region r, which can also be decomposed into:
The standard MRIO of the formula can be decomposed to produce an input-output model for any country r:
represents the output induced in country r by final demand in country s, and when represents the output induced domestically by country r’s own final demand, and when represents the output induced domestically by foreign final demand. The calculation of carbon emissions from a country’s total output can be expressed in the following form:
Where denotes the column vector of carbon emission intensity of country r, which is calculated based on the GTAP-E11.0 data with a base year of 2017. It is assumed in this paper that the carbon emission intensities remain constant throughout the period of model simulation. The carbon emissions induced by the final demand of country s in country r are defined as the “inbound emissions” from country r to country s, while the carbon emissions induced by the final demand of country r in country s are defined as the “outbound emissions” from country r to country s (Peng et al., 2015). Then:
The core policy scenario simulated in this study is the expansion of the Belt and Road trade agreements. The key shock variable is the complete elimination of import tariffs on goods trade (i.e., tariffs reduced to zero) between the member countries of the agreement. The baseline scenario is set as the projected economic state in 2030 without any new trade agreements. The various policy scenarios (S1-S7) are then simulated by applying the corresponding tariff reduction shocks on top of this baseline.
Our study selects seven scenarios for simulation (S1-S7), based on reference to existing literature practices, primarily considering the strategic blueprint of the Belt and Road Initiative, the feasibility and actual negotiation progress of free trade zone agreements among various countries and regions, as well as the necessity of using a CGE model for counterfactual analysis (Table 2).
Table 2
| Scenario | Target region code | Shock | Policy framework |
|---|---|---|---|
| Baseline | All Regions | Business-as-usual baseline scenario for 2030 (2030BAU): Projecting economy to 2030 based on GDP growth, population, skilled labor, unskilled labor from CEPII prediction and capital stocks calculated using methodology of Walmsley et al. (2000) | |
| S1 | EU | Tariff (tms) -100% (to Zero) |
EU-China Comprehensive Agreement on Investment (CAI) (Negotiations concluded in principle, 2020); EU-China 2020 Strategic Agenda for Cooperation (2013). |
| S2 | Norway | Tariff (tms) -100% (to Zero) |
China-Norway Free Trade Agreement Negotiations (Ongoing since 2008, accelerated and memorandum signed in 2017) |
| S3 | UK | Tariff (tms) -100% (to Zero) |
UK-China Economic and Financial Dialogue (Established in 2008); UK joining AIIB as a founding member (2015). |
| S4 | GCC | Tariff (tms) -100% (to Zero) |
China-GCC Free Trade Agreement Negotiations (Ongoing since 2004, Re-energized in 2022) |
| S5 | India | Tariff (tms) -100% (to Zero) |
Bangladesh-China-India-Myanmar (BCIM) Economic Corridor (Proposed 2013, early the Belt and Road Initiative framework). |
| S6 | EEU | Tariff (tms) -100% (to Zero) |
Joint Statement on the Conjunction of the Silk Road Economic Belt and the Eurasian Economic Union (2015); Agreement on Trade and Economic Cooperation between China and the EAEU (signed in 2018 and effective 2019). |
| S7 | All above | Tariff (tms) -100% (to Zero) |
Integrated Scenario |
Scenario definitions for belt and road trade agreement expansion.
The baseline scenario represents the projected economic state for 2030 in the absence of new trade agreements. The policy scenarios are simulated by applying the tariff elimination shocks described above to this baseline. Within the GTAP model, these tariff shocks are implemented by altering the import tariff rate in Equation 4.
Including developed economies such as the European Union, the United Kingdom, and Norway in the simulation scenarios aligns with the current situation of the Belt and Road Initiative transitioning to a “high-quality development” stage that emphasizes technical standard cooperation and trade in services. Although the conclusion of the China-EU Comprehensive Agreement on Investment (CAI) faces challenges, simulating deep China-EU integration is crucial for understanding the potential for global technology diffusion (Herrero and Xu, 2017). Zhou et al. (2019) have explored the question of when and how China and the EU might initiate free trade agreement negotiations. Jackson and Shepotylo (2021), in their study of the welfare gains brought by the Belt and Road Initiative and their combination with other trade integration schemes, employed a general equilibrium model to simulate the signing and implementation of a deep China-EU Free Trade Agreement. Since the establishment of the EU-China Comprehensive Strategic Partnership in 2003, China and the EU have deepened cooperation across a wide range of areas, forming a high degree of interdependence. The two sides jointly adopted the EU-China 2020 Strategic Agenda for Cooperation and reached an agreement in principle on the Comprehensive Agreement on Investment on December 30, 2020.
Free trade agreement negotiations between China and Norway began in 2008, and a memorandum on resuming Free trade agreement negotiations was signed in 2017. The two economies are highly complementary. Resuming and advancing Free trade agreement negotiations will deepen mutually beneficial bilateral cooperation, directly benefiting enterprises and people in both countries. Norway’s participation in the Belt and Road Initiative holds strong feasibility.
China and the UK established the UK-China Economic and Financial Dialogue mechanism as early as 2008, and it has been operating continuously to this day. The academic community pays considerable attention to the welfare effects and environmental impacts of China-UK economic and trade relations. Li and Hewitt (2008), in their study on international trade and global carbon emissions, identified from the perspective of China-UK bilateral trade that the transfer of production processes caused by international trade may lead to increased global carbon emissions. De Lyon and Pessoa (2021) focused on the impact of trade shocks between China and the UK on worker and firm welfare. In March 2015, the UK officially became a founding member of the China-initiated Asian Infrastructure Investment Bank (AIIB). Incorporating the UK into the simulation scenarios holds significant importance, both theoretically and practically.
The simulation scenario concerning the Gulf Cooperation Council (GCC) in this article focuses on the Belt and Road Initiative's exploration in energy and strategic partnerships. It mainly considers the realistic background of accelerating negotiations for the China-GCC Free Trade Agreement, especially taking the 2022 China-GCC Summit as a key juncture. In 2020, China replaced the EU as the GCC’s largest trading partner. In 2023, GCC exports to China were approximately 173billion, and imports from China were approximately 129 billion. The China-GCC free trade agreement negotiations, aimed at reducing trade barriers, have been ongoing since their launch in 2004. As of October 2025, after more than two decades of negotiations, China and the GCC have reached consensus on about 90% of the clauses, with the final signing of the agreement at a critical “last-step” stage.
The “Bangladesh-China-India-Myanmar Economic Corridor” (BCIM) is one of the six major corridors in the early framework of the Belt and Road Initiative. However, fluctuations in China-India relations have hindered the progress of the BCIM. Considering the India scenario will facilitate opportunity cost analysis of geo-economic policies. Following the standard methodology for evaluating “opportunity costs” in GTAP (Zhai, 2018), simulating India’s participation enables this study to quantify the potential welfare losses caused by geopolitical factors and provide a theoretical benchmark for South Asian regional integration. Moreover, as one of the six corridors in the early the Belt and Road Initiative framework, the possibility of India joining the BRI still exists, and its potential impact remains highly valuable for research. The academic community has not ceased discussions on China-India trade relations. Wang and Yang (2020) studied the temporal changes and their driving factors in carbon emissions from China-India trade from 2000 to 2015. Sun et al. (2018) conducted an input-output analysis (IOA) on China-India manufacturing trade and proposed that China-India energy cooperation is necessary and has broad prospects. Pradhan et al. (2017) used a CGE model to compare the effects of China’s and India’s carbon pricing policies under the influence of terms of trade.
The expansion of the Eurasian Economic Union (EAEU) is a future phased goal and a mark of significant achievement for the Belt and Road Initiative. The EAEU came into effect on January 1, 2015, aiming to ensure the free movement of goods, services, capital, and labor within the region. On May 8, 2015, China and Russia signed a joint statement in Moscow on linking the development of the EAEU with the Belt and Road Initiative. The Eurasian integration project and the Silk Road Economic Belt project are highly complementary. Building on this, the Agreement on Economic and Trade Cooperation between the Eurasian Economic Union and the People’s Republic of China was signed on May 17, 2018, and officially entered into force on October 25, 2019.
3.3 Country and industry divisions
The selected economies in this study scenario design represent typical cases that are at different stages of negotiation (such as conducting feasibility studies or formal talks), have different economic scales and resource endowments, and maintain close trade relations with China, including the European Union (EU), Norway, the United Kingdom, the Gulf Cooperation Council (GCC), India, and the Eurasian Economic Union (EEU). Scenarios S1 to S6 mainly analyze the independent impact of each major economy joining the agreement separately, while Scenario S7 (where all the aforementioned economies join simultaneously) evaluates the synergistic effects and overall impact of large-scale expansion of the agreement. This “representative case” selection method is widely adopted in policy simulation studies, as it effectively captures the influence of key individual actors. We acknowledge the advantages of orthogonal design for analyzing multi-factor interactions; however, since this study focuses on evaluating the holistic impact of the specific policy event of certain economies joining the agreement, the current scenario-setting approach was employed. The countries/regions in the GTAP 11.0 database are reclassified into 12 economies, namely China, the EU, Norway, the UK, India, the GCC, the EEU, the Association of Southeast Asian Nations (ASEAN), the US, Japan, South Korea, and the rest of the world, see Table 3. Table 4 provides the full names of all countries and regions in Table 3. The regional aggregation follows the structure of the GTAP 11.0 database.
Table 3
| Region | Comprising |
|---|---|
| China | chn |
| EU (The European Union) | aut bel bgr hrv cyp cze dnk est fin fra deu grc hun irl ita lva ltu lux mlt nld pol prt Eurou svk svn esp swe |
| Norway | nor |
| UK (The United Kingdom) | gbr |
| GCC (The Gulf Cooperation Council) | bhr kwt omn qat sau are |
| India | ind |
| EEU (The Eurasian Economic Union) | blr kaz kgz arm rus |
| ASEAN (The Association of Southeast Asian Nations) | brn khm idn lao mys phl sgp tha vnm |
| USA (The United States of America) | usa |
| Japan | jpn |
| Korea | kor |
| Rest of world | aus nzl xoc mng xea xse afg bgd npl pak lka xsa can mex xna arg bol bra chl col ecu pry per ury ven xsm cri gtm hnd nic pan slv xca dom hti jam pri tto xcb che xef alb srb ukr xee xer tjk uzb xsu aze geo irn irq isr jor lbn pse syr tur xws dza egy |
Division of countries.
Table 4
| Region code | Comprising countries/regions (Full names) |
|---|---|
| China | China |
| EU (The European Union) | Austria, Belgium, Bulgaria, Croatia, Cyprus, Czech Republic, Denmark, Estonia, Finland, France, Germany, Greece, Hungary, Ireland, Italy, Latvia, Lithuania, Luxembourg, Malta, Netherlands, Poland, Portugal, Romania, Slovakia, Slovenia, Spain, Sweden |
| Norway | Norway |
| UK (The United Kingdom) | United Kingdom |
| GCC (The Gulf Cooperation Council) | Bahrain, Kuwait, Oman, Qatar, Saudi Arabia, United Arab Emirates |
| India | India |
| EEU (The Eurasian Economic Union) | Belarus, Kazakhstan, Kyrgyzstan, Armenia, Russian Federation |
| ASEAN (The Association of Southeast Asian Nations) | Brunei Darussalam, Cambodia, Indonesia, Lao People’s Democratic Republic, Malaysia, Myanmar, Philippines, Singapore, Thailand, Viet Nam |
| USA (The United States of America) | United States of America |
| Japan | Japan |
| Korea | Republic of Korea (South Korea) |
| Rest of world | This group aggregates a large number of economies. A comprehensive list is provided below: Oceania: Australia, New Zealand, Other Oceania East Asia: Mongolia, Other East Asia Southeast Asia: Rest of Southeast Asia South Asia: Afghanistan, Bangladesh, Nepal, Pakistan, Sri Lanka, Rest of South Asia North America: Canada, Mexico, Rest of North America South America: Argentina, Bolivia, Brazil, Chile, Colombia, Ecuador, Paraguay, Peru, Uruguay, Venezuela, Rest of South America Central America: Costa Rica, Guatemala, Honduras, Nicaragua, Panama, El Salvador, Rest of Central America Caribbean: Dominican Republic, Haiti, Jamaica, Puerto Rico, Trinidad and Tobago, Rest of Caribbean Europe: Switzerland, Rest of EFTA, Albania, Serbia, Ukraine, Rest of Eastern Europe, Rest of Europe Former Soviet Union: Tajikistan, Uzbekistan, Rest of Former Soviet Union Middle East: Azerbaijan, Georgia, Iran, Iraq, Israel, Jordan, Lebanon, Palestine, Syria, Türkiye, Rest of Western Asia Africa: Algeria, Egypt, Rest of North Africa, Rest of Africa |
Full list of countries/regions in regional aggregations.
This study simulates a total of seven scenarios as follows: S1: The EU signs a Belt and Road trade agreement with China; S2: Norway signs a Belt and Road trade agreement with China; S3: The UK signs a Belt and Road trade agreement with China; S4: The GCC signs a Belt and Road trade agreement with China; S5: India signs a Belt and Road trade agreement with China; S6: The EEU signs a Belt and Road trade agreement with China; S7: The EU, Norway, the UK, the GCC, India, and the EEU simultaneously sign Belt and Road trade agreements with China.
Regarding industry classification, this paper integrates the practices of technology-intensive industry classification in the existing literature. Currently, scholars use varying criteria for classifying high-tech industries. Ma et al. (2024) qualitatively discern technology-intensive industries within the high-tech manufacturing sector, defined by the utilization of contemporary advanced and cutting-edge technologies. More specifically, the definition of technology-intensive industries has evolved and can vary by analytical framework. For instance, a traditional classification within the manufacturing sector often encompasses sectors such as electronics, pharmaceuticals, chemicals, machinery, and transportation equipment. A more contemporary and detailed stratification, as seen in frameworks like the Beijing High-Tech Industries Relationship Network (HTIRN-BJ), further refines the high-tech sector into ten distinct sub-industries: New Generation Information Technology, Integrated Circuits, Pharmaceuticals and Health, Intelligent Equipment, Energy Conservation and Environmental Protection, New Energy and Intelligent Vehicles, New Materials, Artificial Intelligence, Software and Information Services, and Science and Technology Services. This categorization reflects a nuanced approach to understanding the complex dynamics within the high-tech manufacturing landscape. The definition of technology-intensive industries by the Organization for Economic Cooperation and Development (OECD) and the classification by the National Bureau of Statistics of China are roughly similar. Qu and Zhao (2022) have amalgamated global standards with the Chinese context to delineate the technology industry, which includes the following sectors: manufacturing of chemical raw materials and chemical products, pharmaceuticals, chemical fibers, general machinery, specialized equipment, transportation equipment, electronic and instrumental apparatus, as well as electronic and communication equipment, and office machinery.
This classification reflects a comprehensive approach to the technology industry within the Chinese economic framework. In addition to the manufacturing sector, the definition of the technical services sector is also indispensable. The domain of the new generation information technology sector encompasses key areas such as big data analytics, cloud computing services, artificial intelligence, and other related IT services and manufacturing endeavors. This burgeoning segment is instrumental in facilitating the transformation and upgrading of the broader manufacturing industry, thereby enhancing its competitiveness and innovation capacity. The existing literature is not representative enough to select only one industry as a technology-intensive industry. It is imperative to consider not only the classification criteria for technology-intensive industries in China, but also to align with international standards. Moreover, there are few studies that include technology-centric service industries within the classification of technology-intensive industries. This paper, therefore, reclassifies certain industries from the 65 sectors in the GTAP 11.0 database as technology-intensive, based on the “High-Tech Industry Statistical Classification” by the National Bureau of Statistics of China (2002), the United Nations “International Standard Industrial Classification of All Economic Activities”, and the “High-Tech Industry (Manufacturing) Classification (2017)” and “High-Tech Industry (Service Industry) Classification (2018)” by the National Bureau of Statistics of China. The classification of other industries remains consistent with GTAP. For specific classifications, see Table 5.
Table 5
| Sector | Description |
|---|---|
| Farming, Forestry, Husbandry and Fishing (Agr) | Paddy rice; Wheat; Cereal grains nec; Vegetables, fruit, nuts; Oil seeds; Sugar cane, sugar beet; Plant-based fibers; Crops nec; Bovine cattle, sheep and goats; Animal products nec; Raw milk; Wool, silk-worm cocoons; Forestry; Fishing. Crops nec; Bovine cattle, sheep and goats; Animal products nec; Raw milk; Wool, silk-worm cocoons; Forestry; Fishing. |
| Coal (Coal) | Coal. |
| Crude Oil (Oil) | Crude oil |
| Gas, Gas manufacture distribution (Gas) | Gas; Gas manufacture, distribution. |
| Petroleum, coal products (Oil_pcts) | Petroleum, coal products. |
| Electricity (Electricity) | Electricity. |
| Technology intensive industry (Tec_int_ind) | Basic pharmaceutical products; Computer, electronic and optic; Electrical equipment; Machinery and equipment nec; Motor vehicles and parts. Transport equipment nec; Air transport; Communication; Financial services nec. |
| Energy intensive industry (En_int_ind) | Minerals nec; Chemical products; Rubber and plastic products; Mineral products nec; Ferrous metals; Metals nec. |
| Other industries & service (Oth_ind_ser) | Bovine meat products; Meat products nec; Vegetable oils and fats; Dairy products; Processed rice; Sugar; Food products nec; Beverages and tobacco products; Textiles; Wearing apparel; Leather products; Wood products; Paper products, publishing; Metal products; Manufactures nec; Water. Construction; Trade; Accommodation, food and servic; Transport nec; Water transport; Warehousing and support activi; Insurance; Real estate activities; Business services nec; Recreational and other service; Public Administration and defe; Education; Human health and social work a; Dwellings. Dwellings. |
Division of industries.
It is important to note that in the current sectoral aggregation, sectors closely related to port logistics, such as “Water transport” and “Warehousing and support activities” from the GTAP database, are grouped into the composite category “Other industries & services (Oth_ind_ser).” While this aggregation does not allow for the precise quantification of emissions specifically at port nodes, changes in the carbon intensity of this composite sector can effectively reflect the trends in carbon emissions from overall logistics activities, including port-related operations, driven by trade expansion.
4 Analysis of simulation results
4.1 Analysis of China’s macroeconomic effects
This paper analyzes the impact of the expansion of the Belt and Road trade agreement on China’s macroeconomy. The results presented in Table 6 indicate that in Scenario 1, the EU accession to the Belt and Road trade agreement exerts a negative impact on China’s macroeconomy. China’s terms of trade deteriorate by 12.97%, GDP is reduced by 0.68%, and social welfare decreases by $13,128.64 million. However, domestic output increases by 0.70%, total export volume rises by 17.72%, and total import volume increases by 2.15%. Following the EU’s accession, demand for goods from China’s manufacturing sector is expected to increase, driving growth in exports and domestic output. Concurrently, China’s import demand from the EU, which is heavily comprised of high-end products with originally high tariffs, will rise as a result of reduced tariff barriers, leading to an increase in total import volume.
Table 6
| Index | S1 | S2 | S3 | S4 | S5 | S6 | S7 |
|---|---|---|---|---|---|---|---|
| GDP(%) | -0.68 | 0.00 | -0.14 | 1.42 | 0.40 | 4.44 | 2.82 |
| Terms of trade(%) | -12.97 | 0.01 | -0.02 | 2.13 | 0.26 | 1.55 | 3.32 |
| Social welfare (million$) |
-1312868.38 | 691.58 | 5907.31 | 126182.01 | 1112.74 | -94704.6 | 141451.11 |
| Domestic output(%) | 0.70 | 0.00 | -0.04 | -0.05 | 0.00 | 1.55 | 0.16 |
| Export(%) | 17.72 | 0.05 | -0.64 | -1.94 | 0.16 | 19.82 | -8.39 |
| Import(%) | 2.15 | 0.03 | 0.22 | 1.98 | 0.38 | 1.26 | 14.78 |
S1-S7 China’s macroeconomic impact assessment.
In Scenario 2, Norway’s accession to the Belt and Road trade agreement has a positive but minimal effect on China’s economy because of its smaller economic size and trade volume with China. The terms of trade improve by 0.01%, total export volume grows by 0.03%, total import volume increases by 0.05%, domestic production rises, and social welfare increases by $69.16 million.
In Scenario 3, the UK accession to the Belt and Road trade agreement results in a 0.22% increase in China’s total import volume and a social welfare increase of $590.73 million. However, China’s terms of trade worsen by 0.02%, total export volume declines by 0.64%, and imports from the UK displace domestic industries that lack comparative advantage and were previously protected by tariff barriers, leading to a 0.04% reduction in domestic production and a 0.14% decrease in GDP.
In Scenario 4, the accession of the GCC to the Belt and Road trade agreement improves China’s terms of trade by 2.13%. China’s imports from the GCC are primarily energy products such as oil and natural gas, and steel products. According to data from China’s General Administration of Customs for 2022, China’s crude oil imports from GCC countries account for over 41% of its total crude oil imports. With a stable demand for energy products, further reduction in tariff barriers is expected to significantly increase China’s imports of energy products from GCC countries, leading to a 1.98% increase in total import volume, a 1.42% increase in GDP, and a social welfare increase of $12,618.20 million. However, the total export volume decreases by 1.94%, and domestic output is reduced by 0.05%.
In Scenario 5, India’s accession to the Belt and Road trade agreement improves China’s terms of trade by 0.26%. China mainly imports labor-intensive products from India, and the reduction in tariff barriers makes these products cheaper and more in demand in China. India’s imports from China involve various industrial sectors, resulting in an increase in China’s import and export volumes by 0.38% and 0.16%, respectively, a 0.40% rise in GDP, and a social welfare increase of $111.27 million.
In Scenario 6, the EEU accession to the Belt and Road trade agreement improves China’s terms of trade by 1.55%, with import and export volumes rising by 19.82% and 1.26%, respectively. Domestic output increases by 1.55%, and GDP rises by 4.44%. However, social welfare decreases by $947.05 million. This may be attributable to China’s imports from Russia, primarily energy resources such as oil and natural gas, and mineral resources, which are mainly used in energy-intensive industries. The reduction in tariff barriers implies a decrease in energy product prices and costs for energy-intensive industries, leading more producers to enter or expand in energy-intensive industries, displacing the output of high value-added industries such as technology-intensive industries and services, and ultimately resulting in an increase in domestic output but a decrease in product value-added and a reduction in social welfare.
In Scenario 7, with the simultaneous accession of the EU, Norway, the UK, the GCC, India, and the EEU to the Belt and Road trade agreement, the simulation results show an improvement of 3.32% in China’s terms of trade, a 14.78% increase in total import volume, and an 8.39% decrease in total export volume. Some domestic industries will obtain cheaper energy and mineral resources from the EEU and cheaper intermediate products of technology-intensive industries from the EU, thereby expanding production scale. Other domestic industries’ output will be replaced by imported products, reducing production scale. As a result, domestic output increases by 0.16%, and GDP rises by 4.44%. Social welfare increases by $14,145.11 million.
4.2 Analysis of changes in industrial output
Next, this paper analyzes the impact of the expansion of the Belt and Road trade agreements on the output of various industries in China. The results presented in Table 7 illustrate the impact of the Belt and Road trade agreement expansion on China’s industrial output under various scenarios. In Scenario 1, with the EU’s accession, there is a notable increase in the output of China’s coal, petroleum, natural gas, petrochemical products, and technology-intensive industries by 6.02%, 51.29%, 1.91%, 21.30%, and 46.38%, respectively.
Table 7
| Sector | S1 | S2 | S3 | S4 | S5 | S6 | S7 |
|---|---|---|---|---|---|---|---|
| Agr(%) | -1.5 | -0.01 | -0.08 | 0.05 | -0.01 | 1.34 | -1.47 |
| Coal(%) | 6.02 | -0.02 | -0.06 | -0.1 | -0.22 | -17.55 | 0.5 |
| Oil(%) | 51.29 | -0.45 | 0.05 | 0.19 | 0.69 | -150.09 | -6.23 |
| Gas(%) | 1.91 | -0.04 | 0.1 | 0.15 | -0.1 | -0.82 | 1.25 |
| Oil_pcts(%) | 21.3 | -0.04 | 0.07 | 3.49 | -0.01 | -67.36 | -0.51 |
| Electricity(%) | -6.9 | -0.03 | 0.05 | 0.63 | 0.01 | -0.9 | -0.16 |
| Tec_int_ind(%) | 46.38 | -0.17 | 2.15 | -4.11 | -0.71 | -43.64 | 1.47 |
| En_Int_ind(%) | -20.14 | 0.5 | -1.68 | -2.69 | -0.02 | 0.82 | 67.07 |
| Oth_ind_ser(%) | -4.87 | 0 | -0.19 | 0.61 | 0.09 | 5.31 | -2.47 |
Changes in output by industry in China.
In Scenario 2, Norway’s entry into the Belt and Road initiative has a minimal impact on China’s industrial output because of its smaller economic scale and trade volume. However, there is a discernible increase of 0.50% in the output of energy-intensive industries, which correlates with China’s predominant export of such products to Norway. Conversely, the output of technology-intensive industries decreases by 0.17%, likely because of the competitive nature of China’s imports from Norway in these sectors. In addition, the expansion of seaborne trade routes between China and Northern Europe may further stimulate maritime logistics and port-related service activities, indirectly contributing to output growth in the transportation and warehousing sectors.
In Scenario 3, with the UK’s accession, there is an uptick in the output of petroleum, natural gas, petrochemical products, and the electricity sector, potentially linked to the primary categories of China’s exports to the UK. The output of China’s technology-intensive industries rises by 2.15%, indicating enhanced market competitiveness in the UK post tariff reduction. However, there is a 1.68% decline in the output of energy-intensive industries.
In Scenario 4, with the GCC’s accession, output in agriculture, forestry, animal husbandry, fishing, petrochemicals, and services increases to meet the growing export demand. Imported products from the GCC displace some domestic output, leading to a 4.11% and 2.69% decrease in the output of technology-intensive and energy-intensive industries, respectively.
In Scenario 5, India’s accession results in a slight decline of 0.02% and 0.71% in the output of energy-intensive and technology-intensive industries, respectively.
Scenario 6 reflects the actual signing of the Belt and Road trade agreement between China and the EEU on May 17, 2018, which came into effect in 2019. The agreement primarily aims to reduce nontariff barriers in trade. However, assuming the EEU’s accession to the Belt and Road trade agreement and a reduction in tariff barriers, the simulation shows a decrease in the output of coal, petroleum, natural gas, petrochemical products, and electricity. This is attributed to the displacement of domestic production by increased energy imports from the EEU at lower prices. The output of energy-intensive industries increases by 0.82%, while the output of technology-intensive industries plummets by 43.64%. This could be due to the allocation of more production resources to energy-intensive industries, leading to the phenomenon of low value-added industries “displacing” high value-added industries, and also due to the substitution of domestic output by technological products imported from the EEU.
In Scenario 7, with the accession of the EU, Norway, the UK, the GCC, India, and the EEU to the Belt and Road trade agreement, there is an overall increase in the output of natural gas, petrochemical products, electricity, energy-intensive industries, services, and other industries. However, crude oil output decreases by 5.33% due to substitution of crude oil imports from the GCC and the EEU. The output of technology-intensive industries declines by 8.91%, partly due to insufficient competitiveness of some technology-intensive products. Post tariff reduction, imported products from the EU, the UK, and the EEU may displace this output, and there may also be displacement by low value-added industries from other domestic industries following the input of energy at lower costs. Moreover, the projected increase in cross-border trade volumes under these scenarios implies higher demand for maritime transport services, suggesting that the shipping and port sectors could experience parallel output expansion.
4.3 Analysis of changes in China’s imports and exports with major trading partner countries
When analyzing the economic benefits of the expansion of the Belt and Road trade agreement, it is essential to consider not only the macroeconomic and industrial changes in China, but also the economic shifts of China’s closely related trade partners. Based on data from the General Administration of Customs of China for the period January to August 2023, this paper focuses on the trade volume changes of the five largest trading partners with China, which include two members of the Belt and Road trade agreement expansion: the EU and the EEU; two members of the Belt and Road trade agreement who have signed the RCEP agreement: the ASEAN and Japan; and a country that has not achieved regional economic integration with China: the USA. Given that a substantial share of these trade flows relies on maritime transport, the expansion of the Belt and Road trade agreements is expected to intensify shipping activities and port throughput across major sea routes connecting China with Europe and Asia.
The simulated changes in trade flows under Scenario 7 are comprehensively presented in Table 8, which details the percentage changes in China’s imports and exports with these key partners across major sectors.
Table 8
| Sector | Changes in China’s export to major trading partners (%) | Changes in China’s import from major trading partners (%) | ||||||||
|---|---|---|---|---|---|---|---|---|---|---|
| EU | EEU | ASEAN | USA | Japan | EU | EEU | ASEAN | USA | Japan | |
| Agr | 91.97 | 200.78 | 13.14 | 28.47 | 24.00 | 6.08 | -31.20 | 13.78 | -2.71 | 14.16 |
| Oil pcts | -52.95 | 133.53 | -25.65 | 0.24 | -31.78 | 18.13 | -9.54 | 29.99 | 17.27 | 34.74 |
| Tec_int_ind | 29.65 | 35.22 | 131.74 | -60.15 | -13.60 | -259.98 | 61.59 | -119.64 | 155.09 | -168.28 |
| En_Int_ind | 445.44 | -1538.56 | -153.84 | -902.87 | 1839.83 | 1661.46 | 919.58 | 1778.33 | 603.76 | -77.87 |
| Oth_ind_ser | -10.79 | -100.36 | 184.11 | -21.48 | -7.24 | 4.28 | 14.16 | -10.56 | -4.61 | -14.77 |
S7 Changes in the scale of China’s imports and exports with major trading partners.
In Scenario 7, China’s exports to the EU in the farming, forestry, husbandry, and fishing sectors (agriculture), as well as in technology-intensive and energy-intensive industries, have grown by 91.97%, 29.65%, and 445.44%, respectively. Conversely, imports of technology-intensive products from the EU have decreased by 259.58%. China’s exports to the EEU in the same sectors have increased by 200.78%, 133.53%, and 35.22%, respectively, while exports of energy-intensive products have significantly contracted by 1538.56%. Imports of energy-intensive products from the EEU have dramatically increased by 919.58%. Additionally, China’s imports of technology-intensive products, other industries & service products from the EEU have risen by 61.59% and 14.16%, respectively. The trade changes between China and the EEU reflect a stable and complementary import and export structure. These shifts are likely to translate into increased containerized maritime trade between China and ASEAN ports, reinforcing the strategic importance of maritime logistics corridors such as the South China Sea and the Malacca Strait.
China’s exports to ASEAN in the agriculture sector, technology-intensive industries, and other industries and services have increased by 13.14%, 131.74%, and 184.11%, respectively, while exports of petrochemical products and energy-intensive products have decreased by 25.65% and 153.84%, respectively. Imports from ASEAN in the agriculture sector, petrochemical products, and energy-intensive products have increased by 13.78%, 29.99%, and 1778.33%, respectively. Meanwhile, imports of technology-intensive products, other industries, and service products have decreased by 119.64% and 10.56%, respectively. This aligns with China’s trade characteristics of primarily importing agricultural, petrochemical, and energy-intensive products from ASEAN countries and exporting technology-intensive and service products to them. Moreover, the diversification of China’s export destinations under the Belt and Road framework could reshape trans-Pacific shipping patterns, potentially reducing long-haul routes to the US while increasing intra-Asian maritime traffic.
China’s agriculture and petrochemical products exports have increased by 28.47% and 0.24%, respectively. However, exports of technology-intensive products, energy-intensive products, other industries & service products have significantly decreased by 60.15%, 902.87%, and 21.48%, respectively. This may be due to the substitutability of the US market and the Belt and Road countries, where exports to these countries have encroached upon exports to the US. Imports from the US in petrochemical products, technology-intensive products, and energy-intensive products have increased by 17.27%, 155.09%, and 603.76%, respectively, possibly due to the comparative advantage of these US products in the international market and China’s increased imports of intermediate goods to meet trade demands with Belt and Road countries. Imports of agriculture, forestry, animal husbandry, and fishery sectors, other industries, and services from the US have decreased by 2.71% and 4.61%, respectively.
China’s exports to Japan in the agriculture sector and in the energy-intensive products sector have increased by 24.00% and 1839.83%, respectively, benefiting from the reduced production costs in China’s energy-intensive industries following the accession of economies such as the EEU to the Belt and Road trade agreement and the reduction of tariff barriers between China and Japan under the RCEP agreement. Exports of petrochemical products, technology-intensive products, other industries, and service products to Japan have decreased by 31.78%, 13.60%, and 7.24%, respectively, likely due to the displacement of exports to Japan by exports to other Belt and Road economies such as the EEU. Imports from Japan in the agriculture sector, and petrochemical products have increased by 14.16% and 34.74%, respectively, while imports of technology-intensive, energy-intensive, other industries, and service products have decreased by 168.28%, 77.87%, and 14.77%, respectively, indicating that products from other Belt and Road countries can substitute effectively for Japanese products. Such structural adjustments in regional trade also imply a reconfiguration of maritime logistics networks, with greater port activity expected along East Asian and Eurasian shipping corridors.
4.4 Carbon emission transfer from a global industry chain perspective
In Scenario S7, the total carbon emissions of 12 countries and regions reached 42,496.75 Mt - . To more clearly illustrate the immediate impact of the trade agreement expansion, we established a comparative baseline. Figure 2 presents the total carbon emissions under the policy scenario of the trade agreement expansion (S7) in 2030, compared against the 2030BAU (i.e., with no new trade agreements).
Figure 2
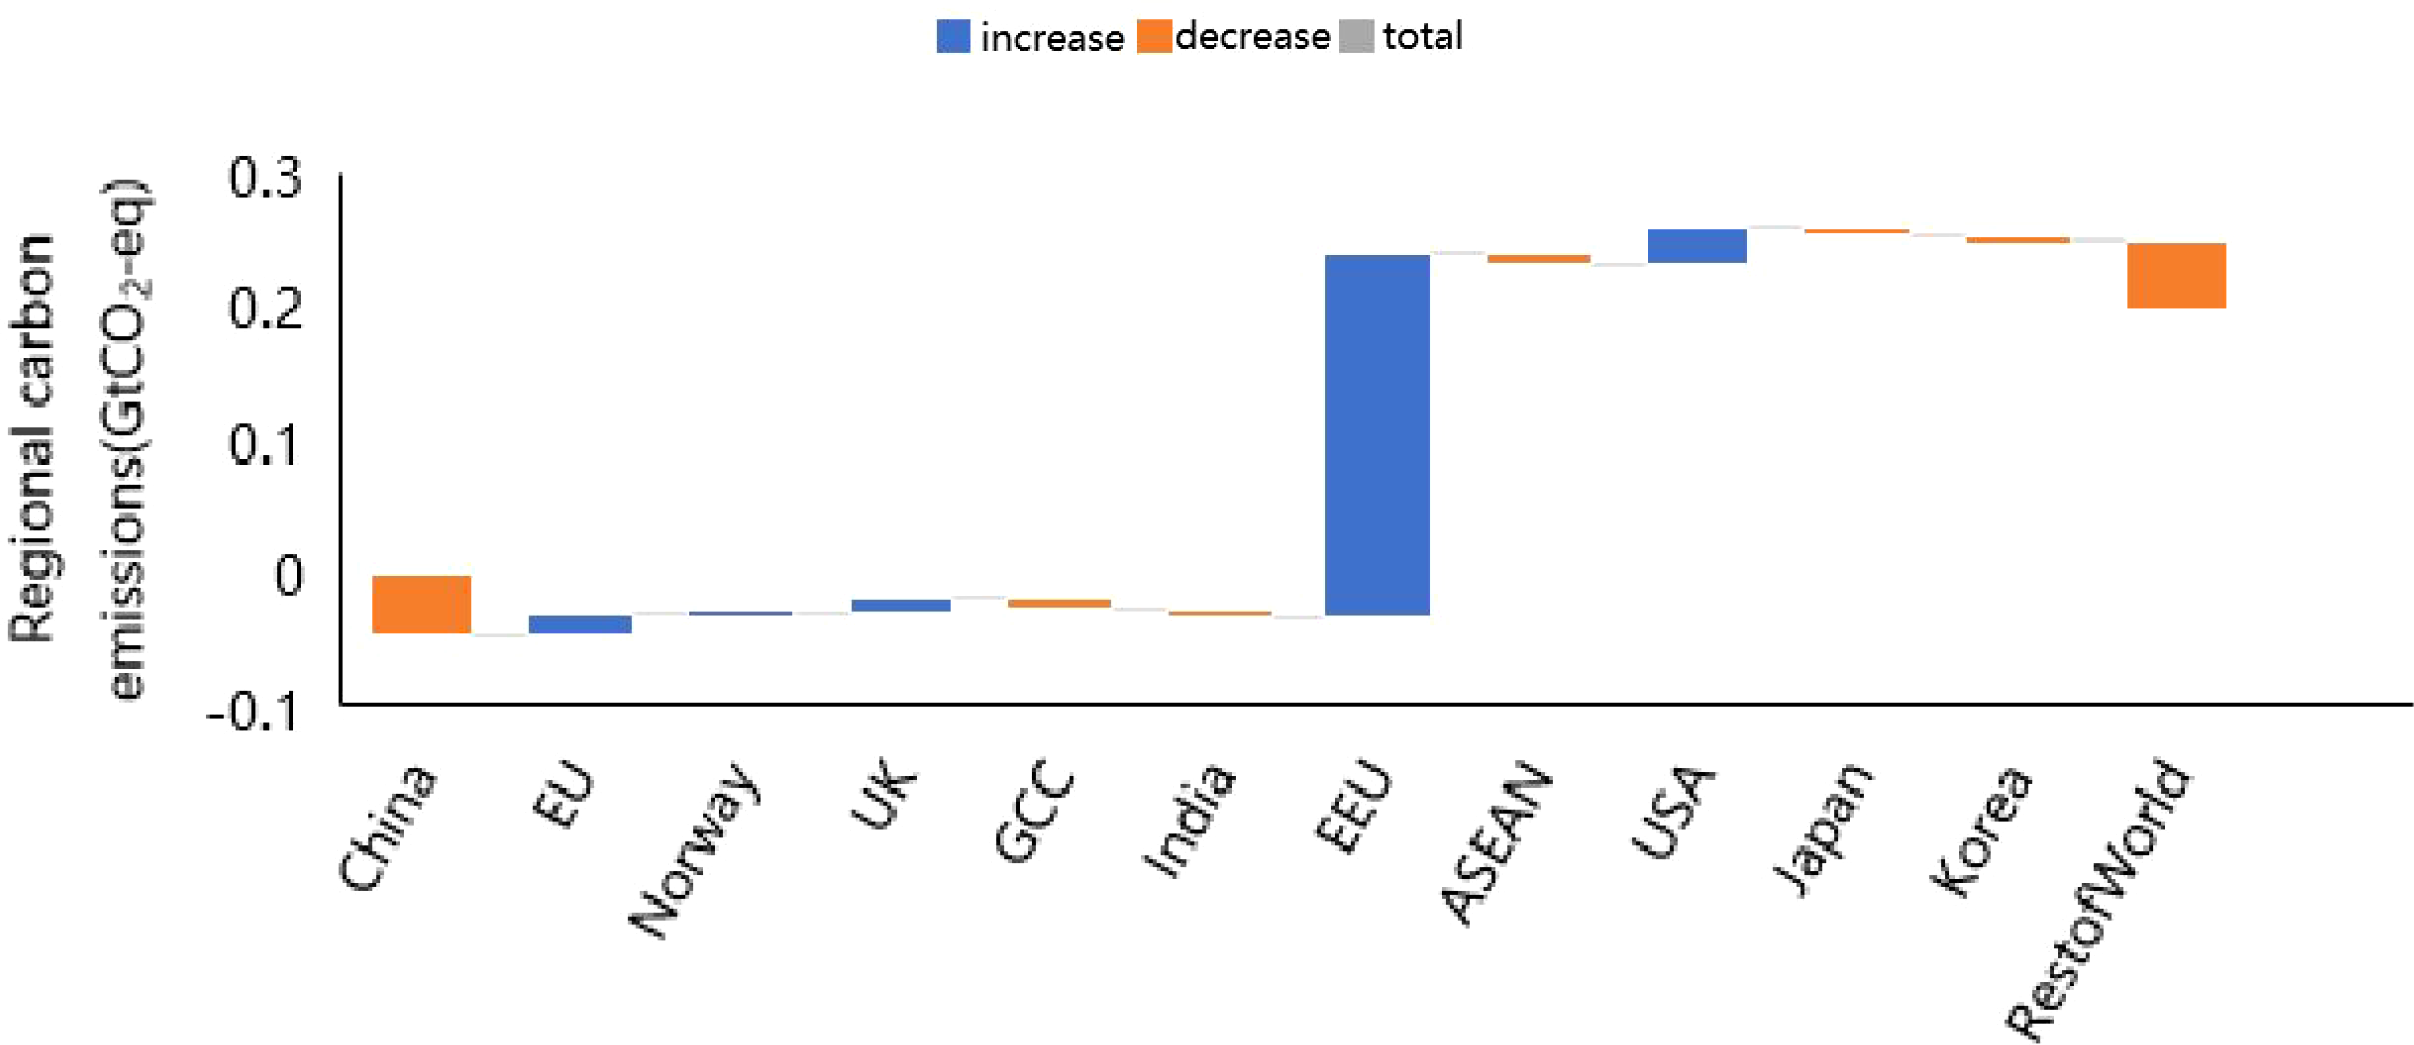
Simulation of total carbon emission changes by country/region.
It is important to clarify that both 2030BAU and 2030 refer to the same point in time (the year 2030) and represent two distinct states: one without the policy shock (baseline) and the other with the policy shock (simulated expansion).This labeling convention is used solely to facilitate a clear comparison between the pre- and post-expansion scenarios within the same target year.
The results indicate that China, the EU, the EEU, and the USA are significantly affected by the expansion, sharing commonalities such as large economic scales and trade volumes. In Scenario 7, both the EU and EEU joined the Belt and Road initiative, while the USA, as China’s largest trading partner, is substantially influenced by the Belt and Road trade agreement, which is centered around China. Figure 3 presents a chord diagram of carbon emission transfers between countries or regions from a global value chain perspective. The results show that China’s inbound emissions, caused by imports from the EEU, have increased, while China’s outbound carbon emissions to the EU, Norway, the UK, the GCC, India, the EEU, the US, Japan, South Korea, and the rest of the world have decreased, leading to an overall reduction in China’s total outbound carbon emissions. This positions China as a net exporter of carbon emissions within the global value chain. Given that the majority of these embodied carbon flows are facilitated through maritime trade, changes in shipping routes and port throughput under the Belt and Road framework may further influence the spatial distribution of trade-related carbon emissions.
Figure 3
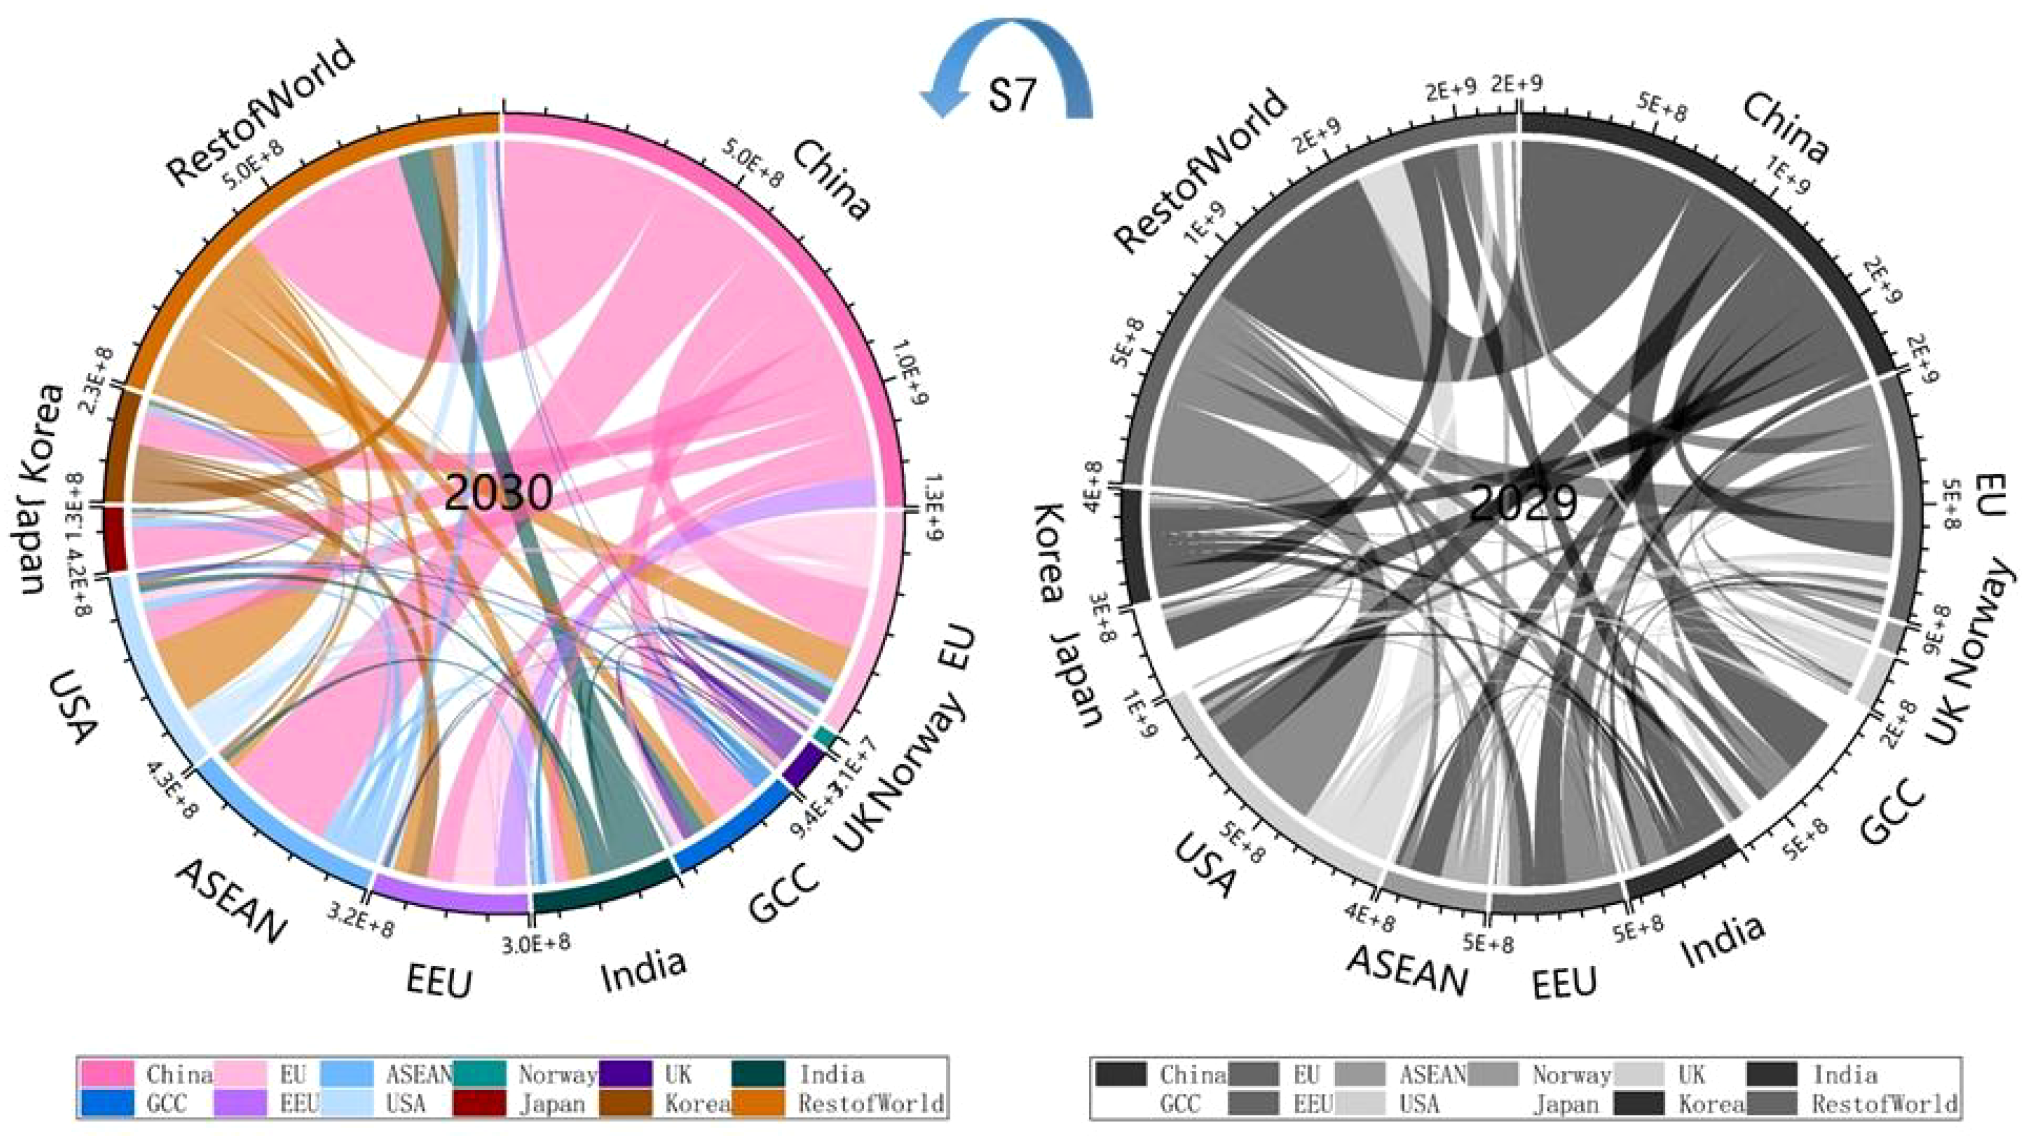
Simulation of implicit carbon emission flows by country/region.
The EU, Norway, and the UK have all experienced a reduction in their outbound carbon emissions to countries and regions worldwide. The GCC countries have seen an increase in their outbound carbon emissions to India, with a decrease to other countries and regions. Specifically, the inbound emissions from China to the GCC have decreased from 62.12 Mt - to 54.30 Mt - . Under the deepening economic cooperation of the Belt and Road initiative, India’s inbound emissions from China have increased from 37.09 Mt - to 54.69 Mt - . The EEU exports energy-intensive products with lower carbon emission coefficients to China and imports high carbon emission coefficient products, resulting in an increase of the EEU’s outbound carbon emissions to China to 66.74 Mt - . This also suggests a corresponding rise in maritime transport activity between China and the EEU, as energy commodities and industrial goods are primarily traded via sea routes, thereby linking carbon emission transfers to shipping-related emissions along these corridors.
In Figure 2, the orange bars represent the reduction in carbon emissions for a country or region. The blue bars indicate the increase in carbon emissions for a country or region. The grey connecting lines between two countries correspond to the net change in global carbon emissions after aggregating increases and decreases.
In Figure 3 the chords emanating from a color representing a specific country or region indicate the carbon emissions transferred to other economies by that country or region (Qu and Zhao, 2022). The chords incoming from colors representing other countries or regions denote the carbon emissions embodied in imports from other economies to that particular country or region. 2030BAU denotes the Business-As-Usual baseline simulation results for the year 2030 without any new Belt and Road trade agreements.
The ASEAN, which has joined the Belt and Road trade agreement and signed the RCEP agreement with China, show an increase in outbound carbon emissions from Japan and South Korea to other ASEAN countries. South Korea’s inbound emissions from China have increased, while Japan and South Korea’s transfers to other countries have decreased. The inbound emissions from China to other ASEAN countries have risen from 35.90 Mt - to 52.18 Mt - , with a reduction in transfers to other economies. The US, which has not joined the Belt and Road trade agreement, has seen a reduction in transfer emissions. As China deepens cooperation within the Belt and Road framework, the trade interdependence between China and the US decreases, leading to a reduction in the US inbound emissions from China from 128.75 Mt - to 83.98 Mt - . The decline in China-US trade-related emissions may also reflect reduced trans-Pacific shipping volumes, accompanied by a relative shift toward shorter intra-Asian maritime routes within the Belt and Road network.
4.5 Industry perspective on carbon emissions
By analyzing the import and export trade of various countries and sectors, the degree of reliance of nations/regions on the global value chain can be assessed, and the industrial characteristics of each country can be understood. Figure 4 presents a Nissen fund diagram of the carbon emissions from imports and exports of each country’s industries as projected by the GTAP11.0 database to 2030BAU, and the carbon emissions from imports and exports of each country’s industries after the EU, Norway, the UK, the GCC, India, and the EEU joined the Belt and Road trade agreement in 2030. The results indicate that in Scenario 7, total carbon emissions from products involved in export activities in the global value chain in 2030 decreased by 1,366.06 Mt - compared with 2030BAU, while total carbon emissions from products involved in import activities decreased by 2,197.87 Mt - compared with 2030BAU, with the EEU and the US having a higher proportion of export carbon emissions. In 2030, China is a net outbound emitter, hence export carbon emissions are represented as negative numbers in the simulation results. China’s import carbon emissions decreased from 1,808.80 Mt - to 1,191.07 Mt - , primarily due to the reduction in carbon emissions from the import of energy-intensive industries and petrochemical products. Overall, the EU’s export carbon emissions decreased from 215.33 Mt - to 83.83 Mt - . Although the export carbon emissions from the technology-intensive industry decreased the most, the EU’s export carbon emissions from the technology-intensive industry have always accounted for a considerable part of the total carbon emissions, consistent with the EU’s role as a technology exporter in international trade. In the EU’s import carbon emissions, the natural gas industry has occupied an undeniable proportion in both 2030BAU and 2030, reflecting the EU’s dependence on natural gas energy. The simulation results for 2030BAU show that in the US, export carbon emissions from petrochemical products and technology-intensive industries accounted for 20.25% and 22.45%, respectively. The simulation results for 2030 show that the export carbon emissions from the energy-intensive industries decreased from 106.35 Mt - to 57.68 Mt - , possibly due to the original export of energy-intensive products being replaced by more competitive energy-intensive products from developing countries along the Belt and Road. Maritime and port logistics sectors exhibit significant embodied carbon flows, particularly between China, the EU, and ASEAN countries. The reduction in tariffs under the Belt and Road trade agreement expansion increases seaborne trade volume, leading to higher port-related carbon emissions despite overall declines in industrial carbon intensity. However, the export carbon emissions from other industries still account for a certain proportion, especially the technology-intensive industry, reflecting the US’s advantage in the technology-intensive industry within the global value chain. The results for the GCC in 2030BAU and 2030 show that its import carbon emissions are mainly concentrated in the technology-intensive, energy-intensive, and service industries. The increase in export carbon emissions from the technology-intensive industry indicates that its technology-intensive products have a certain market competitiveness under the Belt and Road free trade agreement in China.
Figure 4
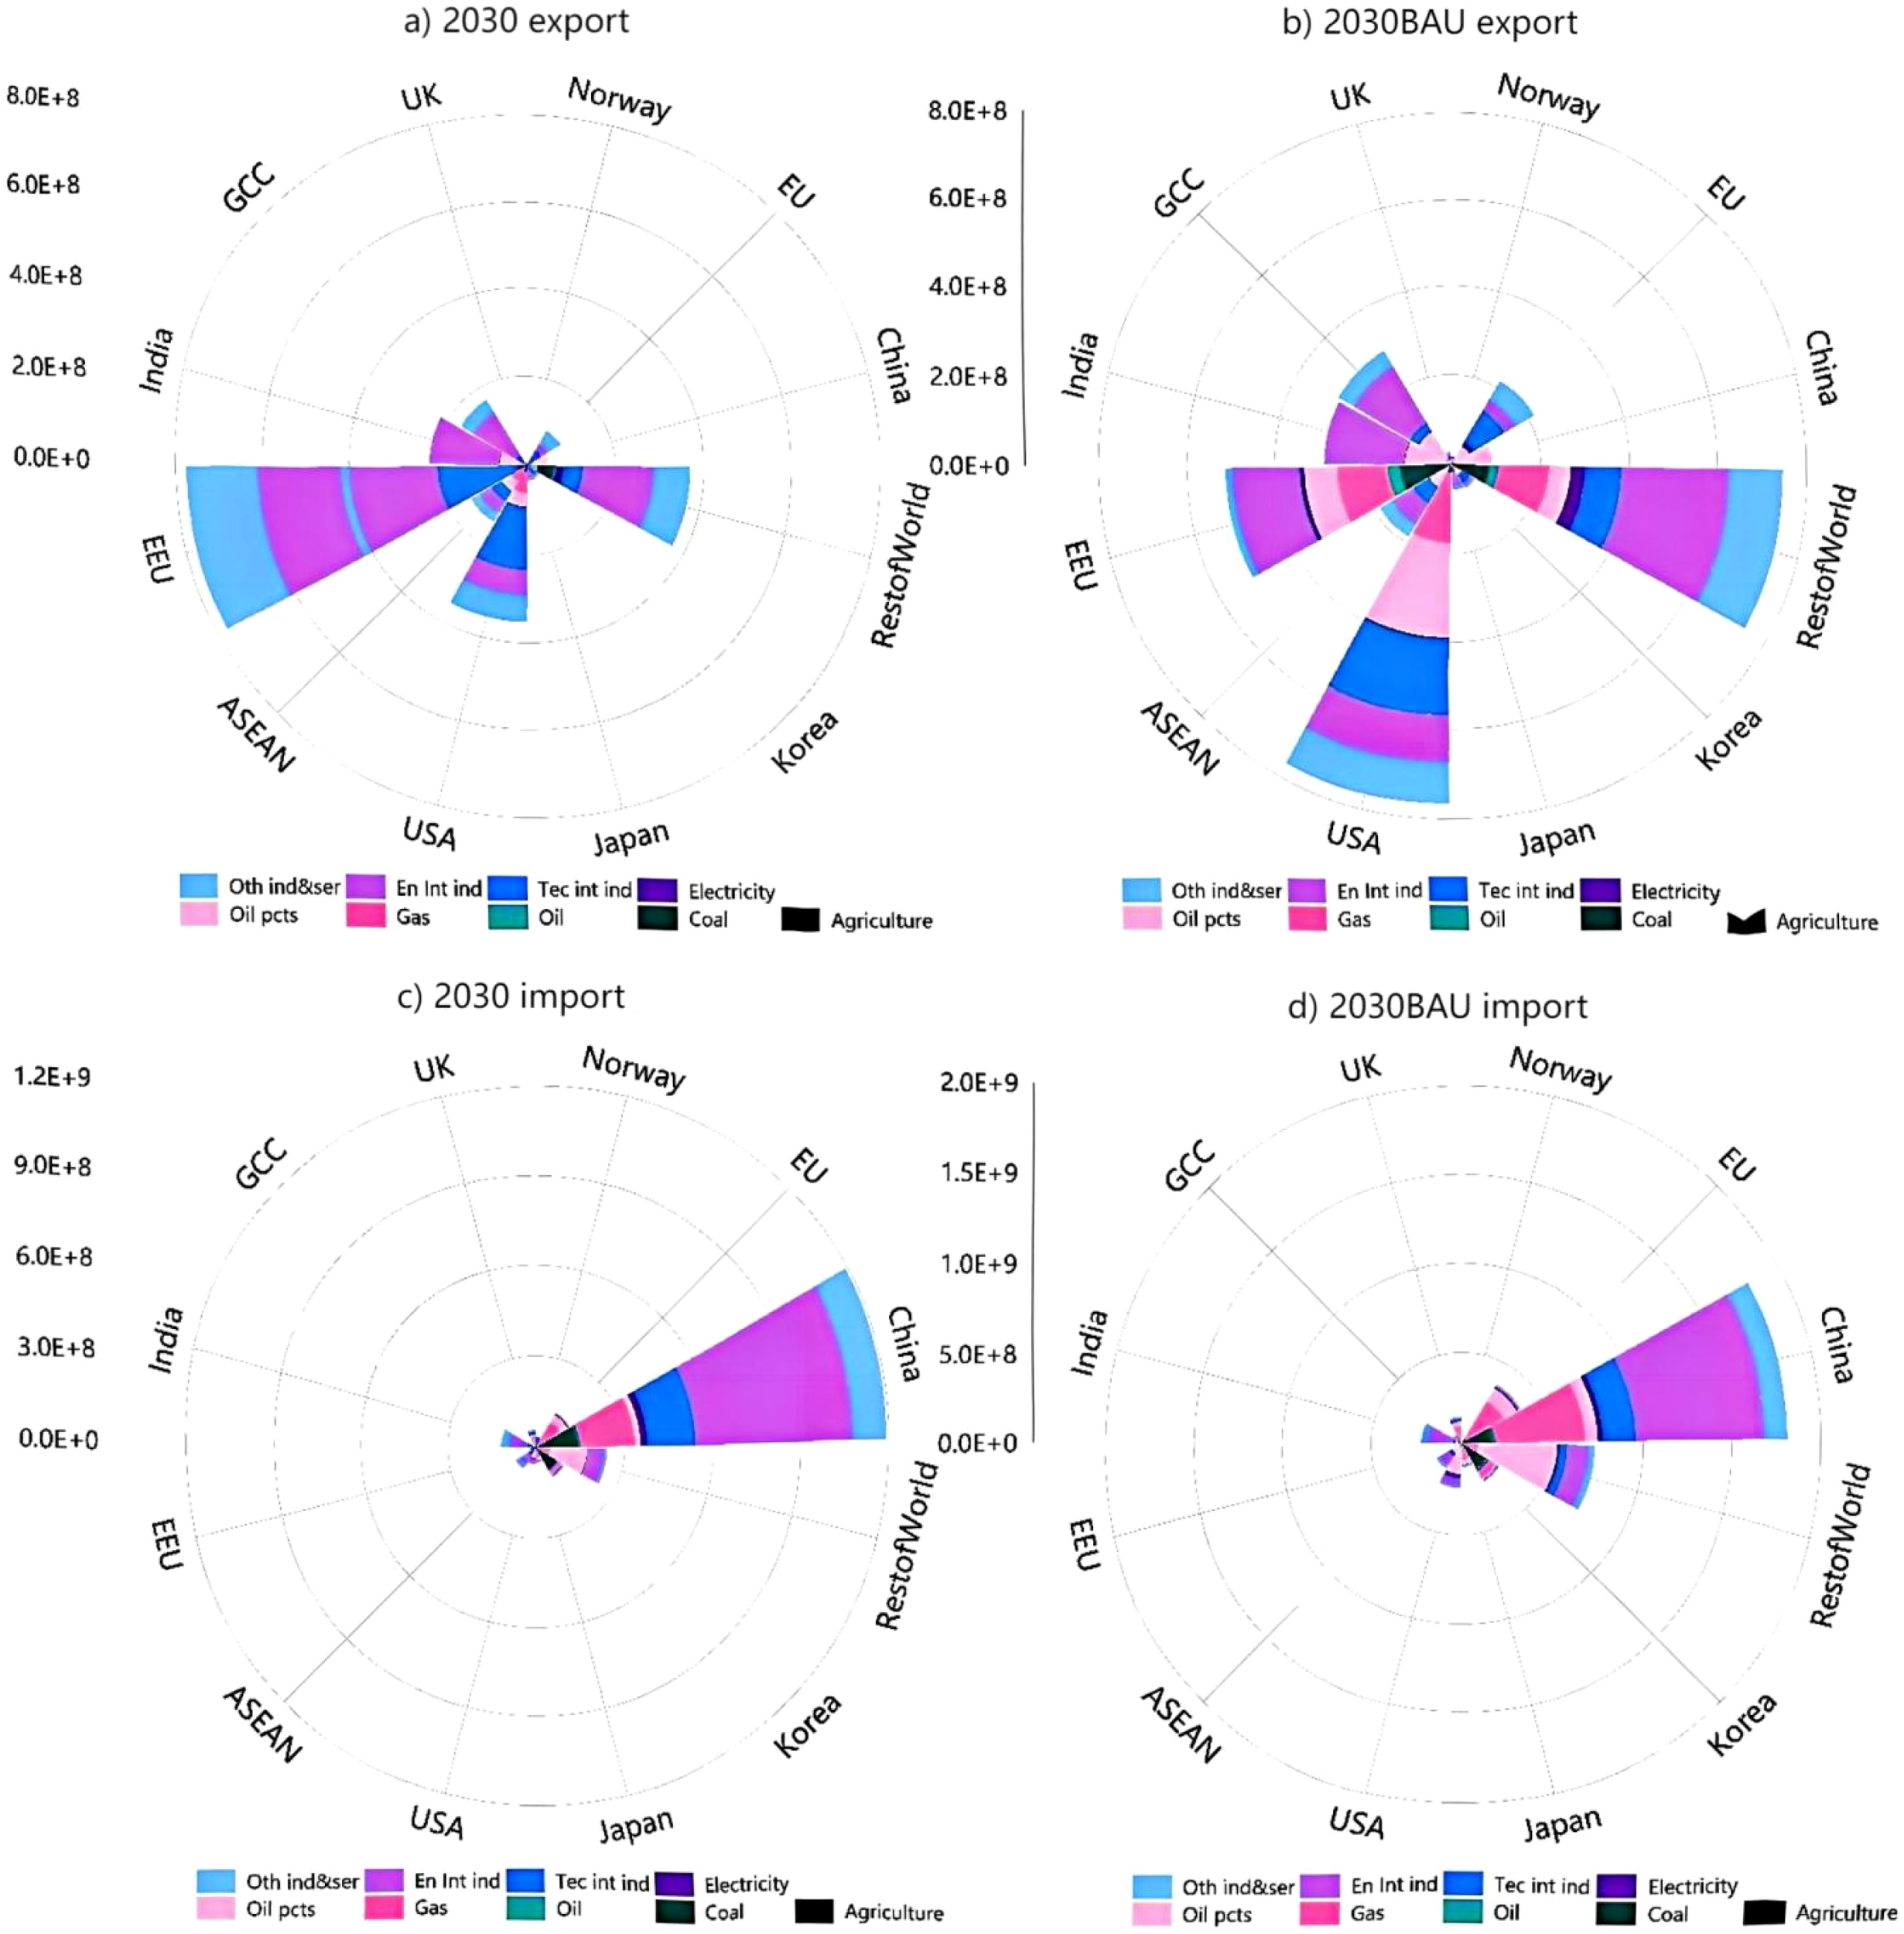
Changes in carbon emissions from industry imports and exports by country/region. (a) Carbon emissions from exported products of economies worldwide after the expansion of the “Belt and Road” free trade agreement in 2030. (b) Carbon emissions from exported products of economies worldwide before the expansion of the “Belt and Road” free trade agreement in 2030BAU. (c) Carbon emissions from imported products of economies worldwide after the expansion of the “Belt and Road” free trade agreement in 2030. (d) Carbon emissions from imported products of economies worldwide before the expansion of the “Belt and Road” free trade agreement in 2030BAU.
5 Conclusions
The simulation results show that the expansion of the “the Belt and Road” trade agreement has significantly improved China’s macroeconomic performance, although the degree of benefit varies with the economic structure and complementarity of participating countries. Among them, the accession of the European Union is expected to strongly stimulate the output of China’s technology intensive industries, while the joint accession of the six economies may lead to significant growth in energy intensive industries. From an environmental perspective, China’s export related emissions are concentrated in energy intensive and service industries, so this trade led growth will also be accompanied by a significant shift in carbon emissions.
Based on the previous findings, we propose that policy makers should prioritize energy intensive industries, specify targeted subsidies and carbon emission targets, and carry out green upgrades in this industry, thereby balancing the dual goals of trade and low-carbon transformation (Kose and Sekban, 2022). For trade with developed countries or regions such as the European Union and the United Kingdom, specific environmental treaties should be included, such as mutual recognition of carbon footprint standards. For the shipping industry in the Belt and Road, the government should accelerate the development of green shipping and consider corresponding preferential policies, such as ports with shore power facilities and low-carbon fuels. In addition, we propose that governments of all countries reward a platform for sharing implicit carbon data and fairly allocate emission responsibilities among member countries.
However, this study has several limitations that also point toward valuable future research avenues. Firstly, due to the sectoral aggregation of the GTAP database, we were unable to precisely quantify the “maritime transport” and “port services” as independent sectors. Future research could attempt to construct more granular sectoral data to isolate and analyze the environmental impact of port-related logistics. Secondly, our model assumed constant carbon emission intensities throughout the simulation period. Incorporating dynamic technological progress factors would make future simulations more aligned with reality. Lastly, while this study focused on tariff reductions, the framework could be extended to simulate richer policy scenarios, such as the reduction of non-tariff barriers and the promotion of technology cooperation, to provide a more comprehensive assessment of green development pathways under the Belt and Road Initiative. Addressing these limitations will be crucial for advancing the policy-relevant modeling of sustainable trade integration.
However, this study has several limitations. Due to the industry aggregation nature of the GTAP database, we are unable to accurately quantify shipping and port services as independent industry data. Future research could attempt to construct finer grained industry data to separate and analyze the environmental impacts of port related logistics. And our model assumes that the carbon emission intensity remains constant throughout the entire simulation period. If dynamic technological advancements can be incorporated, it will make future simulations more realistic. Finally, although this study focuses on tariff reduction, the framework can be extended to simulate richer policy scenarios, such as reducing non-tariff barriers and promoting technological cooperation.
Statements
Data availability statement
The original contributions presented in the study are included in the article/supplementary material. Further inquiries can be directed to the corresponding author/s.
Author contributions
JM: Methodology, Visualization, Writing – original draft, Formal analysis. SR: Methodology, Data curation, Writing – original draft, Formal analysis. HZ: Validation, Writing – review & editing, Investigation. JG: Supervision, Validation, Conceptualization, Funding acquisition, Writing – review & editing. XC: Resources, Project administration, Conceptualization, Writing – original draft.
Funding
The author(s) declared that financial support was received for this work and/or its publication. This work was jointly supported by National Natural Science Foundation of China (No. 42176217),opening project of State Key Laboratory of Maritime Technology and Safety.
Acknowledgments
The authors have reviewed and edited the output and take full responsibility for the content of this publication.
Conflict of interest
Author XC was employed by the company Shanghai Ship and Shipping Research Institute Co., Ltd.
The remaining author(s) declared that this work was conducted in the absence of any commercial or financial relationships that could be construed as a potential conflict of interest.
Generative AI statement
The author(s) declared that generative AI was not used in the creation of this manuscript.
Any alternative text (alt text) provided alongside figures in this article has been generated by Frontiers with the support of artificial intelligence and reasonable efforts have been made to ensure accuracy, including review by the authors wherever possible. If you identify any issues, please contact us.
Publisher’s note
All claims expressed in this article are solely those of the authors and do not necessarily represent those of their affiliated organizations, or those of the publisher, the editors and the reviewers. Any product that may be evaluated in this article, or claim that may be made by its manufacturer, is not guaranteed or endorsed by the publisher.
References
1
Calabrese L. Jenkins R. Lombardozzi L. (2024). The belt and road initiative and dynamics of structural transformation. Eur. J. Dev. Res.36, 515–547. doi: 10.1057/s41287-024-00644-x
2
Cannon C. Gao Y. Wunder L. (2015). Port of Los Angeles—Shanghai municipal transportation commission ecopartnership on shore power. J. Renewable Sustain. Energy7. doi: 10.1063/1.4928175
3
Chadda A. Singh J. Sharma R. K. Gupta R. K. Kansal S. K. (2024). Bottlenecks analysis using analytic hierarchy process (AHP) throughout the value chain of small ruminants in India. Small Ruminant Res.230, 107169. doi: 10.1016/j.smallrumres.2023.107169
4
Chen X. Ma F. Wu Y. Han B. Luo L. Biancardo S. A. (2025). MFMDepth: MetaFormer-based monocular metric depth estimation for distance measurement in ports. Comput. Ind. Eng.207, 111325. doi: 10.1016/j.cie.2025.111325
5
Chen X. Wang Z. Hua Q. Shang W. L. Luo Q. Yu K. (2023a). AI-empowered speed extraction via port-like videos for vehicular trajectory analysis. IEEE Trans. Intelligent Transportation Syst.24, 4541–4552. doi: 10.1109/TITS.2022.3167650
6
Chen X. Wu H. Han B. Liu W. Montewka J. Liu R. W. (2023b). Orientation-aware ship detection via a rotation feature decoupling supported deep learning approach. Eng. Appl. Artif. Intell.125, 106686. doi: 10.1016/j.engappai.2023.106686
7
Chen X. Zheng J. Li C. Wu B. Wu H. Montewka J. (2024). Maritime traffic situation awareness analysis via high-fidelity ship imaging trajectory. Multimedia Tools Appl.83, 48907–48923. doi: 10.1007/s11042-023-17456-6
8
Corong E. L. Hertel T. W. Mcdougall R. Tsigas M. E. van der Mensbrugghe D. (2017). The standard GTAP model, version 7. J. Global Economic Anal.2, 1–119. doi: 10.21642/JGEA.020101AF
9
De Lyon J. Pessoa J. P. (2021). Worker and firm responses to trade shocks: The UK-China case. Eur. Economic Rev.133, 103678. doi: 10.1016/j.euroecorev.2021.103678
10
Feng F. Jia J. Liang A. Liu C. (2022). Bayesian network-based risk evaluation model for the operational requirements of the China Railway Express under the Belt and Road initiative. Transportation Saf. Environ.4, tdac019. doi: 10.1093/tse/tdac019
11
Flodén J. Zetterberg L. Christodoulou A. Parsmo R. Fridell E. Hansson J. et al . (2024). Shipping in the EU emissions trading system: implications for mitigation, costs and modal split. Climate Policy24, 969–987. doi: 10.1080/14693062.2024.2309167
12
Fourth I. (2020). Greenhouse Gas Study (London: International Maritime Organization).
13
Gäde S. Klauser M. (2025). An emissions inventory of seaborne trade flows to and from the Port of Hamburg. J. Shipping Trade10, 22. doi: 10.1186/s41072-025-00212-4
14
Guo J. Liu Y. Wu X. Chen J. (2022). Assessment of the impact of Fukushima nuclear wastewater discharge on the global economy based on GTAP. Ocean Coast. Manage.228, 106296. doi: 10.1016/j.ocecoaman.2022.106296
15
Haider A. Jabeen S. Rankaduwa W. Shaheen F. (2023). The nexus between employment and economic growth: A cross-country analysis. Sustainability15, 11955. doi: 10.3390/su151511955
16
Herrero A. G. Xu J. (2017). China’s Belt and Road initiative: can Europe expect trade gains?. China & World Economy25, 84-99.
17
Hertel T. W. (1997). Global trade analysis: modeling and applications ( Cambridge university press). doi: 10.22004/ag.econ.28708
18
Hertel T. W. Huff K. (2001). Decomposing welfare changes in the GTAP model. doi: 10.22004/ag.econ.28708
19
Hertel T. Hummels D. Ivanic M. Keeney R. (2007). How confident can we be of CGE-based assessments of Free Trade Agreements? Economic Model.24, 611–635. doi: 10.1016/j.econmod.2006.12.002
20
Hummels D. L. Schaur G. (2013). Time as a trade barrier. Am. Economic Rev.103, 2935–2959. doi: 10.1257/aer.103.7.2935
21
Jackson K. Shepotylo O. (2021). Belt and road: The China dream? China Economic Rev.67, 101604. doi: 10.1016/j.chieco.2021.101604
22
Joung T.-H. Kang S.-G. Lee J.-K. Ahn J. (2020). The IMO initial strategy for reducing Greenhouse Gas (GHG) emissions, and its follow-up actions towards 2050. J. Int. Maritime Safety Environ. Affairs Shipping4, 1–7. doi: 10.1080/25725084.2019.1707938
23
Khan Y. Hassan T. Tufail M. Marie M. Imran M. Xiuqin Z. (2022). The nexus between CO2 emissions, human capital, technology transfer, and renewable energy: evidence from Belt and Road countries. Environ. Sci. pollut. Res.29, 59816–59834. doi: 10.1007/s11356-022-20020-8
24
Kose S. Sekban D. M. (2022). Emphasizing the importance of using cold-ironing technology by determining the share of hotelling emission value within the total emission. Transportation Saf. Environ.4, tdac010. doi: 10.1093/tse/tdac010
25
Li Y. Hewitt C. N. (2008). The effect of trade between China and the UK on national and global carbon dioxide emissions. Energy Policy36, 1907–1914. doi: 10.1016/j.enpol.2008.02.005
26
Li Y. Pu Z. Liu P. Qian T. Hu Q. Zhang J. et al . (2025). Efficient predictive control strategy for mitigating the overlap of EV charging demand and residential load based on distributed renewable energy. Renewable Energy240, 122154. doi: 10.1016/j.renene.2024.122154
27
Li Y. Zhao Y. Yao X. (2024). Does the Belt and Road Initiative upgrade the global value chain for BRI Countries:Revealing the substantial role of infrastructure. Int. Rev. Econ Finance89, 832–842. doi: 10.1016/j.iref.2023.10.046
28
Liang R. Liu Z. (2020). Port infrastructure connectivity, logistics performance and seaborne trade on economic growth: an empirical analysis on “21st-century maritime silk road. J. Coast. Res.106, 319–324. doi: 10.2112/SI106-074.1
29
Liu Z. Wu C. Li Z. (2022). Effects on carbon emission of China’s direct investment in Belt and Road countries. China Popul. Resour. Environ.32, 9–18.
30
Liu Y. Zhu J. Tuwor C. P. Ling C. Yu L. Yin K. (2023). The impact of the COVID-19 pandemic on global trade-embodied carbon emissions. Journal of Cleaner Production408, 137042.
31
Ma S. (2022). Growth effects of economic integration: New evidence from the Belt and Road Initiative. Economic Anal. Policy73, 753–767. doi: 10.1016/j.eap.2022.01.004
32
Ma X. Van Rompaey A. Qiang W. W. Derudder B. (2024). Exploring the impacts of high-speed rail on technology-intensive manufacturing: the case of the Yangtze River Delta region 2007–2016. Sci. Rep.14, 21885. doi: 10.1038/s41598-024-72611-9
33
McDougall R. (2000). A new regional household demand system for GTAP. Center for Global Trade Analysis, Department of Agricultural Economics, Purdue University. doi: 10.22004/ag.econ.28713
34
Mpeqa R. Sun H. P. Beraud J.-J. D. (2023). Investigating the impact of import, export, and innovation on carbon emission: evidence from Belt and Road Initiative countries. Environ. Sci. pollut. Res.30, 72553–72562. doi: 10.1007/s11356-023-27402-6
35
Nguyen P. N. (2025). Ship emissions and social costs at Southeast Asian container ports. Transportation Saf. Environ., tdaf067. doi: 10.1093/tse/tdaf067
36
Nguyen D. B. Nong D. Simshauser P. Pham H. (2024). Economic and supply chain impacts from energy price shocks in Southeast Asia. Economic Anal. Policy84, 929–940. doi: 10.1016/j.eap.2024.09.025
37
Ozkan O. Sharif A. Mey L. S. Tiwari S. (2023). The dynamic role of green technological innovation, financial development and trade openness on urban environmental degradation in China: Fresh insights from carbon efficiency. Urban Climate52, 101679. doi: 10.1016/j.uclim.2023.101679
38
Peng S. Zhang W. Sun C. (2015). China’s production-based and consumption-based carbon emissions and their determinants. Economic Res. J.50, 168–182.
39
Peters G. P. Andrew R. Lennox J. (2011). Constructing an environmentally-extended multi-regional input–output table using the GTAP database. Economic Syst. Res.23, 131–152. doi: 10.1080/09535314.2011.563234
40
Pradhan B. K. Ghosh J. Yao Y.-F. Liang Q.-M. (2017). Carbon pricing and terms of trade effects for China and India: A general equilibrium analysis. Economic Model.63, 60–74. doi: 10.1016/j.econmod.2017.01.017
41
Qu Y. Zhao X. (2022). Analysis on China’s regional echelon upgrading and evolution path for manufacturing industry: based on the calculation of the impact of regional industrial agglomeration on total factor productivity. Rev. Ind. Econ2, 37–58.
42
Rajamani L. (2016). The 2015 Paris Agreement: Interplay between hard, soft and non-obligations. J. Environ. Law28, 337–358. doi: 10.1093/jel/eqw015
43
Song A. Y. Fabinyi M. (2022). China’s 21st century maritime silk road: Challenges and opportunities to coastal livelihoods in ASEAN countries. Mar. Policy136, 104923. doi: 10.1016/j.marpol.2021.104923
44
Sun C. Ma T. Xu M. (2018). Exploring the prospects of cooperation in the manufacturing industries between India and China: A perspective of embodied energy in India-China trade. Energy Policy113, 643–650. doi: 10.1016/j.enpol.2017.11.055
45
Walmsley T. L. Dimaranan B. Mcdougall R. A. (2000). A base case scenario for the dynamic GTAP model ( Center for Global Trade Analysis, Purdue University).
46
Wang L. Li Y. (2023). Estimation methods and reduction strategies of port carbon emissions-what literatures say? Mar. pollut. Bull.195, 115451. doi: 10.1016/j.marpolbul.2023.115451
47
Wang B. Liu Q. Wang L. Chen Y. Wang J. (2023). A review of the port carbon emission sources and related emission reduction technical measures. Environ. pollut.320, 121000. doi: 10.1016/j.envpol.2023.121000
48
Wang H. Si I. Chen Z. (2024). Does the Belt and Road Initiative promote China and the countries along the route to reconstruct the global value chain? Evidence from value-added trade. Economic Anal. Policy81, 63–83. doi: 10.1016/j.eap.2023.11.030
49
Wang Q. Yang X. (2020). Imbalance of carbon embodied in South-South trade: Evidence from China-India trade. Sci. Total Environ.707, 134473. doi: 10.1016/j.scitotenv.2019.134473
50
Wang S. Zhu Y. (2024). An inquiry into the effect of trade facilitation on China’s digital product exports to countries along the “Belt and Road. Int. Rev. Econ Finance93, 1246–1259. doi: 10.1016/j.iref.2024.04.041
51
Wei J. Gao Y. Elahi E. (2022). China’s integration in the Asia-Pacific regional economic cooperation. Front. Psychol.13, 951413. doi: 10.3389/fpsyg.2022.951413
52
Wissner N. Cames M. Defour S. Abbasov F. Armstrong J. (2021). Integration of maritime transport in the EU Emissions Trading System (Berlin/Brüssel).
53
Xu P. Cheng Q. (2020). Economic growth effects on B&R sci-tech cooperation. J. Finance Econ46, 140–154. doi: 10.16538/j.cnki.jfe.2020.05.010
54
Yi C.-D. (2025). The effects of US-Japan trade agreements on production, sales, factor demand, and price in competition and firm structure. J. Int. Trade Economic Dev.34, 805–825. doi: 10.1080/09638199.2024.2333818
55
Yu H. Sun H. Pu Z. (2025). GVDF-PIA: group-based vehicular digital forensics and proxy-assisted integrity auditing for intelligent transportation. IEEE Internet Things J.12, 55645–55659. doi: 10.1109/JIOT.2025.3624488
56
Yu J. Yu D. Zhang H. (2023). Impact of the belt and road initiative on carbon emissions of countries along the route. China Popul. Resour. Environ.33, 75–84.
57
Zhai F. (2018). China’s belt and road initiative: A preliminary quantitative assessment. J. Asian Econ55, 84–92. doi: 10.1016/j.asieco.2017.12.006
58
Zhang Z. Chen W. (2022). Embodied carbon transfer between China and the Belt and Road Initiative countries. J. Cleaner Production378, 134569. doi: 10.1016/j.jclepro.2022.134569
59
Zhang D. Tao J. Wan C. Huang L. Yang M. (2024). Resilience analysis of maritime transportation networks: a systematic review. Transportation Saf. Environ.6, tdae009. doi: 10.1093/tse/tdae009
60
Zheng L. Zhang Z. Yao Y. Duan X. Li M. Zeng Z. et al . (2024). Assessment of export-embodied CO2 emissions from China’s ocean industries: implications for formulating sustainable ocean policies. Front. Mar. Sci.11, 1429841. doi: 10.3389/fmars.2024.1429841
61
Zhou Y. Chen S. Chen M. (2019). Global value chain, regional trade networks and Sino-EU FTA. Struct. Change Economic Dynamics50, 26–38. doi: 10.1016/j.strueco.2019.04.010
62
Zhou X. Guo Q. Wang Y. Wang G. (2022). Trade and embodied CO2 emissions: analysis from a global input–output perspective. Int. J. Environ. Res. Public Health19, 14605. doi: 10.3390/ijerph192114605
63
Zhu N. Huang S. (2023). Impact of the tariff concessions of the RCEP agreement on the structure and evolution mechanism of manufacturing trade networks. Soc. Networks74, 78–101. doi: 10.1016/j.socnet.2023.01.008
Summary
Keywords
the “Belt and Road”, carbon emissions, global trade analysisproject (GTAP), regional economic integration, sustainability
Citation
Mi JJ, Rui S, Zhu H, Ge J and Chen X (2026) Trade and port-based resilience analysis under the expansion of the belt and road trade agreement: an integrated economic and environmental assessment. Front. Mar. Sci. 12:1738984. doi: 10.3389/fmars.2025.1738984
Received
04 November 2025
Revised
16 December 2025
Accepted
17 December 2025
Published
23 January 2026
Volume
12 - 2025
Edited by
Tsz Leung Yip, Hong Kong Polytechnic University, Hong Kong SAR, China
Reviewed by
Xiaofeng Pan, Wuhan University of Technology, China
Wei Li, Taiyuan University of Technology, China
Updates
Copyright
© 2026 Mi, Rui, Zhu, Ge and Chen.
This is an open-access article distributed under the terms of the Creative Commons Attribution License (CC BY). The use, distribution or reproduction in other forums is permitted, provided the original author(s) and the copyright owner(s) are credited and that the original publication in this journal is cited, in accordance with accepted academic practice. No use, distribution or reproduction is permitted which does not comply with these terms.
*Correspondence: Jinfeng Ge, jfge@shmtu.edu.cn
Disclaimer
All claims expressed in this article are solely those of the authors and do not necessarily represent those of their affiliated organizations, or those of the publisher, the editors and the reviewers. Any product that may be evaluated in this article or claim that may be made by its manufacturer is not guaranteed or endorsed by the publisher.