Abstract
Under the guidance of “Dual Carbon” goal, the multi-party cooperative mechanism of port consolidation and distribution system faces many challenges, particularly the conflict between the high costs of green transformation and the pursuit of individual profit maximization by various stakeholders, as well as the difficulty in reaching strategic consensus among different parties under policy constraints. Based on the evolutionary game theoretical framework, this paper constructs a tripartite dynamic evolution model including port operators, river-sea intermodal transport operators and road transport operator. The study specifically describes the strategic interaction mechanisms among the port operator’s active progression/negative progression strategy, the river-sea intermodal transport operator’s cooperation/competition strategy, and the road transport operator’s low-carbon mode/traditional mode strategy. Key variables such as additional cost, management effort, and additional income are incorporated into the payoff matrix of all parties. By constructing replicated dynamic equations to analyze the stability of system evolution, and further applying Matlab numerical simulations, the study explores the mechanism by which key parameters influence the evolution of cooperative strategies. It is found that: 1) In the non-responsive state of the operators, the acceptance threshold of additional cost to the port operators increases and shows a stronger tendency of active promotion. River-sea intermodal transport operators are more sensitive to additional cost than road transportation operators, which are more dependent on policy-derived benefits. Moreover, there is a strategy-driven effect among operators, and the adjustment of management effort of one party will change the evolutionary trajectory of the other party. Additional income and subsidy show low sensitivity to the evolution of operators’ strategies, and a synergistic effect between them is needed to change the stability point. 2) Port operators show strong stability to changes in additional cost and subsidy when operators respond positively. The port operators need higher indirect gain to change to the “active progression” strategy, and the response threshold decreases the evolution rate increases in the tripartite coordination state, suggesting that the system coordination has a reinforcing effect on the port operators’ strategy. This study reveals the evolution law of the multi-party game in the port consolidation and distribution system, and proposes the optimization path of multi-parameter coordinated regulation, which provides theoretical support for the coordinated management of the port consolidation and distribution system under the goal of “Dual Carbon”.
1 Introduction
Against the backdrop of increasingly severe global climate change and environmental problems, the Chinese government has actively responded to the call of the international community and put forward the goal of carbon peaking and carbon neutrality (“Dual Carbon”), aiming to promote green and low-carbon development through the reduction of greenhouse gas emissions (He et al., 2022). As the critical hub connecting global supply chains with inland regions, the green transformation of port consolidation and distribution systems is crucial to achieving this goal. However, the efficient operation of consolidation and distribution systems does not rely on the efforts of a single party, but rather depends on deep coordination among multiple stakeholders, including port operators, river-sea intermodal transport operators, road transport operators. Under traditional models, ineffective coordination between transport modes often leads to cargo congestion, wasted resources, and inefficient practices like empty runs by vehicles and vessels. This not only increases logistics costs but also exacerbates the system’s carbon emissions. Therefore, under the constraints of the “Dual Carbon” goals, building a multi-party collaborative green consolidation and distribution system to reduce energy consumption across the entire chain through optimized organizational efficiency and seamless integration has become an inevitable trend in industry development. At the same time, global economic integration and the increasing frequency of international trade make the coordinated development of the port consolidation and distribution system closely linked to the realization of the “Dual Carbon” goal. This system consists of multiple modes of transportation designed to efficiently consolidate and disperse cargo from ports to inland or transshipment to other ports. In this process, the close cooperation and coordination among multiple actors, such as ports, logistics operators, governments and relevant authorities are essential (Yin et al., 2021). Specifically, river-sea intermodal transport must leverage its high-volume capacity to further enhance operational efficiency, road transport must transition toward new energy sources and intelligent scheduling, while ports, as hubs, must promote efficient vehicle-vessel matching through policy incentives and information sharing. The operational efficiency, cost-effectiveness, and environmental sustainability of these three parties significantly influence the achievement of multi-party coordination within port consolidation and distribution systems and the realization of the goal of “Dual Carbon”.
The proposal of this goal is not only a positive contribution to global climate governance, but also an intrinsic requirement for the sustainable development of China’s economy and society, yet there are still difficulties in realizing the above goal. The core challenge lies in establishing effective interest coordination mechanisms to encourage all parties to actively participate in system coordination. On the one hand, in the consolidation and distribution network, port operators have chosen to actively promote the cooperation and greening process of operators, which is crucial for enhancing port competitiveness, responding to policy guidance and promoting industrial upgrading, but faces difficulties such as huge capital investment, complicated coordination of interests of multiple parties, and the development of countermeasures. On the other hand, among logistics enterprises, river-sea intermodal transport operators have chosen a cooperation strategy, aiming to reduce operating costs, improve transportation efficiency and respond to the trend of environmental protection by sharing resources and complementing each other’s strengths, but in the process of cooperation, they need to overcome the challenges of asymmetry of information, unequal distribution of benefits, incomplete coordination mechanism, and prevention and control of cooperation risks. Similarly, the choice of low-carbon modes by road transport operators is a key step to comply with the “Dual Carbon” goal, reduce environmental pollution, enhance corporate image and meet market demand. However, this process needs to deal with the high cost of technological innovation, low market acceptance, imperfect policy support and regulatory system, insufficient new energy infrastructure, and coordination with other transportation modes. These difficulties not only concern the development of the respective subjects, but also profoundly affect the efficiency, cost, environmental performance and sustainability of the entire transportation system (Chen et al., 2023b).
Based on this, this paper establishes an evolutionary game model, takes into account the characteristics of the tripartite in the consolidation and distribution system, makes basic assumptions and parameter settings, constructs a dynamic model of the evolutionary game of “Port operator -River-sea intermodal transport operator-Road transport operator”. The model is used to analyze the stability of the strategy by calculating the payoff matrix and replicating the dynamic equations of the tripartite in the game, then derive the mutual influence mechanism among the tripartite in the game, and numerical simulation is carried out by Matlab simulation software. Considering the interests, strategy choices and mutual influences of each party, the game process under different situations is simulated to reveal how each party can achieve dynamic balance and coordinated evolution while pursuing its own interest maximization.
The research in this paper has important academic value and practical significance. On the one hand, through the construction of an evolutionary game model, the strategic interaction and evolution path of port operators, river-intermodal transport operators and road transport operators in the game system are explored in depth. By simulating the system evolution process under different strategy combinations, it reveals the interaction mechanism and influence law between different subjects, and provides new ideas and methods for the research in related fields; on the other hand, by simulating the strategy evolution process under different initial values and parameters, the government can understand the influence mechanism and effect of different factors on the evolution of the system, and then formulate a scientific and reasonable transportation policies to guide the main parties to choose more environmentally friendly and efficient transportation modes to promote the development of green logistics. At the same time, tax policy and subsidy policy should be adjusted to optimize resource allocation, so as to provide strong support for improving the overall efficiency of the transportation system and promoting the green transformation and sustainable development of the transportation industry.
The rest of the text is organized as follows: in Chapter 2, the relevant literature is reviewed and sorted out in the context of port consolidation and distribution system, and carbon emission reduction in the field of intermodal transport. In Chapter 3, the game relationship between the subjects is described and the assumptions and parameters are defined in order to build a tripartite evolutionary game model. In Chapter 4, the model stability point is solved and analyzed. In Chapter 5, numerical simulation analysis is performed and analytical results are derived. Finally, the analytical results are summarized and suggestions are made.
2 Literature review
2.1 Relevant studies on port consolidation and distribution system
As the key link between ports and hinterlands, port consolidation and distribution system are not only the foundation for the survival and development of modern ports, but also the core driving force for regional economic integration and global trade prosperity. Since Shen and Khoong (1995) pioneered the application of system network optimization technology to the construction of decision support system (DSS) for container empty container deployment, the research in this field has been moving along a path of continuous evolution and innovation, gradually building up a more and more perfect theoretical system and practical framework. In the early exploratory stage, the research mainly focuses on the basic theory and model construction, and the decision support system of Shen, through integrating advanced system network optimization technology, provides an effective solution to the complex decision-making problem of container empty container deployment, which not only improves the utilization rate of empty containers, but also reduces the logistics cost significantly, and lays a solid foundation for the follow-up research. Janic (2007) expanded the research vision to the European freight system, constructed a comprehensive costing model, through the quantitative analysis of the cost-effectiveness of various modes of transport, to provide policymakers with a scientific basis for decision-making, and promote the optimization and upgrading of the European freight system.
In recent years, academic research on port consolidation and distribution systems mainly focuses on the operational efficiency of port consolidation and distribution networks, port consolidation and distribution network planning, port consolidation and distribution system optimization. He et al. (2023) in response to the problem of container collection and distribution efficiency in automated terminals, an external truck task scheduling optimization model is innovatively proposed to effectively improve the operational efficiency of automated terminals by jointly optimizing the scheduling of external trucks and yard booking automated rail gantry crane scheduling, which effectively improves the operational efficiency of the automated terminal. Xu et al. (2024) addressed the issue of generation method of tractor and trailer transport schemes under the influence of disrupted events, considering three transportation states, a scheduling model is constructed to minimize the total deviation cost including transportation time, transportation path, and number of used vehicles under the three states of tractors. Li et al. (2023) established a multi-objective fuzzy nonlinear planning model considering hybrid time window constraints for the intermodal transportation path planning problem under uncertain environment with cost, time and carbon emission as the optimization objectives. The model was defuzzified using the fuzzy expected value method and fuzzy opportunity constraint planning method, and a cooperative game theory-based multi-objective optimization method was proposed by combining the game theory method with the weighted sum method. Bütün et al. (2021) made an important breakthrough in the design of liner shipping hub-and-spoke network, and proposed the theory of directed circulation transportation hub siting and cargo path planning based on capacity constraints, which provided a new way of thinking for the optimal design of liner shipping network. In addition, system optimization and multi-objective decision-making have become a research hotspot. Halim et al. (2016) constructed a port-hinterland consolidation and distribution network model for multi-objective optimization, accurately estimated the distribution center location and network layout by combining multi-objective optimization and distributed service preference identification, deeply analyzed the port’s transportation cost and timeliness, and provided specific measure suggestions to enhance the connectivity between the port and the hinterland. Dai et al. (2018), on the other hand, constructed a dual-objective intermodal logistics model covering emission limits, tax and trade schemes from the shipper’s perspective and applied it to the policy analysis of the Yangtze River Economic Belt, which verified the model’s validity and practicability, and provided a strong support for the regional economic integration and the development of green logistics. Xin et al. (2023) proposed a bilevel programming model for liner alliance shipping network design. The model, which optimizes network and fleet design (upper level) and slot/empty container allocation (lower level), notably incorporates shippers’ choice inertia. Furthermore, an inverse optimization model was developed to ensure sustainable profit allocation among alliance members. This research provides crucial modeling support and algorithmic insights for optimizing shipping networks under multi-stakeholder strategic interactions. Wang et al. (2024) conducted an in-depth study of the impact of pricing strategies on the mixed hub port’s ability to simultaneously satisfy hinterland and transshipment demand, providing port operators with a scientific basis for pricing decisions. Fontes and Goncalves (2019) proposed a hub-and-spoke network structure for global liner shipping sub-hubs, which effectively reduces costs through economies of scale and path optimization and opens up a new path for the optimal design of global liner shipping networks. Alkaabneh et al. (2019) provide a new methodological support for the design of hub-and-spoke networks with inter-center economies of scale and center congestion effects through nonlinear mixed integer modeling combined with Lagrangian heuristic algorithms, which provides a new methodological support for dealing with this kind of complex problems. Chen et al. (2023a) addressed the dilemma of port development shifting from expansion to overcapacity by proposing an optimization model for port integration through capacity adjustment and market share trading. The model, solved using a genetic algorithm embedded in an inverse optimization model, aims to minimize total social cost by jointly optimizing berth construction schemes, market share trading, and government subsidies, offering a new optimization path for governments and port authorities to manage regional overcapacity and develop sustainable policies. Xu et al. (2025a) utilized a hierarchical regression model to evaluate the impact of natural factors and economic factors on the navigability of the Northeast Arctic Route (NER). The study confirmed that economic factors are the primary driver of cargo volume, and external events like major infrastructure projects and external shocks significantly alter shipping capacity and route selection. This analysis highlights the complexity and uncertainty of the external environment impacting global shipping networks, offering crucial references for the long-term planning and strategic decision-making of port consolidation and distribution systems. Liu et al. (2025) applied population ecology theory to revisit the concept and practices of smart ports. Using the Tianjin Port case study, they analyzed stakeholder relationships, system evolution, and information flow within the smart port ecosystem. Crucially, the study introduced the concept of “ecological health” for evaluating smart ports, operationalizing it through an evaluation framework which comprising four primary indicators to assess the system’s overall stability amid external uncertainties and readiness for operations.
2.2 Carbon emission reduction studies in intermodal transportation
As an emerging research field, intermodal transportation has gained the attention of many scholars in the past 20 years (Caris et al., 2013). With a series of environmental problems caused by the rapid development of the transportation industry, such as the increase in environmental pollution and the sharp rise in carbon emissions, the significant advantages and potential effects of intermodal transportation in energy saving and emission reduction have become the focus of competitive research in the academic community, which triggered a wide range of scholars and in-depth discussions. As a mode of transportation organization in the comprehensive transportation system, intermodal transportation has the characteristics of low cost, low pollution and high efficiency, which can effectively optimize the transportation structure and break through the bottleneck of economic development. In addition, intermodal transportation can also promote the formation of a unified market with interconnection between coastal and inland areas, and realize the pattern of “double circulation” at home and abroad (Yin et al., 2021). By synthesizing the existing literature, relevant studies can be roughly condensed into the following three broad categories: carbon emission reduction optimization strategies and model construction, analysis of carbon emissions and exploration of driving factors, carbon emission reduction response strategies for intermodal transportation considering uncertainty.
Carbon emission reduction optimization strategy and model construction, this kind of research focuses on the construction of optimization models and strategies to achieve the balance between carbon emission, cost, efficiency and other multi-objectives in the process of intermodal transportation, and provide specific optimization paths and decision-making basis for intermodal transportation carbon emission reduction. Some scholars are committed to constructing a comprehensive multi-objective optimization model, Yin et al. (2024) constructed a multi-objective planning model considering transportation cost, carbon trading cost, and transportation time, and obtained the Pareto optimal solution set with the help of NSGA-II algorithm, and verified the algorithm’s performance and model’s practicality through the arithmetic examples, meanwhile, carried out a sensitivity analysis on the subsidy of railroad freight transport, carbon quota, and carbon trading price, and provided the best solution for intermodal transportation operators. Lam and Gu (2016) developed a dual-objective optimization model to calculate the carbon emissions of intermodal container flows and constraints with the objectives of minimizing cost and transit time, and analyzed the impact of different carbon emission constraints on the design of intermodal transport networks through examples, which helps to build a cost-effective and cost-effective intermodal transport network that meets carbon emission reduction requirements. Sun and Lang (2015) established a mixed integer nonlinear planning model based on node arcs by considering multiple routes, road service capacity constraints, carbon emissions and customer demand factors, and verified the feasibility of the model solution and the effectiveness of the linearization method through the example of China’s inland container export business, which effectively solved large-scale practical multi-commodity intermodal transportation path problems and achieved carbon emission reduction while guaranteeing transportation efficiency. It effectively solves the large-scale practical multi-commodity intermodal transportation path problem, and realizes the goal of carbon emission reduction while guaranteeing the transportation efficiency.
Carbon emission reduction strategies and models are carried out for specific segments or subjects. Zhu et al. (2023) focus on shipping companies, explore the strategy of carbon emission cap-and-trade mechanism, and use a multi-objective particle swarm optimization algorithm based on the Pareto solution set to solve a two-layer model, which accurately depicts the interactions between governmental decision-making and that of shipping companies, and provides an effective reference to the market mechanism of carbon emission reduction in the shipping segment. Jiang et al. (2025) developed a marine fuel supply chain model involving the government, port, and dual fuel suppliers to address coordination challenges in green fuel adoption. By comparing four cooperation scenarios, the study demonstrated that a carbon tax effectively boosts green marine fuel sales, and collaboration among fuel suppliers significantly reduces government expenditure. Furthermore, findings revealed that increased substitutability between green and conventional fuels leads to higher profits for both the port and suppliers, offering a supply chain optimization perspective for green fuel promotion policies. Hu et al. (2025) proposed a multi-objective path optimization model, aiming to minimize carbon emissions and operating costs, while evaluating the impact of subsidy policy, carbon tax mechanism and energy structure on these objectives, which effectively solves the problem of the gap between the government’s and the enterprise’s objectives, and provides a decision-making basis for the choice of intermodal transport paths that takes into account the economy and environmental protection.
In addition, some studies explore carbon emission reduction optimization strategies from the perspective of supply chain and port dispatching. Wang et al. (2020b) propose an integrated scheduling model for supply chain management in port centers based on improved multi-heterogeneous coded genetic algorithm, and by analyzing the total cost and carbon emission under different operation strategies, they explore the impacts and countermeasures of the integrated scheduling on the optimization of supply chain system in the port centers and the carbon emission reduction policy, and achieve the dual goals of carbon emission reduction and efficiency improvement of port supply chain are achieved. Chen et al. (2014) proposed a new coastal liner route design model based on the user equilibrium allocation model, which can simultaneously determine the port of call, order of call, ship type, and service frequency, and minimize the state subsidy to coastal shipping operators under the given intermodal network carbon emission reduction target, providing a This provides a practical method for the design of coastal liner shipping routes to reduce carbon emissions.
Accurate accounting of carbon emissions and identification of key driving factors are the basis for formulating targeted carbon reduction measures. The second type of research centers on the accounting, estimation and analysis of drivers of intermodal transportation carbon emissions, providing data support and theoretical basis for the precise implementation of intermodal transportation carbon emission reduction measures. In terms of carbon emission analysis and driver research, studies are committed to constructing scientific accounting models and methods. Wang et al. (2020a) proposed a dynamic calculation method of intermodal transportation route parameters based on the simulation of Witness software, and established green evaluation indexes of intermodal transportation routes to evaluate the performance of routes under different intermodal transportation schemes, in which the green evaluation indexes cover the carbon emission-related content, which provides a good basis for intermodal transportation carbon emissions. Guo et al. (2022) focused on the inland container intermodal transport network, studied the estimation of carbon emissions and the identification of carbon emission reduction drivers, established a carbon emission estimation model, and estimated the carbon emissions of the hinterland-based container intermodal transport network in the last 10 years in the above seaport and the hinterland of Yangtze River Delta as an example, which provided a typical case of regional intermodal transport carbon emission accounting. Guo et al. (2023) on the other hand, proposed a simulation method for the peak time and peak value of carbon emissions from containerized intermodal transport networks, capturing the basic network elements through intermodal transport network modeling, combining the carbon emission model with scenario analysis, and simulating and predicting the probability of the peak time and value of carbon emissions by using the Monte Carlo algorithm, which not only achieves the estimation of the carbon emissions, but also makes a prediction of the peak value of the carbon emissions, and offers prospective suggestions for the long-term planning of intermodal transportation carbon emission reduction. emission reduction, which provides prospective guidance for the long-term planning of intermodal transportation. Xu et al. (2025d) compared various models and found that machine learning methods, due to their ability to capture nonlinear relationships, achieve significantly higher accuracy than traditional econometric models in predicting global shipping carbon dioxide emissions, thus offering more reliable policy support. Xu et al. (2025c) utilized the LMDI decomposition method to analyze the driving factors of carbon dioxide emissions, highlighting the upward pressure from global trade growth and advocating for the net-zero decarbonization pathway as the only effective route to achieving substantial reduction.
There are many uncertainties in the intermodal transportation process, such as transportation time, demand changes, etc., which will have an impact on the realization of carbon emission reduction targets. Such studies aim to construct models and methods to cope with uncertainty and guarantee the stability and effectiveness of intermodal transportation carbon emission reduction strategies. Some studies incorporate uncertainty factors into the construction of optimization models. Sun et al. (2022) measure the service level based on a fuzzy soft time window, set the travel time and carbon emission factor as variable parameters, and incorporate travel time uncertainty and road network service capacity factors to enhance route feasibility, apply trapezoidal fuzzy number customized uncertainty, and propose a fuzzy multi-objective nonlinear integrated truck departure time planning optimization model, demonstrating the effectiveness of the methodology through empirical case studies and discussing the impact of optimization results with improved confidence levels and service levels, providing ideas for coping with transport time uncertainty in intermodal transport to achieve carbon emission reduction. Hrušovský et al. (2018) proposed a framework combining optimization modeling and simulation, where the simulation model includes stochastic elements in the form of uncertain travel times, while the optimization model represents the Deterministic and Linear Multi-commodity Service Network Design Formulation, Considering the multi-objectives of cost, time and carbon emission, the solution is proposed for a transportation network of up to 250 services and 20 orders, and identifies possible disruptions and alternatives to accommodate unreliable transportation schedules, which guarantees the stable operation of intermodal carbon-reducing transportation networks in uncertain environments.
From a more macroscopic perspective, Sheng et al. (2017) constructed a multidimensional comprehensive assessment model from the government’s perspective, integrated the dynamic effects of the game between regional port competition and shipping companies, and analyzed and compared the market equilibrium states under different regulatory scenarios through a two-stage game framework. Although the study does not directly focus on the uncertainty factors, there are many uncertainties in the game process of regional port competition and shipping companies, such as fluctuations in market demand, strategic adjustments of competitors, etc. The study provides a reference for the government to formulate intermodal transportation carbon emission reduction related regulatory policies under the complex and volatile market environment, which can help to maintain the stability of the intermodal transportation market and indirectly safeguard the realization of carbon emission reduction goals. Xu et al. (2025b) employed a Stackelberg game model to explore the impact of government subsidies on the strategic decisions of two competing port operators regarding Shore-to-Ship Electricity (SSE) infrastructure construction, aiming to maximize social welfare. The study revealed that a lack of subsidies can lead to a Prisoner’s Dilemma where both ports construct SSE despite its economic infeasibility under high conversion degree. Furthermore, they cautioned that subsidies, while promoting construction, may reduce the likelihood of simultaneously achieving both environmental and economic benefits, offering insights for designing effective subsidy schemes to accelerate maritime decarbonization.
2.3 Summary of research status
In summary, existing literature has yielded fruitful results in path planning of port consolidation and distribution networks, carbon emission accounting, and emission reduction strategies from a single perspective. However, most studies rely on static optimization based on a global optimal perspective, often overlooking the bounded rationality and strategic interactions among independent stakeholders, and few have deeply analyzed how multi-party subjects resolve conflicts of interest under the constraints of “Dual Carbon” goals. Therefore, distinguishing itself from existing static optimization studies, this paper adopts a dynamic evolutionary game framework, incorporating the bounded rationality and strategic interactions of multiple agents into the analytical framework. We specifically investigate the dynamic decision-making mechanisms of different subjects in response to external policies, such as management effort and subsidies and internal additional incomes. Furthermore, rather than solely pursuing system cost minimization, this study focuses on resolving conflicts of interest to achieve a green collaborative equilibrium that satisfies the profit maximization objectives of all parties, thereby offering a more practical theoretical framework for the “Dual Carbon” transformation of port consolidation and distribution systems.
3 Multi-party cooperative game model construction of the consolidation and distribution system
3.1 Problem description
Generally speaking, evolutionary games assume that the participants are finitely rational, and then study the dynamic evolution process of their strategies. This paper analyzes the game relationship between multiple stakeholders and investigates the impact of different evolutionary states of each subject on the coordinated development of the consolidation and distribution system, including port operators, river-sea intermodal transport operators and road transport operators. The game relationship of each party is as follows:
3.1.1 The game between port operators and river-sea intermodal transport operators
As important nodes in the consolidation and distribution system, port operators can enhance their competitiveness by actively promoting river-sea intermodal transportation. However, the close distribution of inland river ports has led to fierce competition among different ports for cargo sources within their common radius. In order to cope with the competition, the government has formulated a strategic plan to establish port clusters, divided the port hierarchy, and guided the orderly development of ports and port clusters. By actively promoting intermodal transportation, ports can expand their service scope, attract more cargo sources, and improve port throughput and operational efficiency. There are two strategic choices for river-sea intermodal transportation operators, namely cooperation and competition, when facing the promotion of ports. In terms of cooperation, operators may establish a close partnership with ports to jointly build efficient river-sea intermodal transport corridors and realize resource sharing and complementary advantages. In terms of competition, operators may compete for market share by lowering prices, improving service quality and other means. However, excessive competition may lead to a decline in industry profits, which is not conducive to the sustainable development of the industry. It is necessary to strengthen cooperation with river-sea intermodal transport operators and road transport operators, and formulate reasonable policies to guide all parties to actively participate in river-sea intermodal transport and low-carbon transportation.
3.1.2 The game between port operators and road transport operators
It is of great significance for port operators to actively promote the low-carbon mode in the consolidation and distribution system. As global environmental and climate problems become more and more prominent, China needs to promote economic development while accomplishing the “Dual Carbon” goal, the carbon emissions of the logistics industry are mainly concentrated in the transportation and warehousing links, and the energy cleanliness of the transportation link is of great practical significance for the logistics industry to achieve the low-carbon goal. Port operators can promote low-carbon mode by optimizing port layout, improving energy use efficiency and promoting clean energy. Road transport operators are faced with the choice between low-carbon and traditional modes when facing low-carbon promotion in ports. Low-carbon mode requires operators to invest more money in purchasing new energy vehicles and building charging facilities, but in the long run, it can reduce operating costs, which is in line with national policies and market development trends. The traditional model, on the other hand, is relatively low-cost, but faces environmental pressures and policy constraints, and some enterprises still have problems such as incomplete disclosure of environmental data, making progress in low-carbon transformation slower.
3.1.3 The game between river-sea intermodal transport operators and road transport operators
River-sea intermodal transport operators and road transport operators face both the need for cooperation and the pressure of competition in the consolidation and distribution system. In terms of cooperation, the two sides can realize seamless connection of cargoes through intermodal cooperation, improve transportation efficiency and reduce logistics costs. For example, after transporting the goods to the port, the road transport operator can be responsible for transporting the goods to the destination, realizing the “door-to-door” transport service. In terms of competition, both parties are competing in terms of cargo sources and transportation markets, and both want to win more customers and market share. The strategic choices of the operators are affected by a variety of factors, including transportation costs, transportation time, service quality, policy support, and so on. For example, if a river-sea intermodal transport operator can provide lower transportation costs and faster transportation time, it may attract more customers to choose river-sea intermodal transport; while a road transport operator may also have an advantage in competition if it can provide more flexible services and a wider transportation network.
In the process of multi-party coordinated development of port consolidation and distribution, the main stakeholders involved include port operators, river-sea intermodal transport operators, and road transport operators. The relationship between the game parties in the tripartite evolution game is shown in Figure 1.
Figure 1
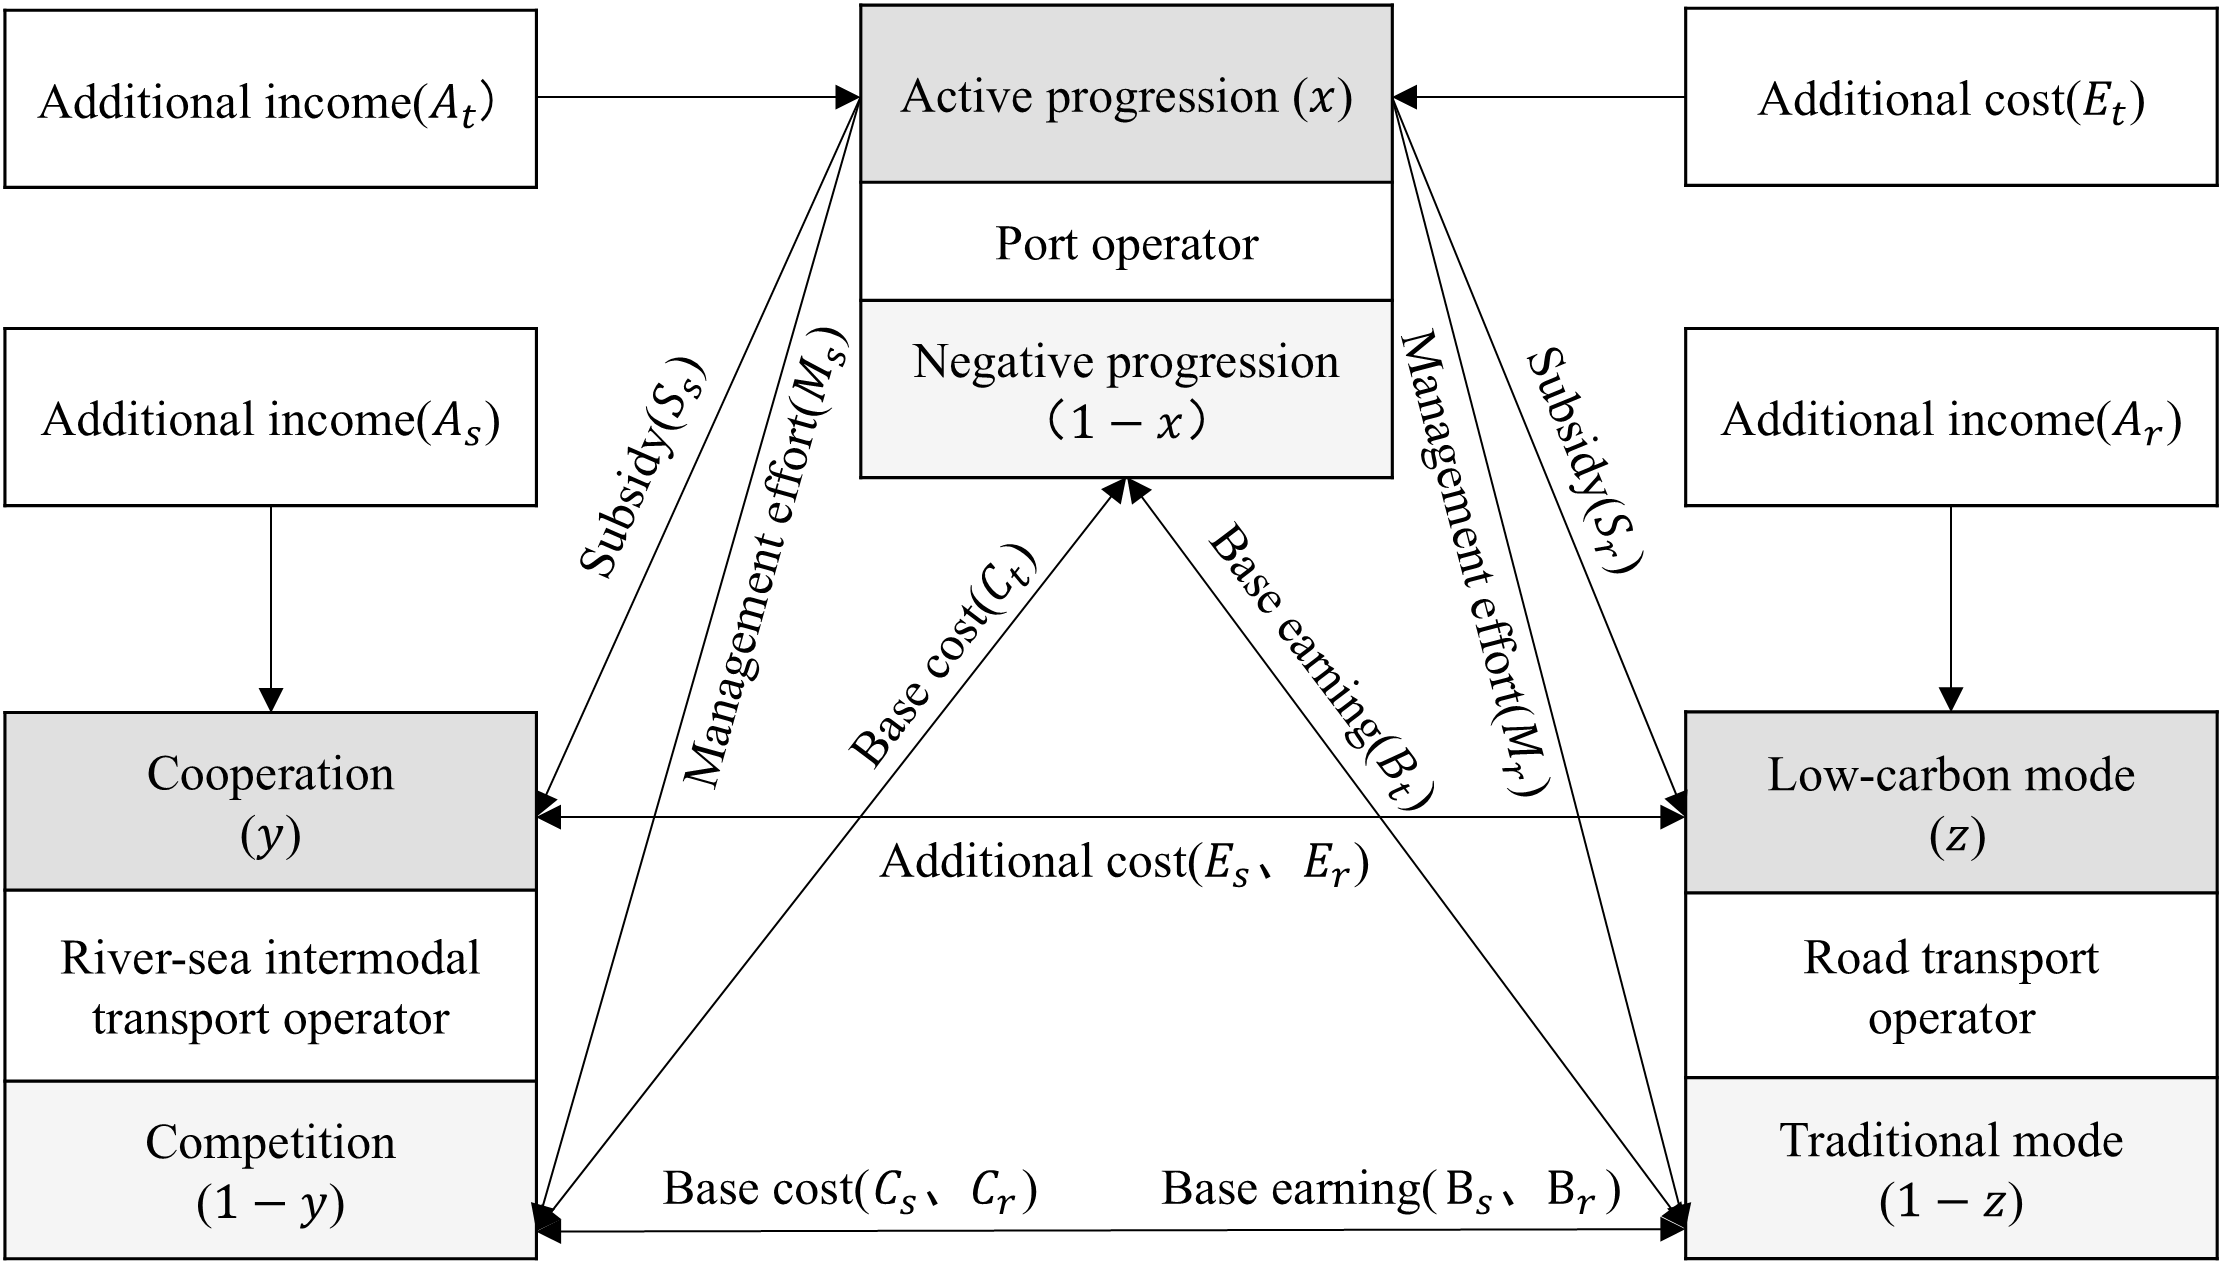
Logic diagram of the tripartite evolutionary game model.
3.2 Model assumptions and parameters
In order to establish an evolutionary game model and to study the strategies of each participant, the stability of the equilibrium point, and the interactions between the parameters, the following hypotheses are proposed:
-
The two strategies for port operators include “active progression” and “negative progression”; the two strategies for river-sea intermodal transport operators include “cooperation” and “competition”; The two strategies for road transport operators include “low-carbon mode” and “traditional mode”. All three are limited rational participants, and their strategy choices gradually evolve and stabilize to the optimal strategy over time.
-
The probability that a port adopts the strategy of “active progression” is x, and the probability of “negative progression” is . “Active progression” means that the port invests funds and other resources to enhance the coordinated efficiency of the consolidation and distribution network and increase the overall social benefits, and then subsidizes the responding port operators and strengthens the management of non-responding operators. “Negative progression” means that the port operators have not taken any initiative to intervene with the operators to realize the coordinated development of the consolidation and distribution network.
-
The probability that a river-sea intermodal transport operator adopts the strategy of “cooperation” is y, and the probability that it adopts the strategy of “competition” is . “Cooperation” refers to the close collaboration and resource sharing between river-sea intermodal transport operators and road transport operators to speed up the efficiency of the consolidation and distribution network for customers. “Competition” refers to actively seeking competitive advantages in the transportation market and competing for market share by means of lowering prices.
-
The probability of a road transport operator adopting a “low-carbon mode” strategy is z, and the probability of adopting a “traditional mode” strategy is . “Low-carbon mode” strategy aims to reduce carbon emissions and environmental pollution by adopting clean energy and new energy vehicles, improving vehicle efficiency, and optimizing transport routes. “Traditional mode” strategy is to continue to use traditional fuel vehicles and maintain the current transportation status. x, y, [0, 1].
-
Base cost of the port operators, river-sea intermodal transport operators and road transport operators in the evolved system when they operate independently is ; Base earing when they operate independently is ; When the three parties choose to cooperate with each other, in addition to the base cost, they also need to invest in the additional cost of cooperative cooperation, and at the same time obtain the additional income ; When the port operators chooses “active progression” strategy, it will bring social benefits to the port operators, which mainly include emission reduction, reputation and financial benefits brought by improving the transportation efficiency of the port consolidation and distribution system. Indirect gain G for port operators when they choose “active progression” strategy and indirect loss L when they choose “negative progression” strategy; Subsidy for river-sea intermodal transport operators choosing the “cooperation” strategy and subsidy for road transport operators choosing the “low-carbon mode” strategy. Conversely, management effort of river-sea intermodal operators choosing the “competition” strategy, and management effort of road transport operators choosing the “traditional model” strategy.
-
α is the ratio of additional cost E to base cost C, which is defined as low additional cost when α = 3%, slightly low additional cost when α = 5%, slightly high additional cost when α = 10%, high additional cost when α = 15%, super high additional cost when α = 30%, and extremely high additional cost when α = 45%. is the ratio of management effort to the base earning is defined as weak management effort when =5%, slightly weak management effort when =10%, slightly strong management effort when =15%, and strong management effort when =20%.
Based on the above description, the symbols in the model are defined as shown in Table 1.
Table 1
| Parameters | Descriptions |
|---|---|
| Base cost when the port operators is operated independently | |
| Base cost when the river-sea intermodal transport operator is operated independently | |
| Base cost when the road transport operator is operated independently | |
| Base earning when the port operators is operated independently | |
| Base earning when the river-sea intermodal transport operator is operated independently | |
| Base earning when the road transport operator is operated independently | |
| Additional cost that port operators need to invest when choosing to active progression | |
| Additional cost that river-sea intermodal transport operator needs to invest when choosing to cooperation | |
| Additional cost that road transport operator needs to invest when choosing to low-carbon mode | |
| Additional income that port operators need to invest when choosing to active progression | |
| Additional income that river-sea intermodal transport operator needs to invest when choosing to cooperation | |
| Additional income that road transport operator needs to invest when choosing to low-carbon mode | |
| Indirect gain from the port operators ‘s active progression of synergies | |
| Indirect loss from the port operators ‘s negative progression of synergies | |
| Subsidy provided by the port operators for river-sea intermodal transport operator choosing the “cooperation” strategy | |
| Subsidy provided by the port operators for road transport operator choosing the “low-carbon mode” strategy | |
| Management effort imposed by the port operators for river-sea intermodal transport operator choosing the “competition” strategy | |
| Management effort imposed by the port operators for road transport operator choosing the “traditional mode” strategy | |
| A | The ratio of to , which is used to define the level of additional cost |
| The ratio of to , which is used to define the strength of management effort | |
| The probability of port operators choosing “active progression” strategy | |
| The probability of river-sea intermodal transport operator choosing “cooperation” strategy | |
| The probability of road transport operator choosing “low-carbon mode” strategy |
Symbols and definitions to the tripartite game model.
3.3 Payoff matrix construction
Based on the above model assumptions, the game payoff matrix is obtained, as shown in Table 2. Among them, the incomes of port operators, river-sea transport operators, road transport operators are , , .
Table 2
| Strategy | River-sea intermodal transport operator | ||||
|---|---|---|---|---|---|
| Cooperation () | Competition () | ||||
| Road transport operator | Road transport operator | ||||
| Low-carbon mode () | Traditional mode | Low-carbon mode | Traditional mode () | ||
| Port operators | Active progression () |
||||
| Negative progression () |
|||||
Payoff matrix to the tripartite game model.
4 Analysis of multi-party benefits and stability under the evolutionary game
4.1 Expected benefits for each party
4.1.1 Expected benefits for port operator
In Equation 1, the expected benefits of the port operators to active progression, the expected benefits to negative progression and the average expected benefit are , , .
In Equation 2, the replicated dynamic equation for the port operators is obtained as:
4.1.2 Expected benefits for river-sea intermodal transport operator
In Equation 3, the expected benefits of the river-sea intermodal transport operator to cooperation, the expected benefits to competition and the average expected benefit are , , .
In Equation 4, the replicated dynamic equation for the river-sea intermodal transport operator is obtained as:
4.1.3 Expected benefits for road transport operator
In Equation 5, the expected benefits of the road transport operator to low-carbon mode, the expected benefits to traditional mode and the average expected benefit are , , .
In Equation 6, the replicated dynamic equation for the road transport operator is obtained as:
4.2 Stability analysis of tripartite evolutionary game system
4.2.1 Solving the evolutionary game equilibrium points
Since the probability of any strategy chosen by the port operators, the river-sea intermodal transport operator, and the road transport operator during the dynamic game will change over time, the overall evolutionary game will stabilize when the replicated dynamic equations of the three parties is =0, =0, =0.
Solving the system of replicated dynamic equations, the following 12 equilibrium points exist, including 8 pure strategy solutions: (0, 0, 0), (1, 0, 0), (0, 1, 0), (0, 0, 1), (1, 1, 0), (1, 0, 1), (0, 1, 1), (1, 1, 1), and 4 mixed strategy solutions (, , ), , , [0, 1]. In asymmetric games only pure strategies can reach an evolutionary stable state, and mixed strategies cannot be stable evolutionary strategies, so only pure strategy equilibrium points are discussed subsequently.
4.2.2 Stability analysis of equilibrium points
Construct the Jacobi matrix of the tripartite evolutionary game system based on the replicated dynamic equations for:
Invoke Lyapunov’s first method to determine the stability of the equilibrium point in the Jacobi matrix (Friedman, 1991). If all the eigenvalues of the Jacobi matrix have a negative real part, the equilibrium point is asymptotically stable; if at least one of the eigenvalues of the Jacobi matrix has a positive real part, the equilibrium point is unstable; if all the eigenvalues of the Jacobi matrix have a negative real part except the eigenvalue with zero real part, the equilibrium point is in a critical state, and the stability can’t be determined by the sign of the eigenvalue. Analyzing the eigenvalue stability of the pure strategy equilibrium point is shown in Table 3.
Table 3
| Equilibrium point | Eigenvalues | Eigenvalues | Eigenvalues |
|---|---|---|---|
| (0, 0, 0) | |||
| (1, 0, 0) | |||
| (0, 1, 0) | |||
| (0, 0, 1) | |||
| (1, 1, 0) | |||
| (1, 0, 1) | |||
| (0, 1, 1) | |||
| (1, 1, 1) |
Eigenvalues of the equilibrium point.
Corollary 1: When satisfying , , , the replication dynamics equation exists with an equilibrium point of (1, 0, 0), the combination of strategies (active progression, competition, traditional mode) is a stable strategy for this system after evolution.
Corollary 1 shows that according to Table 2, when the condition is satisfied, , then the equilibrium point (0, 0, 0) is an unstable point. When the conditions , , , are satisfied, the equilibrium points (1, 1, 0), (1, 0, 1) are unstable points. When the conditions , , are satisfied, , , then the equilibrium points (0, 1, 1) and (1, 1, 1) are saddle points or unstable points, and there is an asymptotic stabilization point (1, 0, 0) in the system.
Corollary 2: When , , are satisfied, there exists an asymptotic equilibrium point of (1, 0, 0) for the replication dynamics equation, the combination of strategies (negative progression, cooperation, low-carbon mode) is a stable strategy for this system after evolution.
Corollary 2 shows that according to Table 2, when the conditions and are satisfied, the equilibrium point (1, 1, 1) is an unstable point. When the conditions , are satisfied, then the equilibrium points (0, 1, 0), (0, 0, 1) are unstable points. Equilibrium points (0, 0, 0), (1, 0, 0), (1, 1, 0), (1, 0, 1) are saddle points or unstable points, and there is an asymptotic stabilization point (0, 1, 1) of the system, i.e., the combination of the strategies (negative progression, cooperation, low-carbon mode) is the stable strategy of the system after evolution.
Corollary 3: When , , are satisfied, there exists an asymptotic equilibrium point of (1, 0, 0) for the replication dynamics equation, i.e., the combination of strategies (active progression, cooperation, low-carbon mode) is a stable strategy for this system after evolution.
Corollary 3 shows that when the condition is satisfied, , then the equilibrium point (0, 1, 1) is an unstable point. When the conditions , are satisfied, , - , then the equilibrium points (1, 1, 0), (1, 0, 1) are unstable points. The equilibrium point (0, 0, 0), (1, 0, 0) is a saddle point or unstable point, and the system exists an asymptotic stabilization point (1, 1, 1), i.e., the combination of the strategies (active promotion, cooperation, low-carbon mode) is a stable strategy for this system after evolution. The eigenvalue sign and stability corresponding to the equilibrium point are shown in Table 4.
Table 4
| Equilibrium point | Eigenvalue symbols | Stability | ||
|---|---|---|---|---|
| Eigenvalues | Eigenvalues | Eigenvalues | ||
| (0, 0, 0) | * | – | – | saddle or unstable |
| (1, 0, 0) | – | – | – | ESS |
| (0, 1, 0) | * | + | * | unstable |
| (0, 0, 1) | * | * | + | unstable |
| (1, 1, 0) | * | * | * | saddle or unstable |
| (1, 0, 1) | * | * | * | saddle or unstable |
| (0, 1, 1) | – | – | – | ESS |
| (1, 1, 1) | – | – | – | ESS |
Evolutionary stability of the equilibrium point.
Symbols used in this table: “+” denotes a positive value; “-” denotes a negative value; and “*” denotes an uncertain sign (sign depends on specific parameter conditions).
5 Simulation-based coordinated evolutionary dynamics and sensitivity analysis
On the basis of the previous three game stable states and stability conditions, in order to more intuitively analyze the evolutionary dynamics of port operators, river-sea intermodal transport operators and road transport operators in the coordination of the consolidation and distribution network and the sensitivity of the three parties to the relevant parameters, this paper uses Matlab to simulate and analyze the numerical values.
5.1 Analysis on the stable evolutionary strategy
For the equilibrium point (1, 0, 0), there exists a stable evolutionary strategy when it satisfies , , . Under this condition, its simulation parameter assignments are shown in Table 5 Scene 1. As shown in Figure 2, as the evolution progresses, the probability of river-sea intermodal transport operators choosing “competition” and road transport operators choosing “traditional mode” strategy increases, which is due to the fact that under the condition of Corollary 1, the management effort loss of river-sea intermodal transport operators choosing “competition” is smaller than the difference between the additional cost and subsidy of choosing “cooperation”; Meanwhile, under the hypothetical condition, the management effort loss of road transport operators choosing “traditional mode” is smaller than the difference between the additional cost and subsidy of choosing “ low-carbon mode “, Therefore, river-sea intermodal transport operators and road transport operators will tend to choose the “competition” and “traditional mode” strategies respectively. Under the condition of , the difference between the additional cost and the management effort gain, indirect gain of the port operators choosing “active progression” is smaller than the indirect loss of the “negative progression” strategy, so the port operators will prefer “active progression” to enhance the reputation of the status and to promote the coordinated cooperation of the operators. In this case, the stabilization strategies of port operators, river-sea intermodal transport operators and road transport operators are “active progression”, “com- petition” and “traditional mode” respectively.
Table 5
| Parameter category | Symbol | Description | Scene 1 | Scene 2 | Scene 3 |
|---|---|---|---|---|---|
| Variable Parameters | Additional cost of port operator | 15 | 20 | 15 | |
| Additional cost of river-sea intermodal transport operator | 60 | 25 | 40 | ||
| Additional cost of road transport operator | 60 | 25 | 40 | ||
| Additional income for river-sea intermodal transport operator | 30 | 55 | 70 | ||
| Additional income for road transport operator | 30 | 55 | 70 | ||
| Management effort for river-sea intermodal transport operator | 15 | 20 | 15 | ||
| Management effort for road transport operator | 12 | 15 | 12 | ||
| Subsidy for river-sea intermodal transport operator | 4 | 25 | 40 | ||
| Subsidy for road transport operator | 7 | 20 | 40 | ||
| Indirect gain for port operator | 20 | 15 | 60 | ||
| Indirect loss for port operator | 20 | 15 | 60 | ||
| Fixed Parameters | Additional income for port operator | 55 | 55 | 55 | |
| Base earning of port operator | 80 | 80 | 80 | ||
| Base earning of river-sea intermodal transport operator | 60 | 60 | 60 | ||
| Base earning of road transport operator | 60 | 60 | 60 | ||
| Base cost of port operator | 40 | 40 | 40 | ||
| se cost of river-sea intermodal transport operator | 30 | 30 | 30 | ||
| Base cost of road transport operator | 30 | 30 | 30 |
Simulation parameter assignment.
Figure 2
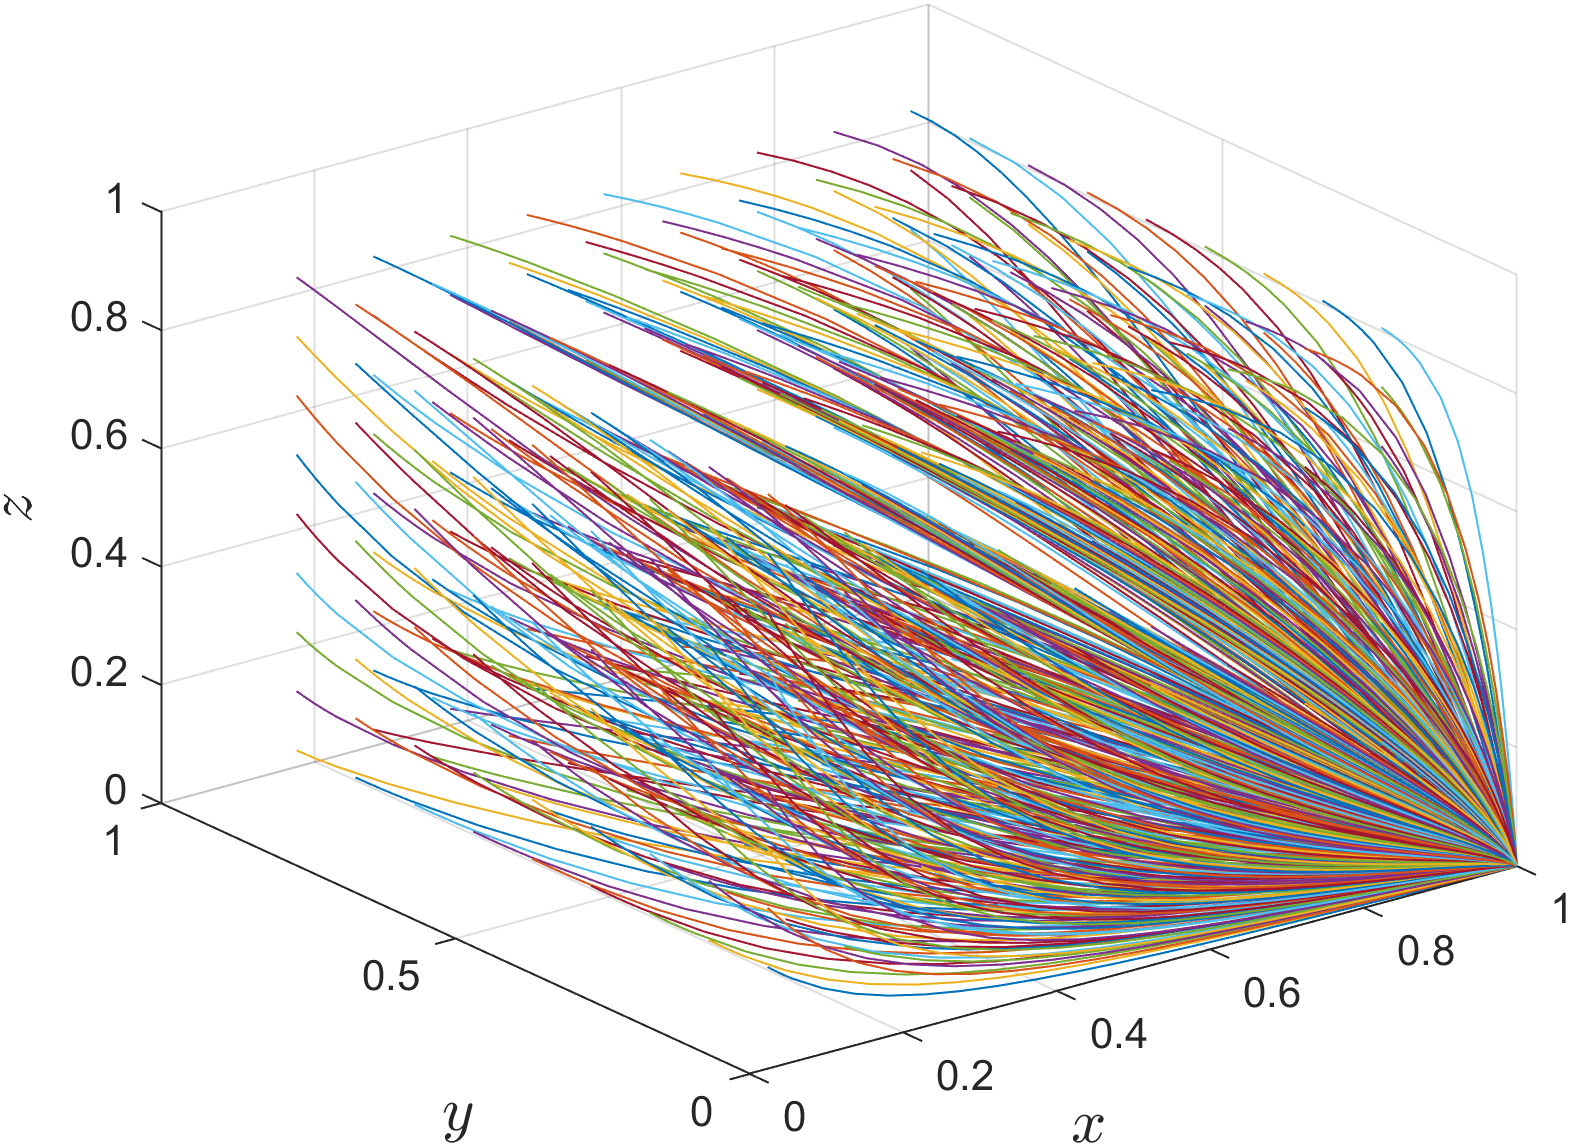
Evolution path of the equilibrium point (1, 0, 0).
For the equilibrium point (0, 1, 1), there exists a stable evolutionary strategy when it satisfies , , . Under this condition, its simulation parameter assignments are shown in Table 5 Scene 2. As shown in Figure 3, as the evolution progresses, the probability of river-sea intermodal transport operators choosing “cooperation” and road transport operators choosing “low-carbon mode” strategy increases. This is because under the condition of Corollary 2, the additional income of the river-sea intermodal transport operators choosing “cooperation” are more than the additional cost; Meanwhile, under the hypothetical condition, the additional income of the road transport operators choosing “low-carbon mode” are more than the additional cost, so the river-sea intermodal transport operators and the road transport operators will tend to choose “cooperation” and “low-carbon mode”, respectively. Therefore, river-sea transport operators and road transport operators will tend to choose the “cooperation” and “low-carbon mode” strategies respectively. Under the condition of , the indirect loss of the port operators choosing “negative progression” is smaller than the difference between the additional cost, expenditure subsidy and indirect gain when choosing “active progression”, so in order to avoid excessive capital expenditure, the port operators will tend to choose the strategy of “negative progression” strategy. In this case, the stabilization strategies for port operators, river-sea intermodal transport operators, and road transport operators are “negative progression”, “cooperation”, and “low-carbon mode”, respectively.
Figure 3
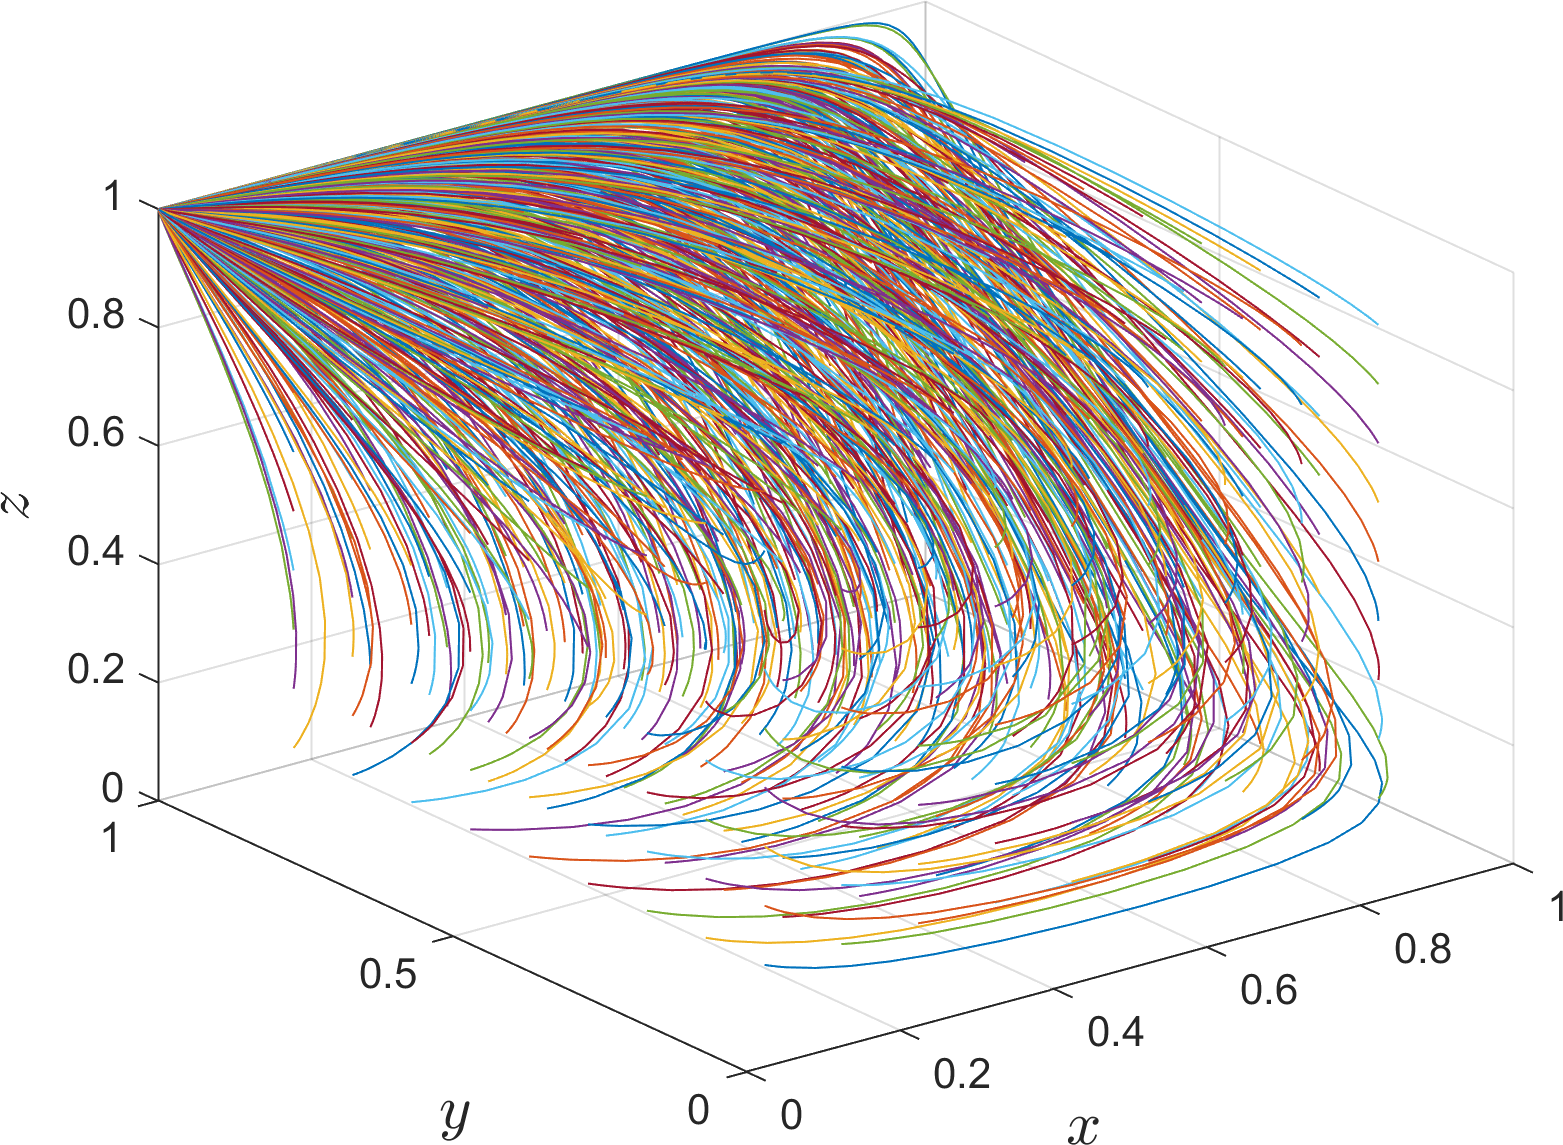
Evolution path of the equilibrium point (0, 1, 1).
For the equilibrium point (1, 1, 1), there exists a stable evolution strategy for it when , , are satisfied. Under this condition, its simulation parameter assignments are shown in Table 5 Scenario 3. As shown in Figure 4, as the evolution progresses, the probability of river-sea intermodal transport operators choosing “cooperation” and road transport operators choosing “low-carbon mode” increases, This is because under the condition of Corollary 3, the difference between the additional cost and the additional income, subsidy of choosing “cooperation” is smaller than the management effort loss when choosing “competition”; Meanwhile, under the hypothetical conditions, the additional cost and the additional income, subsidy of road transport operators choosing “low-carbon mode” are smaller than the management effort loss when choosing “competition”. Therefore, river-sea intermodal transport operators and road transport operators will tend to choose the “cooperation” and “low-carbon mode” strategies, respectively. Under the condition of , the difference between the additional cost and subsidy and indirect gain for port operators choosing “active promotion” is smaller than the indirect loss when choosing “negative progression”, and port operators will tend to choose the “active progression” strategy. The difference between the additional cost, subsidy and the indirect gain is smaller than the indirect loss when choosing “negative progression”. In this case, the three parties actively cooperate to promote the coordinated development of the consolidation and distribution network, and the stabilization strategies of port operators, river-sea intermodal transport operators and road transport operators are “active progression”, “ cooperation” and “low-carbon mode” respectively.
Figure 4
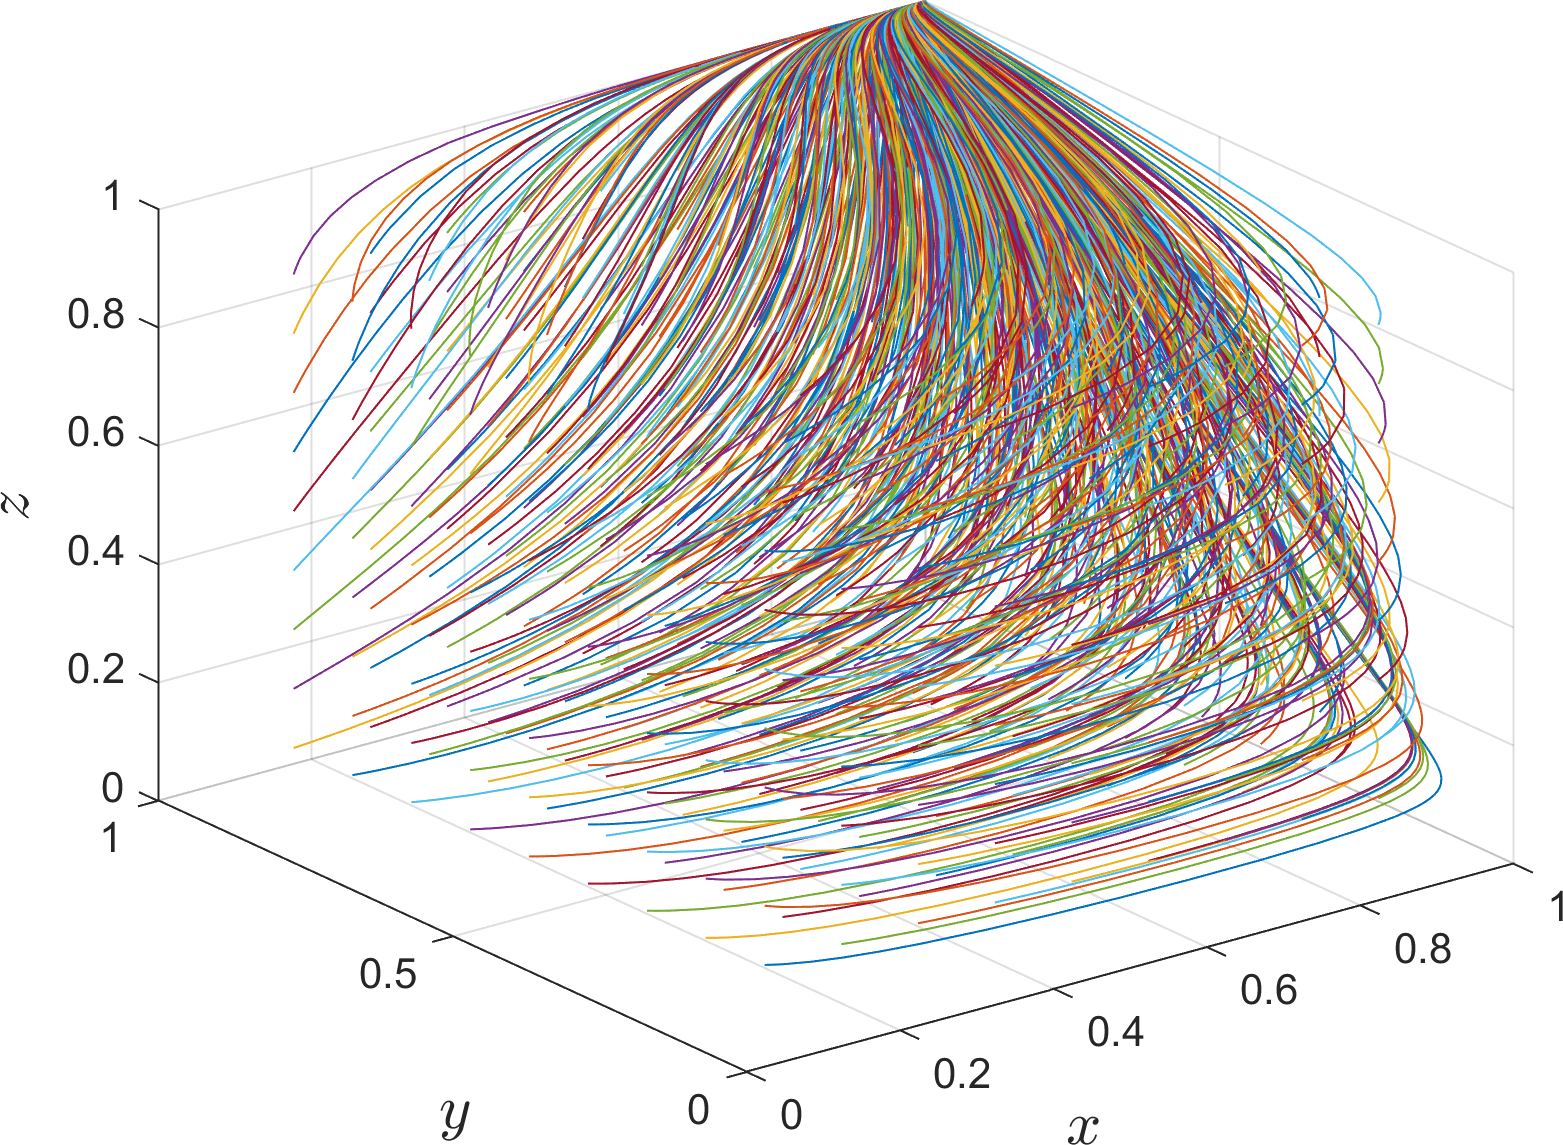
Evolution path of the equilibrium point (1, 1, 1).
In summary, under the two stable evolution states of (1, 0, 0) and (0, 1, 1), the operators and port operators choose the strategies of “competition”, “traditional mode” and “negative progression”, respectively. “. In this case, the expected benefits of all three parties cannot be maximized. In the stable state of (1, 1, 1), the port operators actively promotes the cooperation of operators, the river-sea intermodal transport operators choose the “cooperation” strategy, the road transport operators choose the “low-carbon mode”, the rapid operation of the consolidation and distribution network, the port operators does not have to bear indirect loss, and because of the positive response of the operators, the port operators cannot implement the management effort, thus saving the cost of supervision, rational optimization of inputs and expenditures, to achieve the ideal maximization of income. Therefore, the optimal strategy combination is (1, 1, 1), that is, the port operators choose “active progression” strategy, the river-sea intermodal transport operators choose “cooperation” strategy, the road transport operators choose “low-carbon mode” strategy, to realize the high-speed operation of the consolidation and distribution network and achieve the ideal maximization of the tripartite benefits.
5.2 Simulation parameter analysis
5.2.1 Simulation analysis of the evolution of the equilibrium point (1, 0, 0)
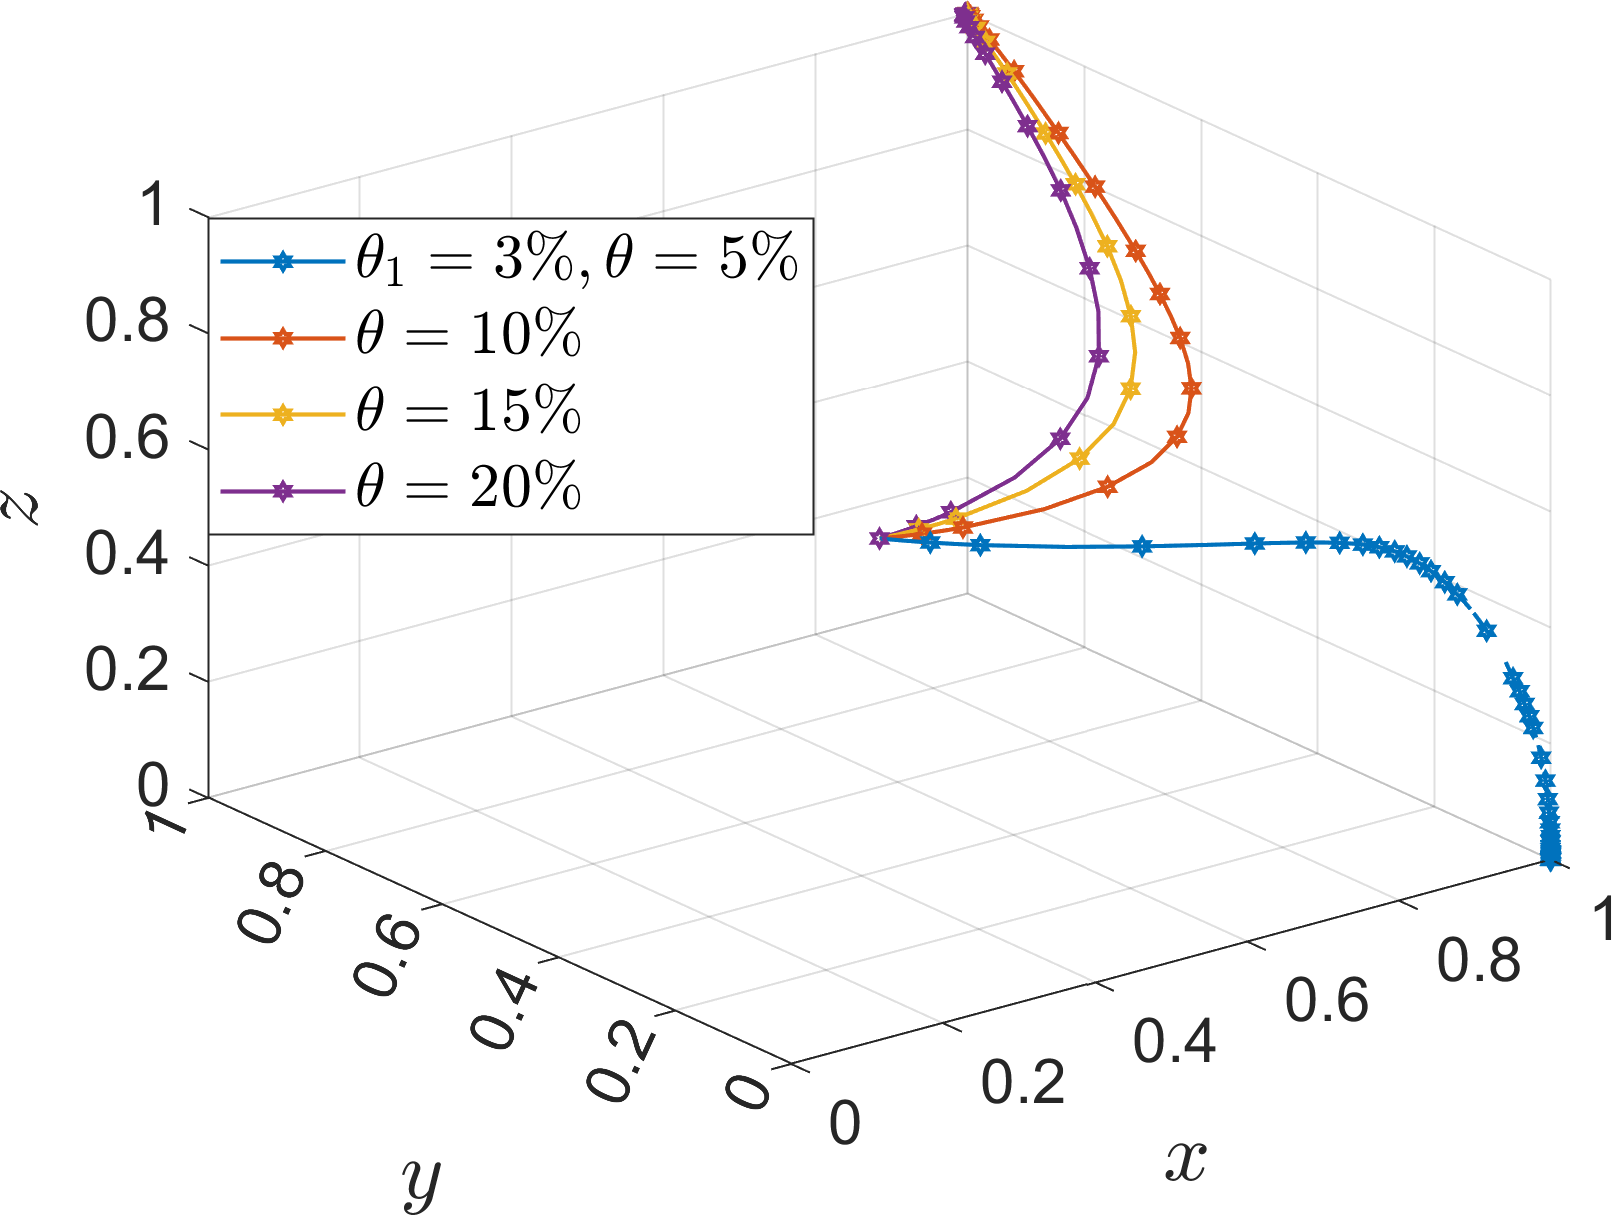
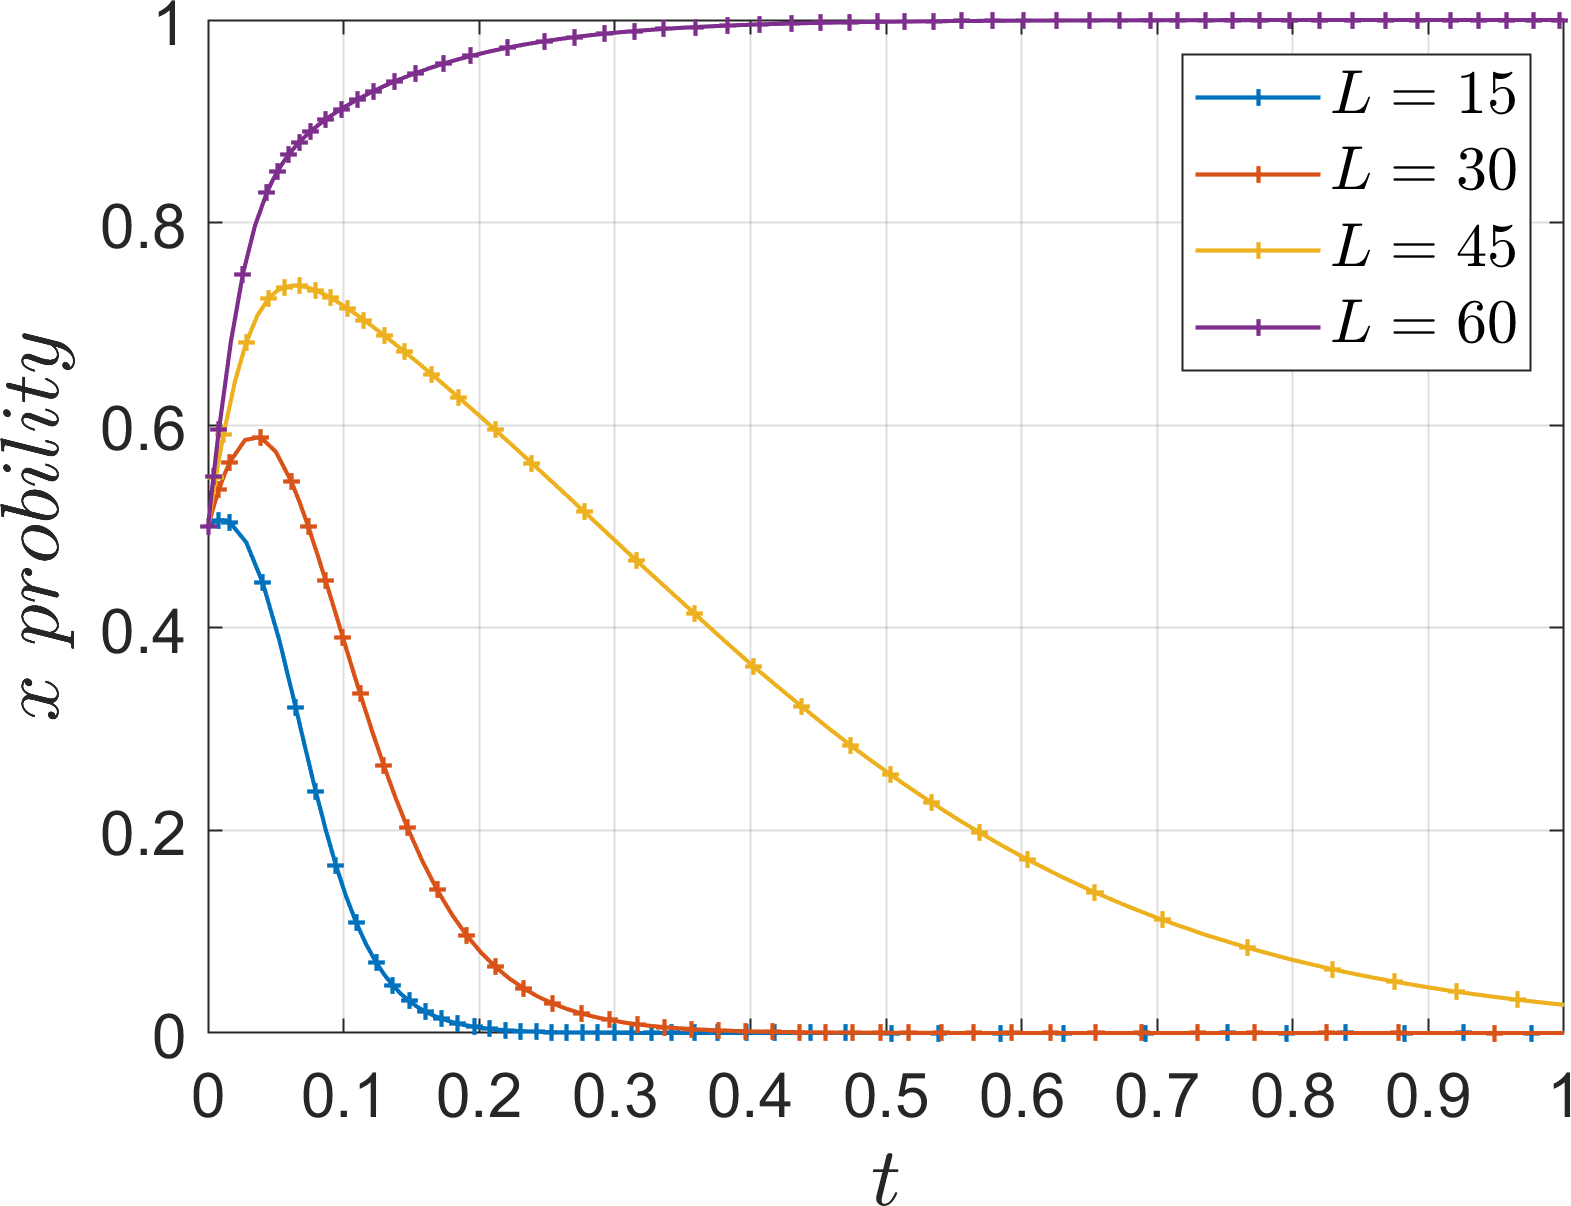
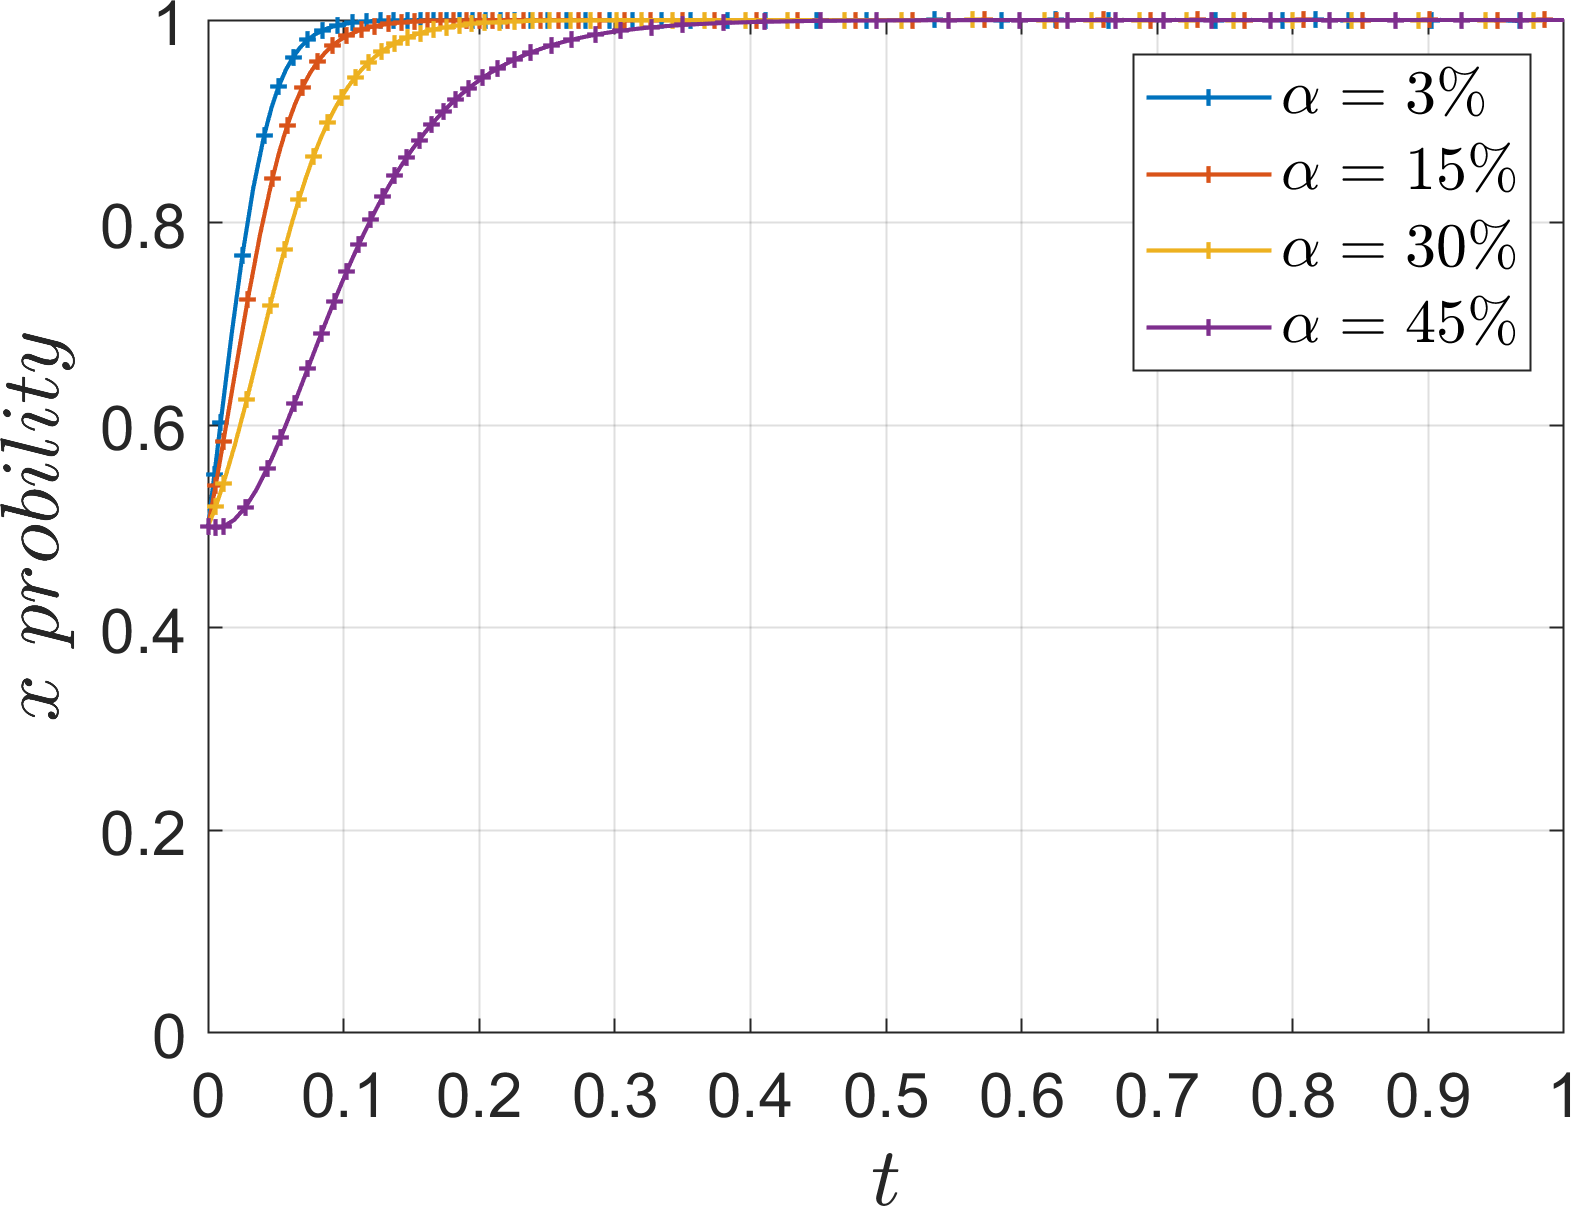
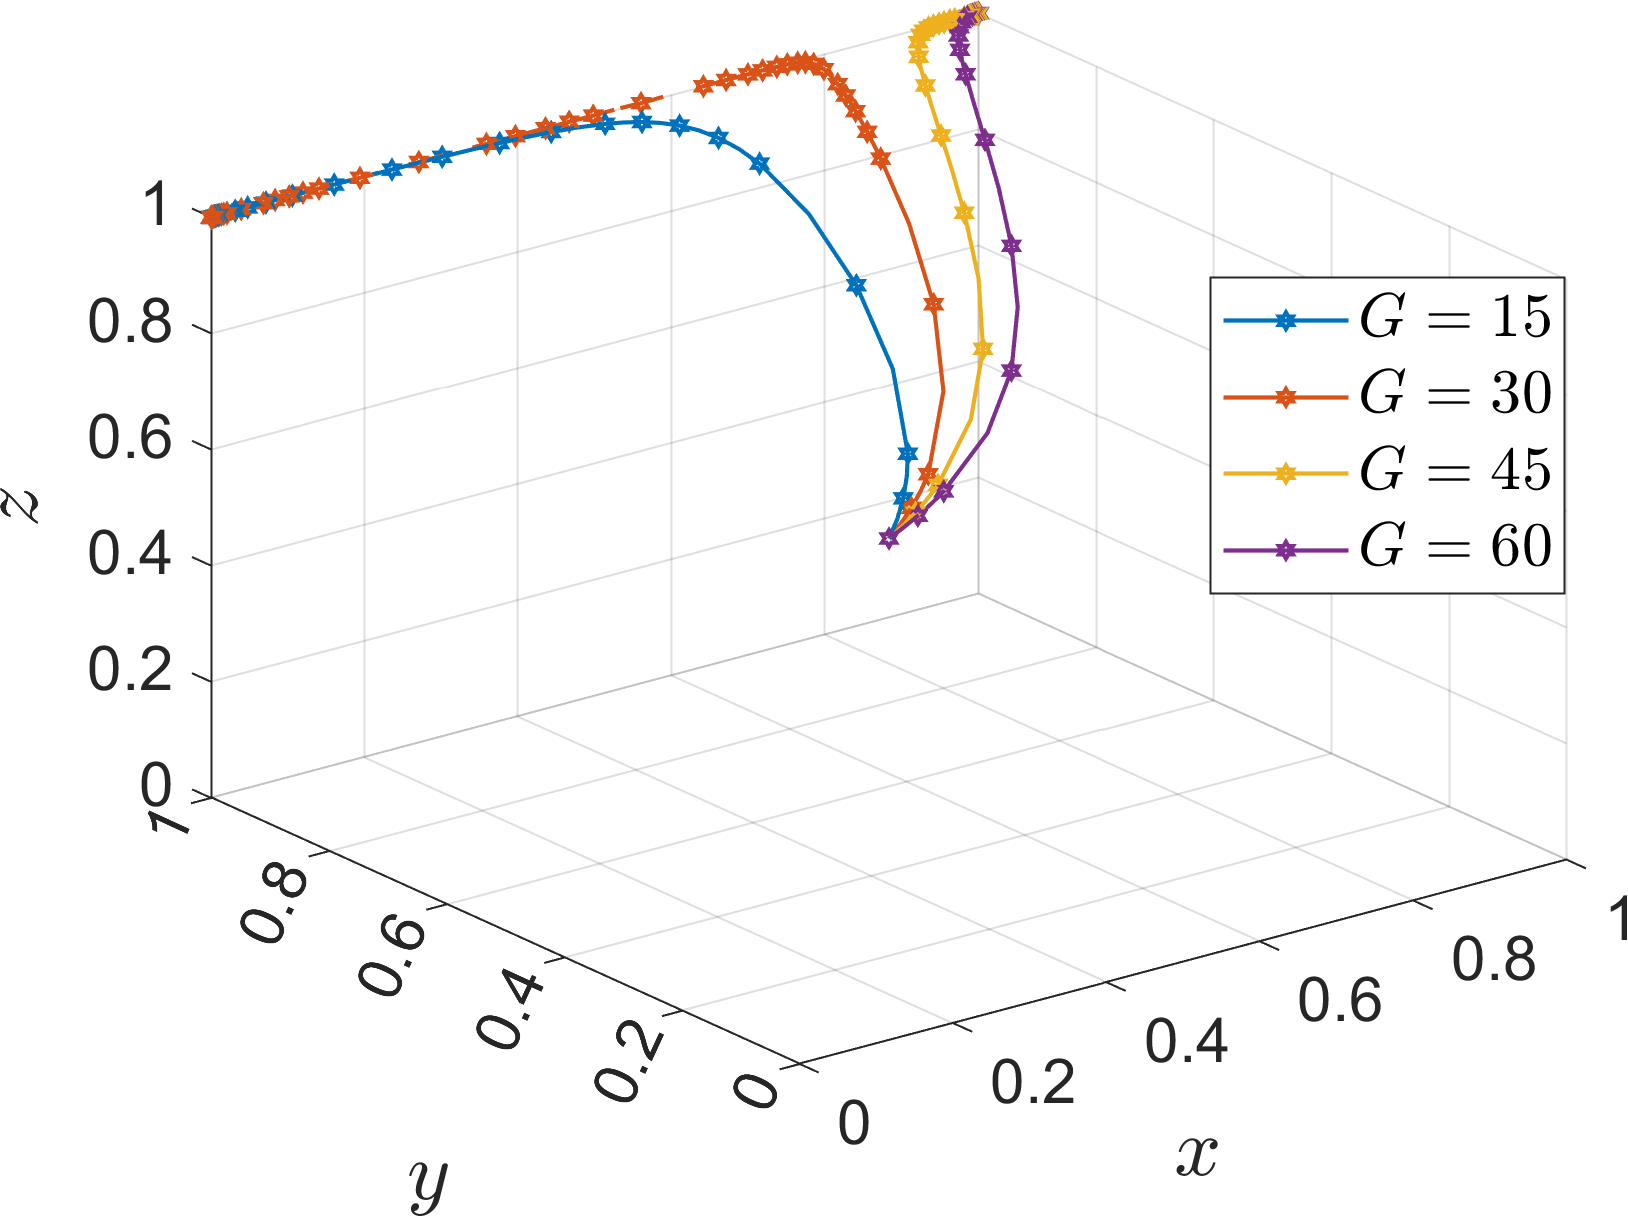
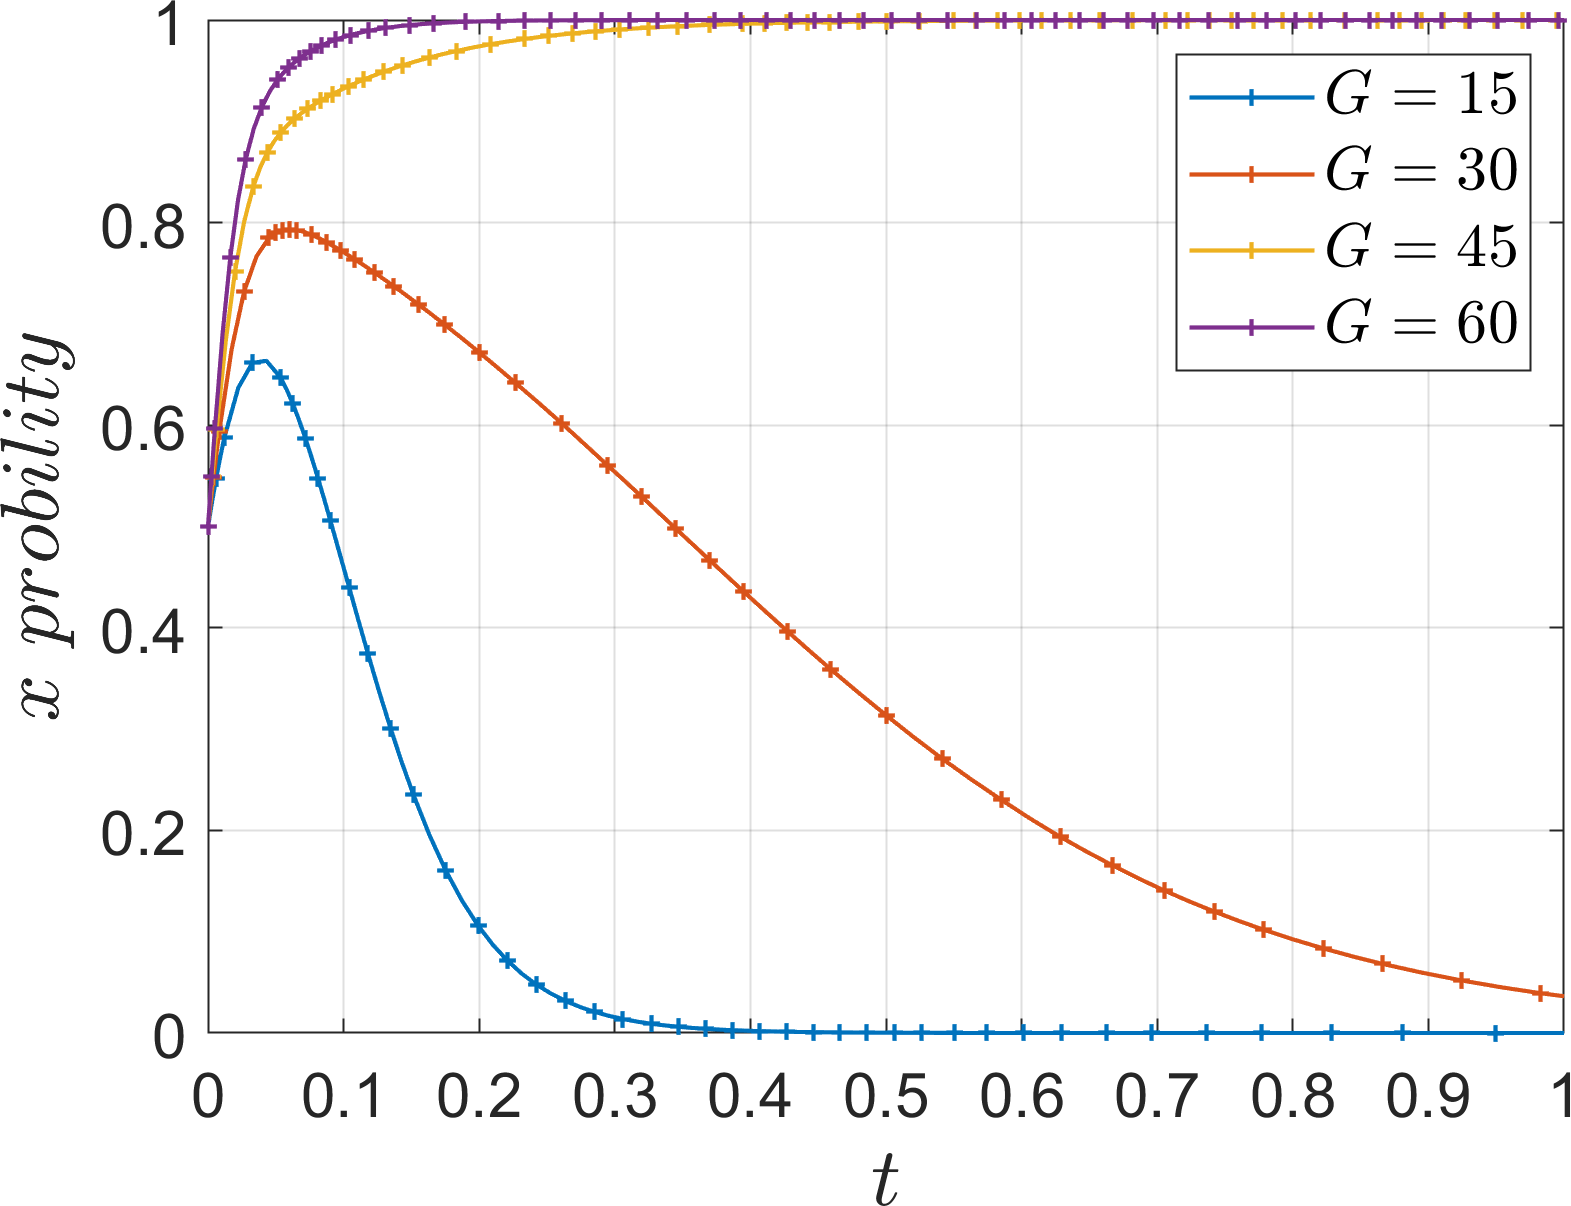
Based on Table 5 Scene 1 and satisfying all the conditions in Corollary 1, its simulation parameters are assigned as follows: =15, =60, =60, =30, =30, =15, =12, =4, =7, =20, =20, set the initial value of strategy selection probability of the three parties of the game (, , ) as (0.5, 0.5, 0.5). To analyze the impact of parameters , , , , , on the process and outcome of the system evolution. In order to analyze the effect of the additional cost on the evolution of the system, the values of , are assigned as 5, 10, 15, 20. The parameter is introduced as the ratio of the additional cost to the base cost , which is defined as low additional cost when =3%, slightly low additional cost when =5%, slightly high additional cost when =10%, and high additional cost when =15%, and the simulation results are shown in Figures 5–7.
Figure 5
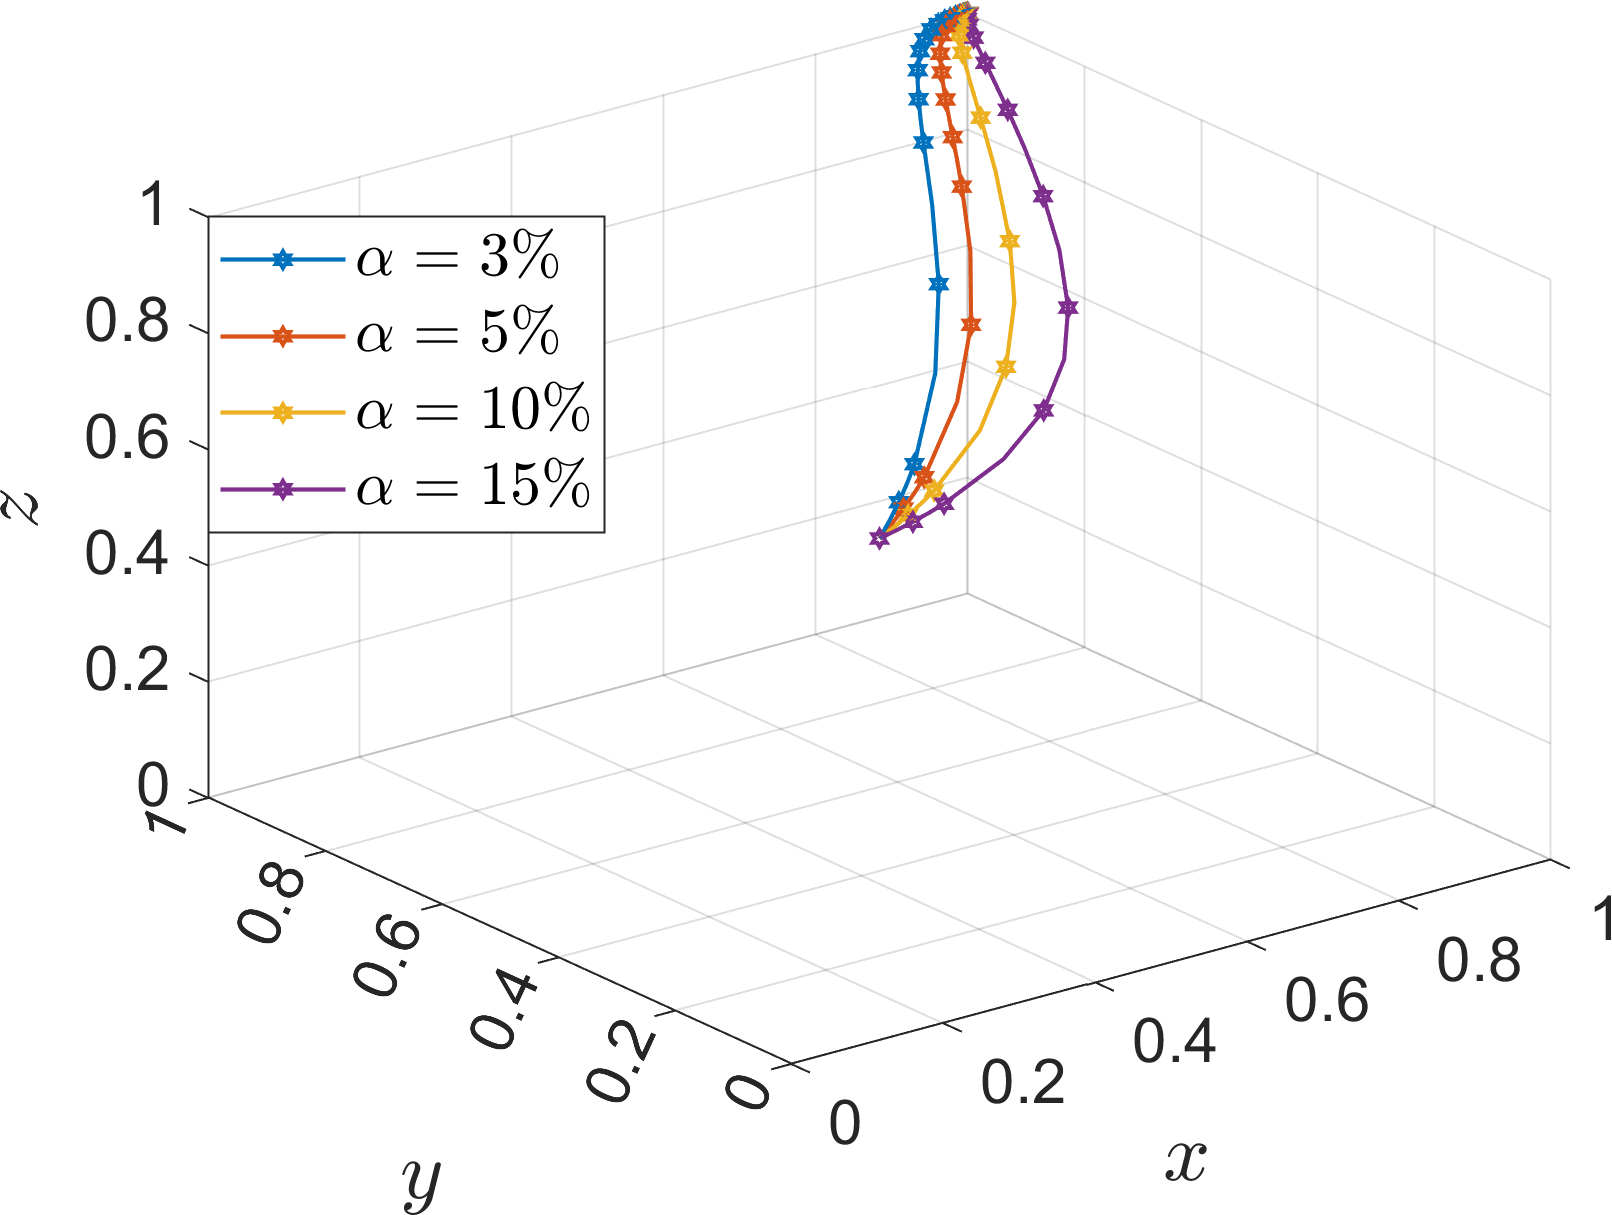
Effect of (ratio additional cost to base cost ) on the evolutionary system.
Figure 6
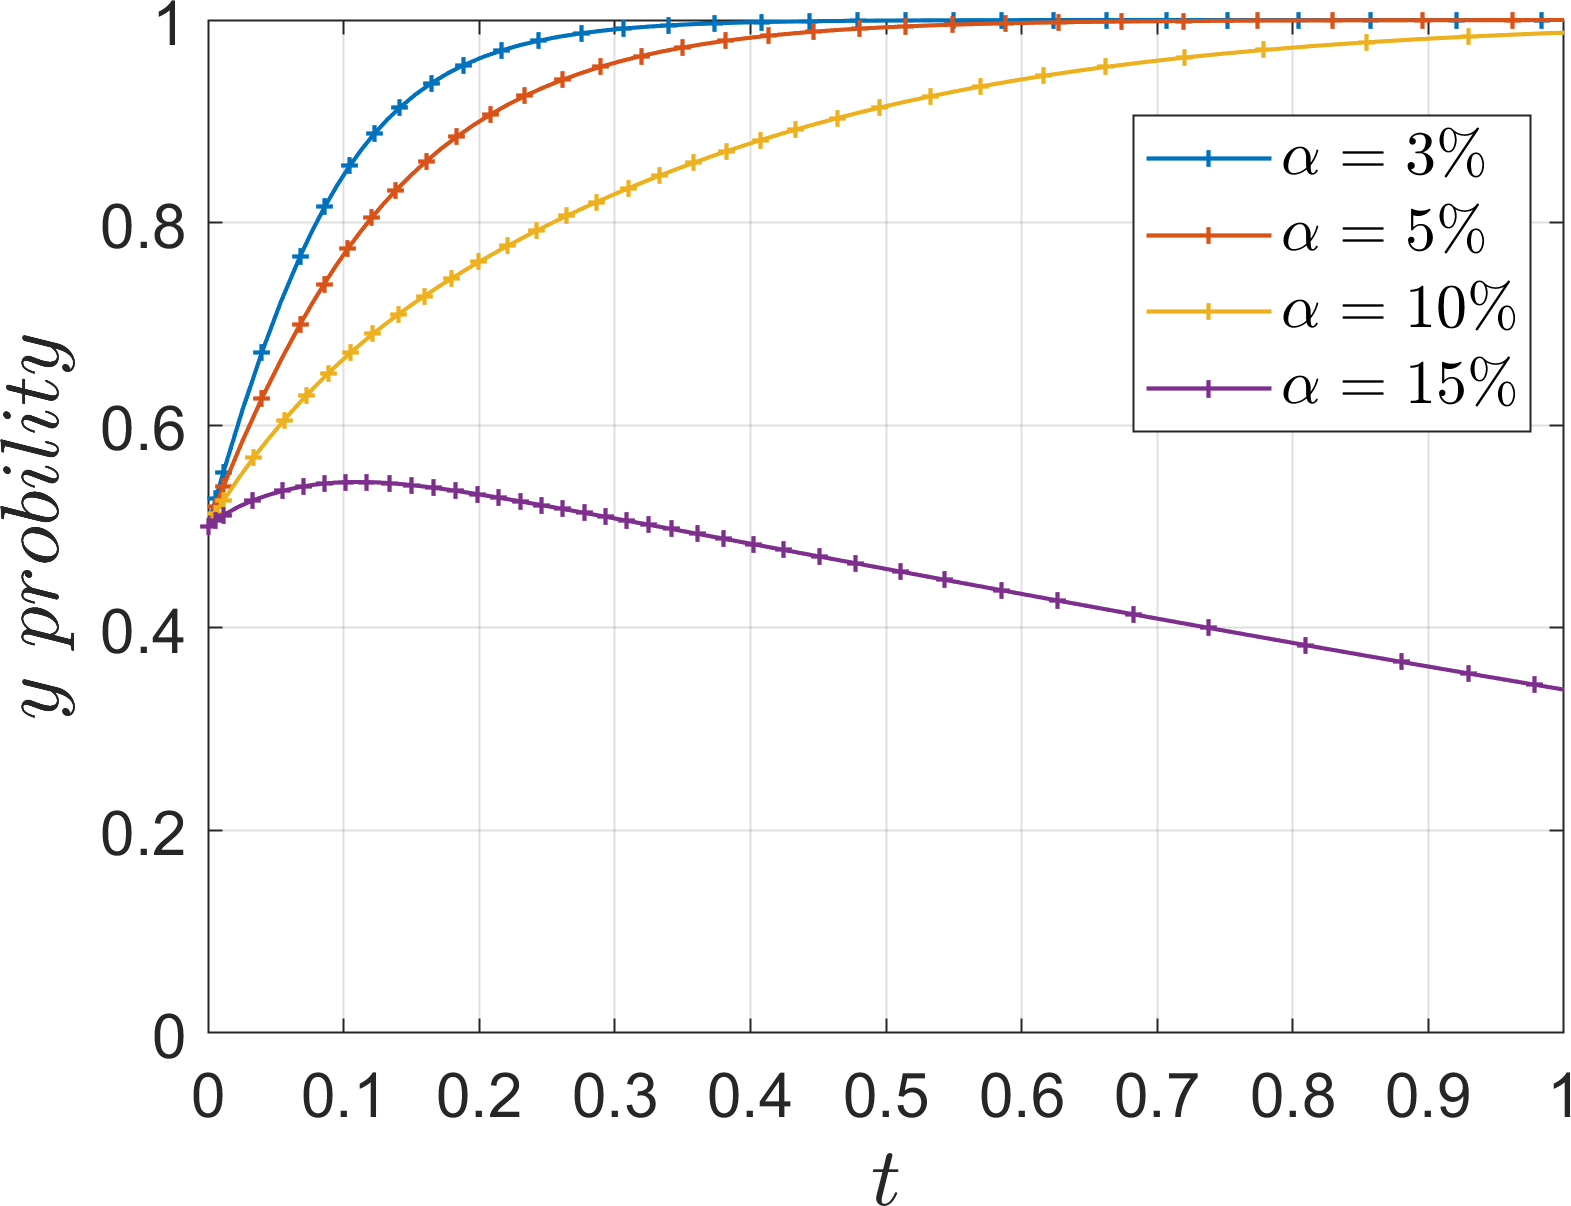
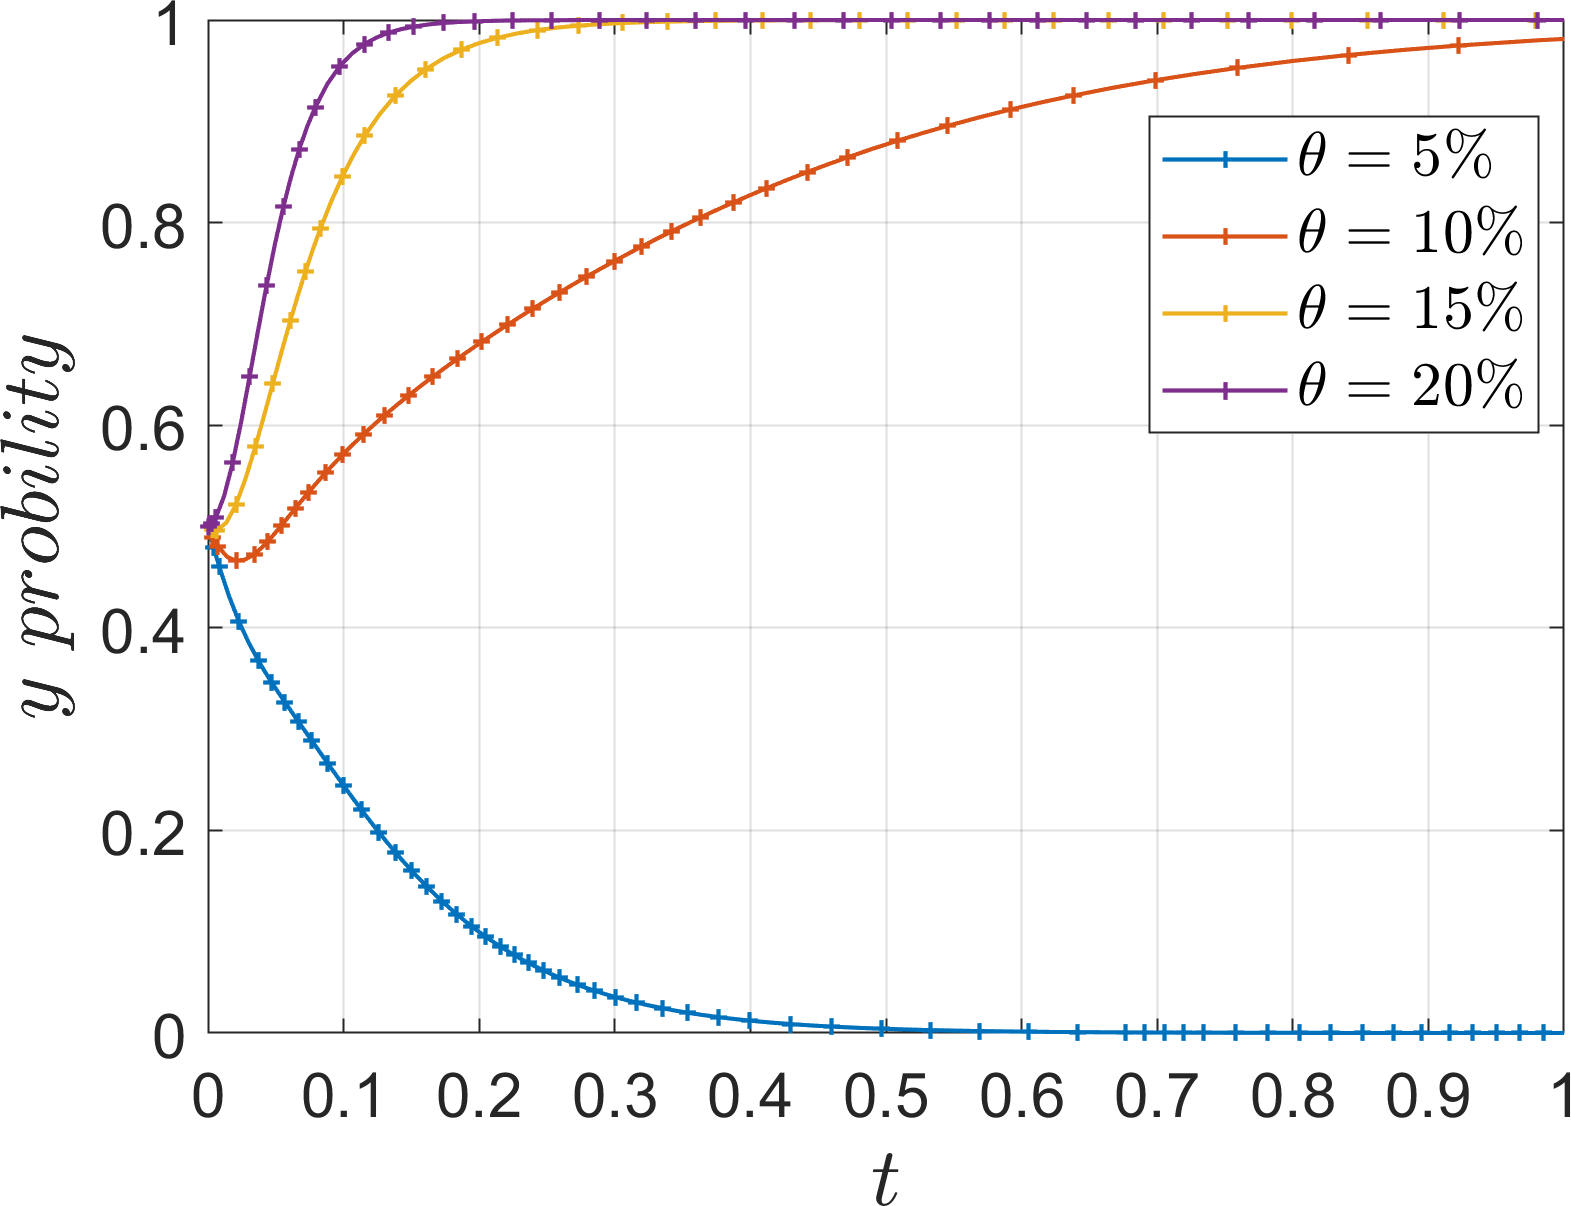
Effect of to the evolutionary strategy of river-sea intermodal transport operators.
Figure 7
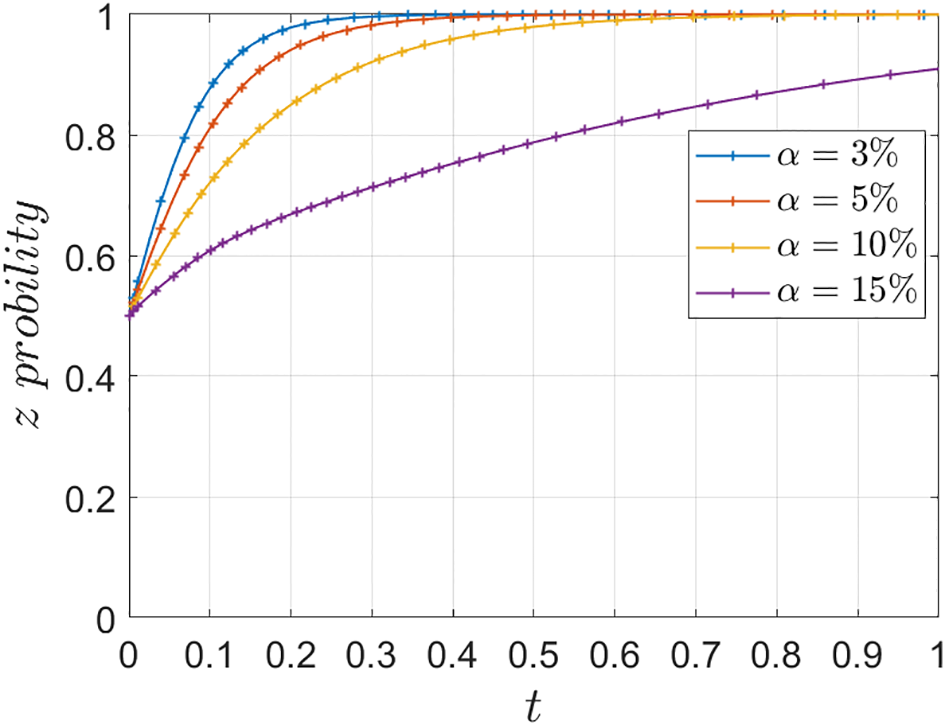
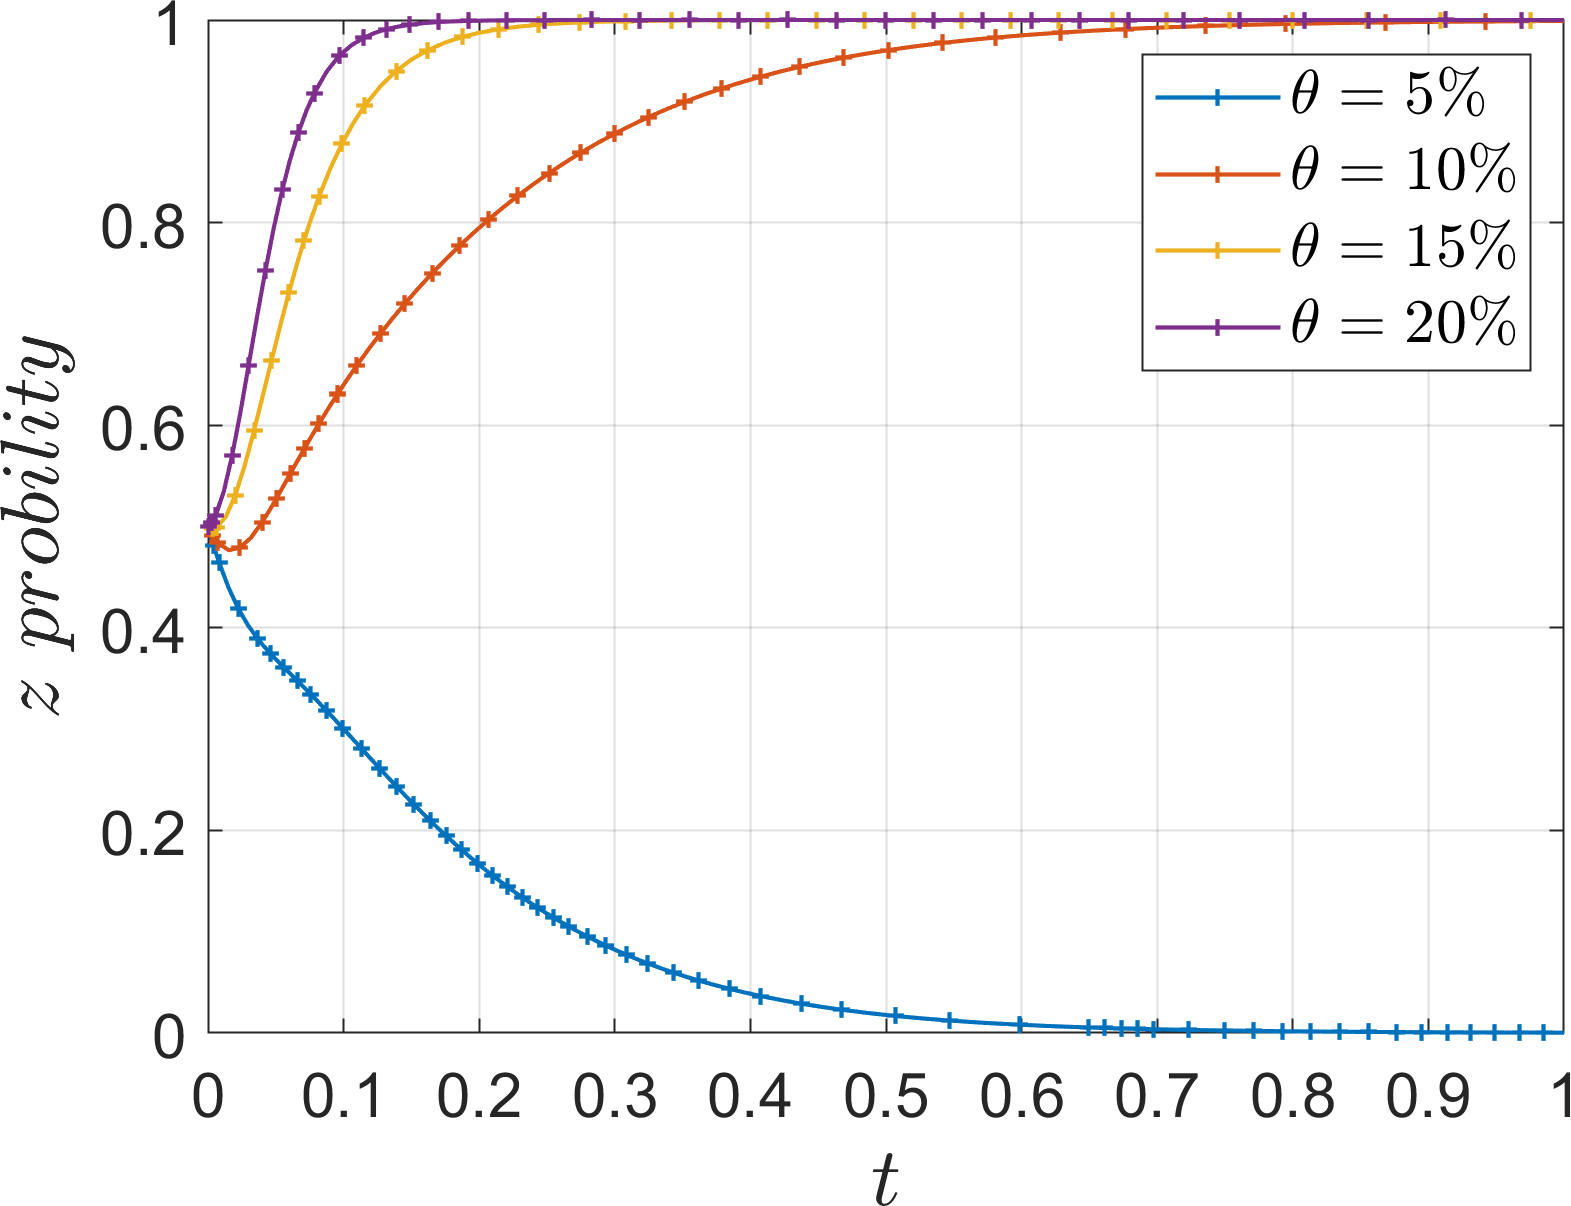
Effect of to the evolutionary strategy of road transport operators.
Under Corollary 1, both operators find that the income and subsidy from collaboration are less than the additional cost, so the system stabilizes at (1, 0, 0). As the additional cost decreases, the operators gradually evolve to the “cooperation” and “low-carbon mode” strategies, However, excessively low additional cost will also imply an increase in financial investment, which is not conducive to the active promotion of the port operators, and thus affects the response of the operators. Comparing the evolution rates of the two operators, it can be seen that under high additional costs, the river-sea intermodal transport operators choose the “competition” strategy, while the road transport operators still choose the “low-carbon mode” strategy, which indicates that the river-sea transport operators are more sensitive to the changes of additional cost. Under the background of “dual carbon”, as a low-carbon transportation mode, the river-sea intermodal transport is more inclined to the return of the investment itself, while the road transport operators are more inclined to the additional returns brought by the policy background, such as social feedback, company reputation, market competitiveness, etc. Therefore, under the same high additional cost, the two sides have different evolutionary results.
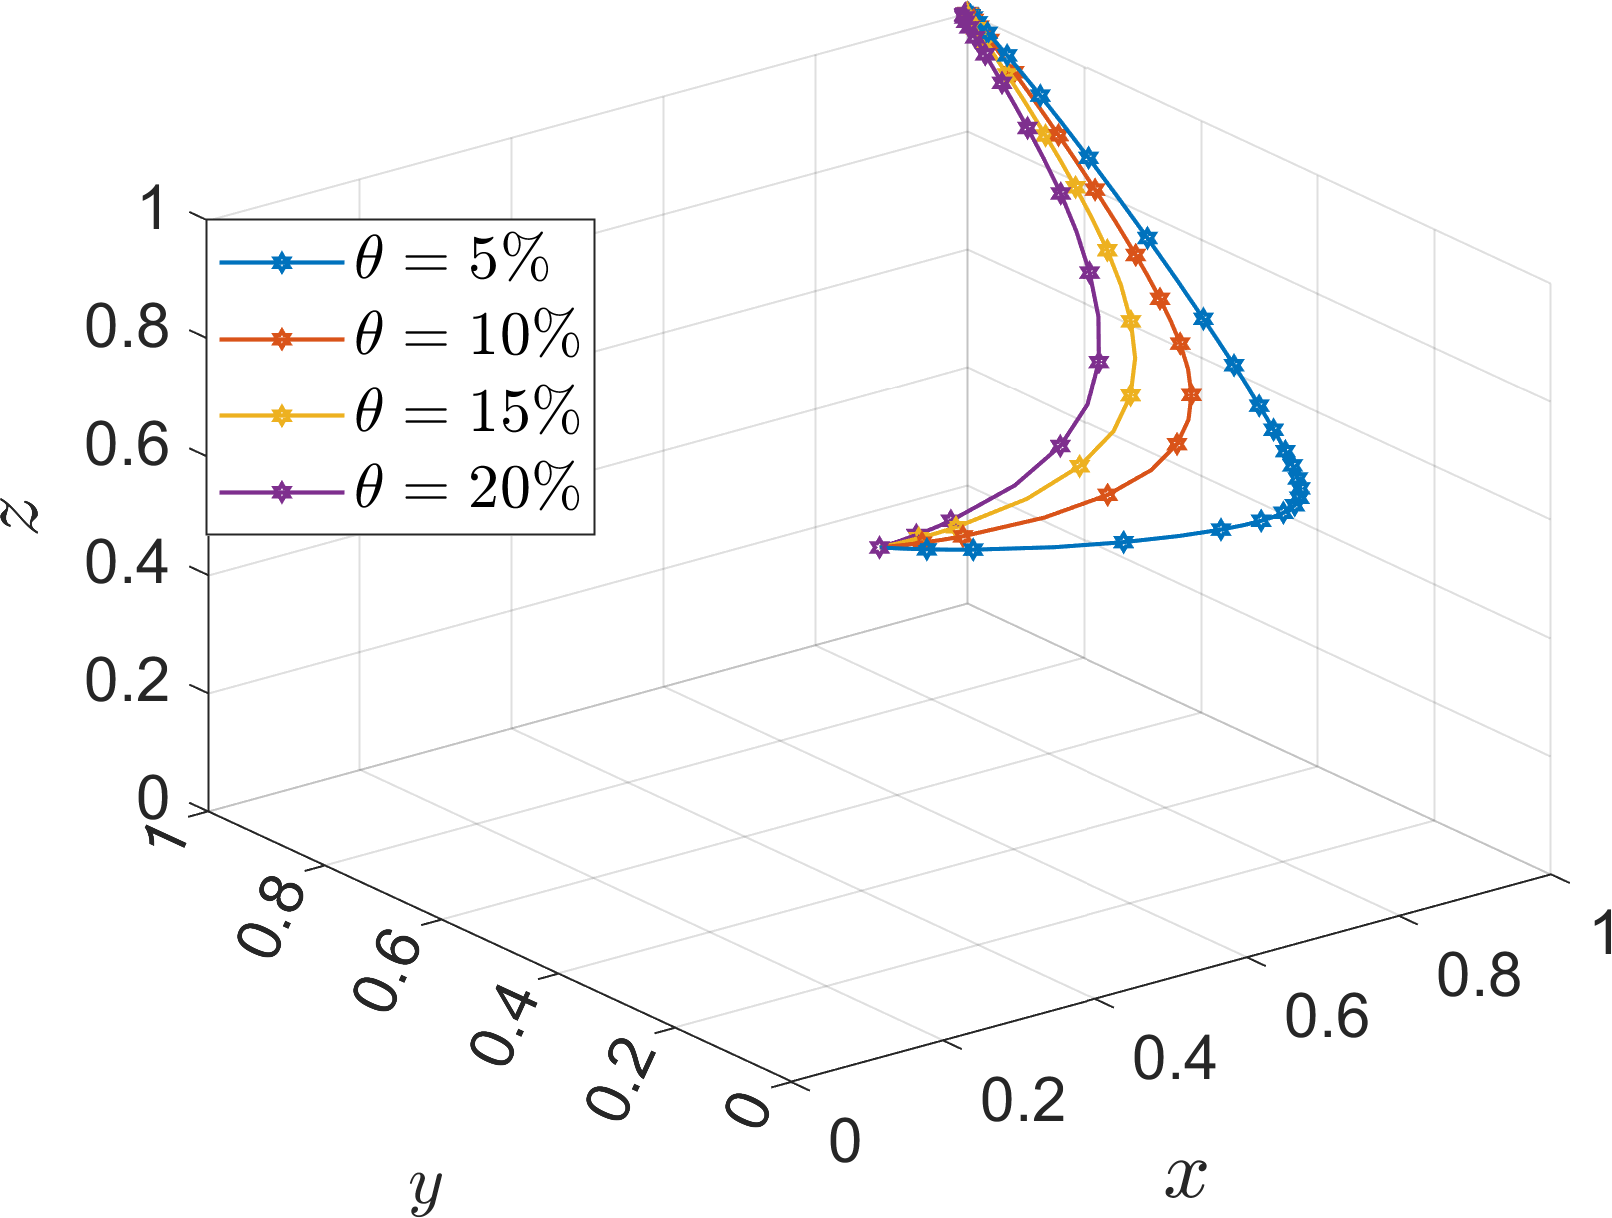
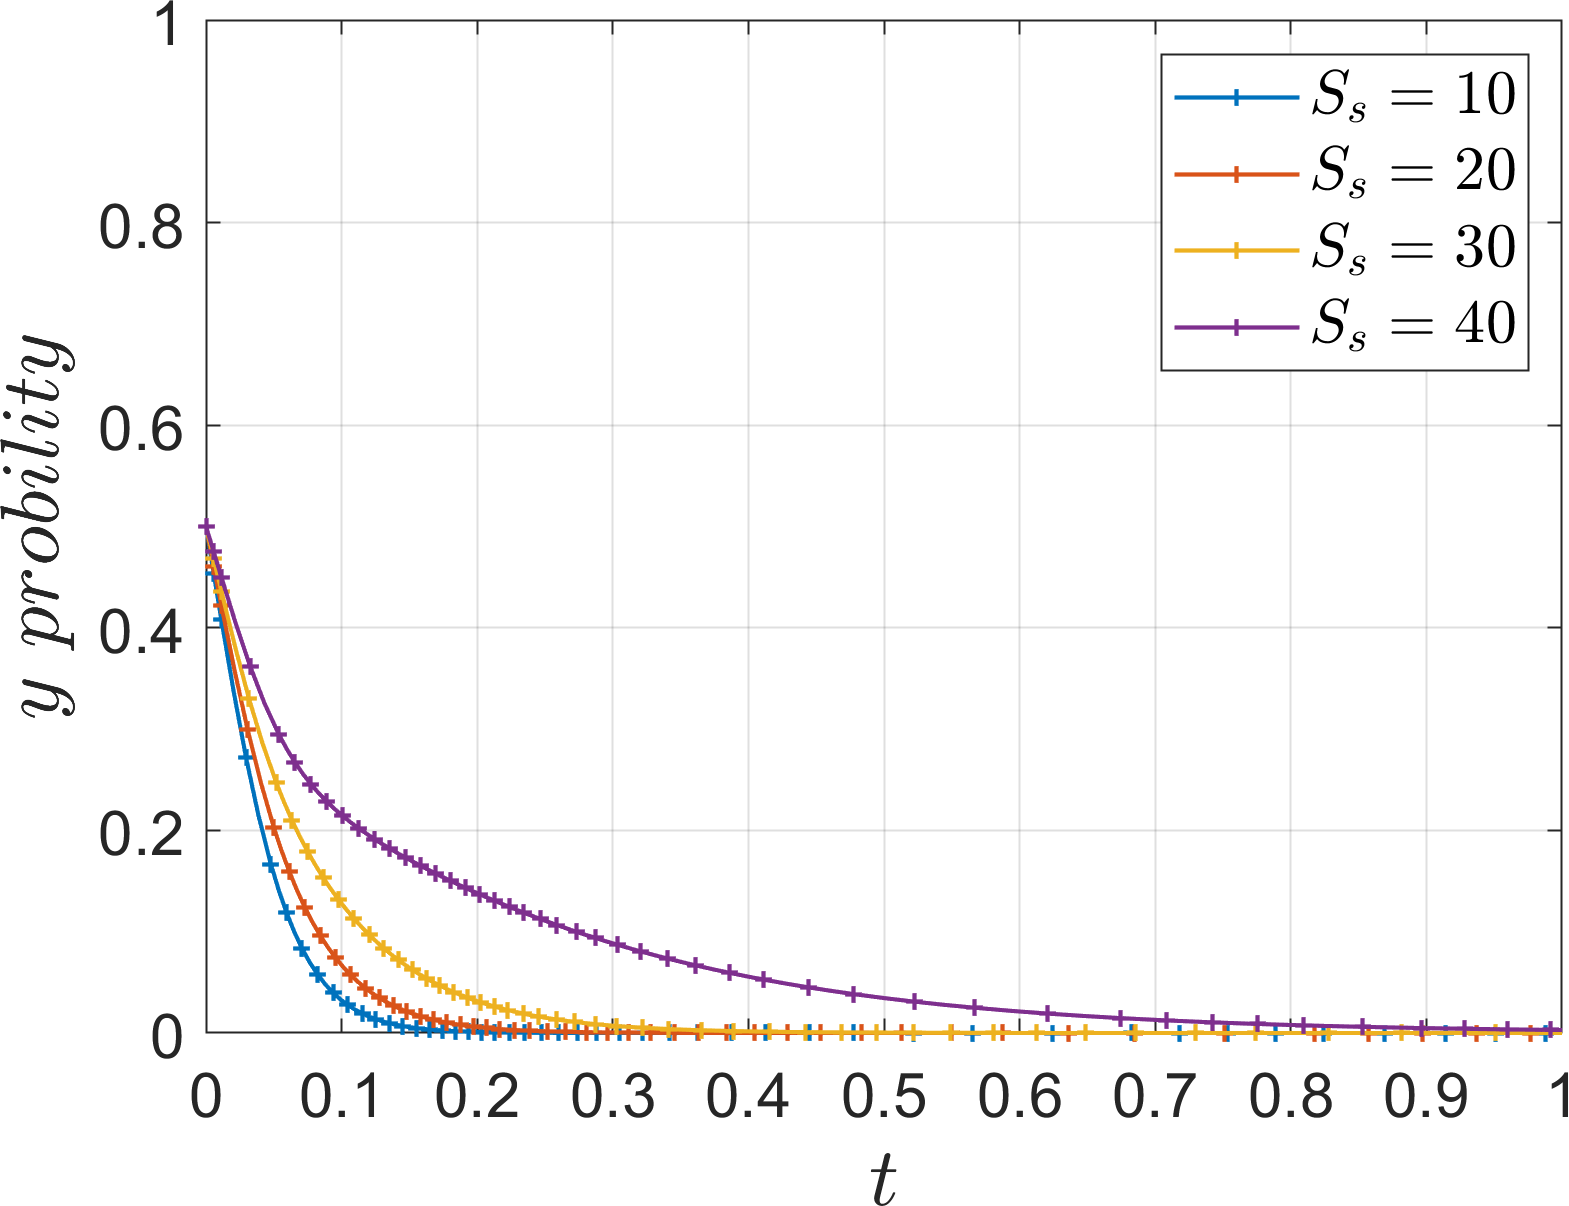
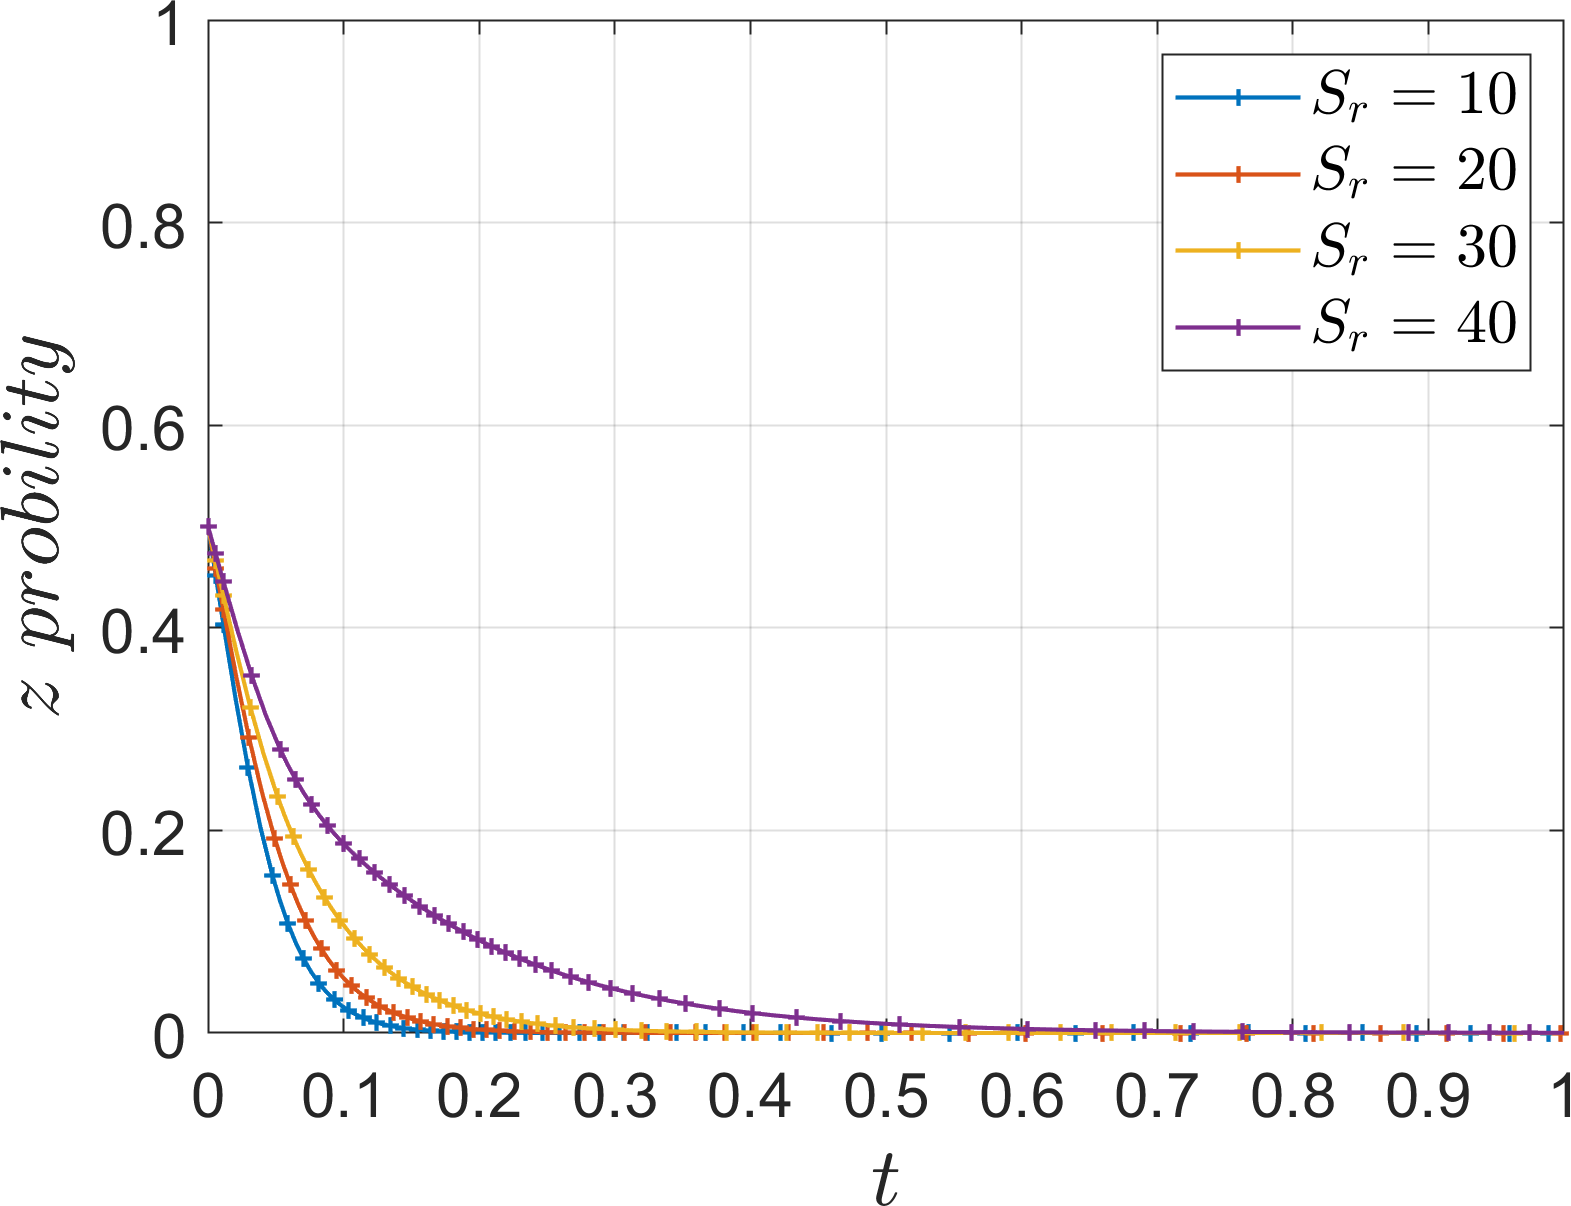
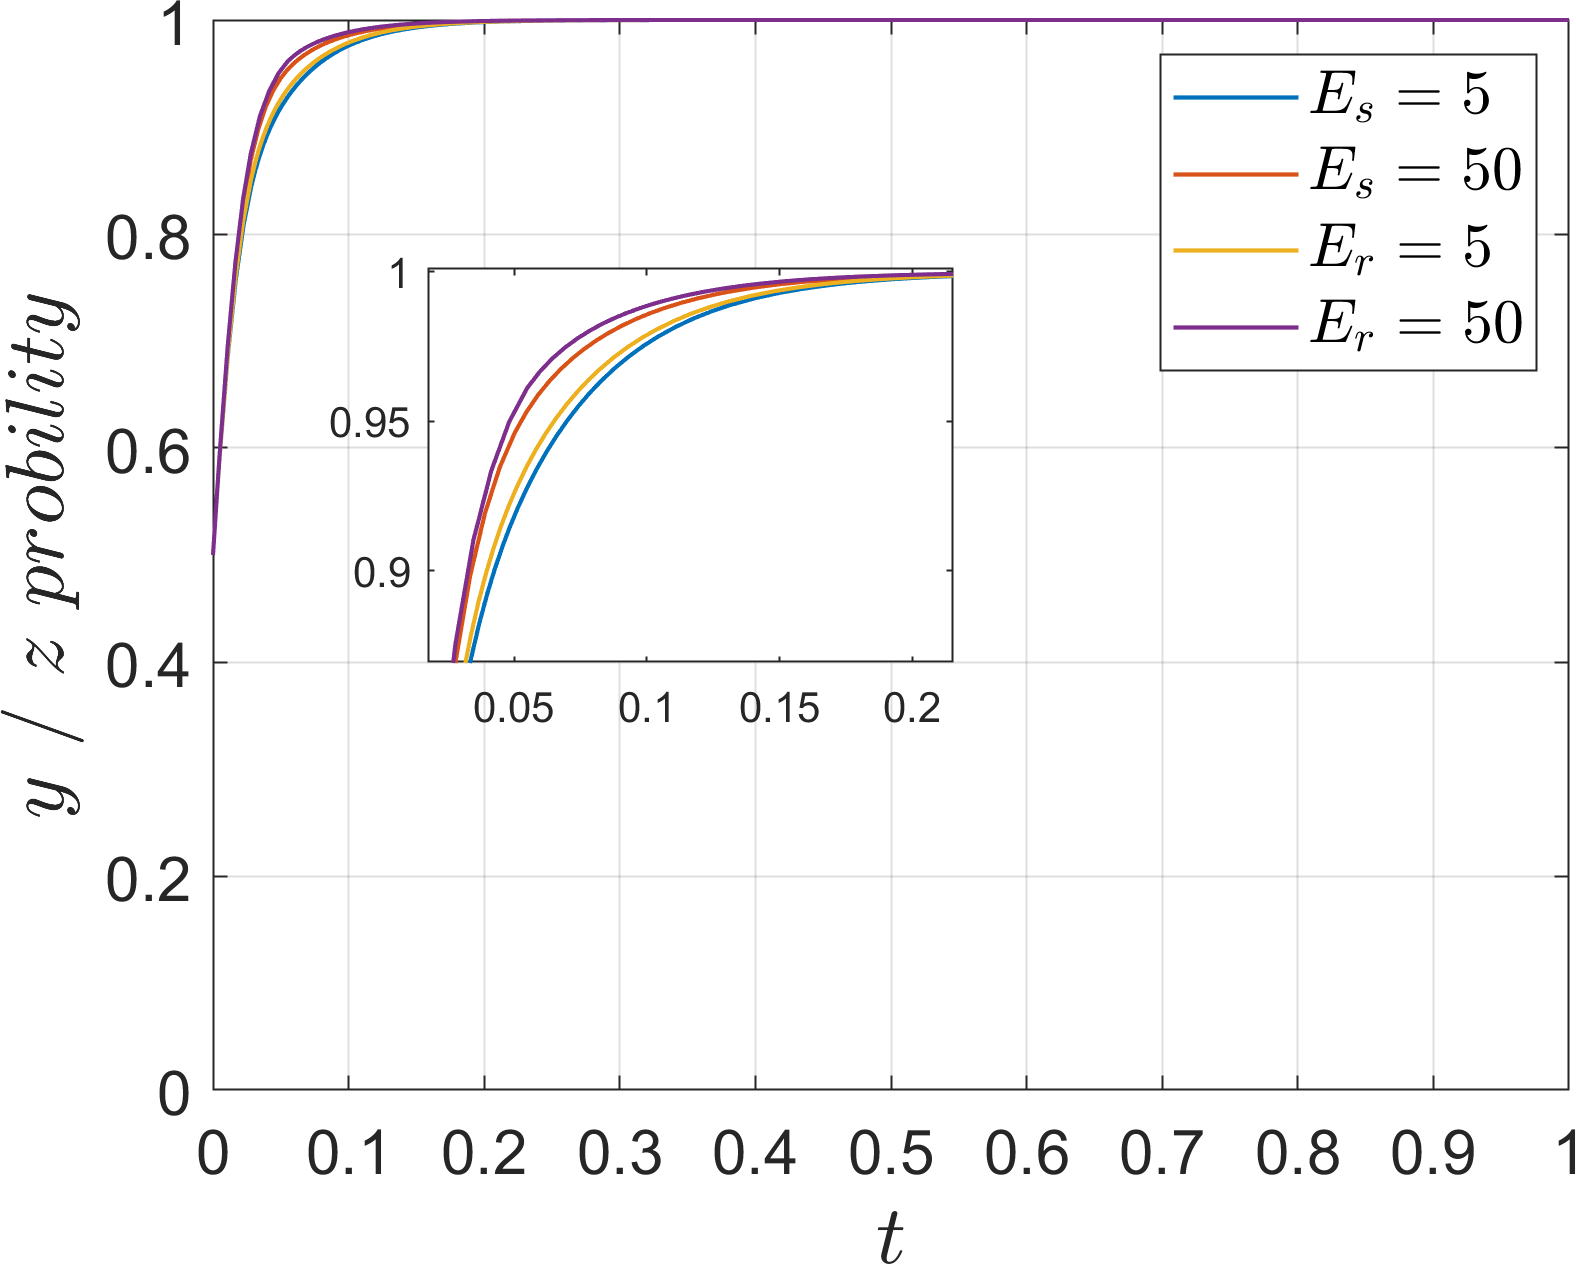
In order to analyze the effect of management effort on the evolution of the system, the values of , are assigned as 45, 60, 75, 90. The parameter is introduced as the ratio of the management effort to the base earning , which is defined as weak management effort when =5%, slightly weak management effort when =10%, slightly strong management effort when =15%, and strong management effort when =20%. In order to discuss the impact on the system when the management effort is unbalanced, is assigned a value of 35 alone and =3% is introduced. The simulation results are shown in Figures 8–11.
Figure 8
Effect of (ratio management effort to base earning ) on the evolutionary system.
Figure 9
Effect of (ratio to ) on the evolutionary system(=35).
Figure 10
Effect of to the evolutionary strategy of river-sea intermodal transport operators.
Figure 11
Effect of to the evolutionary strategy of road transport operators.
During the evolution of the system to the stabilization point, as port operators’ management effort increases, both operators find that the economic loss of not responding to the port operators outweighs the subsidy and additional income of responding to the port operators, Therefore, the speed of evolution towards “cooperation” and “low-carbon mode” strategies is accelerated. When the management effort is at a weak level, the evolution of the operator’s strategy converges at 0, it stabilizes at the “competition” and “traditional mode” strategies. At slightly weak, slightly strong and strong levels, the evolution of operator strategy converges at 1, it stabilizes at “cooperation” and “low-carbon mode” strategies. Under weak management effort, the evolution rate to 1 is slower, while under slightly strong management, the evolution rate is significantly faster. Although the evolution rate of operators is faster under strong management effort, the acceleration effect is not significant, and too much management will demotivate operators, so the management effort should be controlled at a reasonable level. When studying one operator alone, it can be seen that both operators choose not to respond to the port operators under weak management intensity, but when studying both operators, it can be seen that both operators under the same low management intensity evolve to 1, indicating that the operators will form a driving force between them and thus evolve to the same stable point. On the contrary, if the management of one of the operators is lowered, the evolution path of the other operator will be changed, so the port operators have to manage both operators rationally.
In order to analyze the effect of the subsidy on the evolution of the system, the values of subsidies for river-sea intermodal transport operators , subsidies for road transport operators are assigned as 10, 20, 30, 40. The simulation results are shown in Figures 12–14.
Figure 12
Effect of (subsidies for river-sea intermodal transport operators and road transport operators) on the evolutionary system.
Figure 13
Effect of to the evolutionary strategy of river-sea intermodal transport operators.
Figure 14
Effect of to the evolutionary strategy of road transport operators.
As the subsidy increased, the two operators did not change their evolutionary strategies, and the results remained stable in the “competition” and “traditional mode” strategies, indicating that the operators were not sensitive to changes in the subsidy. At the same additional cost, the operators are more likely to focus on the industry evaluation of the port operators ‘s implementation of the management, which affects the position of the company in the industry, and the impact of the port operators ‘s implementation of the management is much greater than the financial support of accepting its subsidy. Therefore, port operators should consider the management effort when actively promoting cooperation with operators.
5.2.2 Simulation analysis of the evolution of the equilibrium point (0, 1, 1)
Based on Table 5 Scene 2 and satisfying all conditions in Corollary 2, its simulation parameters are assigned as follows: =20, =25, =25, =55, =55, =20, =15, =25, =20, =15, =15, and the initial value of strategy selection probability of the three parties of the game (, , ) is set to (0.5, 0.5, 0.5). The effects of the parameters , , , on the evolutionary process and results of the system are analyzed. In order to analyze the effect of additional costs and subsidies on the evolution of the system, the values of , , are assigned as 10 and 100. In order to analyze the effect of indirect loss on the system evolution, is assigned as 15, 30, 45, 60. The simulation results are shown in Figures 15–17.
Figure 15
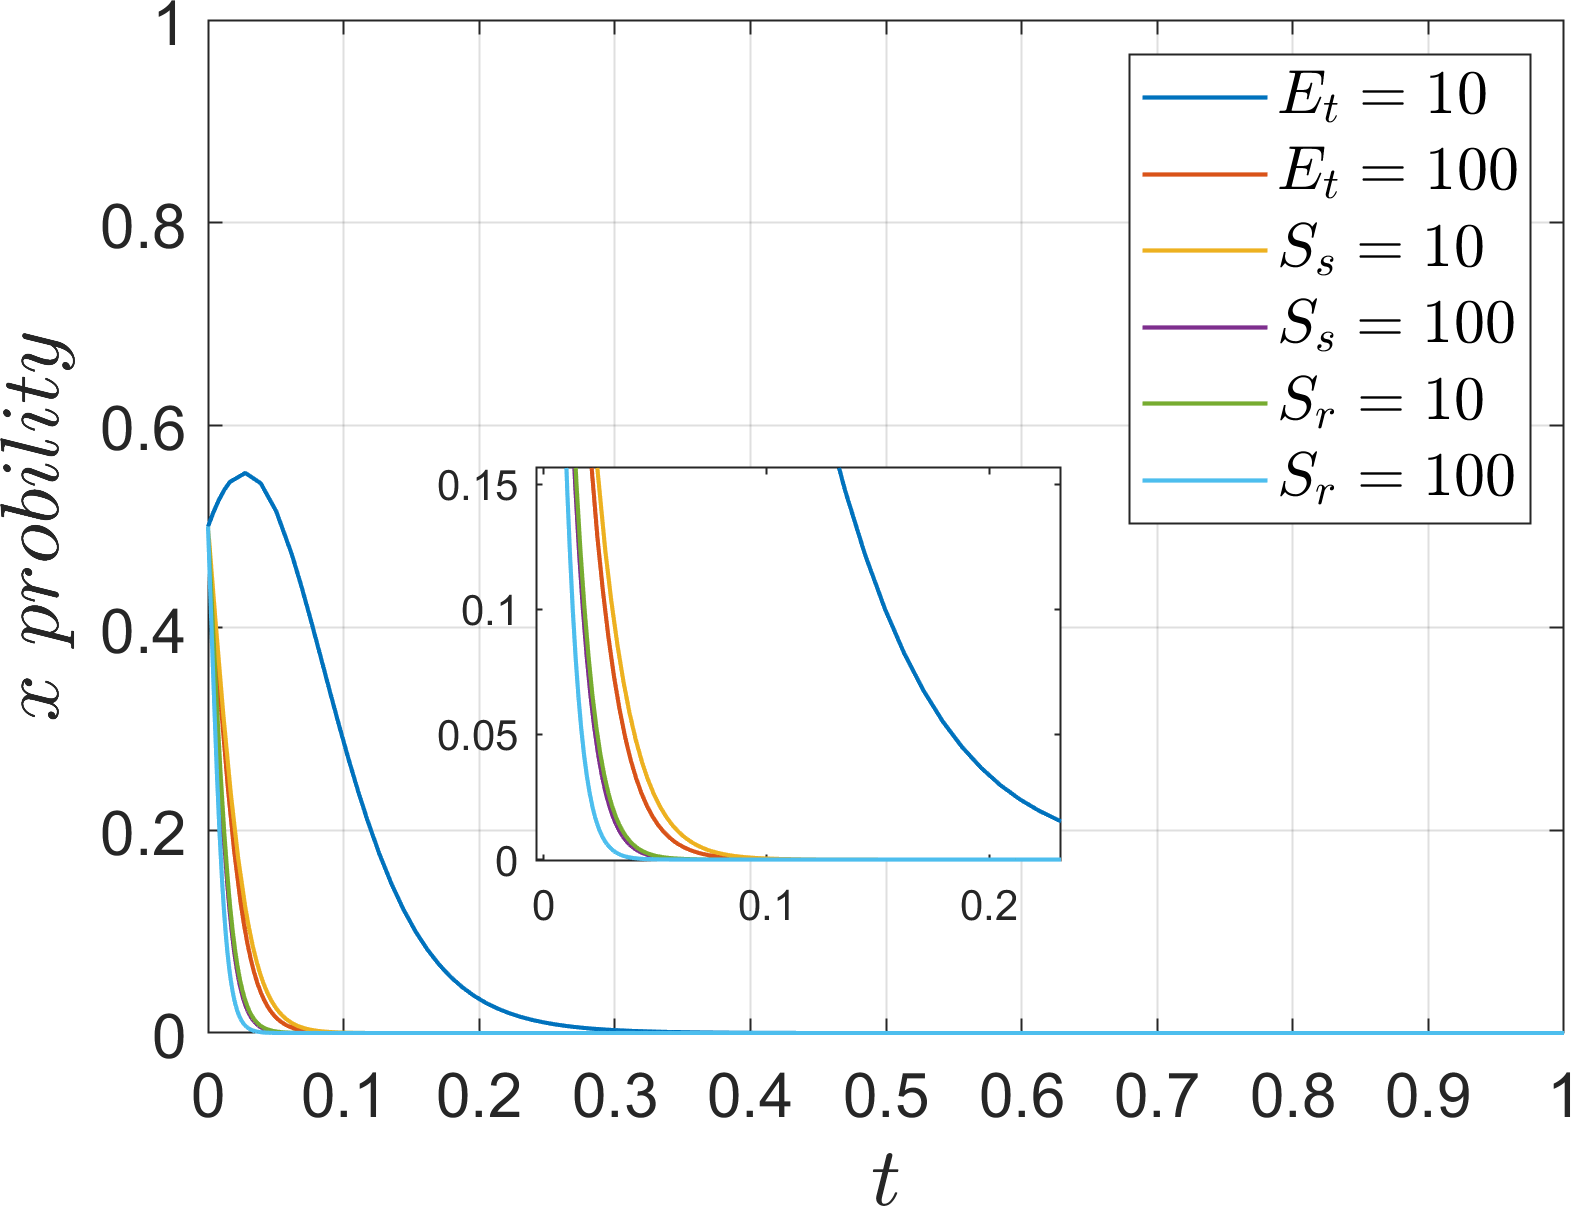
Effect of to the evolutionary strategy of port operators.
Figure 16
Effect of (indirect loss) on the evolutionary system.
Figure 17
Effect of to the evolutionary strategy of port operators.
Under Corollary 2, when the indirect loss caused by the negative promotion of the port operators’ side is low, the port operators is more inclined to negatively promote the coordinated development of the operators. When the indirect losses increase and exceed the threshold, the port operators shift to actively promote the coordinated development. Increasing the values of the additional cost and subsidy parameters from 10 to 100 shows that their changes do not lead to changes in the stabilization point of the port operators side, and the rate of change is almost indistinguishable, indicating that the port operators is not sensitive to this parameter, which reflects that the increase of the additional cost and the provision of subsidies has almost no impact on the port operators ‘s decision-making. When the indirect loss is at a high level of 45, the evolution rate of the port operators to the “negative progression” strategy is significantly lower but still does not change its evolution results, and its change does not affect the results of the two operators’ evolution to the “cooperation” and “low-carbon mode” strategies. This indicates that the two operators have reached equilibrium in the port operators ‘s “negative progression” strategy and that the evolutionary results are in line with the “Dual Carbon” goal. There are few parameters that can significantly affect the port operators, and the sum of these parameters has to be adjusted significantly to change the evolution result. Therefore, the introduction of governmental incentives and penalties can be considered to better manage the port operators’ side and accelerate the efficiency of synergies between multiple parties.
5.2.3 Simulation analysis of the evolution of the equilibrium point (1, 1, 1)
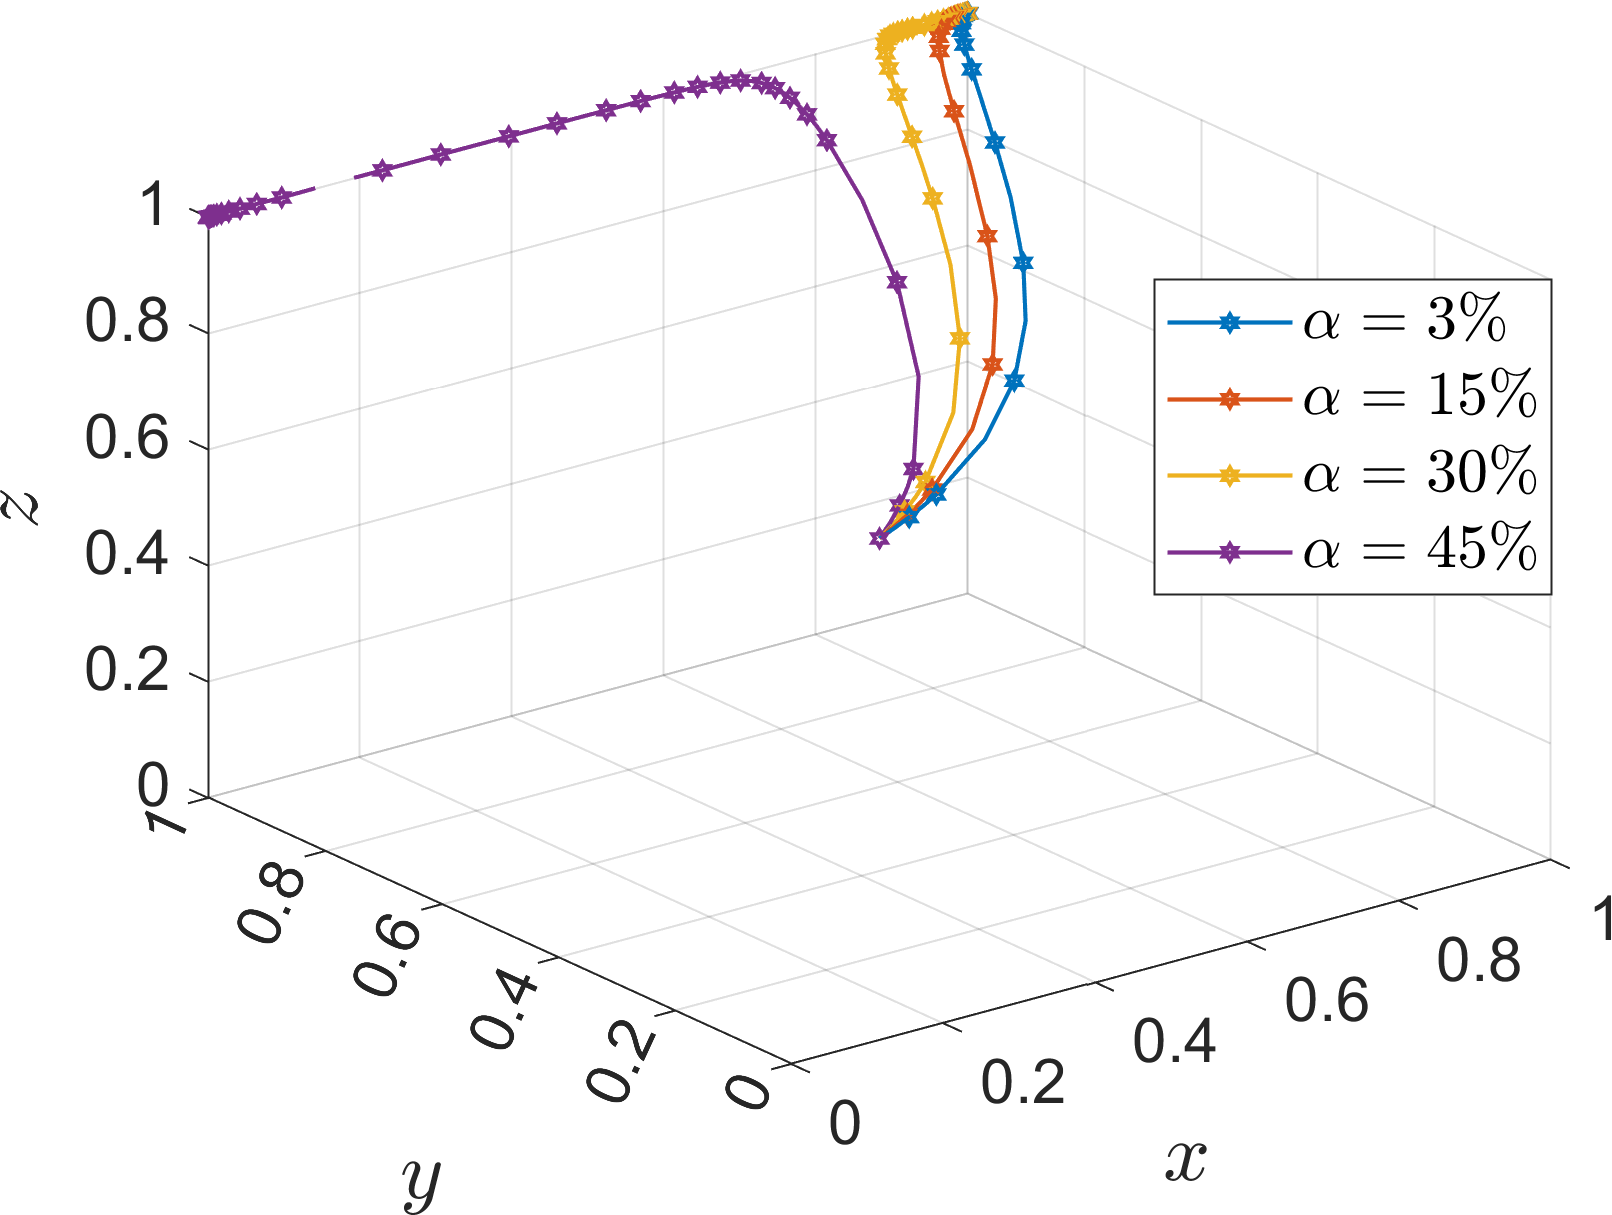
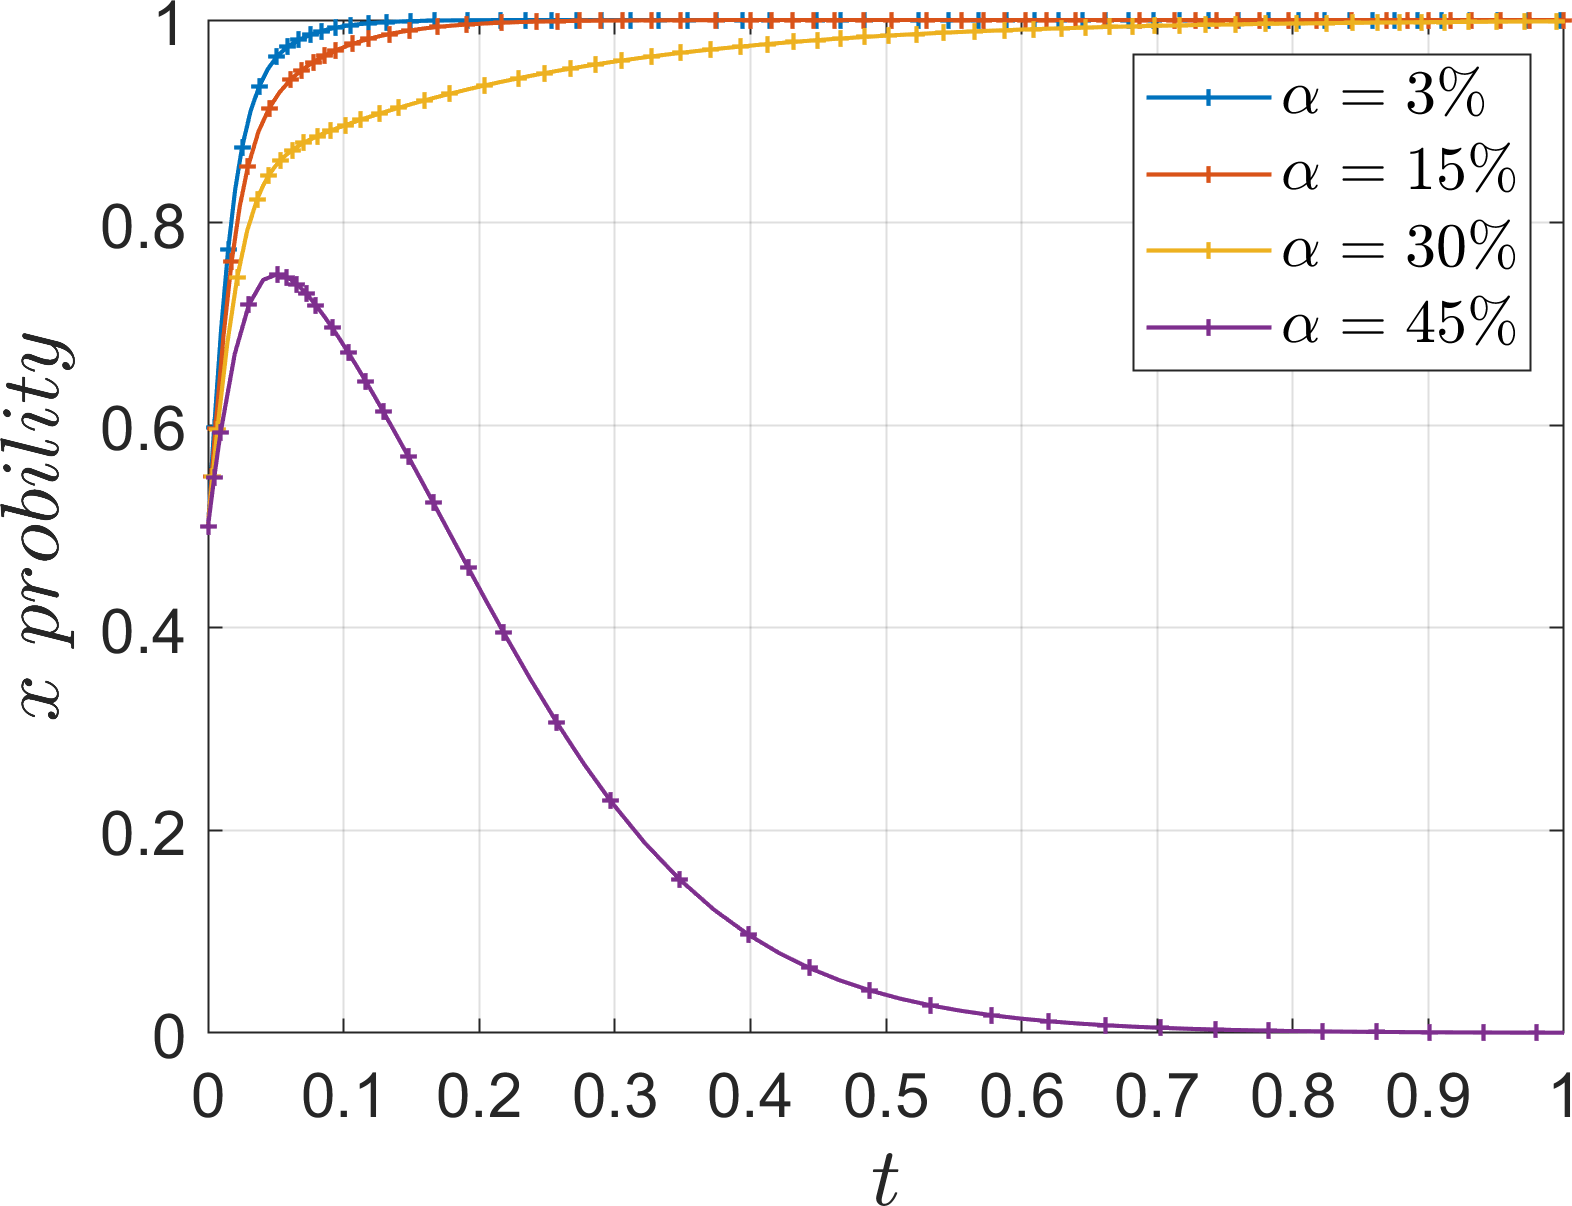
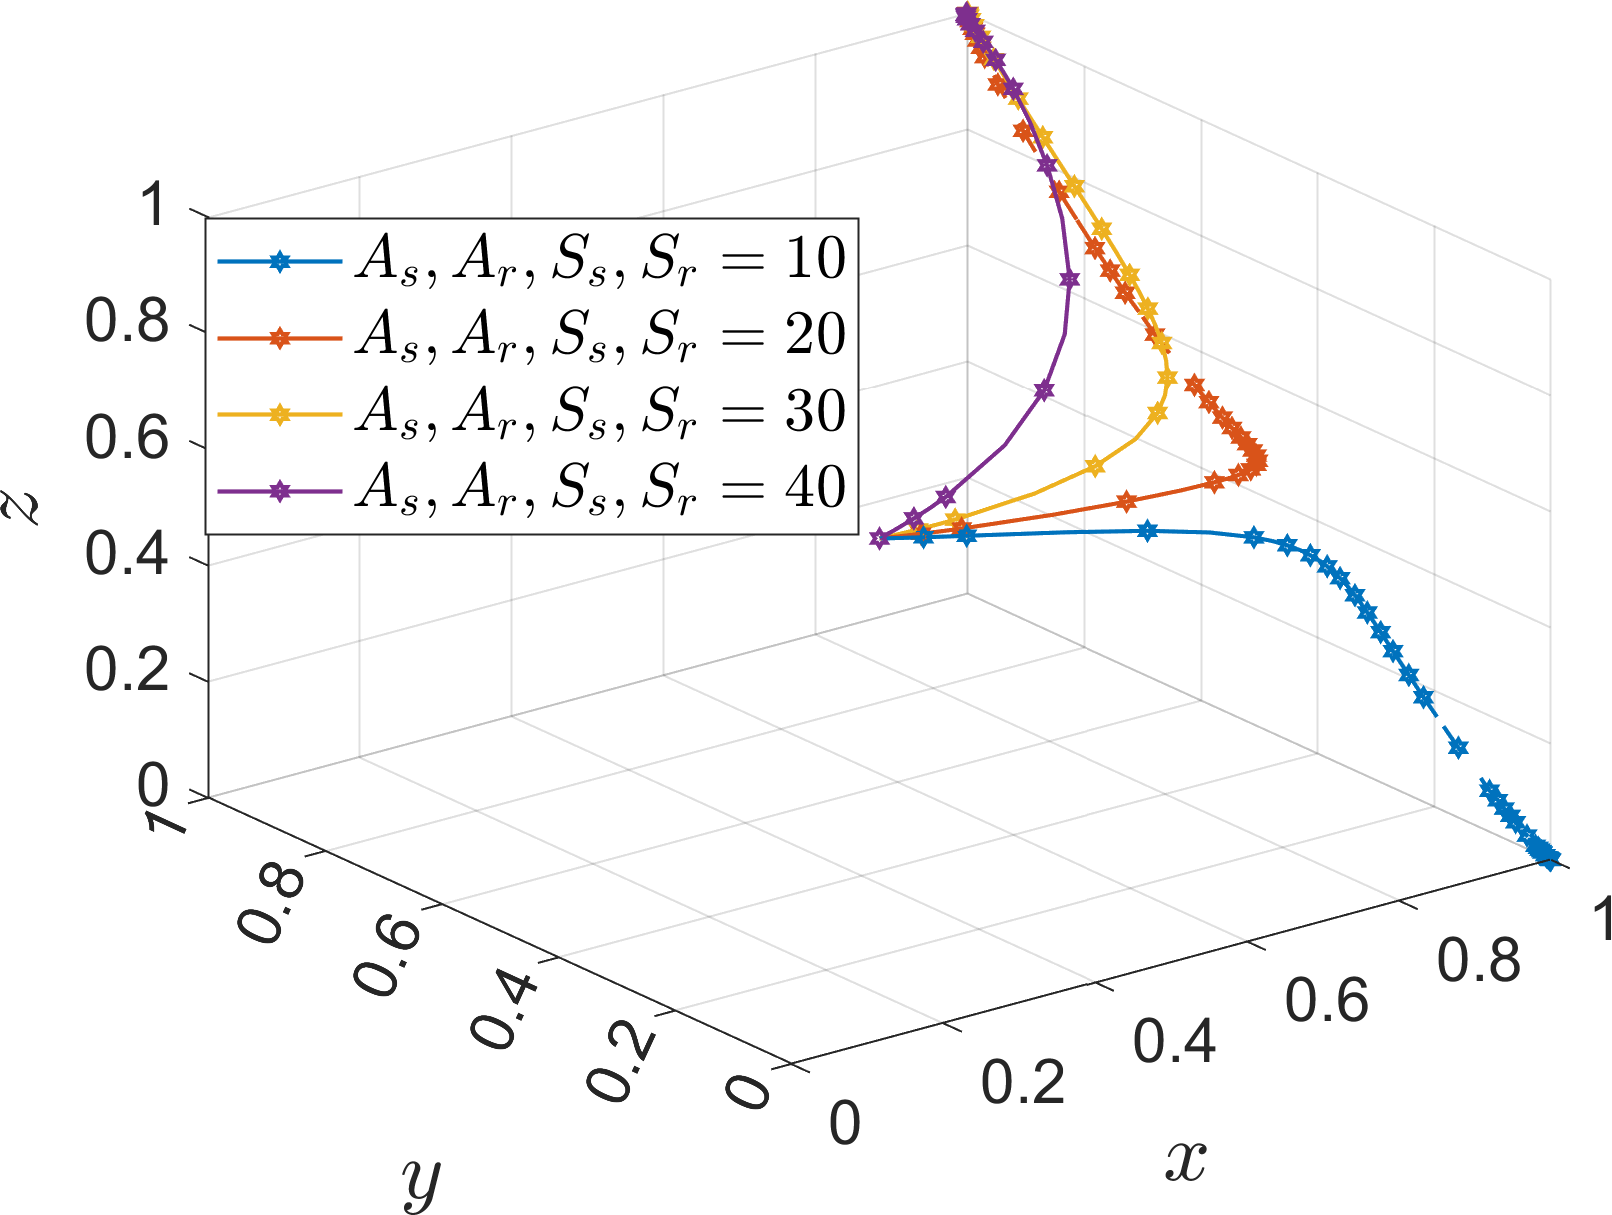
Based on Table 5 Scene 3 and satisfying all the conditions in Corollary 3, its simulation parameters are assigned as follows: =15, =40, =40, =70, =70, =15, =12, =40, =40, =60, =60, and the initial value of the probability of strategy selection of the three parties of the game (, , ) is set to (0.5, 0.5, 0.5). To analyze the impact of the parameters , , , , , , , on the evolution process and results of the system. In order to analyze the effect of additional cost on the evolution of the system, the values of is assigned as 5, 20, 35, 50, corresponds to =3%, =15%, =30%, and =45%, which are defined as low additional cost, high additional cost, super high additional cost, extremely high additional cost, respectively. At the same time, the values of , are assigned as 5, 50, which are used to discuss the effect of parameters on the operator. The simulation results are shown in Figures 18–21.
Figure 18
Effect of (ratio to ) on the evolutionary system.
Figure 19
Effect of to the evolutionary strategy of two operators.
Figure 20
Effect of to the evolutionary strategy of port operators.
Figure 21
Effect of to the evolutionary strategy of port operators under (1, 0, 0) state.
Under Corollary 3, the rate of convergence of port operators, river-sea intermodal transport operators, and road transport operators towards the strategies of “active progression”, “cooperation”, and “low-carbon mode” slows down as the additional costs continue to increase, but the rate of change is not significant from the point of view of the two operators. Comparing the evolution rate of the port operators in the (1, 0, 0) state in Figure 21, it can be seen that increasing the parameter to 50 does not change the evolution strategy of the port operators in the evolution state where the port operators actively promote the cooperative development of the operators, indicating that the unresponsive state of the operators prompts the port operators to actively promote the evolution of the system. Comparison of the parameter values and rates of the tripartite also shows that the port operators’ side has a higher acceptance of the increase in additional cost, especially when the operator is not responsive. Therefore, in order to prevent port operators from choosing the “negative progression” strategy due to the high additional cost, the government should formulate subsidy measures to ensure the stability of the system.
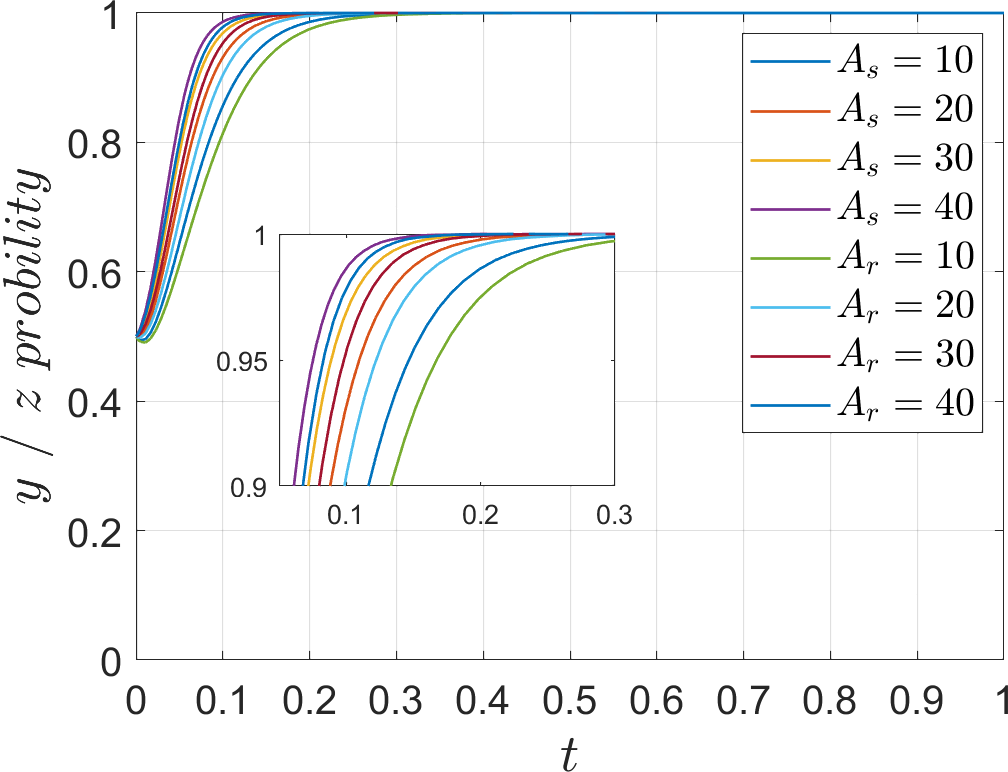
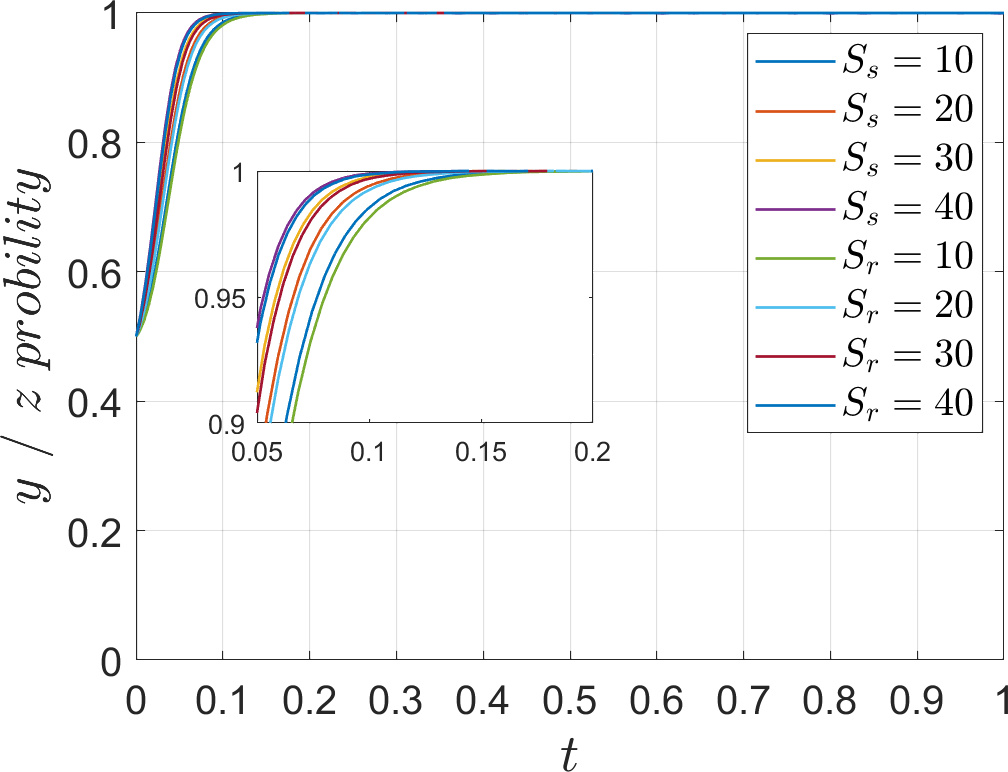
In order to analyze the effect of additional income and subsidy on the evolution of the system, the values of , are assigned as 10, 20, 30, 40, the values of , are assigned as10, 20, 30, 40. The simulation results are shown in Figures 22–24.
Figure 22
Effect of on the evolutionary system.
Figure 23
Effect of to the evolutionary strategy of two operators.
Figure 24
Effect of to the evolutionary strategy of two operators.
When the system is in the state of (1, 1, 1), with the increase of additional income and subsidy, the evolution rate of the operator to the “cooperation” and “low-carbon mode” strategies also accelerates gradually, but the change is not sensitive, and converges at 0.15 and 0.25 respectively. However, when considering the effects of these two parameters on the system, it can be seen that the system evolves to (1, 0, 0) when the additional income and subsidy are at a low level at the same time, which indicates that the operators’ decision-making evolves towards the strategies of “competition” and “traditional mode”. When all three parties are cooperating, a low level of additional income or subsidy will not change the stability point of the system, but when the additional income is at a low level, the port operators should make sure that the subsidy level is in the normal range, so that the system is in a stable state and does not bear a heavy financial burden.
In order to analyze the effect of the indirect gain on the evolution of the system, the values of is assigned as 15, 30, 45 60. The simulation results are shown in Figures 25, 26.
Figure 25
Effect of (indirect gain) on the evolutionary system.
Figure 26
Effect of to the evolutionary strategy of port operators.
As the indirect gain increases, the evolution rate of the port operators to the “active progression” strategy gradually accelerates, and compared with the parameter indirect loss in the (0, 1, 1) state, the port operators in the (1, 1, 1) state tends to choose the evolution strategy that is favorable to itself rather than to the system. This is because in the (0, 1, 1) state, the two operators have reached equilibrium stability without the port operators ‘s active promotion. Therefore, when the indirect loss =60, the port operators evolve to the “active progression” strategy. In the (1, 1, 1) state, the port operators prefer the evolutionary strategy that is favorable to the system, and when the indirect gain is =45, the port operators choose the “active progression” strategy and the evolution rate is faster than that in the (0, 1, 1) state.
5.3 Discussion based on the simulation result
In this paper, from the perspective of “Dual Carbon” goal, based on the dynamic game theory, by constructing a dynamic evolution game model of port operators, river-sea intermodal transport operators and road transport operators in the consolidation and distribution system, and analysed the stability of the strategy choices of each party, the stability of the equilibrium strategy combinations of the gaming system, and the influence of the relationship between each parameter. Matlab numerical simulation is used to analyse the factors and interaction mechanisms affecting the decision-making choices of each party. The study analyses different equilibrium states and explores the influence and change mechanism of port operators, river-sea intermodal transport operators, and road transport operators in the cooperative dynamic game of consolidation and distribution network, and the following conclusions can be obtained:
5.3.1 Port operators actively promoting but operators not responding
-
When the additional cost decreases, the operator’s strategy evolves towards “cooperation” and “low-carbon mode”, but too low an operator’s cost will indirectly increase the financial burden of the port operators, which creates a resistance to advancement. River-sea intermodal transportation operators are more sensitive to changes in additional costs, while road transportation operators are more dependent on policy-derived benefits (e.g., reputation, market competitiveness), which leads to different evolution paths between the two sides at the same cost level.
-
Stronger port operators’ management accelerates the convergence of operator strategies to cooperative equilibrium, but with diminishing marginal effects. The system converges to the “competition” and “traditional strategy” strategies under weak management effort (convergence to 0), while slightly strong and higher strengths achieve cooperative equilibrium (convergence to 1). Excessive management effort may increase the evolution rate but may inhibit operators’ motivation, and a moderate range needs to be sought to balance efficiency and willingness to participate.
-
There is a strategy-driven effect among operators, where adjustments in one party’s management efforts can change the evolutionary trajectory of the other, suggesting that port operators need to implement collaborative management in order to avoid strategy imbalance. Subsidy policy has no significant effect on strategy evolution, and operators are more concerned about the non-economic benefits of port operators’ management, such as industry evaluation, whose incentive effect far exceeds direct financial support.
5.3.2 Operators respond actively while port operators promote negatively
-
Port operators tend to maintain the status quo when indirect loss due to negative port operators’ advances are below a threshold; once the loss exceeds the threshold, port operators will shift to an active coordinated strategy. The significant increase in additional cost and subsidy has almost no effect on the stabilization point and evolution rate of the port operators ‘s strategy, indicating that the port operators ‘s decision is strongly stable to this type of economic incentive. Its strategy adjustment relies mainly on the shock of indirect loss rather than on additional cost changes.
-
Even if the indirect loss reaches a high level, the evolution rate of port operators negativity decreases significantly, but the final stabilization point remains unchanged, and the operator can still spontaneously converge to the equilibrium of the “cooperation” and “low-carbon mode” strategies. This suggests that port operators’ strategy negativity does not jeopardize the overall goal achievement of the system, but may lead to a loss of efficiency in the cooperative development of the consolidation and distribution network.
5.3.3 Evolutionary system in a tripartite coordinated state
-
Additional cost enhancement inhibits the rate of port operators’ strategy evolution, while operator response hysteresis leads to insignificant rate changes. When the additional cost exceeds the threshold value, the port operator’s strategy reverses, indicating that the port operators become more sensitive to cost changes when the system is in a cooperative state. In the state of negative operator response (1, 0, 0), the port operators ‘s acceptance threshold for additional cost increases, showing a stronger tendency to promote proactively.
-
In the coordinated state of the system (1, 1, 1), the additional income and subsidy show low sensitivity to the evolution of the operator’s strategy, and it takes the coordinated effect of the two to change the stability point. When the additional income or subsidy alone is at a low level, the system evolves to a non-coordinated equilibrium. Due to the uncontrollable nature of the income, the port operators should control the subsidy level in the normal range to ensure the stability of the system.
-
In the operator-autonomous stable state (0, 1, 1), the port operators need higher indirect gain to choose the “active progression” strategy, whereas in the coordinated state (1, 1, 1), the response threshold is reduced and the evolution rate is increased, which indicates that the coordinated system has a reinforcing effect on the port operators ‘s strategy.
6 Conclusions and policy suggestions
Focusing on the cooperative development of the port consolidation and distribution system under the “Dual Carbon” goals, this paper constructs a tripartite dynamic evolutionary model involving the port operators, river-sea intermodal transport operators, road transport operators based on evolutionary game theory. By analyzing the strategic stability of each subject and the system equilibrium conditions, and applying Matlab for numerical simulation, this study deeply explores the influence mechanism of key parameters, such as management effort, additional cost, subsidy, and additional income on the system’s evolutionary path.
6.1 Conclusions
-
The strategic evolution of operators exhibits distinct differences and linkage. River-sea intermodal operators are more sensitive to cost changes, whereas road transport operators rely more on derivative benefits such as reputation brought by policies. Meanwhile, a strategic driving effect exists between the two; the strategy adjustment of one subject significantly alters the evolutionary trajectory of the other, underscoring the necessity of coordinated management.
-
The incentive effect of port management intensity is superior to pure subsidy policies. Moderate management intensity can effectively drive the system to converge to a collaborative equilibrium, while excessive intensity may have a suppressive effect. In contrast, direct subsidies have a limited driving effect on operators’ strategies; operators prioritize the industry reputation enhancement resulting from port management actions.
-
The system coordination state has a reinforcing effect on the port’s strategy. In the non-coordinative state, the port’s decision is mainly constrained by the threshold of indirect losses and is insensitive to costs and subsidies. However, in the tripartite coordinative state, the port operator’s tolerance for additional costs increases, and the response threshold decreases. This indicates that the positive feedback mechanism generated by system coordination can effectively consolidate the port’s active progression strategy.
6.2 Policy suggestions
When port operators promote operator collaboration, they should prioritize optimizing the design of management efforts rather than relying solely on subsidy measures, and guide the evolution of operator strategies by dynamically adjusting the intensity of regulation while focusing on the policy’s role in shaping the industry’s reputation, in order to achieve the dual goals of system stability and efficiency improvement. In view of the low sensitivity of the decision-making parameters of the port operators, it is necessary to introduce external regulatory measures such as governmental reward and punishment mechanisms. By constructing a reward and punishment function that is deeply bound to the interests of the port operators, the intrinsic decision-making threshold can be broken through, accelerating the coordinated process of the consolidation and distribution network under the premise of maintaining the stability of the system. The government should design a dynamic subsidy mechanism to compensate for incremental port operators’ costs, regulate port operators decision-making thresholds, and optimize the indirect gain distribution mechanism to prevent system instability caused by strategy reversal, while maintaining fiscal sustainability. Special attention needs to be paid to the negativity of port operators ‘ strategies under the autonomous stabilization state of the operators, and the positive feedback effect of system coordination should be strengthened through the institutional design of, so as to realize the efficiency enhancement of the low-carbon transition.
Statements
Data availability statement
The original contributions presented in the study are included in the article/supplementary material. Further inquiries can be directed to the corresponding author.
Author contributions
QX: Writing – original draft, Funding acquisition, Conceptualization. HD: Formal Analysis, Writing – original draft. JH: Investigation, Writing – original draft. JW: Writing – original draft, Investigation, Validation. QW: Validation, Writing – original draft. WZ: Writing – review & editing, Conceptualization.
Funding
The authors declared that financial support was received for this work and/or its publication. This research was funded by Natural Science Foundation of China (52362055), Guangxi Science and Technology Major Program of China (Grant No. 2024AC35003).
Conflict of interest
The authors declared that this work was conducted in the absence of any commercial or financial relationships that could be construed as a potential conflict of interest.
Generative AI statement
The authors declared that generative AI was not used in the creation of this manuscript.
Any alternative text (alt text) provided alongside figures in this article has been generated by Frontiers with the support of artificial intelligence and reasonable efforts have been made to ensure accuracy, including review by the authors wherever possible. If you identify any issues, please contact us.
Publisher’s note
All claims expressed in this article are solely those of the authors and do not necessarily represent those of their affiliated organizations, or those of the publisher, the editors and the reviewers. Any product that may be evaluated in this article, or claim that may be made by its manufacturer, is not guaranteed or endorsed by the publisher.
References
1
Alkaabneh F. Diabat A. Elhedhli S. (2019). A Lagrangian heuristic and GRASP for the hub-and-spoke network system with economies-of-scale and congestion. Transportation Res. Part C: Emerging Technol.102, 249–273. doi: 10.1016/j.trc.2018.12.011
2
Bütün C. Petrovic S. Muyldermans L. (2021). The capacitated directed cycle hub location and routing problem under congestion. Eur. J. Operational Res.292, 714–734. doi: 10.1016/j.ejor.2020.11.021
3
Caris A. Macharis C. Janssens G. K. (2013). Decision support in intermodal transport: A new research agenda. Comput. Industry64, 105–112. doi: 10.1016/j.compind.2012.12.001
4
Chen K. Guo J. Xin X. Zhang T. Zhang W. (2023a). Port sustainability through integration: A port capacity and profit-sharing joint optimization approach. Ocean Coast. Manage.245, 106867. doi: 10.1016/j.ocecoaman.2023.106867
5
Chen K. Yang Z. Notteboom T. (2014). The design of coastal shipping services subject to carbon emission reduction targets and state subsidy levels. Transportation Res. Part E: Logistics Transportation Rev.61, 192–211. doi: 10.1016/j.tre.2013.11.004
6
Chen Z. Zhang Z. Bian Z. Dai L. Hu H. (2023b). Subsidy policy optimization of multimodal transport on emission reduction considering carrier pricing game and shipping resilience: A case study of Shanghai port. Ocean Coast. Manage.243, 106760. doi: 10.1016/j.ocecoaman.2023.106760
7
Dai Q. Yang J. Li D. (2018). Modeling a three-mode hybrid port-hinterland freight intermodal distribution network with environmental consideration: the case of the Yangtze river economic belt in China. Sustainability10, 3081. doi: 10.3390/su10093081
8
Fontes F. Goncalves G. (2019). A variable neighbourhood decomposition search approach applied to a global liner shipping network using a hub-and-spoke with sub-hub structure. Int. J. Production Res.59, 30–46. doi: 10.1080/00207543.2019.1693652
9
Friedman D. (1991). Evolutionary games in economics. Econometrica59, 637–666. doi: 10.2307/2938222
10
Guo X. He J. Lan M. Yu H. Yan W. (2022). Modeling carbon emission estimation for hinterland-based container intermodal network. J. Cleaner Production378, 134593. doi: 10.1016/j.jclepro.2022.134593
11
Guo X. He J. Yu H. Liu M. (2023). Carbon peak simulation and peak pathway analysis for hub-and-spoke container intermodal network. Transportation Res. Part E: Logistics Transportation Rev.180, 103332. doi: 10.1016/j.tre.2023.103332
12
Halim R. A. Kwakkel J. H. Tavasszy L. A. (2016). A strategic model of port-hinterland freight distribution networks. Transportation Res. Part E: Logistics Transportation Rev.95, 368–384. doi: 10.1016/j.tre.2016.05.014
13
He J. Li Z. Zhang X. Wang H. Dong W. Du E. et al . (2022). Towards carbon neutrality: A study on China’s long-term low-carbon transition pathways and strategies. Environ. Sci. Ecotechnology9, 100134. doi: 10.1016/j.ese.2021.100134
14
He J. Zhang L. Deng Y. Yu H. Huang M. Tan C. (2023). An allocation approach for external truck tasks appointment in automated container terminal. Advanced Eng. Inf.55, 101864. doi: 10.1016/j.aei.2022.101864
15
Hrušovský M. Demir E. Jammernegg W. Van Woensel T. (2018). Hybrid simulation and optimization approach for green intermodal transportation problem with travel time uncertainty. Flexible Serv. Manufacturing J.30, 486–516. doi: 10.1007/s10696-016-9267-1
16
Hu X. Cheng R. Chen X. Zhao J. Liu F. Zhou X. (2025). Optimization and implementation strategy for low-carbon multimodal transport routes: A collaborative approach between government and transport enterprises. J. Cleaner Production502, 145341. doi: 10.1016/j.jclepro.2025.145341
17
Janic M. (2007). Modelling the full costs of an intermodal and road freight transport network. Transportation Res. Part D: Transport Environ.12, 33–44. doi: 10.1016/j.trd.2006.10.004
18
Jiang Y. Xu C.-y. Xu J. (2025). Research on optimization of green marine fuel supply chain considering fuel substitution effects. Front. Mar. Sci.12. doi: 10.3389/fmars.2025.1668875
19
Lam J.S. L. Gu Y. (2016). A market-oriented approach for intermodal network optimisation meeting cost, time and environmental requirements. Int. J. Production Econ171, 266–274. doi: 10.1016/j.ijpe.2015.09.024
20
Li L. Zhang Q. Zhang T. Zou Y. Zhao X. (2023). Optimum route and transport mode selection of multimodal transport with time window under uncertain conditions. Mathematics11, 3244. doi: 10.3390/math11143244
21
Liu M. Lai K.-h. Wong C. W. Y. Xin X. Lun V. Y. H. (2025). Smart ports for sustainable shipping: concept and practices revisited through the case study of China’s Tianjin port. Maritime Econ Logistics27, 50–95. doi: 10.1057/s41278-024-00291-3
22
Shen W. S. Khoong C. M. (1995). A DSS for empty container distribution planning. Decision Support Syst.15, 75–82. doi: 10.1016/0167-9236(94)00037-S
23
Sheng D. Li Z.-C. Fu X. Gillen D. (2017). Modeling the effects of unilateral and uniform emission regulations under shipping company and port competition. Transportation Res. Part E: Logistics Transportation Rev.101, 99–114. doi: 10.1016/j.tre.2017.03.004
24
Sun Y. Lang M. (2015). Modeling the multicommodity multimodal routing problem with schedule-based services and carbon dioxide emission costs. Math. Problems Eng.2015, 406218. doi: 10.1155/2015/406218
25
Sun Y. Yu N. Huang B. (2022). Green road–rail intermodal routing problem with improved pickup and delivery services integrating truck departure time planning under uncertainty: an interactive fuzzy programming approach. Complex Intelligent Syst.8, 1459–1486. doi: 10.1007/s40747-021-00598-1
26
Wang Q.-Z. Chen J.-M. Tseng M.-L. Luan H.-M. Ali M. H. (2020a). Modelling green multimodal transport route performance with witness simulation software. J. Cleaner Production248, 119245. doi: 10.1016/j.jclepro.2019.119245
27
Wang H. Ruan Y. Niu B. Zhang H. (2024). Intra-port demand coordination and inter-port competition: Ports’ pricing strategies with congestion concerns. Ocean Coast. Manage.248, 106918. doi: 10.1016/j.ocecoaman.2023.106918
28
Wang W. Xu X. Jiang Y. Xu Y. Cao Z. Liu S. (2020b). Integrated scheduling of intermodal transportation with seaborne arrival uncertainty and carbon emission. Transportation Res. Part D: Transport Environ.88, 102571. doi: 10.1016/j.trd.2020.102571
29
Xin X. Wang X. Zhang T. Chen H. Guo Q. Zhou S. (2023). Liner alliance shipping network design model with shippers’ choice inertia and empty container relocation. Electronic Res. Arch.31, 5509–5540. doi: 10.3934/era.2023280
30
Xu L. Huang J. Fu S. Chen J. (2025a). Evaluation of navigation capacity in the Northeast Arctic passage: evidence from multiple factors. Maritime Policy Manage.52, 497–513. doi: 10.1080/03088839.2024.2376126
31
Xu L. Li X. Yan R. Chen J.-h. (2025b). How to support shore-to-ship electricity constructions: Tradeoff between government subsidy and port competition. Transportation Res. Part E: Logistics Transportation Rev.201, 104258. doi: 10.1016/j.tre.2025.104258
32
Xu L. Wu J. Yan R. Chen J. (2025c). Is international shipping in right direction towards carbon emissions control? Transport Policy166, 189–201. doi: 10.1016/j.tranpol.2025.03.009
33
Xu L. Wu J. Yan R. Chen J. Fu S. (2025d). Who predicts better? A comparison of machine learning and econometrics in forecasting CO2 emissions from global shipping. Energy338, 138967. doi: 10.1016/j.energy.2025.138967
34
Xu Q. Zhong Y. Deng H. Wang X. Chen X. (2024). Scheduling on tractor and trailer transportation considering the influence of disrupted events based on the contract net and simulated annealing algorithm. Digital Transportation Saf.3, 155–168. doi: 10.48130/dts-0024-0014
35
Yin C. Ke Y. Chen J. Liu M. (2021). Interrelations between sea hub ports and inland hinterlands: Perspectives of multimodal freight transport organization and low carbon emissions. Ocean Coast. Manage.214, 105919. doi: 10.1016/j.ocecoaman.2021.105919
36
Yin C. Zhang Z.-A. Fu X. Ge Y.-E. (2024). A low-carbon transportation network: Collaborative effects of a rail freight subsidy and carbon trading mechanism. Transportation Res. Part A: Policy Pract.184, 104066. doi: 10.1016/j.tra.2024.104066
37
Zhu M. Shen S. Shi W. (2023). Carbon emission allowance allocation based on a bi-level multi-objective model in maritime shipping. Ocean Coast. Manage.241, 106665. doi: 10.1016/j.ocecoaman.2023.106665
Summary
Keywords
port consolidation and distribution, multi-party coordination, evolutionary game, numerical simulation, parameter sensitivity
Citation
Xu Q, Deng H, Huang J, Wang J, Wu Q and Zhang W (2025) Optimization of multi-party cooperative game strategies for port consolidation and distribution under the goal of “Dual Carbon”. Front. Mar. Sci. 12:1741273. doi: 10.3389/fmars.2025.1741273
Received
07 November 2025
Revised
24 November 2025
Accepted
30 November 2025
Published
17 December 2025
Volume
12 - 2025
Edited by
Lang Xu, Nanyang Technological University, Singapore
Reviewed by
Xu Changyan, Shanghai Maritime University, China
Zhenhua Yang, Shandong University of Science and Technology, China
Updates
Copyright
© 2025 Xu, Deng, Huang, Wang, Wu and Zhang.
This is an open-access article distributed under the terms of the Creative Commons Attribution License (CC BY). The use, distribution or reproduction in other forums is permitted, provided the original author(s) and the copyright owner(s) are credited and that the original publication in this journal is cited, in accordance with accepted academic practice. No use, distribution or reproduction is permitted which does not comply with these terms.
*Correspondence: Wei Zhang, wzhang.vera@gmail.com
Disclaimer
All claims expressed in this article are solely those of the authors and do not necessarily represent those of their affiliated organizations, or those of the publisher, the editors and the reviewers. Any product that may be evaluated in this article or claim that may be made by its manufacturer is not guaranteed or endorsed by the publisher.