Abstract
As the maritime industry accelerates its transition toward decarbonization, electric automated guided vehicles utilizing battery swapping stations (BSSs) have emerged as a critical solution for green automated container terminals. However, the adoption of this low-carbon technology faces dual challenges: high capital investment and significant demand uncertainty. Traditional replacement strategies, often relying on fixed cycles or empirical judgment, fail to adequately account for battery performance degradation and demand fluctuations, leading to resource mismatches and hindering the economic sustainability of electrification. To address these issues, this paper proposes a multi-period decision-making model for optimizing battery investment and replacement strategies under uncertainty. The model manages batteries in age-based groups and optimizes procurement timing and usage allocation to minimize the total operational cost in net present value, ensuring a cost-effective transition to green logistics. To handle demand uncertainty without relying on precise distributional information, we establish distributionally robust chance constraints based on the Wasserstein distance. Furthermore, we propose an approximation method using Conditional Value-at-Risk (CVaR) and derive its closed-form expression through duality theory. Numerical experiments validate the model’s effectiveness. Comparative analysis demonstrates that the CVaR method exhibits superior robustness in extreme demand scenarios compared to expectation-based approaches, providing a theoretical foundation for reliable and resilient energy management in decarbonized terminals.
1 Introduction
The maritime industry is currently undergoing a transformation driven by the need for decarbonization and sustainable development. With the International Maritime Organization setting ambitious targets to reduce greenhouse gas emissions, green ports have become a strategic priority for global port corporations (Chen et al., 2023; Miao et al., 2025; Xu et al., 2025). In this context, automated container terminals (ACTs) are spearheading the transition to zero-emission operations. As the core component of the terminal’s horizontal transport system, carrying vehicles are shifting from diesel-powered trucks to electric automated guided vehicles (AGVs), serving as a critical measure to eliminate carbon emissions at the terminal (Zhang et al., 2025b; Tadros et al., 2023).
Battery replacement mode has been widely used in high-intensity port environments. Unlike plug-in charging, which often necessitates prolonged downtime for energy replenishment and requires a high charger-to-vehicle ratio, the battery swapping mode physically exchanges depleted batteries for fully charged ones within minutes. This rapid replenishment capability significantly improves AGV utilization rates, effectively decoupling energy replenishment from transport operations (Zhen et al., 2025; Zhang et al., 2025a).
However, despite its operational merits, the widespread adoption of this technology is impeded by significant economic and operational challenges, primarily revolving around the management of batteries. The BSS faces a yet intensified “supply-demand balance” dilemma under the pressure of cost-effective decarbonization. On the one hand, batteries are expensive assets subject to performance degradation; excessive inventory leads to substantial capital tie-up and resource waste, undermining the economic feasibility (Zhang et al., 2021a). On the other hand, the demand for battery swapping is highly uncertain, fluctuating dynamically with shipping schedules and terminal throughput (Xin et al., 2023). Insufficient inventory risks service interruptions, which not only paralyze terminal operations but may also cause vessel congestion, leading to increased emissions and reputational damage (Xu et al., 2024; Goldstein et al., 2022).
Therefore, formulating a scientifically sound battery investment and replacement strategy—one that minimizes operating costs while ensuring service reliability under uncertainty—is crucial for the sustainable operation of green terminals. A review of existing literature reveals limitations across three dimensions. First, studies predominantly focus on short-term AGV scheduling and path planning (Che et al., 2024; Zhou et al., 2024), often treating BSS capacity as a fixed constraint. Second, investment optimization of ACTs has largely targeted YCs and trucks (Tan et al., 2022; Zhang et al., 2024a), failing to address the unique lifecycle dynamics of circulating battery assets. Third, current strategies often rely on deterministic forecasts or stochastic programming with assumed distributions (Peng et al., 2016). These gaps collectively expose port operators to financial risks and operational vulnerabilities.
This paper establishes a distributionally robust optimization (DRO) model for the battery investment and replacement strategy of a BSS. Unlike traditional stochastic programming that relies on precise probability distributions, our data-driven approach constructs an ambiguity set based on the Wasserstein distance to capture demand uncertainty. This method allows us to minimize the net present value (NPV) of costs while satisfying demand under worst-case scenarios. By optimizing the timing of procurement and the allocation of batteries across their lifecycle, our model provides a robust roadmap for port operators to navigate the financial and operational complexities of going green. The contributions of this study are as follows:
-
Proposing a multi-period decision model based on battery age groups for the optimization problem of the battery investment and replacement strategy in container terminal BSSs. This model systematically considers the full operating costs of battery procurement and holding, significantly reducing the model size compared to battery-based modeling methods.
-
We utilized real port data. Employing a data-driven DRO approach to handle the uncertainty of battery swapping demand. An ambiguity set is constructed based on the Wasserstein distance, avoiding the reliance on distributional assumptions of traditional stochastic optimization.
-
Proposing an approximation method based on Conditional Value-at-Risk (CVaR) to handle the distributionally robust chance constraints. This method focuses on risk under extreme scenarios, and its closed-form expression is derived, allowing the model to be efficiently solved directly by solvers.
-
In the numerical experiment section, the expectation method with Wasserstein distance ambiguity set is introduced as a baseline for comparison, verifying the necessity of considering tail risk, and providing scientific theoretical support and practical guidance for the investment decisions of terminal BSSs.
The remainder of this paper is organized as follows. Section 2 reviews the related literature on AGV operation optimization, terminal equipment investment, and uncertainty methodologies. Section 3 defines the battery investment and replacement problem in ACT. Section 4 constructs the age-based DRO model aimed at minimizing the NPV of operating costs. Section 5 details the solution methodology, where we derive a closed-form CVaR approximation to transform the intractable distributionally robust chance constraints into a tractable mixed-integer linear programming (MILP) formulation. Section 6 reports the numerical experiment results for both short-term and long-term planning, and conducts a comparative analysis between the CVaR and expectation value methods. Finally, Section 7 concludes the paper and discusses directions for future research.
2 Literature review
The optimization of battery investment and replacement strategies for BSSs in ACTs sits at the intersection of three research streams: operational scheduling of AGV, sustainable infrastructure investment, and decision-making methodologies under uncertainty. This section reviews the relevant literature in these areas to identify the research gaps that this paper aims to bridge.
2.1 Operational optimization of electric AGVs
As the core equipment of the horizontal transport system in ACTs, the stable and efficient operation of AGVs is paramount. The AGV scheduling problem, which focuses on optimally allocating limited vehicle resources to pending container transport tasks, has been extensively studied. Traditional research primarily targets the minimization of makespan or delay time through various methodological approaches, including mathematical programming and heuristic algorithms. For instance, scholars have conducted in depth research from the perspectives of job assignment and scheduling optimization (Che et al., 2024; Guan et al., 2025), as well as conflict-free path planning (Cao et al., 2023). These studies established the foundational framework for AGV operations but often treated batteries as perpetually available resources, overlooking the constraints imposed by energy replenishment.
With the maritime industry’s paradigm shift toward green logistics and decarbonization, energy management has become a critical area in AGV operations. Recent literature has moved beyond simple efficiency objectives to incorporate energy constraints and carbon emission reduction. For example, Zhang et al. (2025b) proposed low-carbon scheduling methods for electric transportation vehicles, emphasizing the trade-off between operational efficiency and energy consumption. Zhou et al. (2024) modeled the charging decision as a Markov decision process to manage AGV charging sequences. Furthermore, for the infrastructure level, Zhen et al. (2025) highlighted the operational advantages of the battery swapping mode over traditional plug-in charging, noting its ability to maximize vehicle availability through rapid energy replenishment. Zhao and Liang (2025) proposed a novel shallow charge and shallow discharge charging strategy based on idle time, which significantly moves beyond simple full charge and full discharge cycles to preserve battery life.
However, despite the rich literature on short-term operational scheduling, there is a disconnect between daily operations and long-term asset management. Most existing studies treat the capacity of BSS and the number of batteries as fixed parameters or infinite resources during the scheduling phase. Systematic research on the strategic level remains relatively scarce.
2.2 Sustainable terminal equipment investment
Regarding terminal equipment investment and asset management, significant work has focused on the electrification and retrofitting of yard cranes (YCs), which are major contributors to terminal emissions. To actively respond to the green port initiative, scholars have developed optimization models to balance the trade-off between capital expenditure and environmental benefits. For instance, Tan et al. (2022) proposed a strategic decision method for YC transformation, constructing a model to minimize the total investment and operation costs while meeting specific carbon emission reduction targets. Similarly, Ding et al. (2021) addressed the transition from diesel-powered to electric-driven rubber-tyred gantry cranes. They emphasized that retrofitting decisions must be integrated with operational planning, developing a model to determine the optimal investment timing and deployment to maintain yard handling capabilities during the transition period. Peng et al. (2016) explored the optimal allocation of resources for YC networks. Rather than focusing on individual equipment, they modeled the energy replacement problem at a network level to minimize total carbon dioxide emissions, demonstrating the importance of systemic resource planning.
In addition to YCs, the investment and configuration of horizontal transport equipment have also attracted attention, particularly under complex operational constraints. Zhang et al. (2024a) investigated the retrofitting and deployment of yard trucks for hazardous material transportation. Their study highlights the complexity of managing a mixed fleet—comprising diesel, electric, and LNG trucks—where investment decisions must satisfy strict safety regulations alongside environmental goals.
Despite these advancements in equipment investment, a critical gap remains regarding the energy infrastructure itself, specifically BSS. Existing research primarily treats equipment (like cranes and trucks) as independent assets to be purchased or retrofitted. However, BSS investment involves a set of multi-period challenges. It requires managing a pool of circulating assets subject to performance battery degradation.
2.3 Methodologies for uncertainty and robustness
From a methodological perspective, mathematical programming is the dominant approach in terminal equipment investment research. Deterministic optimization models, such as those employed by Tan et al. (2022) and Ding et al. (2021), effectively handle scenarios with fixed parameters, determining optimal investment timing and configuration schemes through exact or heuristic algorithms. However, given that investment problems often span long time horizons, handling uncertainty is crucial. Neglecting these stochastic factors may lead to rigid strategies that fail to adapt to actual demand variations, resulting in either substantial capital waste from over-investment or service interruptions due to supply shortages. To address this, stochastic programming has been widely applied. For example, Zhang et al. (2024b) constructed a two-stage stochastic MILP model to handle uncertainties in workloads and carbon quotas. Similarly, Peng et al. (2016) combined mathematical resource allocation models with simulation to cope with high uncertainties in the terminal transportation network. These stochastic programming methods often rely on precise assumptions about probability distributions of uncertain parameters, which are difficult to obtain accurately in practice. This reliance can lead to suboptimal decisions if the assumed distribution is different from reality.
To overcome these limitations, DRO has recently received widespread attention due to its robustness against distribution deviation (Mohajerin Esfahani and Kuhn, 2018). The DRO method constructs an ambiguity set for uncertain parameters, possessing both the interpretability of mathematical models and the generalizability of statistical methods. It has been widely applied in fields such as transportation systems (Zhang et al., 2018; Ghosal and Wiesemann, 2020; Zhang et al., 2021b) and terminal operations. For instance, Agra and Rodrigues (2022) pioneered its application in berth allocation using a Wasserstein-based ambiguity set to address vessel handling time uncertainty. Subsequently, Rodrigues and Agra (2024) extended this methodology to quay crane scheduling, proving that robust models can effectively balance operational costs and reliability.
Motivated by these advancements, this paper adopts the DRO method to handle the uncertainty of battery swapping demand. This method summarizes the patterns of battery swapping demand from historical data, which can effectively prevent the overfitting of theoretical models and improve the generalizability of the model. The method proposed in this paper provides scientific support for the long-term investment decision of battery assets in BSSs, bridging the gap between theoretical robustness and practical application.
3 Problem description
The BSS serves as a critical energy infrastructure for the AGV fleet, ensuring the continuity of terminal operations. We consider a discrete planning horizon , where the terminal operator must formulate sequential decisions on battery procurement and usage allocation to minimize the total operating cost. In each period , two key decisions are required: the quantity of new batteries to purchase, denoted as , and the usage allocation for batteries across different age groups.
To manage performance degradation, batteries are aggregated into categories based on their cumulative usage cycles (age), denoted by . The system follows a strict age-evolution mechanism: as batteries are utilized, they accumulate usage cycles and gradually age. Once a battery reaches the maximum threshold , it must be mandatorily retired from the system. Figure 1 illustrates this time flow, depicting the battery lifecycle through purchasing, utilization, aging, and eventual retirement.
Figure 1
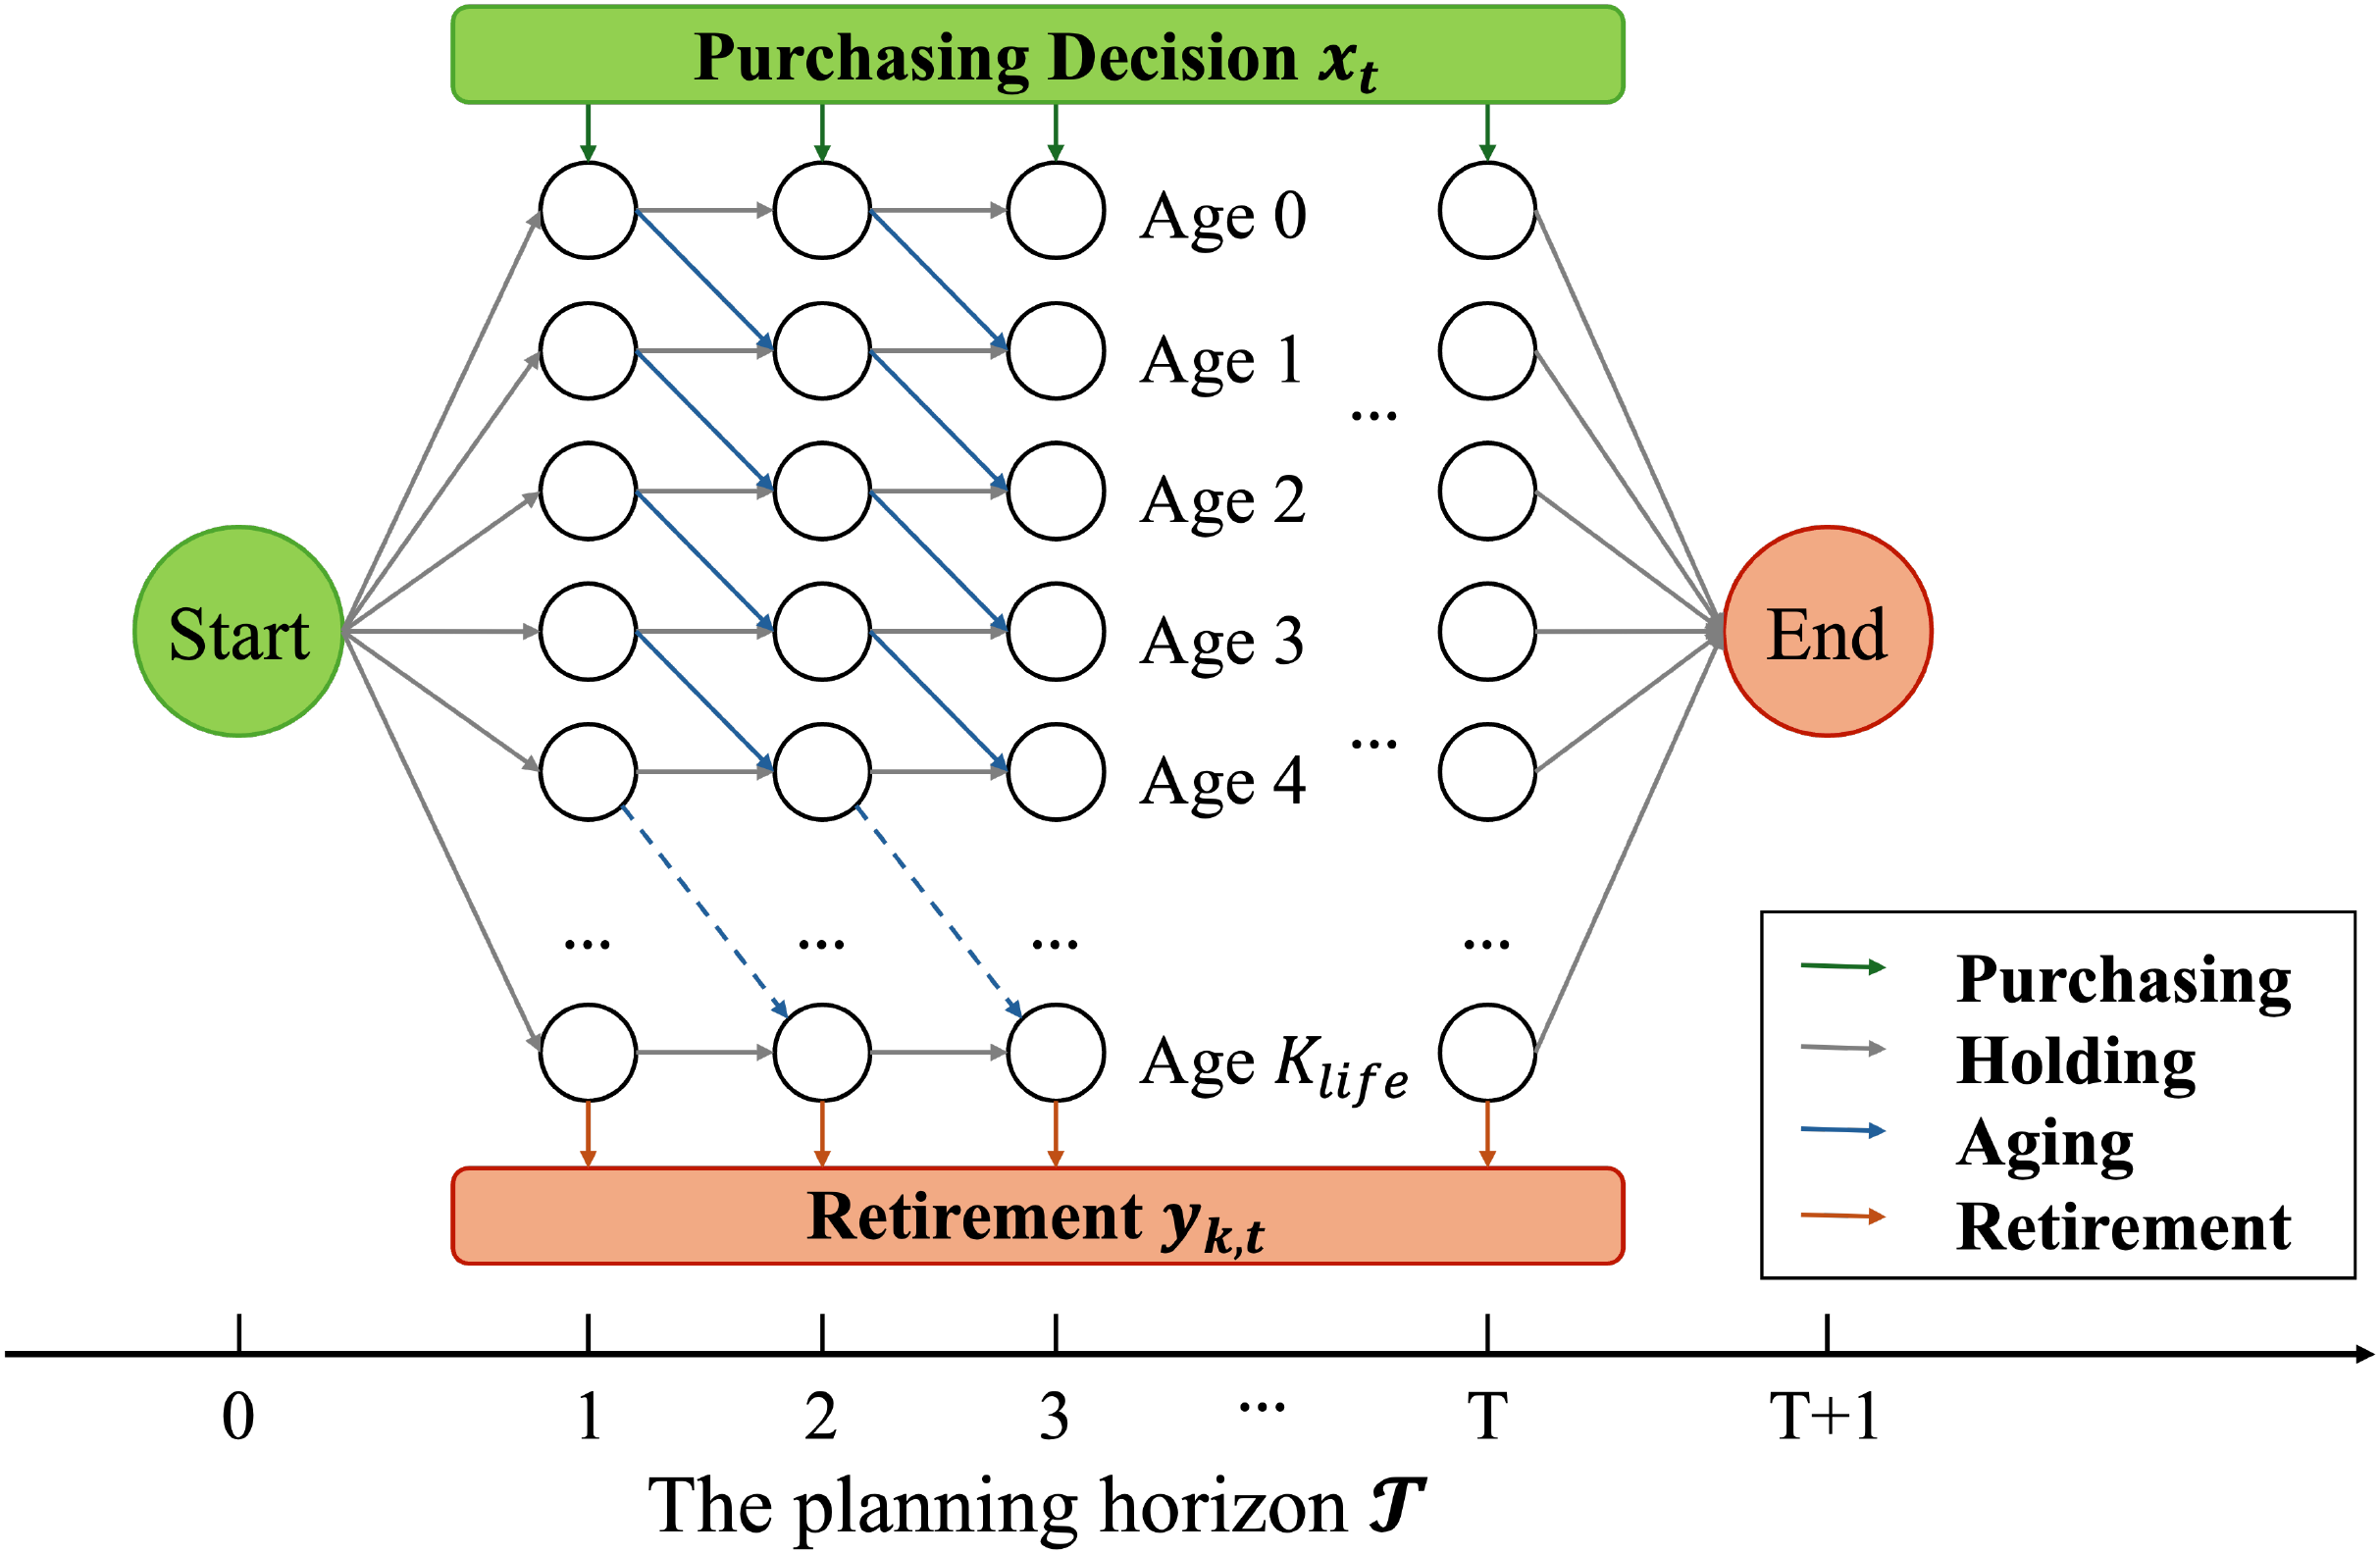
Time network formulation for battery investment and replacement.
The operation of the BSS involves a trade-off between cash flow elements and strict financial constraints. The cost structure includes the procurement cost of new batteries (dbuy), the periodic holding cost for inventory maintenance (dhold), and the book value for remained batteries in the end, determined by an end-of-period asset conversion rate ρ. Because of the capital intensity of ACT, the model has two strict budget constraints: a per-period budget cap Bt to control short-term cash flow pressure, and a total budget cap B for the entire planning horizon. To account for the time value of money, we employ the NPV method, discounting all cash flows to the beginning of the planning horizon using an annual discount rate r. The objective is to minimize the NPV of the total operating cost, thereby achieving value optimization over the battery assets’ entire lifecycle while satisfying operational constraints.
The uncertainty of the battery swapping demand in each period , denoted as . In actual terminal operations, demand is subject to significant random disturbances caused by fluctuating shipping schedules, variable vessel handling rates, and adjustments to AGV operational plans. These factors make accurate long-term prediction difficult. To address this challenge, this paper employs a DRO approach. Specifically, we construct a Wasserstein ambiguity set with a radius to characterize the set of plausible distributions for the disturbance term . This approach allows the model to hedge against the risk of demand deviation and distributional errors, ensuring service reliability even under worst-case demand scenarios.
4 Battery investment and replacement model
This section formulates the mathematical model for the battery investment and replacement problem under demand uncertainty. We first define the mathematical notation used throughout the paper. Subsequently, we construct a Wasserstein distance-based ambiguity set to characterize the distributional uncertainty of battery swapping demand. Based on this, we propose an age-based DRO model aimed at minimizing the NPV of total operating costs.
4.1 Notation
The mathematical symbols used in this paper are defined as follows, based on the problem description in the Section 3.
Sets:
Set of battery age indices, , where represents the cumulative usage cycles of the battery;
Set of full time indices, , where is the length of the planning horizon;
Set of decision period indices, ;
Set of operational period indices, ;
Ω Set of demand uncertainty scenarios, |Ω| denotes the number of scenarios.
Parameters:
Procurement cost of a single battery;
Maintenance cost of a single battery per period;
Battery lifecycle threshold;
Battery swapping demand in period t;
Battery swapping demand in scenario ω ∈ Ω;
Budget upper limit in period t;
Total budget upper limit for the entire planning horizon;
Annual discount rate (for NPV calculation);
End-of-period asset conversion rate;
Number of periods in a year;
Distribution ambiguity set based on Wasserstein distance, with radius parameter θ;
Maximum violation probability for the distributionally robust chance constraint;
Number of batteries with cumulative usages at the initial time.
Decision Variables:
Number of new batteries purchased at the end of period t;
Number of batteries with cumulative usages owned at the beginning of period t;
Number of batteries with k cumulative usages utilized in period t.
4.2 Distributionally robust ambiguity set
To address the uncertainty of battery swapping demand without requiring precise knowledge of its underlying probability distribution, we employ a data-driven approach using Wasserstein distance-based ambiguity sets. The Wasserstein ambiguity set encompasses all probability distributions that lie within a specified statistical distance from the empirical distribution constructed from historical samples, where the radius parameter θ controls the level of robustness.
Let denote the random variable representing the uncertain battery swapping demand. We construct the ambiguity set (θ) using the following formulation:
Equations 1–5 establish the mathematical framework for our ambiguity set construction. Equation 1 defines the ambiguity set by incorporating all probability distributions supported on that reside within a Wasserstein distance of the empirical distribution . The distance metric is formalized in Equation 2, which utilizes the absolute deviation to quantify the cost of transporting probability mass from the empirical distribution to the true distribution. Equations 3 and 4 specify that the uncertain demand follows the candidate distribution , while the historical samples follow the empirical distribution . Finally, Equation 5 defines the joint distribution within the set , representing all valid joint distributions with marginals and . The support set ensures the physical meaningfulness of the demand values (e.g., non-negativity).
4.3 Assumptions
To accurately model this complex decision problem, the following reasonable assumptions are made:
-
All batteries are assumed to be homogeneous, sharing the same model specifications and a uniform maximum service life defined by cumulative usage cycles;
-
The performance degradation of batteries is approximated as a linear function of cumulative usage. The book value of remaining batteries in the end period is calculated following a linear decay rule based on cumulative usage cycles;
-
The battery procurement decision in period t is executed at the end of the period, and the purchased batteries arrive and are put into use at the beginning of period t + 1;
-
To simplify the NPV calculation, it is assumed that all cash flows occur and are discounted centrally at the end of the period.
Regarding Assumption 2, while battery degradation is inherently non-linear, linear simplification is adopted to ensure the tractability of the strategic optimization model. Furthermore, since the procurement decisions are primarily driven by the maximum service life rather than the intermediate degradation process, this approximation has a negligible impact on the optimal investment strategy, affecting only the minor book value in the end period.
4.4 Age-based DRO model
The optimization problem for the battery replacement strategy, considering demand uncertainty, can be formulated as the following model with distributionally robust chance constraints:
The objective function (Equation 6) aims to minimize the total NPV cost of the BSS, including three parts. The first term represents the present value of new battery procurement costs. The second term is the present value of battery holding costs, calculated based on the total number of batteries owned in each period and discounted. The third term represents the book value of the remaining batteries at the end, due to asset recovery. Constraints (Equation 7) are the distributionally robust chance constraints, ensuring the reliability of the battery swapping service under demand uncertainty. This constraint is based on the Wasserstein ambiguity set , requiring that the total supply capacity of the BSS meets the uncertain demand with a probability of at least under the worst-case distribution. Compared to traditional deterministic demand constraints, this chance constraint maintains an acceptable service level by controlling the violation probability . Constraints (Equation 8) limit the usage quantity of each age group to no more than the number of batteries owned in that group. Constraints (Equation 9) state that the new batteries in the next period originate from the batteries purchased in the current period. Constraints (Equation 10) are the core constraints for age evolution. At the beginning of period t, there are batteries with k cumulative usages, of which are used, and their cumulative usage increases to ; the unused batteries retain k cumulative usages; meanwhile, batteries that had cumulative usages in the previous period become k cumulative usages after being used. Therefore, the number of batteries with cumulative usages at the beginning of period equals the sum of k-aged batteries unused in this period and -aged batteries used in the previous period. Constraints (Equation 11) are the per-period budget constraint, limiting the sum of procurement expenditure and holding costs in each operational period () to no more than the budget upper limit The initial procurement at is treated as a one-time construction investment and is excluded from this operational budget constraint. Constraints (Equation 12) are the total budget constraint, limiting the cumulative procurement expenditure and holding costs over the entire planning horizon. Constraints (Equation 13) set the initial age distribution based on the pre-existing inventory . Constraint (Equation 14) stipulates that no new batteries are purchased during the liquidation period. Constraints (Equations 15–17) define the domain of the decision variables, where all variables are non-negative integers.
5 Tractable reformulation based on CVaR
The distributionally robust chance constraint (7) involves an infinite number of constraints due to the continuous nature of the ambiguity set, making the original model intractable. To address this, we propose a deterministic approximation method based on CVaR. This section details the transformation process, the theoretical derivation under the Wasserstein ambiguity set, and the final tractable MILP formulation.
5.1 CVaR approximation and decomposition
To ensure the reliability of battery swapping services, we require that the probability of supply meeting demand is at least under the worst-case distribution within the ambiguity set. This is formally expressed as the following distributionally robust chance constraint (7). Directly solving it is computationally intractable due to the non-convexity of the chance constraint and the infinite dimension of the ambiguity set. To address this, we introduce the CVaR as a convex conservative approximation. Based on the fundamental property that CVaR serves as a rigorous upper bound for the Value-at-Risk, we can transform the original chance constraint into a mathematically tractable form through the transformation shown in Equation 18:
The implication in step 3 holds because is a sufficient condition for , providing a safe approximation for the original problem (Rockafellar and Uryasev, 2000).
To further simplify the constraint and decouple the decision variables from the uncertainty, we exploit the translation invariance property of coherent risk measures.
Equation 19 shows that the total battery supply in each period must exceed the worst-case CVaR of the random demand.
5.2 Closed-form representation under Wasserstein ambiguity
It’s difficult to compute the worst-case CVaR of the uncertain demand ξt over the infinite-dimensional Wasserstein ambiguity set. Based on strong duality, we derive a closed-form expression that depends only on the historical data and the robustness radius.
Theorem 1. Consider the uncertainty setwithhistorical scenarios. Let the observed demand values be denoted byfor each scenario. Under a confidence leveland a Wasserstein ambiguity setwith radius, if the historical samples are sorted in descending order such that, the worst-case CVaR can be calculated as:
where and are defined to handle boundary cases. The proof is provided in Appendix 1.
Theorem 1 decomposes the worst-case risk into three interpretable components: 1) The average value of the worst scenarios, capturing the tail risk inherent in the historical data; 2) A fractional adjustment term for the boundary scenario, ensuring the continuity of the risk measure; 3) A robustness term, where a larger Wasserstein radius imposes a stricter penalty for distributional deviation, offering stronger protection.
5.3 Transformed deterministic MILP model
Through Theorem 1, we obtain the tractable formulation. The original distributionally robust chance constraint (7) is replaced by the Equation 21.
This transformation eliminates the infinite-dimensional constraints. The resulting model consists solely of a linear objective function and linear constraints, allowing it to be efficiently solved to global optimality using standard commercial solvers such as Gurobi or CPLEX.
The computational complexity of the transformed model is primarily determined by the planning horizon and the battery lifecycle resolution . Specifically, the number of integer decision variables scales linearly with the product of and (). Although the problem size naturally expands as the planning horizon extends or the age becomes finer, this growth is polynomial rather than exponential. Consequently, even for long-term scenarios, the problem dimension remains within the efficient handling capabilities of standard commercial solvers. Furthermore, unlike individual battery tracking models, the complexity of our formulation is independent of the total number of batteries, ensuring scalability in large-scale terminals.
6 Case study and analysis
To validate the effectiveness and practical viability of the proposed model, this section conducts numerical experiments based on real-world operational data from a large-scale ACT in China. The experimental analysis addresses distinct decision horizons: a 5-year short-term planning for a BSS and a 20-year long-term planning for a BSS. Furthermore, we perform a comparative analysis between the proposed CVaR-based method and the expectation-based approach, highlighting the trade-offs between investment efficiency and operational resilience. The program is implemented in C++ and solved using the commercial solver Gurobi 12.0.3.
6.1 Parameter design
The parameters for the numerical experiments are derived from the actual operational data of a large-scale ACT in China. Specifically, the dataset reflects the aggregate charging requirements of a fleet comprising approximately 90 AGVs. Detailed demand characteristics are presented in Figure 2 in Section 6.2. We designed two scenarios to reflect different stages of infrastructure development:
Figure 2
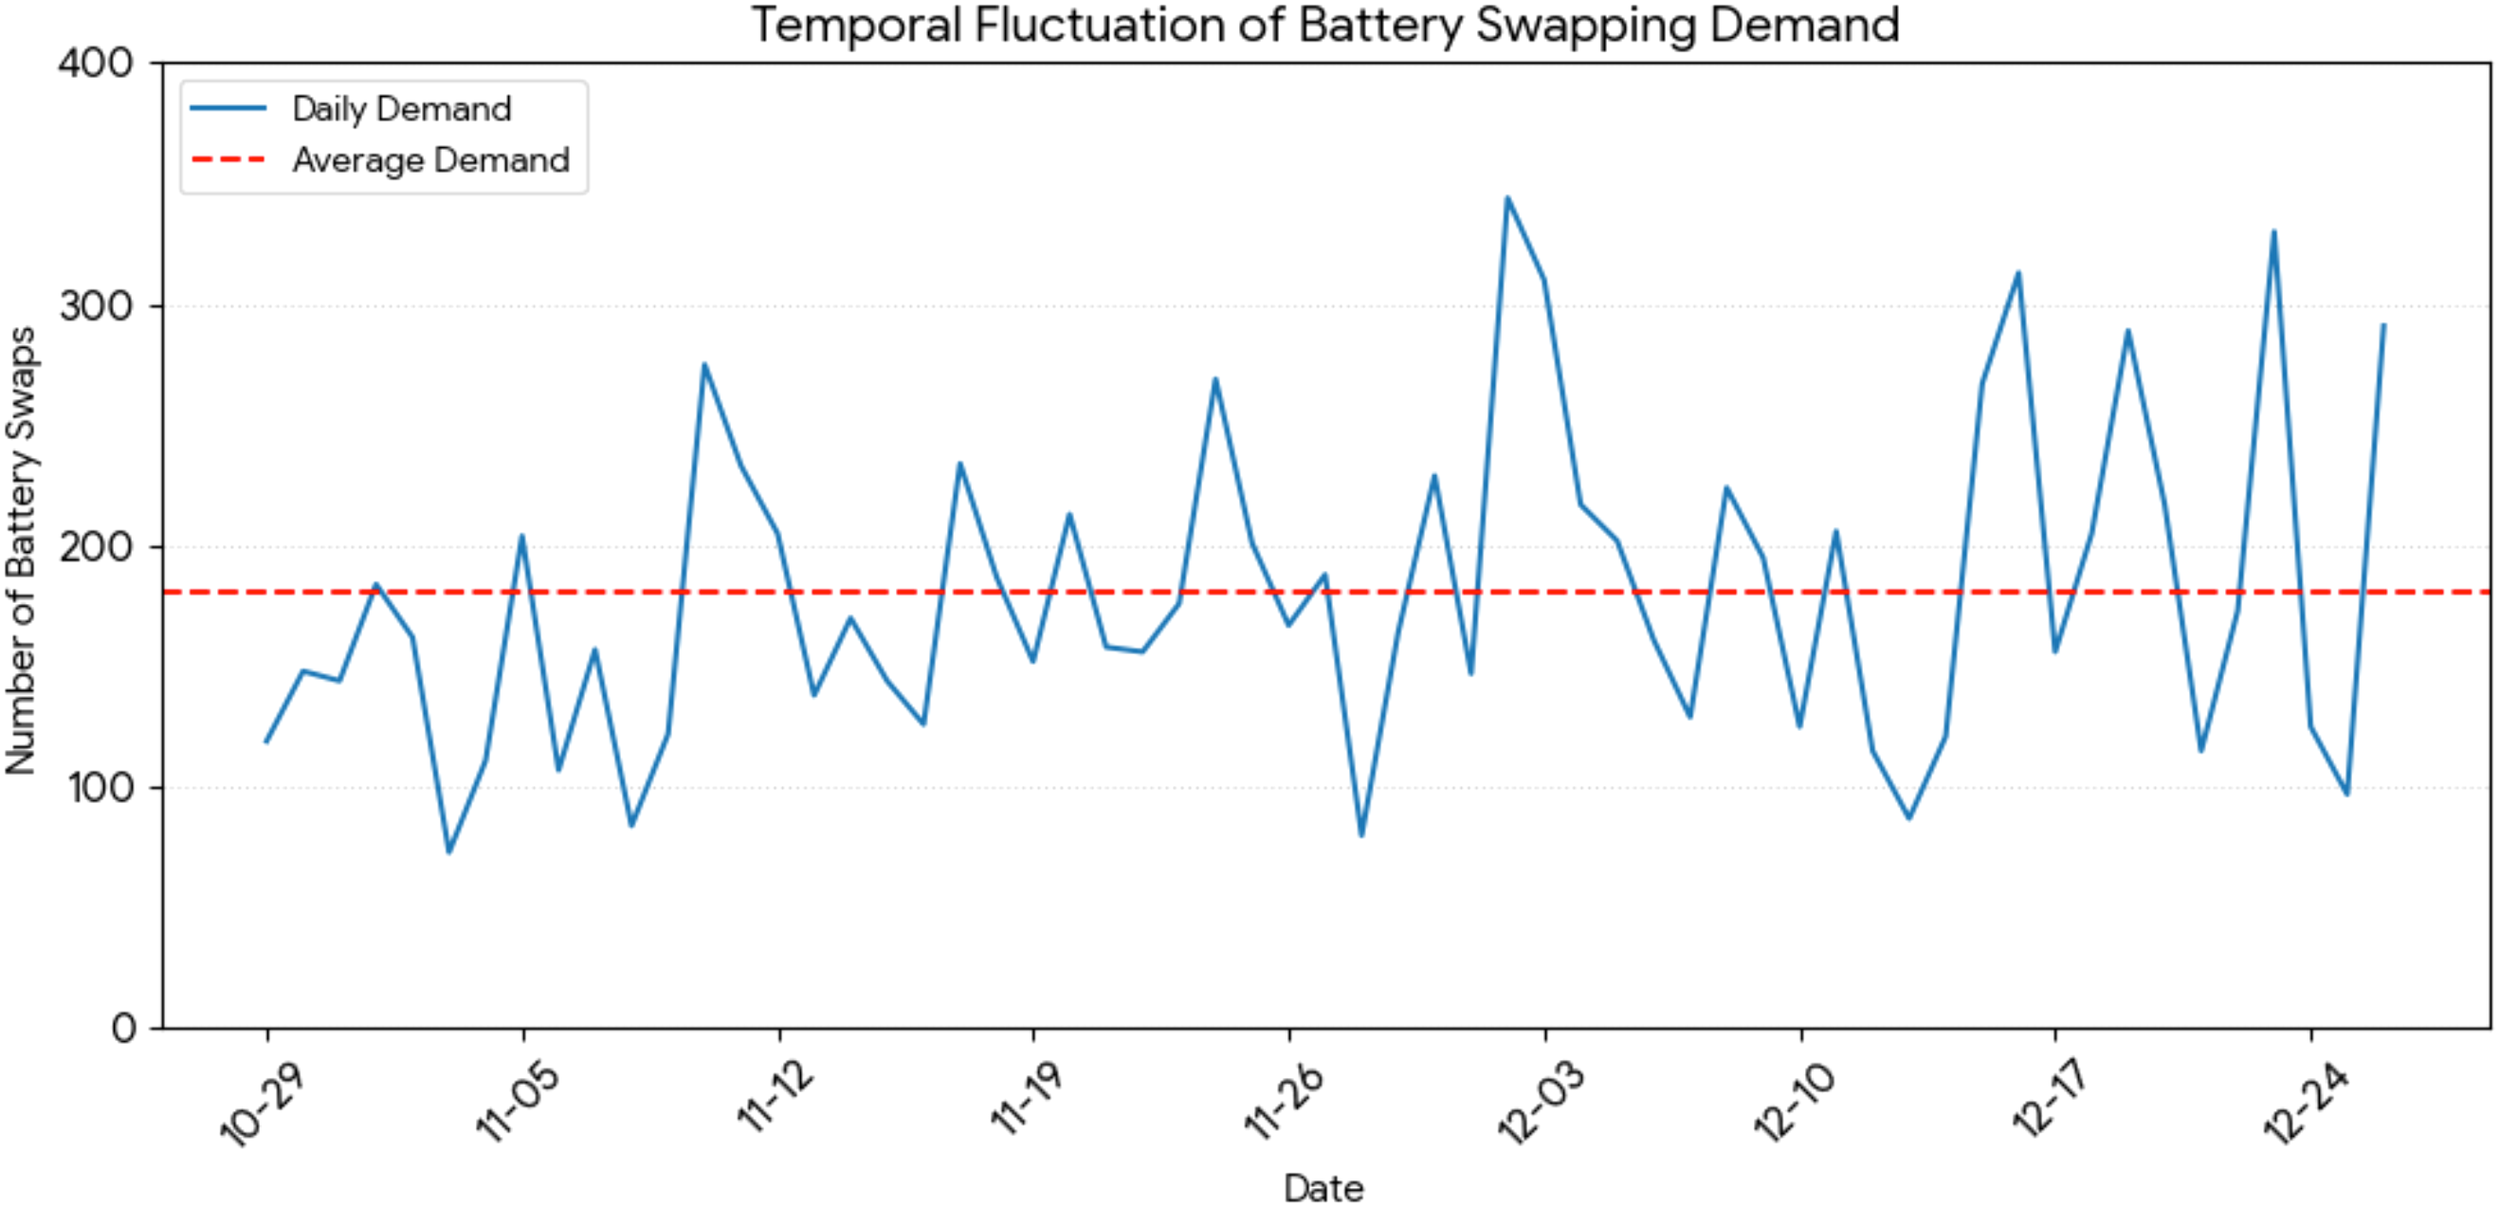
Temporal fluctuation of daily battery swapping demand.
-
5-year short-term plan: Simulating a project where the operator optimizes the replacement of aging battery assets in an operational station. This scenario addresses the immediate challenge of maintaining service continuity while upgrading green assets under strict budget constraints.
-
20-year long-term plan: Simulating a long-term strategic investment scenario aligned with the decarbonization roadmap. This scenario focuses on the optimal capacity planning over a 20-year horizon to demonstrate the model’s capability in long-term asset management.
According to the actual battery life degradation curve, a single battery can undergo approximately 2500 full charge-discharge cycles. Considering that each battery is used a maximum of 50 times per month in actual terminal operations, we define one month as one decision period, thus obtaining a battery lifecycle threshold Klife of 50 usage cycles.
For cost parameters, the procurement cost of a new battery dbuy is set to 100,000 Yuan/unit. This value is based on quotes from the terminal’s actual equipment supplier and aligns with current average market prices for industrial battery packs. The single-period holding cost dhold is 500 Yuan/month, covering maintenance, storage, and safety monitoring fees. The end-of-period asset conversion rate ρ is set to 0.3. The annual discount rate r is set to 8%, which is the general standard of China. For the DRO model parameters, the Wasserstein distance radius is set to θ = 0.1 and the confidence level to ϵ = 0.2.
6.2 Empirical analysis of battery swapping demand
To ensure the proposed model captures the operational realities of container terminals, we analyzed daily battery swapping demand data collected from a large-scale ACT in China over a two-month period (October 29 to December 26). This demand dataset serves as the empirical basis for constructing the ambiguity set .
6.2.1 Temporal fluctuation and volatility
Figure 2 illustrates the temporal fluctuation of battery swapping demand. The red dashed line in Figure 2 represents the average demand level. The data exhibits significant volatility, driven by the stochastic nature of varying on-site operational intensities. Descriptive statistics reveal a mean daily demand of approximately 180. However, relying solely on this average metric conceals critical operational risks. The peak demand surged to nearly twice the average level (e.g., December 2nd and 23rd), while the lowest demand dropped to below 80 swaps. Notably, actual demand exceeded this average on 44.1% of the observed days. This empirical evidence supports the “Average Value Trap” inherent in traditional expectation-based optimization: a capacity plan based on average demand would likely result in service interruptions for nearly half of the operational period.
6.2.2 Distributional characteristics of demand
Figure 3 further presents the frequency distribution of daily demand. The distribution is not perfectly symmetric and exhibits a “fat tail” characteristic on the right side, representing the occurrence of extremely high-demand events. These tail events, although less frequent, pose disproportionately high risks to terminal operations, potentially leading to severe congestion and delays. This observation provides a justification for adopting the CVaR-based DRO approach, which specifically targets these tail risks to ensure operational resilience under worst-case scenarios.
Figure 3
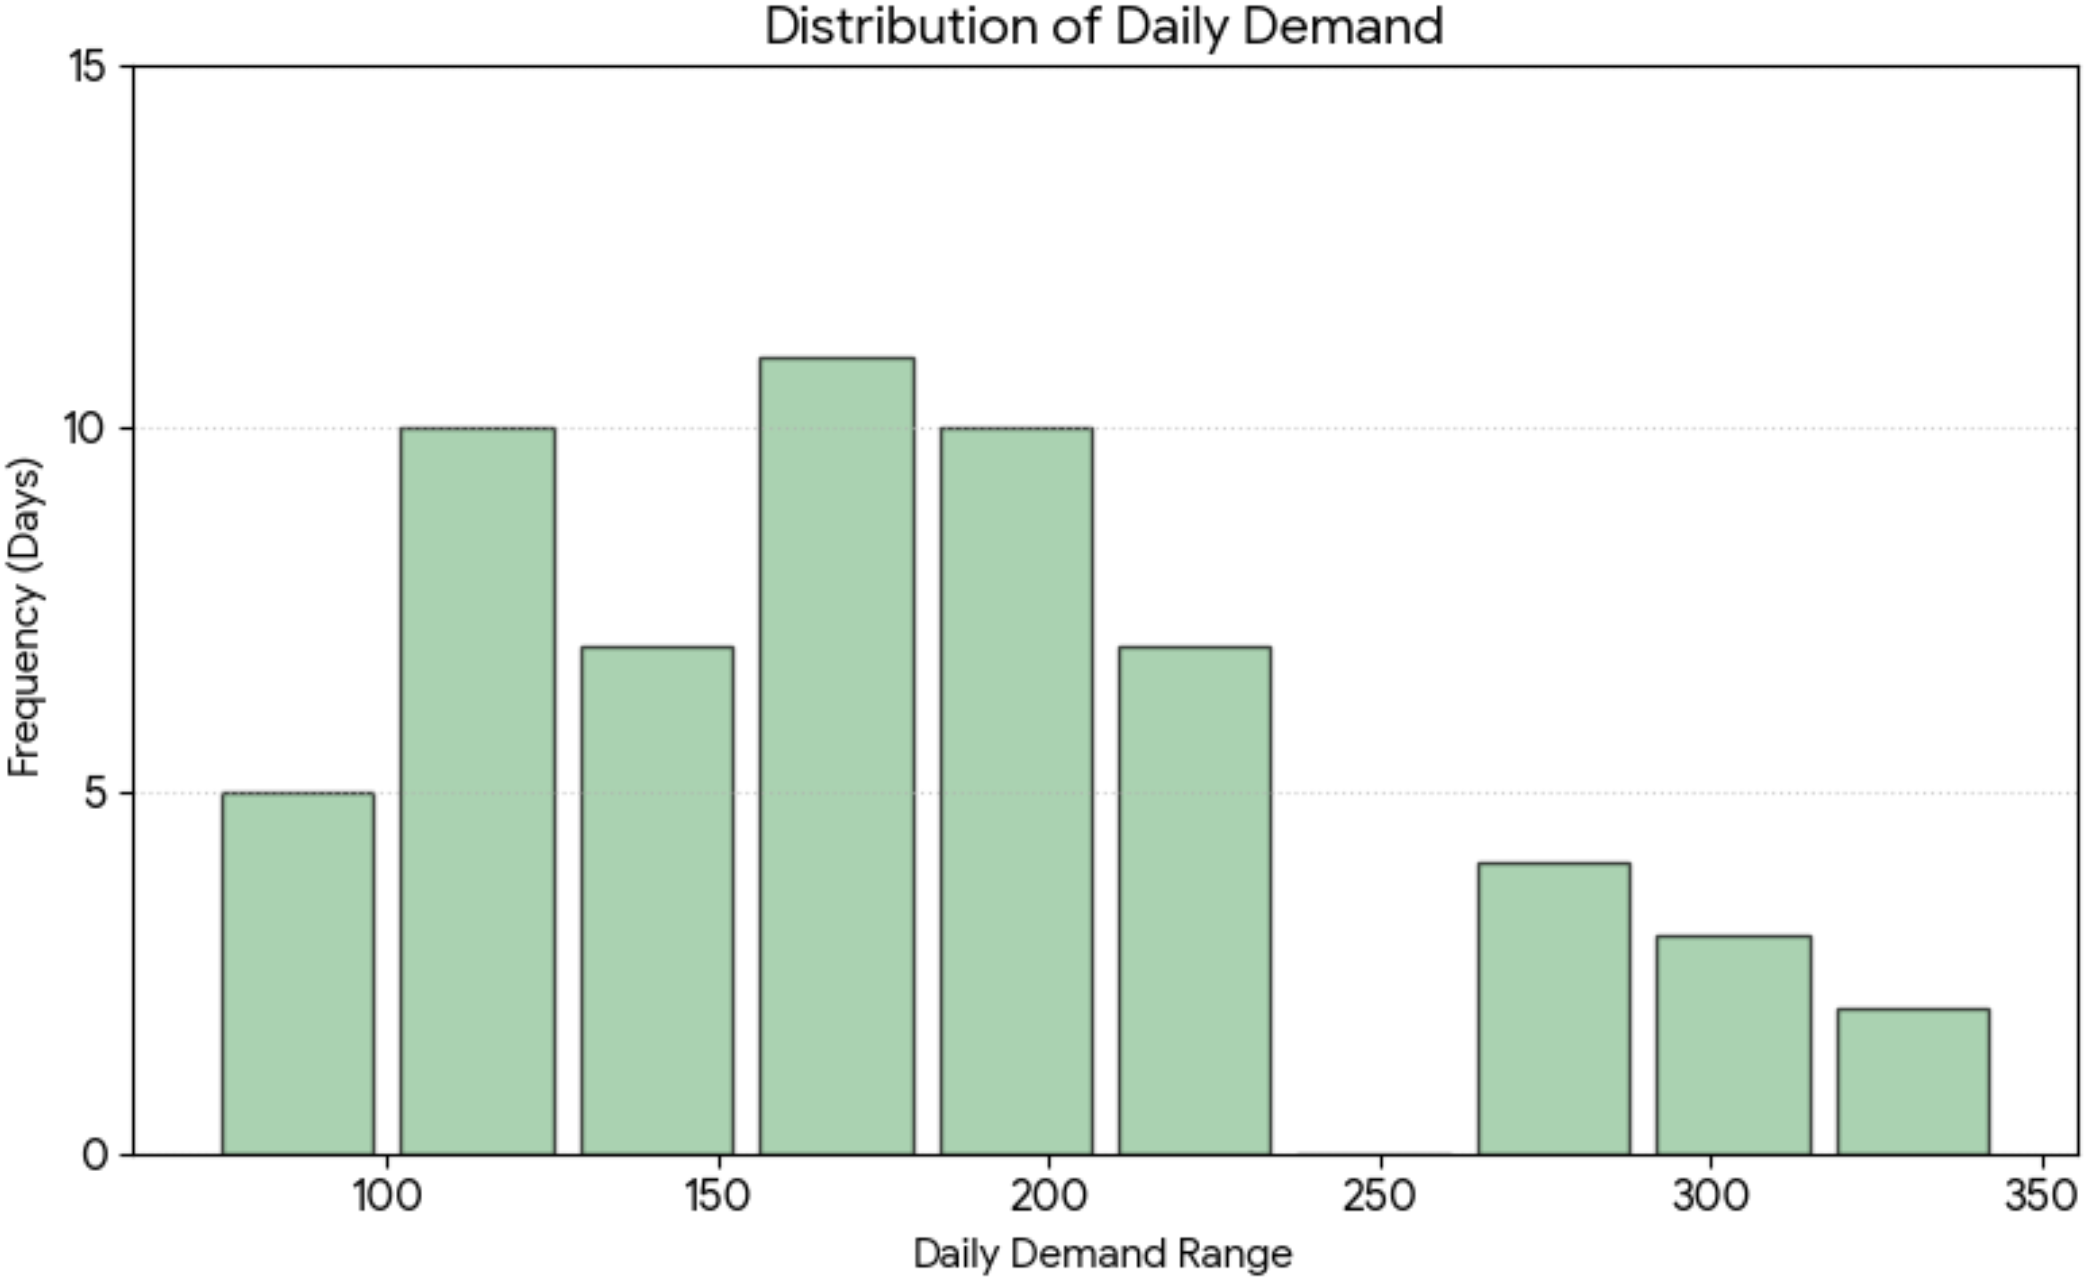
Frequency distribution of daily battery swapping demand.
These historical records serve as the reference for constructing the dataset utilized in the subsequent numerical analysis, ensuring that the demand scenarios reflect realistic operational fluctuations.
6.3 Case study of short-term planning
This section conducts a granular analysis of the 5-year planning horizon for an operational BSS, simulating the investment decision process within a Chinese port enterprise’s strategic framework. The scenario targets a BSS with an initial stock of 120 batteries at varying stages of degradation, with cumulative usage cycles uniformly distributed in . The solver reached the optimal solution with a Gap of 0.01% in 24.5 seconds.
6.3.1 Cost structure analysis
The total NPV cost is 21.5 million Yuan over the planning horizon. For the cost composition, battery procurement is the dominant expenditure, accounting for nearly 80% of the total operating cost. Specifically, the initial procurement incurs 7.5 million Yuan (34.87%). Operational period procurement accounts for the largest share at 9.7 million Yuan (45.08%), reflecting the continuous investment required to sustain operations. The NPV of holding costs stands at 4.6 million Yuan (21.32%), illustrating the long-term financial burden of maintaining an inventory buffer.
6.3.2 Inventory and procurement dynamics
Figure 4 visualizes the procurement decisions and inventory evolution. A total of 182 batteries are procured over the total horizon. The inventory trajectory exhibits a distinct “high-fluctuation – stability – decay” pattern. Initially, procurement initiates at 3 batteries (periods 1–5) and escalates to 4 batteries (periods 6–28) to counteract the retirement of legacy batteries. Crucially, the system enters an inventory stability phase from period 30 to 50, maintaining a constant level of 182 units. This phase represents optimal operational resilience, where the BSS possesses sufficient capacity to withstand operational demand without procurement. Finally, after period 51, inventory naturally decays to a minimum of 171 units.
Figure 4
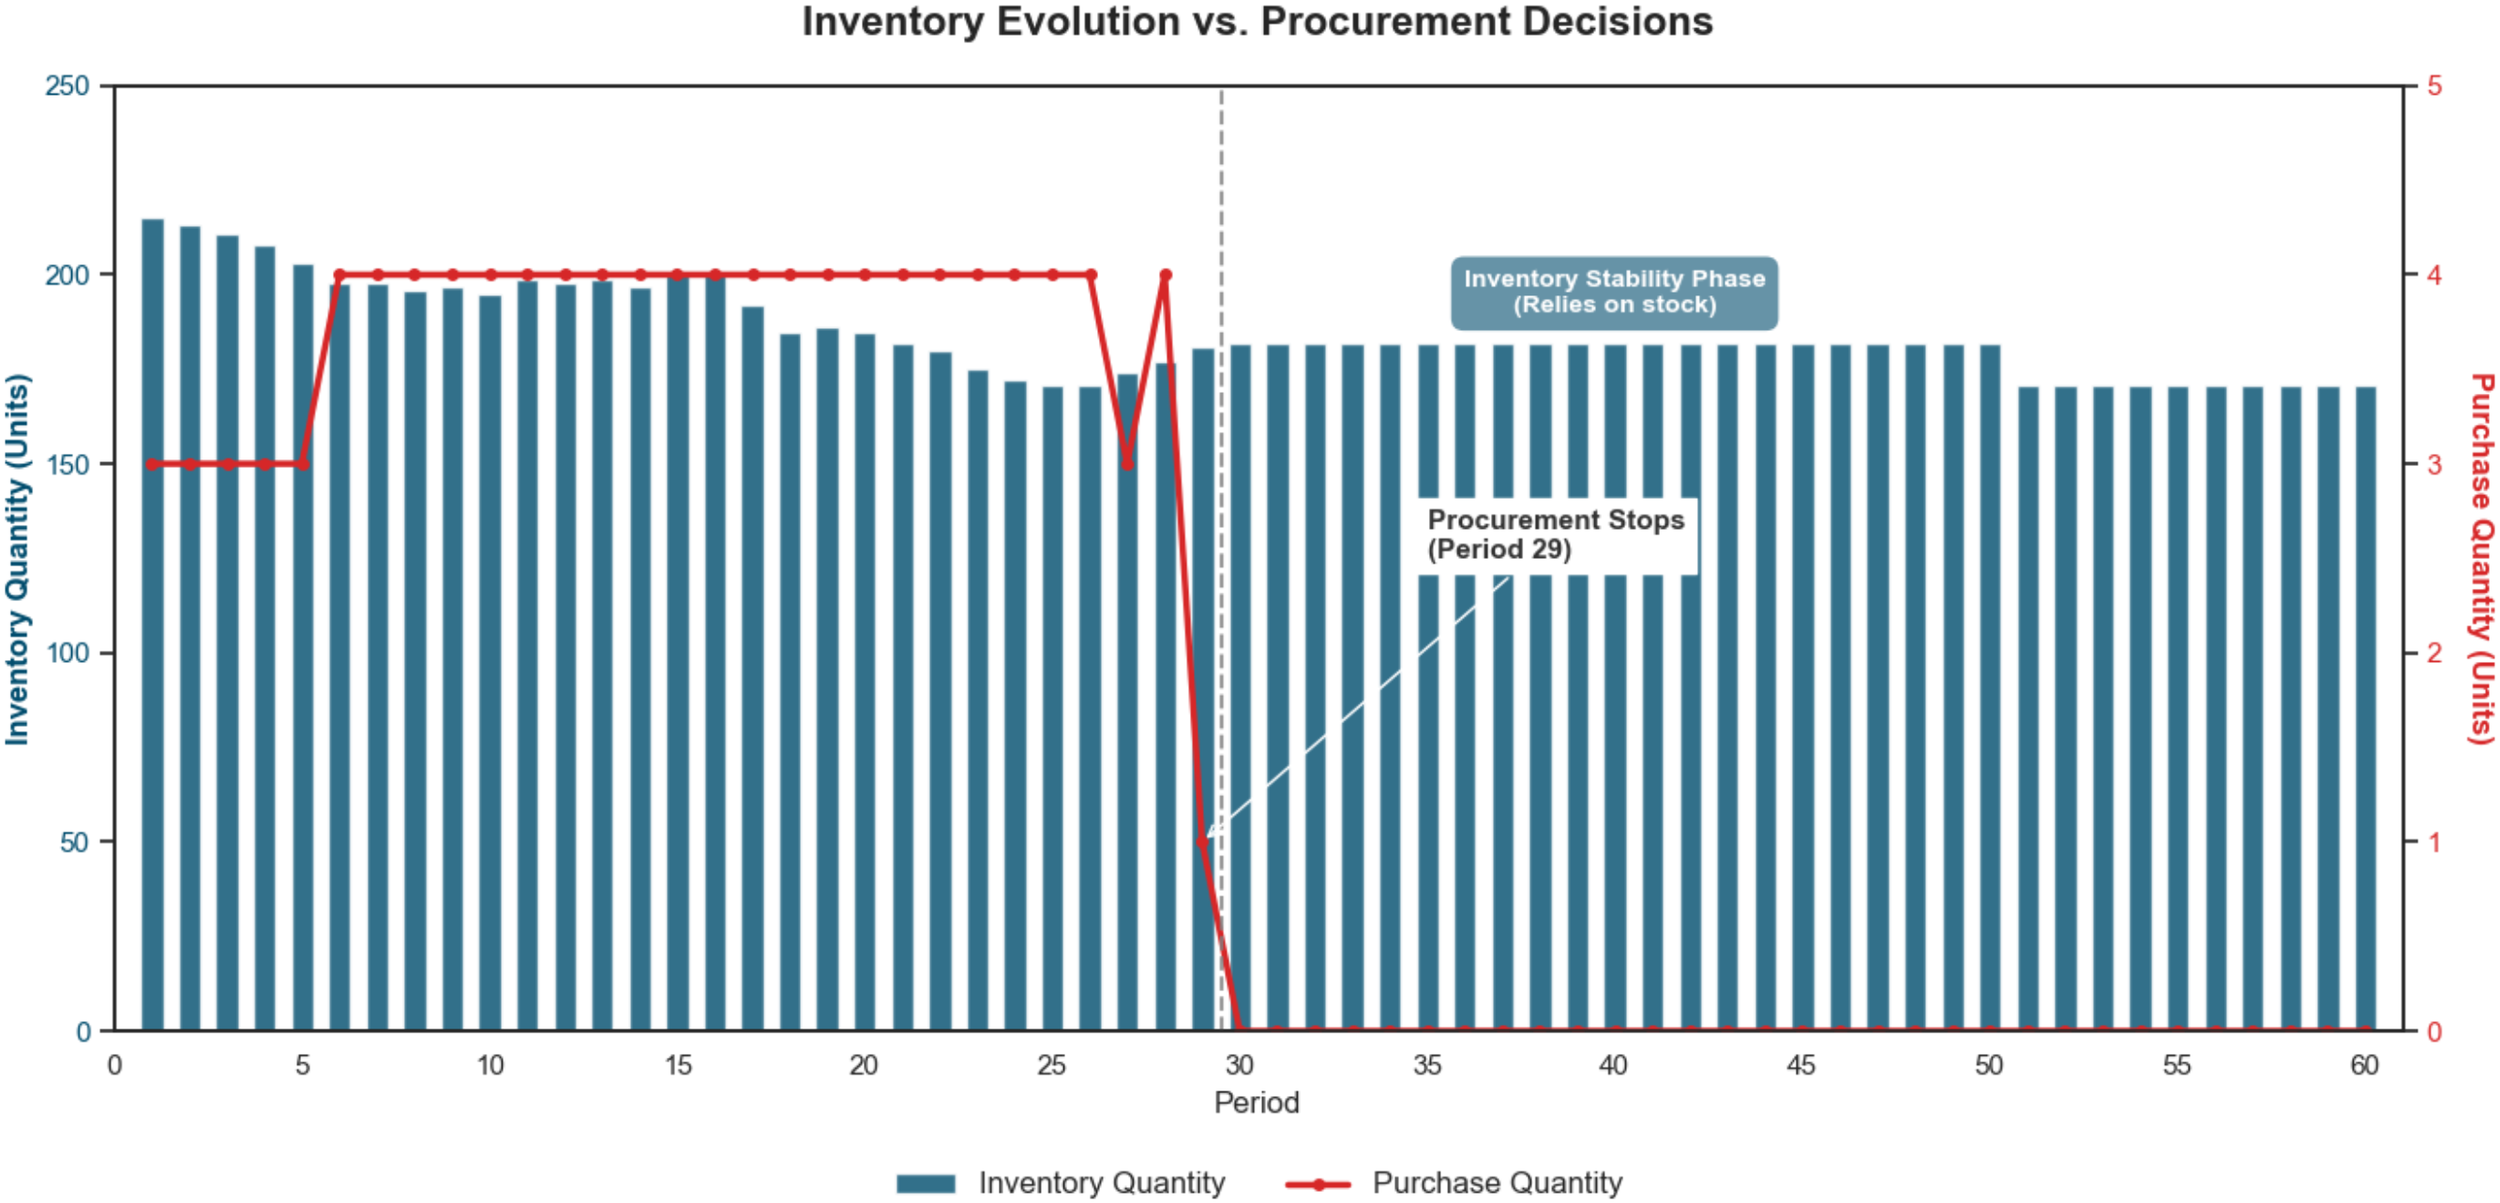
Coupling analysis of inventory evolution and procurement decisions.
6.3.3 Spatiotemporal evolution of battery age
Figure 5 illustrates the structural rejuvenation of the battery. From the perspective of age distribution, the system begins with aging batteries, with 81.4% concentrated in the 30–49 cycles. However, the active procurement strategy significantly rejuvenates the stock: by period 10, a substantial influx of “young” batteries (0–9 cycles) accounts for 51.8% of the inventory. The most balanced distribution is observed at period 20, where young (40.9%), middle-aged (35.5%), and aging (23.7%) batteries coexist, ensuring stable service capability. From a temporal perspective, the evolution exhibits a diagonal “wave-like” propagation. The cessation of procurement after period 29 causes the heatmap intensity to shift diagonally upwards, showing the synchronized aging of the battery.
Figure 5
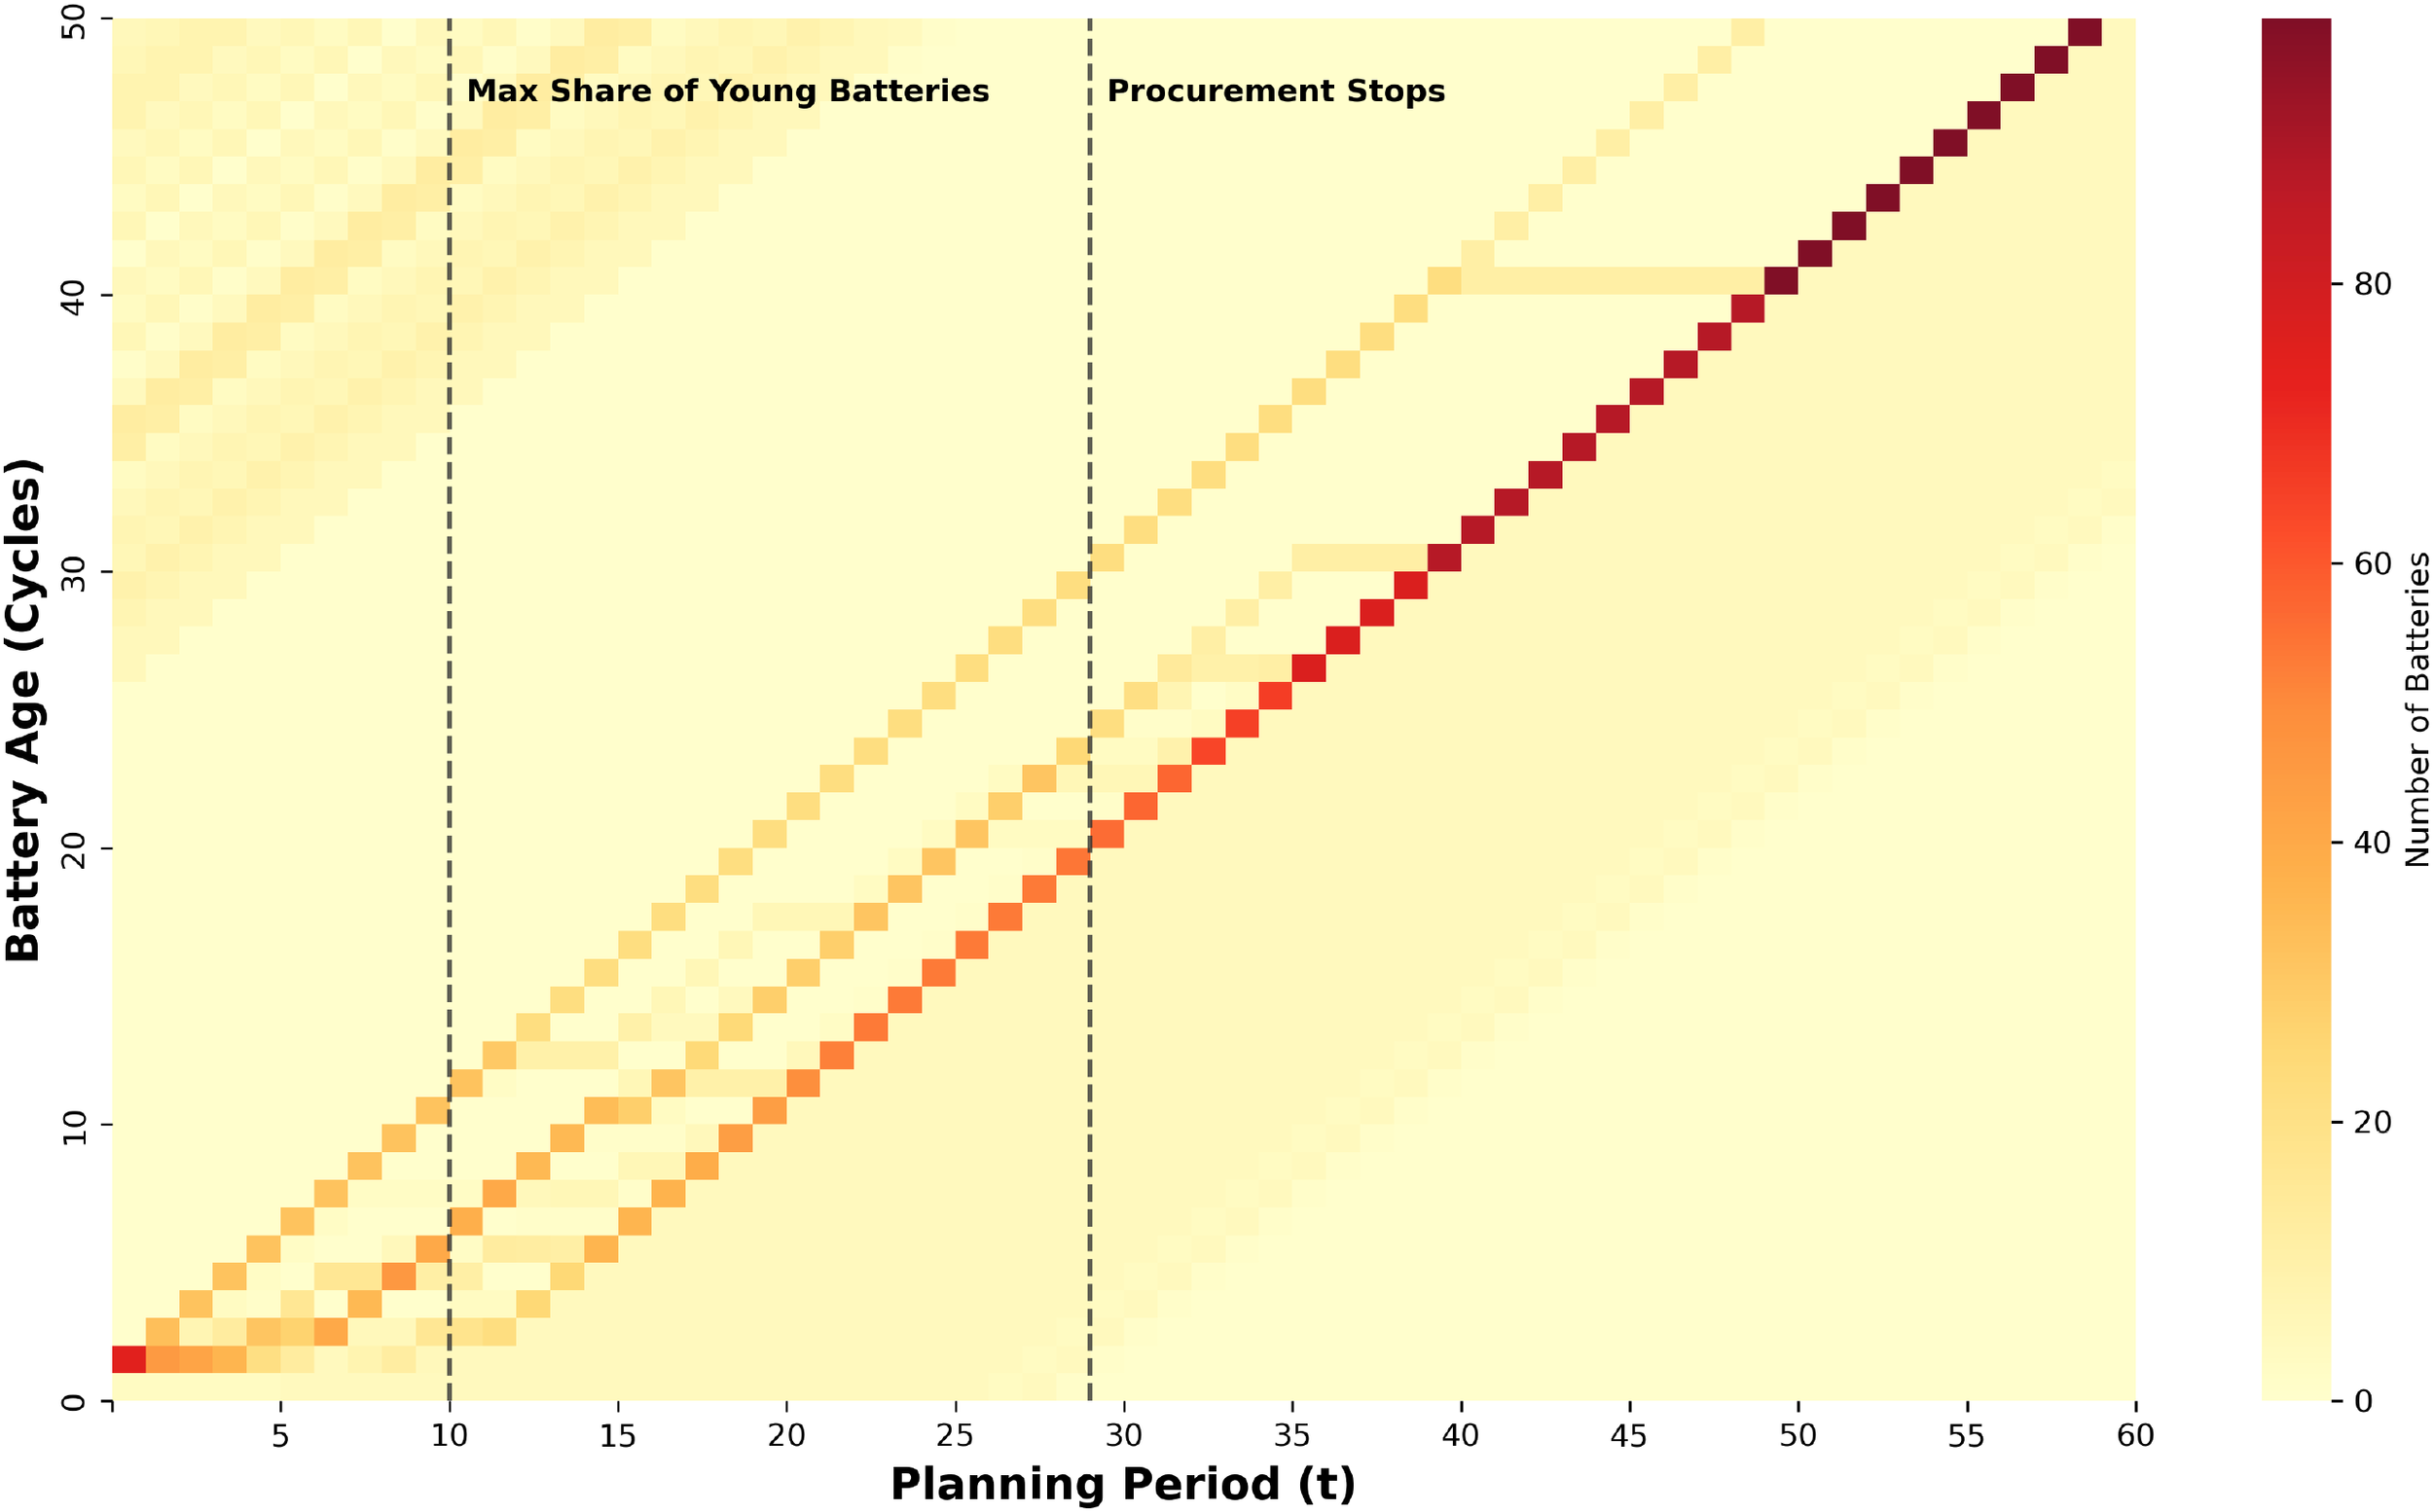
Spatiotemporal evolution of battery age structure.
6.3.4 Budget utilization and cash flow
Figure 6 shows the temporal evolution of cost composition. During the initial phase (periods 1–5), the aggregate cost averages approximately 0.4 million Yuan per period. Subsequently, from period 6 to 28, the procurement strategy intensifies to fully saturate the budget limit, driving the procurement cost to 0.4 million Yuan and the total cost to nearly 0.5 million Yuan. A distinct structural shift occurs after period 29: as procurement stops, the total expenditure precipitates to 0.09 million Yuan, consisting solely of inventory holding expenses.
Figure 6
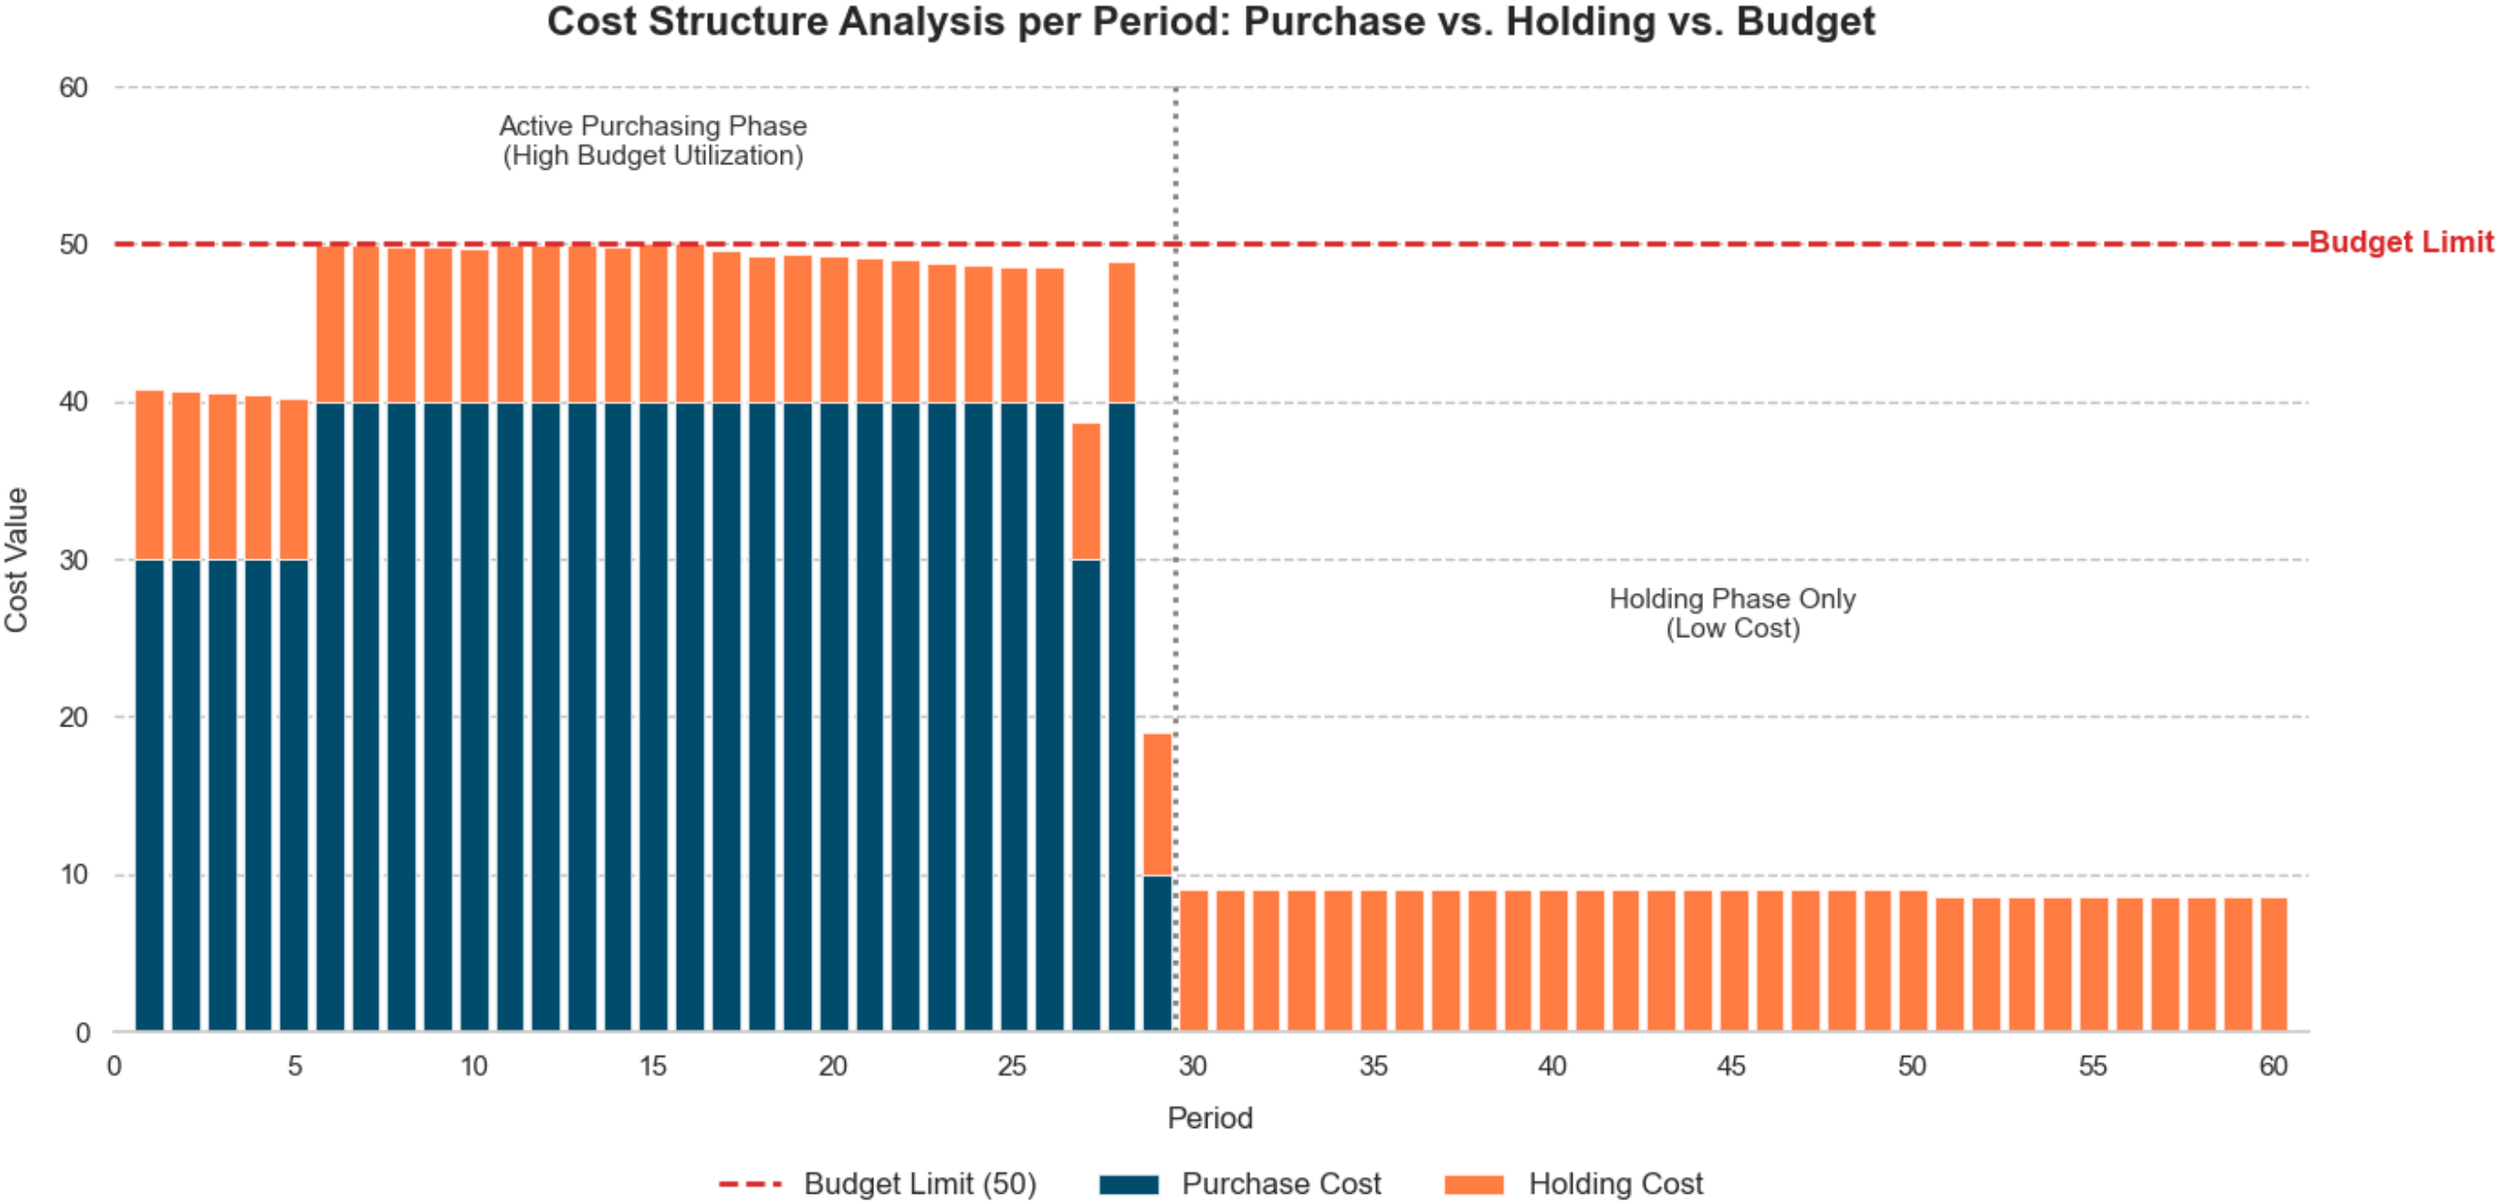
Cost structure analysis and budget utilization per period.
6.4 Case study of long-term planning
This section extends the analysis to a 20-year planning horizon. Unlike the 5-year short-term plan, this case assumes a scenario with zero initial inventory. The objective is to determine the optimal investment roadmap from scratch, using the demand characteristics of the target terminal to validate the model’s long-term strategic performance. The solver reached the optimal solution with a gap of 0.01% in 1461 seconds.
6.4.1 Investment analysis
Table 1 summarizes the key indicators over the planning horizon. The project costs a total NPV of 59.6 million Yuan. Analyzing the cost composition shows that operational period procurement is the main part, accounting for 53.5% of the total expenditure, while the initial setup cost accounts for 28.7%. In terms of inventory management, the system procures a total of 840 batteries. A significant initial stock of batteries is deployed to launch operations. It is worth noting that while operational procurement accounts for the majority of the total quantity, its proportion of the total cost is significantly lower. This disparity is attributable to the discounting effect inherent in the NPV mechanism, where expenditures occurring in the later stages of the 20-year horizon contribute less to the present value compared to upfront investments.
Table 1
| Indicator | Value | Proportion |
|---|---|---|
| Cost structure (NPV, Million Yuan) | ||
| Initial procurement cost | 17.1 | 28.7% |
| Operational procurement cost | 31.9 | 53.5% |
| Holding cost | 10.7 | 18.0% |
| Residual value recovery | -0.1 | 0.2% |
| Total cost | 59.6 | 100% |
| Inventory & procurement metrics (Units) | ||
| Total procurement | 840 | – |
| Initial stock | 171 | – |
| Operational procurement | 669 | – |
| End-of-period inventory | 85 | – |
Quantitative summary of the 20-year long-term plan.
6.4.2 Strategy evolution
Table 2 shows the strategic evolution of procurement decisions. The system exhibits a three-stage trajectory. First, the initial consumption phase (periods 1–25) operates on the initial batteries with zero new procurement. The model strategically delays new purchases to maximize the NPV. Then transitions into a prolonged steady-state operation (periods 26-212), where procurement stabilizes at a rate of 3–4 units per period. Finally, during the depletion phase (periods 213–240), the model halts procurement. This mechanism minimizes the “end-of-horizon effect,” preventing the operator from holding surplus depreciating assets when the planning cycle ends. This multi-stage strategy confirms that the proposed DRO model effectively balances the immediate service needs with long-term asset sustainability under the budget constraint.
Table 2
| Phase & Period | Procurement strategy | Inventory status |
|---|---|---|
| 1. Initial consumption | Zero procurement | Rapid depletion |
| (Periods 1–25) | Relying on initial stock. | Consuming the initial 171 units. |
| 2. Steady-state operation | Micro-replenishment | Stable buffer |
| (Periods 26–212) | Constant 3–4 units/period. | Maintained at 171–250 units. |
| 3. Inventory depletion | Stop procurement | Controlled decay |
| (Periods 213–240) | Ceasing new purchases. | Dropping to 85 units. |
Phased operational strategy over the 20-year horizon.
6.5 Comparison between the expectation method
To evaluate the effectiveness of the CVaR approximation, this paper introduces a comparative method based on the expectation with the Wasserstein distance ambiguity set.
6.5.1 The expectation method
The expectation method constructs an alternative deterministic optimization model that requires the battery supply to meet the worst-case expected demand. The expectation value method uses uses the constraint form shown in Equation 22:
This constraint focuses on the average demand with the Wasserstein distance ambiguity set, rather than a probabilistic guarantee under extreme scenarios. The expectation value method generally provides a more optimistic estimate of demand and can serve as a baseline in numerical experiments to quantify the conservatism and robustness advantage of the CVaR method. The closed-form expression for this formula is calculated in Theorem 2.
Theorem 2. Under the set of scenarios, let the uncertain value under each scenariobe. Under the Wasserstein ambiguity setwith radius, the worst-case expected demand value is:
The proof follows a similar approach to Mohajerin Esfahani and Kuhn (2018).
Unlike traditional stochastic programming frameworks that assume a known, fixed probability distribution (e.g., Sample Average Approximation), this method also depends on the Wasserstein ambiguity set derived from the sample data in Section 6.2.
6.5.2 Comparative results
Table 3 compares the performance of the CVaR method and the expectation value method in the short-term case. The two methods show significant differences in cost and inventory strategy.
Table 3
| Indicator | CVaR method | Expectation method |
|---|---|---|
| Cost structure (Million Yuan, NPV) | ||
| Initial Procurement Cost | 7.5 | 0.3 |
| Operational Period Procurement | 9.7 | 9.3 |
| Holding Cost | 4.6 | 2.9 |
| Residual Value Recovery | 0.3 | 0.2 |
| Total Cost | 21.5 | 12.3 |
| Battery procurement and inventory (Units) | ||
| Initial Procurement (t = 0) | 75 | 3 |
| Operational Procurement | 107 | 101 |
| End-of-Period Inventory | 72 | 61 |
| Total Procurement | 182 | 104 |
Comparison of CVaR method and expectation value method.
This difference in procurement stems from the fundamentally different understanding of demand uncertainty by the two methods. The CVaR method focuses on the tail risk of the demand distribution, ensuring through Equation 20 that demand is met with at least a = 80% probability in the worst case. This constraint is practically aimed at the worst 20% of scenarios in the historical data—such as extreme cases like concentrated ship arrivals or terminal operation peaks—where battery swapping demand might reach 2–3 times the average demand.
In contrast, the expectation value method, according to Equation 23, only requires satisfying the average demand level, assigning equal weight to extreme and ordinary scenarios. This “optimistic” estimation can satisfy demand most of the time, but in the face of the aforementioned extreme scenarios, it may result in insufficient battery inventory, leading to the interruption of battery swapping services. For a container terminal, the interruption of battery swapping service leads to AGV stoppage, consequently affecting the coordinated work between quay cranes and yard stacking, causing a chain reaction of ship congestion and customer complaints, where the economic loss from a single interruption (including ship demurrage fees, customer compensation, and reputational loss) can reach several million Yuan.
Although the investment of the CVaR method is higher (a difference of 7.2 million Yuan, representing an approximately 17% increase in the short-term plan), considering the potential losses from battery swapping service interruptions, this additional investment is essentially a risk insurance. Therefore, the CVaR method is more suitable for container terminal operational scenarios that have strict requirements for service reliability and incur high costs for swapping interruptions.
6.6 Sensitivity analysis
This section analyzes the sensitivity of the investment strategy to key parameters: the Wasserstein radius θ, maximum violation probability , battery lifecycle Klife, and per-period budget Bt. The experimental results are illustrated in Figure 7.
Figure 7
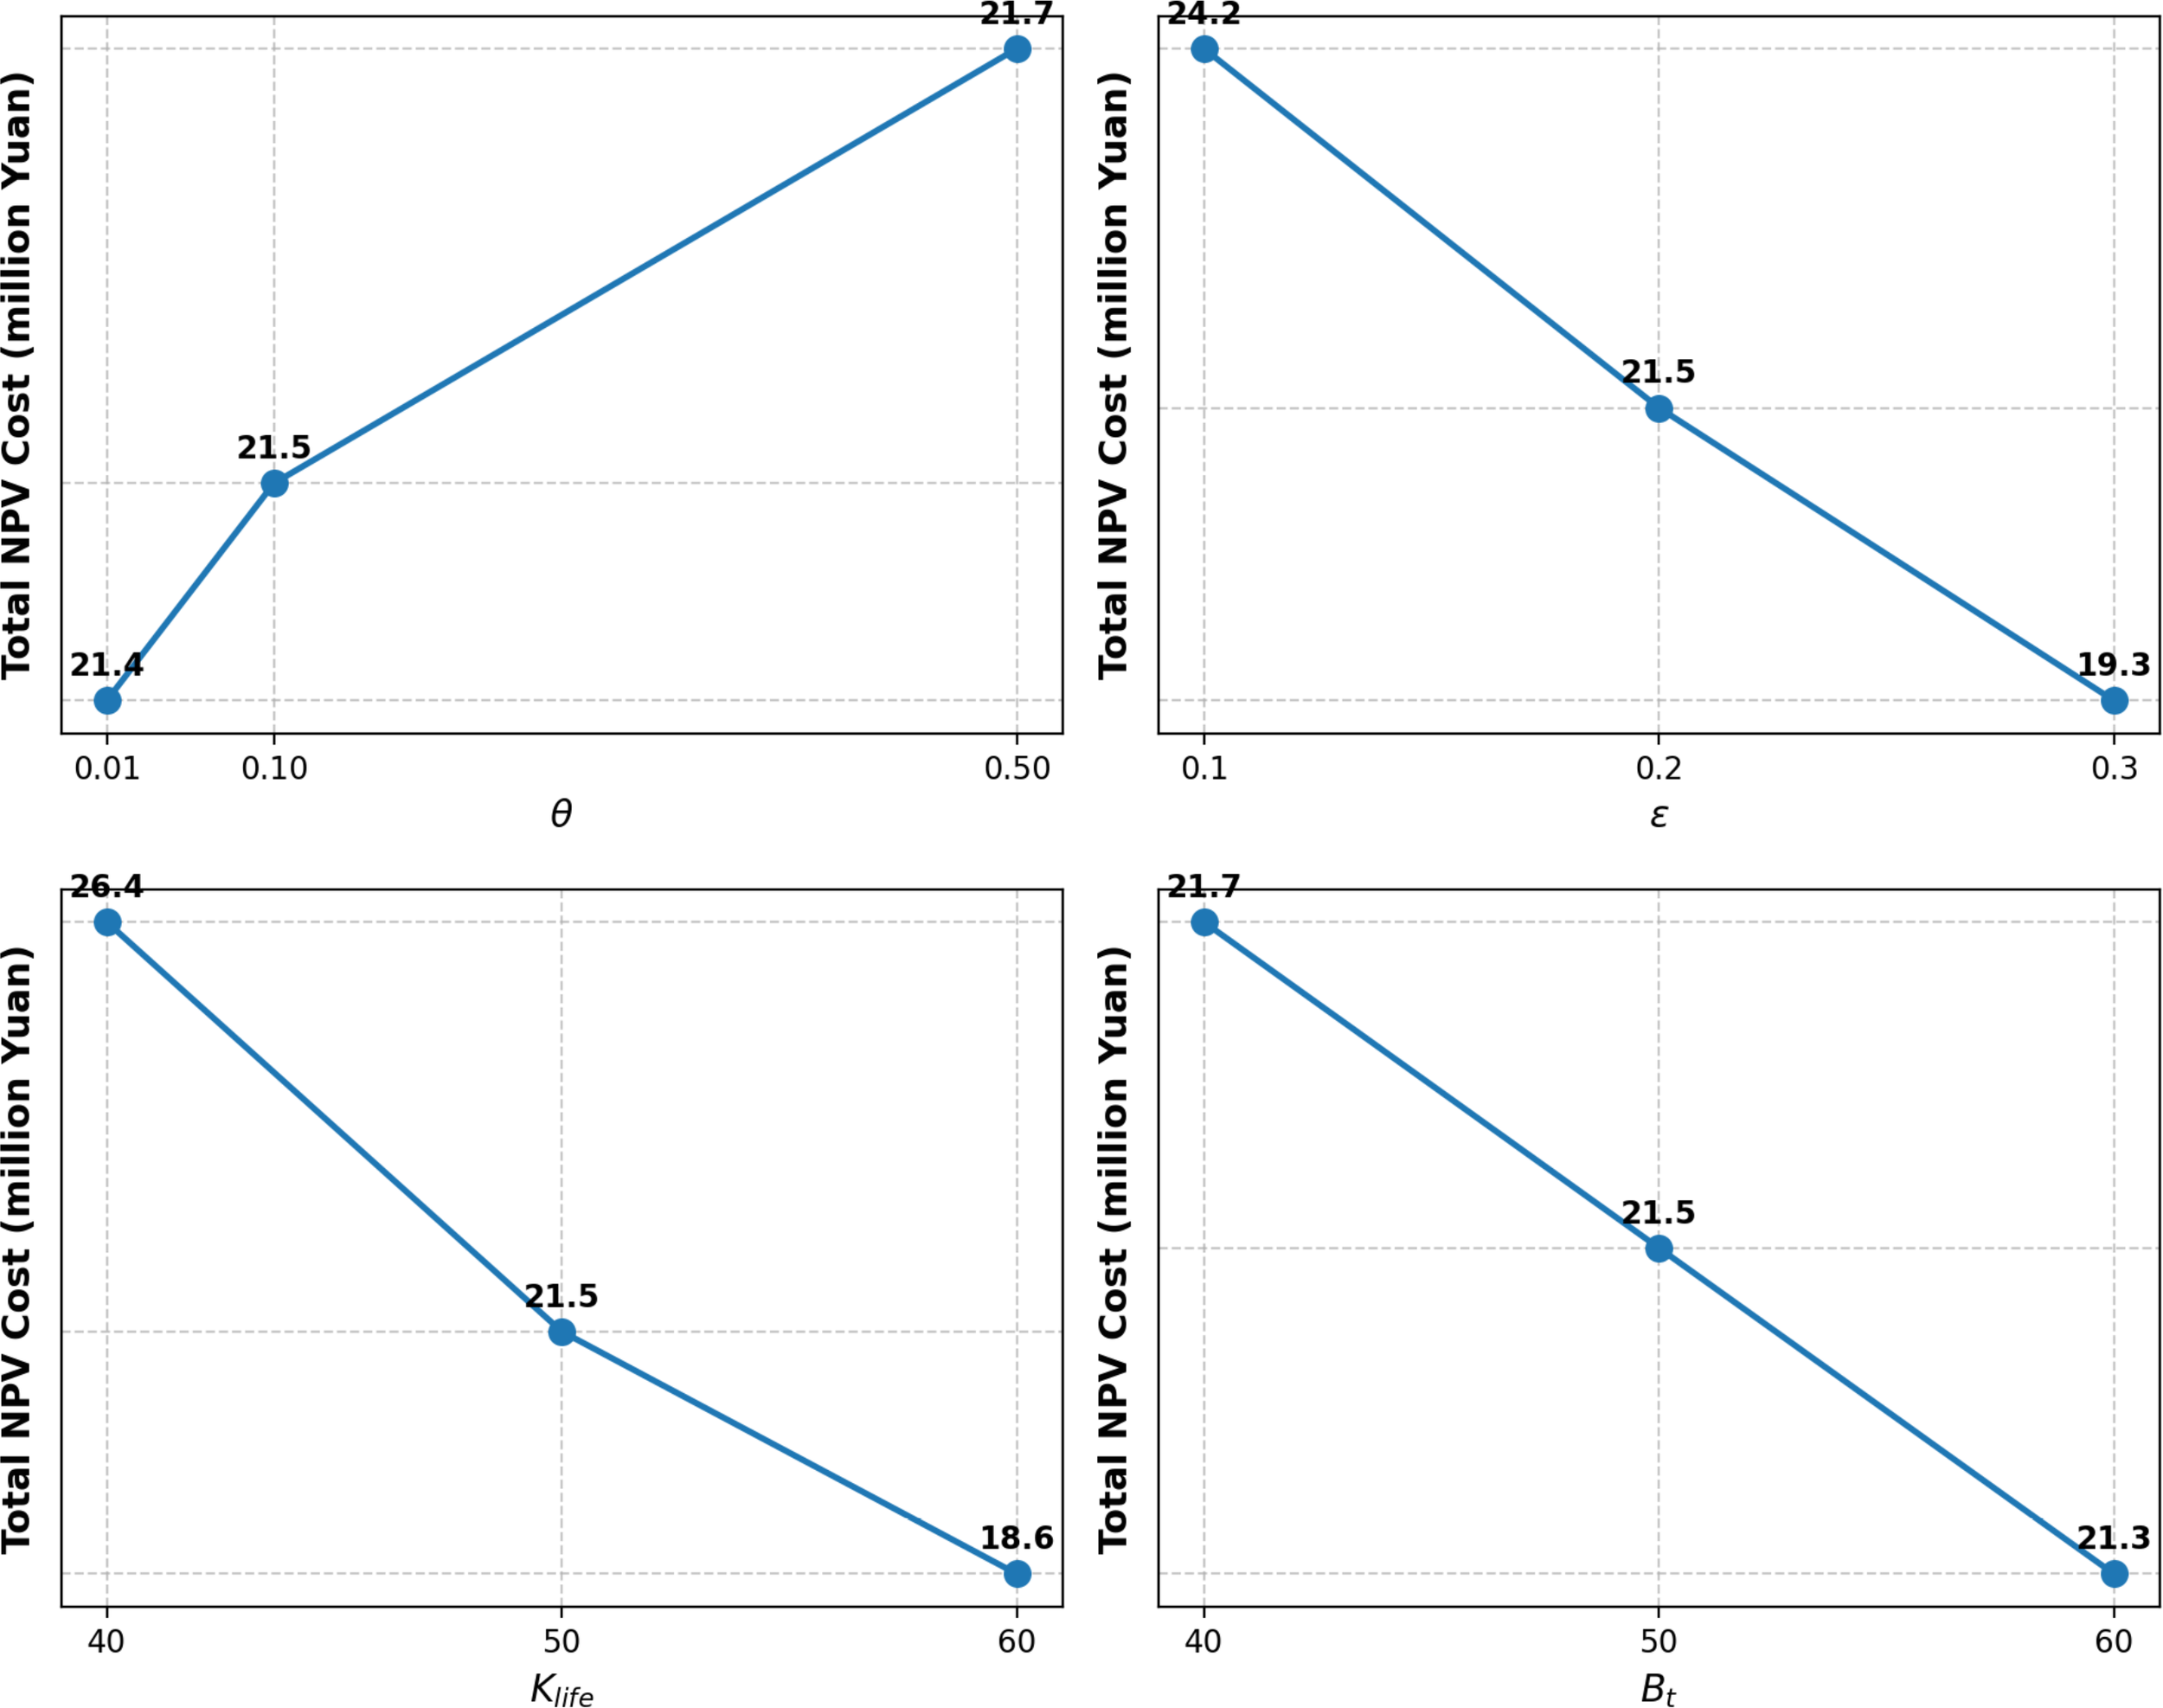
The impact of parameters on NPV and procurement quantity.
The Wasserstein radius θ quantifies the level of distributional ambiguity. We varied θ within the range [0.01,0.5]. As illustrated in the results, the total NPV cost exhibits an increasing trend with θ, rising from 21.4 million Yuan to 21.7 million Yuan. A larger radius implies a higher degree of uncertainty regarding the demand distribution, forcing the robust model to procure more batteries to hedge against worst-case scenarios. Conversely, a smaller θ assumes the empirical data is highly reliable, leading to a lower cost strategy.
The parameter represents the terminal operator’s tolerance for service level violations. We tested values from 0.1 to 0.3. The results indicate an inverse relationship between and total cost. When is low (e.g., 0.1, implying a 90% service level guarantee), the model tends to build a high safety stock, significantly increasing the NPV to 24.2 million Yuan. As relaxes to 0.3, the system tolerates higher tail risks, allowing for a lower inventory and reduced expenditures (19.3 million Yuan).
Considering the battery technology enhancement, as Klife increases from 40 to 60 cycles, the total NPV cost decreases significantly from 26.4 million Yuan to 18.6 million Yuan. Longer life of batteries reduces the frequency of replacement cycles, thereby lowering the total procurement volume over the planning horizon (from 233 to 137 units).
Finally, we analyzed the sensitivity of the solution to the budget constraints. We found that when the budget is tightened to 80% of the baseline, the cost increases to 21.7 million Yuan. This increase is due to the liquidity constraint. Strict per-period budgets prevent the operator from purchasing in bulk when needed. Instead, the model is forced to pre-purchase batteries in earlier periods to accumulate stock gradually, which increases the NPV. As the budget relaxes to 120%, the objective function value decreases to 21.3 million Yuan, as the relaxed constraint allows for optimal, just-in-time procurement.
7 Conclusion and implications
To support the maritime industry’s transition toward green logistics, this paper proposes a robust decision-making framework for the investment and management of battery swapping stations in automated container terminals. Recognizing that high capital costs and demand uncertainty are the primary hurdles to electrification, we constructed an age-based multi-period optimization model. This model manages the lifecycle of battery assets, aiming to minimize the net present value of operational costs while strictly adhering to budget constraints. To mitigate the operational risks brought by terminal operation plans, we have adopted a data-driven distributionally robust optimization (DRO) method, which does not rely on precise distribution assumptions. We minimize operational costs while ensuring a certain level of service reliability.
Numerical experiments based on real-world terminal data validate the effectiveness of the proposed framework. While the CVaR method incurs a higher investment compared to expectation-based methods, this additional cost acts as a necessary “insurance premium.” In the context of decarbonized ports, this investment effectively hedges against tail risks, preventing service interruptions that could lead to severe vessel congestion and carbon emissions. Thus, the proposed approach is particularly suitable for modern terminals where operational resilience is as critical as cost control.
Future research can be extended in the following directions to further enhance the sustainability of port operations. First, incorporating non-linear battery degradation models is a valuable direction. While this study adopts a linear assumption for strategic tractability, future work could explore data-driven or electrochemical degradation curves to optimize operational-level charging and discharging behaviors more precisely. Second, exploring flexible retirement mechanisms is a promising avenue. While this study assumes mandatory retirement at the maximum lifespan due to high procurement costs, future models could consider “early retirement” strategies driven by the potential economic benefits of cascading utilization for partially aged batteries. Third, constructing a dynamic decision model that explicitly accounts for technological advancements and fluctuating battery market prices would provide more adaptive guidance for long-term green investments.
Statements
Data availability statement
The original contributions presented in the study are included in the article/Supplementary Material. Further inquiries can be directed to the corresponding author.
Author contributions
XL: Conceptualization, Data curation, Funding acquisition, Writing – original draft, Writing – review & editing. ML: Formal analysis, Methodology, Validation, Writing – original draft. ZC: Investigation, Validation, Writing – review & editing. QZ: Project administration, Supervision, Writing – review & editing.
Funding
The author(s) declared that financial support was received for this work and/or its publication. This work was supported by the Development Plan of Dalian Northeast Asia International Logistics Center.
Conflict of interest
The authors declared that this work was conducted in the absence of any commercial or financial relationships that could be construed as a potential conflict of interest.
Generative AI statement
The author(s) declared that generative AI was not used in the creation of this manuscript.
Any alternative text (alt text) provided alongside figures in this article has been generated by Frontiers with the support of artificial intelligence and reasonable efforts have been made to ensure accuracy, including review by the authors wherever possible. If you identify any issues, please contact us.
Publisher’s note
All claims expressed in this article are solely those of the authors and do not necessarily represent those of their affiliated organizations, or those of the publisher, the editors and the reviewers. Any product that may be evaluated in this article, or claim that may be made by its manufacturer, is not guaranteed or endorsed by the publisher.
Supplementary material
The Supplementary Material for this article can be found online at: https://www.frontiersin.org/articles/10.3389/fmars.2025.1754484/full#supplementary-material
References
1
Agra A. Rodrigues F. (2022). Distributionally robust optimization for the berth allocation problem under uncertainty. Transportation Res. Part B: Methodological164, 1–24. doi: 10.1016/j.trb.2022.07.009
2
Cao Y. Yang A. Liu Y. Zeng Q. Chen Q. (2023). AGV dispatching and bidirectional conflict-free routing problem in automated container terminal. Comput. Ind. Eng.184, 109611. doi: 10.1016/j.cie.2023.109611
3
Che A. Wang Z. Zhou C. (2024). Multi-agent deep reinforcement learning for recharging considered vehicle scheduling problem in container terminals. IEEE Trans. Intelligent Transportation Syst.25, 16855–16868. doi: 10.1109/TITS.2024.3412932
4
Chen K. Guo J. Xin X. Zhang T. Zhang W. (2023). Port sustainability through integration: A port capacity and profit-sharing joint optimization approach. Ocean Coast. Manage.245, 106867. doi: 10.1016/j.ocecoaman.2023.106867
5
Ding Y. Yang Y. Heilig L. Lalla-Ruiz E. Voss S. (2021). Deployment and retrofit strategy for rubber-tyred gantry cranes considering carbon emissions. Comput. Ind. Eng.161, 107645. doi: 10.1016/j.cie.2021.107645
6
Ghosal S. Wiesemann W. (2020). The distributionally robust chance-constrained vehicle routing problem. Operations Res.68, 716–732. doi: 10.1287/opre.2019.1924
7
Goldstein M. A. Lynch A. H. Li X. Norchi C. H. (2022). Sanctions or sea ice: Costs of closing the northern sea route. Finance Res. Lett.50, 103257. doi: 10.1016/j.frl.2022.103257
8
Guan L. Zhou C. Che A. (2025). A Q-learning-based neighborhood search for seaside vehicle dispatching and resource scheduling at automated container terminals. IEEE Trans. Intelligent Transportation Syst.26, 16785–16799. doi: 10.1109/TITS.2025.3572945
9
Miao H. Feng X. Li X. (2025). Economic viability of arctic shipping under imo environmental regulations: a well-to-wake assessment of different carbon tax scenarios. Front. Mar. Sci.12. doi: 10.3389/fmars.2025.1575551
10
Mohajerin Esfahani P. Kuhn D. (2018). Data-driven distributionally robust optimization using the Wasserstein metric: Performance guarantees and tractable reformulations. Math. Programming171, 115–166. doi: 10.1007/s10107-017-1172-1
11
Peng Y. Wang W. Song X. Zhang Q. (2016). Optimal allocation of resources for yard crane network management to minimize carbon dioxide emissions. J. Cleaner Production131, 649–658. doi: 10.1016/j.jclepro.2016.04.120
12
Rockafellar R. T. Uryasev S. (2000). Optimization of conditional value-at-risk. J. Risk2, 21–41. doi: 10.21314/JOR.2000.038
13
Rodrigues F. Agra A. (2024). Handling uncertainty in the quay crane scheduling problem: A unified distributionally robust decision model. Int. Trans. Operational Res.31, 721–748. doi: 10.1111/itor.13325
14
Tadros M. Ventura M. Soares C. G. (2023). Review of current regulations, available technologies, and future trends in the green shipping industry. Ocean Eng.280, 114670. doi: 10.1016/j.oceaneng.2023.114670
15
Tan Z. Zhang Q. Yuan Y. Jin Y. (2022). A decision method on yard cranes transformation and deployment in green ports. Int. Trans. Operational Res.29, 323–346. doi: 10.1111/itor.13027
16
Xin X. Wang X. Zhang T. Chen H. Guo Q. Zhou S. et al . (2023). Liner alliance shipping network design model with shippers’ choice inertia and empty container relocation. Electronic Research Archive. 31, 5509–5540. doi: 10.3934/era.2023280
17
Xu Q. Huang X. Zhang W. Zhao H. Zhang H. Jin Z. (2025). Eurasian container intermodal transportation network: a robust optimization with uncertainty and carbon emission constraints. Front. Mar. Sci.12. doi: 10.3389/fmars.2025.1576006
18
Xu Q. Zhong Y. Deng H. Wang X. Chen X. (2024). Scheduling on tractor and trailer transportation considering the influence of disrupted events based on the contract net and simulated annealing algorithm. Digital Transportation Saf.3, 155–168. doi: 10.48130/dts-0024-0014
19
Zhang G. Zhang Z. Yuan H. Chen W. (2025a). Emission-reduction investment strategies in competitive shipping supply chains under carbon cap-and-trade mechanisms. Front. Mar. Sci.12. doi: 10.3389/fmars.2025.1546146
20
Zhang L. Wang S. Qu X. (2021a). Optimal electric bus fleet scheduling considering battery degradation and non-linear charging profile. Transportation Res. Part E: Logistics Transportation Rev.154, 102445. doi: 10.1016/j.tre.2021.102445
21
Zhang Q. Wang S. Zhen L. (2024a). Yard truck retrofitting and deployment for hazardous material transportation in green ports. Ann. Operations Res.343, 981–1012. doi: 10.1007/s10479-021-04507-0
22
Zhang Y. Baldacci R. Sim M. Tang J. (2018). Routing optimization with time windows under uncertainty. Math. Programming175, 263–305. doi: 10.1007/s10107-018-1243-y
23
Zhang Y. Guo Y. Huang Y. Ge S. (2025b). A low-carbon scheduling method based on improved ant colony algorithm for underground electric transportation vehicles. Complex & Intelligent Systems. 11, 166. doi: 10.1007/s40747-024-01775-8
24
Zhang X. Li H. Sheu J.-B. (2024b). Integrated scheduling optimization of AGV and double yard cranes in automated container terminals. Transportation Res. Part B: Methodological179, 102871. doi: 10.1016/j.trb.2023.102871
25
Zhang Y. Zhang Z. Z. Lim A. Sim M. (2021b). Robust data-driven vehicle routing with time windows. Operations Res.69, 469–485. doi: 10.1287/opre.2020.2043
26
Zhao R. Liang C. (2025). Optimizing AGV utilization and battery life in automated container terminals: Focus on a novel charging strategy and reinforcement learning algorithm. Journal of Cleaner Production. 519, 145939. doi: 10.1016/j.jclepro.2025.145939
27
Zhen L. Zhang Q. Tan Z. Wang S. (2025). Scheduling AGVs in ports with battery charging and swapping. IISE Trans.57, 1245–1262. doi: 10.1080/24725854.2025.2468722
28
Zhou C. Stephen A. Tan K. C. Chew E. P. Lee L. H. (2024). Multiagent Q-learning approach for the recharging scheduling of electric automated guided vehicles in container terminals. Transportation Sci.58, 664–683. doi: 10.1287/trsc.2022.0113
Summary
Keywords
AGV battery swapping station, automated container terminal, battery investment strategy, conditional value-at-risk, distributionally robust optimization
Citation
Li X, Li M, Chen Z and Zeng Q (2026) Distributionally robust battery investment and replacement for AGV battery swapping stations with demand uncertainty in automated container terminals. Front. Mar. Sci. 12:1754484. doi: 10.3389/fmars.2025.1754484
Received
26 November 2025
Revised
20 December 2025
Accepted
23 December 2025
Published
21 January 2026
Volume
12 - 2025
Edited by
Zhongzhen Yang, Ningbo University, China
Reviewed by
Shanhua Wu, Ningbo University, China
Ping He, Shanghai Jiao Tong University, China
Updates
Copyright
© 2026 Li, Li, Chen and Zeng.
This is an open-access article distributed under the terms of the Creative Commons Attribution License (CC BY). The use, distribution or reproduction in other forums is permitted, provided the original author(s) and the copyright owner(s) are credited and that the original publication in this journal is cited, in accordance with accepted academic practice. No use, distribution or reproduction is permitted which does not comply with these terms.
*Correspondence: Mingze Li, limz@dlmu.edu.cn
Disclaimer
All claims expressed in this article are solely those of the authors and do not necessarily represent those of their affiliated organizations, or those of the publisher, the editors and the reviewers. Any product that may be evaluated in this article or claim that may be made by its manufacturer is not guaranteed or endorsed by the publisher.