Abstract
Introduction:
Major Baltic Inflows (MBIs) episodically ventilate deep Baltic basins, but detailed observations of mixing during their propagation remain scarce. The 2023/24 inflow introduced saline, oxygen-rich North Sea water into the Southern Baltic.
Methods:
We combined autonomous ocean glider observations with ship-based CTD data across the Bornholm Basin (BB), Slupsk Furrow (SF), and Gdansk Basin (GB). Water-mass analysis was performed using T–S diagrams, while turbulence was estimated using Thorpe-scale methods.
Results:
The inflow propagated as a bottom-intensified gravity current and under-halocline layers. Deep-water oxygen concentrations increased markedly (>6 mg L−¹ in BB), while salinity rise remained modest (~0.5 PSU), indicating strong dilution. Elevated dissipation rates (ϵ > 10−7 W kg−¹) below the halocline and in the bottom boundary layer reveal active shear-driven mixing and internal wave processes. Oxygen inventory analysis shows an initial dominance of advective supply, followed by vertical mixing as the main oxygenation mechanism.
Discussion:
The 2023/24 inflow caused temporary basin-wide deep-water oxygenation, but persistence depends on post-inflow stratification and biogeochemical demand.
Highlights
-
The 2023/24 inflow introduced about 198 km³ of saline, oxygen-rich water into the Baltic Sea, including ~75 km³ of highly saline North Sea water that continued along the pathway towards the Bornholm Basin sampled in this study. In the Bornholm Basin, its salinity signal was modest, but its oxygen signal was strong and basin wide.
-
Glider observations showed deepening and subsequent shoaling of the halocline in the Bornholm Basin, with large increases in dissolved oxygen concentration and temperature, and only a limited salinity rise (~0.5 PSU), suggesting upstream dilution of the salinity signal.
-
T–S diagrams and turbulence data indicate that the inflow propagated both as a bottom-intensified gravity current and as under-halocline layers that progressively mixed with resident waters.
-
Elevated dissipation rates (ϵ > 10−7 W kg−¹) in the bottom boundary layer and below the halocline, confirm shear-induced turbulence and internal wave mixing contributing to stratification erosion and oxygen penetration below the halocline.
-
Deep-water oxygenation removed basin-wide anoxia, though its persistence will depend on post-inflow stratification and benthic oxygen demand.
1 Introduction
The Baltic Sea, a semi-enclosed, brackish basin, is highly sensitive to hydrological, meteorological, and anthropogenic forcing. Among the dominant physical drivers, Major Baltic Inflows (MBIs) play a particularly important role due to their sporadic yet substantial impact on the sea’s stratification and deep-water renewal. These inflows introduce large volumes of saline and oxygen-rich North Sea water, significantly altering the distributions of temperature, salinity and oxygen across the Baltic’s basins and depth layers (Mohrholz et al., 2015; Mohrholz, 2018).
Over recent decades, the frequency and intensity of MBIs have varied considerably. Earlier studies suggested a clear decline after the 1980s, with inter-inflow intervals often exceeding a decade (Dahlin et al., 1993; Jakobsen, 1995; Liljebladh and Stigebrandt, 1996; Matthäus and Lass, 1995). However, more recent analyses based on extended datasets did not confirm a statistically significant long-term decline, but rather highlighted pronounced interdecadal variability (Mohrholz, 2018). This variability culminated in the exceptional 2014/15 MBI, when the Institute of Oceanology of the Polish Academy of Sciences reported unprecedented salinity values (up to 20 PSU) in the deep waters of the southern Baltic (Rak, 2016), marking the end of an 11-year hiatus since the last major inflow in 2003 (Piechura and Beszczynska-Moeller, 2004).
MBIs are critical for the ecological functioning of the Baltic Sea, as they ventilate deep basins and replenish oxygen-depleted bottom waters, thereby restoring conditions suitable for benthic life (Schmidt et al., 2021). Deep-water oxygenation resulting from MBIs directly influences benthic habitats, biogeochemical cycling, and long-term ecosystem recovery in areas otherwise prone to hypoxia or anoxia. Moreover, understanding the dynamics of MBIs is particularly relevant in the context of climate change, which may alter wind regimes, stratification, and the frequency or character of inflow events in the future.
Two main types of inflows are recognized in the Baltic Sea: barotropic and baroclinic. Barotropic inflows are primarily driven by wind- and air-pressure-induced sea-level differences between the North Sea/Kattegat and the Baltic and occur predominantly during autumn and winter. Most barotropic events are moderate and do not meet the usual thresholds for Major Baltic Inflows (MBIs). Only the strongest barotropic inflows fulfil the criteria of MBIs, typically associated with a sequence of persistent easterlies (preconditioning) followed by sustained westerlies and resulting in large net imports of saline, oxygen-rich waters. For such MBI events, the imported volume and salt load are on the order of ~200 km³ and ~2 Gt, respectively (Matthäus and Franck, 1992). In contrast, baroclinic inflows are density-driven, occur mainly during calm summer conditions, and are often manifested as relatively small thermohaline (isopycnal) intrusions within or near the halocline, accompanied by a compensating surface outflow from the Baltic towards the North Sea.
Strong MBIs propagate into the Baltic Sea as dense gravity currents that are bottom-trapped, advancing along the seabed and through topographic depressions. These dense overflows displace resident water masses and generate shear at density interfaces, which can trigger mixing through internal wave generation and turbulent dissipation (Umlauf et al., 2007, 2010). Mixing and internal wave processes at Baltic halocline interfaces have been widely documented (Arneborg et al., 2007; Burchard et al., 2009; Lass and Mohrholz, 2003; Scotti, 2015). In contrast, smaller baroclinic intrusions propagate along isopycnal surfaces within the halocline or intermediate layers. Both processes contribute to the transformation of inflowing waters, but their pathways and mixing efficiencies differ markedly, particularly in basins with steep bathymetric gradients such as the Bornholm Basin and the Slupsk Furrow.
In late December 2023, the Baltic Sea experienced a saltwater inflow event associated with winter storm “Zoltan” (Purkiani et al., 2024). Initial observations at the Danish straits characterized this event as a moderate Baltic inflow in terms of volume and salt transport. According to Purkiani et al. (2024), the inflow increased the total Baltic Sea volume by about 198 km³, of which approximately 75 km³ were highly saline North Sea waters entering the western Baltic Sea. This saline core carried an estimated 1.75 Gt of salt (over 20% of the typical annual salt import) and about 0.8 × 10⁶ tons of oxygen. In this study we focus on the fraction (~75 km³) that effectively propagated towards the Bornholm Basin and downstream basins. This event provided a unique opportunity to study its propagation and influence on deep-water properties along the key advection pathway from the Bornholm Basin (BB), through the Slupsk Furrow (SF), to the Gdansk Basin (GB).
While the role of the inflows in deep-water renewal has been widely acknowledged, detailed, high-resolution observations of turbulence and mixing during inflow propagation remain scarce, especially using autonomous observational platforms. In particular, the structure and efficiency of shear-driven mixing, and the degree to which inflowing waters are transformed during their transit, are poorly constrained. The increasing availability of gliders and turbulence-resolving methods now enables the detection of these processes at the necessary temporal and spatial resolution.
This study presents one of the first observationally constrained characterizations of turbulent mixing during the Baltic inflow, expanding upon earlier works that addressed turbulence and mixing processes in the Baltic Sea (Kuzmina et al., 2005; Umlauf et al., 2007; Holtermann et al., 2017). Based on glider-derived hydrography and turbulence estimates from the Thorpe scale method, this study provides valuable insight into boundary-layer mixing and water mass transformation during inflow progression. Although indirect, these estimates highlight the importance of vertical mixing for deep-water ventilation, while the limitations of this approach underline the need for future campaigns using direct microstructure sensors, such as glider-mounted shear probes.
This study aims to not only document the hydrographic changes associated with the 2023/24 inflow, but also to elucidate the underlying mixing dynamics and transformation of water masses as the inflow propagated through the deep basins of the Southern Baltic. By integrating glider-based turbulence estimates with ship-based CTD observations, we investigate the evolution of stratification, ventilation, and water mass structure in three key regions: BB, SF and GB.
2 Data
2.1 Study area
To facilitate a thorough examination, the study focuses on three distinct areas within the Southern Baltic Sea, based on a 70 m isobath along with specific longitudinal ranges for each basin (Figure 1). BB was analyzed within the geographical longitude range of 14.7 to 16.3° E. The longitude range for SF was determined to be between 16.5 and 17.7° E, while the analysis of GB was limited to the longitude range of 18.6 to 19.4° E. The glider transect is located slightly north of the main pathway of the dense MBI gravity current, which is expected to follow the southern rim of the Bornholm Basin toward the Slupsk Furrow.
Figure 1
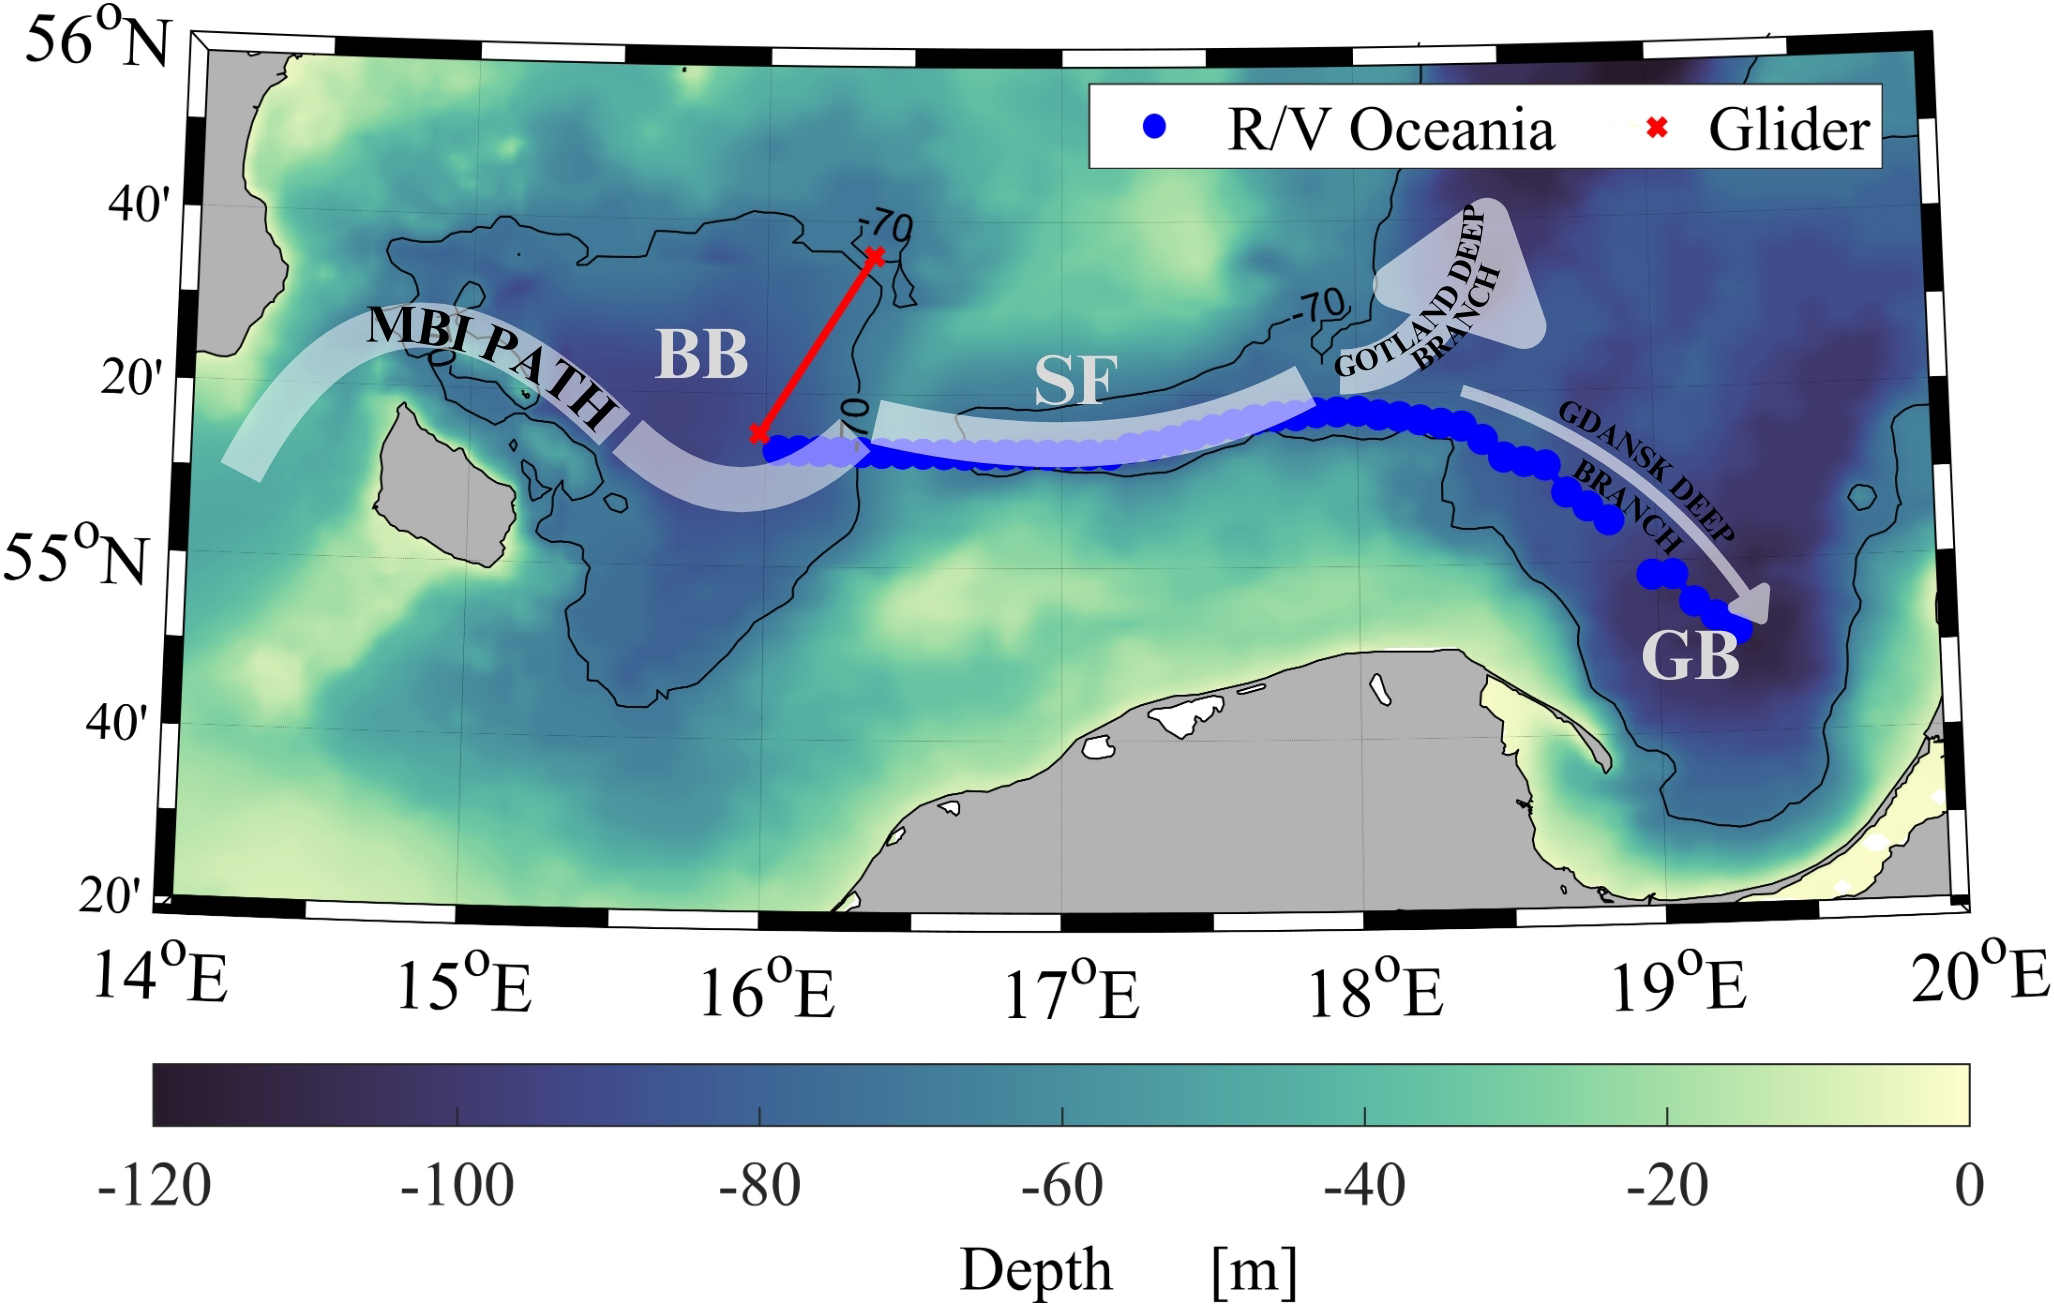
Study area with glider track (red) and R/V Oceania track (blue). Bathymetry from ETOPO-1 with the 70 m isobath (thin black line). Basin limits (Bornholm Basin—BB, Slupsk Furrow—SF, Gdansk Basin—GB) are indicated along the transect. The basins were defined using the 70 m isobath in combination with longitudinal boundaries: BB (14.7–16.3°E), SF (16.5–17.7°E), and GB (18.6–19.4°E). White arrows mark the direction of the Major Baltic Inflow (MBI) propagation.
2.2 Field data
2.2.1 R/V Oceania cruises
The extensive monitoring cruises carried out by the Institute of Oceanology of the Polish Academy of Sciences (IOPAN) from 1998 to 2023, detailed in Rak et al. (2024), serve as a foundational reference for average water properties in our study. These efforts employed a towed probe technique with a high horizontal resolution of approximately 200–500 meters to chart detailed transects across the Southern Baltic’s deepest basins from BB through SF to GB. Annually, about four cruises were managed along this route.
This article focuses particularly on the two most recent cruises conducted in December 2023 and February 2024. During these voyages, data was collected using the Idronaut Ocean Seven 316 Plus CTD at a 20 Hz frequency, ensuring high-resolution measurements. This device played a crucial role in obtaining precise and accurate data on conductivity, temperature, and depth (pressure). Although the data collection frequency was modified from every 0.2 nautical miles to every 5 nautical miles along the same transect, the gathered data still enhances the long-term data trends that have been established through decades of research. Importantly, the CTD datasets from these two cruises are publicly available through the IOPAN repository (IO PAN, 2025).
2.2.2 Gliders
We use data collected by the SeaExplorer ocean underwater gliders deployed in the eastern BB by the Voice of the Ocean Foundation collecting CTD between 55.260N 15.980E and 55.60N 16.360E. The gliders were equipped with CTD RBR Legato sensors and RINKO JFE Advantech AROD_FT optical oxygen sensors. All information regarding the gliders, their specifications, deployments and calibration dates can be found on https://observations.voiceoftheocean.org/. We use the data collected by the following four missions: SEA_063_M69 (15.12.2023-09.01.2024), SEA_067_M53(09.01.2024-30.01.2024), SEA_068_M30 (30.01.2024-20.02.2024), SEA_63_M71 (20.02.2024-13.03.2024) (VOTO, 2025). The sampling frequency for the CTD sensor was 2Hz for the 2nd and 3rd mission and 16Hz for SEA_063 (the 1st and last mission).
Four gliders measured CTD and oxygen profiles between 15th December 2023 and 13th March 2024 in a repeated transect mode operating from the deep central BB in the north-eastern direction towards shallower Swedish waters of the BB (Figure 1). The average vertical resolution of these observations was about 6 cm in vertical and about 1 km in horizontal between the consecutive dives up to about 85 m depth in the central basin, therefore the spatial resolution between the ascending and descending profiles was about 500 m. The measurements were initially screened for bad data and post-processed by VOTO using IOOS QARTOD and pyglider python toolbox.
3 Methods
3.1 CTD processing
One of the initial steps undertaken was quality control, a crucial process for identifying and removing any errors or anomalies in the data, ensuring the analyzed data’s integrity. In this research, outliers were specifically recognized as values that fell outside the expected ranges for salinity and temperature. For salinity, these ranges were determined to be below 5 or above 22 in the BB, below 5 or above 20 in the SF, and below 5 or above 18 in the Gdansk Deep. For temperature, extreme values across all areas were below 0°C or above 21°C.
Following the quality control, cubic spline data interpolation was employed to achieve a uniform vertical distribution of data points, as suggested by de Boor (1978).
3.2 Glider processing and water masses identification
The glider data were averaged in the vertical every 20 cm to improve signal-to-noise ratio and prepare for time–depth visualization. Data flagged as erroneous were removed using QARTOD-compliant quality control procedures. Temporal changes between successive glider sections were assessed, and temperature–salinity (T–S) diagrams were constructed to evaluate the evolution and mixing of water masses in the BB over the period from 15 December 2023 to 13 March 2024. Water masses (WMs) were identified in temperature–salinity (T–S) space using hydrographic glider data collected between December 2023 and March 2024. Salinity, temperature, potential density, and dissolved oxygen were divided into three temporal periods: pre-inflow (up to 9 January 2024), inflow (10 January–10 February 2024), and inflow continuation (from 11 February 2024 onwards). These intervals correspond to the observed onset and evolution of the saline inflow event.
For the pre-inflow period, characteristic water masses were determined from clusters in T–S space. Four WMs were defined, representing surface, intermediate, and bottom layers. Their centroids were estimated as mean values of salinity and temperature within limited T–S windows. When insufficient data were available, the nearest valid observation was used to locate the centroid. All possible pairwise combinations among the four centroids were connected to form reference mixing lines, which delineate the pre-inflow mixing envelope shown in Figure 2A.
Figure 2
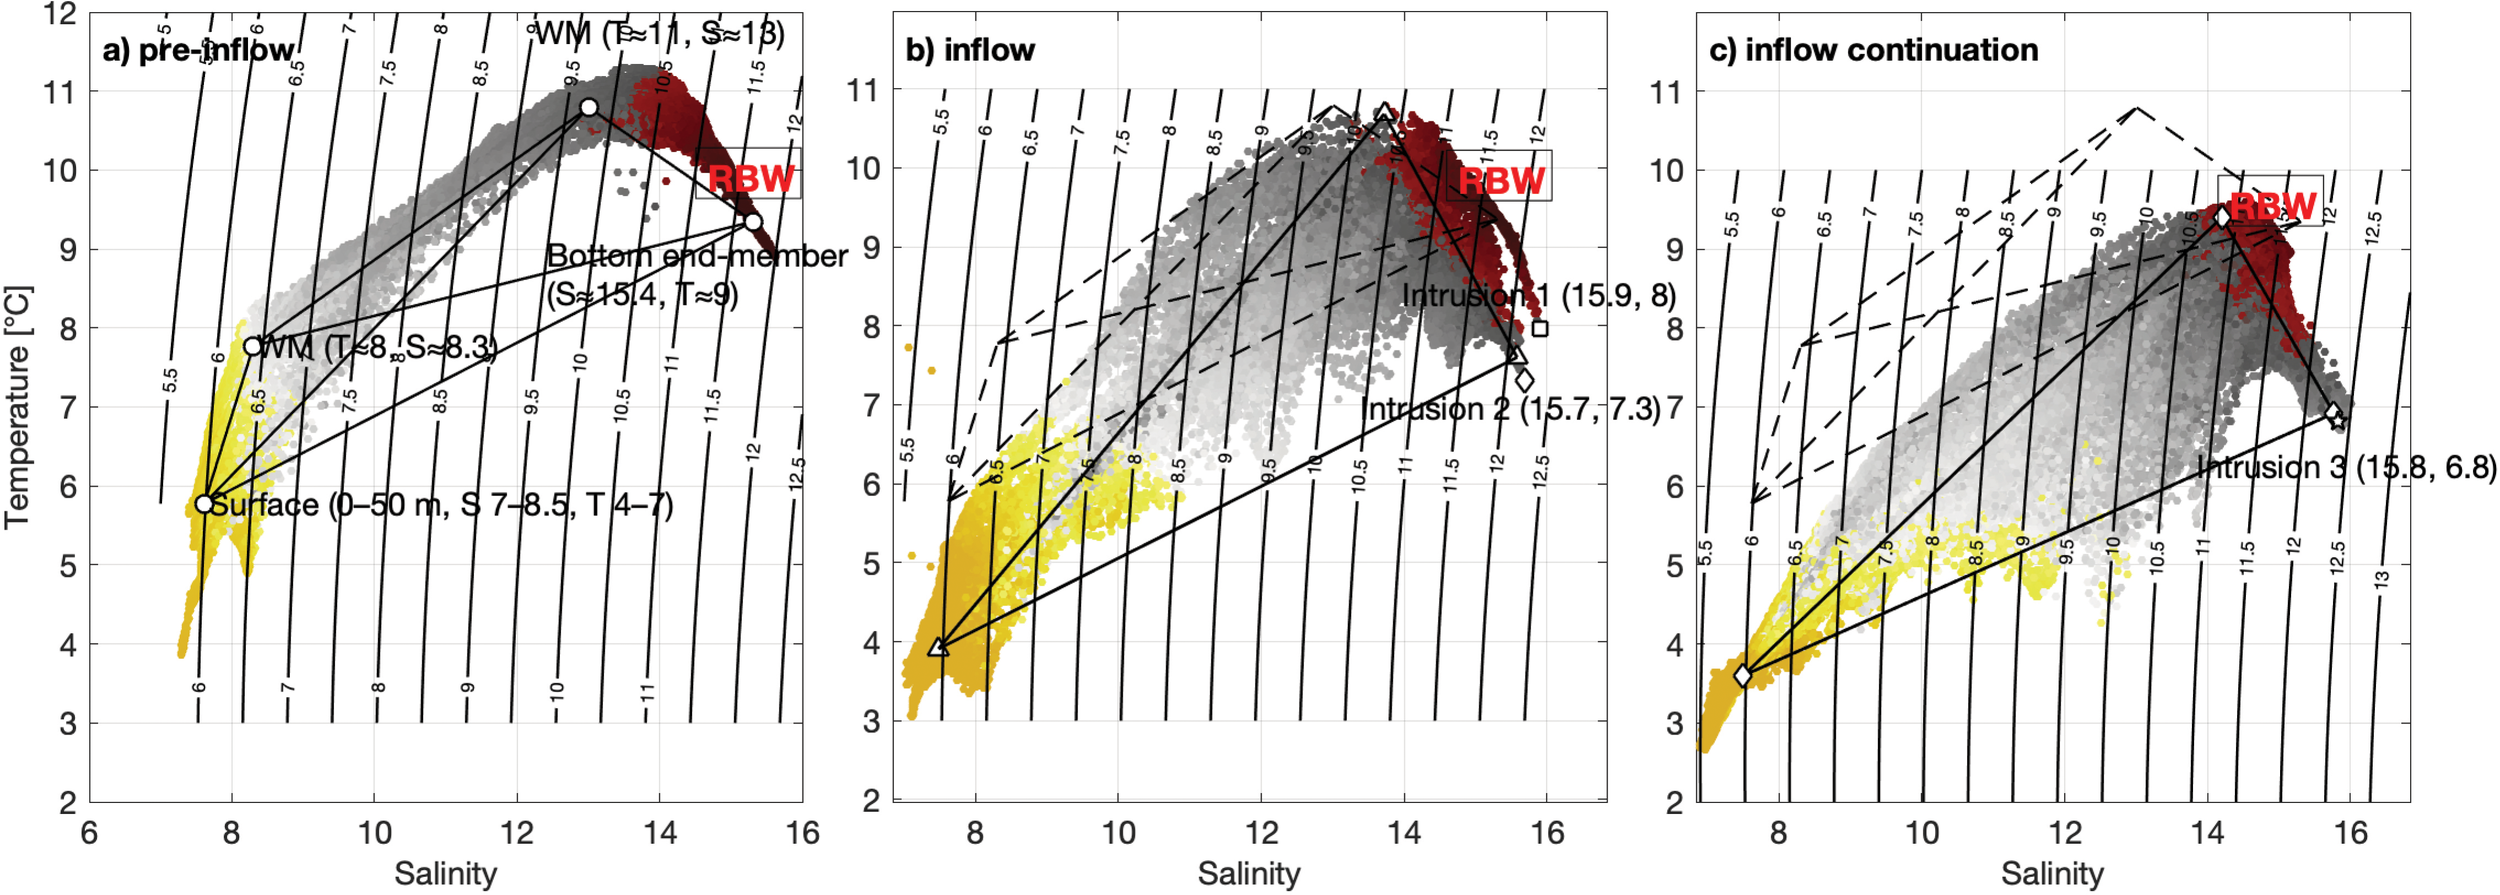
Water mass analysis in the Bornholm Basin. (A–C) T–S diagrams for pre−inflow, inflow, and post−inflow periods with potential density contours. Black straight lines show simple mixing lines between local deep water (pre−inflow end−member) and inflow end−members automatically selected from upper salinity quantiles (Intrusion 1:S=15.9,T=7.97°C; Intrusion 2: S = 15.68, T = 7.31°C, Intrusion 3: S = 15.83, T = 6.82°C). Old pre-inflow waters are present in other panes as dashed lines and the resident bottom waters are marked as RBW.
For the inflow and inflow continuation periods, new water masses were identified from the same T–S framework by locating emergent clusters that deviated from the pre-inflow pattern. Three intrusions were also recognized as local T–S anomalies: Intrusion 1 (S = 15.90, T = 7.97°C), Intrusion 2 (S = 15.68, T = 7.31°C), and Intrusion 3 (S = 15.83, T = 6.82°C). Their approximate depths (84.63 m, 85.13 m, and 80.63 m, respectively) were obtained by matching the observed [S, T] pairs to the closest values in the vertical profiles, consistent with the local potential-density structure.
3.3 Turbulence characteristics
Oceanic density overturns are commonly used to parameterize the dissipation rate of turbulent kinetic energy ϵ. Thorpe (1977) suggested a possible correlation between an observable measure of overturn size, the so-called Thorpe length scale LT, and a dimensionally constructed length scale to be a large-scale bound on isotropic motions in a stratified fluid, the so-called Ozmidov length scale LO = (ϵ/N3)1/2, where is the ambient buoyancy frequency determined from the background density gradient . In an investigation of turbulence within the thermocline, Dillon (1982) provided observational evidence suggesting a linear relationship between LT and LO in support of Thorpe’s assertion. This method assumes a linear scaling between the Thorpe length scale LT and the Ozmidov length scale LO. From glider CTD profiles, with an average vertical resolution of about 6 cm, potential density and temperature were calculated, then each profile was sorted in a way density is increasing with depth and each displacement δT of this sorting was recorded. The root-mean-square of δT for the depth range exhibiting this signature then determines LT of the overturn. The “turbulent patches” for Thorpe-scale calculations were identified as vertical segments of each profile over which nonzero values of δT cumulatively sum to zero. Patch boundaries are determined using a top-down cumulative sum , where j = 1 corresponds to a beginning value at the top of the profile and j = n corresponds to the end value at the bottom of the profile. For most of the water column, the density profile is stable so that ∑δT = 0 because δT = 0. Over an overturning patch, however, ∑δT decreases from zero as a function of depth in the uplifted heavy fluid before increasing back to zero as a function of depth in the downwelled light fluid. The depths where ∑δT = 0 on either side of the overturning fluid outline the patch. It is over these limited vertical segments that patch averages of buoyancy frequency and dissipation rate are taken for a calculation of LO. The process of identifying a turbulent patch used potential density profiles. The EKE dissipation rate ϵ was obtained from: ϵT=0.64 LT2N3. The limitation of the method assumes that the flow is in a fully turbulent regime, which is not always the case. A noise floor of ϵ ≈ 10−¹0 W kg−¹ was estimated based on the instrument resolution (~6 cm) and the smallest resolvable overturn length scale (~0.2 m). In strongly stratified layers without detectable inversions, Thorpe reordering still yields apparent dissipation on the order of 10−¹0 W kg−¹, which we interpret as the effective detection limit.
Because glider profiles are collected along an inclined trajectory, the inferred density overturns represent displacements projected onto the glider’s sampling path rather than strictly vertical motions. This geometric effect introduces a modest positive bias in Thorpe-scale estimates (e.g., Howatt et al., 2021; Sheehan et al., 2023) but does not affect the ability to identify enhanced mixing or interpret dissipation rates at the order-of-magnitude level. A more detailed discussion of this limitation is provided in Section 5.5.
3.4 Oxygen inventory and flux calculations
In this study, conservative and non-conservative oxygen changes are defined relative to S–O2 mixing relationships. Conservative oxygen change refers to variations explainable solely by internal vertical mixing processes that move water parcels along the conservative S–O2 mixing lines and do not supply external oxygen. Non-conservative oxygen change refers to deviations from the conservative mixing line and quantifies external oxygen input associated with the lateral advection of inflow water.
Column-integrated oxygen inventories were calculated for the deep layer (z ≥ 70 m) as:
where O2(zi,t) is the oxygen concentration (mg L−¹), Δzi is the layer thickness, and c = 1000 L m−³ is the unit conversion to mg m−².
The pre-inflow reference inventory I_pre was computed as the mean column-integrated oxygen content of the deep layer (z ≥ 70 m) over all glider profiles collected during the pre-inflow period (before 9 January 2024), using the same vertical integration as for I_obs(t). This provides a single baseline value against which all subsequent inventory anomalies were evaluated.
To estimate the oxygen concentration expected from purely conservative internal mixing, we constructed linear S–O2 mixing lines between the pre-inflow deep-water end-member (S0, O20) and the characteristic intrusion end-members (S1, O21) for each inflow period (Intrusion 1, Intrusion 2, Intrusion 3, see Figure 3). For each measurement:
Figure 3
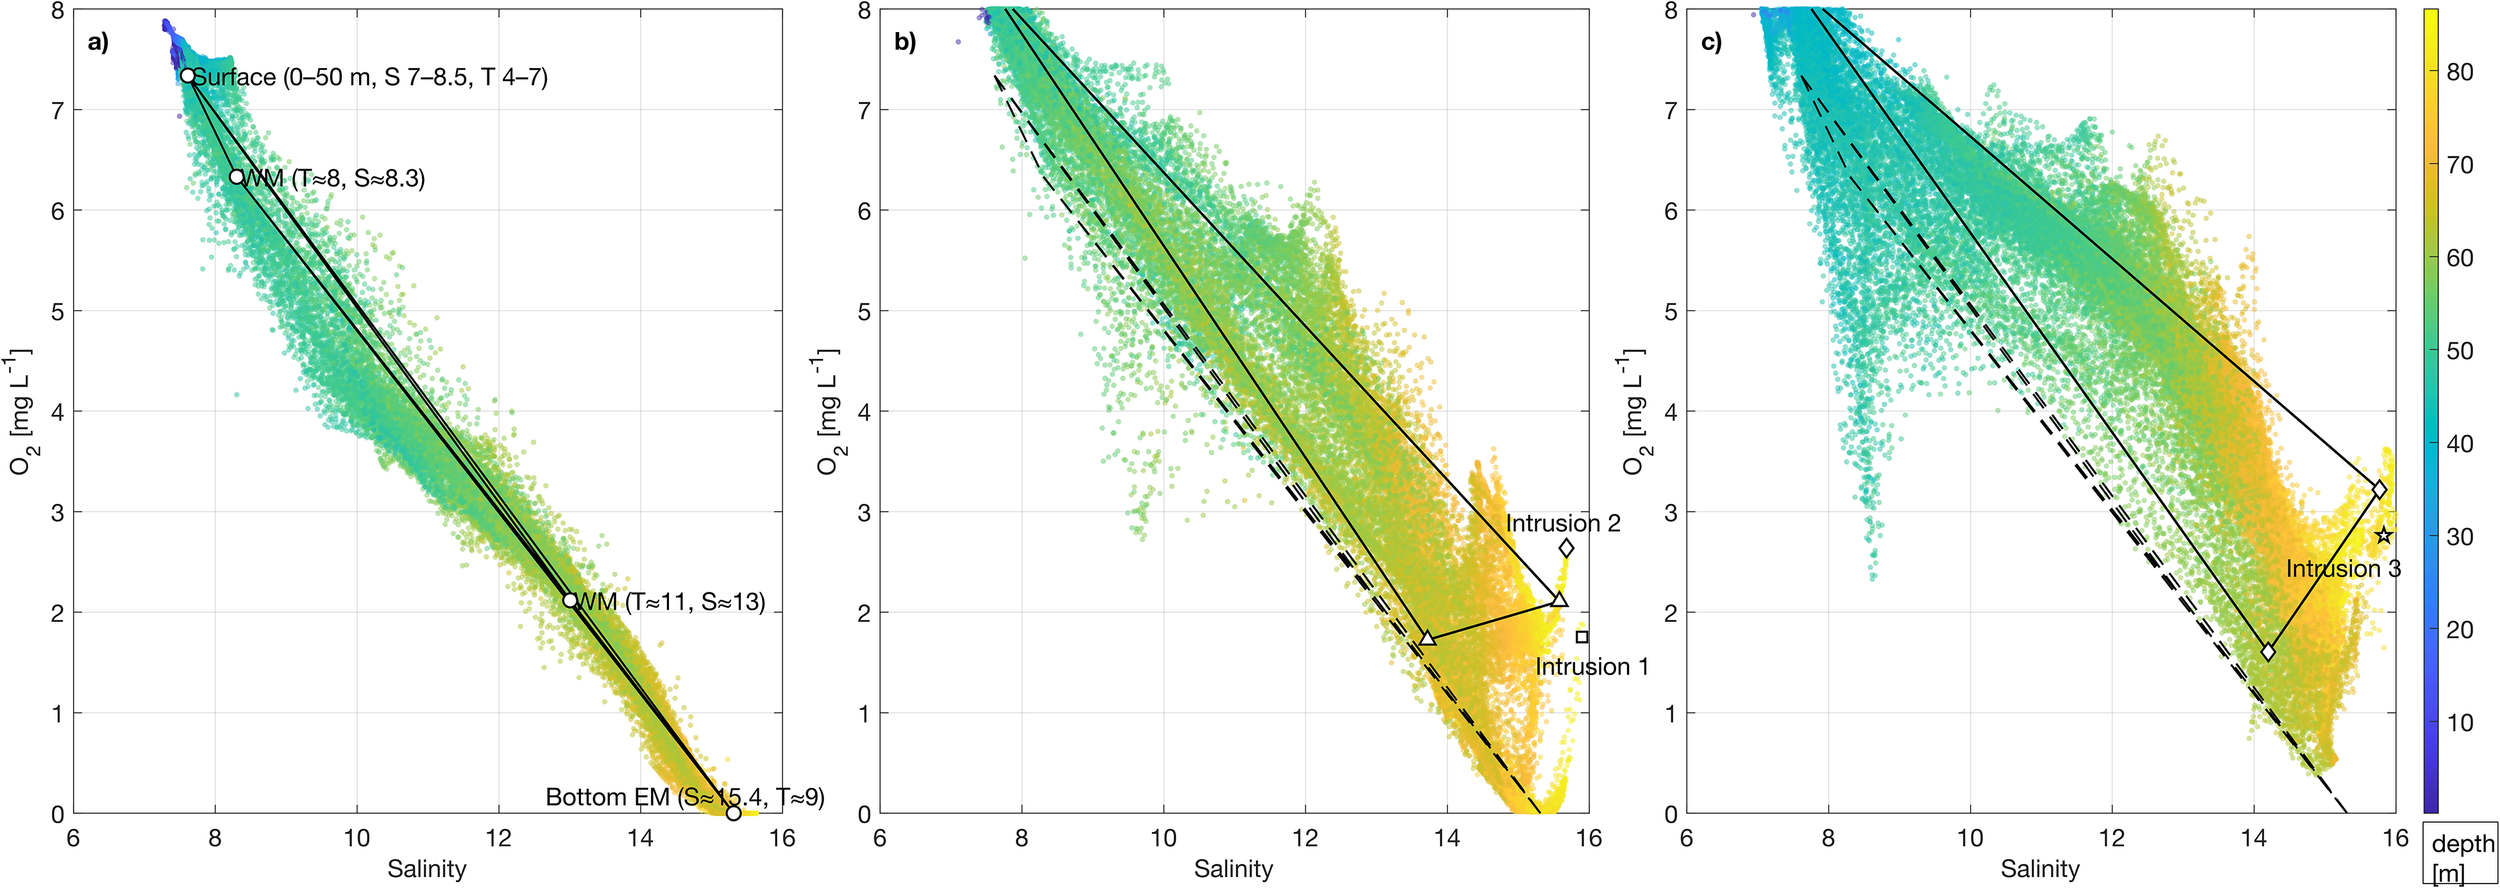
O2–S relationship for pre-inflow (A), inflow period (B), and post-inflow (C) phases with the same mixing lines and water masses as in Figure 2 with three intrusions: Intrusion 1 (S = 15.90, T = 7.97°C), Intrusion 2 (S = 15.68, T = 7.31°C), and Intrusion 3 (S = 15.83, T = 6.82°C).
For each profile, this predicted conservative concentration field O2_mix(z) was then vertically integrated in the same manner as the observed oxygen field to obtain the conservative inventory:
Inventory anomalies relative to the pre-inflow baseline I_pre were then computed as:
Here, ΔI_cons represents the conservative oxygen change attributable to internal vertical mixing, while ΔI_inflow represents the non-conservative oxygen input delivered laterally by each intrusion. O2,mix was computed at all depths using the S–O2 mixing relationships shown in Figure 3, but only values within the deep layer (z ≥ 70 m) were used when integrating the conservative oxygen inventory.
Oxygen fluxes for each inflow event were computed as:
where Δt is the duration of the corresponding intrusion period. Fluxes were expressed in mg m−² d−¹ and represent net flux e.g. the total oxygen input to the deep layer.
The relative contributions of advection and vertical mixing to the total oxygen increase were quantified as:
where f_inflow represents the fraction of oxygen supplied laterally by Intrusion 1, Intrusion 2, or Intrusion 3, and f_cons represents the fraction produced by conservative internal mixing.
To allow direct comparison across intrusions, advective and conservative oxygen fluxes were also derived by scaling the total oxygen flux F_O2 by these fractions:
Thus, F_adv represents the portion of the net oxygen flux attributable to non-conservative inflow advection, whereas F_cons represents the portion attributable to conservative internal mixing processes.
This approach provides an observational analogue to a box-model oxygen budget, allowing the partitioning of oxygen sources for each intrusion without requiring assumptions regarding basin volume, diapycnal diffusivity, or stationarity.
4 Results
4.1 Cross-basin hydrography during inflow (February 2024)
To aid interpretation, we first distinguish the main water masses in the Southern Baltic basins. The surface layer (0–40 m) consists of low-salinity waters (<8 PSU) of Baltic origin, strongly influenced by river runoff and seasonal atmospheric forcing. Beneath lies the halocline/transition layer (approximately 40–60 m in BB and SF, ~60–70 m in GB under climatological conditions), where salinity increases steeply from ~8 PSU to >13 PSU. Below this density interface, the deep-water mass (>60 m in BB and SF, >70–80 m in GB) extends from the halocline down to the seabed. It is typically more saline (10–20 PSU), colder, and prone to hypoxia or anoxia due to limited ventilation.
Figure 4 illustrates the distribution of temperature, salinity, and oxygen concentration along the main transect across the deep basins of the Southern Baltic, during the period from 7 to 12 February 2024. Temperatures at the surface average around 4°C, increasing to approximately 8°C below the halocline. Salinity levels in the upper layer align with typical regional values. However, in the BB the halocline was elevated to ~45 m, which is shallower than its typical climatological depth of ~50–55 m (Bulczak et al., 2024). This elevation facilitated the advection of waters from deeper layers of BB over the Slupsk Sill. In contrast, in the GB the halocline was markedly depressed to ~90 m, considerably deeper than the typical ~60 m reported for this basin (Bulczak et al., 2024). This anomalous vertical positioning of the halocline in both basins highlights the unusual hydrographic response to the 2023/24 inflow. The oxygen content in the bottom layer of the Southern Baltic was unusually high for this time of year, with almost no anoxic zones typically present in this region. This exceptional situation was primarily linked to the anomalous depth of the halocline. In the GB, the halocline was markedly deeper than usual, allowing oxygen-rich waters with concentrations up to ~14 mg L−¹ to extend down to ~75 m depth.
Figure 4
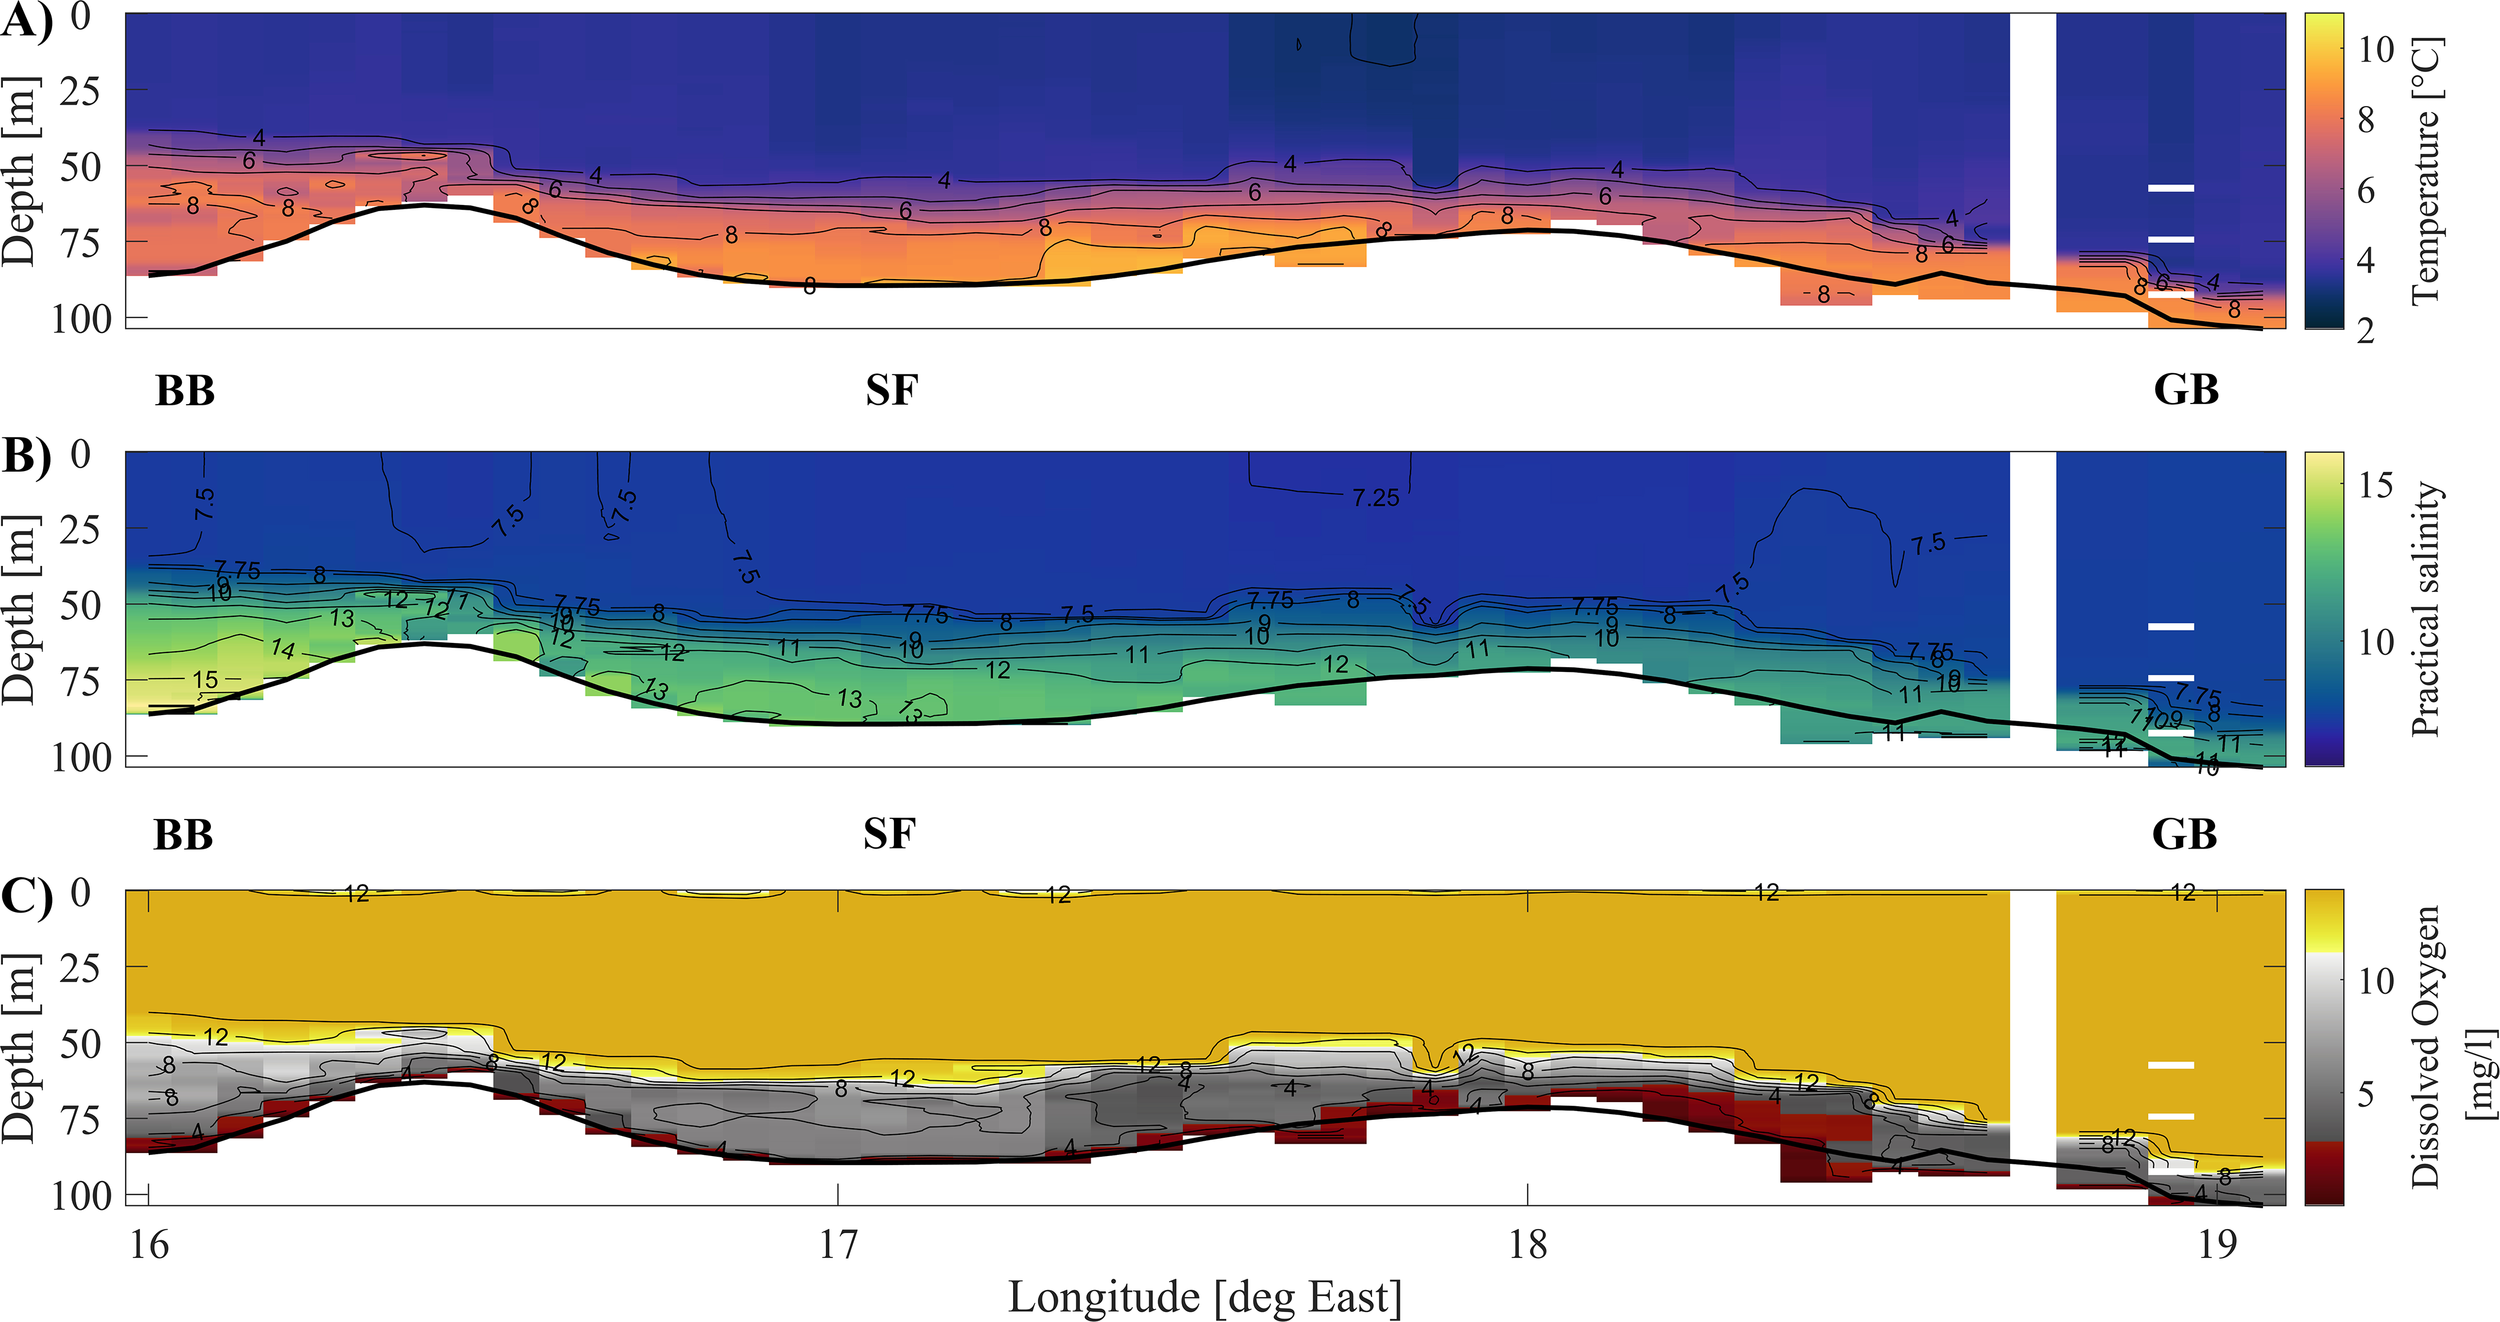
Distribution of (A) temperature [°C], (B) salinity [PSU], and (C) dissolved oxygen concentration [mg L−¹] along the main transect from BB through SF to GB, based on CTD data collected during 7–12 February 2024. The halocline is elevated in BB and depressed in GB, while deep oxygen levels are exceptionally high throughout the section.
4.2 Inflow-induced changes relative to pre-inflow conditions
Figure 5 compares current hydrological conditions across the BB, SF, and GB with both the long-term climatology and observations from before (December 2023) and during (February 2024) the inflow event.
Figure 5
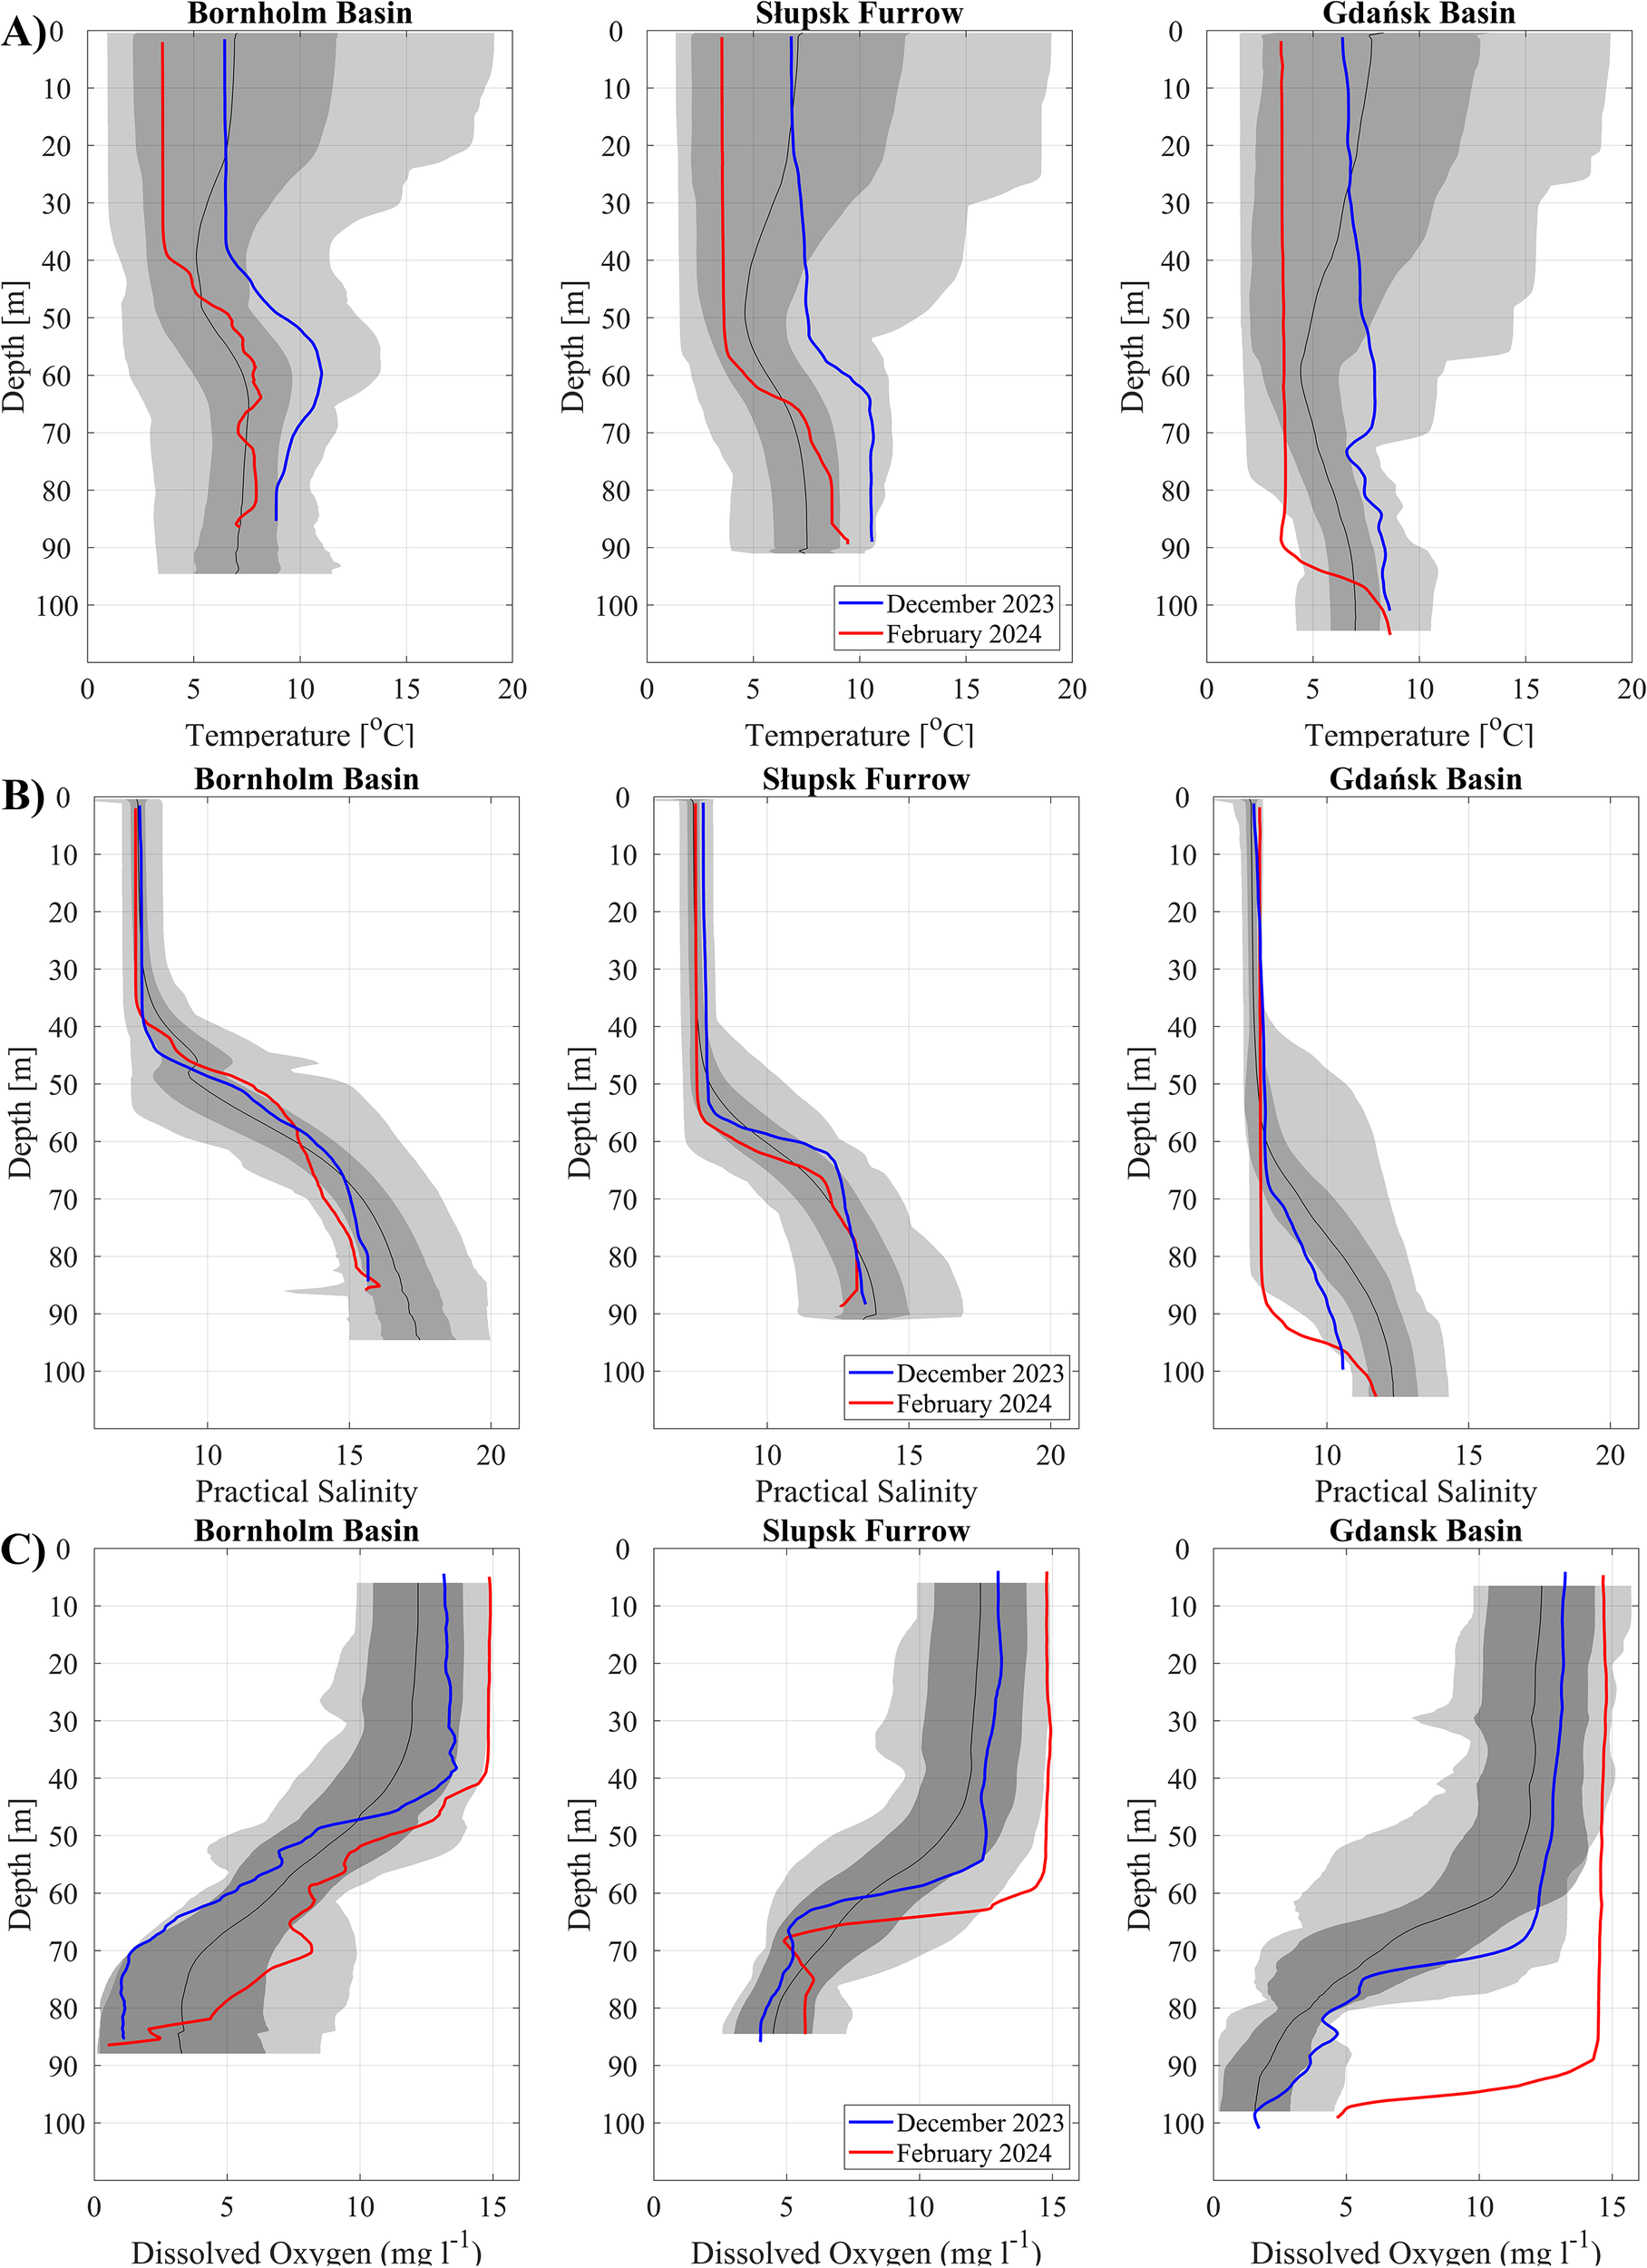
Profiles of (A) temperature [°C], (B) salinity [PSU], and (C) dissolved oxygen [mg L−¹] in BB, SF, and GB for December 2023 (blue), February 2024 (red), and the historical climatology (gray shading: mean ±1 SD). In BB, the halocline rose by ~6 m, but bottom salinity remained lower than average. In GB, a deep halocline and unprecedented oxygen increase are observed.
Across all three regions, the water column cooled by approximately 4.5°C between December and February, reflecting seasonal atmospheric forcing. In the deep water, however, the inflow signal was superimposed on this cooling trend: in the BB, bottom water temperature decreased only modestly (from ~6°C to ~5°C), while its relative warmth compared to the overlying winter surface layer still indicated the advection of milder North Sea water. The most pronounced inflow signature was observed in the BB deep-water mass, where salinity increased by approximately 0.5 PSU and dissolved oxygen concentrations rose sharply, from near-anoxic levels (<1 mg L−¹) in December to over 6 mg L−¹ in February. This oxygenation signal clearly exceeded the historical variability, evidencing the arrival of oxygen-rich inflow waters.
In contrast, SF exhibited a more moderate and transient response. Bottom salinity remained largely unchanged, while dissolved oxygen levels briefly increased by ~1 mg L−¹ above the average, before declining again to even lower values than those recorded in December. This suggests that oxygen consumption and upstream dilution significantly limited the impact of the inflow in this region. Temperature changes were minimal, and the halocline remained near ~50 m, although some erosion of stratification was observed.
A unique situation was recorded in GB, where in February 2024 the vertical hydrographic structure reached values beyond those previously recorded by IOPAN. The halocline deepened markedly, with its upper boundary detected at ~90 m depth. This shift coincided with unprecedented changes in temperature, salinity, and oxygen levels below 80 m. However, preliminary analyses suggest that these anomalies are not directly related to the inflow signal and may reflect internal basin dynamics. A comprehensive assessment of this phenomenon will be presented in a separate publication.
4.3 Hydrographic evolution in the Bornholm Basin observed by gliders
The glider-based time series in BB, collected between December 15, 2023, and March 13, 2024, reveal significant temporal evolution in salinity, potential temperature, and oxygen concentration, particularly in the deep layer (Figures 6A–C). These changes reflect the arrival and progression of the 2023/24 inflow and its influence on local water mass structure.
Figure 6
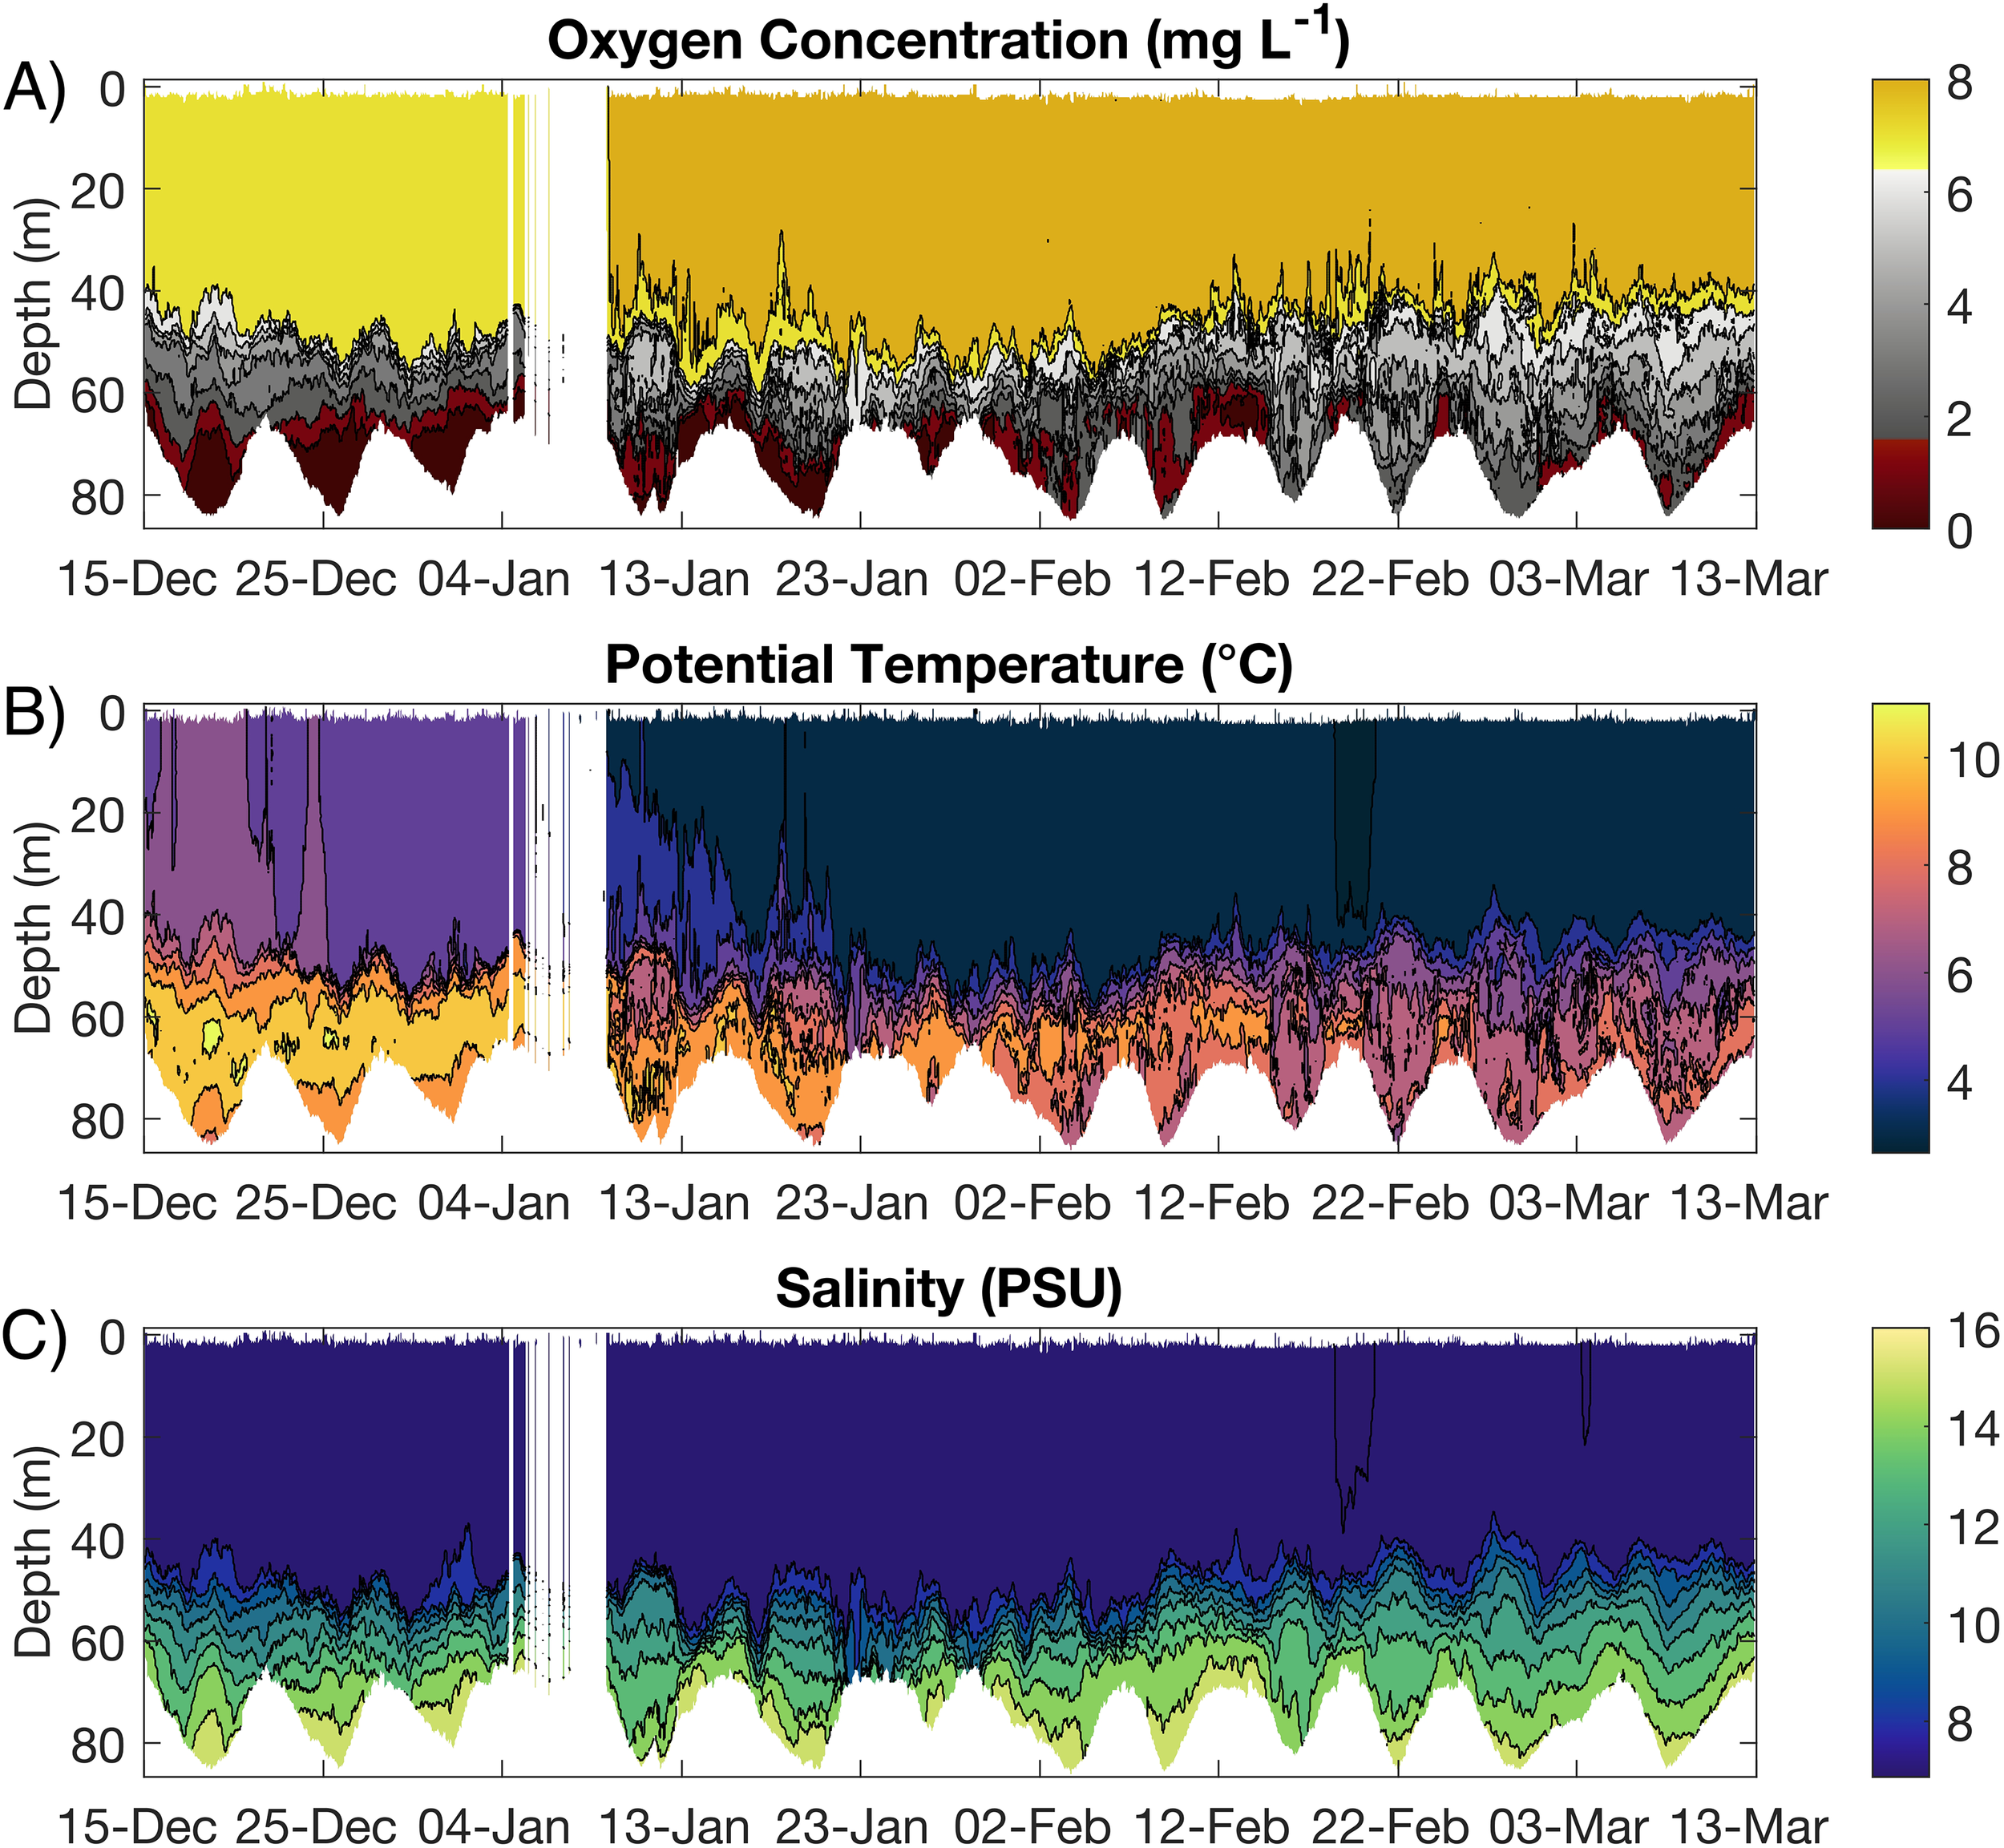
Time–depth plots of (A) dissolved oxygen [mg L−¹], (B) potential temperature [°C], and (C) salinity [PSU] from December 15, 2023 to March 13, 2024.
Prior to mid-January, deep-layer salinity (below ~75 m) remained relatively low, with weekly-mean values around 14 PSU. The concurrent evolution of weekly mean salinity, dissolved oxygen, and turbulence in the sub-halocline and deep layers is summarized in (Figures 7A–C). A clear monotonic increase is not apparent in the section view (Figure 6), as the color scale and spatial averaging mask small but relevant changes in the deepest layers. However, several intermittent intrusions of more saline North Sea water are evident in the pointwise salinity maxima extracted from Figure 6. These short-lived pulses reached 15.63 PSU on 19 December 2023, 15.53 PSU on 25 December 2023, 15.91 PSU on 21 January 2024, 15.56 PSU on 4 February 2024, 15.78 PSU on 10 February 2024, 15.98 PSU on 21 February 2024, 16.01 PSU on 22 February 2024, and 15.79 PSU on 1 March 2024.
Figure 7
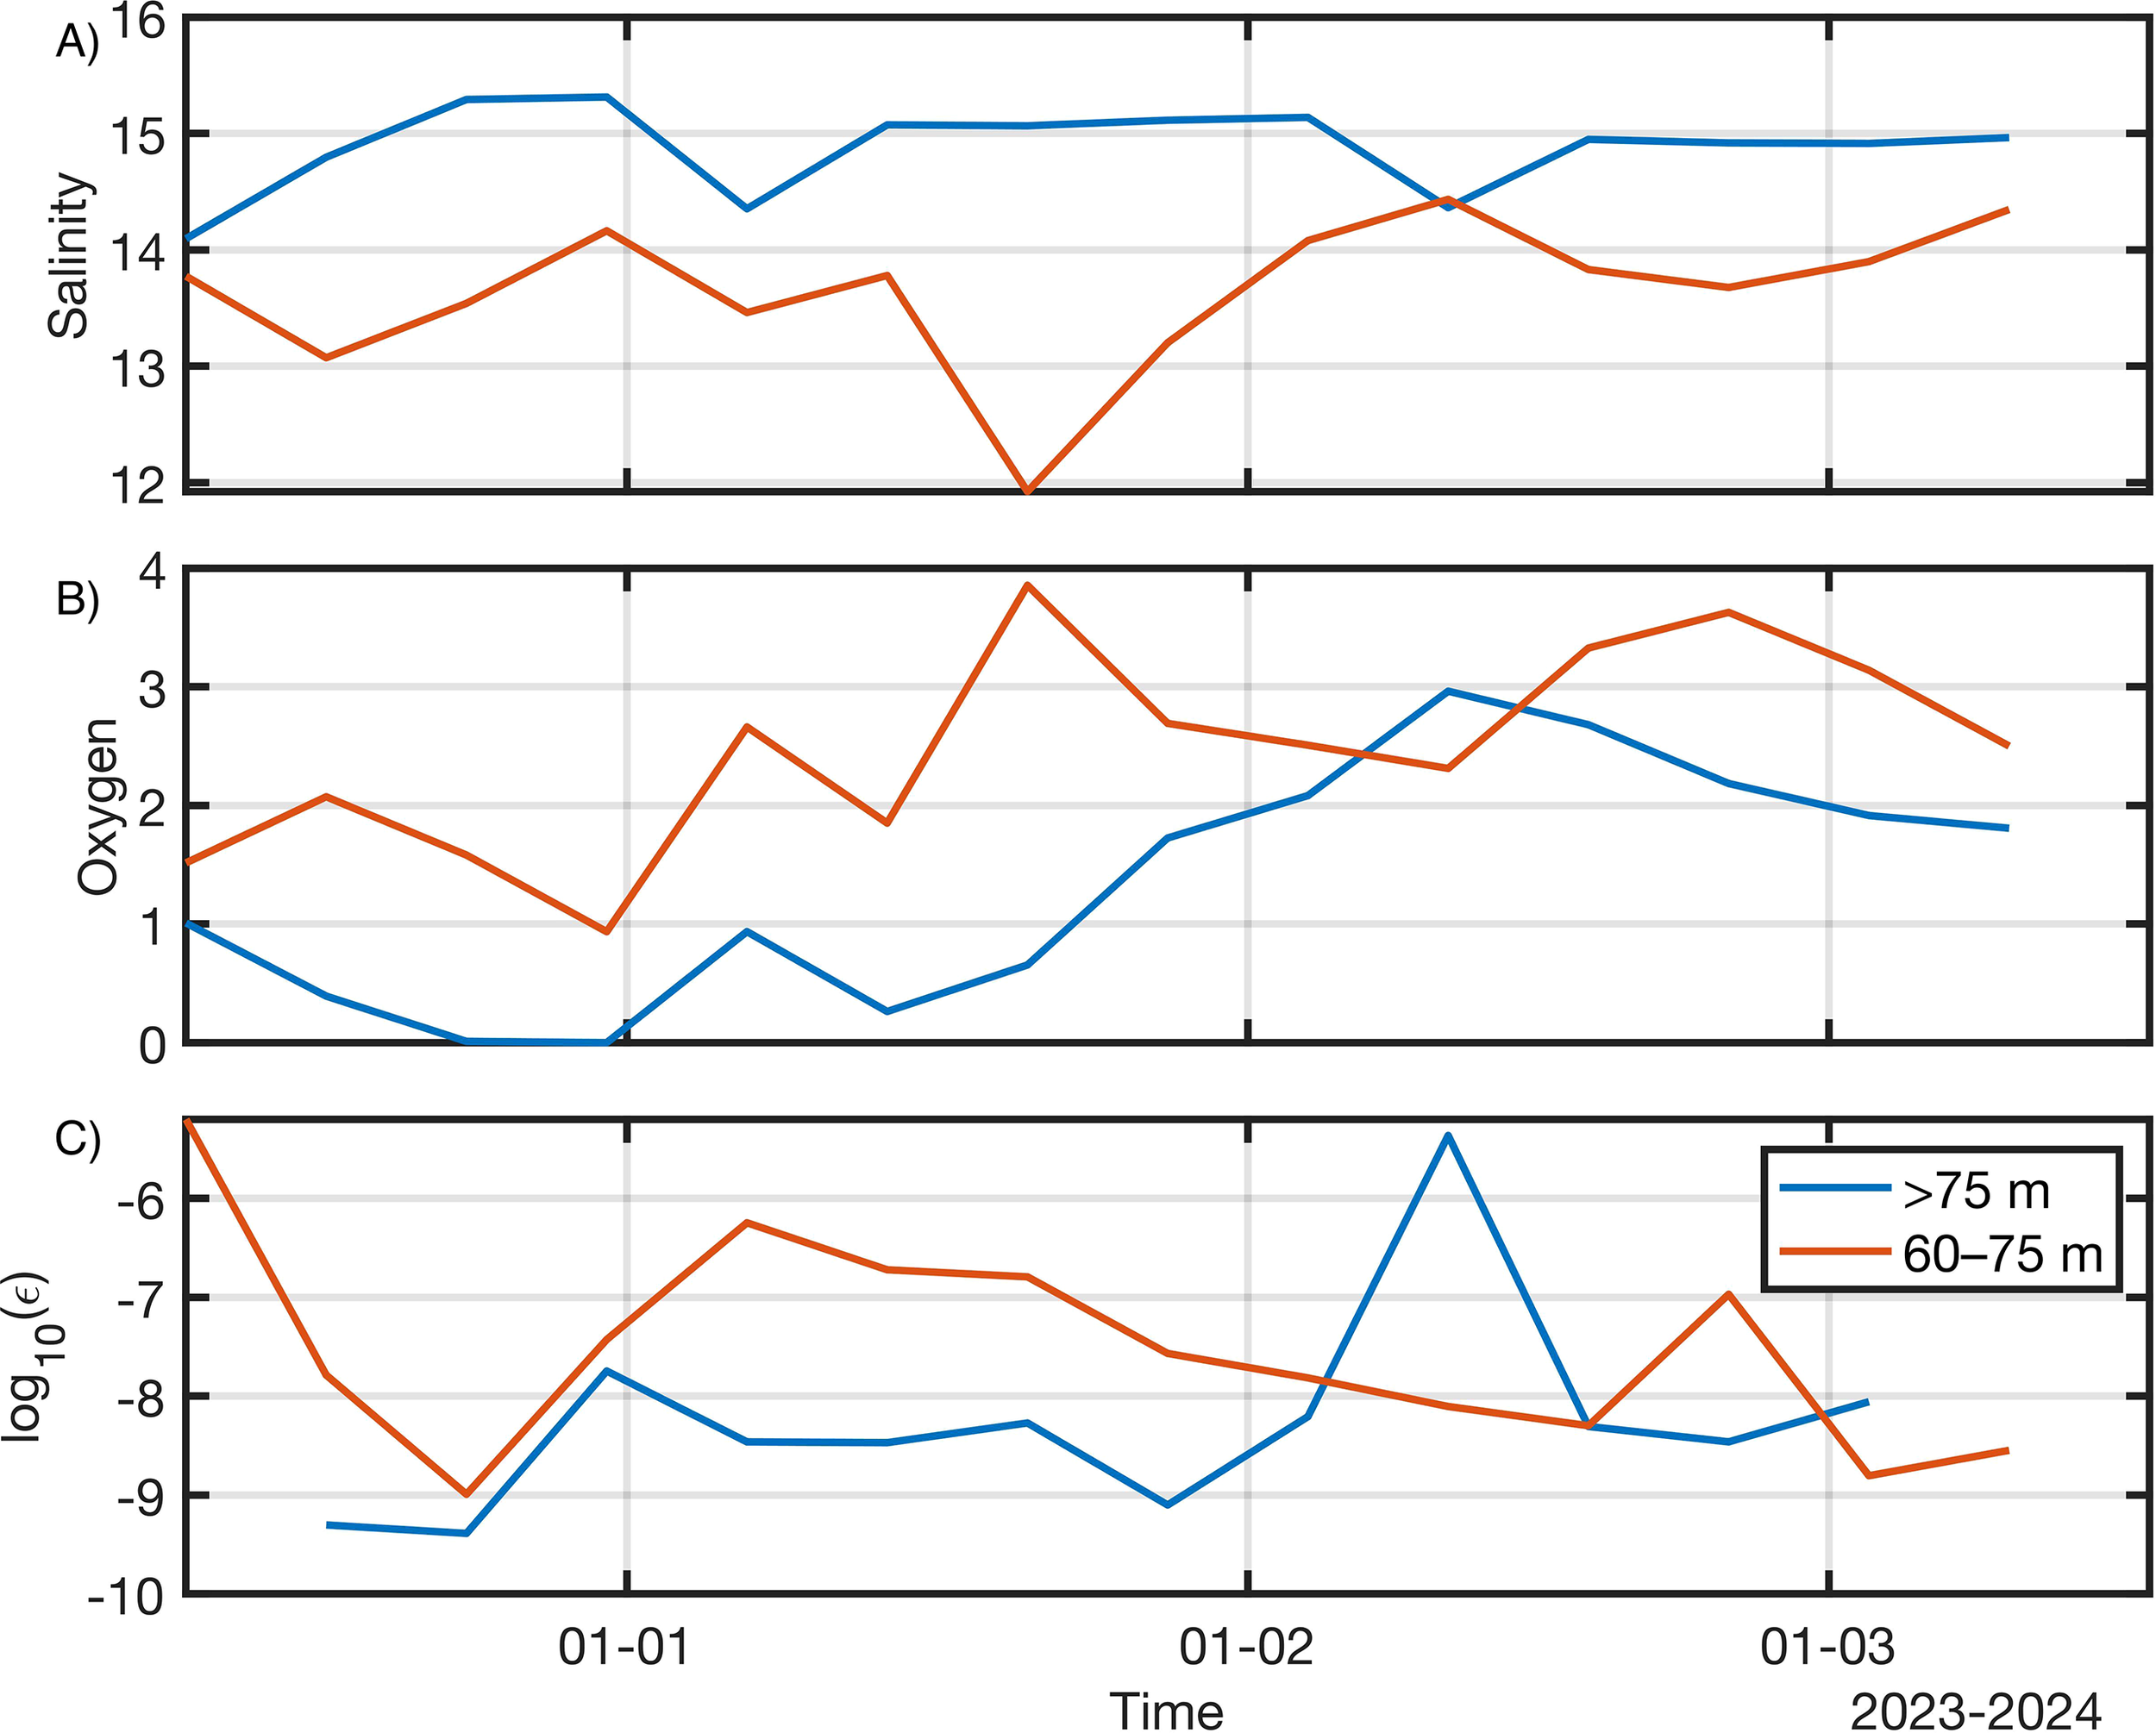
Time series of bottom and under-halocline properties (weekly mean below 75 m and between 60 and 75m in the central Bornholm Basin) from glider data. Evolution of (A) salinity (PSU), (B) dissolved oxygen (mg L−¹) and (C) Logarithm of the Eddy Kinetic Energy dissipation rate (W kg−¹) in 15.12.2023-13.03.2024.
These episodic peaks are substantially smoothed in the weekly-mean record (Figure 7A), which nevertheless shows a gradual increase from ~14 PSU in late December to ~15.3 PSU by mid-February. Together, the detailed maxima (Figure 6) and the weekly-mean evolution (Figure 7A) indicate that dense, saline water entered the deep basin not as a single sustained inflow, but through several irregular pulses whose cumulative effect raised the background salinity through January–February. The upper 40 meters of the water column remained largely unaffected, with salinities below 8 PSU, confirming that the inflow propagated as a bottom-intensified gravity current, consistent with known Baltic inflow dynamics. Temperature changes followed a typical winter pattern: surface cooling from 5–6°C in December to approximately 2–3°C in February, while the bottom layer retained higher temperatures of about 10°C in December that decreased with the advection of cold inflow waters to 7-8°C in February-March.
Dissolved oxygen concentrations in the bottom layer rose dramatically over the same period. In mid-December, levels below 70 m were below 2 mg L−¹ and even 0 mg L−¹ below 80 m, indicating hypoxic or anoxic conditions. Beginning in mid-January, coinciding with the salinity rise, bottom oxygen levels increased sharply, reaching 6–8 mg L−¹ by mid-February and remaining elevated through March. This confirms that the inflow introduced not only saline but also oxygen-rich waters, effectively ventilating the previously oxygen-depleted deep basin.
The concurrent increase in bottom salinity, oxygen, and decrease in temperature confirms the arrival of a cold-season, dense inflow that advanced along the seabed and displaced resident water masses. These glider observations provide high-resolution evidence of a gravity current, demonstrating the vertical and temporal structure of the inflow and its dominant control over deep basin ventilation. Importantly, the gradual shallowing of the halocline from mid-January elevated the density interface sufficiently to enable cross-sill transport over the Slupsk Sill. This topographic threshold typically limits the eastward propagation of deep water, but in this case, the elevated halocline and associated dense layer allowed the inflow signal to progress into the Slupsk Furrow and the Gdansk Basin, as confirmed by ship-based CTD observations during the February 2024 cruise (Figure 4).
4.4 Stratification and mixing structure during the inflow
Time–depth diagrams of the turbulent kinetic energy dissipation rate (ϵ), buoyancy frequency squared (N²), and vertical gradients of salinity, temperature, and oxygen (Figure 8) provide a detailed view of the evolving mixing and stratification in BB during the 2023/24 inflow.
Figure 8
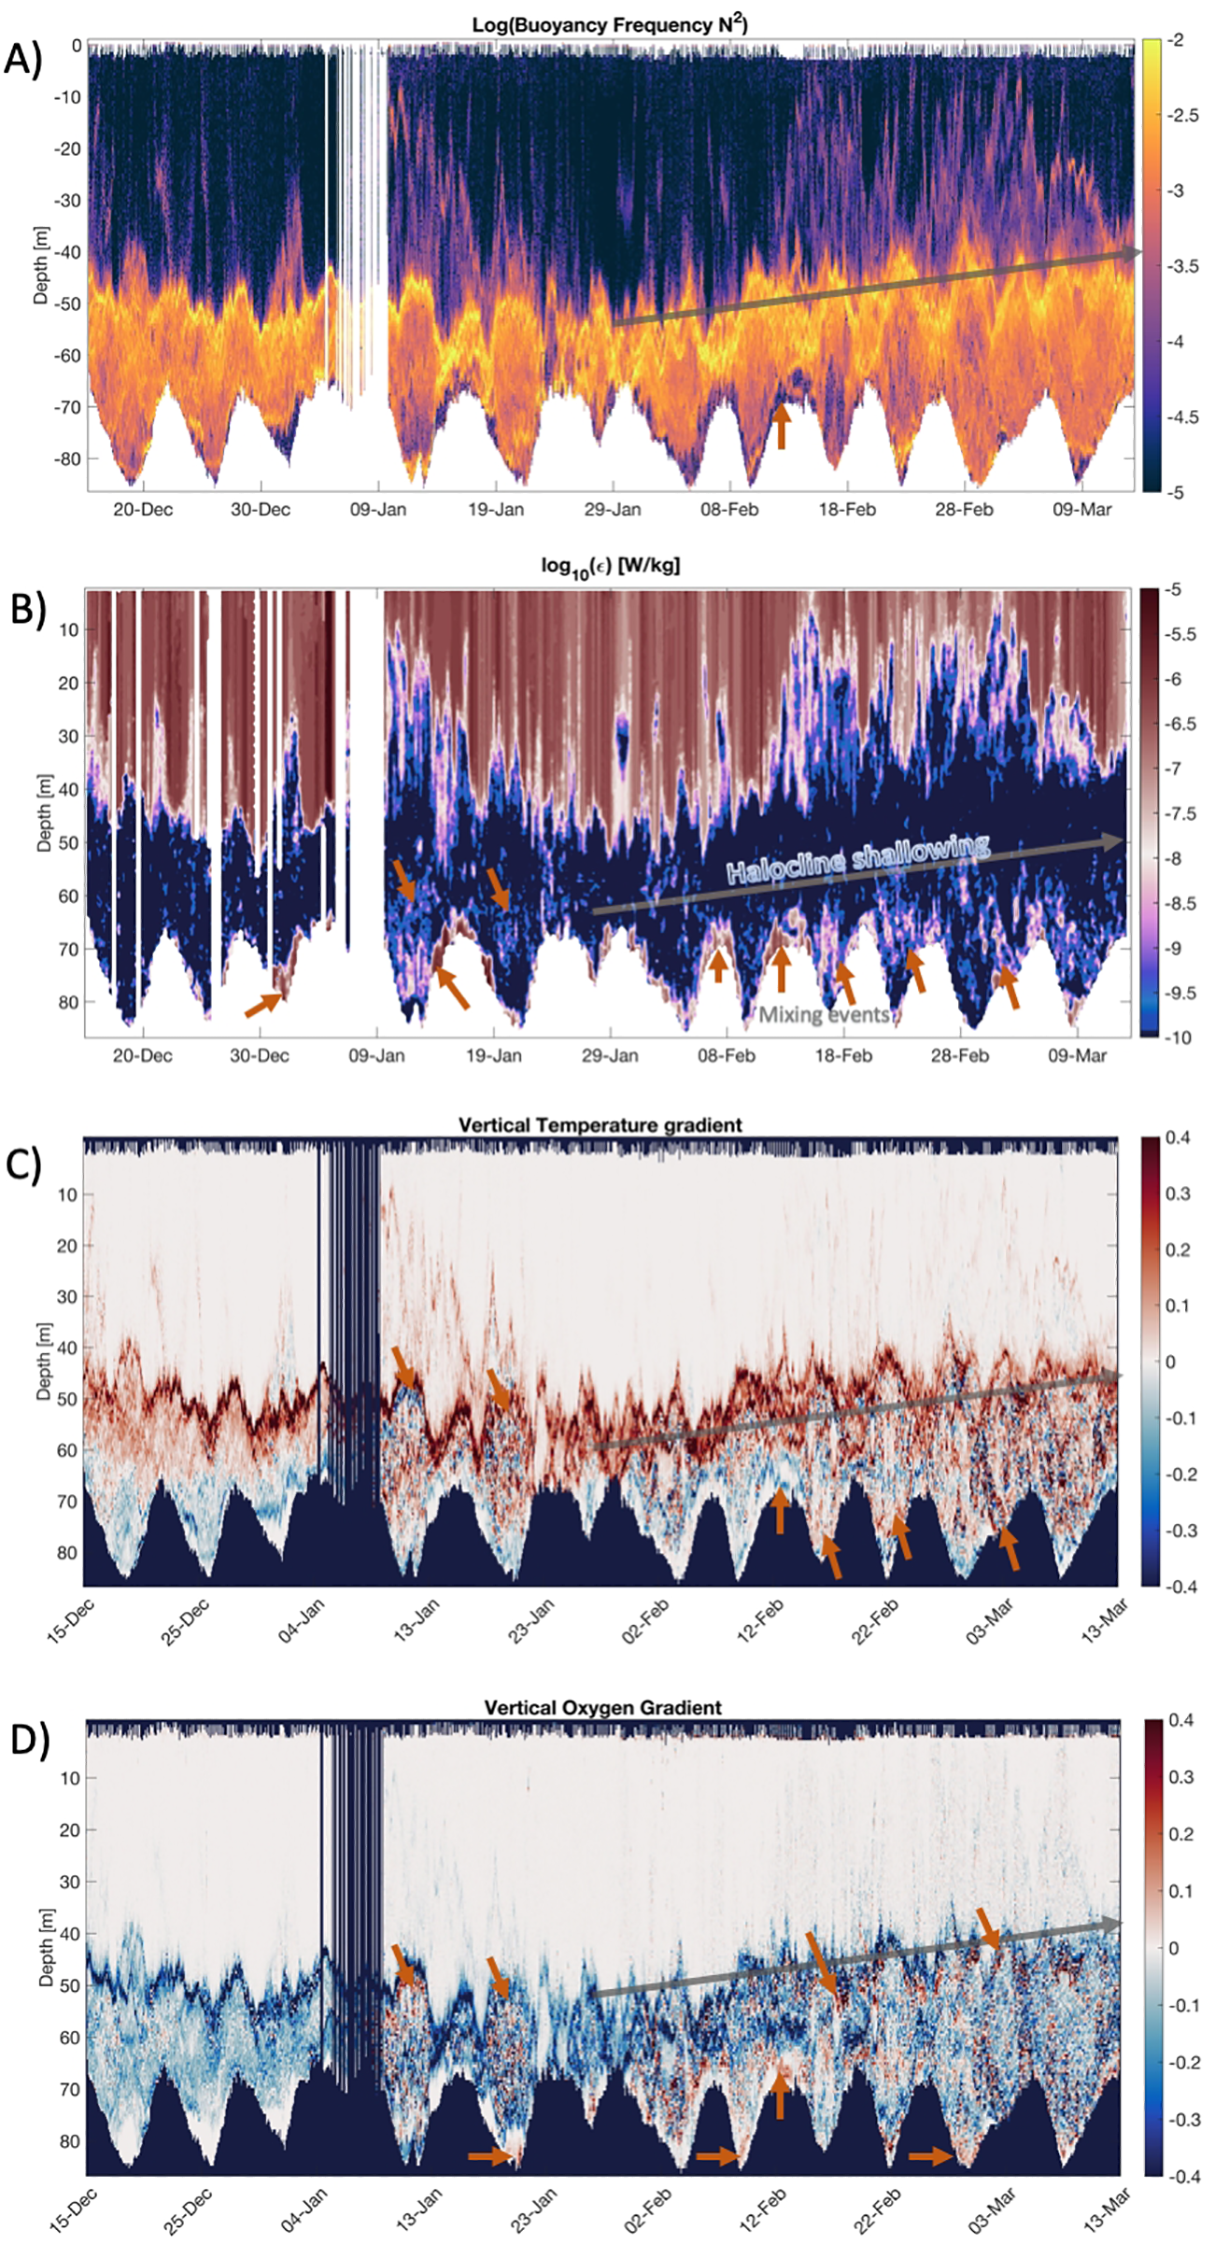
Time–depth diagrams from glider profiles in the Bornholm Basin showing: (A) log10 of buoyancy frequency squared, N² [s−²]; (B) log10 of turbulent kinetic energy dissipation rate, ϵ [W kg−¹]; (C) downward vertical gradient of temperature [°C m−¹]; and (D) downward vertical gradient of oxygen [mg L−¹ m−¹]. In panel (B) values below the noise floor (10−¹0 W kg−¹) are colored as a very dark blue. Elevated ϵ values occur in the bottom boundary layer (70–85 m) during episodic mixing events on January 3–5, January 19, January 29–30, February 6–8, and February 17–18 and are indicated by the arrows. Persistent stratification is evident near the halocline (~45–60 m), where interfacial turbulence coincides with halocline shoaling and inflow propagation.
From late December to January 10, the halocline deepened from ~45 m to ~60 m, as seen by the downward migration of elevated N² and strong salinity and temperature gradients. The glider transect was oriented from the Bornholm Basin center towards the northeast (Figure 1), whereas the dense inflow entered from the west/northwest. Consequently, the observed halocline deepening (Figure 6C) represents a basin-scale adjustment rather than a direct intrusion signal along the transect. The downward displacement from ~45 to ~60 m likely reflects baroclinic adjustment as dense bottom water entered the basin from the west, entrainment of halocline waters into the bottom-attached gravity current, and spatial asymmetry, as the transect did not intersect the core of the inflow. These combined effects preconditioned the basin by deepening the interface, in contrast to the intuitive expectation of an upward shift. The first notable increase in ϵ appeared in the bottom boundary layer on January 3–5, with values below 75 m reaching log10(ϵ) ≈ –6.5 to –6.0 W/kg, indicating shear-driven turbulence generated by the advancing gravity current interacting with the seabed. Following this initial burst, a broader increase in ϵ (~10−8 W kg−¹) extended throughout the layer below 60 m between January 10 and 15, marking a more vertically distributed mixing event beyond the near-bottom zone. This enhanced mixing signal gradually weakened and became spatially restricted in the following week, suggesting a decay of the event.
Later in January and February, higher ϵ values (>10−7 W kg−¹) reappeared as localized bands confined near the bottom, both in the deep center and along slopes. Additionally, streak-like upward extensions of elevated ϵ below 60 m formed inclined patterns suggestive of internal wave-driven mixing or wave reflection from the slope, propagating turbulence upward from the bottom into the stratified interior. These patterns show that mixing was the strongest at both the bottom boundary layer and along the density interfaces below the halocline, with intensity highest in regions of reduced stratification and weakened salinity and temperature gradients. Elevated ϵ coincided with low N² and diminished gradients, indicating that turbulence was effectively eroding stratification.
4.5 Interaction of inflow advection and vertical mixing during deep-water ventilation
The combined analysis of vertical gradients, water-mass structure, and oxygen inventories provides a detailed picture of how advective inflow and vertical mixing jointly contributed to the 2024 deep-water ventilation in the Bornholm Basin. A key feature in the oxygen gradient field (Figure 8) was the emergence of positive vertical oxygen gradients below the halocline (~50–65 m) starting on 9 January 2024, absent during the pre-inflow period. This pattern indicates the progressive downward penetration of oxygen-rich inflow water into previously hypoxic layers. The vertical oxygen gradient also suggests the presence of oxygenated water arriving along density surfaces, implying that both lateral advection and vertical entrainment contributed to the observed ventilation. In contrast, the salinity field (Figures 6, 8) showed only a weak increase at the bottom (~0.5 PSU), indicating that the oxygen signal was more pronounced than the salinity anomaly—likely due to pre-mixing and dilution of saline water during its upstream propagation.
The temperature gradient field (Figure 8) reveals a dynamic halocline interface shifting in depth with the progression of the inflow. As the event continued, temperature gradients at depth weakened, indicating thermal homogenization, while the halocline gradually shoaled after mid-February, consistent with cumulative mixing and erosion of stratification. These changes reflect a dual mixing regime:
-
- intense near-bottom boundary mixing driven by shear and friction at the base of the gravity current, and
-
- interfacial mixing below the halocline, likely induced by baroclinic shear, internal waves, and inertial oscillations.
The combined effect was the progressive homogenization and oxygenation of the deep layer and the upward migration of the halocline.
The transformation of water masses during these stages is illustrated by the T–S diagrams (Figures 2A–C). Prior to the inflow, the water-column structure was characterized by a well-defined stratification between surface, intermediate, and bottom waters. During the inflow, three distinct saline end-members—Intrusion 1, Intrusion 2, and Intrusion 3—appeared at the high-salinity edge of the distribution (Figures 2B, C), in addition to the resident deep water. The mixing lines between these end-members and the pre-inflow bottom water indicate that the post-inflow water masses cannot be reproduced by conservative mixing alone, implying an additional non-conservative contribution from lateral advection and along-isopycnal spreading of oxygen-rich water, with vertical mixing redistributing heat and oxygen within the deep layer.
The O2–S relationship (Figures 3A–C) confirms this interpretation. During the initial inflow phase, oxygen concentrations closely followed the conservative O2–S mixing lines, indicating that most of the oxygen increase resulted from the advection of oxygen-rich saline water entering the Bornholm Basin. As the inflow progressed, an increasing number of data points deviated above the conservative mixing line, revealing a non-conservative oxygen anomaly maintained by lateral advection and along-isopycnal spreading of already oxygenated water, while vertical mixing redistributes this signal within the deep layer. The vertical color gradient in these plots indicates that oxygenation initially occurred near 70–85 m and subsequently propagated both upward and downward as diapycnal mixing and entrainment eroded the halocline and thickened the oxygenated layer.
Quantitative decomposition of the oxygen inventories (Table 1) supports this pattern. During the early inflow phase (Intrusions 1 and 2), the deep layer gained approximately 20 800–24–000 mg m−² of oxygen relative to pre-inflow conditions, corresponding to net fluxes of 650–750 mg m−² d−¹. Of this, 55–60% originated from lateral advection of oxygen-rich inflow water, while 40–45% was supplied by conservative internal mixing and entrainment. In the subsequent continuation phase (Intrusion 3), both the total oxygen gain and the flux rate increased markedly (≈41–850 mg m−²; 1–350 mg m−² d−¹). However, only about 30% of this oxygen increase was attributable to inflow advection, whereas the remaining 70% resulted from vertical mixing, diapycnal exchange, and along-isopycnal redistribution. This shift indicates that, once the inflow had filled and thickened within the basin interior, turbulent mixing became the dominant mechanism sustaining deep-water oxygenation, with direct advective supply playing a progressively smaller role.
Table 1
| Period | Δt [d] | ΔI_total (vs pre) [mg m−²] | F_O2 [mg m−² d−¹] | f_inflow | f_cons | F_adv [mg m−² d−¹] | F_cons [mg m−² d−¹] |
|---|---|---|---|---|---|---|---|
| Intrusion 1 (10 Jan–10 Feb 2024) | 32 | 24000 | 750 | 0.60 | 0.40 | 450 | 300 |
| Intrusion 2 (10 Jan–10 Feb 2024) | 32 | 20800 | 650 | 0.55 | 0.45 | 357.5 | 292.5 |
| Continuation/Intrusion 3 (11 Feb–13 Mar 2024) | 31 | 41850 | 1350 | 0.30 | 0.70 | 405 | 945 |
Column‐integrated oxygen inventory changes (ΔI), fluxes (F), and fractional contributions of advective inflow (f_inflow) and vertical mixing (f_cons) for three inflow periods in the Bornholm Basin (January–March 2024).
Values are calculated relative to the pre-inflow baseline (I_pre) from glider observations. Fluxes are expressed in mg m−² d−¹.
Figure 7 presents the time evolution of salinity, dissolved oxygen, and turbulence averaged for the sub-halocline (60–75 m) and deep (>75 m) layers in the central Bornholm Basin between 15 December 2023 and 13 March 2024. During the pre-inflow phase (December–early January), bottom salinity remained nearly constant (~15.3–15.5 PSU) and oxygen levels were close to zero, indicating stagnant and oxygen-depleted deep water. Starting in mid-January, a gradual increase in bottom oxygen and a sharp rise in turbulence (log10ϵ from −9 to −6; Figure 7C) coincided with the arrival of saline intrusions, marking the onset of enhanced vertical exchange. Between late January and mid-February, oxygen concentrations below 75 m increased by over 2 mg L−¹, while the sub-halocline layer reached transient maxima above 3 mg L−¹, showing that oxygen-rich inflow water mixed upward into the interface zone. After mid-February, both layers showed progressive homogenization—oxygen concentrations converged, salinity differences diminished, and turbulence declined.
Together, Figures 3-7; Table 1 depict the sequential transformation of the Bornholm Basin deep water during the inflow: the arrival of saline intrusions, subsequent vertical oxygen transfer below the halocline, and progressive homogenization of the deep layer. The observed evolution of the T–S–O2 structure provides a coherent view of how lateral advection and vertical mixing jointly governed the 2024 oxygen renewal in the Bornholm Basin.
5 Discussion
5.1 Inflow characteristics and propagation
The winter 2023/24 barotropic inflow developed under the influence of storm “Zoltan”, which altered the large-scale atmospheric circulation over the North Atlantic and Scandinavia between December 19, 2023, and January 1, 2024 (Purkiani et al., 2024) driven by the westerly winds with peak velocities exceeding 22 m s−¹ replaced preceding easterlies. Saline water (S > 17 PSU) entered the Danish Straits by December 17, and the dense inflow reached BB around January 15, initially manifesting in the transition layer. However, the hydrographic signal in the BB remained relatively weak, with only a modest increase in bottom salinity (~0.5 PSU) despite the inflow’s arrival. This contrasts with the stronger salinity signal of 17 PSU reported near the Darss Sill and up to 22 PSU in the Arkona Basin (Purkiani et al., 2024), suggesting that the inflow mass experienced dilution and transformation during its propagation before reaching the Bornholm Basin. Most of the dense gravity current likely advanced along the southern rim of the Bornholm Basin into the Slupsk Furrow, whereas our transect sampled the central and northeastern part of the basin and therefore mainly recorded the transformed, diluted branch of the inflow. By mid-February, the inflow’s influence extended downstream across SF and into GB, indicating a basin-wide response about two months after onset.
The 2023/24 event exhibited a continuous and sustained inflow signal without a sharp salinity front. This pattern suggests a more complex regime, possibly hybrid in nature, where a barotropic initiation was followed by baroclinic reinforcement and significant entrainment of ambient waters. Glider observations in BB reveal a gradual advection–mixing process, with no clear front but a progressive deepening and subsequent shoaling of the halocline, consistent with a moderately pulsating inflow modulated by stratification. The relatively small increase in bottom salinity contrasts with the more prominent increase in dissolved oxygen concentration, suggesting that the inflow’s oxygen signature propagated more effectively than its salinity signal, likely due to upstream mixing and dilution of the inflow mass. The glider-based oxygen gradients show that the inflow oxygenated deeper layers not solely through advection along the bottom but also via vertical mixing and lateral spreading beneath the halocline, consistent with a gravity current that progressively entrains ambient water beneath the halocline.
The efficient downstream propagation of the inflow signal into GB was facilitated by favorable bathymetric pathways—particularly the channel-like structure of SF—and supported by background turbulence. These dynamics align with previous descriptions of gravity currents in semi-enclosed basins (Umlauf et al., 2007), where dense water advances along topographic depressions, generating shear and internal wave activity.
Compared to the 2014/15 MBI (Rak, 2016), the 2023/24 event progressed more slowly and lacked a clearly defined leading edge, supporting the interpretation of a stratified, entraining current rather than a single, coherent pulse. Similar behaviors have been observed in fjord and estuarine systems (Arneborg et al., 2004; Wells and Nadarajah, 2009), where dense overflows evolve as gravity currents that entrain ambient water and transform dynamically during propagation. The high-resolution glider observations presented here capture this transition in situ and provide rare observational constraints for modelling stratified inflow dynamics in semi-enclosed seas. Beyond large-scale advection and mixing, the internal structure of the inflow suggests the presence of finer-scale wave dynamics. The inclined, streak-like patterns in dissipation below the halocline and episodic vertical extension of turbulence into the stratified interior (Figure 8B) are indicative of internal wave activity modulating the mixing structure. Similar signatures in laboratory studies and idealized models (e.g., Marshall et al., 2021) have been attributed to internal gravity waves generated at the upper interface of stratified gravity currents. While direct velocity observations were not available in this study, the observed dissipation structure is consistent with the presence of wave-induced instabilities that may influence vertical transport, delay mixing in parts of the inflow, or promote the formation of intermittent mixing layers. This supports the interpretation that the 2023/24 inflow evolved not as a steady gravity current, but as a temporally and vertically modulated flow shaped by internal wave dynamics and local stratification. This broad-scale behavior sets the context for the local water mass and oxygen changes quantified below. In the following, we examine how these basin-scale inflow dynamics translated into local hydrographic transformations in the Bornholm Basin. In particular, T–S diagrams and oxygen–salinity relationships (Figures 2, 3) as well as glider-based bottom time series (Figure 7) provide a detailed view of the transformation and oxygenation of deep waters.
5.2 Halocline dynamics and bottom water transformation
Hydrographic observations from gliders and ship-based CTD profiles confirm a significant reorganization of the vertical hydrographic structure in the Bornholm Basin during the 2023/24 inflow. The halocline initially deepened from ~45 m in December to nearly 60 m by mid-January, consistent with a basin-scale baroclinic adjustment to the arrival of dense bottom water, combined with entrainment at the upper interface of the bottom-intensified flow (see Figure 8 and the discussion in Section 4.4). Rather than continuing to depress, the halocline gradually shoaled from late January to March, returning to ~45 m. This vertical reversal reflects a combination of advection, vertical mixing, and partial entrainment, rather than complete replacement of resident deep water. The observed shoaling coincided with a progressive thickening of the intruding water mass. As the inflow propagated into the basin, increased diapycnal mixing incorporated both overlying lighter water and parts of the resident deep-water layer, leading to a measurable increase in the vertical thickness and cross-sectional extent of the inflow-modified deep layer along the transect. This thickening raised the upper boundary of the inflow-modified layer and contributed to the observed shoaling/upward shift of the halocline. This is evidenced by the upward migration of the upper boundary of the under-halocline oxygen/salinity anomalies in the time–depth sections (Figure 6) and by the increasing depth range and contrast between the 60–75 m layer and the bottom layer (>75 m) in the weekly-mean record (Figure 7). In addition to the vertical evolution of the halocline, the observations reveal clear lateral gradients along the transect, most evident in oxygen and associated hydrographic properties below and around the halocline. These differences are consistent with contrasting flow regimes within the Bornholm Basin: the southern part of the transect is directly influenced by the topographically guided inflow branch following the southern slope, while the central and northern parts are dominated by more weakly ventilated interior/recirculating waters. This contrast implies spatially varying entrainment and residence times along the transect and provides a mechanistic explanation for the observed spatial variability in oxygenation and bottom-water transformation during the 2023/24 event.
The T–S diagrams (Figures 2A–C) provide clear evidence for this transformation. The progressive curvature and expansion of the water mass distribution illustrate partial mixing between intruding and resident waters, rather than a distinct, unmixed inflow mass. Three intrusions with distinct salinity–temperature characteristics can be identified, superimposed on the resident deep water. Mixing lines drawn between the inflow end-members and the pre-inflow deep water show that the post-inflow distribution cannot be explained by lateral advection of a single dense mass. Instead, the curvature and broadening of the T–S space point to cumulative entrainment and transformation. The O2–S relationship (Figure 3) reinforces this view: oxygen concentrations after the inflow lie consistently above the mixing prediction, implying that additional oxygen was supplied vertically through entrainment and interfacial mixing, not solely imported laterally with saline inflow water.
The time series of bottom properties from the glider (Figure 7) illustrate this contrast directly. Bottom salinity increased only modestly (~0.5 PSU), whereas bottom oxygen rose by more than 3 mg L−¹. These observations highlight that oxygen is a much more sensitive tracer of inflow propagation and transformation than salinity in this event. The appearance of positive vertical oxygen gradients below the halocline after January 9 further supports this interpretation, indicating downward penetration of oxygen via both vertical mixing and advection of pre-oxygenated water entrained along density surfaces. Simultaneously, localized turbulence events were observed at the bottom boundary and near the halocline (Figure 8B), consistent with shear and internal wave activity enhancing entrainment. The associated vertical structure of density stratification and mixing intensity across the halocline and bottom boundary layer is illustrated in Figures 8A, D. The combination of bottom friction, interfacial mixing, and wave-driven turbulence contributed to the erosion of density gradients, shoaling of the halocline, and expansion of a denser, oxygenated, thermally homogenized bottom layer.
In the Gdansk Basin, an anomalously deep halocline (~90 m) was observed in February. Although temporally aligned with the broader inflow progression, its magnitude and depth suggest it resulted from internal basin dynamics—such as enhanced baroclinic adjustment or stratification-induced sinking. These processes are mentioned here only to outline possible mechanisms; their detailed evaluation will be presented in a separate publication.
Altogether, these halocline dynamics highlight the complex interplay between advection, stratification, and mixing during inflow propagation—processes that cannot be resolved by bulk hydrographic properties alone. High-resolution glider-based observations provide a unique perspective on these transitional structures and their evolution over space and time.
5.3 Ventilation efficiency and mixing
To quantify the relative roles of vertical and lateral transport in the observed oxygenation, we applied an observational oxygen inventory approach rather than a traditional box-model budget. Column-integrated oxygen inventories were compared with conservative estimates derived from salinity–oxygen mixing relationships, allowing the advective (inflow) and vertical (mixing) components to be separated directly from the measured profiles (Table 1). The results indicate that both processes contributed substantially to the oxygen renewal of the deep Bornholm Basin, but their relative importance changed over time. During the early inflow phase (Intrusions 1 and 2), the oxygen increase was primarily associated with the advection of oxygen-rich saline water, which accounted for approximately 55–60% of the total oxygen gain. In the subsequent continuation phase (Intrusion 3), vertical entrainment and diapycnal mixing became dominant, contributing about 70% of the total oxygen input while the advective share decreased to roughly one third. This transition reflects a shift from direct lateral import to turbulent redistribution as the inflow weakened and stratification re-established.
The O2–S relationships (Figure 3) and T–S characteristics (Figure 2) support this interpretation. During the main inflow, oxygen concentrations followed the conservative mixing lines between the pre-inflow and intrusion end-members, consistent with predominantly advective control. In February–March, however, oxygen values increasingly exceeded the conservative predictions, indicating a non-conservative oxygen anomaly maintained by lateral advection and along-isopycnal spreading of oxygen-rich water, while vertical mixing and entrainment redistributed this signal within the deep layer. The depth-dependent gradients in these plots show that oxygenation initially occurred near 70–85 m and later expanded both upward and downward through continued diapycnal exchange. Turbulence observations further corroborate this mechanism. The dissipation rate structure (Figure 8C) revealed enhanced ϵ both near the bottom boundary and just below the halocline, consistent with shear-driven mixing and interfacial entrainment. The sustained elevation of ϵ after the main inflow event indicates that vertical processes continued to redistribute oxygen long after the advective inflow had ceased.
Quantitatively, dense inflowing waters with salinities of 15.7–15.9 and temperatures of 7–8°C advected laterally into the basin, introducing oxygen primarily through near-bottom transport. The total oxygen inventory increases during the inflow phase reached approximately 2 × 10⁴ mg m−² relative to the pre-inflow baseline, of which about 40–45% represented non-conservative enrichment. This excess indicates active entrainment, as the dense inflow drew oxygen-rich intermediate water from 60–80 m depth, enhancing the oxygen supply beyond conservative expectations. After the main inflow subsided, continued diapycnal mixing and interfacial turbulence added a further ~4 × 10⁴ mg m−² of oxygen to the deep layer, confirming that vertical processes—rather than inflow magnitude—controlled the post-inflow ventilation of the Bornholm Basin.
On a regional scale, the 2023–2024 inflow resulted in rapid and extensive ventilation of the bottom waters across the southern Baltic Sea. In the Bornholm Basin, dissolved oxygen concentrations increased by approximately 3.5 mg L−¹ in the deepest layer, while in the Gdańsk Basin the increase exceeded 5 mg L−¹, reaching values unprecedented in recent decades (Rak et al., 2024). These changes demonstrate that oxygen-rich inflow water effectively ventilated long-resident, hypoxic bottom layers throughout the region. The present results are consistent with previous findings by Neumann et al. (2017), who emphasized that the overall strength of a major Baltic inflow (MBI) does not solely determine its oxygenation impact. Smaller or subsequent inflows, combined with post-inflow mixing, can play a disproportionately large role in sustaining deep-water ventilation. The glider-based observations presented here extend this conclusion by providing direct, high-resolution evidence that diapycnal mixing and entrainment following a strong inflow can deliver oxygen to deep basins more effectively than advection alone.
5.4 Ecological implications
The 2023/24 inflow event produced a basin-scale oxygenation of bottom waters that is rarely observed in the Southern Baltic. In the BB, the previously anoxic layer disappeared between February 15 and March 1, while in GB oxygen concentrations locally approached 15 mg L−¹ in the upper part of the deep-water mass (above ~75 m), representing the highest values observed in over a decade. These oxygen concentrations exceed both recent climatological norms and the impacts of previous MBIs, marking the event as a significant biogeochemical disturbance with the potential to temporarily reshape benthic conditions across the region.
Interestingly, the oxygenation signal was stronger and more widespread than the salinity signal, reflecting the cumulative effect of both vertical mixing and lateral advection of pre-oxygenated water during the inflow’s propagation (Figure 3). This decoupling shows that oxygen transport into the deep basins was facilitated not solely by bottom advection of dense saline water but also by entrainment and mixing along the halocline, enabling oxygen penetration into intermediate depths that were previously hypoxic. Consequently, the inflow’s ecological impact extended beyond the bottom boundary layer, reaching vertically higher layers and potentially increasing the habitable zone for benthic and demersal organisms.
This dramatic ventilation temporarily restored favorable conditions for benthic fauna and likely inhibited the production of hydrogen sulfide in bottom sediments. Such oxygenation allows for recolonization by macrofauna and reactivation of redox-sensitive processes in the sediments. However, the ecological benefit may prove transient. The long-term persistence of oxygenated conditions depends on several factors: the rate at which thermal stratification re-establishes in spring, the extent of organic matter loading to the seafloor, and whether further inflows or mixing events occur.
Previous studies have shown that MBI-induced oxygenation can be reversed within months due to oxygen consumption in sediments and the water column (Schmidt et al., 2021). The observation of positive oxygen vertical gradients below the halocline during this inflow event indicates that mixing and advection pathways allowed oxygen to reach depths previously isolated from surface sources. Yet, the limited increase in bottom (below 75 m) salinity (~0.5 PSU) suggests that the inflow’s salt mass was largely diluted or transformed upstream, reinforcing that oxygen renewal and salinity renewal can be decoupled.
This decoupling has ecological implications: while oxygenation improves benthic conditions, insufficient salinity renewal weakens stratification stability, making the system less susceptible to re-establishment of anoxia during subsequent stratified periods. Therefore, while inflows are necessary for deep-water renewal, they are not sufficient to maintain long-term benthic health without supportive biogeochemical and physical conditions.
Our findings highlight the importance of integrating physical and biogeochemical observations to assess ecosystem responses to episodic ventilation events. Sustained, turbulence-resolving monitoring efforts — including gliders, benthic sensors, and autonomous platforms — will be critical to tracking the evolution of bottom oxygen levels and to identifying thresholds beyond which anoxic conditions may return. Future modelling work should also explore how changing inflow frequency and intensity, combined with evolving nutrient and organic matter dynamics, will shape the resilience of deep Baltic ecosystems under a warming climate.
5.5 Limitations
While this study provides new insight into the dynamics of Baltic inflows and their associated mixing processes, several limitations should be acknowledged. First, estimates of the turbulent kinetic energy dissipation rate were derived indirectly using the Thorpe scale method applied to glider CTD profiles with an average vertical resolution of ~6 cm. Although the Thorpe method has been widely used in stratified environments and provides robust estimates when applied to overturning patches, it is inherently limited in its ability to resolve thin-layer turbulence and small-scale overturns — especially in weakly stratified conditions or near the noise floor of the instrument.
Recent studies have also demonstrated that the Thorpe-scale method can be reliably applied to glider-derived hydrographic data. Sheehan et al. (2023) showed that Thorpe-based dissipation estimates from glider CTD profiles agree well with independent microstructure temperature observations collected using a glider-mounted FP07 fast thermistor. Both methods captured the same mixing events and produced comparable ϵ values, confirming that Thorpe-scale performs well even on autonomous platform measurements. Similarly, Howatt et al. (2021) found that although the Thorpe method tends to overestimate ϵ in absolute magnitude, it does a better job of resolving spatiotemporal patterns of turbulent dissipation. These results suggest that Thorpe-based analyses are well suited for interpreting glider transects, where mapping the spatial structure of mixing is often more important than obtaining point-accurate microstructure values.
Second, the method assumes that the observed density inversions are caused by turbulent overturns and not by sensor noise, wave-induced tilting, or other non-turbulent displacements. While quality control procedures and vertical smoothing mitigate such effects, the possibility of misidentification of overturns cannot be fully excluded. Under such conditions, ϵ may be biased high. Direct microstructure observations by van der Lee and Umlauf (2011) in the Bornholm Basin showed shear-driven turbulence to dominate, with enhanced dissipation in the bottom boundary layer, at the surface, and in a ~15 m interior layer just below the halocline. Their reported magnitudes (ϵ ≈ 10−9–10−8 W kg−¹ in energetic layers, <10−9 W kg−¹ outside) agree well with our estimates, lending confidence to the Thorpe-based approach. Nevertheless, the method is indirect and typically uncertain within a factor of ~5 compared to direct microstructure measurements (Dillon, 1982; Ferron et al., 1998; Alford et al., 2006). A further limitation arises from the orientation of the glider transect and the glider’s sampling pattern. The transect in the Bornholm Basin was oriented from the basin center toward the northeast and thus was not perfectly aligned with the main inflow pathway, which extends from the northwest to the deepest part of the basin and further east toward the Slupsk Furrow (Figure 1). As a result, denser water masses propagating from the south may not have been fully captured. In addition, the glider’s sampling pattern implies that profiles are oblique rather than purely vertical. This may affect Thorpe-scale dissipation estimates, since apparent overturns can include contributions from horizontal density gradients or internal wave tilting. For this reason, we explicitly interpret the Thorpe-based dissipation rates as qualitative, order-of-magnitude estimates that are consistent with previous microstructure observations, rather than as exact values. While quality control and comparison with independent observations mitigate these effects, the results should be interpreted with this limitation in mind. Direct microstructure shear measurements will be essential in the future to cross-validate Thorpe-based estimates and to better quantify intermittency and fine-scale mixing during inflows.
6 Summary
The 2023/24 inflow introduced approximately 198 km³ of saline, oxygen-rich water into the Southern Baltic (Purkiani et al., 2024). Despite this large volume, the salinity signature in the Bornholm Basin remained modest, with bottom salinity increasing by only ~0.5 PSU. This limited anomaly suggests that much of the salt mass was diluted or transformed during its propagation from the Arkona Basin to the Bornholm Basin. In contrast, the oxygen signal was strong and widespread. Deep waters in the Bornholm Basin transitioned from hypoxic or anoxic conditions to well-ventilated states, with bottom oxygen concentrations exceeding 6 mg L−¹. Even larger increases occurred downstream in the Gdansk Basin, where oxygen reached nearly 15 mg L−¹. These changes demonstrate that oxygen transport during the inflow was more effective than salinity renewal, reflecting cumulative entrainment and vertical mixing beneath the halocline in addition to advection of inflowing water.
The oxygen budget analysis further shows that ventilation in the Bornholm Basin occurred in two stages. During the initial inflow (January 2024), advective import of oxygenated saline water accounted for roughly 55–60% of the total oxygen gain. In the subsequent continuation phase (February–March), vertical entrainment and diapycnal mixing became dominant, contributing about 70% of the total oxygen input. This demonstrates that post-inflow turbulent mixing, rather than the magnitude of the advective inflow alone, governed the overall efficiency of deep-water ventilation.
Glider observations revealed that the inflow advanced as a bottom-intensified gravity current and as under-halocline intrusions, accompanied by interfacial mixing with resident waters. Elevated dissipation rates near the bottom boundary and halocline underscored the role of shear-driven turbulence in modifying stratification. These processes led to halocline deepening followed by shoaling, expansion of the oxygenated bottom layer, and transformation of the resident water mass into a denser, more homogenized state.
The ecological consequences were immediate: previously anoxic bottom layers were ventilated across large parts of the Southern Baltic, temporarily restoring favorable conditions for benthic fauna. However, the persistence of this oxygenation will depend on spring stratification, sediment oxygen demand, and the occurrence of subsequent inflows.
While turbulence estimates in this study were derived from indirect Thorpe-scale analysis and therefore carry uncertainties, their spatial and temporal patterns are consistent with previous microstructure observations in the Bornholm Basin. Overall, our study underscores the importance of sustained, high-resolution observations—including glider-based monitoring and integrated biogeochemical measurements—for understanding episodic ventilation processes in stratified semi-enclosed seas, and for predicting ecosystem responses under evolving climate conditions.
Statements
Data availability statement
Publicly available datasets were analyzed in this study. This data can be found here: Ship-based hydrographic and dissolved oxygen data from Southern Baltic cruises conducted in December 2023 and February 2024 are available from the Institute of Oceanology of the Polish Academy of Sciences (IOPAN): Hydrographic and oxygen data from Southern Baltic cruises during the 2023/24 inflow event [Dataset], https://doi.org/10.48457/IOPAN.2025.488. Ocean glider data from the Bornholm Basin collected during the 2023/24 Baltic inflow are publicly available from Zenodo: Voice Of The Ocean Foundation, Bulczak, A., & Rak, D. (2025), Gliders in the Bornholm Basin during the Baltic inflow of 2023/24 [Dataset], https://doi.org/10.5281/zenodo.17292532.
Author contributions
AB: Conceptualization, Funding acquisition, Investigation, Methodology, Visualization, Writing – original draft, Writing – review & editing. DR: Conceptualization, Funding acquisition, Investigation, Methodology, Visualization, Writing – original draft, Writing – review & editing.
Funding
The author(s) declared that financial support was received for this work and/or its publication. This research was supported by the following projects: “Turbulent mixing in the SF (Southern Baltic)” funded by the National Science Centre (NCN) Poland [2019/33/B/ST10/02189] and ARGO Polska [grant no. 2022/WK/04].
Conflict of interest
The author(s) declared that this work was conducted in the absence of any commercial or financial relationships that could be construed as a potential conflict of interest.
Generative AI statement
The author(s) declared that Generative AI was not used in the creation of this manuscript.
Any alternative text (alt text) provided alongside figures in this article has been generated by Frontierswith the support of artificial intelligence and reasonable efforts have been made to ensure accuracy, including review by the authors wherever possible. If you identify any issues, please contact us.
Publisher’s note
All claims expressed in this article are solely those of the authors and do not necessarily represent those of their affiliated organizations, or those of the publisher, the editors and the reviewers. Any product that may be evaluated in this article, or claim that may be made by its manufacturer, is not guaranteed or endorsed by the publisher.
References
1
Alford M. H. Gregg M. C. Merrifield M. A. (2006). Structure, propagation, and mixing of energetic baroclinic tides in Mamala Bay, Oahu, Hawaii. J. Phys. Oceanogr.36, 997–1018. doi: 10.1175/JPO2877.1
2
Arneborg L. Erlandsson C. P. Liljebladh B. Stigebrandt A. (2004). The rate of inflow and mixing during deep-water renewal in a sill fjord. Limnol. Oceanogr.49, 768–777. doi: 10.4319/lo.2004.49.3.0768
3
Arneborg L. Fiekas V. Umlauf L. Burchard H. (2007). Gravity current dynamics and entrainment: A process study based on observations in the Arkona Basin. J. Phys. Oceanogr.37, 2094–2113. doi: 10.1175/JPO3110.1
4
Bulczak A. I. Nowak K. Jakacki J. Muzyka M. Rak D. Walczowski W. (2024). Seasonal variability and long-term winter shoaling of the upper mixed layer in the southern Baltic Sea. Cont. Shelf Res.276, 105232. doi: 10.1016/j.csr.2024.105232
5
Burchard H. Janssen F. Bolding K. Umlauf L. Rennau H. (2009). Model simulations of dense bottom currents in the Western Baltic Sea. Cont. Shelf Res.29, 205–220. doi: 10.1016/j.csr.2007.09.010
6
Dahlin H. Fonselius S. Sjöberg B. (1993). The changes of the hydrographic conditions in the Baltic Proper due to 1993 inflow to the Baltic Sea, ICES Statutory Meeting, Dublin, ICES C.M. 1993/C:58, 14 pp.
7
de Boor C. (1978). A Practical Guide to Splines Vol. 27 (New York: Springer-Verlag). doi: 10.2307/2006241
8
Dillon T. M. (1982). Vertical overturns: A comparison of Thorpe and Ozmidov length scales. J. Geophys. Res.: Oceans87, 9601–9613. doi: 10.1029/JC087iC12p09601
9
Ferron B. Mercier H. Speer K. Gargett A. Polzin K. (1998). Mixing in the romanche fracture zone. J. Phys. Oceanogr.28, 1929–1945. doi: 10.1175/1520-0485(1998)028<1929:MITRFZ>2.0.CO;2
10
Holtermann P. L. Prien R. Naumann M. Mohrholz V. Umlauf L. (2017). Deep-water dynamics and mixing processes during a major inflow event in the central Baltic Sea. J. Geophys. Res.: Oceans122, 6648–6667. doi: 10.1002/2017JC013050
11
Howatt T. Waterman S. Ross T. (2021). On using the finescale parameterisation and Thorpe scales to estimate turbulence from glider data. J. Atmos. Ocean. Tech.38, 1187–1204. doi: 10.1175/JTECH-D-20-0144.1
12
IO PAN (2025). Hydrographic and oxygen data from Southern Baltic cruises (December 2023 and February 2024) during the 2023/24 inflow event (Sopot, Poland: Institute of Oceanology, Polish Academy of Sciences). doi: 10.48457/IOPAN.2025.488
13
Jakobsen F. (1995). The major inflow to the Baltic Sea during January 1993. J. Mar. Syst.6, 227–240. doi: 10.1016/0924-7963(94)00025-7
14
Kuzmina N. P. Rudels B. Stipa T. Zhurbas V. M. (2005). The structure and driving mechanisms of the Baltic intrusions. J. Phys. Oceanogr.35, 1120–1137. doi: 10.1175/JPO2749.1
15
Lass H. U. Mohrholz V. (2003). On dynamics and mixing of inflowing saltwater in the Arkona Sea. J. Geophys. Res.: Oceans108, 3042. doi: 10.1029/2002JC001465
16
Liljebladh B. Stigebrandt A. (1996). Observations of the deepwater flow into the Baltic Sea. J. Geophys. Res.: Oceans101, 8895–8911. doi: 10.1029/95JC03303
17
Marshall C. Dorrell R. Keevil G. M. Peakall J. Tobias S. M. (2021). Observations of large-scale coherent structures in gravity currents: implications for flow dynamics. Exp. Fluids62, 120. doi: 10.1007/s00348-021-03217-4
18
Matthäus W. Franck H. (1992). Characteristics of major Baltic inflows—a statistical analysis. Cont. Shelf Res.12, 1375–1400. doi: 10.1016/0278-4343(92)90060-W
19
Matthäus W. Lass H.-U. (1995). The recent salt inflow into the Baltic Sea. J. Phys. Oceanogr.25, 280–297. doi: 10.1175/1520-0485(1995)025<0280:TRSIIT>2.0.CO;2
20
Mohrholz V. (2018). Major Baltic inflow statistics – revised. Front. Mar. Sci.5. doi: 10.3389/fmars.2018.00384
21
Mohrholz V. Naumann M. Nausch G. Krüger S. Gräwe U. (2015). Fresh oxygen for the Baltic Sea – An exceptional saline inflow after a decade of stagnation. J. Mar. Syst.53, , 152–166. doi: 10.1016/j.jmarsys.2015.03.005
22
Neumann T. Radtke H. Seifert T. (2017). On the importance of Major Baltic Inflows for oxygenation of the central Baltic Sea. J. Geophys. Res.: Oceans122, 1090–1101. doi: 10.1002/2016JC012525
23
Piechura J. Beszczynska-Moeller A. (2004). Inflow waters in the deep regions of the southern Baltic Sea—Transport and transformations. Oceanologia46, 113–141.
24
Purkiani K. Jochumsen K. Fischer J. (2024). Observation of a moderate major Baltic sea inflow in December 2023. Sci. Rep14, 16577. doi: 10.1038/s41598-024-67328-8
25
Rak D. (2016). The inflow in the Baltic Proper as recorded in January–February 2015. Oceanologia58, 241–247. doi: 10.1016/j.oceano.2016.04.001
26
Rak D. Przyborska A. Bulczak A. I. Dzierzbicka-Głowacka L. (2024). Energy fluxes and vertical heat transfer in the Southern Baltic Sea. Front. Mar. Sci.11. doi: 10.3389/fmars.2024.1365759
27
Schmidt B. Wodzinowski T. Bulczak A. I. (2021). Long-term variability of near-bottom oxygen, temperature, and salinity in the Southern Baltic. J. Mar. Syst.213, 103462. doi: 10.1016/j.jmarsys.2020.103462
28
Scotti A. (2015). Biases in Thorpe-scale estimates of turbulence dissipation. Part II: energetics arguments and turbulence simulations. J. Phys. Oceanogr.45, 2522–2543. doi: 10.1175/JPO-D-14-0092.1
29
Sheehan P. M. F. Damerell G. M. Leadbitter P. J. Heywood K. J. Hall R. A. (2023). Turbulent kinetic energy dissipation rate and associated fluxes in the western tropical Atlantic estimated from ocean glider observations. Ocean Sci.19, 77–92. doi: 10.5194/os-19-77-2023
30
Thorpe S. A. (1977). Turbulence and mixing in a Scottish loch. Philos. Trans. R. Soc. London Ser. A Math. Phys. Sci.286, 125–181. doi: 10.1098/rsta.1977.0112
31
Umlauf L. Arneborg L. Burchard H. Fiekas V. Lass H. Mohrholz V. et al . (2007). Transverse structure of turbulence in a rotating gravity current. Geophys. Res. Lett.34, L07603. doi: 10.1029/2007GL029521
32
Umlauf L. Arneborg L. Hofmeister R. Burchard H. (2010). Entrainment in shallow rotating gravity currents: A modeling study. J. Phys. Oceanogr.40, 1819–1834. doi: 10.1175/2010JPO4367.1
33
van der Lee E. M. Umlauf L. (2011). Internal wave mixing in the Baltic Sea: Near-inertial waves in the absence of tides. J. Geophys. Res.116, C10016. doi: 10.1029/2011JC007072
34
Voice Of The Ocean Foundation Bulczak A. Rak D. (2025). Gliders in the Bornholm Basin during the Baltic inflow of 2023/24 (Stockholm, Sweden: Zenodo). doi: 10.5281/zenodo.17292532
35
Wells M. G. Nadarajah P. (2009). The intrusion depth of density currents flowing into stratified water bodies. J. Phys. Oceanogr.39, 1935–1947. doi: 10.1175/2009JPO4022.1
Summary
Keywords
Baltic Sea, inflow, ocean glider observations, oxygenation, turbulent mixing
Citation
Bulczak AI and Rak D (2026) Propagation and mixing of the 2023/24 inflow: impacts on stratification and deep-water ventilation in the Southern Baltic Sea. Front. Mar. Sci. 13:1629491. doi: 10.3389/fmars.2026.1629491
Received
16 May 2025
Revised
19 January 2026
Accepted
20 January 2026
Published
12 February 2026
Volume
13 - 2026
Edited by
Benjamin Rabe, Alfred Wegener Institute Helmholtz Centre for Polar and Marine Research (AWI), Germany
Reviewed by
Markus Meier, Leibniz Institute for Baltic Sea Research (LG), Germany
Lars Arneborg, Swedish Meteorological and Hydrological Institute, Sweden
Updates
Copyright
© 2026 Bulczak and Rak.
This is an open-access article distributed under the terms of the Creative Commons Attribution License (CC BY). The use, distribution or reproduction in other forums is permitted, provided the original author(s) and the copyright owner(s) are credited and that the original publication in this journal is cited, in accordance with accepted academic practice. No use, distribution or reproduction is permitted which does not comply with these terms.
*Correspondence: Daniel Rak, rak@iopan.pl
†These authors have contributed equally to this work
Disclaimer
All claims expressed in this article are solely those of the authors and do not necessarily represent those of their affiliated organizations, or those of the publisher, the editors and the reviewers. Any product that may be evaluated in this article or claim that may be made by its manufacturer is not guaranteed or endorsed by the publisher.