Abstract
Mangrove forests in southern China’s Gaoqiao Mangrove National Nature Reserve (Guangdong–Guangxi border) have undergone significant decline followed by partial recovery, driven by human activities and conservation efforts. Traditional monitoring methods struggle to capture their complex spatiotemporal dynamics. This study develops a practical two-stage deep learning framework: an enhanced U-Net with Squeeze-and-Excitation (SE) and Convolutional Block Attention Module (CBAM) first extracts high-quality annual mangrove masks from multi-temporal Landsat imagery (1993–2023), achieving IoU = 0.815 and F1-score = 0.928. These masks are then used for spatiotemporal forecasting, with U-Net–ConvLSTM recommended as the primary architecture due to its excellent balance of accuracy, simplicity, and computational efficiency. An optional asymmetric Ecological Constraint Loss (ECOLOSS) can be added to form the ConvLSTM+ECOLOSS variant, providing marginal additional accuracy (IoU = 0.793 vs. 0.787, MAE = 6.70% vs. 6.83%) on the test period (2019–2023) by acting mainly as an ecological safeguard against unrealistic long-term runaway trends. Forecasts for 2024–2026 indicate continued slow recovery under current management. The U-Net–ConvLSTM pipeline offers a transparent and efficient tool for operational mangrove monitoring and conservation planning in subtropical China.
1 Introduction
Mangrove forests, which thrive in tropical and subtropical intertidal zones, are critical ecosystems with substantial ecological and societal importance (Kathiresan and Bingham, 2001). They play a pivotal role in coastal protection by stabilizing shorelines and reducing erosion through sediment retention, while also serving as highly efficient carbon sinks, sequestering carbon at rates three to five times greater than tropical rainforests (Lugo and Snedaker, 1974; Alongi, 2014; Jones et al., 2020). Furthermore, mangroves enhance biodiversity by providing habitats for marine and avian species along migratory routes, including the East Asian–Australasian Flyway, and they support coastal communities by supplying resources for traditional remedies, dyes, and cultural practices (Romañach et al., 2018). Despite their importance, global mangrove extent has declined by more than 35% due to aquaculture expansion, urban development, and pollution (Goldberg et al., 2020; Heck et al., 2024; Turschwell et al., 2020). Time-series forecasting is particularly crucial for predicting future mangrove dynamics, enabling proactive restoration and sustainable management strategies amid persistent environmental pressures (Jia et al., 2018; Ellison et al., 2020).
Remote sensing has become the primary tool for large-scale, long-term mangrove monitoring due to mangroves’ distinct spectral signatures: high reflectance in the near-infrared (NIR) band from dense vegetation and strong chlorophyll absorption in the red band, resulting in elevated Normalized Difference Vegetation Index (NDVI > 0.7) (Rouse, 1974) and Modified Normalized Difference Water Index (mNDWI; Xu, 2006) values that effectively distinguish mangroves from water and mudflats. Multi-temporal Landsat imagery (30 m resolution, 16-day revisit) further captures tidal inundation cycles and phenological changes, with essential preprocessing steps including atmospheric correction to surface reflectance (Level-2 products), cloud/shadow masking, precise co-registration (RMSE < 0.5 pixel), topographic correction for tidal flats, and calculation of spectral indices (NDVI, NDWI, mNDWI) to enhance mangrove signals while reducing noise from tides and aerosols (Chen et al., 2017; Kuenzer et al., 2011). Although these conventional remote-sensing approaches—such as NDVI thresholding, maximum likelihood classification, random forests, and support vector machines—remain widely used and typically achieve classification accuracies of 82–88% (Shrestha et al., 2019; Cayetano et al., 2023), they have inherent limitations. Their reliance on per-pixel spectral features and hand-crafted indices struggles with Landsat’s 30 m resolution in heterogeneous coastal zones, often producing blurred boundaries and Intersection over Union (IoU) values below 0.70. Moreover, traditional dynamic prediction models (e.g., Markov chains or simple regression of historical areas) ignore spatiotemporal dependencies and biological constraints, frequently yielding ecologically implausible forecasts, such as abrupt >15% annual loss or unrealistic rapid expansion.
Recent advances have addressed some of these limitations by leveraging higher-resolution Sentinel-2 imagery and more sophisticated multi-temporal analyses. Notably, a 10-m global mangrove map for 2020 (HGMF_2020) was developed using object-based image analysis and random forest classification, revealing a total extent of 145,068 km2 and providing insights into regional conservation status and resistance to coastal hazards (Jia et al., 2023). Similarly, in West Africa, a 10-m resolution approach optimized for inter-annual monitoring achieved high accuracy (>97% for land cover, ~85% for zonation stability) in mapping mangrove zonation in the Saloum Delta through object-based time-series analysis and harmonic regression of vegetation fraction (Lombard et al., 2023). Beyond mangroves, coarser MODIS data have been used for broader vegetation trend detection; for example, a 23-year analysis in Italy (2001–2023) applied non-parametric tests to identify significant grassland declines, woodland increases, and wildfire-precipitation correlations (Ghaderpour et al., 2025). These studies highlight the benefits of improved spatial resolution and multi-temporal processing for detailed mapping and historical/short-term trend detection. Nevertheless, they predominantly provide static snapshots, inter-annual monitoring, or retrospective trend analysis, lacking long-term time-series forecasting with biologically constrained spatiotemporal modeling—gaps that our deep learning framework addresses using the multi-decadal Landsat data record and extended future predictions.
The primary objective of this study is to develop and validate a practical end-to-end deep learning framework for high-precision mangrove extraction and biologically plausible long-term forecasting. The framework consists of two stages: (1) an enhanced U-Net incorporating Squeeze-and-Excitation (SE) and Convolutional Block Attention Module (CBAM) to generate accurate annual mangrove masks from multi-decadal Landsat imagery (1993–2023), and (2) U-Net–ConvLSTM as the core forecasting architecture, which effectively integrates U-Net’s rich spatial features with ConvLSTM’s temporal modeling capabilities, achieving an optimal balance of accuracy, simplicity, and computational efficiency. To further constrain unrealistic long-term growth rates, we introduce an optional asymmetric Ecological Constraint Loss (ECOLOSS) that penalizes annual changes exceeding the regionally observed range of approximately –5% to =10%. The framework is applied to the Gaoqiao Mangrove National Nature Reserve (Guangdong–Guangxi border), with predictions extended to 2026 to inform restoration and sustainable management in subtropical coastal zones, particularly in southern China.
2 Materials and methods
2.1 Study area
This study focuses on the Gaoqiao Mangrove National Nature Reserve, located on the northeastern coast of the Beibu Gulf in Guangdong Province, China (21°35’N, 110°20’E), encompassing Gaoqiao Town, Lianjiang City, and adjacent buffer zones (Figure 1). As the northernmost mangrove distribution in mainland China, the reserve is a globally significant site for mid-latitude mangrove ecosystems (Kathiresan and Bingham, 2001). It is the largest contiguous mangrove protected area along China’s continental coastline, supporting exceptional biodiversity, including 26 native species (e.g., Bruguiera gymnorrhiza, Kandelia obovata, Rhizophora stylosa), five introduced species (e.g., Sonneratia apetala), and diverse aquatic taxa (comprising 97 phytoplankton and 159 benthic diatom species) (Jia et al., 2018; Liu et al., 2024). Beyond its ecological significance, the Gaoqiao mangrove ecosystem provides substantial economic value, contributing to local livelihoods through fisheries, aquaculture, and ecotourism, with mangroves globally estimated to support economic benefits ranging from $2,000 to $9,000 per hectare annually (Salem and Mercer, 2012; Malik et al., 2015). The region exhibits a southern subtropical maritime monsoon climate, with an average annual temperature of 23.1°C, precipitation of 1600–1900 mm, 2100 sunshine hours, and an average of 2.3 typhoons annually during summer and autumn (Jia et al., 2018).
Figure 1
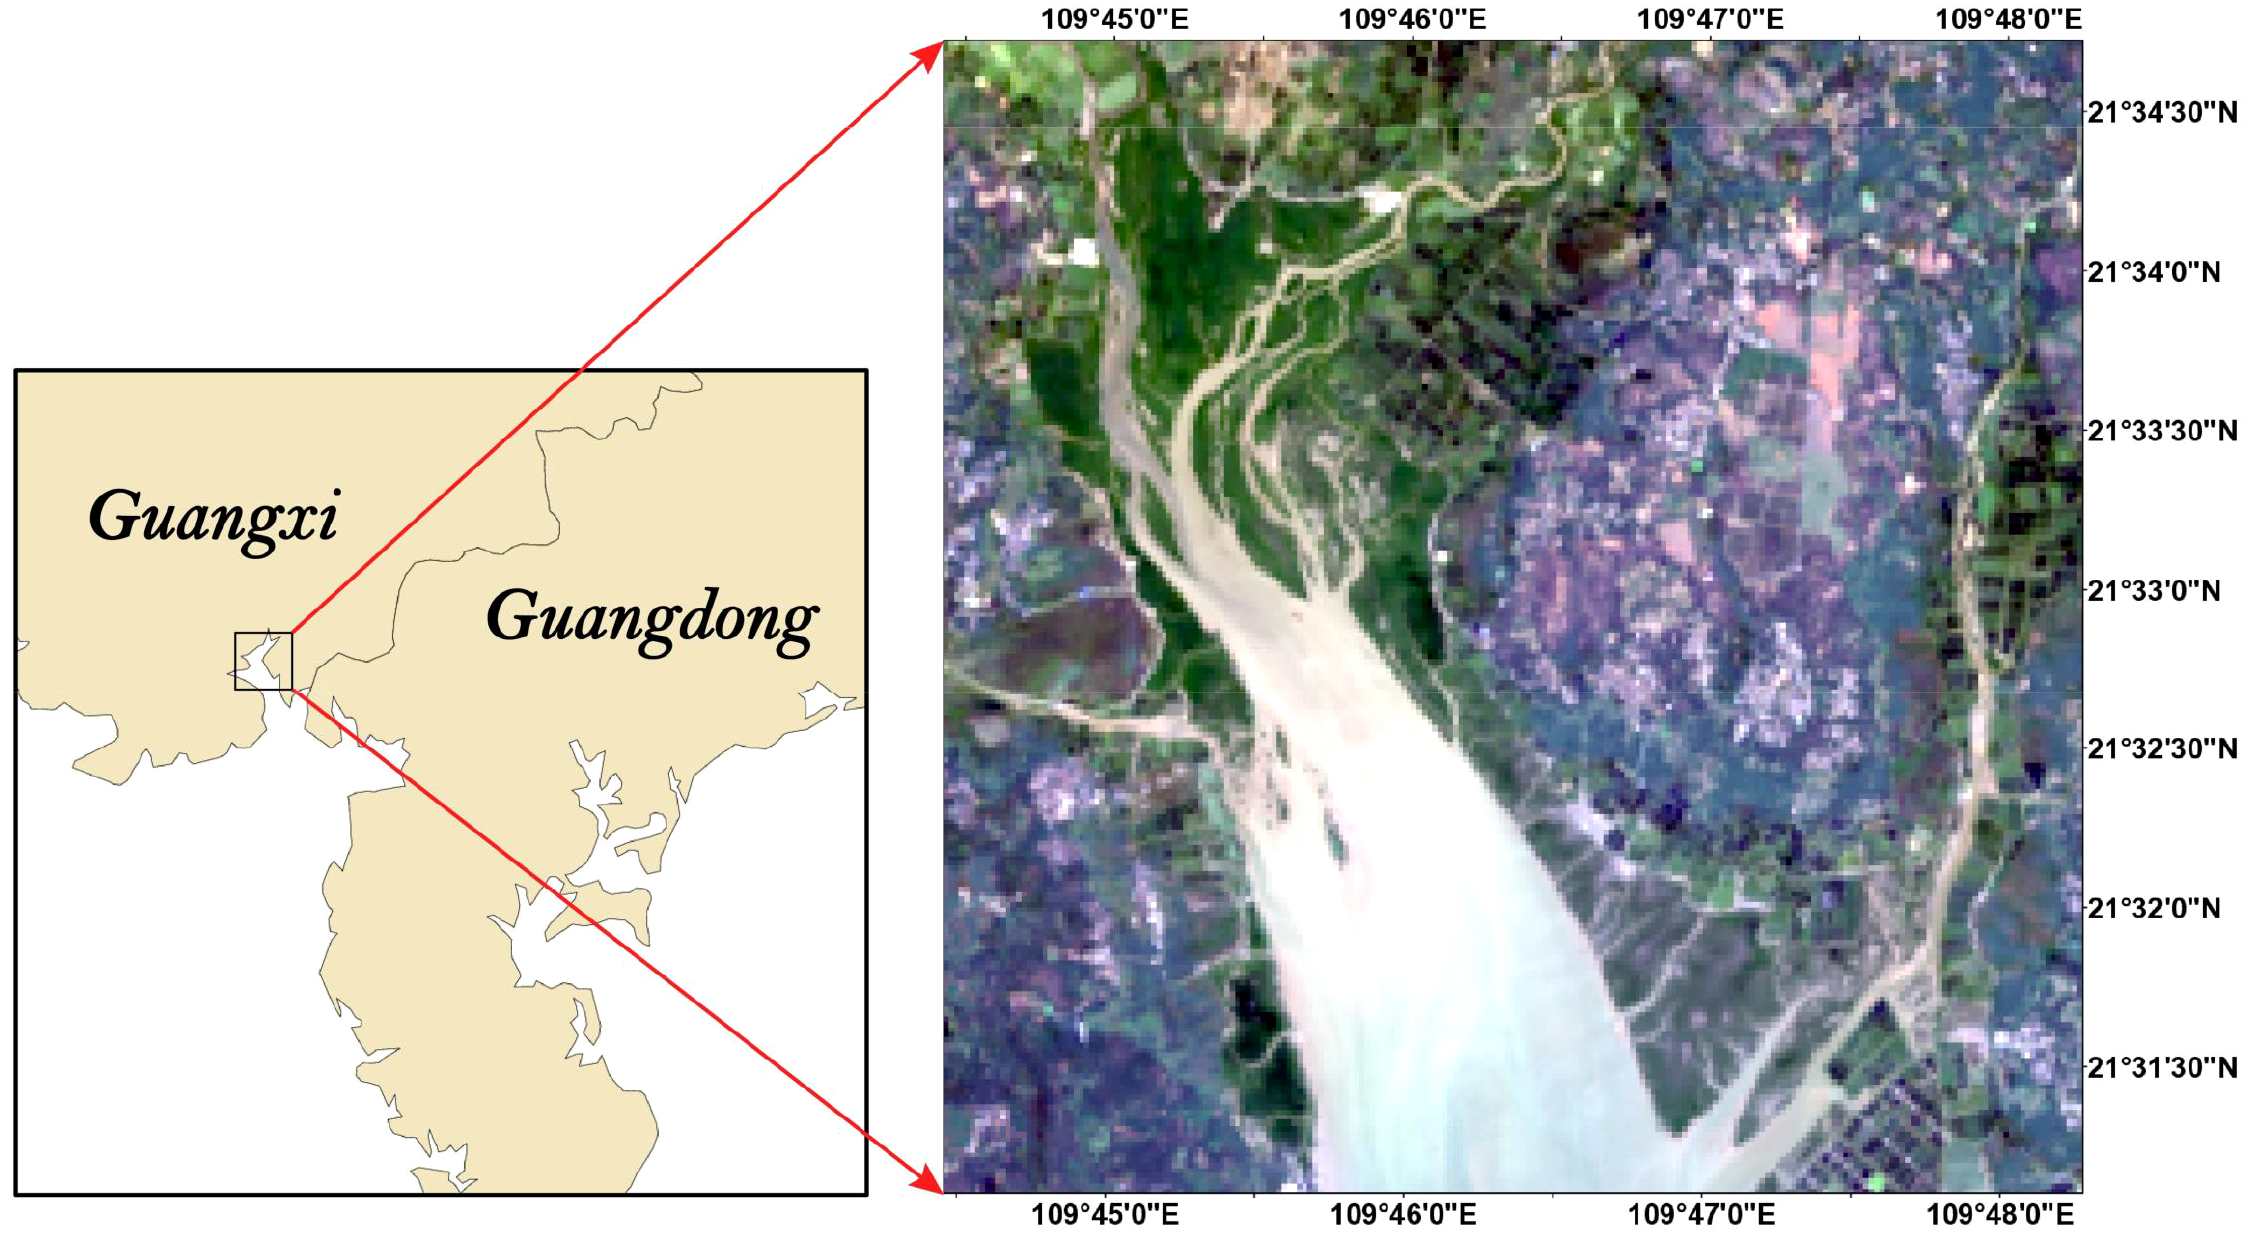
Geographical location of the Gaoqiao Mangrove National Nature Reserve in Guangdong Province, China, showing the core area and buffer zones.
2.2 Data acquisition and preprocessing
This study utilized multi-temporal Landsat surface reflectance products (Level-2) acquired from the United States Geological Survey (USGS) EarthExplorer platform to examine the spatiotemporal dynamics of the Gaoqiao Mangrove National Nature Reserve (21°33’N, 109°44’E), located at the Guangdong–Guangxi border, China, from 1993 to 2023. The dataset consists of Landsat 5 Thematic Mapper (TM, 1993–2012) and Landsat 8 Operational Land Imager (OLI, 2013–2023) images, providing a consistent 30 m spatial resolution. Only the three visible bands (blue, green, red) were used as input to the deep learning models.
A total of 127 scenes were initially available for the study period. After excluding 16 scenes with excessive cloud cover or sensor artifacts, 111 high-quality scenes were retained to ensure complete annual coverage across the 31-year record (Table 1).
Table 1
| Period | Sensor | Initial images | Selected images | Notes |
|---|---|---|---|---|
| 1993–2012 | Landsat 5 TM | 75 | 68 | Cloud cover<10% |
| 2013–2023 | Landsat 8 OLI | 52 | 43 | Cloud cover<10% |
| Total | — | 127 | 111 | — |
Details of Landsat imagery used in this study.
For independent validation of the 2023 mangrove extraction, high-resolution drone imagery (3 cm/pixel, RGB + NIR bands) was acquired on 7 November 2023 using a DJI Matrice M300 platform, covering 4.35 km² of the reserve (Figure 2). This drone survey provided ground-truth reference for confusion matrix analysis (Table 2).
Figure 2
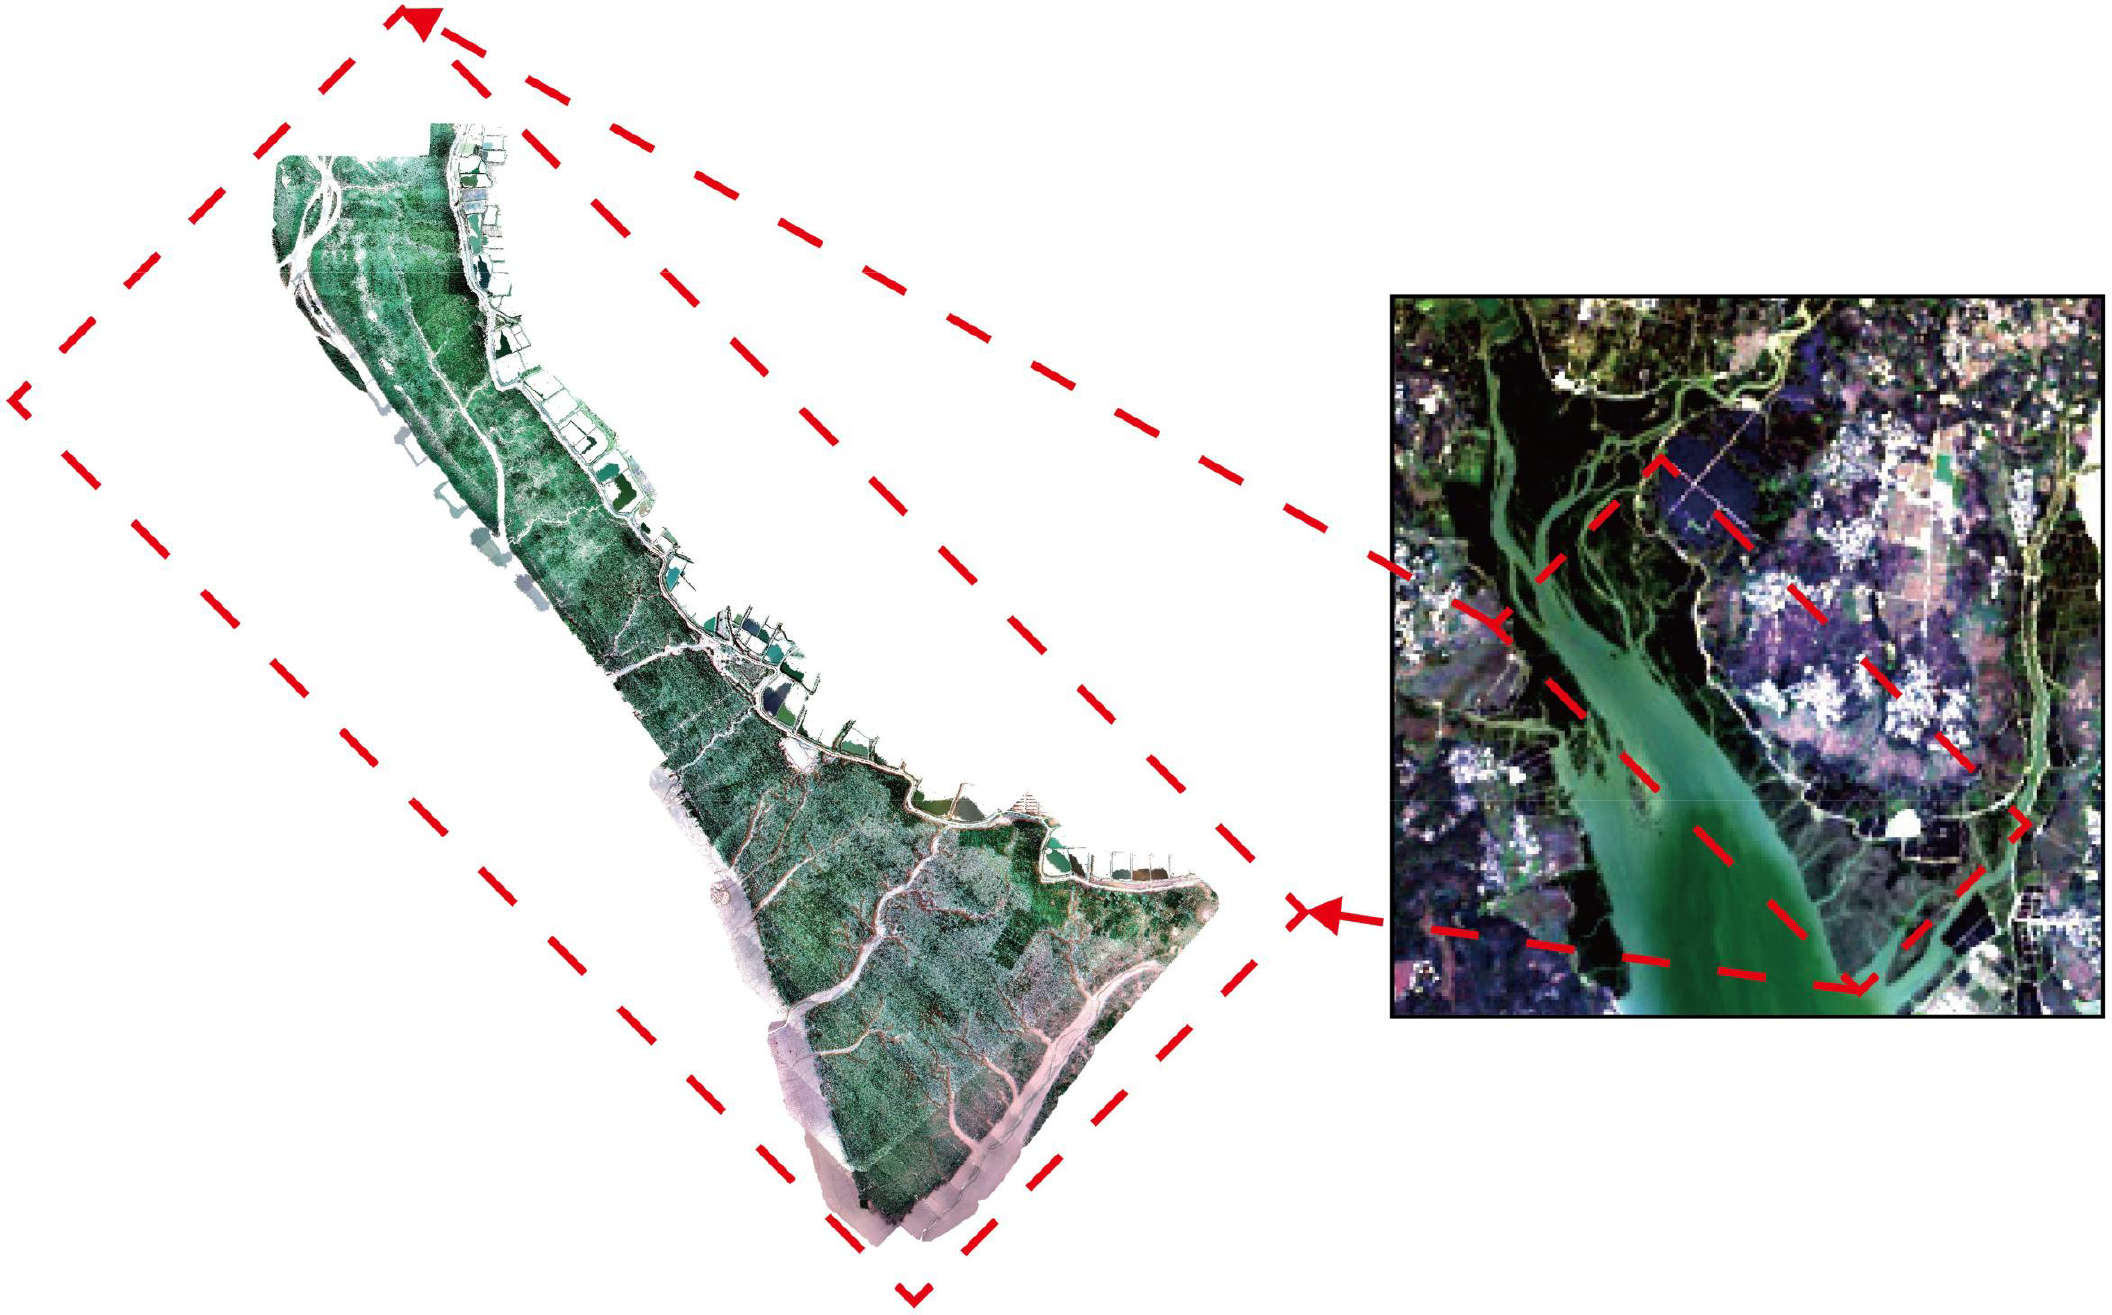
Distribution of drone imagery coverage (4.35 km²) within the Gaoqiao Mangrove National Nature Reserve, overlaid on a Landsat 8 image (2023). Red areas indicate drone coverage.
Table 2
| Methods | Classified | Ground-Truth | Summary | |||
|---|---|---|---|---|---|---|
| Mangrove | Non-Mangrove | Total | PA | UA | ||
| Unet+SE+CBAM | Mangrove | 325 | 5 | 330 | 98.78% | 98.48% |
| Non-Mangrove | 4 | 285 | 289 | 98.28% | 98.62% | |
| Total | 329 | 290 | 619 | 98.53% | 98.55% | |
| OA = 98.55% | Kappa = 0.9708 | |||||
| NDVI | Mangrove | 288 | 41 | 329 | 87.54% | 96.97% |
| Non-Mangrove | 9 | 281 | 290 | 96.90% | 87.27% | |
| Total | 297 | 322 | 619 | 92.22% | 92.12% | |
| OA = 91.92% | Kappa = 0.8388 | |||||
Accuracy assessment of classification results.
All Landsat scenes were clipped to the reserve boundary plus a 2 km buffer and co-registered to a common UTM Zone 49N grid (RMSE < 0.5 pixel) using ENVI 5.6 and Python scripts.
The workflow adopts a two-stage design:
Stage 1 – Mangrove extraction (spatial segmentation task)
From the 111 preprocessed annual scenes spanning the entire study period (1993–2023), 1280 overlapping patches (256 × 256 pixels, 50% overlap) with corresponding manually delineated binary mangrove masks were generated. This multi-temporal pooling strategy ensures the model captures diverse phenological and tidal conditions. Extensive online data augmentation (random rotation, horizontal/vertical flipping, brightness ±25%, contrast adjustment) was applied during training. The 1280 patches were randomly shuffled and split in a 7:2:1 ratio:
-
Training set: 70% (896 patches)
-
Validation set: 20% (256 patches)
-
Test set: 10% (128 patches)
Random splitting is appropriate for this stage because the segmentation model processes each patch independently without temporal context.
Stage 2 – Spatiotemporal forecasting (temporal prediction task)
The trained U-Net+SE+CBAM model was applied to all 111 full scenes (1993–2023), producing one binary mangrove mask per year (31 annual masks total). These masks were chronologically divided as follows:
-
Training period: 1993–2015 (23 years)
-
Validation period: 2016–2018 (3 years)
-
Test period: 2019–2023 (5 years)
This strict temporal split prevents future information leakage. Forecasting models use sliding windows of five consecutive annual masks to predict the subsequent year’s mask, with three-year forecasts (2024–2026) generated recursively from the 2019–2023 window.
2.3 Mangrove extraction with U-Net+SE+CBAM
The extraction of mangrove distributions in this study relies on an enhanced U-Net model integrated with Squeeze-and-Excitation (SE) and Convolutional Block Attention Module (CBAM) to process Landsat imagery (1993–2023) from Landsat 5 TM and Landsat 8 OLI. The U-Net framework employs an encoder-decoder architecture for semantic segmentation, addressing the challenge of low spatial resolution (30 m) that often blurs mangrove boundaries and causes misclassification in complex coastal environments. The encoder downsamples the input through convolutional and pooling layers to extract multi-scale features, such as mangrove patches and tidal zones, while the decoder, supported by skip connections, upsamples these features to restore spatial detail, ensuring precise delineation despite resolution limitations.
To enhance feature discrimination, the SE module targets spectral noise interference, a common issue in coastal regions where reflections from water bodies or sediments obscure vegetation signals. SE applies global average pooling to compress spatial dimensions into a channel descriptor, followed by a fully connected layer and sigmoid activation to recalibrate feature responses, prioritizing informative bands (e.g., red and near-infrared) for mangrove health while suppressing non-vegetation noise. This refinement boosts segmentation accuracy, contributing to a notable performance uplift.
Complementing SE, the CBAM module improves edge detection accuracy, tackling challenges from tidal influences and adjacency to water bodies. CBAM uses a two-stage approach: a channel attention module weights feature importance to enhance mangrove signals and suppress tidal noise, while a spatial attention module highlights pixel-level differences to refine mangrove edges, reducing misclassification in dynamic intertidal zones. This dual mechanism enhances the model’s robustness across varying conditions.
2.4 Spatiotemporal forecasting models
Traditional approaches to mangrove area forecasting have relied on statistical models (e.g., Markov chains, ARIMA) or simple regression of historically mapped areas, which typically ignore spatial patterns and biological constraints, leading to unrealistic long-term projections in dynamic coastal systems. This study addresses these limitations through a two-stage deep learning pipeline: high-quality annual binary masks (1993–2023) are first generated by the U-Net+SE+CBAM segmentation model (Section 2.3), and these masks are then used as input for sequence-based forecasting. The primary recommended architecture is U-Net–ConvLSTM, which effectively combines U-Net’s precise spatial feature extraction with ConvLSTM’s efficient temporal modelling, offering an excellent balance of accuracy, simplicity, and computational efficiency. To explore whether additional ecological regularization can further constrain unrealistic long-term trends, an optional asymmetric Ecological Constraint Loss (ECOLOSS) is introduced, yielding the ConvLSTM+ECOLOSS variant that penalizes annual growth rates outside the regionally observed range of approximately –5% to +10% (Section 2.4.2). Performance of U-Net–ConvLSTM and ConvLSTM+ECOLOSS, along with five additional baselines (standalone ConvLSTM, ConvLSTM+Self-Attention, 3DCNN, LSTM, and RNN), is evaluated below.
2.4.1 UNet-ConvLSTM Model (primary recommended)
The U-Net–ConvLSTM model combines the U-Net encoder-decoder architecture with ConvLSTM layers for spatiotemporal forecasting of mangrove distributions. The U-Net component generates detailed spatial feature maps from the annual binary masks, which are then processed by two ConvLSTM layers (64 hidden units each) using a 5-year sliding window ([5, 256, 256, 1]). The model outputs the predicted mangrove mask for the subsequent year, with area calculated by multiplying mangrove pixels by 900 m² (30 m × 30 m Landsat pixel area). This architecture effectively leverages U-Net’s high spatial precision while enabling ConvLSTM to capture temporal dependencies, making it the recommended choice for most practical applications due to its strong performance, simplicity, and computational efficiency (training completed on an NVIDIA 4090D GPU with 16 GB memory). The model structure is illustrated in Figure 3.
Figure 3
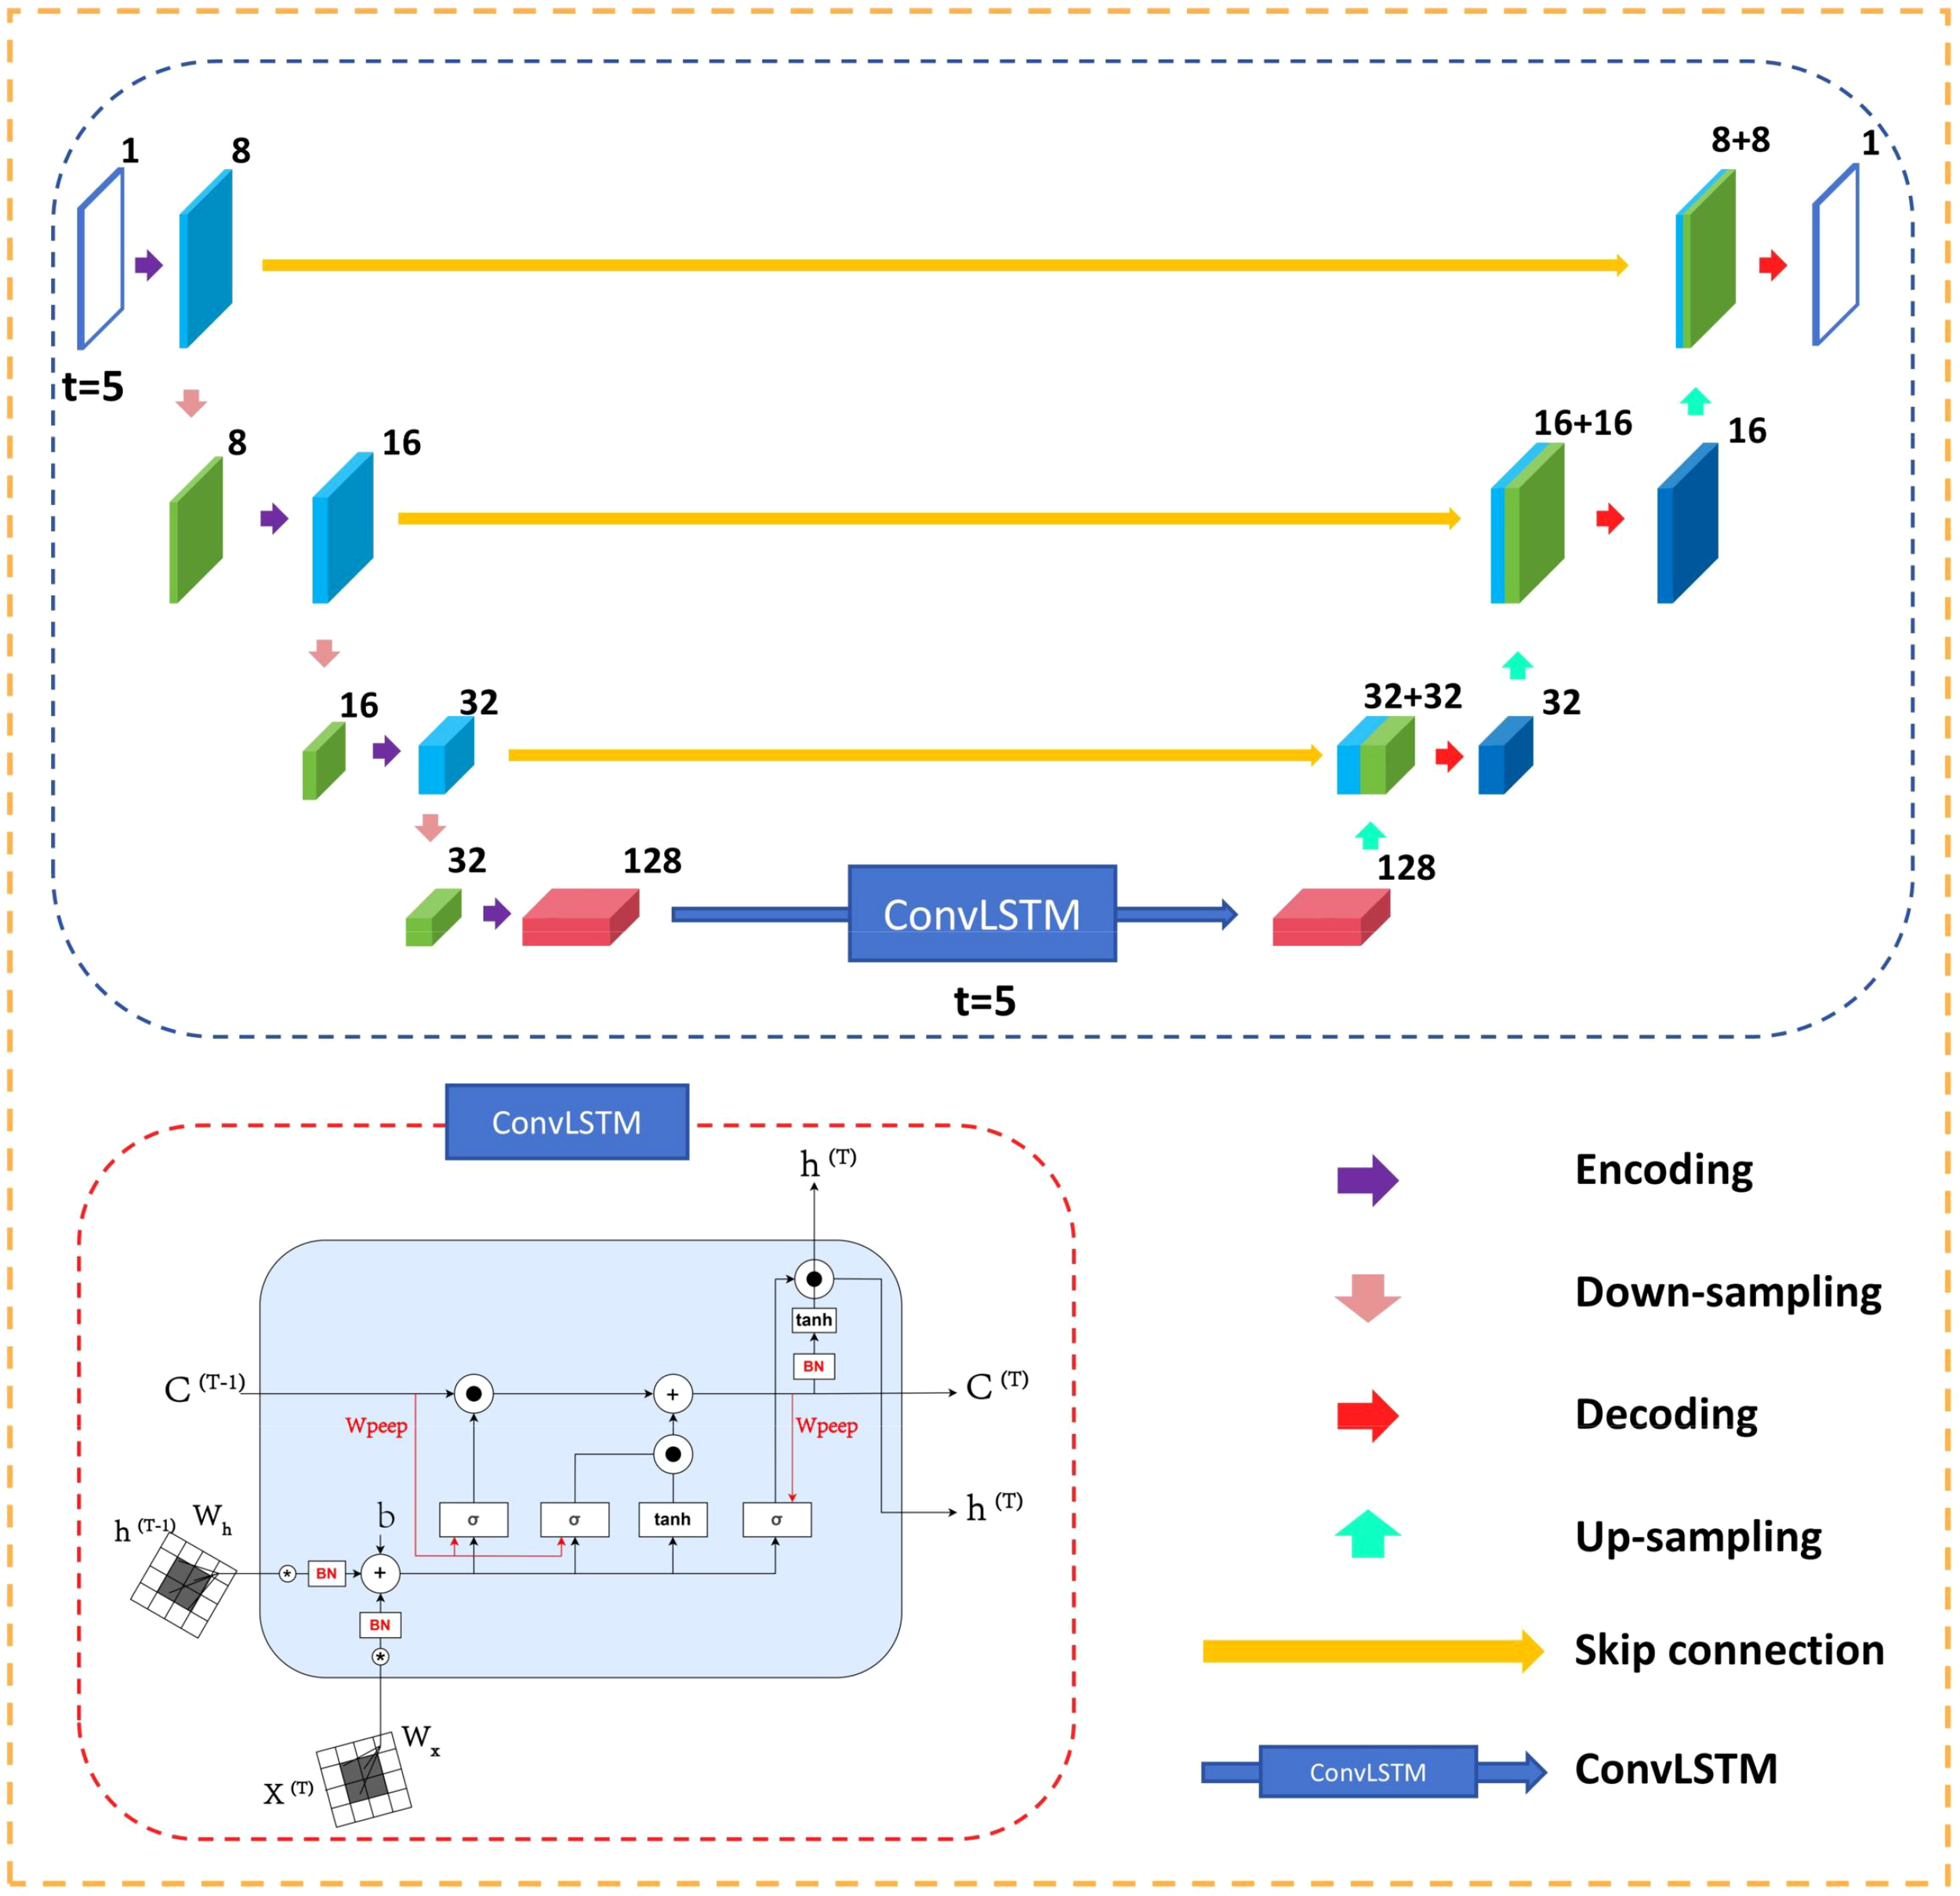
Structure of the UNet-ConvLSTM model.
2.4.2 ConvLSTM+ECOLOSS Model (with optional ecological constraint)
To explore whether additional ecological regularization can further constrain unrealistic long-term trends, an optional asymmetric Ecological Constraint Loss (ECOLOSS) is introduced to the ConvLSTM framework. The ConvLSTM processes sliding windows of five consecutive annual mangrove masks ([5, 256, 256, 1]) and captures spatiotemporal dependencies through convolutional operations within LSTM cells (Shi et al., 2015).
ECOLOSS enforces asymmetric, biologically informed bounds on the predicted annual relative growth rate (), reflecting observed dynamics in subtropical Chinese mangroves: historical decline rarely exceeds –5% yr–1 (driven by reclamation and pollution), while post-restoration recovery typically remains below +10% yr–1 (limited by cold stress and slow recruitment at the latitudinal margin). These bounds are supported by long-term field monitoring and remote sensing analyses in the Gaoqiao Reserve, where historical annual rates generally fall within a single-digit percentage range (approximately –5% to +9%), as well as by regional studies of Chinese subtropical mangroves (He and Liu, 2024; Wang et al., 2023).
The revised ECOLOSS is formulated as a piecewise penalty (Equation 1):
The total training loss is calculated as (Equation 2):
where was determined based on the performance on the validation set (2016–2018). As demonstrated in the ablation study (Table 3), this asymmetric formulation effectively constrains the growth rate within biologically reasonable bounds compared to symmetric or unconstrained alternatives.
Table 3
| Model | IoU | MAE (%) | Max growth rate (%) |
|---|---|---|---|
| U-Net–ConvLSTM (no constraint) | 0.787 | 6.83 | 14.8 |
| + ECOLOSS (symmetric) | 0.789 | 6.79 | 11.2 |
| + ECOLOSS (asymmetric, ours) | 0.793 | 6.70 | 9.4 |
Ablation study for ECOLOSS in spatiotemporal forecasting on the test period (2019–2023).
2.4.3 Other comparative models
The following models were evaluated to benchmark UNet-ConvLSTM and ConvLSTM+ECOLOSS:
-
ConvLSTM: Processes a 5-year sliding window ([5, 256, 256]) with two layers (each comprising 64 hidden units, approximately 0.5 million parameters).
-
ConvLSTM+Self-Attention: Incorporates a self-attention layer (approximately 0.1 million parameters) to highlight critical features.
-
3DCNN: Employs a 3D convolutional network ([1, 5, 256, 256], approximately 1 million parameters) to maintain spatial continuity.
-
LSTM: Processes a 5-year sequence of mangrove areas ([5], approximately 0.02 million parameters), emphasizing temporal modeling.
-
RNN: A basic recurrent neural network processing a 5-year sequence of mangrove areas ([5]) to predict the following year’s area, serving as a baseline for temporal modeling.
2.5 Model training and evaluation
Both the mangrove extraction and spatiotemporal forecasting models were trained on an NVIDIA 4090D GPU with 16 GB memory.
For mangrove extraction (U-Net+SE+CBAM), 1280 overlapping patches (256 × 256 pixels) were generated from the 111 annual scenes. Extensive online data augmentation (random rotation, horizontal/vertical flips, brightness/contrast adjustment) was applied. The patches were randomly split in a 7:2:1 ratio (70% training, 20% validation, 10% test). Training used binary cross-entropy loss and the Adam optimizer (initial learning rate 0.001) for a maximum of 100 epochs with early stopping (patience = 10). An ablation study for the attention modules is presented in Table 4.
Table 4
| Model | IoU | F1-score |
|---|---|---|
| Baseline U-Net | 0.648 | 0.779 |
| U-Net+SE | 0.663 | 0.791 |
| U-Net+CBAM | 0.629 | 0.764 |
| U-Net+SE+CBAM (ours) | 0.718 | 0.822 |
Ablation study on the internal patch test set (10% of 1280 patches).
For spatiotemporal forecasting, the 31 annual binary masks were chronologically divided into training (1993–2015), validation (2016–2018), and test (2019–2023) periods. All sequence models used a 5-year sliding window of masks ([5, 256, 256, 1]) to predict the subsequent year and were trained with Dice loss and the Adam optimizer (initial learning rate of , batch size 2) for a maximum of 100 epochs with early stopping (patience = 10). The ConvLSTM+ECOLOSS variant additionally incorporated the asymmetric ecological constraint loss (Section 2.4.2, = 0.5). No transfer learning was employed due to the consistent resolution of Landsat imagery throughout the study period.
Forecasting performance was evaluated using Intersection over Union (IoU) and F1-score for spatial accuracy, and Mean Absolute Error (MAE) and Root Mean Square Error (RMSE) for predicted mangrove area. Ablation analysis for ECOLOSS is presented in Table 3.
2.6 Data and implementation
All experiments were implemented in Python using the PyTorch framework on an NVIDIA 4090D GPU with 16 GB memory. The code is available from the corresponding author upon reasonable request. Prediction results were visualized as line graphs of mangrove area (hectares) over time, with the U-Net+SE+CBAM mapping results serving as the reference trajectory.
3 Results
3.1 Comparison of mangrove extraction methods
To evaluate mangrove extraction performance in the Gaoqiao Mangrove National Nature Reserve, the proposed U-Net+SE+CBAM model was compared with traditional NDVI thresholding (threshold = 0.3) and ablation variants. Reference masks were derived from high-resolution Google Earth historical imagery (1993–2023) and the Global Mangrove Watch dataset.
The U-Net+SE+CBAM model integrates Squeeze-and-Excitation (SE) modules for channel-wise feature recalibration and Convolutional Block Attention Module (CBAM) for spatial attention, enabling effective differentiation of mangroves from tidal flats and water bodies in complex coastal environments (IoU = 0.815 and F1-score = 0.928, see Table 5; overall accuracy = 98.55% as confirmed by the confusion matrix in Table 2). In contrast, NDVI thresholding is more sensitive to residual cloud cover and tidal variation, while U-Net+SE improves spectral feature mapping but shows weaker boundary delineation in fragmented patches. The Gaoqiao region, the northernmost native mangrove ecosystem in mainland China and home to 26 true mangrove species, particularly benefits from such high-precision mapping to support evidence-based conservation.
Table 5
| Model | IoU | F1-score |
|---|---|---|
| UNet+SE+CBAM | 0.815 | 0.928 |
| UNet+SE | 0.758 | 0.884 |
| UNet+CBAM | 0.733 | 0.864 |
| UNet | 0.745 | 0.875 |
| NDVI | 0.652 | 0.694 |
Performance comparison of mangrove extraction models.
An ablation study was conducted to evaluate the contributions of the SE and CBAM modules (Table 4). The baseline U-Net achieved an IoU of 0.648 and an F1-score of 0.779. Adding SE alone improved performance to IoU = 0.663 (relative improvement of 2.4% over baseline) and F1-score = 0.791, while CBAM alone yielded IoU = 0.629 and F1-score = 0.764. The full model combining both attention mechanisms (U-Net+SE+CBAM) achieved the highest performance with IoU = 0.718 (relative improvement of approximately 10.6% over the baseline U-Net and 8.3% over U-Net+SE alone) and F1-score = 0.822. This synergistic effect demonstrates the complementary roles of channel-wise recalibration (SE) and spatial attention (CBAM) in reducing misclassification, particularly in tidally influenced zones with mixed water-vegetation signals.
These quantitative findings are further detailed in the confusion matrix derived from independent 2023 reference data (Table 2). The U-Net+SE+CBAM model exhibits superior performance with an overall accuracy (OA) of 98.55% and a Kappa coefficient of 0.9708, while NDVI thresholding achieves OA = 91.92% and Kappa = 0.8388. The high producer’s accuracy (PA = 98.78%) and user’s accuracy (UA = 98.48%) for mangroves in U-Net+SE+CBAM underscore its precision in detecting mangrove areas, compared to NDVI’s PA = 87.54% and UA = 96.97%. This validates the model’s reliability for detailed mangrove mapping in the Gaoqiao region. Qualitative insights into these methods are presented in Figure 4.
Figure 4
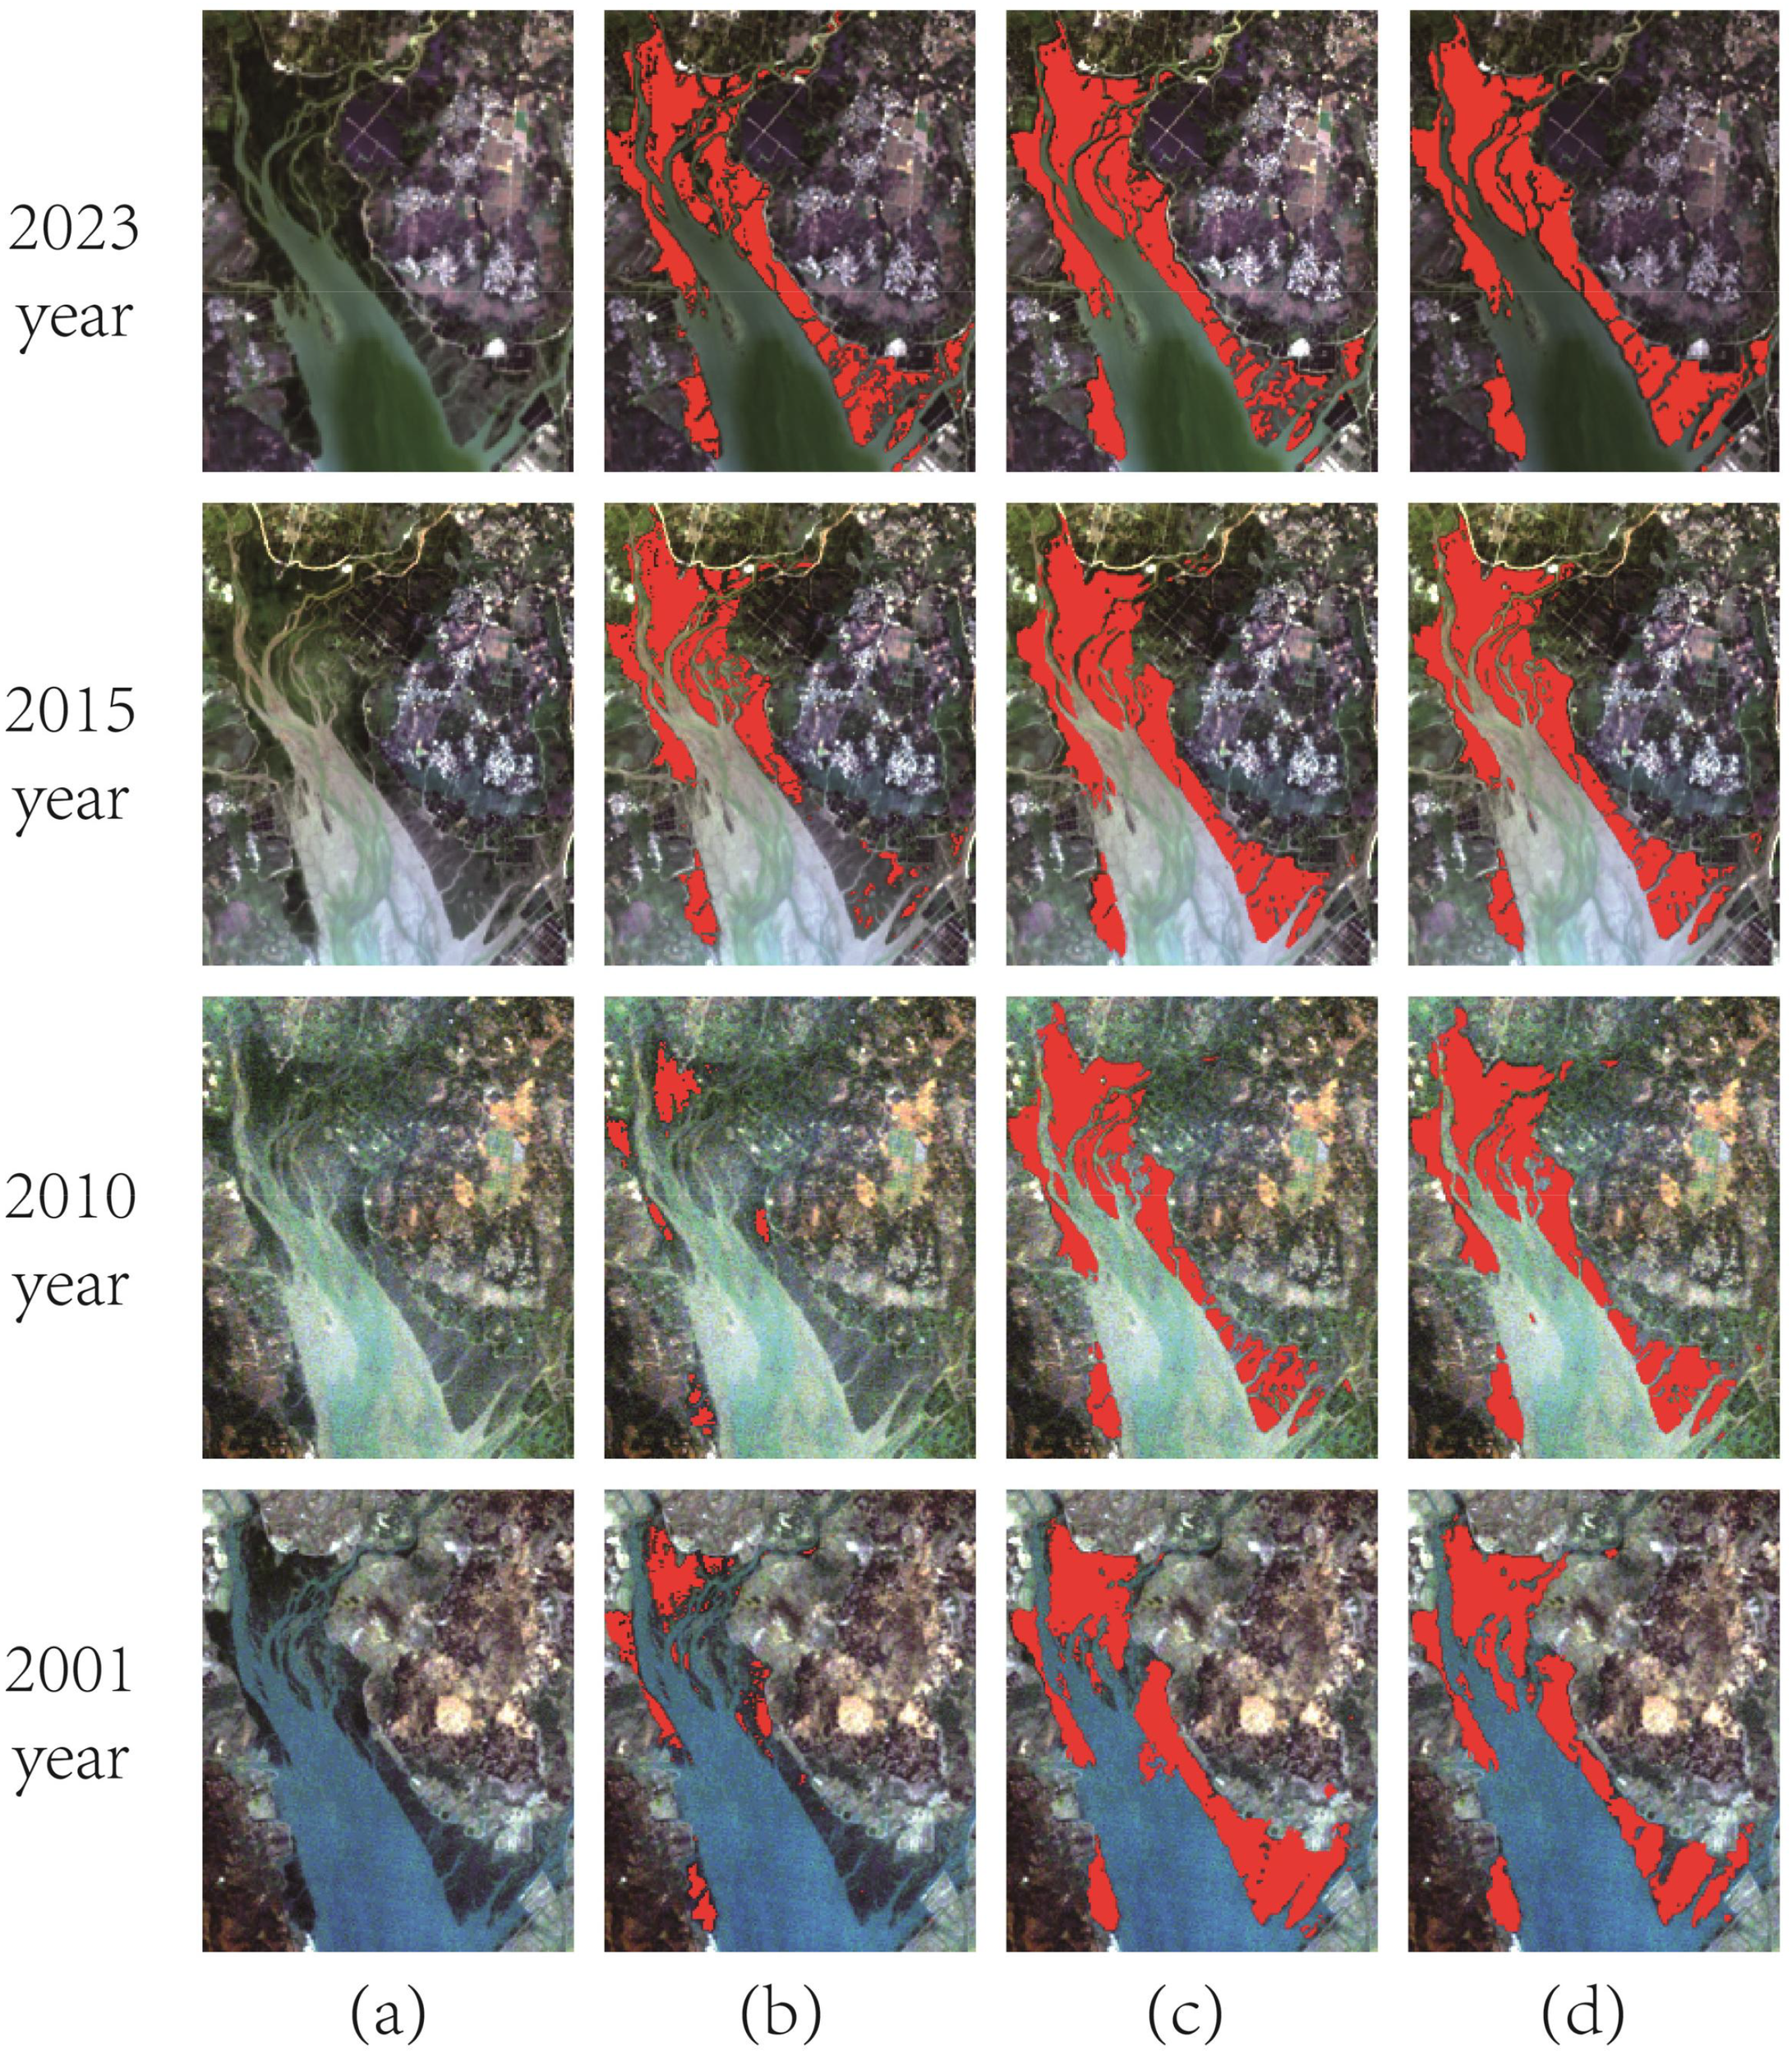
Qualitative comparison of mangrove extraction methods across four years in the Gaoqiao region. Rows (top to bottom): 2023, 2015, 2010, 2001. Columns (left to right): (a) Original Landsat image, (b) NDVI extraction (threshold = 0.3), (c) UNet+SE identification, (d) UNet+SE+CBAM extraction.
3.2 Spatiotemporal prediction performance
The spatiotemporal forecasting performance was evaluated on the 31 annual binary mangrove masks (1993–2023) generated by the U-Net+SE+CBAM model (Section 2.3). Historical trends derived from these masks show a decline from approximately 700 ha in 1993 to a minimum of 650 ha around 2008, followed by gradual recovery to 675 ha by 2023, consistent with documented phases of aquaculture expansion and subsequent conservation efforts.
As described in Section 2.3, the masks were chronologically split into training (1993–2015), validation (2016–2018), and test (2019–2023) periods. All sequence models used a 5-year rolling window to predict the subsequent year. This window length was selected as it yielded the lowest validation error among tested lengths of 3–7 years.
A qualitative comparison for September 2019 is shown in Figure 5. The reference mask from U-Net+SE+CBAM (a) accurately resolves narrow tidal-creek fringes and fragmented patches. LSTM (b) severely over-generalizes, ConvLSTM (c) sharpens boundaries but introduces occasional artificial expansion into mudflats, and the U-Net–ConvLSTM baseline (d) closely matches the reference in core areas while merging some thin features. The ConvLSTM+ECOLOSS prediction is visually very similar to the standalone ConvLSTM result (c) for this single year. This similarity is expected, as the primary role of the asymmetric ECOLOSS is to suppress biologically implausible multi-year runaway growth or decline, rather than to modify short-term spatial patterns that already lie within realistic bounds.
Figure 5
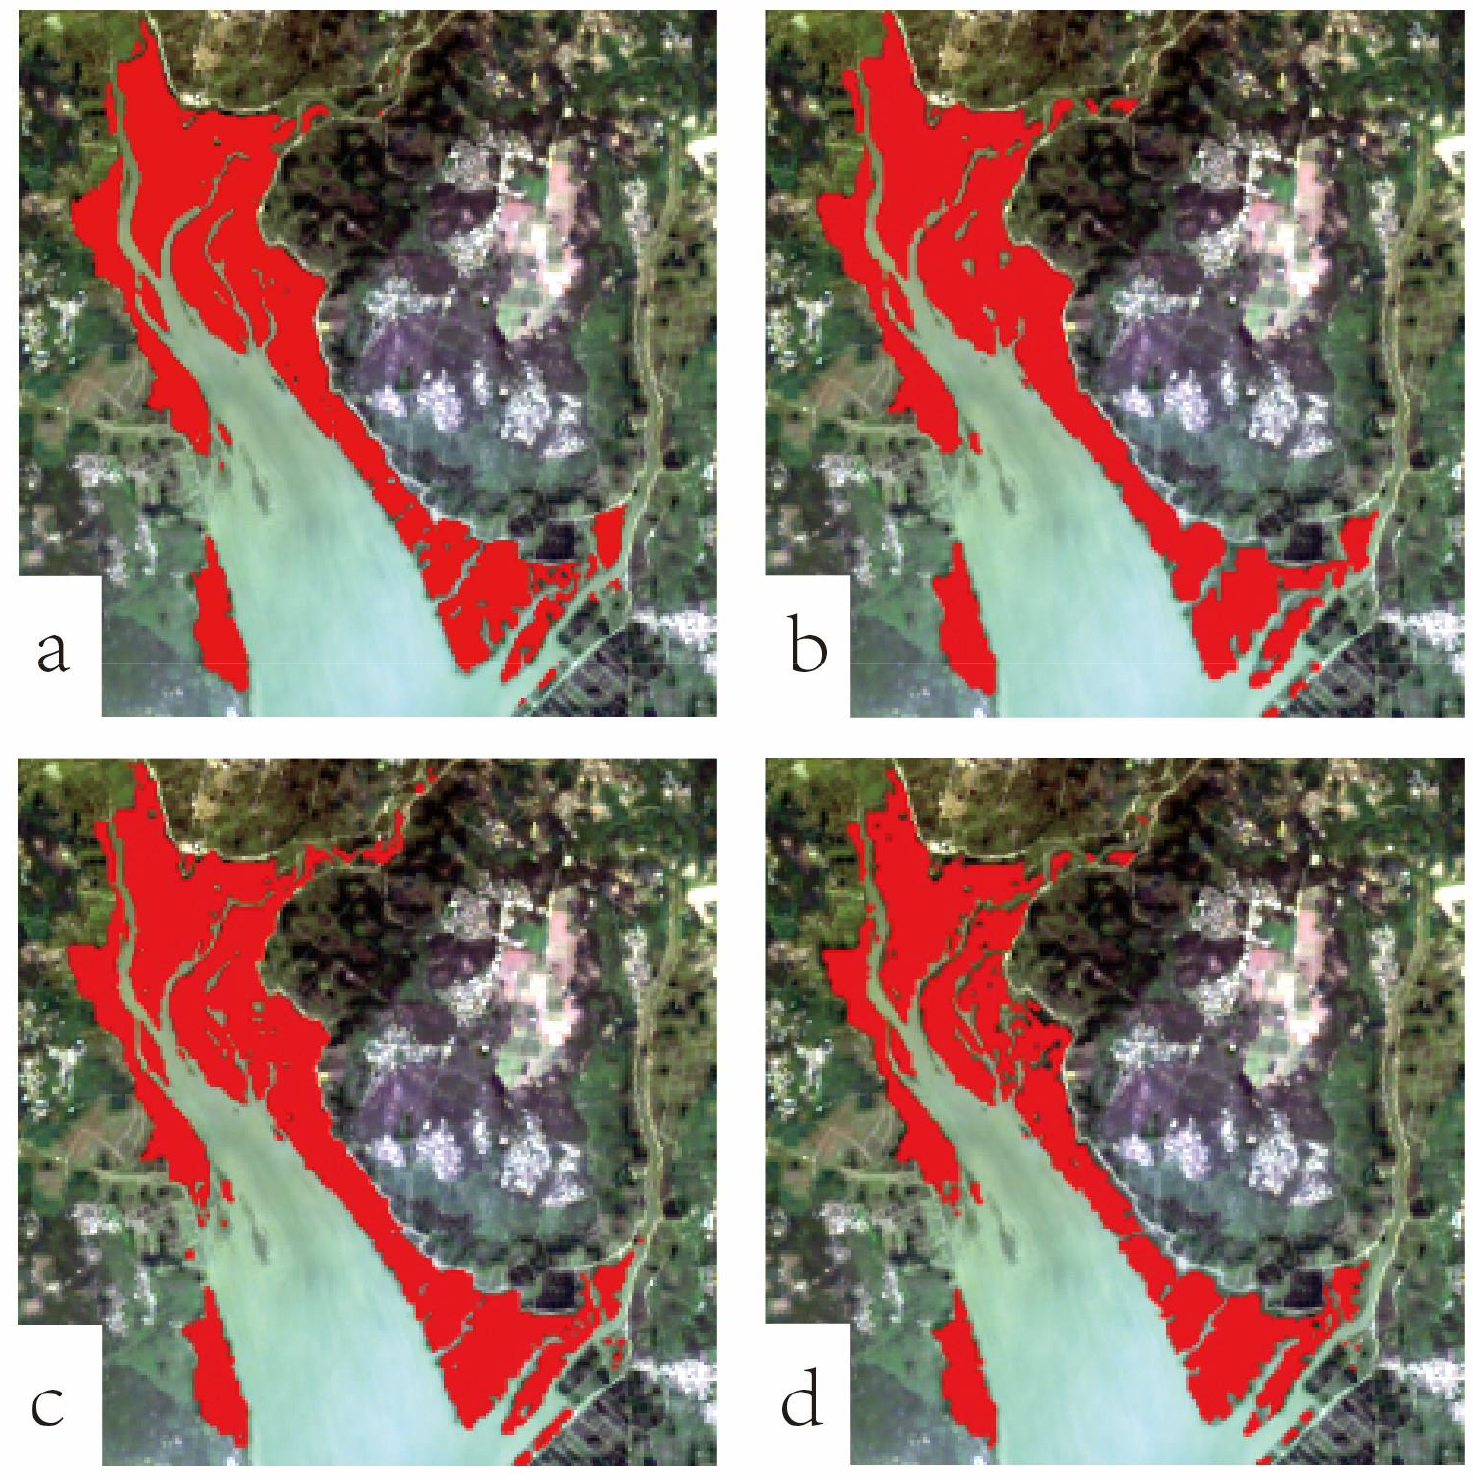
Qualitative comparison of predicted and actual mangrove distributions on September 2019 in the Gaoqiao region. (a) Reference mask generated by U-Net+SE+CBAM (b) LSTM prediction (c) ConvLSTM prediction (d) U-Net-ConvLSTM.
Temporal trajectories over the test period are presented in Figure 6. The reference series exhibits mild recovery from 672 ha in 2019 to 675 ha in 2023. U-Net–ConvLSTM and ConvLSTM+ECOLOSS track this trend most faithfully, with only minor deviations. Other convolutional models show slight over-prediction in 2021–2022, while purely temporal models deviate substantially.
Figure 6
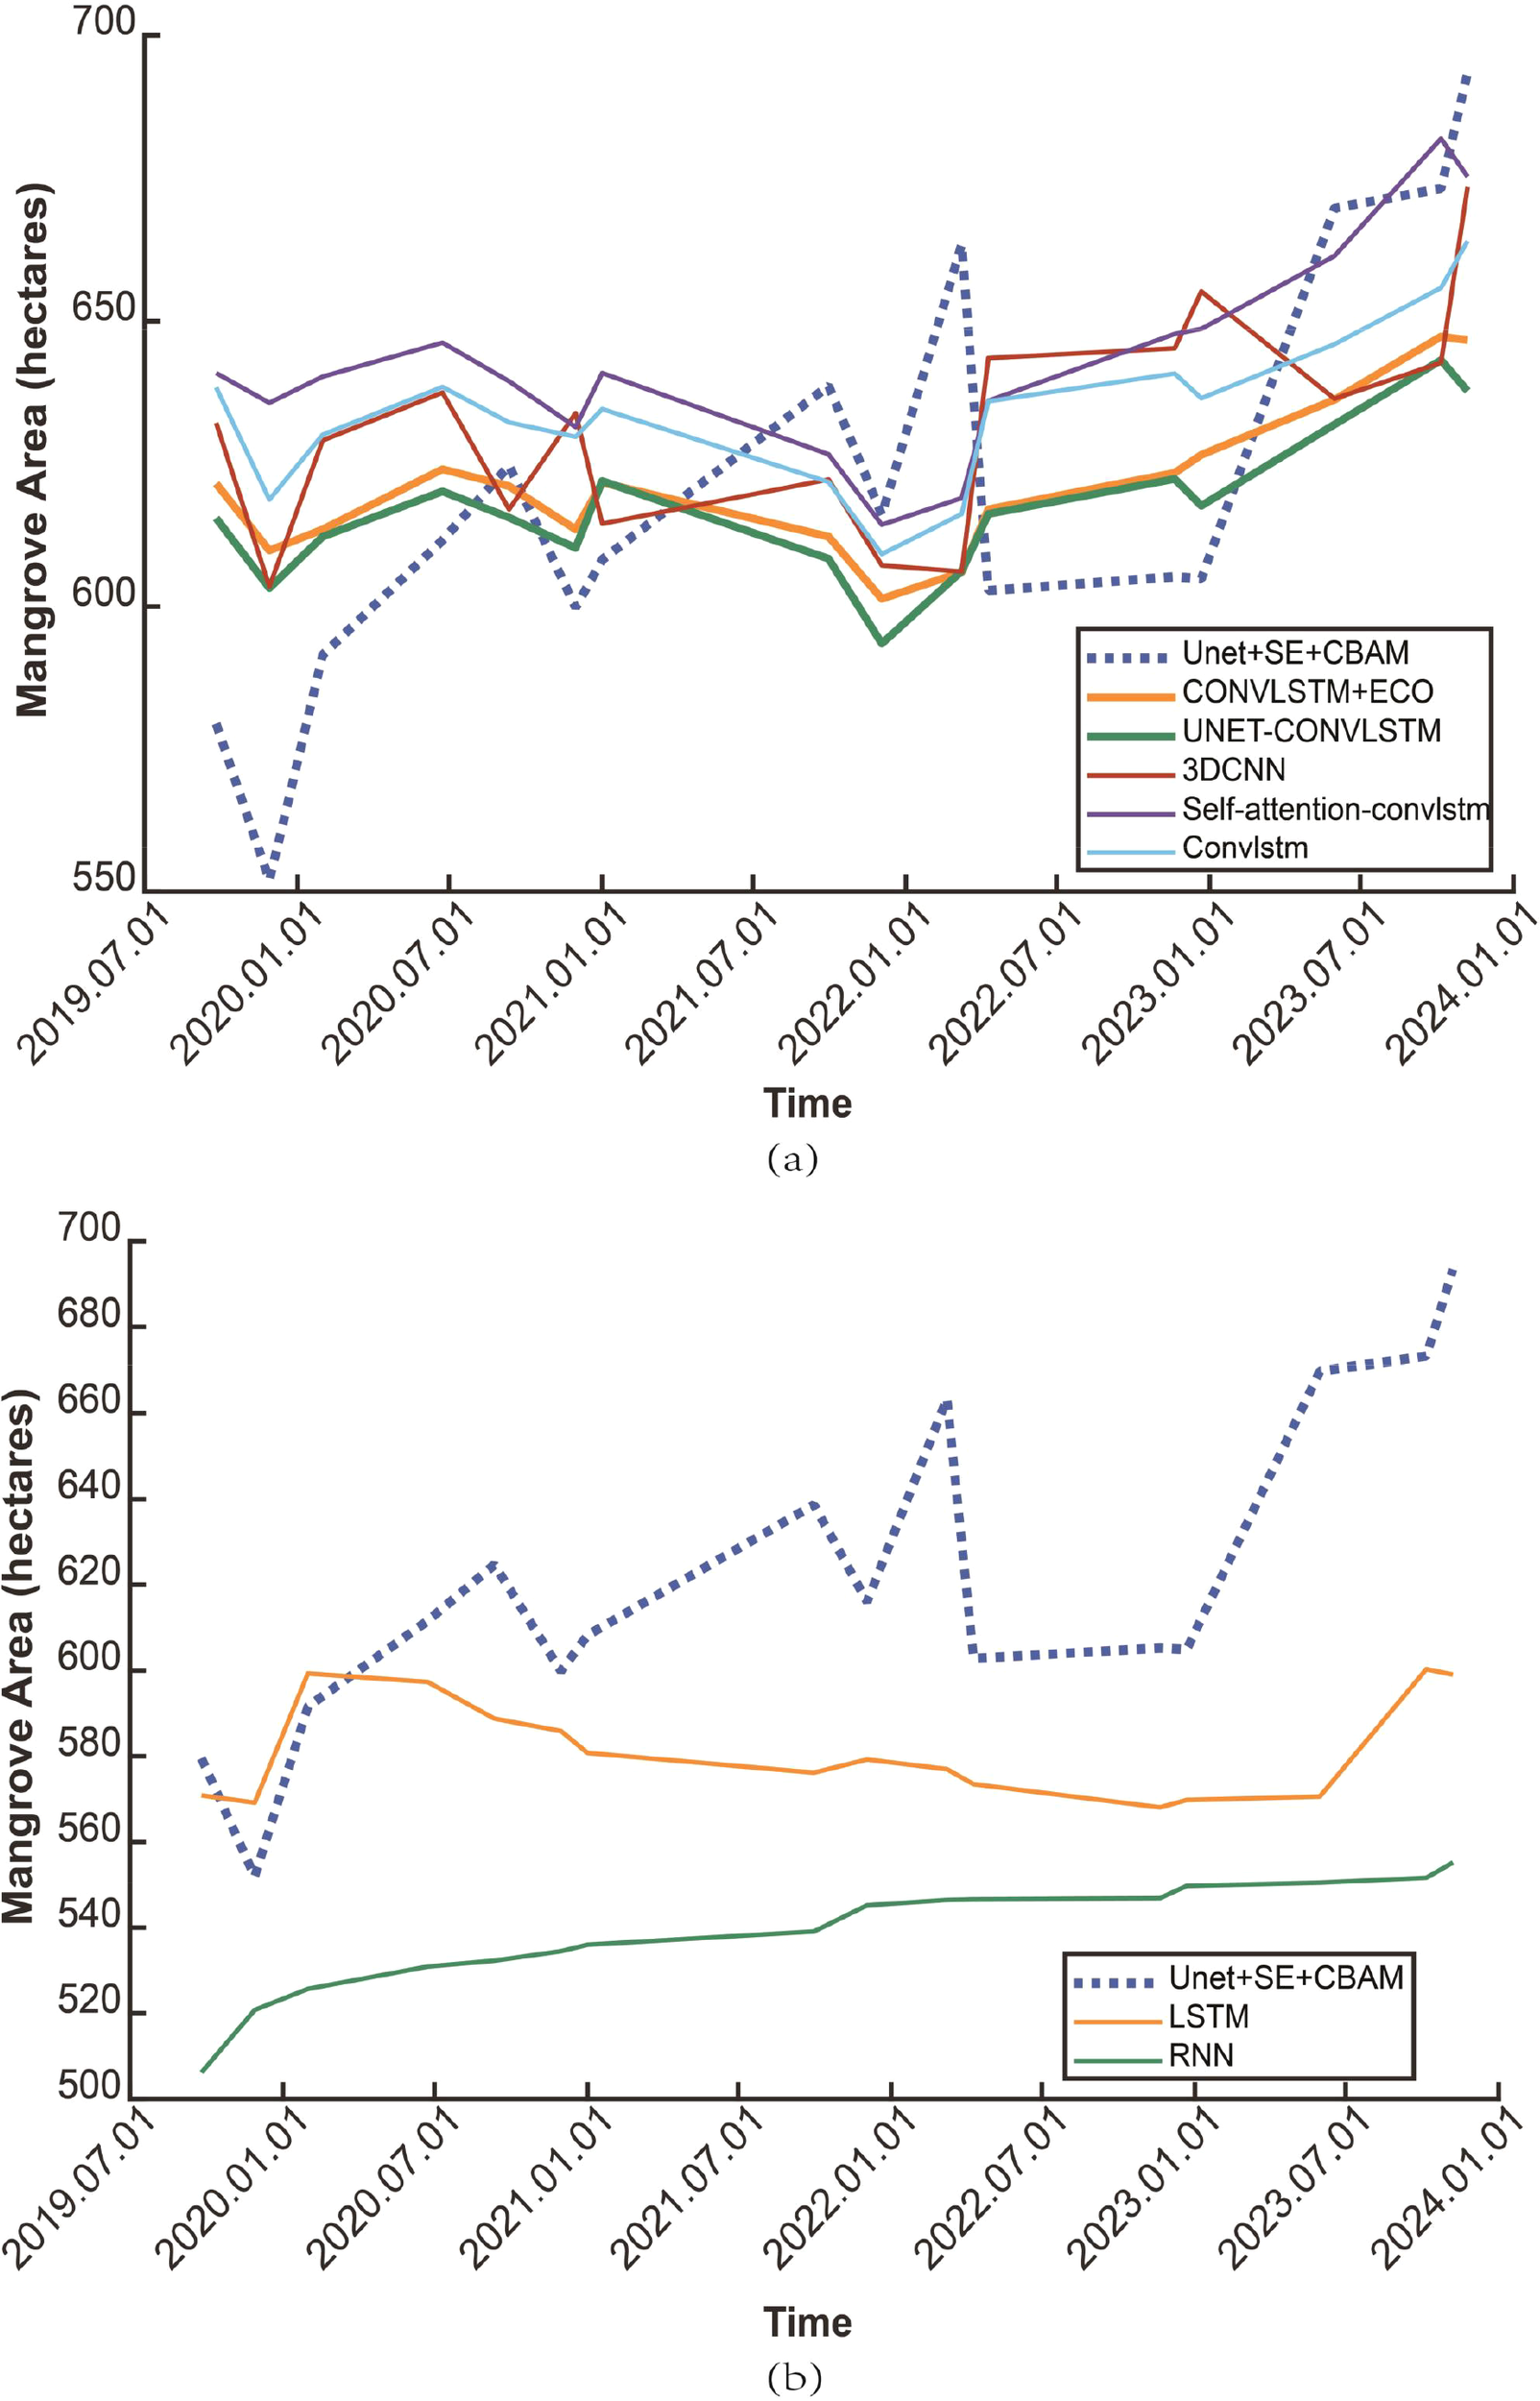
Time-series of predicted mangrove area in the Gaoqiao region (2019–2023). Dashed line: reference area from annual U-Net+SE+CBAM masks. Solid lines: predictions by different models in (a) convolutional spatiotemporal architectures and (b) purely temporal architectures (LSTM, RNN).
Quantitative metrics on the test period (2019–2023) are summarized in Table 6. The primary recommended U-Net–ConvLSTM model achieves strong performance (IoU = 0.787, F1-score = 0.874, MAE = 6.83%, RMSE = 9.03%). Adding the optional asymmetric ECOLOSS regularization yields ConvLSTM+ECOLOSS with the highest numerical scores (IoU = 0.793, MAE = 6.70%), but the absolute improvement remains marginal — an increase of 0.006 in IoU and a reduction of 0.13 percentage points in MAE — and is consistent across all metrics. Ablation analysis (Table 3) confirms that ECOLOSS primarily serves as an ecological safeguard, providing a modest reduction in extreme annual growth-rate outliers relative to unconstrained or symmetric variants, rather than acting as a major driver of short-term accuracy.
Table 6
| Model | IoU | F1-score | MAE(%) | RMSE(%) |
|---|---|---|---|---|
| ConvLSTM+ECOLOSS | 0.793 | 0.877 | 6.70 | 9.11 |
| U-Net+ConvLSTM | 0.787 | 0.874 | 6.83 | 9.03 |
| ConvLSTM | 0.776 | 0.867 | 7.32 | 10.00 |
| ConvLSTM+Self-Attention | 0.790 | 0.877 | 7.34 | 10.30 |
| 3DCNN | 0.786 | 0.873 | 7.87 | 10.77 |
| LSTM | 0.577 | 0.731 | 10.03 | 11.43 |
| RNN | 0.646 | 0.784 | 15.81 | 17.24 |
Performance metrics of spatiotemporal prediction models for mangrove distributions in the Gaoqiao region (2019–2023).
3.3 Future predictions
To generate near-term forecasts of mangrove dynamics in the Gaoqiao region (2024–2026), three models were employed: the primary recommended U-Net–ConvLSTM model, the pure ConvLSTM model, and the ConvLSTM+ECOLOSS variant incorporating asymmetric ecological regularization. All models were driven recursively using a 5-year sliding window on the annual mangrove masks derived from the U-Net+SE+CBAM segmentation for the historical period 1993–2023. Over this historical span, mangrove area increased from 542.25 ha in 1993 to 693.45 ha in 2023, representing a net gain of 151.20 ha (+27.88.
The predicted area trajectories indicate continued gradual recovery over the three-year forecast horizon, although the models differ in projected magnitude and rate of growth. The U-Net–ConvLSTM model forecasts mangrove areas of 700.38 ha in 2024, 708.30 ha in 2025, and 710.46 ha in 2026, yielding a modest cumulative increase of 10.08 ha (+1.44% relative to the 2024 baseline) and the most conservative trajectory overall. The ConvLSTM+ECOLOSS variant projects slightly higher values of 682.83 ha, 697.77 ha, and 701.37 ha for the corresponding years, resulting in a cumulative gain of 18.54 ha (+2.72%). The pure ConvLSTM model produces the strongest expansion, with predicted areas of 681.21 ha, 702.63 ha, and 710.19 ha, corresponding to a cumulative increase of 28.98 ha (+4.25%).
The full historical time series (1993–2023) and the near-term forecasted trajectories (2024–2026) for the three models are presented in Figure 7, with the left panel showing the complete series from 1993 to 2026 and the right panel providing a zoomed-in view of the prediction period.
Figure 7
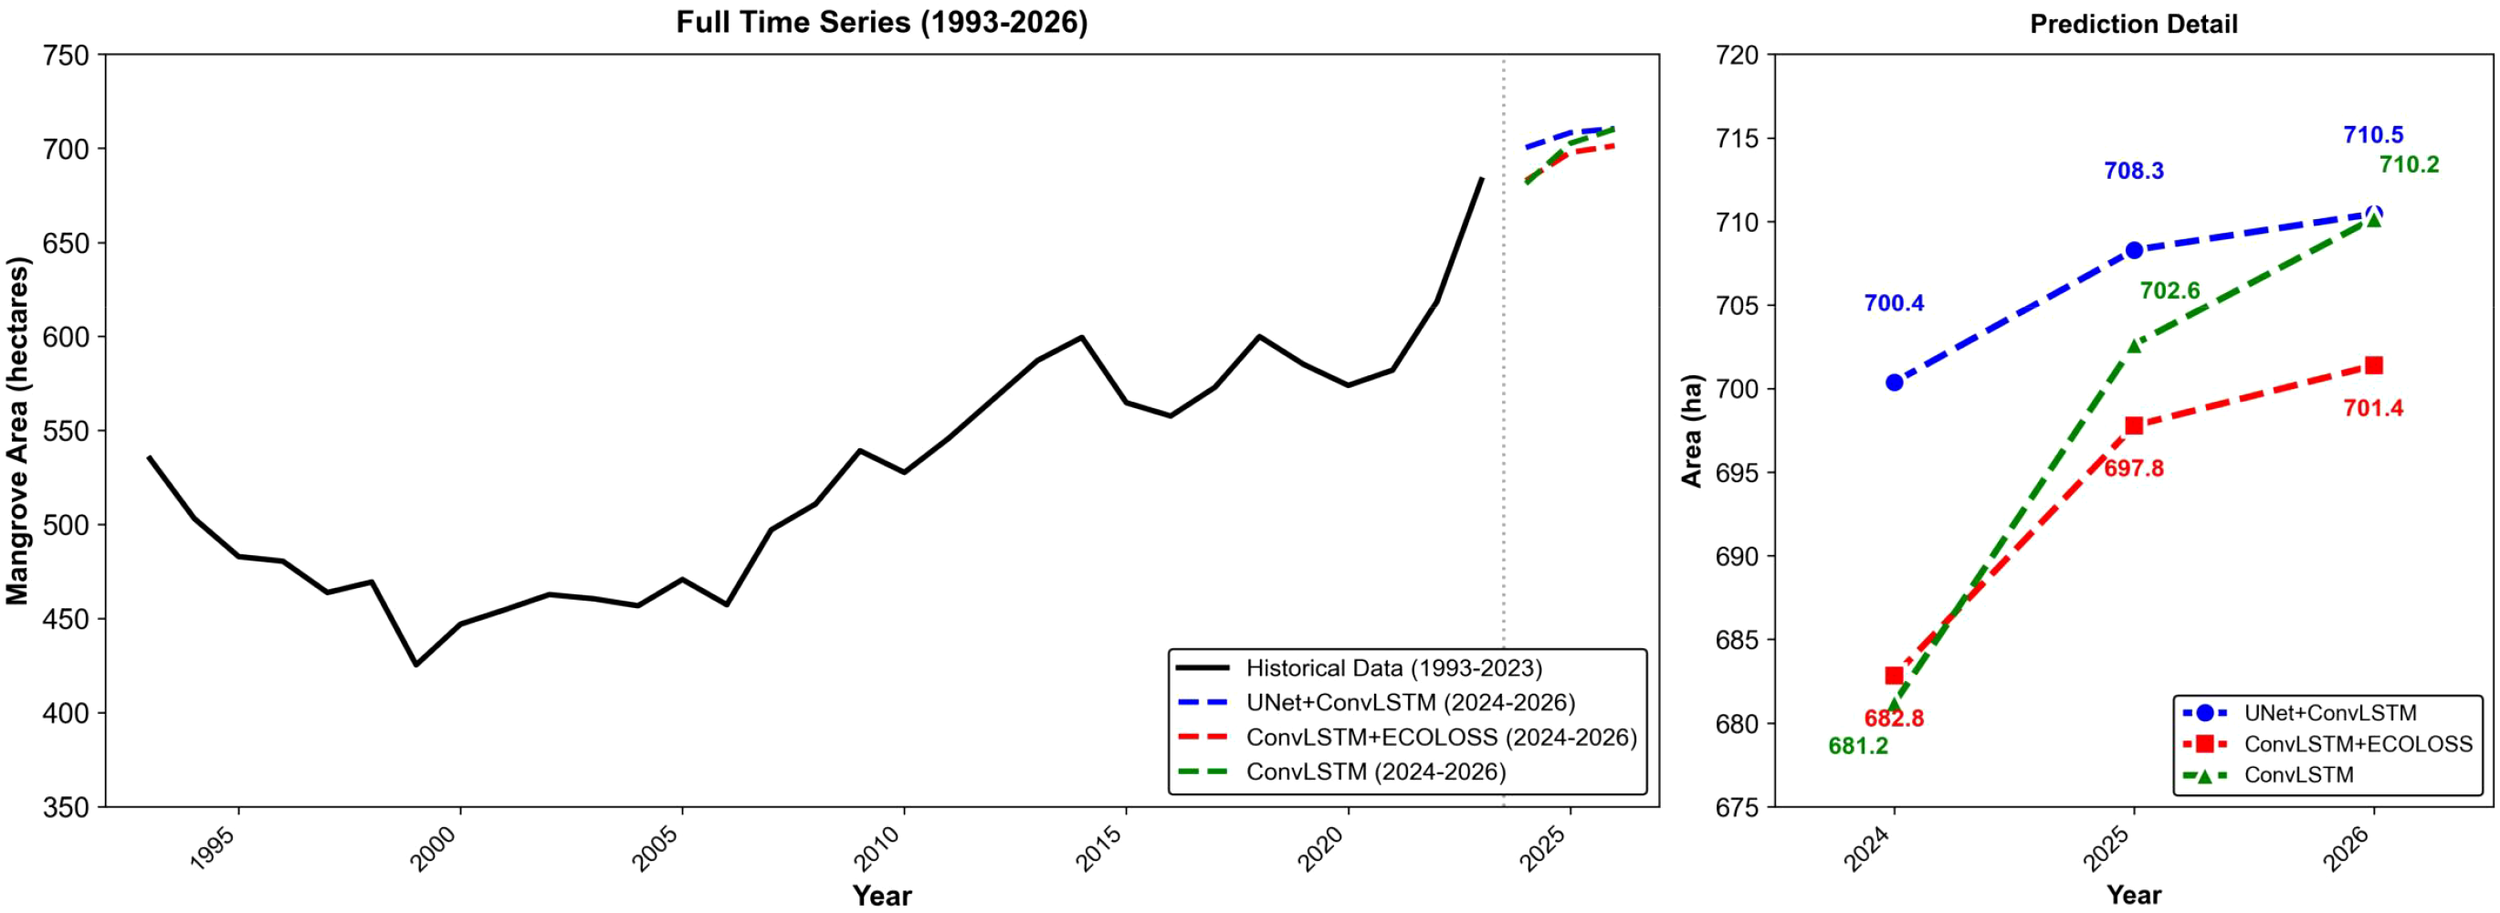
Full time series of mangrove extent in the Gaoqiao region (1993–2026). Left panel: historical trajectory derived from U-Net+SE+CBAM (1993–2023, black line) and near-term forecasted trajectories (2024–2026) from three models. Right panel: zoomed-in view of the prediction period. Predictions from U-Net–ConvLSTM (blue), ConvLSTM+ECOLOSS (red), and pure ConvLSTM (green).
Ablation analysis demonstrates that the pure ConvLSTM exhibits a pronounced tendency toward rapid short-term expansion, whereas incorporation of the asymmetric ECOLOSS provides mild moderation of this trend (reducing the three-year increase from +4.25% to +2.72%), confirming a constrained but limited regulatory effect that does not markedly reshape the overall forecast amplitude. By comparison, the U-Net–ConvLSTM model delivers the most stable and ecologically plausible predictions, owing to its integrated architecture that effectively couples detailed spatial feature extraction with robust temporal modeling. Its conservative growth trajectory aligns closely with known biophysical limitations in the Gaoqiao Reserve, including restricted seaward extension due to tidal exposure and primary expansion potential confined to northern intertidal zones.
These near-term forecasts suggest that, under continuing current management practices, mangrove recovery in the Gaoqiao Reserve will remain gradual and biologically reasonable through 2026, with total extent stabilizing near 700 ha. The U-Net–ConvLSTM model is considered the most reliable benchmark for these projections due to its superior stability and fidelity to observed ecological constraints.
4 Discussion
This study presents a practical two-stage deep learning framework for mangrove monitoring and forecasting in the Gaoqiao Mangrove National Nature Reserve. The enhanced U-Net+SE+CBAM model provides high-precision masks from Landsat RGB imagery, while the primary recommended U-Net–ConvLSTM architecture effectively couples detailed spatial precision with robust temporal modelling, delivering superior stability and performance with minimal complexity. The optional asymmetric ECOLOSS regularization, when added to form ConvLSTM+ECOLOSS, offers a modest additional safeguard against biologically implausible rapid expansion trends but contributes only marginally to short-term forecasting accuracy.
Comparisons with recent studies highlight the trade-offs and advantages of our approach. Recent advancements have demonstrated the superiority of high-resolution sensors for detailed mapping; for instance, (Jia et al., 2023) produced a global 10-m mangrove baseline using Sentinel-2, and (Lombard et al., 2023) achieved high accuracy in distinguishing mangrove zonation in West Africa using optimized time-series indices. While our Landsat-based approach (30 m) naturally yields coarser boundaries than these 10-m products, it offers the unique advantage of a multi-decadal temporal span (1993–2023) unavailable with Sentinel-2. This long-term perspective is crucial for understanding historical trajectories. Furthermore, regarding dynamic monitoring, (Ghaderpour et al., 2025) effectively utilized statistical methods (e.g., Mann-Kendall tests) on MODIS data to identify vegetation trends and wildfire impacts over two decades. In contrast to such pixel-based statistical trend analyses, our U-Net–ConvLSTM framework explicitly models spatiotemporal dependencies. This allows it to not only detect past trends but also generate spatially explicit forecasts of future mangrove distributions, providing a more direct tool for forward-looking conservation planning.
However, several uncertainties and limitations inherent in the input data and model parameters must be acknowledged. First, regarding input data uncertainties, the 30-m spatial resolution of Landsat inevitably introduces mixed-pixel effects, particularly along narrow tidal creeks and fragmented edges, which limits the precision of boundary delineation compared to higher-resolution alternatives. Second, despite the use of annual composites, residual noise from cloud cover, cloud shadows, and scan-line gaps (specifically in Landsat 7 ETM+) remains a source of uncertainty that can lead to local misclassifications. Third, regarding model parameters, the proposed ECOLOSS relies on growth constraint thresholds (–5% to +10%) derived from regional historical observations. While effective for this study area, these parameters may require recalibration when applied to other mangrove ecosystems with different recovery rates or disturbance regimes. Finally, the current reliance on RGB bands excludes valuable near-infrared (NIR) and shortwave-infrared (SWIR) information, which could further improve vegetation–water separation under complex tidal conditions.
Despite these limitations, the predicted gradual recovery through 2026 is consistent with ongoing conservation efforts in the Gaoqiao Reserve and indicates sustained enhancement of ecosystem services, including carbon sequestration and coastal protection. The U-Net–ConvLSTM pipeline, in particular, provides a transparent, computationally efficient, and robust tool that is well-suited for operational monitoring of subtropical Chinese mangroves. The framework can be easily transferred to other reserves through minor adaptations of its straightforward RGB-based segmentation and forecasting modules, offering a scalable solution for regional-scale mangrove management in the context of climate change.
5 Conclusion
This study presents a practical two-stage deep learning framework for monitoring and forecasting mangrove dynamics in the Gaoqiao Mangrove National Nature Reserve, southern China. The enhanced U-Net+SE+CBAM model provides high-precision annual mangrove masks from Landsat RGB imagery (IoU = 0.815, F1-score = 0.928 when validated against independent reference data). For spatiotemporal forecasting, the primary recommended U-Net–ConvLSTM architecture effectively integrates U-Net’s spatial precision with ConvLSTM’s temporal modelling, achieving robust performance (IoU = 0.787, MAE = 6.83% on the test period 2019–2023) with excellent simplicity and computational efficiency.
An optional asymmetric Ecological Constraint Loss (ECOLOSS) can be added to form the ConvLSTM+ECOLOSS variant, yielding marginally higher scores (IoU = 0.793, MAE = 6.70%) by constraining extreme growth-rate outliers. Ablation analysis confirms that ECOLOSS provides a modest ecological safeguard against biologically implausible rapid expansion trends but contributes only marginally to short-term forecasting accuracy. Near-term forecasts for 2024–2026 suggest sustained gradual recovery under current management practices, with mangrove extent stabilizing near 700 ha.
The U-Net–ConvLSTM pipeline is particularly recommended for operational mangrove monitoring in subtropical China due to its transparency, ease of implementation, and near-optimal performance. The optional ECOLOSS module may be useful in scenarios requiring additional biological constraints. Future work should incorporate full-multispectral data and additional environmental drivers (e.g., temperature, salinity) to further enhance forecasting reliability amid climate change.
Statements
Data availability statement
The original contributions presented in the study are included in the article/supplementary material, further inquiries can be directed to the corresponding author/s.
Author contributions
JY: Writing – original draft, Writing – review & editing, Data curation, Formal analysis, Investigation, Visualization. YL: Investigation, Methodology, Software, Visualization, Writing – original draft, Writing – review & editing. ZC: Investigation, Supervision, Writing – original draft, Writing – review & editing. XS: Investigation, Methodology, Writing – original draft, Writing – review & editing. DL: Conceptualization, Funding acquisition, Supervision, Writing – original draft, Writing – review & editing.
Funding
The author(s) declared that financial support was not received for this work and/or its publication.
Acknowledgments
Thank our supervisor and classmates for their assistance in this study.
Conflict of interest
The author(s) declared that this work was conducted in the absence of any commercial or financial relationships that could be construed as a potential conflict of interest.
Generative AI statement
The author(s) declared that generative AI was not used in the creation of this manuscript.
Any alternative text (alt text) provided alongside figures in this article has been generated by Frontiers with the support of artificial intelligence and reasonable efforts have been made to ensure accuracy, including review by the authors wherever possible. If you identify any issues, please contact us.
Publisher’s note
All claims expressed in this article are solely those of the authors and do not necessarily represent those of their affiliated organizations, or those of the publisher, the editors and the reviewers. Any product that may be evaluated in this article, or claim that may be made by its manufacturer, is not guaranteed or endorsed by the publisher.
References
1
Alongi D. M. (2014). Carbon cycling and storage in mangrove forests. Annu. Rev. Mar. Sci.6, 195–219. doi: 10.1146/annurev-marine-010213-135020
2
Cayetano C. B. Creencia L. A. Sullivan E. Clewely D. Miller P. I. (2023). Multi-spatiotemporal analysis of changes in mangrove forests in Palawan, Philippines: predicting future trends using a support vector machine algorithm and the Markov chain model. UCL Open Environ.5, e057. doi: 10.14324/111.444/ucloe.000057
3
Chen B. Xiao X. Li X. Pan L. Doughty R. Ma J. et al . (2017). A mangrove forest map of China in 2015: analysis of time series Landsat 7/8 and sentinel-1A imagery in google earth engine cloud computing platform. ISPRS J. Photogrammetry Remote Sens.131, 104–120. doi: 10.1016/j.isprsjprs.2017.07.011
4
Ellison A. M. Felson A. J. Friess D. A. (2020). Mangrove rehabilitation and restoration as experimental adaptive management. Front. Mar. Sci.7, 327. doi: 10.3389/fmars.2020.00327
5
Ghaderpour E. Bozzano F. Mugnozza G. S. Mazzanti P. (2025). Analyses of MODIS land cover/use and wildfires in Italian regions since 2001. Land14, 14435. doi: 10.3390/land14071443
6
Goldberg L. Lagomasino D. Thomas N. Fatoyinbo T. (2020). Global declines in human-driven mangrove loss. Global Change Biol.26, 5844–5555. doi: 10.1111/gcb.15275
7
He W. Liu D. (2024). Changes in the distribution of mangroves in Yingluowan Bay, Zhanjiang, from 2019 to 2023. Adv. Mar. Sci.11, 111. doi: 10.12677/ams.2024.113011
8
Heck N. Goldberg L. Ahmadia G. N. Andradi-Brown D. A. Lagomasino D. Campbell A. et al . (2024). Global drivers of mangrove loss in protected areas. Conserv. Biol.38, e14293. doi: 10.1111/cobi.14293
9
Jia M. Wang Z. Mao D. Ren C. Song K. Zhao C. et al . (2023). Mapping global distribution of mangrove forests at 10-m resolution. Sci. Bull.68, 1306–1316. doi: 10.1016/j.scib.2023.05.004
10
Jia M. Wang Z. Zhang Y. Mao D. Wang C. (2018). Monitoring loss and recovery of mangrove forests during 42 years: the achievements of mangrove conservation in China. Int. J. Appl. Earth Observation Geoinformation73, 535–545. doi: 10.1016/j.jag.2018.07.025
11
Jones A. R. Segaran R. R. Clarke K. D. Waycott M. Goh W. S. H. Gillanders B. M. (2020). Estimating mangrove tree biomass and carbon content: A comparison of forest inventory techniques and drone imagery. Front. Mar. Sci.6, 784. doi: 10.3389/fmars.2019.00784
12
Kathiresan K. Bingham B. L. (2001). Biology of Mangroves and Mangrove Ecosystems. Amsterdam: Elsevier. 40.
13
Kuenzer C. Bluemel A. Gebhardt S. Quoc T. V. Dech S. (2011). Remote sensing of mangrove ecosystems: A review. Remote Sens.3, 878–9285. doi: 10.3390/rs3050878
14
Liu Y. Zhang Y. Cheng Q. Feng J. Chao M. C. Tsou J. Y. (2024). Mangrove monitoring and change analysis with landsat images: A case study in Pearl river estuary (China). Ecol. Indic.160, 111763. doi: 10.1016/j.ecolind.2024.111763
15
Lombard F. Soumaré S. Andrieu J. Josselin D. (2023). Mangrove zonation mapping in West Africa, at 10-m resolution, optimized for inter-annual monitoring. Ecol. Inf.75, 102027. doi: 10.1016/j.ecoinf.2023.102027
16
Lugo A. E. Snedaker S. C. (1974). The ecology of mangroves. Annu. Rev. Ecol. Systematics5, 39–64. doi: 10.1146/annurev.es.05.110174.000351
17
Malik A. Fensholt R. Mertz O. (2015). Economic valuation of mangroves for comparison with commercial aquaculture in south Sulawesi, Indonesia. Forests6, 3028–3445. doi: 10.3390/f6093028
18
Romañach S. S. DeAngelis D. L. Koh H. L. Li Y. Teh S. Y. Raja Barizan R. S. et al . (2018). Conservation and restoration of mangroves: global status, perspectives, and prognosis. Ocean Coast. Manage.154, 72–82. doi: 10.1016/j.ocecoaman.2018.01.009
19
Rouse J. W. (1974). Monitoring vegetation systems in the great plains with ERTS1. Proceedings of the Third Earth Resources Technology Satellite-1 Symposium (NASA SP-351).309–317.
20
Salem M. E. Mercer D.E. (2012). The economic value of mangroves: A meta-analysis. Sustainability4, 359–835. doi: 10.3390/su4030359
21
Shi X. Chen Z. Wang H. Yeung D.-Y. Wong W.-K. Woo W.-c. (2015). Convolutional LSTM network: A machine learning approach for precipitation nowcasting. Adv. Neural Inf. Process. Syst.28, 802-810. doi: 10.48550/arXiv.1506.04214
22
Shrestha S. Miranda I. Kumar A. Escobar Pardo M. L. Dahal S. Rashid T. et al . (2019). Identifying and forecasting potential biophysical risk areas within a tropical mangrove ecosystem using multi-sensor data. Int. J. Appl. Earth Observation Geoinformation74, 281–294. doi: 10.1016/j.jag.2018.09.017
23
Turschwell M. P. Tulloch V. J.D. Sievers M. Pearson R. M. Andradi-Brown D. A. Ahmadia G. N. et al . (2020). Multi-scale estimation of the effects of pressures and drivers on mangrove forest loss globally. Biol. Conserv.247, 108637. doi: 10.1016/j.biocon.2020.108637
24
Wang Y. Wang X. Khan S. Zhou D. Ke Y. (2023). Evaluation of mangrove restoration effectiveness using remote sensing indices: A case study in Guangxi Shankou mangrove national natural reserve, China. Front. Mar. Sci.10, 1280373. doi: 10.3389/fmars.2023.1280373
25
Xu H. (2006). Modification of normalised difference water index (NDWI) to enhance open water features in remotely sensed imagery. Int. J. Remote Sens.27, 3025–3033. doi: 10.1080/01431160600589179
Summary
Keywords
mangrove, remote sensing, semantic segmentation, ecological constraint loss, U-net, spatiotemporal prediction
Citation
Yuan J, Li Y, Cheng Z, Sun X and Liu D (2026) Deep learning for mangrove change prediction: Gaoqiao Mangrove, China. Front. Mar. Sci. 13:1632093. doi: 10.3389/fmars.2026.1632093
Received
20 May 2025
Revised
16 January 2026
Accepted
16 January 2026
Published
06 February 2026
Volume
13 - 2026
Edited by
Baoxin Hu, York University, Canada
Reviewed by
Maged Marghany, Universitas Malikussaleh, Indonesia
Chao Chen, Suzhou University of Science and Technology, China
Ebrahim Ghaderpour, Sapienza University of Rome, Italy
Updates
Copyright
© 2026 Yuan, Li, Cheng, Sun and Liu.
This is an open-access article distributed under the terms of the Creative Commons Attribution License (CC BY). The use, distribution or reproduction in other forums is permitted, provided the original author(s) and the copyright owner(s) are credited and that the original publication in this journal is cited, in accordance with accepted academic practice. No use, distribution or reproduction is permitted which does not comply with these terms.
*Correspondence: Xiong Sun, 1540802710@qq.com; Dazhao Liu, liudz@gdou.edu.cn
Disclaimer
All claims expressed in this article are solely those of the authors and do not necessarily represent those of their affiliated organizations, or those of the publisher, the editors and the reviewers. Any product that may be evaluated in this article or claim that may be made by its manufacturer is not guaranteed or endorsed by the publisher.