Abstract
The dissociation behavior of CH4–C3H8 mixed gas hydrates in natural marine sediments is critical to global carbon storage and marine biogeochemical cycles, but the effects of sediment composition and dissociation pathways remain unclear. In this study, dissociation experiments were conducted using marine sediments from the South China Sea, including foraminifera-rich sands, mud-foraminifera sand mixtures, and muds, under controlled heating and depressurization. Hydrate dissociation dynamics and gas release were monitored using in situ and ex situ Raman spectroscopy, supplemented by microscopic observations. Our results show that dissociation of sII hydrate crystals in all sediments begins within the hydrate stability range. The morphological changes in hydrate crystal surfaces correlate with compositional shifts in sediments characterized by high heterogeneity and a broad particle-size distribution. In muddy sediments, dissociation behavior remained uniform regardless of the triggering mechanism, while hydrate crystals in foraminifera-rich sands exhibited distinct behaviors under heating compared to depressurization. Sediment composition influences gas release, although the L(CH4)/S(CH4) ratio remains nearly constant across all sediments. Specifically, coarse quartz particles enhance CH4 and C3H8 release, while clay minerals have negligible effects. Foraminifera-rich sands preferentially facilitate CH4 release under heating, whereas they promote CH4 and C3H8 release under depressurization. These findings provide mechanistic and quantitative insights into sediment-carbon interactions in marine systems, with implications for sustainable carbon management and predicting ocean responses to anthropogenic and climate-driven perturbations.
Highlights
-
Gas hydrate dissociation was investigated using in situ and ex situ Raman spectroscopy.
-
Five natural marine sediments from the South China Sea were used under controlled heating and depressurization.
-
Hydrate dissociation initiated within the stability zone, highlighting sediment-induced metastability.
-
Morphology-composition coupling during hydrate dissociation in sediments with high heterogeneity and a broad particle size distribution.
-
Foraminifera-rich sands exhibited distinct gas release behavior compared to muds under different dissociation pathways.
1 Introduction
Gas hydrates are crystalline substances with a defined structure, where water molecules form a three-dimensional lattice via hydrogen bonds. These formations create spaces of different sizes, effectively trapping guest molecules within them. In a natural environment, the guest gas molecules primarily consist of light hydrocarbon molecules, including methane (CH4), ethane (C2H6), and propane (C3H8). The prospect of recovering CH4 from the natural gas hydrate reserves has attracted significant interest, driving research into the formation and dissociation dynamics of CH4 hydrates (Konno et al., 2012; Takeya et al., 2013; Song et al., 2015; Li et al., 2016a). Although CH4 dominates natural gas hydrates, other hydrocarbons are also significant (Lu et al., 2007; Liu et al., 2015).
Mixed gas hydrates, including C1-C4 hydrocarbons, have been identified in various deposits worldwide, such as the Gulf of Mexico, the Caspian Sea, Lake Baikal, the Qilian Mount Permafrost of China, and the Pearl River Mouth Basin in the South China Sea (Klapp et al., 2010; Sun et al., 2018; Wei et al., 2018, 2021). Among mixed gas hydrates, CH4–C3H8 mixed gas hydrate is significant in deep-sea sediments (Yang et al., 2017; Cai et al., 2022). The cage occupancy and gas composition of CH4–C3H8 mixed gas hydrates during formation have been extensively studied (Aladko et al., 2002; Uchida et al., 2004a; Hester et al., 2007; Schicks and Luzi-Helbing, 2013; de Menezes et al., 2019; Klapproth et al., 2019). The results of these studies indicate that even a small amount of C3H8 mixed with CH4 shifts the hydrate structure from sI to sII, significantly enhancing the stability range of the resulting hydrate phase, whereby the composition of the hydrate phase plays a crucial role when evaluating the dissociation process of CH4–C3H8 mixed gas hydrates.
The dissociation of CH4–C3H8 mixed gas hydrates can be triggered by, among others, ocean warming, submarine landslides, and depressurization or heating during production. It was observed that under depressurization, CH4 is preferentially released over C3H8 due to cavity size effects (Sun et al., 2018), resulting in highly concentrated CH4 which can be effectively separated (Truong-Lam et al., 2020). The dissociation rate follows CH4 in 512 ≥ CH4 in 51264 > C3H8 in 51264. Under heating, Tang et al. (2018) reported similar dissociation rates for small and large cages, while Pan et al. (2023) showed that CH4 release is faster than C3H8, with preferential dissociation of small cages. Molecular dynamics simulations further revealed that CH4 and C3H8 molecules remain in a quasi-liquid layer at the hydrate surface, slightly delaying further dissociation (Naeiji et al., 2024). Although these studies elucidate hydrate dissociation mechanisms, they mainly address simplified systems, leaving the role of natural marine sediments insufficiently understood.
Over the past decades, significant efforts have been devoted to investigating the dissociation of gas hydrates in porous media, involving various materials such as artificial porous media (e.g., silica gel, glass beads), quartz sand, and clayey silts (Yu et al., 2024; Wu et al., 2025). Handa and Stupin (1992) suggested that the dissociation pressure of CH4–C3H8 hydrates in small pores of porous media was higher than those without pores. Riestenberg et al. (2003) and Prasad et al. (2012) found that CH4 hydrate dissociation behavior in bentonite-clay was similar to that in silica. Uchida et al. (2004b) indicated the dissociation conditions of CH4 hydrates are primarily influenced by pore sizes, with less influence from surface textures and mineral components. Liu et al. (2008) discovered that particle size impacts the ratio of large to small cages during CH4 hydrate dissociation. Prasad et al. (2012) noted that the dissociation rate of CH4 hydrates in fine beads was slower, while Zhao et al. (2015) suggested that the hydrate dissociation rate increases as the particles size decreases. These studies highlight the critical role of sediments in gas hydrate dissociation. However, the dissociation dynamics of CH4–C3H8 mixed gas hydrates in natural marine sediments under controlled heating and depressurization remain insufficiently explored.
The South China Sea hosts extensive gas hydrate accumulations predominantly in clayey silts, which are fine-grained sediments often enriched with foraminiferal sand and typically exhibit high hydrate saturation levels (Li et al., 2016b). Our previous studies have highlighted the influence of muddy and foraminifera-rich sandy sediments from the South China Sea on the gas enclathration of CH4–C3H8 mixed gas hydrates during formation (Mao et al., 2025), however, their dissociation behavior has not been investigated. In this study, a series of in situ and ex situ Raman spectroscopic measurements were conducted on the dissociation behavior of CH4–C3H8 mixed gas hydrates within five natural sediments (namely, foraminifera-rich sands, mud-foraminifera sand mixtures, and muds), capturing molecular behaviors throughout the entire dissociation process. We primarily investigated how pressure-temperature (P-T) conditions and sediment types affect the dissociation of CH4–C3H8 mixed gas hydrates. Accordingly, dissociation experiments were designed to simulate two key pathways: thermal stimulation and depressurization. We examined the morphology of hydrate crystals during dissociation, and assessed changes in hydrate structure, hydrate composition, and cage occupancy throughout the process. These findings not only deepen the understanding of thermodynamic and kinetic responses of CH4–C3H8 mixed gas hydrates to environmental perturbations in natural sediments, but also provide new insights into sediment-carbon interactions within marine biogeochemical cycles.
2 Materials and methods
2.1 Experimental setups for in situ and ex situ Raman spectroscopic measurements
Raman spectroscopic measurements were conducted using a LabRAM HR Evolution dispersive Raman spectrometer from Horiba Scientific, coupled with an Olympus BX-FM microscope and a data acquisition system. For both in situ and ex situ Raman measurements, a 20× magnification microscope objective lens was utilized. A frequency-doubled Nd/YAG solid-state laser (λ = 532 nm) emitting at an output power of 100 mW served as the excitation source. The confocal pinhole was set to 100 μm during the measurements for both in situ and ex situ Raman measurements, providing optimal spatial resolution in z-direction. A silicon chip was employed as the reference standard for the calibration of the Raman system. In situ experiments were conducted within a custom-made high-pressure cell made of Hastelloy (Figure 1A), featuring an inner sample space volume of approximately 550 μl. This cell is capable of operating within a temperature range of 263 K to 295 K and a pressure range of 0.1 MPa to 10 MPa using a pressure controller (ER 3000, Tescom) regulating the pressure in the cell with a precision of 2% rel. Continuous comparison of the measured actual pressure with the target pressure ensures automatic pressure adjustment and thus constant pressure in the system during the dissociation process.
Figure 1
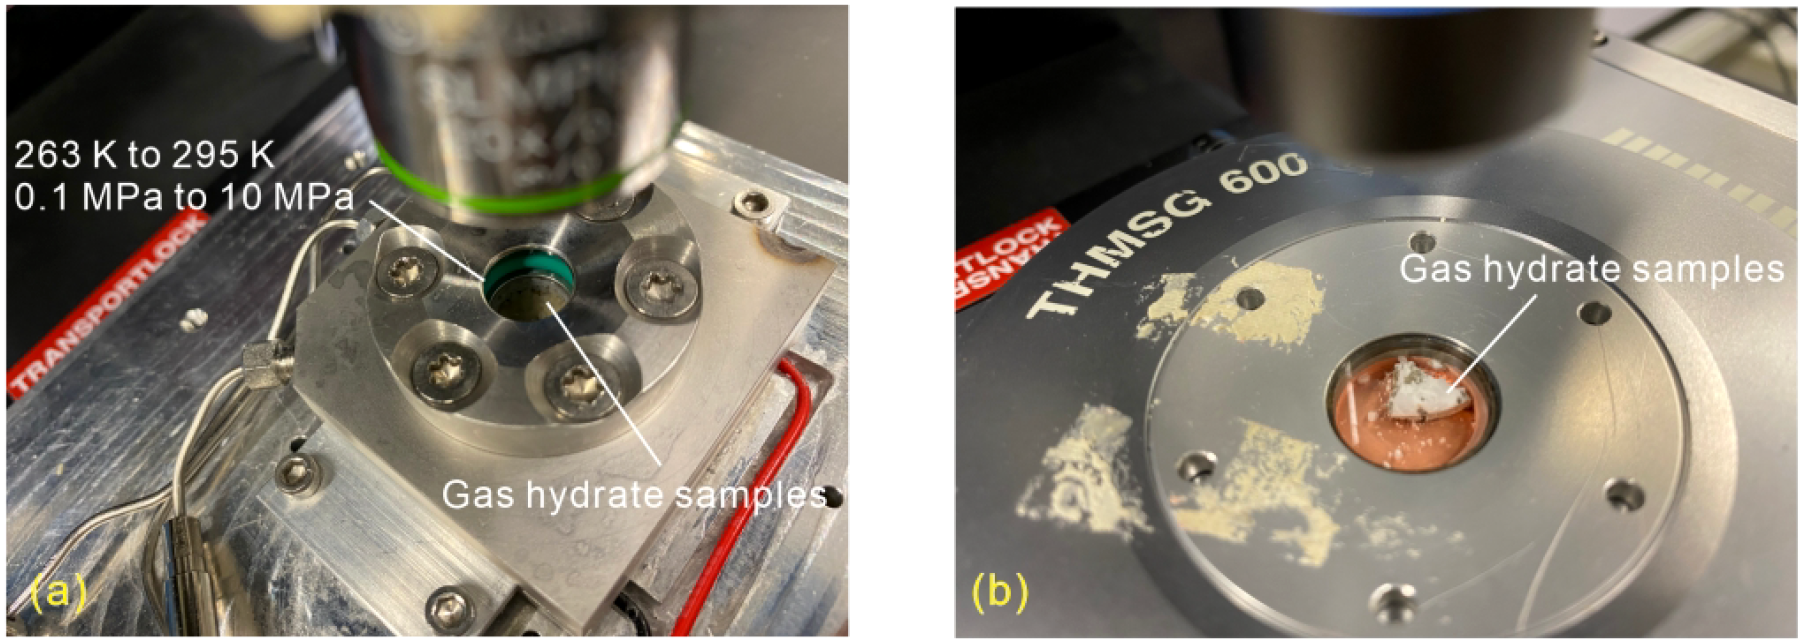
(A) The customized optical high-pressure cell with samples for in situ Raman measurements, and (B) the Linkam cooling stage with samples used for ex situ Raman measurements.
Ex situ Raman spectroscopic analysis was performed using a Linkam cooling stage (Figure 1B). This system maintained the gas hydrate samples at the target temperature of 173.15 K via liquid nitrogen cooling. Ex situ Raman observations are conducted after the gas hydrates formed in a high-pressure vessel, recovered and transported in liquid nitrogen to the Linkam cooling stage. The high-pressure vessel can be pressurized with gas up to 10 MPa. The internal pressure of the vessel is continuously monitored in real-time by a pressure sensor mounted on top of the vessel, using catmanEasy V4.2.2 software. Additional information concerning the Raman spectroscopy setup, the pressure cell, and data analysis can be found in the publication by Schicks et al. (2020) and Mao et al. (2025).
2.2 Sediments
Five natural marine unconsolidated sediments collected from the South China Sea by the Chinese Geological Survey were utilized: foraminifera-rich sands, mud-foraminifera sand mixtures, and muds. Detailed information about these sediments can be found in our previous publication related to the formation process of CH4–C3H8 mixed gas hydrates in these sediments (Mao et al., 2025). We designate foraminifera-rich sands as sediment 1, mud-foraminifera sand mixtures as sediment 2, and the remaining three mud samples as sediment 3, 4, and 5, respectively. The particle size and mineral composition of these five sediments are shown in Figure 2. The particle size distributions are shown in Supplementary Figure S1 in the Supplementary Materials.
Figure 2
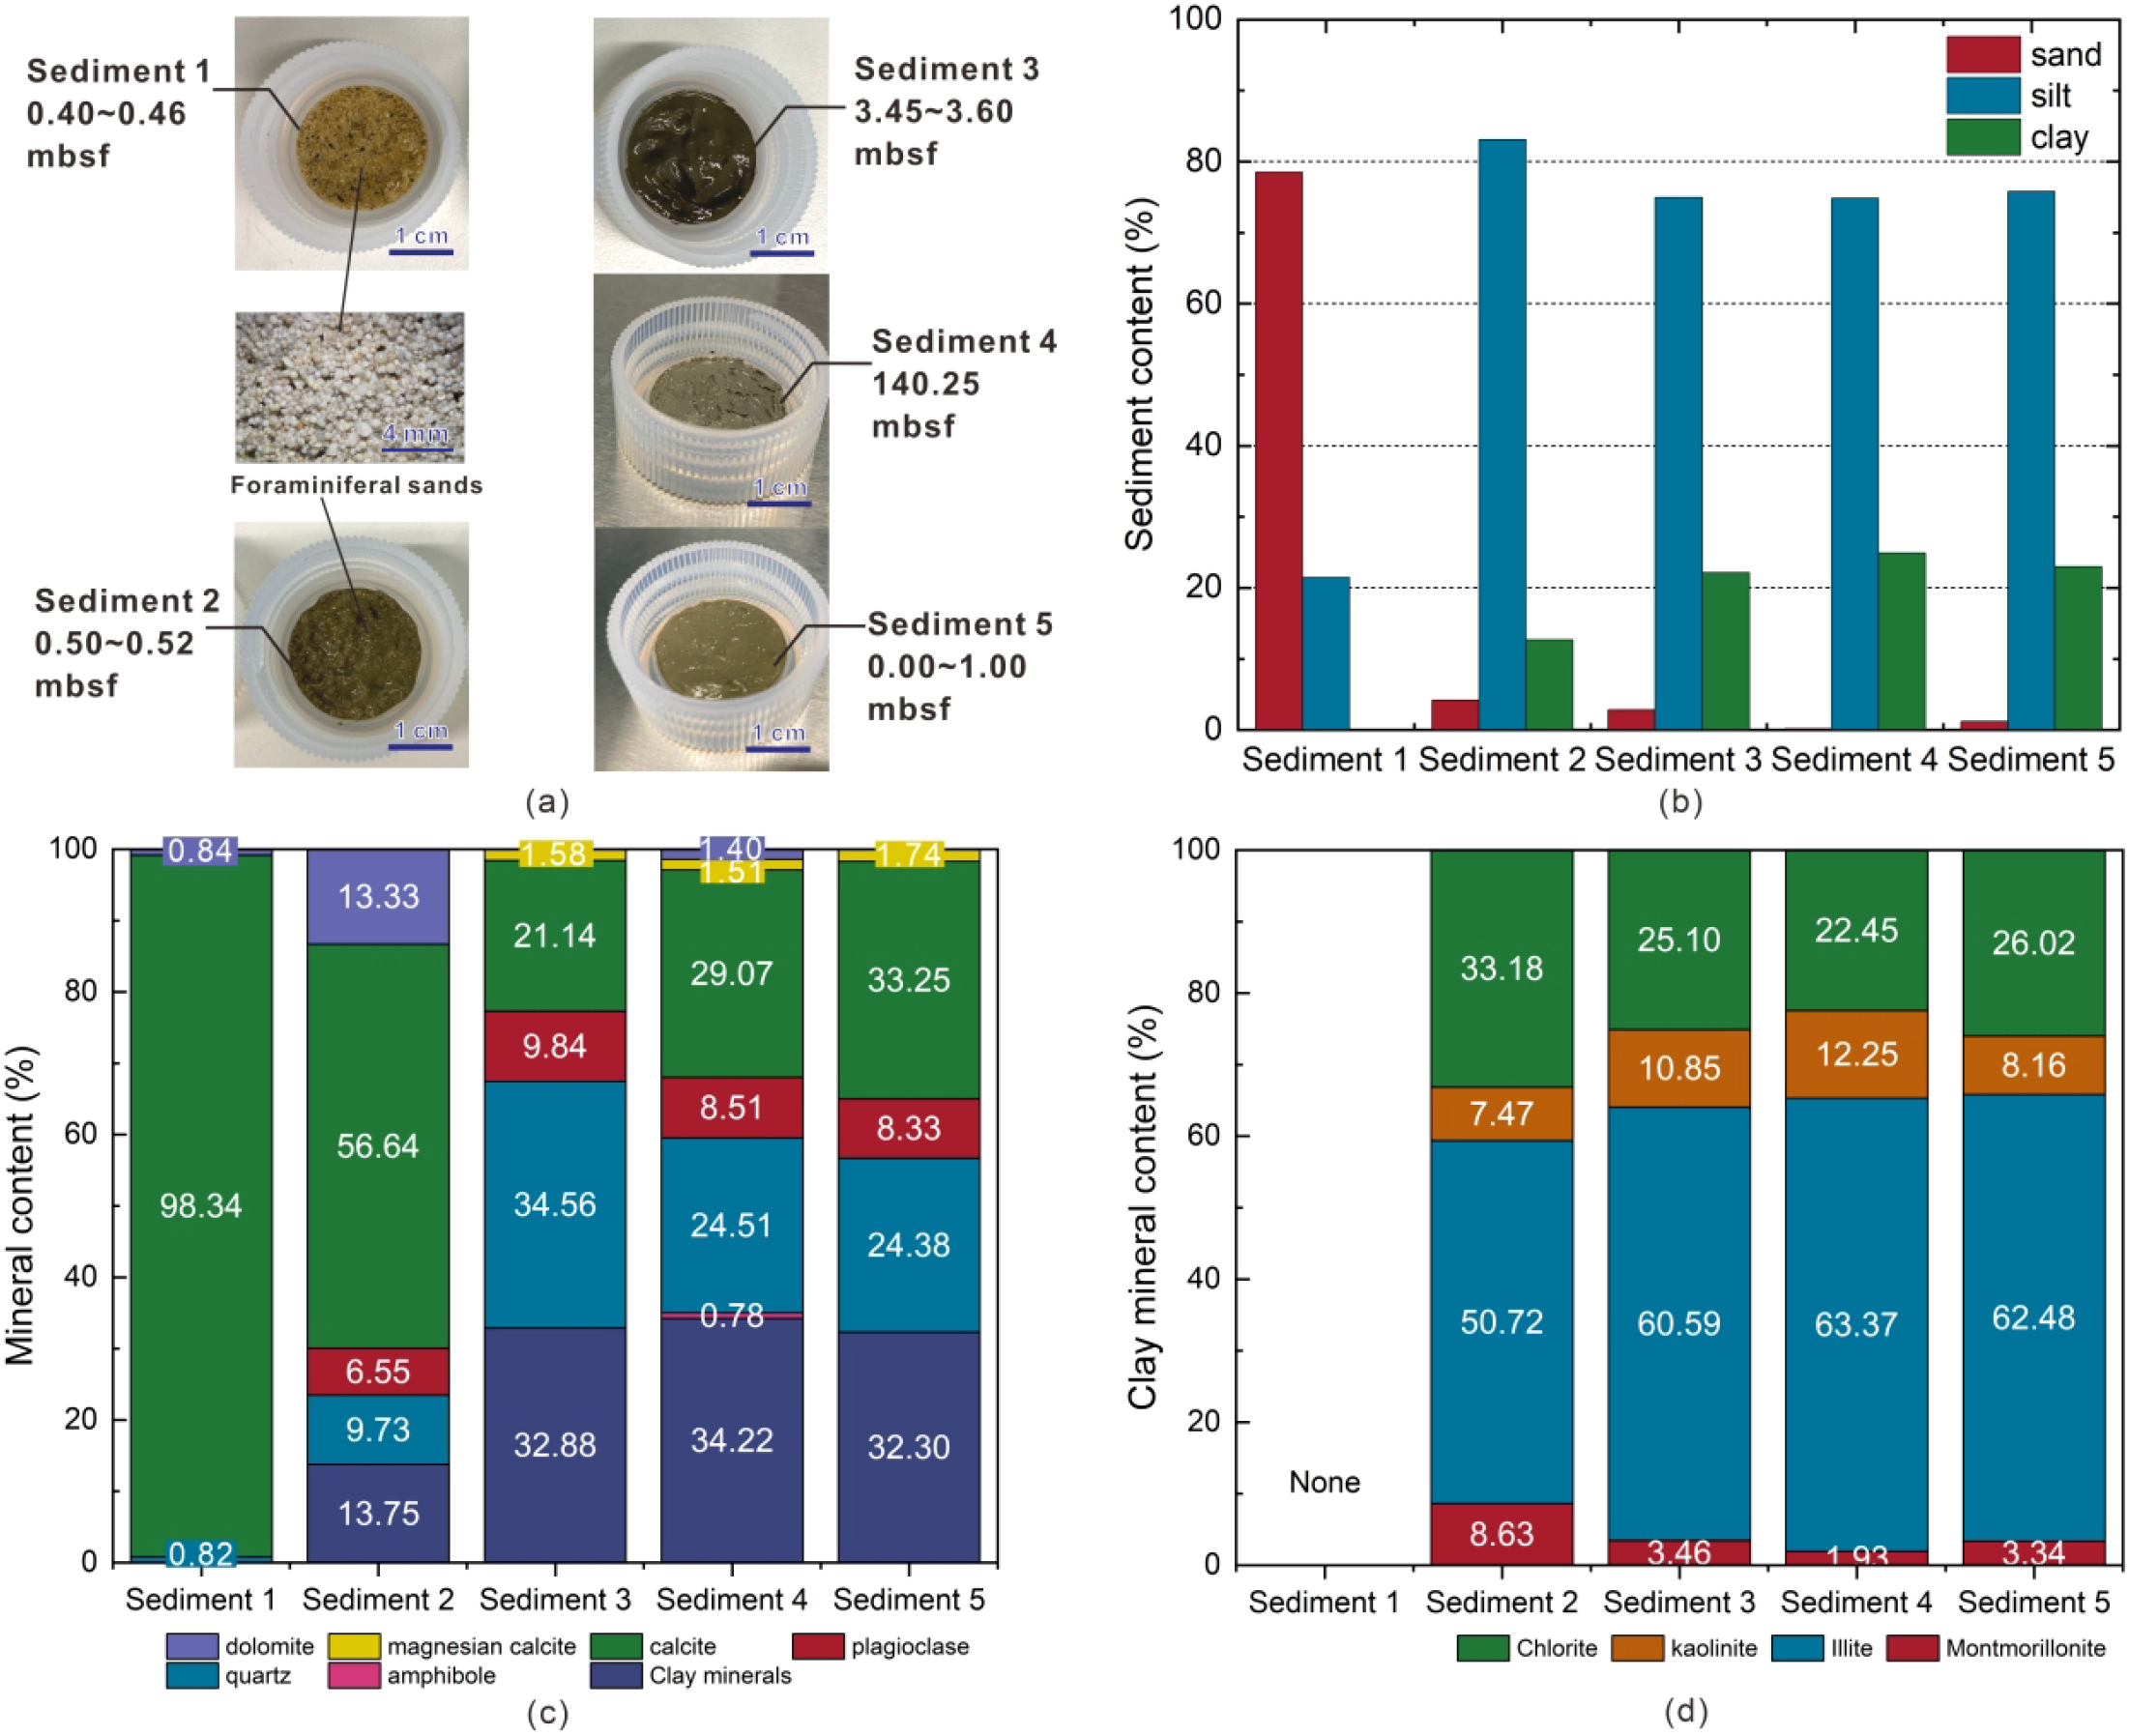
(A) Photographs of the five sediment samples collected from the South China Sea, showing their source depths and a schematic representation of foraminifera present in sediments 1 and 2; (B) sand-silt-clay content distribution of the five natural marine sediments; (C) mineral composition of the five sediments; and (D) clay mineral content distribution.
2.3 Experimental procedure and dissociation conditions
Before conducting in situ Raman measurements, sediments and deionized water were first loaded into the high-pressure cell. The weight and water-to-sediment ratio of samples are listed in Supplementary Table S1 in the Supplementary Materials. The cell was then sealed and pressurized to 5 MPa at 278 K with gas mixtures containing CH4 and C3H8. A continuous gas flow of about 1 ml/min ensures a constant gas composition during the hydrate formation process. To avoid any temperature effects, the incoming gas was pre-cooled. This, coupled with the thorough cooling of the cell and the small sample volume, avoid any thermal gradients within the sample and facilitated rapid achievement of thermal equilibrium. We analyzed the feed gas composition using Raman spectroscopy. The Raman band at 2917 cm-1 represents CH4 molecules in the gas phase, while the Raman band at 869 cm-1 represents C3H8 in the gas phase (Figure 3) (Pan et al., 2023). By calculating the integrated intensities of these two Raman bands, the feed gas composition was determined to be 95.4 mol% CH4 and 4.6 mol% C3H8. For data acquisition and computational procedures, please refer to Mao et al. (2025). During the formation process, gas-hydrate crystals were continuously analyzed by Raman spectroscopy. The dissociation of CH4–C3H8 mixed gas hydrates was induced after a stable hydrate composition and cage occupancy within the hydrate phase were maintained for 4~5 days.
Figure 3
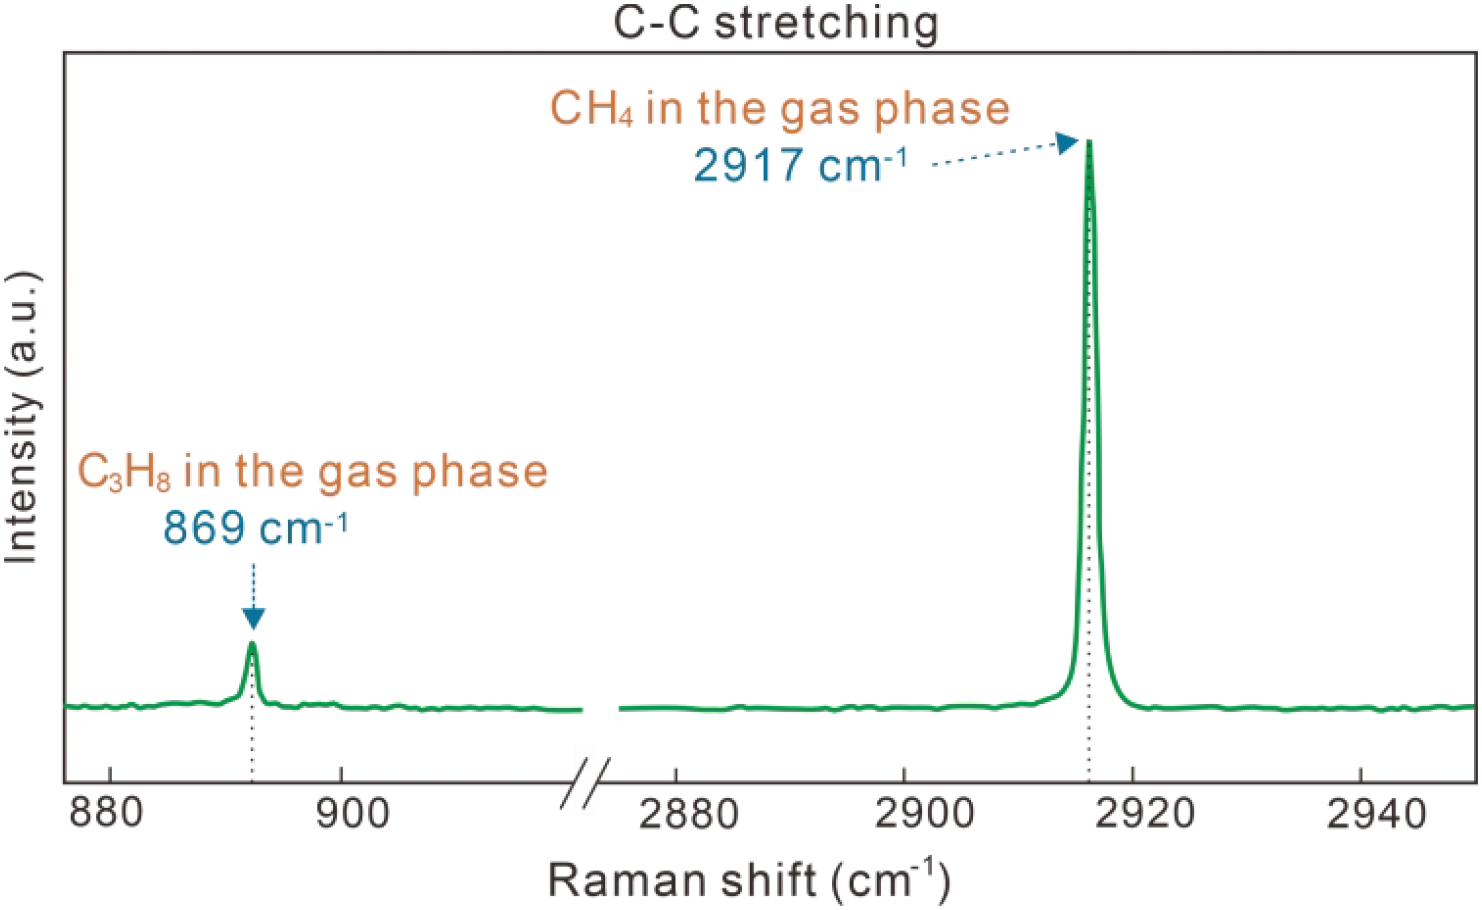
Raman spectra of gas phase in the C-C stretching vibrational interval.
Before conducting ex situ Raman measurements, five different sediment samples, each with a similar water-to-sediment weight ratio (Supplementary Table S1), were individually placed in high-pressure vessels. These vessels were pressurized to approximately 10 MPa using the same CH4–C3H8 mixture as used for the in situ measurements. They were then placed in a cooling freezer where the temperature cycled between 272.15 K and 274.15 K. Throughout the procedure, changes in pressure and temperature within the reactor were monitored and recorded. A pressure decrease was observed during hydrate formation. The pressure in the vessels was monitored until it remained constant for at least 96 hours. This pressure stability indicated the complete transformation of water into gas hydrate. Following this, the synthesized hydrates were recovered from the high-pressure vessels and transferred to a pre-cooled Linkam cooling stage for ex situ Raman observations.
The dissociation of CH4–C3H8 mixed gas hydrates was induced by increasing temperature or decreasing pressure to mimic climate change and its consequences such as global warming and the melting of ice sheets. According to calculations from CSMGem (Sloan and Koh, 2008), the crystals will begin to lose their original morphology near the equilibrium temperature T = 289.65 K at P = 5.0 MPa or the equilibrium pressure P = 1.23 MPa at T = 278.15 K, indicating that dissociation is activated (Figure 4). During the depressurization-induced dissociation process, the pressure was reduced stepwise from 2.5 MPa to 0.8 MPa at intervals of 0.1-0.2 MPa (T = 278.15 K), as shown in Supplementary Figure S2A and Supplementary Table S2 in the Supplementary Materials. The pressure was hold at each step for ~30 mins. During that time, in situ Raman spectrometric measurements were conducted.
Figure 4
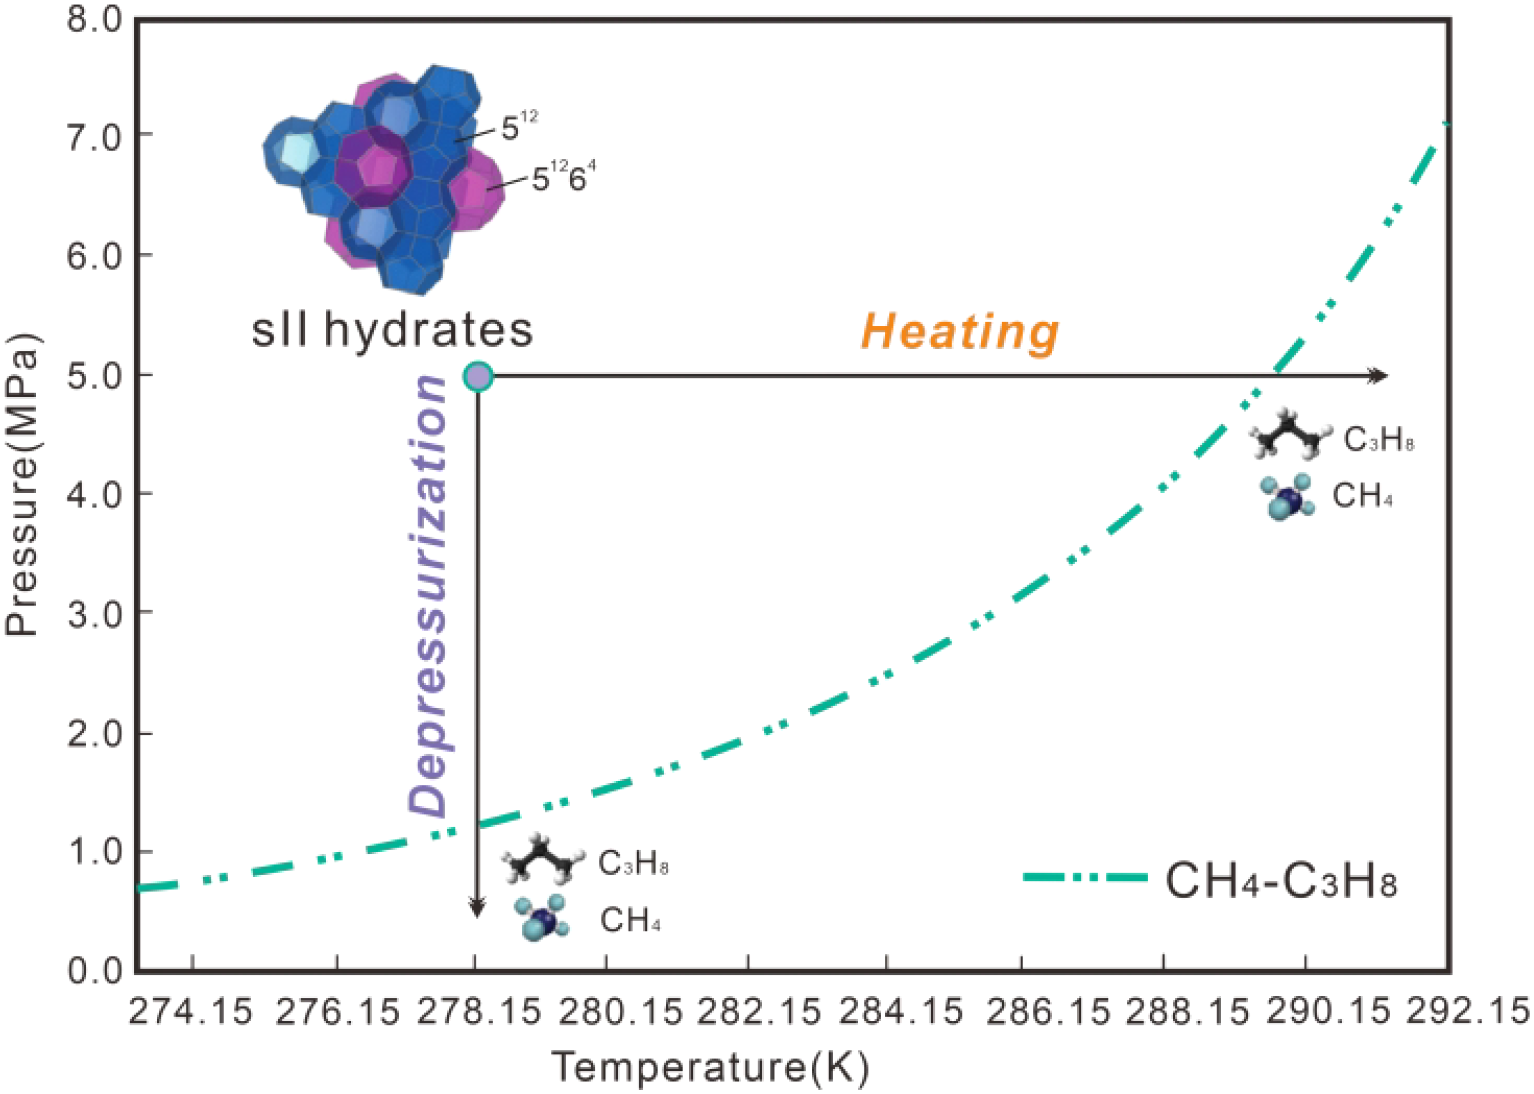
Conceptual illustration of the dissociation pathways of CH4-C3H8 mixed gas hydrates via heating and depressurization. The phase equilibrium curve is calculated using CSMGem with a feed gas composition of 95.4 mol% CH4 and 4.6 mol% C3H8, consistent with the conditions in this study.
During the heating-induced dissociation process, the temperature was increased stepwise from 278.15 K to 288.15 K at increments of 0.5-1.0 K, as detailed in Supplementary Figure S2B and Supplementary Table S2. It should be noted that during the heating-induced dissociation process the pressure maintained constant at P = 5.0 MPa). The temperature was held for 20–35 minutes, during which in situ Raman spectrometric measurements were conducted. Ex situ Raman analyses were initiated at 173.15 K and 0.1 MPa. The temperature was then increased stepwise to 268.15 K at increments of 5–10 K, as shown in Supplementary Figure S2C and Supplementary Table S2. The temperature at each step was maintained for at least 6 minutes during ex situ Raman spectrometric measurements, with the specific duration adapted to ensure optimal spectral quality at each temperature condition. Once significant hydrate dissociation was observed, the temperature was held constant. Only after no further morphological changes occurred the temperature was raised again. It is worth noting that ex situ Raman spectroscopic experiments only support heating-induced dissociation.
Selected hydrate crystals were continuously monitored and analyzed at each pressure/temperature step. During both in situ and ex situ Raman spectroscopic measurements, the laser beam was focused on the surface of different hydrate crystals formed in the natural sediments. For each run with a specific sediment, either three or seven hydrate crystals were selected for analysis. At each pressure/temperature step, Raman spectra were measured for each of the selected hydrate crystals. For the in situ measurements, seven crystals were selected and used to determine the hydrate composition and respective cage occupancy. During the ex situ Raman measurements, three different hydrate crystals were analyzed. Replicate experiments were conducted for each run to ensure reproducibility. For certain sediments, more than two repetitions were performed to guarantee the reliability and accuracy of the results. For instance, additional replicates were conducted for depressurization-induced dissociation in sediments 1 and 2 (in situ Raman measurements), heating-induced dissociation in sediments 2 and 3 (in situ Raman measurements), and heating-induced dissociation in sediment 1 and 5 (ex situ Raman measurements). In this study, however, only two representative sets of results are presented. We would like to point out here that when the Raman measurements on the gas hydrate crystals were carried out during their decomposition, not all selected crystals could be analyzed by the end of the experiment, as the decomposition process was completed earlier for some crystals than for others. The crystals were therefore not always analyzed in the same order.
2.4 Raman spectra data analysis
The Raman band observed at 876 cm-1 corresponds to the C−C stretching vibrations of C3H8 encased into the larger 51264 cavities of sII hydrates (Figure 5). The Raman bands at 2902 cm-1 and 2912 cm-1 represent CH4 within the larger 51264 and smaller 512 cavities of sII hydrates, respectively (Figure 5). In this study, the large-to-small cavity ratio was only accurately calculated using results from ex situ Raman measurements in the absence of a coexisting gas phase. This approach was chosen primarily to avoid an incorrect calculation of the integrated intensities for the Raman bands of CH4 in 512 cages (2912 cm-1) and CH4 in the gas phase (2917 cm-1) (Figure 5). This is because these two bands are very close to each other, making a clear assignment difficult. Especially with low intensities of the Raman bands, a partial overlapping of the bands could lead to considerable misinterpretations. Therefore, no calculation of the large-to-small cavity ratio was performed on the basis of the in situ Raman measurements.
Figure 5
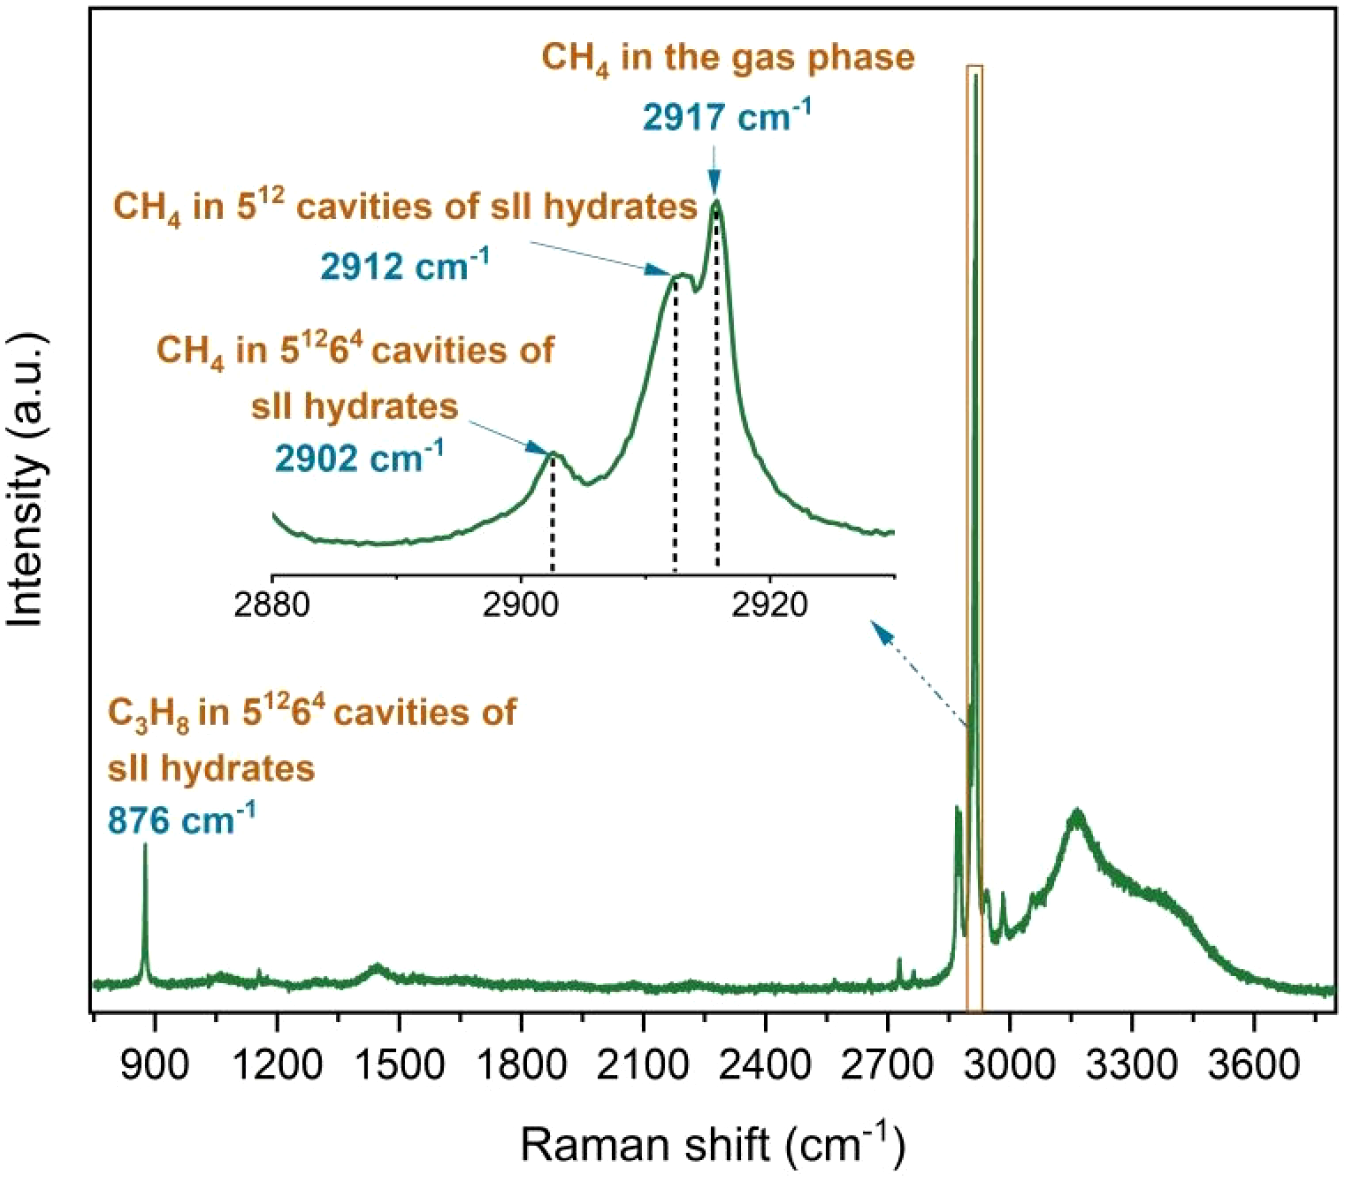
Raman spectra obtained from in situ Raman measurements showing C-C stretching vibrations for C3H8 molecules encased in hydrate cavities at 876 cm-1, CH4 molecules encased in the large (51264) cavities at 2902 cm-1, and in the small (512) cavities at 2912 cm-1, as well as the CH4 molecule in the gas phase at 2917 cm-1.
The molar composition of the gas and hydrate phases was determined semi-quantitatively using Raman spectroscopy. The calculation method followed the approach outlined by Beeskow-Strauch et al. (2011). In a mixed system, the molar fraction of a specific component can be derived using the simplified Equation 1, which is based on Placzek’s ratio method (Placzek, 1934). This method is applicable because the integrated intensity of a component’s Raman band is directly proportional to the number of molecules present in the sample.
In this equation, Xa denotes the molar fraction of component a, Aa represents the integrated intensity of its Raman band, corresponds to the Raman scattering cross-section factor of component a, and accounts for instrumental efficiency. The index i and Σ signify the respective values for all species in the sample and their total sum. To improve accuracy, Raman band areas were adjusted using wavelength-independent scattering cross-section factors. These factors are assumed to remain constant regardless of pressure variations, cage structure, or phase composition (Schrötter and Klöckner, 1979; Schrader, 1995; Burke, 2001).
The large-to-small cavity ratio was determined from ex situ Raman measurements using Equation 2. This calculation assumes that CH4 occupies both the small 512 and large 51264 cavities in sII hydrate, while C3H8 is exclusively confined to the large 51264 cavities.
Here, a represents the integrated intensity of a specific Raman band recorded in the spectrum. In this study, the relative Raman scattering cross-section factors applied were 8.63 for CH4 and 1.60 for C3H8 (Schrader, 1995; Burke, 2001).
3 Results
3.1 Depressurization-induced dissociation process
The CH4 content and C3H8 content of individual hydrate crystals from the five sediments, measured before depressurization-induced dissociation, vary slightly (Figure 6). The C3H8 content ranges from 20 mol% to 40 mol% in the hydrate phase, and the CH4 concentration is between 60 mol% and 80 mol% for the hydrate crystals before the dissociation process starts. The average hydrate phase composition before dissociation is close to the composition calculated by CSMGem, approximately 66.5 mol%. CH4 and 33.5 mol% C3H8. This significant enrichment of C3H8 into the hydrate phase is a result of its preferred incorporation into the large 51264 cages of the structure II hydrate. Due to their size, C3H8 molecules are preferentially enclosed in the large cages, on which they exert a superior stabilizing effect compared to CH4 (Schicks and Luzi-Helbing, 2013; Medvedev et al., 2015; Du et al., 2023; Mao et al., 2025), leading to a higher stability of the resulting hydrate phase. For sediments 3 and 5, Runs 1 and 2 show a slight difference in the pressures at which a significant change in the morphology of the hydrate crystals was observed. The changes in the composition of the hydrate phase show a similar development in both runs, independently of this.
Figure 6
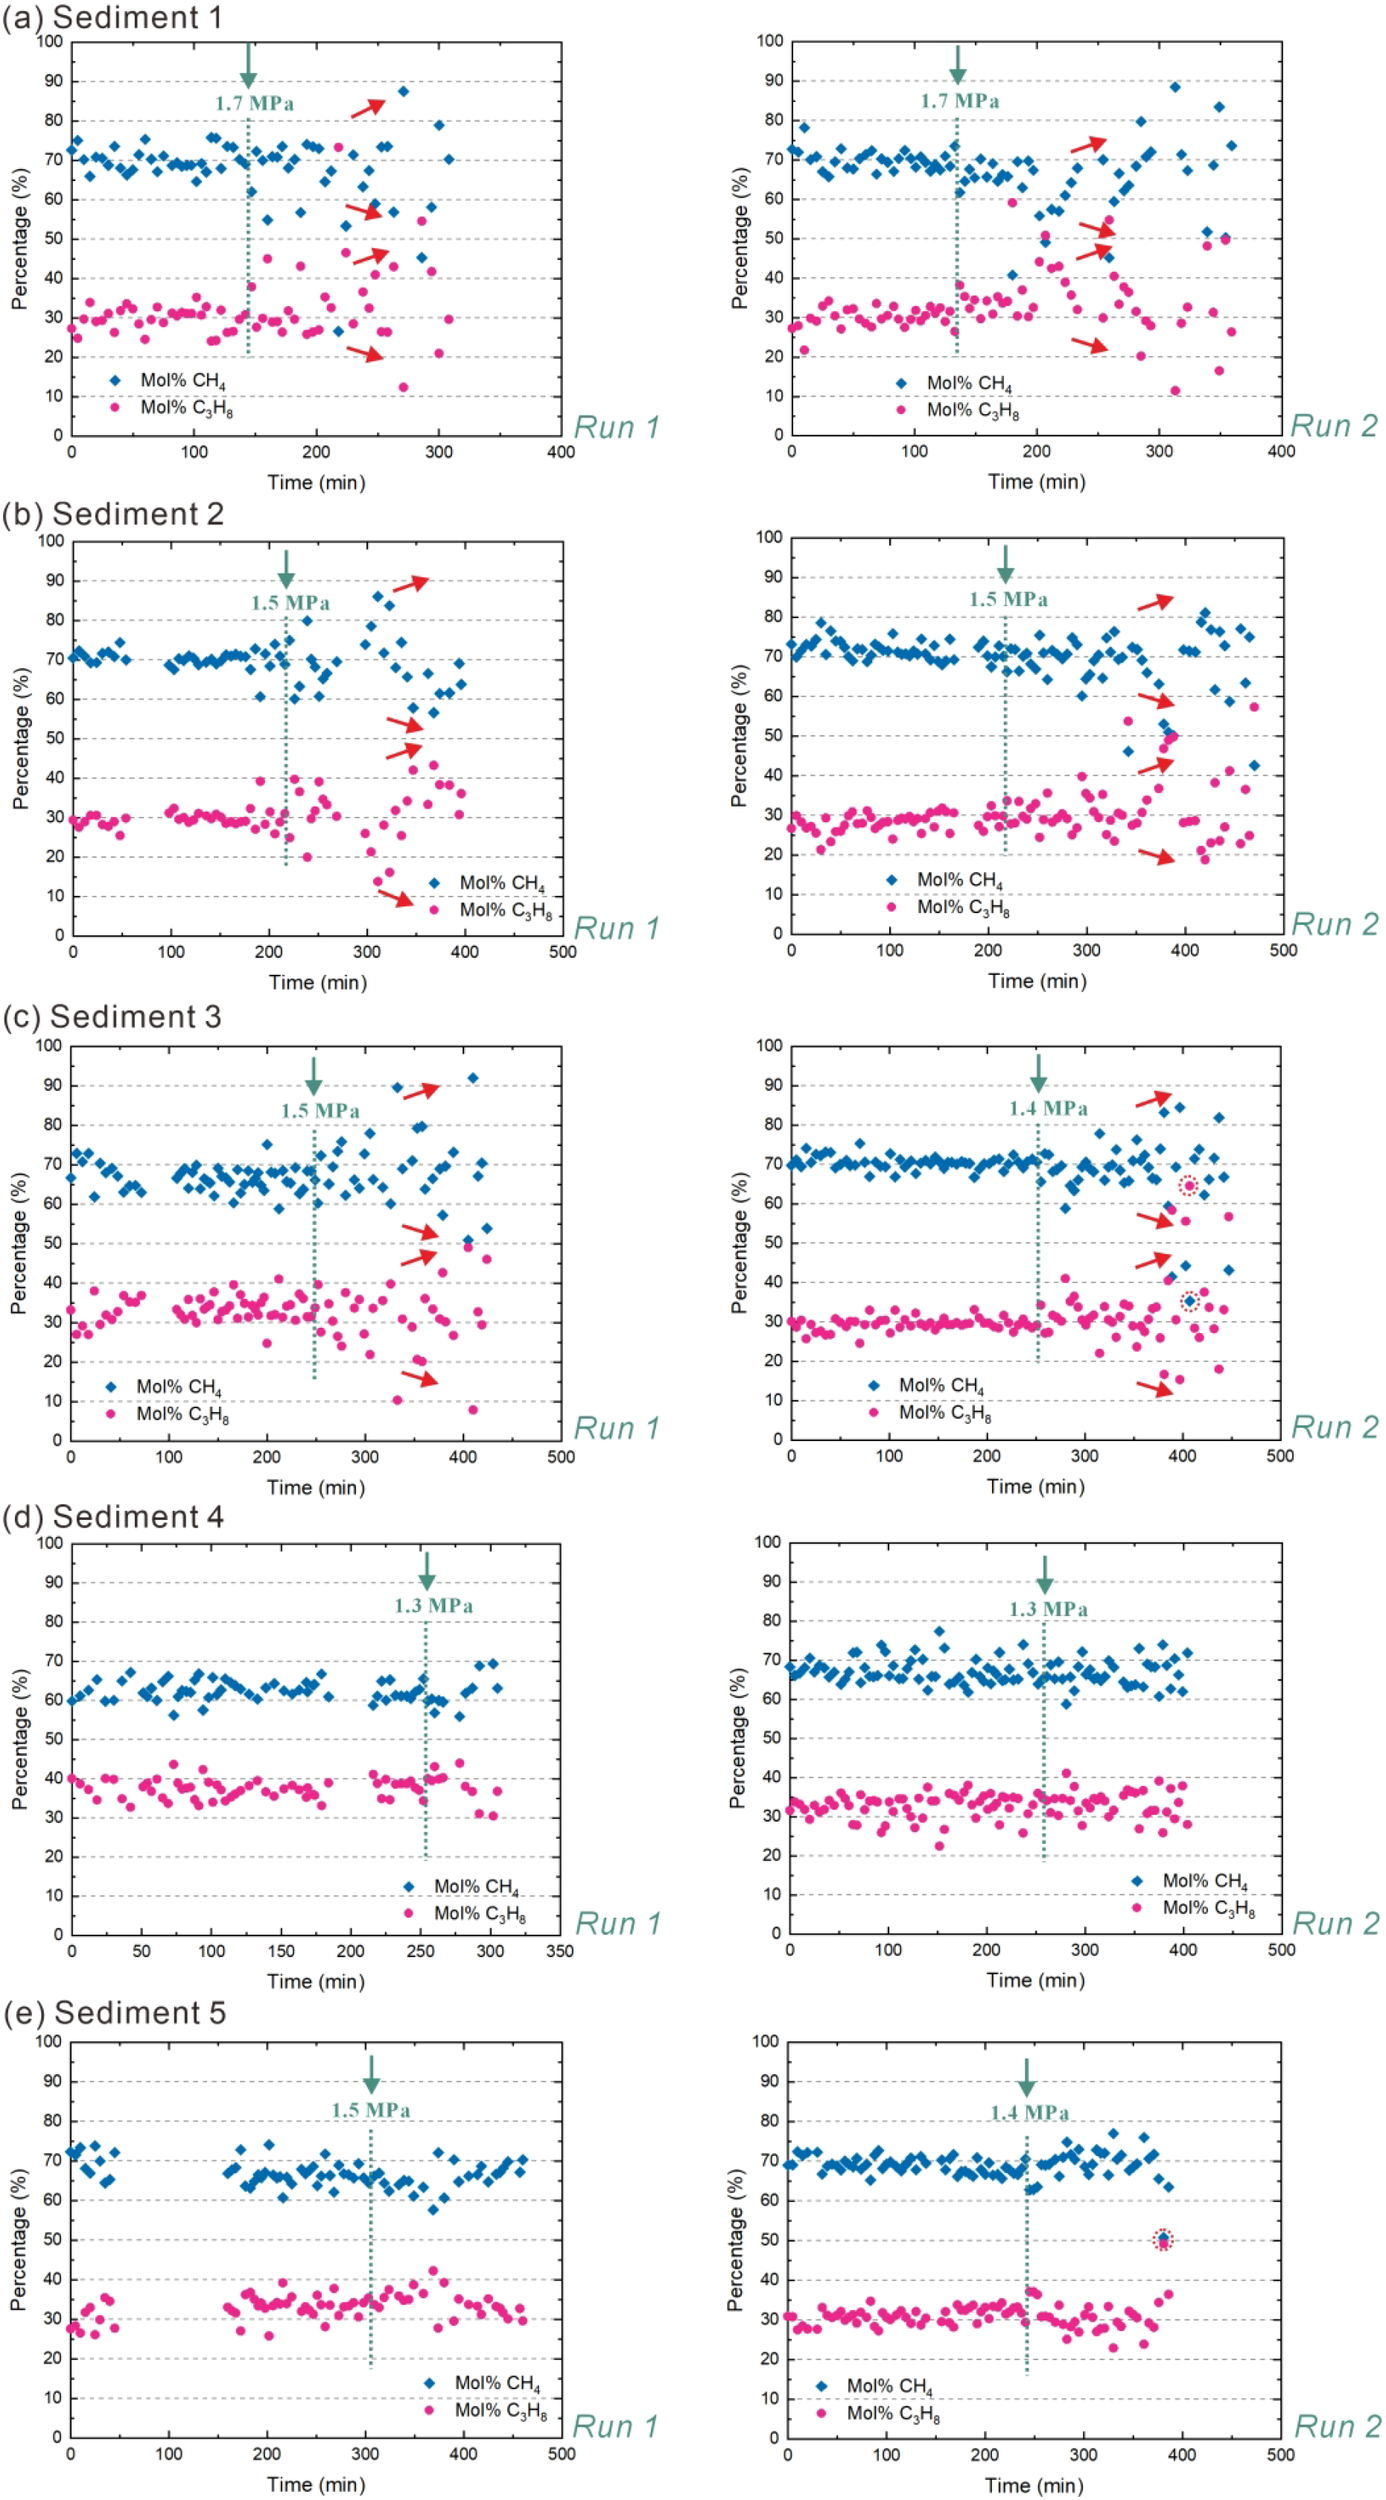
Depressurization-induced dissociation of CH4–C3H8 mixed gas hydrates in five different sediments during in situ Raman measurement. Sub-panels (a–e) correspond to Sediment 1, 2, 3, 4, and 5, respectively. The pressure was reduced stepwise from 2.5 MPa to 0.8 MPa at intervals of 0.1-0.2 MPa (T = 278.15 K). The green dashed line corresponds to the time at which there is a significant change observed regarding the morphology of the hydrate crystal. The pressure values above the green dashed line (under the green arrow) represent the internal pressure of the experimental vessel at the moment when a significant change in the morphology of the hydrate crystal was observed. Since some of the Raman spectra taken from the dissociating hydrate crystals showed a signal-to-noise ratio which was at the limit, we marked these data points with red dashed circles; the same applies below. For each sediment type, two experiments were conducted (Run 1 and Run 2) to verify the reproducibility of the results. Run 1 and Run 2 are only used to indicate that the data of two sets of experiments are present, and the same applies below. In sediments 1-3, the red arrows to the right of the green dashed line indicate the temporal evolutionary of mol% C3H8 or mol% CH4 over time after a significant morphological change occurs in the hydrate crystal. The absence of a red arrow indicates that the content of mol% C3H8 or mol% CH4 remains constant.
The mixed gas hydrates formed in sediments 1, 2 and 3, showed a strong increase in compositional variation after reaching the reduced pressure at which the significant change in hydrate crystal morphology occurred. In other words, the relative concentration of CH4 in hydrate crystals exhibited different behaviors among sediments 1, 2, and 3, with values increasing in some dissociating crystals while decreasing in others (Figures 6A-C). Accordingly, the relative content of C3H8 also changes correspondingly. This indicates that in some hydrate crystals, the release rate of C3H8 molecules is faster than that of CH4 molecules, while in others, the release rate of CH4 molecules is faster than that of C3H8 molecules. It should be noted that due to the non-stoichiometric character of gas hydrates their composition varies between individual hydrate crystals but also within a hydrate crystal (Schicks et al., 2020). When the decomposition begins, it does not immediately affect the entire crystal, but starts at its surface. Due to the dissociation of the unit cells at the interface between the hydrate crystal and its environment, deeper layers of the crystal form the surface. In other words, the hydrate decomposition continues layer by layer as described in Pan et al. (2023). Since the composition of the hydrate crystals may also fluctuate from layer to layer, the compositional changes of the individual hydrate crystals as well as the entire hydrate phase do not show consistent changes in CH4 or C3H8 concentrations, but – regardless of the absolute fluctuations in concentration – a general tendency regarding the compositional change.
The relative concentrations of CH4 and C3H8 in hydrate crystals in sediments 4 and 5 remain almost unchanged during the entire process (Figures 6D, E), showing only a slight increase in variations, if any. This suggests that the release rates of both, C3H8 and CH4 molecules from the hydrate cages remains in a fixed ratio for these sediments. Furthermore, no alternate transient structures were observed throughout the entire dissociation process, indicating that the collapse of gas hydrate cages occurs uniformly as a single entity.
The morphological changes on the surface of hydrate crystals in sediments 1, 2 and 3 correspond to the changes in hydrate composition. Taking a crystal from sediment 3 as an example (Figure 7A), there is a slight change in the appearance of the hydrate crystal morphology at pressure > 1.5 MPa, but it remains largely unchanged. When pressure decreases to ≤ 1.5 MPa, the hydrate crystals in the central region undergo a distinct morphological transition, coinciding with the pressure at which the hydrate composition begins to show a change. Finally, the crystal completely disappears at 1.2 MPa.
Figure 7
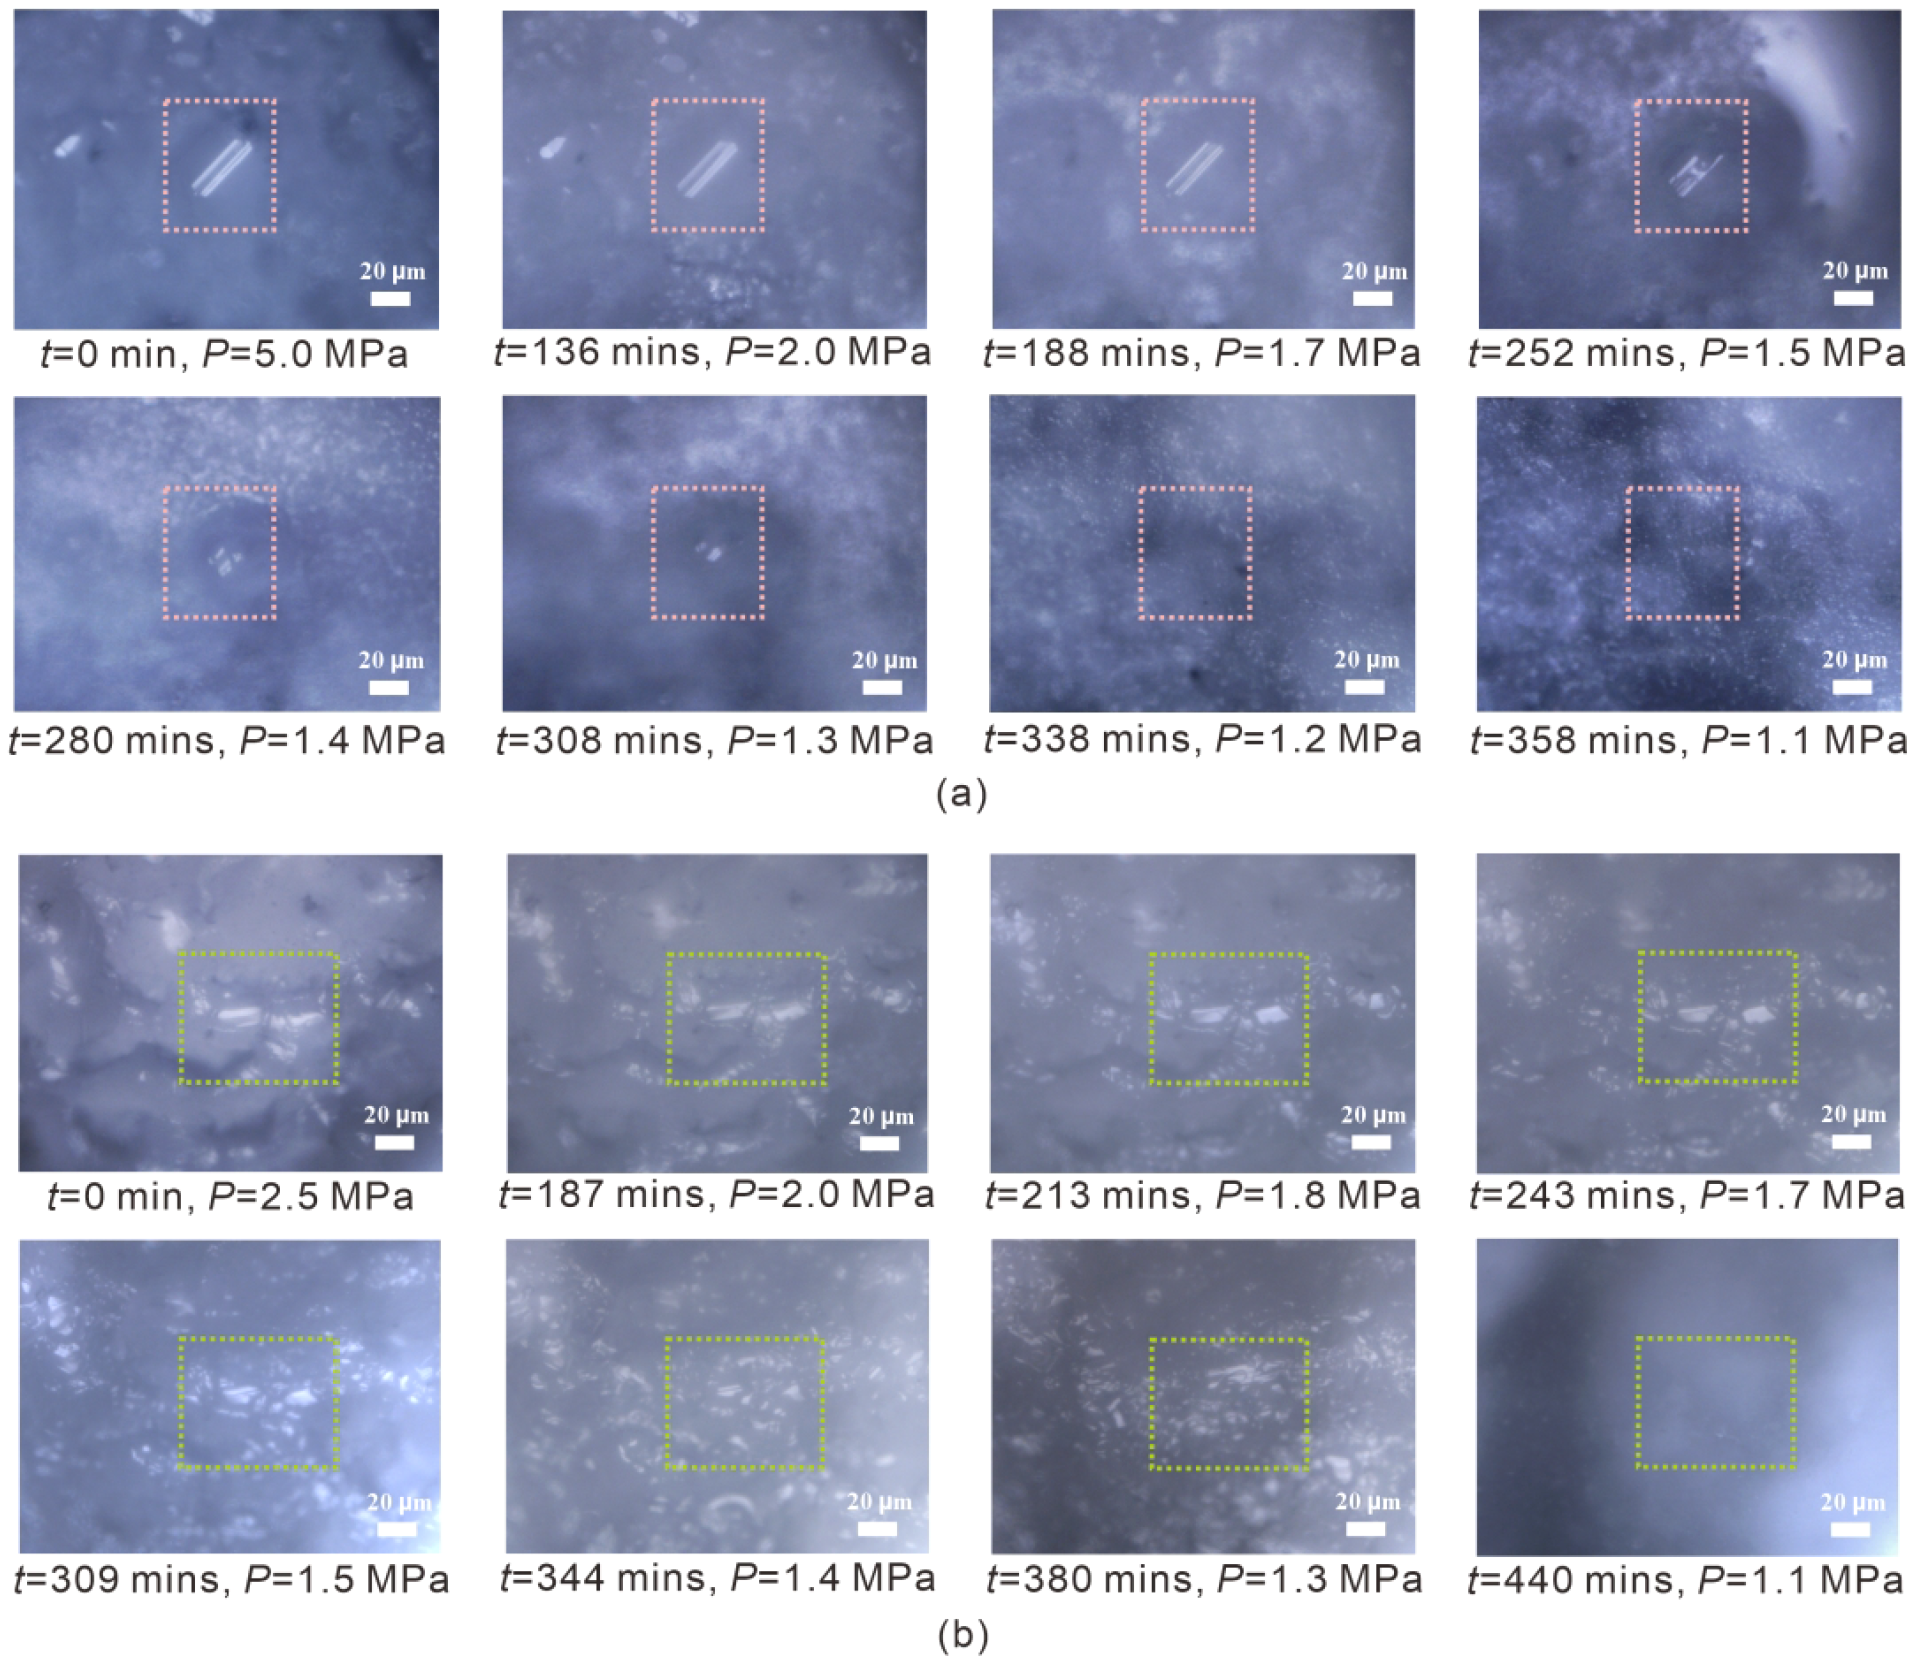
Illustration of the surface morphological changes of one selected hydrate crystal in sediment 3 (Run 1) (A) and sediment 5 (Run 1) (B) during the dissociation process using depressurization-induced method from in situ Raman measurements. The crystals enclosed in the pink- and green-dashed boxes represent the same individual crystals, respectively.
For the gas hydrates in sediments 4 and 5, the average composition remains almost unchanged, and the observed morphological changes on the surface of the hydrate crystals occur more gradually during the depressurization-induced dissociation process. Taking a crystal from sediment 5 as an example (Figure 7B), it appears as if the hydrate crystals are slowly melting without suddenly changing their morphology.
The equilibrium pressure of CH4–C3H8 mixed gas hydrates at around 278.15 K is close to 1.23 MPa using CSMGem, with a feed gas composition of 95.4 mol% CH4 and 4.6 mol% C3H8. The pressure at which the CH4-C3H8 morphology in hydrate crystals begins to change significantly in different sediments is between 1.3 MPa and 1.7 MPa. The dissociation pressure of hydrate crystals in all sediments is higher than the equilibrium pressure.
3.2 Heating-induced dissociation process
3.2.1 In situ Raman measurements
The CH4 content and C3H8 content of hydrate crystals before dissociation by heating in five sediments also vary slightly (Figure 8). The C3H8 content achieves 20~40 mol% in the hydrate phase, and the concentration of CH4 reaches 60~80 mol% for the selected crystals before the dissociation process begins. This range is consistent with the results presented in Figure 6 for the gas hydrate crystals formed for the dissociation process induced by depressurization. In two dissociation experiments using the same sediments, the onset of obvious morphology changes occurs at slightly different temperatures in sediments 3, 4, and 5. Nevertheless, the changes in hydrate composition during the heating-induced dissociation process followed a similar development in both runs.
Figure 8
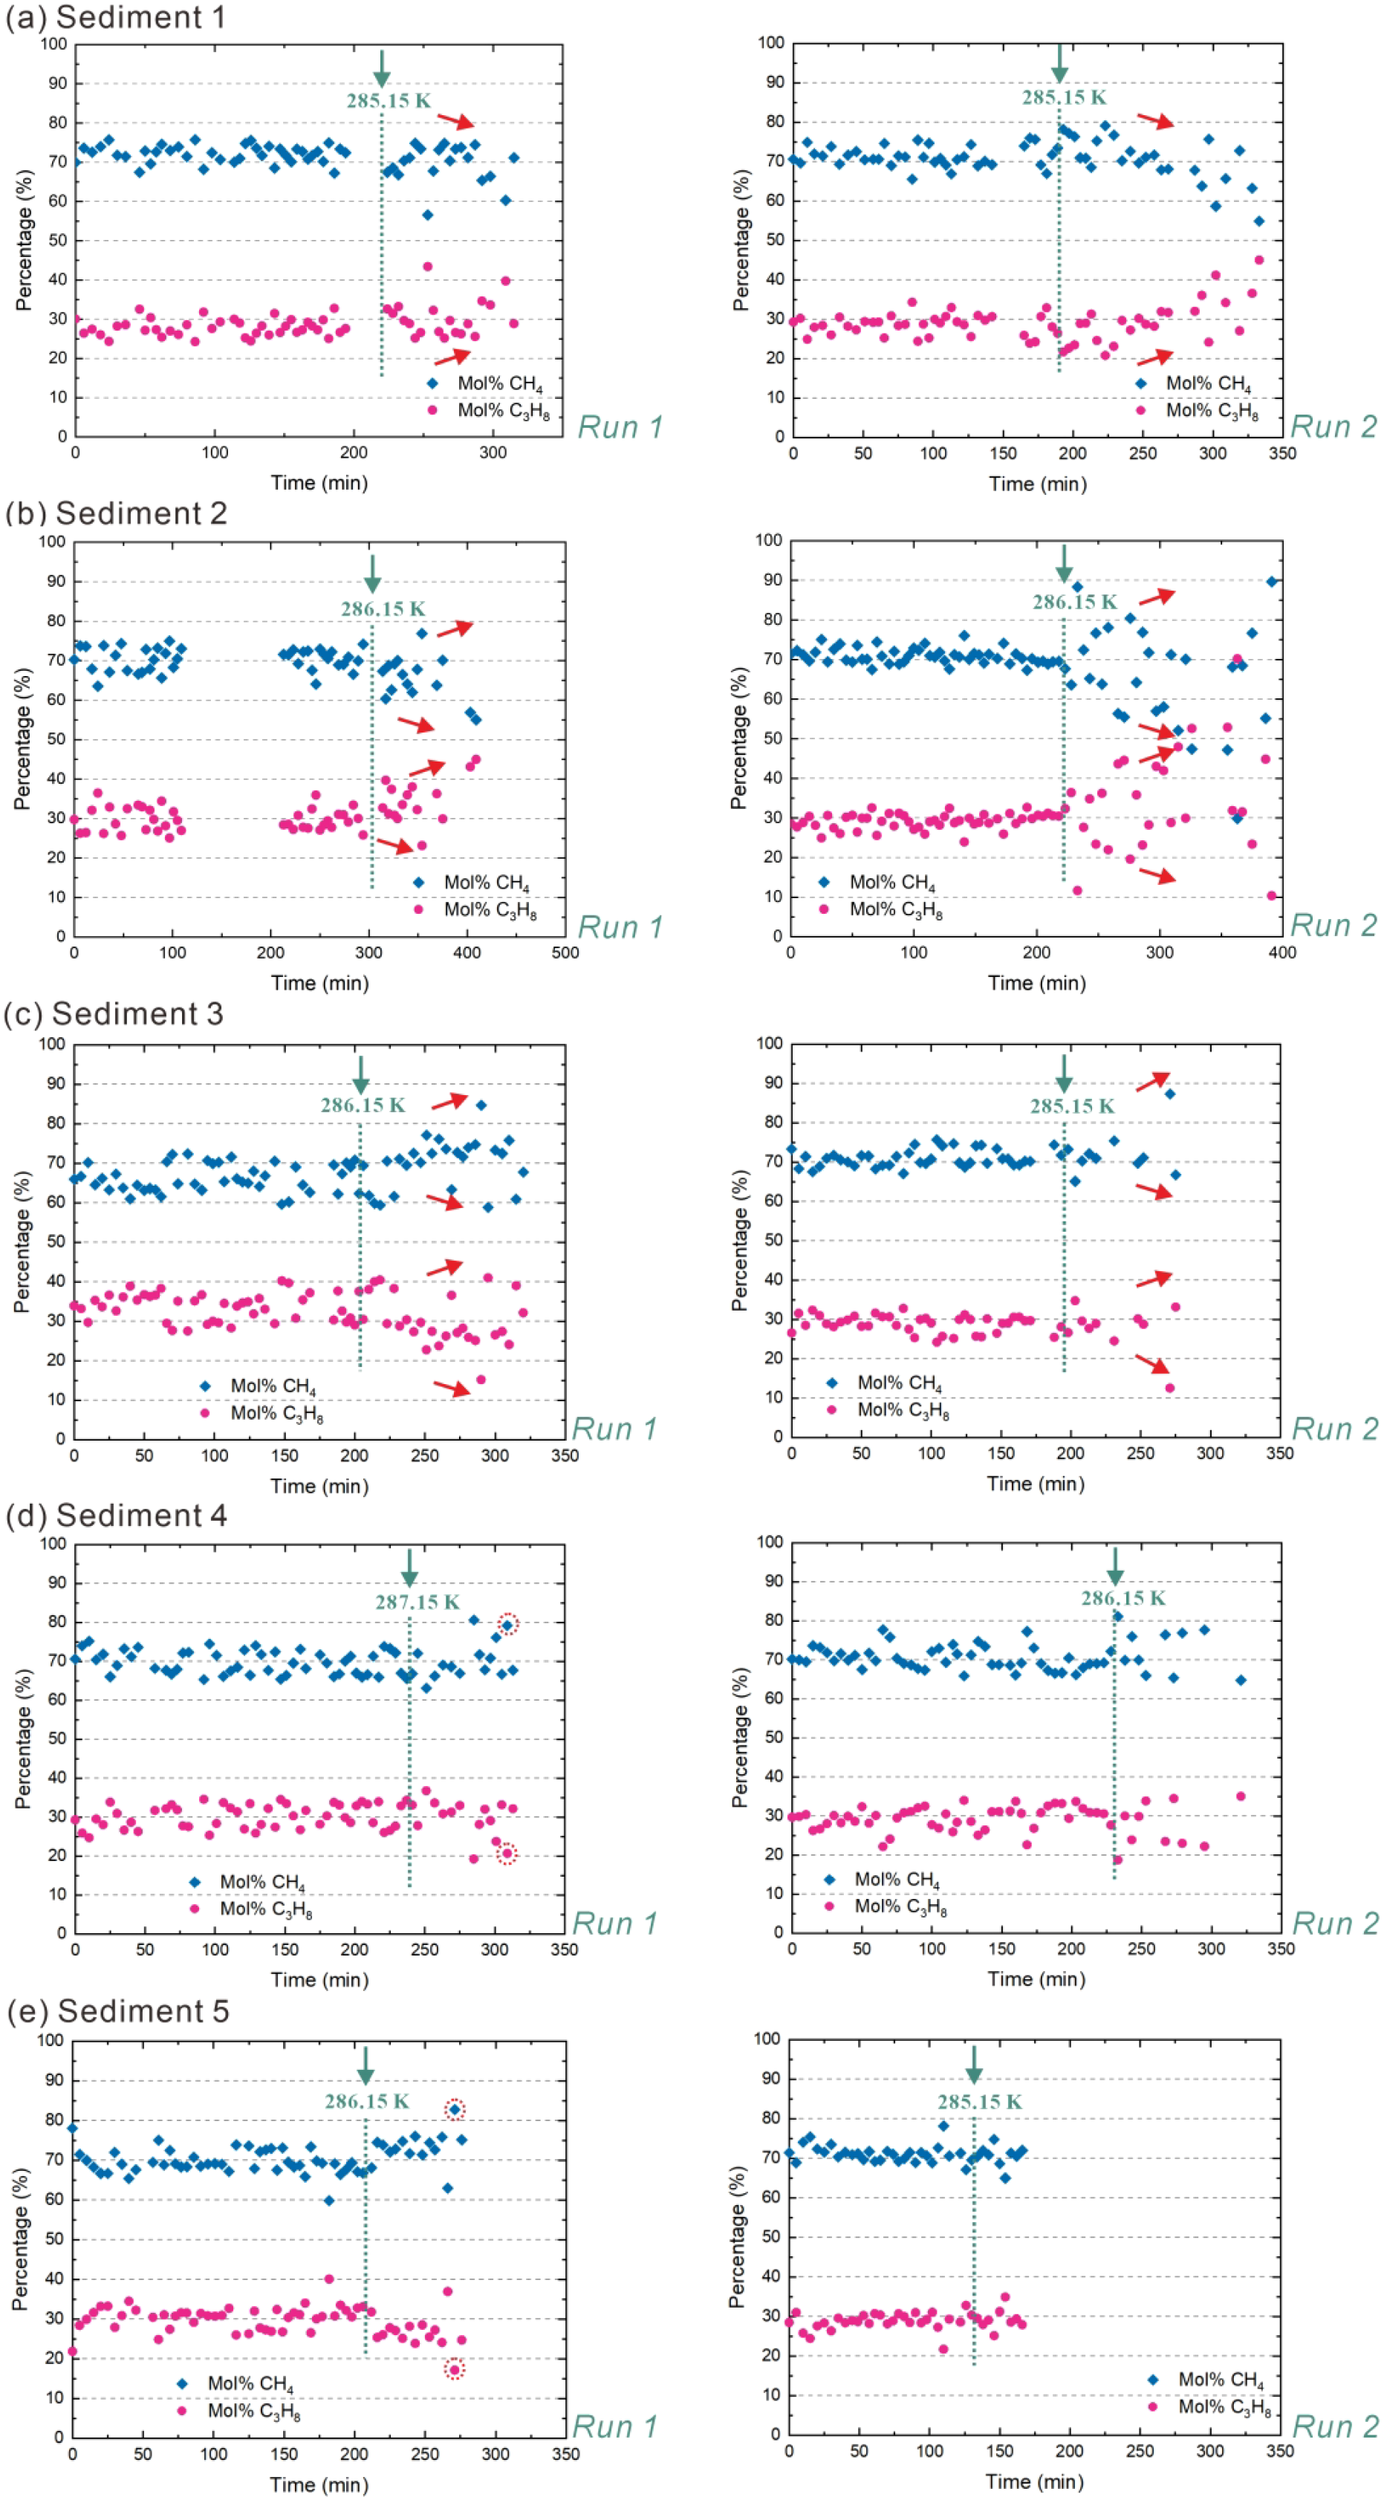
Dissociation of CH4–C3H8 mixed gas hydrates by heating in five different sediments during in situ Raman measurement. Sub-panels (a–e) correspond to Sediment 1, 2, 3, 4, and 5, respectively. The temperature was increased stepwise from 278.15 K to 288.15 K at increments of 0.5-1.0 K under a constant pressure of 5.0 MPa. To better illustrate the hydrate evolution in sediments 2 and 3, two additional in situ measurement figures are provided in Supplementary Figure S3 of the Supplementary Materials. The green dashed line corresponds to the temperature at which there is a significant change observed regarding the morphology of the hydrate crystal. The temperature values above the green dashed line (under the green arrow) represent the internal temperature of the experimental vessel at the moment when a significant change in the morphology of the hydrate crystal was observed. For each sediment type, two experiments were conducted (Run 1 and Run 2) to verify the reproducibility of the results. In sediments 1-3, the red arrows to the right of the green dashed line indicate the directional change in mol% C3H8 or mol% CH4 over time following a significant alteration in hydrate crystal morphology. The absence of a red arrow indicates that the content of mol% C3H8 or mol% CH4 remains constant.
After the temperature reaches the level at which a significant change in hydrate crystal morphology is observed, the relative concentration of CH4 decreases in some hydrate crystals in Runs 1 and 2 of sediment 1 (Figure 8A), indicating that CH4 molecules are released from the hydrate cages faster than C3H8 molecules. In sediments 2 and 3, the relative concentration of CH4 in the hydrate crystals observed in Runs 1 and 2 showed broader variation, with values increasing in some crystals and decreasing in others (Figures 8B, C). Accordingly, the relative content of C3H8 also changed. This indicates that in some hydrate crystals, the release rate of C3H8 molecules from the hydrate cages is faster than that of CH4 molecules, while in others, the release rate of CH4 molecules from the hydrate cages is faster than that of C3H8 molecules. The relative concentrations of CH4 and C3H8 in hydrate crystals in sediments 4 and 5 remain almost unchanged during the dissociation process (Figures 8D, E), exhibiting only a slight increase in variations, if any. This indicates that the release rates of C3H8 and CH4 molecules from the hydrate cages remain in a fixed ratio in the hydrate crystals. Additionally, no other transient structures were observed during the heating-induced dissociation process, and the gas hydrate cages appeared to collapse as an entity.
In sediment 1, noticeable surface morphological changes in hydrate crystals appear prior to any substantial alteration in their composition. For sediments 2 and 3, the pronounced surface morphological changes of hydrate crystals correspond to compositional variations. For instance, when considering a crystal from sediment 3 as an example (Figure 9A), only small changes in the hydrate crystal morphology are observed at temperatures < 286.15 K. However, after the temperature rises to 286.15 K, the hydrate crystals noticeably lose their smooth surface and sharp edges. Finally, the crystal disappeared at 287.15 K.
Figure 9
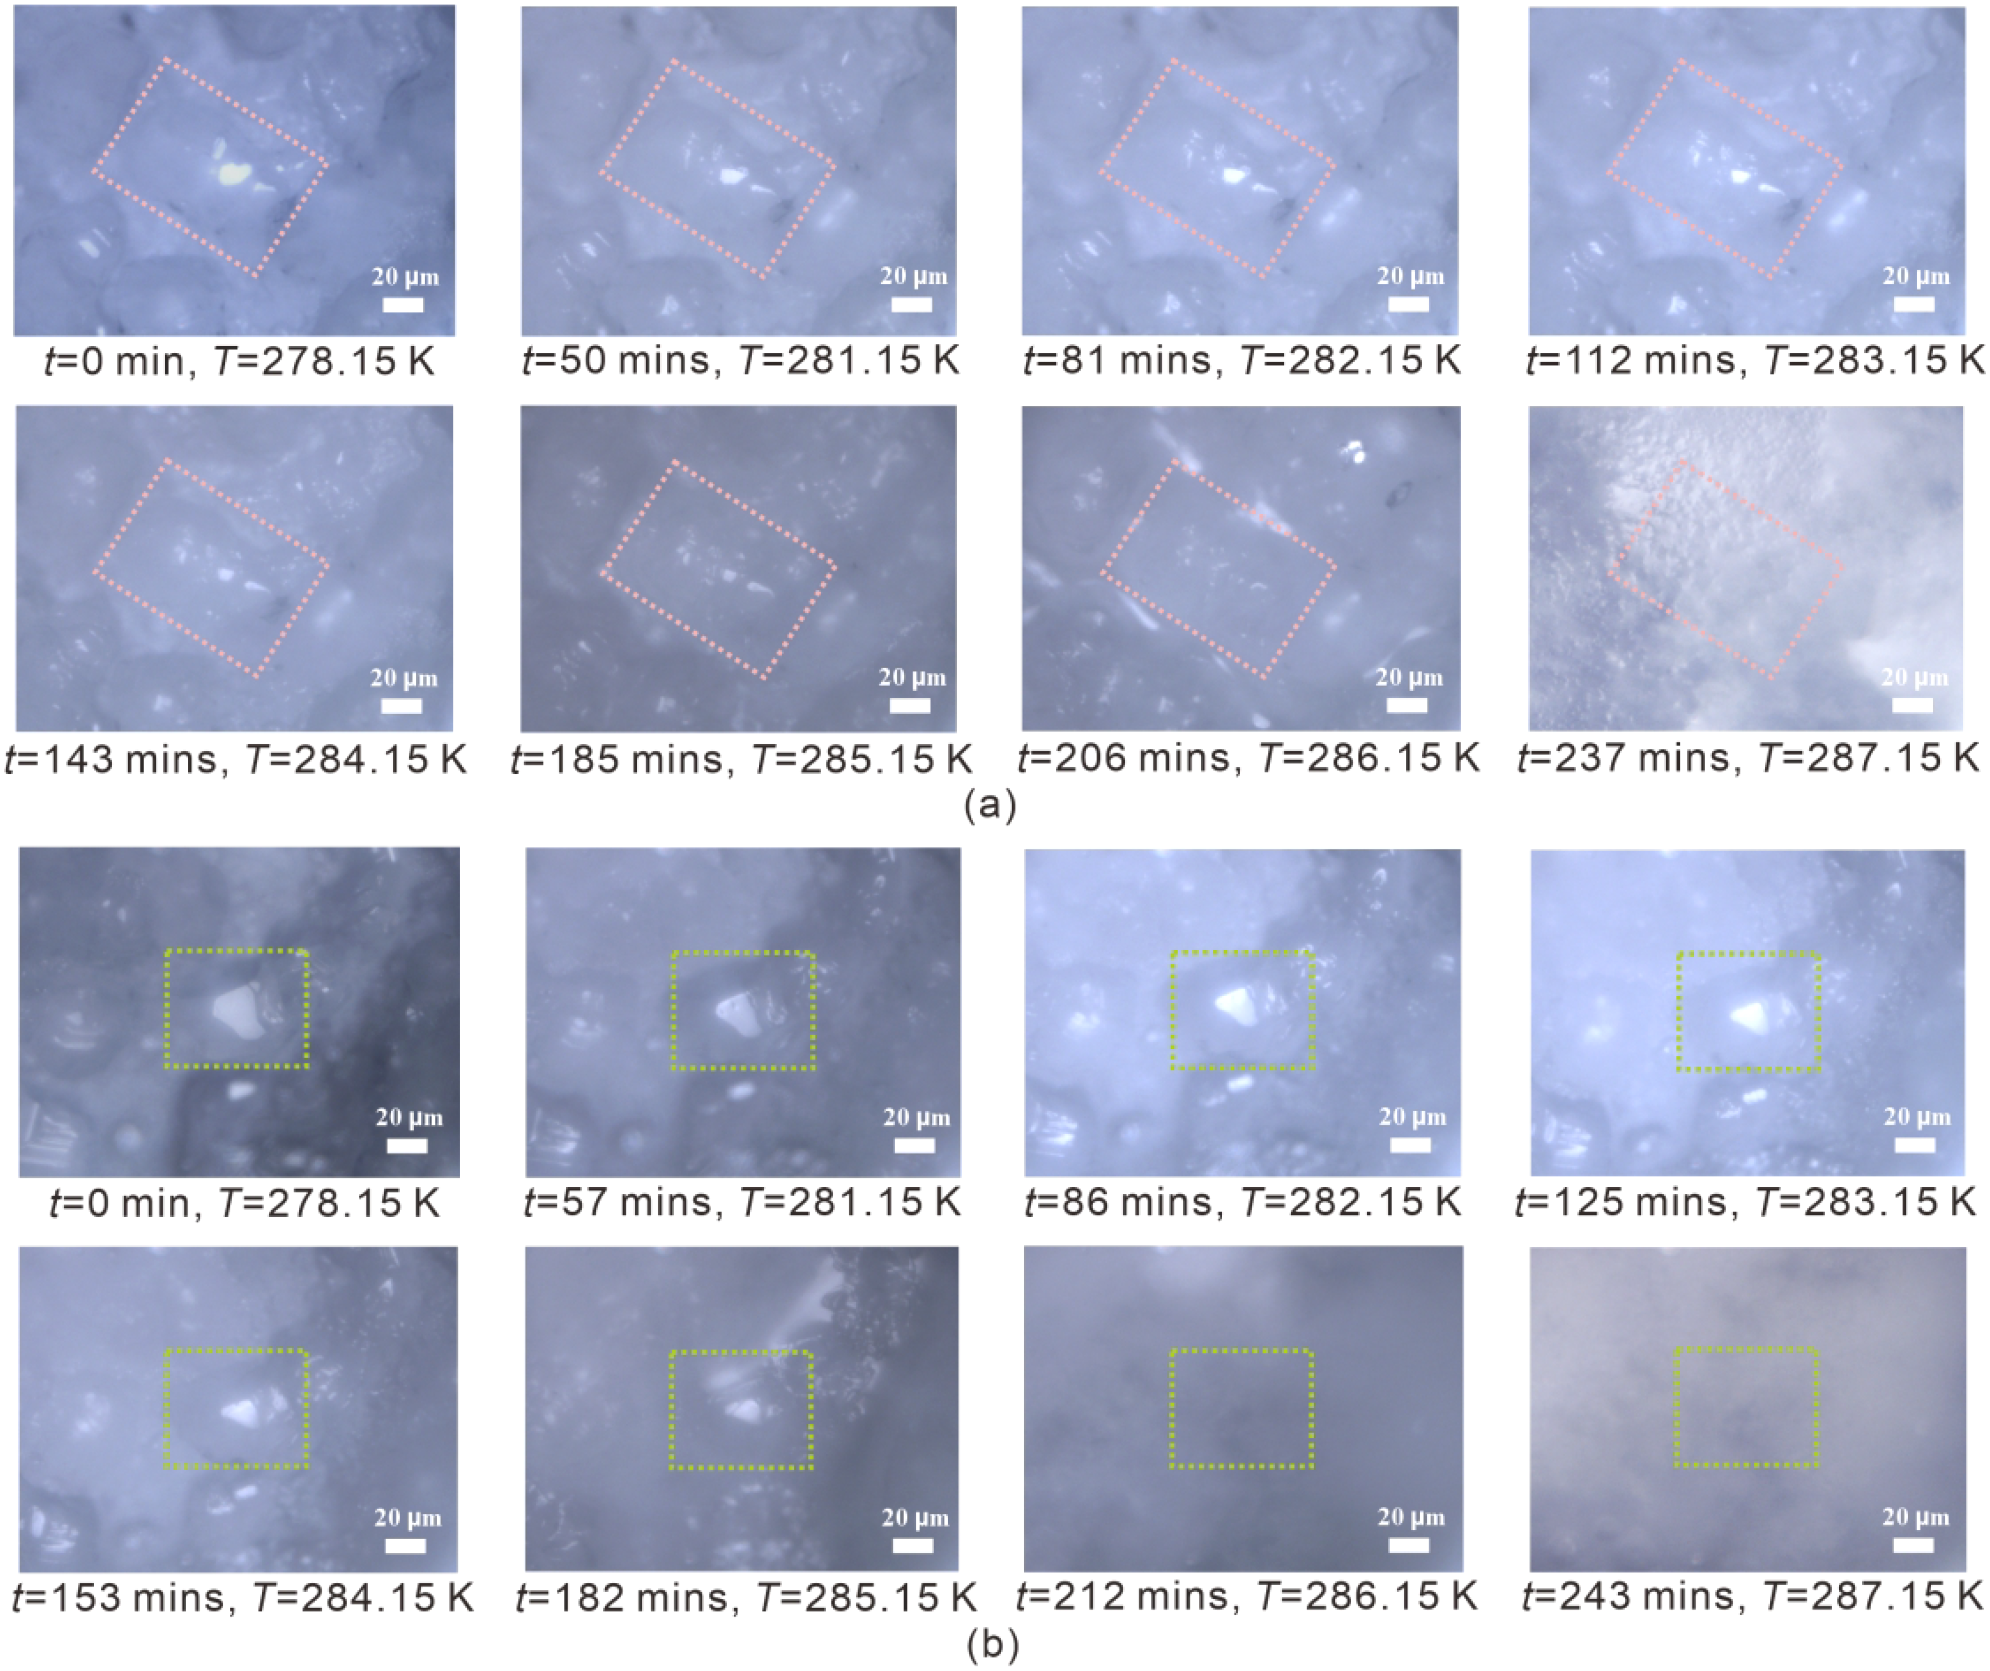
Illustration of the surface morphological changes of one selected hydrate crystal in sediment 3 (Run 1) (A) and sediment 5 (Run 1) (B) during the dissociation process using heating method from in situ Raman measurements. The crystals enclosed in the pink- and green-dashed boxes represent the same individual crystals, respectively.
In sediment 4 and sediment 5, significant morphological changes on the surface of hydrate crystals gradually occur during the heating process, but they do not correspond to changes in hydrate composition. Taking a crystal from sediment 5 as an example (Figure 9B), it can be observed that the hydrate crystal becomes smaller and smaller and disappears at temperatures above 286.15 K.
The equilibrium temperature of CH4–C3H8 mixed gas hydrates at 5 MPa is close to 289.65 K calculated using CSMGem with a feed gas composition of 95.4 mol% CH4 and 4.6 mol% C3H8. In different sediments, significant morphological changes of CH4–C3H8 hydrate crystals occur between 284.15 K and 287.15 K. Therefore, in all sediments, the dissociation temperature of hydrate crystals is lower than the equilibrium temperature calculated by CSMGem.
3.2.2 Ex situ Raman measurements
The results of ex situ Raman measurements are depicted in Figure 10, with repeat results shown in Supplementary Figure S4 in the Supplementary Materials.
Figure 10
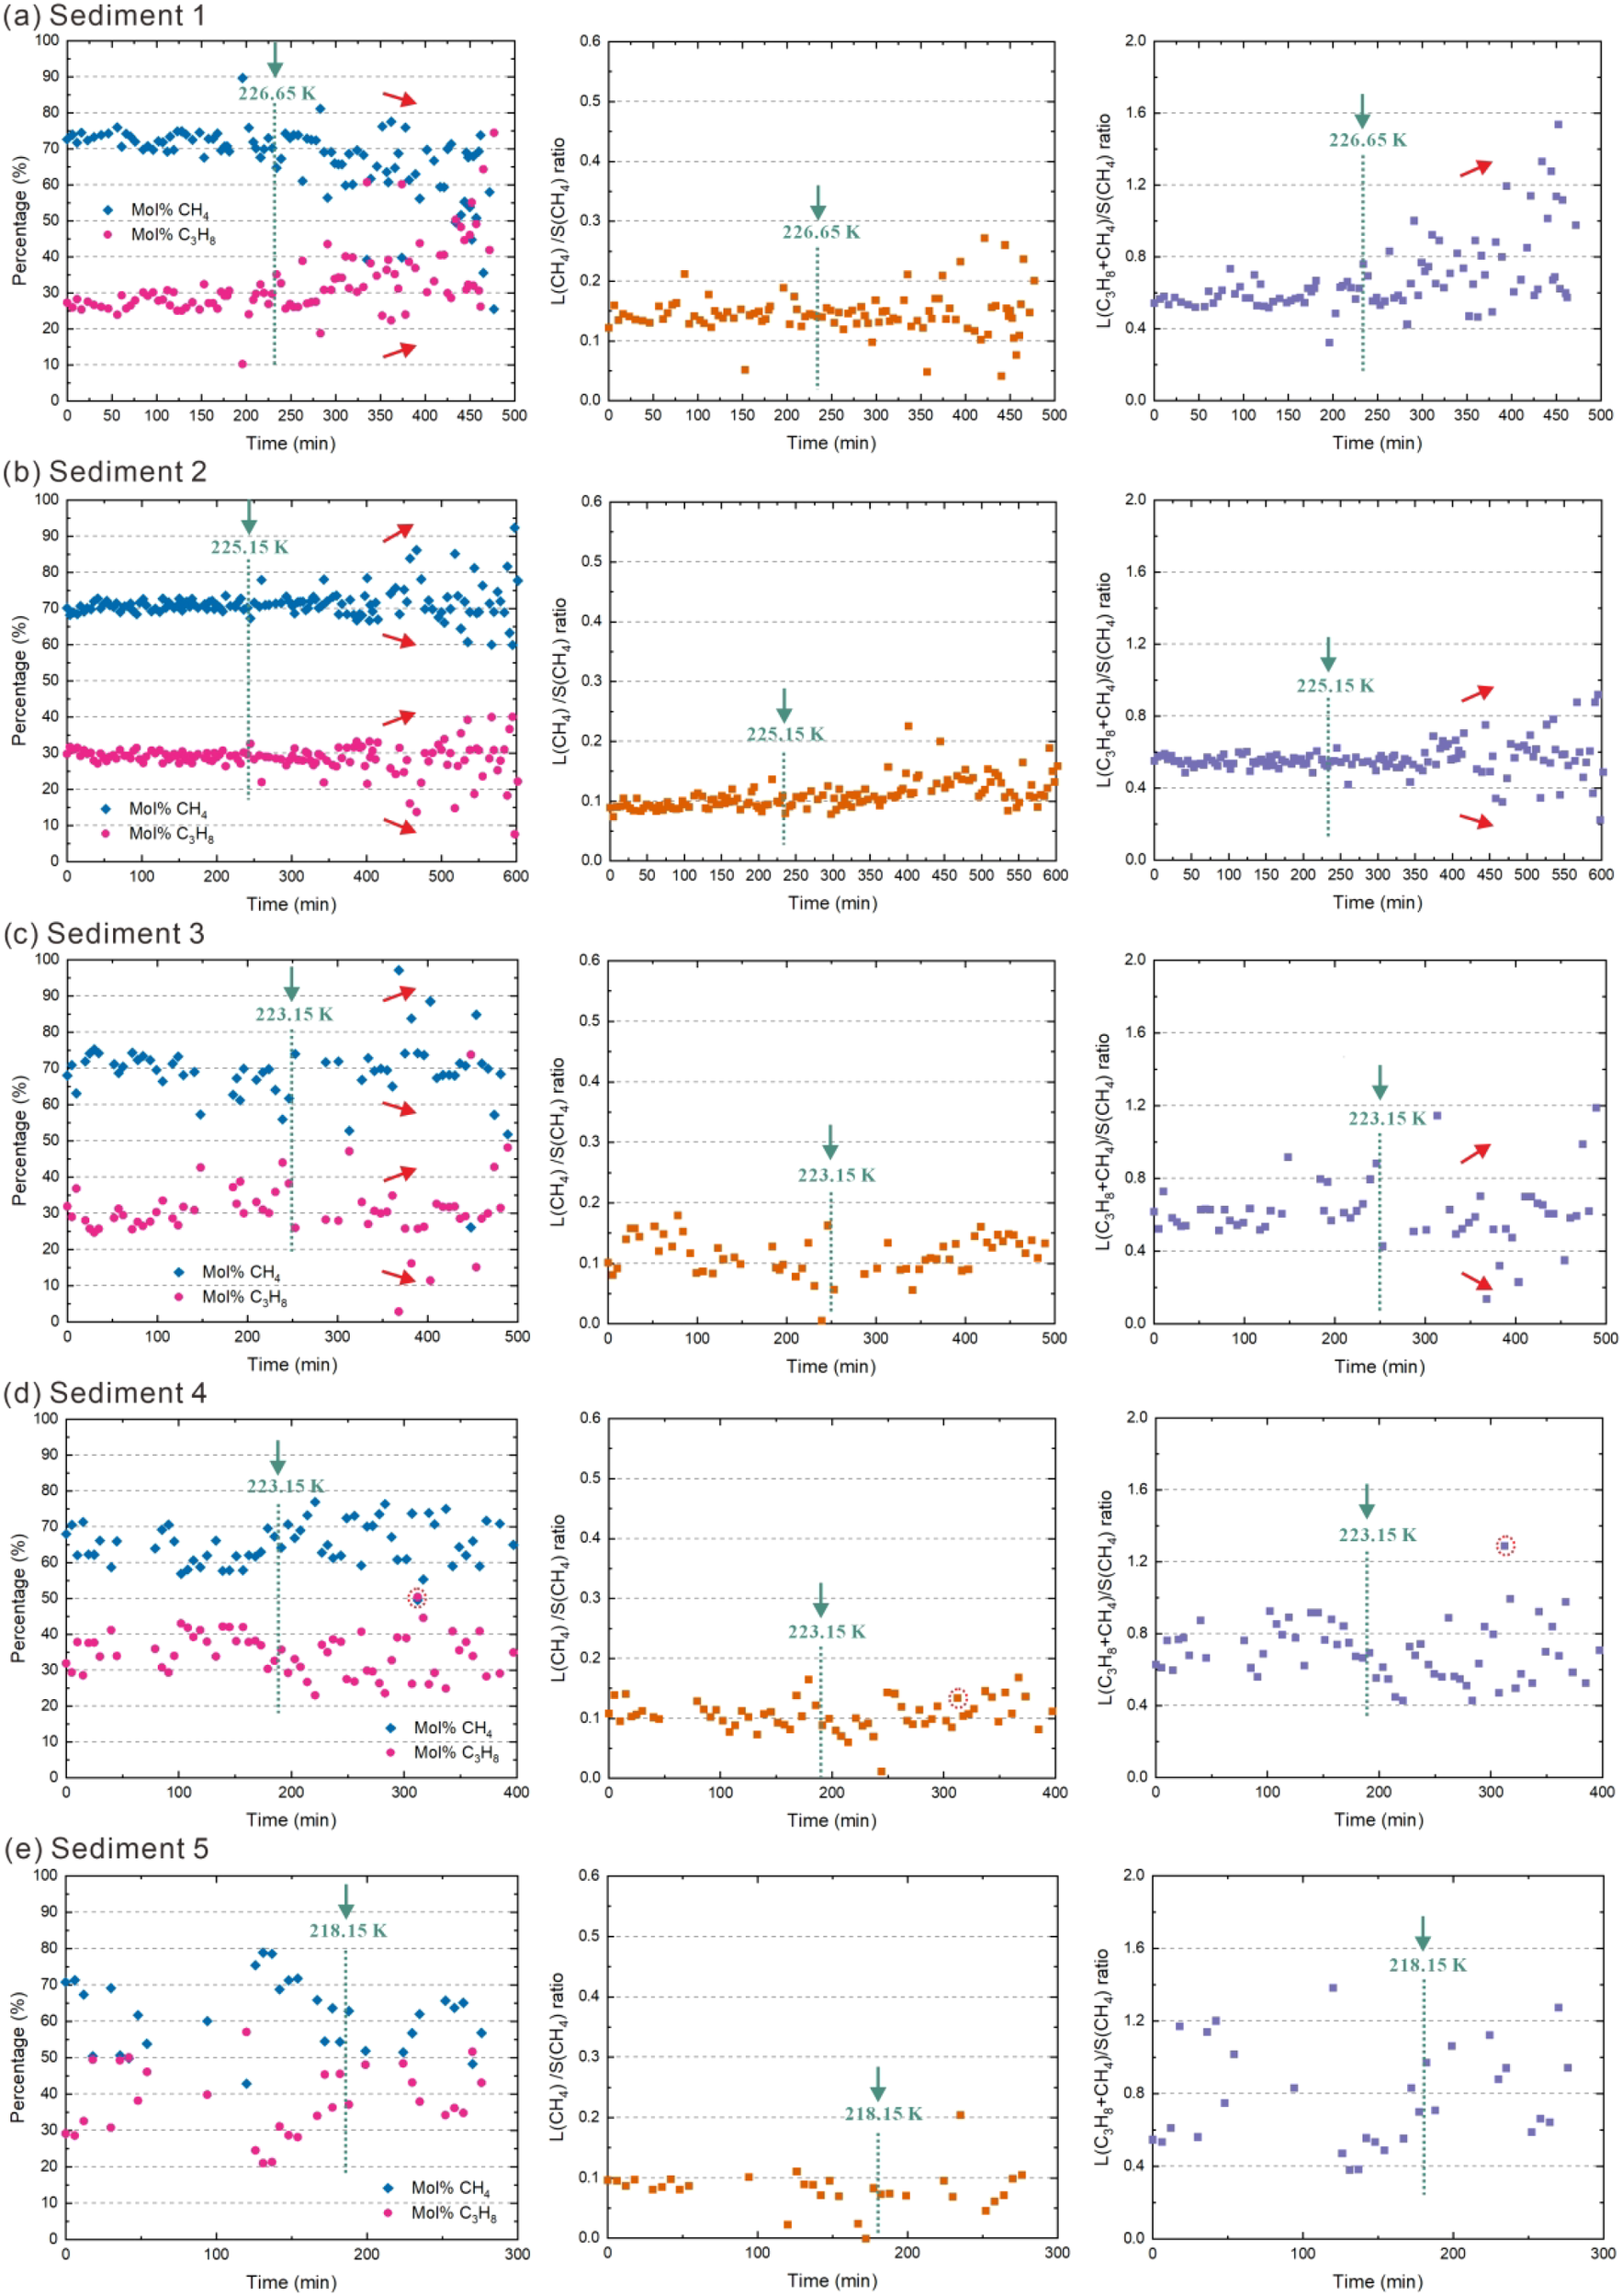
Dissociation of CH4–C3H8 mixed gas hydrates by heating in five different sediments during ex situ Raman measurement. Sub-panels (a–e) correspond to Sediment 1, 2, 3, 4, and 5, respectively. The left panel for each sediment shows the variation of hydrate composition throughout the dissociation process from ex situ Raman measurements on crystals at ambient pressure. The middle panel displays the large-to-small cavity ratio for CH4 molecules in the hydrate phase. The right panel presents the large-to-small cavity ratio for both CH4 and C3H8 molecules in the hydrate phase. The experiment was initiated at 173.15 K with a stepwise heating protocol of 5 K increments every 6~15 minutes. When observable hydrate dissociation was detected, the temperature was maintained constant until hydrate composition stabilized, after which heating resumed. The green dashed line corresponds to the temperature at which there is a significant change observed regarding the morphology of the hydrate crystal. The temperature values above the green dashed line (under the green arrow) represent the internal temperature of the experimental vessel at the moment when a significant change in the morphology of the hydrate crystal was observed. In sediments 1-3, the red arrows to the right of the green dashed line represent the temporal changes in values following a significant alteration in hydrate crystal morphology. The absence of a red arrow indicates that the values remain constant.
While the gas hydrates in sediments 1 and 2 show a relatively homogeneous composition before decomposition, the gas hydrate crystals in sediments 3, 4 and 5 already show a significantly higher variance in their compositions (Figure 10). However, the average composition of the gas hydrate phase is similar to those obtained in the in situ measurements (Figures 6, 8). The initial ratio of large (L)-to-small (S) cavities filled with CH4 (L(CH4)/S(CH4) ratio) in hydrate crystals across different sediments is generally less than 0.2. In contrast, the ratio when considering both CH4 and C3H8 occupancy in large cages (i.e., L(CH4+C3H8)/S(CH4) ratio) ranges from approximately 0.4 to 0.8. Since structure II hydrates consist of 8 large and 16 small cavities, the ratio should be 0.5 provided that all cavities are filled with a CH4 or C3H8 molecule. The ratios calculated from Raman measurements suggest, however, that not all small 512 cages and large 51264 cages in mixed gas hydrates were fully occupied by CH4 and/or C3H8 (Mao et al., 2025). The gas hydrates in sediment 5 are an exception; here the values for the L(CH4+C3H8)/S(CH4) ratio vary considerably between 0.4 and 1.6 and are therefore not meaningful. The following discussion of the L(CH4+C3H8)/S(CH4) ratio therefore refers to the gas hydrates in sediments 1-4.
After the initiation of hydrate dissociation, the changes in hydrate composition from different sediments are consistent with the results obtained from in situ measurements. The L(CH4)/S(CH4) ratio in sediments 1–5 does not show a clear change with increasing temperature, suggesting that the breakdown speed of small cavities is similar to that of large cavities (Figure 10). The L(CH4+C3H8)/S(CH4) ratio in hydrate crystals in different sediments exhibits variations. In sediment 1, the L(CH4+C3H8)/S(CH4) ratio of hydrate crystals increases (Figure 10A). In sediments 2 and 3, the L(CH4+C3H8)/S(CH4) ratio of some hydrate crystals increases, while it decreases for others (Figures 10B, C). The distribution range of the L(CH4+C3H8)/S(CH4) ratio remains unchanged during the heating process in sediment 4 (Figure 10D).
The equilibrium temperature of CH4–C3H8 mixed gas hydrates at one atmosphere is close to 235 K. In our study, CH4–C3H8 mixed gas hydrates in different sediments began to undergo significant morphological changes between 218.15 K and 226.65 K, indicating that decomposition occurred in all sediments below the equilibrium temperature.
4 Discussion
4.1 Crystalline structure
No other transient structure was observed during dissociation by depressurization and heating methods, confirming the structural stability of pure sII hydrates. Although a clear determination of the hydrate structure by Raman spectroscopy alone is not possible, our Raman spectroscopic analyses show two important indications for the formation of a sII hydrate and distinguishing features from sI hydrates: (1) The positions of the Raman bands for CH4 are at 2902 cm-1 (large 51264 cages) and 2912 cm-1 (small 512 cages) (Figure 11), distinct from sI hydrate signatures (2905 cm-1 for 51264 and 2915 cm-1 for 512 cages) (Pan et al., 2023; Naeiji et al., 2023); and (2) A markedly lower CH4 occupancy in 51264 cages (2902 cm-1) versus 512 cages (2912 cm-1) (Figures 6, 8, 10), whereas sI hydrates show a characteristic 3:1 ratio (51264/512 cages) (Cai et al., 2022). These findings align with our prior work on sII CH4–C3H8 mixed gas hydrate formation in sediments (Mao et al., 2025) and independent studies of pure systems (Tang et al., 2018; Truong-Lam et al., 2020; Pan et al., 2023). These results suggest that sediments have no influence on the structural type of CH4–C3H8 mixed gas hydrates.
Figure 11
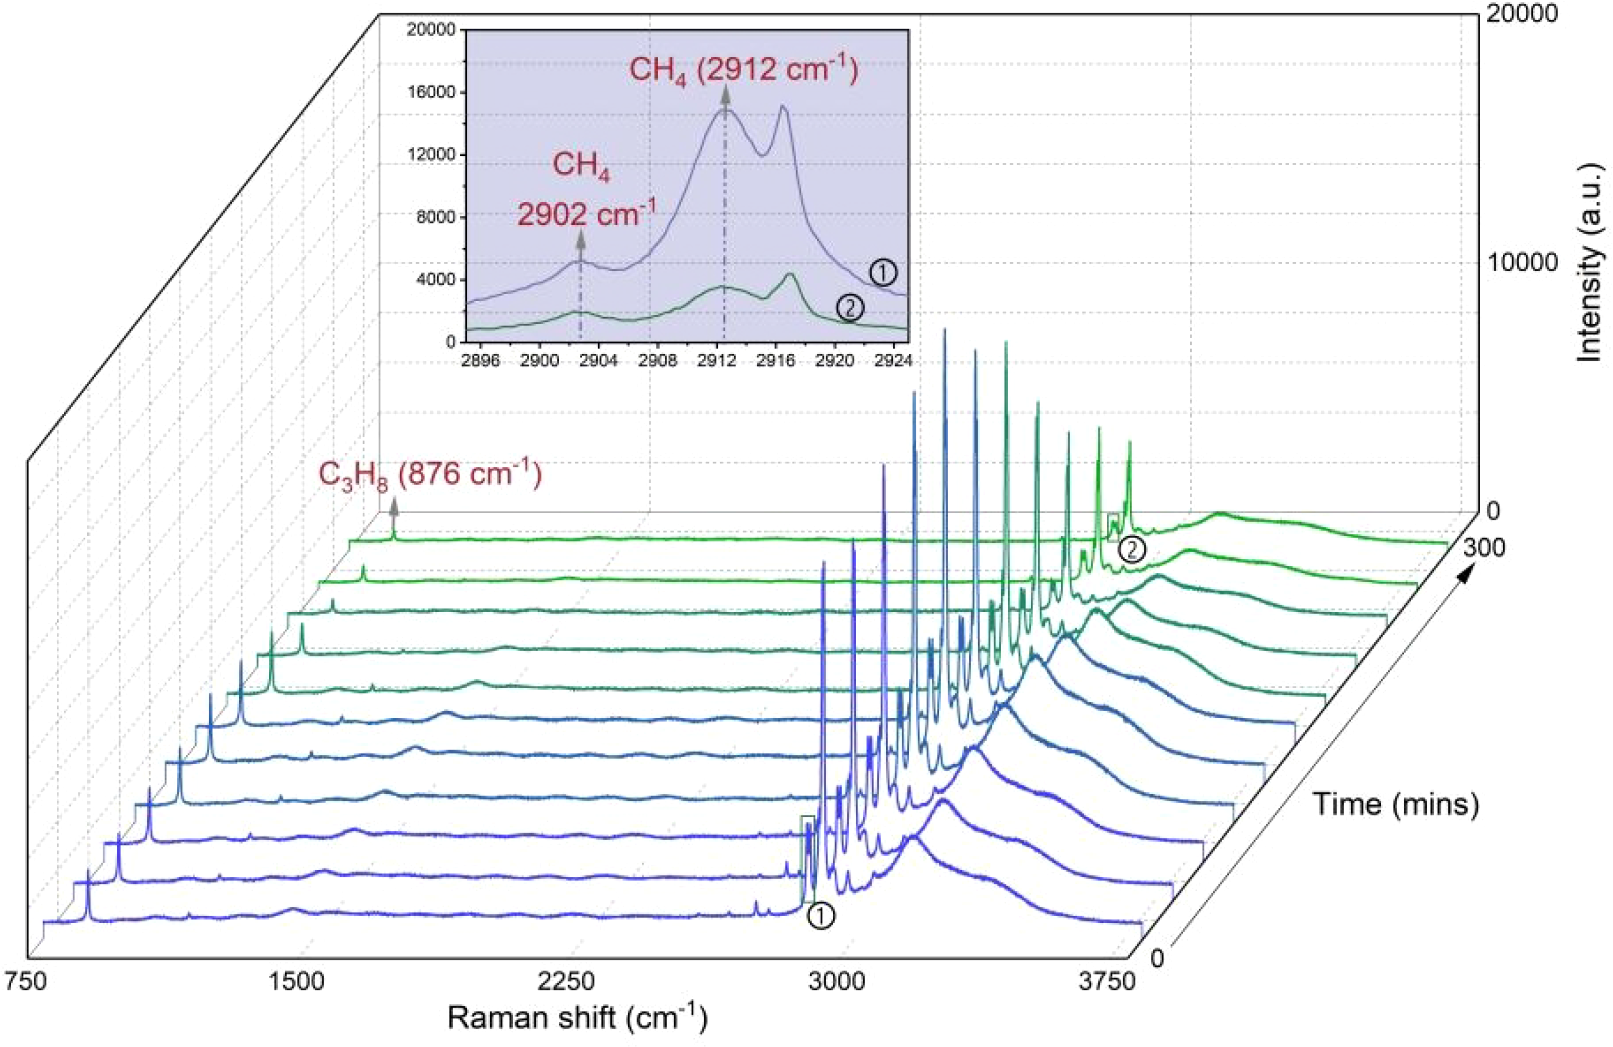
In situ Raman spectura of CH4–C3H8 mixed gas hydrates in segment 1 (Run 1) during depressurization-induced dissociation process at 283.15 K over 300 mins. A prominent Raman band at 876 cm-1 can be attributed to the C-C stretching vibrations of C3H8 encased in the large cavities of sII hydrates, while the bands at 2902 and 2912 cm-1 indicated CH4 in the large 51264 and the small 512 cavities of sII, respectively. The inset shows an enlarged view of the 2895 cm-1 to 2925 cm-1region for spectra ① and ②.
4.2 The impact of dissociation methods
Comparative analysis of different dissociation methods reveals two key findings regarding hydrate behavior in natural marine sediments: 1) The dissociation temperature of hydrate crystals is consistently lower than the calculated equilibrium temperature of the bulk hydrate phase at given pressure (Figure 8), while 2) the dissociation pressure in all sediment types exceeds the calculated equilibrium pressure at given temperature (Figure 6). In both cases, this means that the decomposition of the hydrates begins even though the temperature and pressure conditions are still within the stability range of the mixed gas hydrates. This observation is in general agreement with the work of Uchida et al. (2002), who investigated the direct influence of the pore size of porous media on the decomposition conditions of simple CH4, CO2 and C3H8 hydrates. They found that as the pore size decreased, the equilibrium temperature value tended to decrease at a given pressure. Assuming that hydrate crystals in small pores have different physical properties than a bulk hydrate phase, they explained the differing decomposition temperatures with the Gibbs-Thomson effect. These conclusions can generally be applied to our findings as well: the observed premature decomposition behavior may be attributed to sediment-specific properties and varying ratios of mineral components to hydrates affecting the microstructural environment and thus alter phase equilibrium conditions (Uchida et al., 2002).
The hydrate crystals in foraminifera-rich sands (sediment 1), however, exhibit distinct gas release behaviors under different dissociation methods. The results indicate that, during depressurization, the relative concentration of CH4 in different hydrate crystals shows heterogeneous behavior: in some crystals it remains constant, in others it increases, and in yet others it decreases. Under heating, the relative concentration of CH4 in some crystals remains unchanged, while in others it decreases. This differential behavior suggests that, in foraminifera-rich sands, heating provides more efficient CH4 release compared to depressurization. The higher release rate of CH4 molecules under heating may be explained by a higher porosity and interconnected pore structure of foraminifera sands, which promotes gas transport overall, allowing the smaller CH4 molecules to be released particularly easily in this situation.
4.3 The impact of natural sediments on CH4 and C3H8 release
The results obtained from ex situ Raman measurement were primarily used when discussing the influence of sediments on gas hydrate behaviors during the heating-induced dissociation process (Figure 10). In the studies reported by Truong-Lam et al. (2020) and Pan et al. (2023), it was observed that during the heating- or depressurization-induced dissociation process, the relative concentration of CH4 in the hydrate crystals decreased, while that of C3H8 increased. Pan et al. (2023) indicated that CH4 molecules exhibit higher diffusivity from the hydrate surface to the gas phase but have a lower capacity to stabilize hydrate cavities compared to C3H8. The results of this study indicate that, only the hydrate dissociation in sediment 1 during the heat-induced decomposition was consistent with the scenario observed in the studies mentioned above. Based on the results shown in Figures 8, 10 and the particle size and mineral composition presented in Figure 2, we conclude that the presence of foraminifera sands in sediment 1 facilitates CH4 release. Sediments 3–5 are all muddy sediments, but the effect of sediment 3 on gas hydrate dissociation also exhibits differences compared to the other muddy sediments. This is primarily related to its high heterogeneity and wide particle size distribution, including coarse-grained particle content and muds. Similarly, sediment 2 contains a significant amount of coarse-grained sediment in addition to foraminifera-rich sands. It appears that the heterogeneity of the sediment leads to a different effect on the hydrate decomposition process. The release of CH4 is promoted in some hydrate crystals, while in others, the release of C3H8 is promoted. This leads to a high variance in the composition of the hydrate phase during decomposition. The results of the experiments with sediments 4 and 5 indicate that clay has no significant effect on the relative release ratio of CH4 to C3H8.
As shown in Figure 10, the L(CH4)/S(CH4) ratio of the hydrate in all sediments remains almost unchanged. This indicates that the sediment has no significant effect on the relative rate of CH4 release from either large or small cages. The changes in the L(CH4+C3H8)/S(CH4) ratio in hydrate crystals in sediments 1–4 are consistent with the variation in C3H8 content within the hydrate crystals. The L(CH4+C3H8)/S(CH4) ratio in some hydrate crystals in foraminifera-rich sands (sediment 1) increases, consistent with the conclusions proposed by Pan et al. (2023). Above phenomena highlight the influence of sediment composition on gas hydrate dissociation dynamics.
It is important to acknowledge the limitations of our experimental approach. While the employment of a small-volume, constant-gas-supply system provides highly controlled conditions ideal for elucidating fundamental mechanisms of hydrate dissociation (e.g., dissociation begins even within the hydrate stability range), this setup undoubtedly simplifies the complex, multiphase environment of natural marine sediments. Natural systems involve dynamic biogeochemical processes, heterogeneous mineral surfaces, and fluctuating fluid flow, which are not fully captured here. Therefore, the kinetic-related quantitative findings of this study should be extrapolated to natural settings with caution.
5 Conclusion and implications
This study investigates the dissociation process of CH4–C3H8 mixed gas hydrates in five different natural marine sediments from the South China Sea, including foraminifera-rich sands (sediment 1), a mixture of mud and foraminifera-rich sands (sediment 2) and muds (sediments 3-5), under heating and depressurization conditions. The results show that no transient structures were observed during dissociation by either heating or depressurization, reinforcing the structural stability of sII hydrates across different decomposition pathways. In sediments with high heterogeneity and broad particle size distribution, the observed morphological changes on the hydrate crystal surfaces correlate strongly with changes in their composition. This suggests that the dynamics of gas release may influence these morphological alterations.
The dissociation method did not significantly alter the development of composition change in sediments 2-5. In contrast, hydrate crystals in foraminifera-rich sands (sediment 1) exhibit distinct dissociation behaviors. Depressurization induces non-monotonic CH4–C3H8 concentration variations, while heating yields predictable compositional shifts (CH4 decrease and C3H8 increase with temperature). Sediment heterogeneity, specifically a wide range of particle sizes (e.g., coarse grains and mud), significantly influences gas hydrate dissociation. This leads to a high variance in the relative release of CH4 versus C3H8, as observed in sediments 2 and 3. In contrast, clay-rich sediments (sediments 4 and 5) show no measurable influence on the relative release ratio of CH4 to C3H8. The L(CH4)/S(CH4) ratio of the hydrate in all sediments remains almost unchanged. Regardless of the type of sediment, we observed that both pressure-induced and heat-induced dissociation of gas hydrates started under P-T conditions within the calculated stability range.
The aforementioned findings reveal that the dissociation kinetics of CH4–C3H8 mixed gas hydrates vary under different conditions in sediments from the South China Sea, indicating that sediment composition and dissociation pathways jointly regulate gas release behavior. This understanding holds significant value for optimizing natural gas hydrate extraction technologies and elucidating the mechanisms of sediment-carbon interactions within the marine carbon cycle. Under climate warming conditions, CH4–C3H8 mixed hydrate reservoirs in highly permeable sandy sediments (e.g., foraminifera-rich sands) may become hotspots for CH4 release, triggering local microbial ecological shifts and seabed hypoxia. Furthermore, the observation that CH4–C3H8 mixed hydrates in all sediment types dissociate within the theoretical stability zone challenges traditional phase equilibrium models. Sediment micro-scale effects may promote premature dissociation, suggesting that current models likely underestimate actual dissociation rates and carbon fluxes. Future carbon-climate predictions must incorporate sediment characteristics to improve accuracy.
Statements
Data availability statement
The raw data supporting the conclusions of this article will be made available by the authors, without undue reservation.
Author contributions
PM: Data curation, Funding acquisition, Investigation, Resources, Writing – original draft, Conceptualization. JS: Conceptualization, Methodology, Supervision, Writing – review & editing.
Funding
The author(s) declared financial support was received for this work and/or its publication. This work was supported by the National Natural Science Foundation of China (grant number: 42506218, 42476252), the Postdoctoral Fellowship Program of CPSF (grant number: GZB20230682), the China Postdoctoral Science Foundation (grant number: 2023M743295) and the China Scholarship Council (grant number: 202008110273).
Acknowledgments
We acknowledge Mengdi Pan, Erik Spangenberg, Ronny Giese, and Parisa Naeiji at GFZ for their valuable support during this research. Additionally, we are grateful to Qingdao Institute of Marine Geology for their support in the testing of sediment samples.
Conflict of interest
The author(s) declared that this work was conducted in the absence of any commercial or financial relationships that could be construed as a potential conflict of interest.
Generative AI statement
The author(s) declared that generative AI was not used in the creation of this manuscript.
Any alternative text (alt text) provided alongside figures in this article has been generated by Frontiers with the support of artificial intelligence and reasonable efforts have been made to ensure accuracy, including review by the authors wherever possible. If you identify any issues, please contact us.
Publisher’s note
All claims expressed in this article are solely those of the authors and do not necessarily represent those of their affiliated organizations, or those of the publisher, the editors and the reviewers. Any product that may be evaluated in this article, or claim that may be made by its manufacturer, is not guaranteed or endorsed by the publisher.
Supplementary material
The Supplementary Material for this article can be found online at: https://www.frontiersin.org/articles/10.3389/fmars.2026.1688347/full#supplementary-material
References
1
Aladko E. Y. Dyadin Y. A. Manakov A. Y. Zhurko F. V. Larionov E. G. (2002). Phase diagrams of the ternary gas hydrate forming systems at high pressures. Part 1. propane-methane-water system. J. Supramol. Chem.2, 369–376. doi: 10.1016/S1472-7862(03)00061-3
2
Beeskow-Strauch B. Schicks J. M. Spangenberg E. Erzinger J. (2011). The influence of SO2 and NO2 impurities on CO2 gas hydrate formation and stability. Chem. Eur. J.17, 4376–4384. doi: 10.1002/chem.201003262
3
Burke E. A. J. (2001). Raman microspectrometry of fluid inclusions. Lithos, fluid Inclusions: Phase relationships-methods-applications. A special issue honour Jacques Touret55, 139–158. doi: 10.1016/S0024-4937(00)00043-8
4
Cai W. Zhan L. Huang X. Lu H. (2022). Raman micro-imaging of the coexistence of sI and sII hydrates formed from a mixed methane-propane gas in a confined space. Acta Geol. Sin. - Engl. Ed.96, 674–679. doi: 10.1111/1755-6724.14929
5
de Menezes D.É.S. Sum A. K. Desmedt A. Pessôa Filho P. de A. Robustillo Fuentes M. D. (2019). Coexistence of sI and sII in methane-propane hydrate former systems at high pressures. Chem. Eng. Sci.208, 115149. doi: 10.1016/j.ces.2019.08.007
6
Du S. Han X. Cai W. Zhu J. Ma X. Han S. et al . (2023). Formation of the structure-II gas hydrate from low-concentration propane mixed with methane. Chin. J. Chem. Eng.58, 306–314. doi: 10.1016/j.cjche.2022.10.014
7
Handa Y. P. Stupin D. Y. (1992). Thermodynamic properties and dissociation characteristics of methane and propane hydrates in 70-.ANG.-radius silica gel pores. J. Phys. Chem.96, 8599–8603. doi: 10.1021/j100200a071
8
Hester K. C. Dunk R. M. Walz P. M. Peltzer E. T. Sloan E. D. Brewer P. G. (2007). Direct measurements of multi-component hydrates on the seafloor: Pathways to growth. Fluid Phase Equilibria Properties Phase Equilibria Product Process Design261, 396–406. doi: 10.1016/j.fluid.2007.07.053
9
Klapp S. A. Murshed M. M. Pape T. Klein H. Bohrmann G. Brewer P. G. et al . (2010). Mixed gas hydrate structures at the Chapopote Knoll, southern Gulf of Mexico. Earth Planet. Sci. Lett.299, 207–217. doi: 10.1016/j.epsl.2010.09.001
10
Klapproth A. Piltz R. O. Kennedy S. J. Kozielski K. A. (2019). Kinetics of sII and mixed sI/sII, gas hydrate growth for a methane/propane mixture using neutron diffraction. J. Phys. Chem. C123, 2703–2715. doi: 10.1021/acs.jpcc.8b06693
11
Konno Y. Uchiumi T. Oyama H. Jin Y. Nagao J. Masuda Y. et al . (2012). Dissociation behavior of methane hydrate in sandy porous media below the quadruple point. Energy Fuels26, 4310–4320. doi: 10.1021/ef300628c
12
Li C. Hu G. Zhang W. Ye Y. Liu C. Li Q. et al . (2016b). Influence of foraminifera on formation and occurrence characteristics of natural gas hydrates in fine-grained sediments from Shenhu area, South China Sea. Sci. China Earth Sci.59, 2223–2230. doi: 10.1007/s11430-016-5005-3
13
Li X. Xu C. Zhang Y. Ruan X. Li G. Wang Y. (2016a). Investigation into gas production from natural gas hydrate: A review. Appl. Energy172, 286–322. doi: 10.1016/j.apenergy.2016.03.101
14
Liu C. Lu H. Ye Y. Ripmeester J. A. Zhang X. (2008). Raman spectroscopic observations on the structural characteristics and dissociation behavior of methane hydrate synthesized in silica sands with various sizes. Energy Fuels22, 3986–3988. doi: 10.1021/ef800440s
15
Liu C. Meng Q. He X. Li C. Ye Y. Lu Z. et al . (2015). Comparison of the characteristics for natural gas hydrate recovered from marine and terrestrial areas in China. J. Geochem. Explor.152, 67–74. doi: 10.1016/j.gexplo.2015.02.002
16
Lu H. Seo Y. Lee J. Moudrakovski I. Ripmeester J. A. Chapman N. R. et al . (2007). Complex gas hydrate from the Cascadia margin. Nature445, 303–306. doi: 10.1038/nature05463
17
Mao P. Schicks J. M. Pan M. Wu N. (2025). CH4-C3H8 mixed gas hydrates formation in marine mud and foraminifera-rich sand from the South China Sea: an experimental approach. Front. Mar. Sci.12. doi: 10.3389/fmars.2025.1510050
18
Medvedev V. I. Gushchin P. A. Yakushev V. S. Semenov A. P. (2015). Study of the effect of the degree of overcooling during the formation of hydrates of a methanepropane gas mixture on the equilibrium conditions of their decomposition. Chem. Technol. Fuels Oils51, 470–479. doi: 10.1007/s10553-015-0627-4
19
Naeiji P. Luzi-Helbing M. Schicks J. M. Pan M. (2024). Dissociation behavior of sI and sII gas hydrates in response to environmental changes-Investigations on the self-preservation effect. Appl. Energy374, 124042. doi: 10.1016/j.apenergy.2024.124042
20
Naeiji P. Pan M. Luzi-Helbing M. Alavi S. Schicks J. M. (2023). Experimental and simulation study for the dissociation behavior of gas hydrates-Part I: CH4 hydrates. Energy Fuels.37, 4484–4496. doi: 10.1021/acs.energyfuels.2c03984
21
Pan M. Naeiji P. Schicks J. M. (2023). Experimental and simulation study for the dissociation behavior of gas hydrates─Part II: sII mixed gas hydrates. Energy Fuels37 (6), 4497–4514. doi: 10.1021/acs.energyfuels.2c03985
22
Placzek G. (1934). Handbuch der Radiologie Vol. 6. Ed. MarxE. (Leipzig: Akad. Verlagsgesellschaft).
23
Prasad P. S. R. Chari V. D. Sharma D.V.S.G.K. Murthy S. R. (2012). Effect of silica particles on the stability of methane hydrates. Fluid Phase Equilibria318, 110–114. doi: 10.1016/j.fluid.2012.01.012
24
Riestenberg D. West O. Lee S. McCallum S. Phelps T. J. (2003). Sediment surface effects on methane hydrate formation and dissociation. Mar. Geol.198, 181–190. doi: 10.1016/S0025-3227(03)00100-2
25
Schicks J. M. Luzi-Helbing M. (2013). Cage occupancy and structural changes during hydrate formation from initial stages to resulting hydrate phase. Spectrochim. Acta A. Mol. Biomol. Spectrosc.115, 528–536. doi: 10.1016/j.saa.2013.06.065
26
Schicks J. M. Pan M. Giese R. Poser M. Ismail N. A. Luzi-Helbing M. et al . (2020). A new high-pressure cell for systematic in situ investigations of micro-scale processes in gas hydrates using confocal micro-Raman spectroscopy. Rev. Sci. Instrum.91, 115103. doi: 10.1063/5.0013138
27
Schrader B. (1995). Infrared and Raman spectroscopy: Methods and applications (Weinheim, Germany: VCH Verlagsgesellschaft mbH). doi: 10.1002/9783527615438
28
Schrötter H. W. Klöckner H. W. (1979). “ Raman scattering cross sections in gases and liquids,” in Raman Spectroscopy of Gases and Liquids, Topics in Current Physics. Ed. WeberA. ( Springer Berlin Heidelberg, Berlin, Heidelberg), 123–166. doi: 10.1007/978-3-642-81279-8_4
29
Sloan E. D. Koh C. A. (2008). Clathrate Hydrates of Natural Gases. 3rd Edition (Boca Raton, FL: CRC Press-Taylor and Francis Group LLC).
30
Song Y. Cheng C. Zhao J. Zhu Z. Liu W. Yang M. et al . (2015). Evaluation of gas production from methane hydrates using depressurization, thermal stimulation and combined methods. Appl. Energy145, 265–277. doi: 10.1016/j.apenergy.2015.02.040
31
Sun Y.-H. Su K. Li S.-L. Carroll J. J. Zhu Y.-H. (2018). Experimental investigation into the dissociation behavior of CH4-C2H6-C3H8 hydrates in sandy sediments by depressurization. Energy Fuels32, 204–213. doi: 10.1021/acs.energyfuels.7b02949
32
Takeya S. Fujihisa H. Gotoh Y. Istomin V. Chuvilin E. Sakagami H. et al . (2013). Methane clathrate hydrates formed within hydrophilic and hydrophobic media: Kinetics of dissociation and distortion of host structure. J. Phys. Chem. C117, 7081–7085. doi: 10.1021/jp312297h
33
Tang C. Zhou X. Li D. Zhao X. Liang D. (2018). In situ Raman investigation on mixed hydrate dissociation in the presence of polyvinylpyrrolidone. Fuel214, 505–511. doi: 10.1016/j.fuel.2017.11.063
34
Truong-Lam H. S. Seo S. Kim S. Seo Y. Lee J. D. (2020). In situ Raman study of the formation and dissociation kinetics of methane and methane/propane hydrates. Energy Fuels34, 6288–6297. doi: 10.1021/acs.energyfuels.0c00813
35
Uchida T. Ebinuma T. Takeya S. Nagao J. Narita H. (2002). Effects of pore sizes on dissociation temperatures and pressures of methane, carbon dioxide, and propane hydrates in porous media. J. Phys. Chem. B106, 820–826. doi: 10.1021/jp012823w
36
Uchida T. Moriwaki M. Takeya S. Ikeda I. Y. Ohmura R. Nagao J. et al . (2004a). Two-step formation of methane-propane mixed gas hydrates in a batch-type reactor. AIChE J.50, 518523. doi: 10.1002/aic.10045
37
Uchida T. Takeya S. Chuvilin E. M. Ohmura R. Nagao J. Yakushev V. S. et al . (2004b). Dissociation of methane hydrates in sand, sandstone, clays, and glass beads: CH4 hydrate dissociation in sediments. J. Geophys. Res. Solid Earth109:B05206. doi: 10.1029/2003JB002771
38
Wei J. Fang Y. Lu H. Lu H. Lu J. Liang J. et al . (2018). Distribution and characteristics of natural gas hydrates in the Shenhu Sea Area, South China Sea. Mar. Pet. Geol.98, 622–628. doi: 10.1016/j.marpetgeo.2018.07.028
39
Wei J. Wu T. Zhu L. Fang Y. Liang J. Lu H. et al . (2021). Mixed gas sources induced co-existence of sI and sII gas hydrates in the Qiongdongnan Basin, South China Sea. Mar. Pet. Geol.128, 105024. doi: 10.1016/j.marpetgeo.2021.105024
40
Wu P. Dong Z. Huang Z. Zhi Y. Li Y. Song Y. (2025). A novel high-pressure and low-temperature ring shear apparatus for large-scale deformation of hydrate-bearing sediment. Energy Fuels acs.energyfuels39 (39), 18870–18879. doi: 10.1021/acs.energyfuels.5c03776
41
Yang S. Lei Y. Liang J. Holland M. Schultheiss P. Lu J. et al . (2017). “ Concentrated gas hydrate in the Shenhu Area, South China Sea: results from drilling expeditions GMGS3 & GMGS4,” in Proceedings of 9th International Conference on Gas Hydrates. 25–30. Denver, CO, USA: International Conference on Gas Hydrates (ICGH).
42
Yu C. Sun B. Hasan M. Ma W. Chen L. (2024). Experimental investigation and modeling on the dissociation kinetics of methane hydrate in clayey silt cores in depressurization. Chem. Eng. J.486, 150325. doi: 10.1016/j.cej.2024.150325
43
Zhao J. Lv Q. Li Y. Yang M. Liu W. Yao L. et al . (2015). In-situ visual observation for the formation and dissociation of methane hydrates in porous media by magnetic resonance imaging. Magn. Reson. Imaging33, 485–490. doi: 10.1016/j.mri.2014.12.010
Summary
Keywords
CH4–C3H8 mixed gas hydrates, depressurization, dissociation behavior, heating, natural marine sediments
Citation
Mao P and Schicks JM (2026) CH4–C3H8 mixed gas hydrate behavior in natural marine sediments: influence of sediment type and dissociation pathways. Front. Mar. Sci. 13:1688347. doi: 10.3389/fmars.2026.1688347
Received
19 August 2025
Revised
24 December 2025
Accepted
19 January 2026
Published
04 February 2026
Volume
13 - 2026
Edited by
Wei Zhang, Guangzhou Marine Geological Survey, China
Reviewed by
Chenyang Bai, China University of Geosciences, China
Qian Zhang, Hainan University, China
Updates
Copyright
© 2026 Mao and Schicks.
This is an open-access article distributed under the terms of the Creative Commons Attribution License (CC BY). The use, distribution or reproduction in other forums is permitted, provided the original author(s) and the copyright owner(s) are credited and that the original publication in this journal is cited, in accordance with accepted academic practice. No use, distribution or reproduction is permitted which does not comply with these terms.
*Correspondence: Judith M. Schicks, schick@gfz.de
Disclaimer
All claims expressed in this article are solely those of the authors and do not necessarily represent those of their affiliated organizations, or those of the publisher, the editors and the reviewers. Any product that may be evaluated in this article or claim that may be made by its manufacturer is not guaranteed or endorsed by the publisher.