Abstract
Studies on Pterois miles growth in the Mediterranean Sea are scant, while otoliths, traditionally used to age Pterois species, present difficulties in sampling, handling and interpretation. In this study a total of 617 P. miles specimens collected from the Cretan and Ionian Seas were aged by reading transverse sections of the third dorsal spine. The monthly evolution of the spine’s edge type (hyaline or opaque) and marginal increment analysis supported the annual formation of annuli. Lionfish age ranged from 0 to 5 years. The length-on-spine radius relationship exhibited a significant change in slope indicating that beyond the estimated inflection point fish growth was slower in relation to spine growth. We applied a multi-stage body proportional back-calculation formula that accounted for this shift in the length-on-spine radius relationship. The comparison of von Bertalanffy growth curves fitted to back-calculated length-at-age data, confirmed the sexually dimorphic growth of Pterois, with males reaching higher mean lengths-at-age. Growth was faster off the island of Crete, which could be attributed to higher temperatures compared to the Ionian Sea. Published growth data from the Pterois invaded areas revealed that the growth performance was significantly lower in the Mediterranean compared to the Atlantic. Finally, an inverse ‘Rosa Lee phenomenon’ was observed, with mean back-calculated length at each annulus formation increasing with age. A hypothesis is formulated asserting that slow growing individuals experience higher mortality (‘faster is better’ hypothesis), which can be attributed to cooler winter temperatures and an associated energetic stress which is inversely related to fish size.
1 Introduction
Invasive species, despite comprising only a small fraction of non-indigenous species, are amongst the leading drivers of global marine change, causing profound ecological and economic impacts (Bax et al., 2003; Boonstra et al., 2015). Among the most notorious invasive fish are the Indo-Pacific devil firefish Pterois miles (Bennett, 1828) and red lionfish P. volitans (Linnaeus, 1758) (hereafter, referred to collectively as ‘lionfish’) (Schultz, 1986; Kulbicki et al., 2012). Over the past few decades, lionfish have received considerable scientific attention (Côté et al., 2013) following their invasion of the western Atlantic approximately 40 years ago (Whitfield et al., 2002). More recently, P. miles invaded the Mediterranean Sea, where since 2012 self-sustained populations have become established in most eastern Mediterranean regions (Bottacini et al., 2024 and references therein).
The high invasiveness of lionfish is shaped by their unique combination of traits, including rapid growth, early maturation, high fecundity, spawning frequency and dispersal ability, and the presence of anti-predatory venomous spines (Côté et al., 2013 and references therein). Lionfish exert significant predation pressure, posing a major ecological threat in the invaded Atlantic regions where their presence has been linked to declines in native fish abundance and recruitment (Albins and Hixon, 2008; Green et al., 2012a), disruptions in food-web dynamics (Arias-González et al., 2011) and loss of ecological services (Johnston et al., 2015). In the Mediterranean the invasion of P. miles is still in its early stages and its success and impacts have yet to be fully documented. However, based on prior experience in the Atlantic, P. miles has already been classified as one of the most invasive fish taxa in the Mediterranean with high managerial priority (Galanidi et al., 2018; Tsiamis et al., 2020).
In both the Mediterranean Sea and the western Atlantic Ocean, current management efforts are focusing on controlling, and consequently reducing the lionfish impacts through localized removal efforts (i.e., fishing derbies and tournaments), commercialization and promotion of the species as a food resource, and, in the long-term, establishment of lionfish fisheries (Morris, 2012; Ulman et al., 2022). Knowledge on the species life history parameters is fundamental in order to assess the potential of such management actions. Moreover, since biotic and abiotic factors (e.g., temperature, habitat type, food availability) affect the species traits, region-specific studies are crucial for informed decision-making on local or regional scales. Age and growth data have been essential inputs to age-structured population models, used to determine the intensity and efficacy of lionfish removal programs (Barbour et al., 2011; Edwards et al., 2014), as well as the fishing pressure required for population suppression (Bogdanoff et al., 2021). Historically, the selection of the most suitable method for fish ageing has been a challenging task, often being a trade-off between cost and precision (Worthington et al., 1995; Khan et al., 2015). Up to now, the age and growth of lionfish has been mainly studied using otoliths, either sectioned (Potts et al., 2010; Barbour et al., 2011; Eddy et al., 2019; Fogg et al., 2019; Dahl et al., 2019; Savva et al., 2020; Blakeway et al., 2022) or whole (Edwards et al., 2014; Dağhan and Demirhan, 2020; Yilmaz and Demirhan, 2020). Other methods have also been used like length frequency analysis (Rodríguez-Cortés et al., 2015; Johnson and Swenarton, 2016; Bustos-Montes et al., 2020; Savva et al., 2020; Kondylatos et al., 2024) and tagging techniques (Jud and Layman, 2012; Akins et al., 2014; Pusack et al., 2016).
Although most commonly used in age determination, lionfish otoliths are small, fragile and highly opaque when viewed whole. Even when sectioned, they often present unclear macrostructure (e.g., Potts et al., 2010; Dahl et al., 2019). In this study, we explored, for the first time, the use of dorsal fin spines to age P. miles. Fin spines have been repeatedly selected as the preferred structure to age large pelagic, endangered and protected species, as well as invasive freshwater fish (e.g., Casselman, 1983; Metcalf and Swearer, 2005; Walsworth et al., 2020; Carroll et al., 2023). They are larger in size and easy to obtain, without the need of dissecting the fish. They can be acquired fast at landing sites, facilitating the collection of larger samples for age determination. Lionfish possess 18 spines (13 dorsal, 3 anal and 2 pelvic spines) with a tri-lobed cross-sectional shape, each one covered by a thin fleshy membrane and featuring a pair of lateral grooves that deliver venom (Halstead et al., 1955).
Despite the extended published literature for Atlantic regions, where P. volitans predominates, P. miles growth data are scant in the Mediterranean (Dağhan and Demirhan, 2020; Savva et al., 2020; Yilmaz and Demirhan, 2020). In the Greek seas, only two studies have recently provided information on the species growth, based on scales ageing (Koilakos et al., 2024) and length frequency analysis (Kondylatos et al., 2024). The main objective of the present work was to investigate the growth of P. miles in coastal areas of the eastern Mediterranean (seas around Crete and Ionian Sea), based on age readings from dorsal spine sections, and compare growth patterns between study areas, sexes and other invaded regions.
2 Materials and methods
2.1 Sample collection
A total of 617 P. miles specimens were collected from Crete (n = 299) and the Ionian Sea (n = 318) during the period December 2020–September 2022 (Figure 1). Sampling was opportunistic, with most specimens obtained during small-scale fishing trips (n = 411) using static nets (mesh sizes of 20, 22, 24, 28, 40, 45 and 70 mm), and supplemented with specimens caught during experimental sampling operations with pole spears (n = 206). By combining catches from fishing nets with varying mesh sizes and scientific sampling, we ensured the representation of a wide range of sizes for age determination. Fishing depth ranged from 1 to 50 meters.
Figure 1
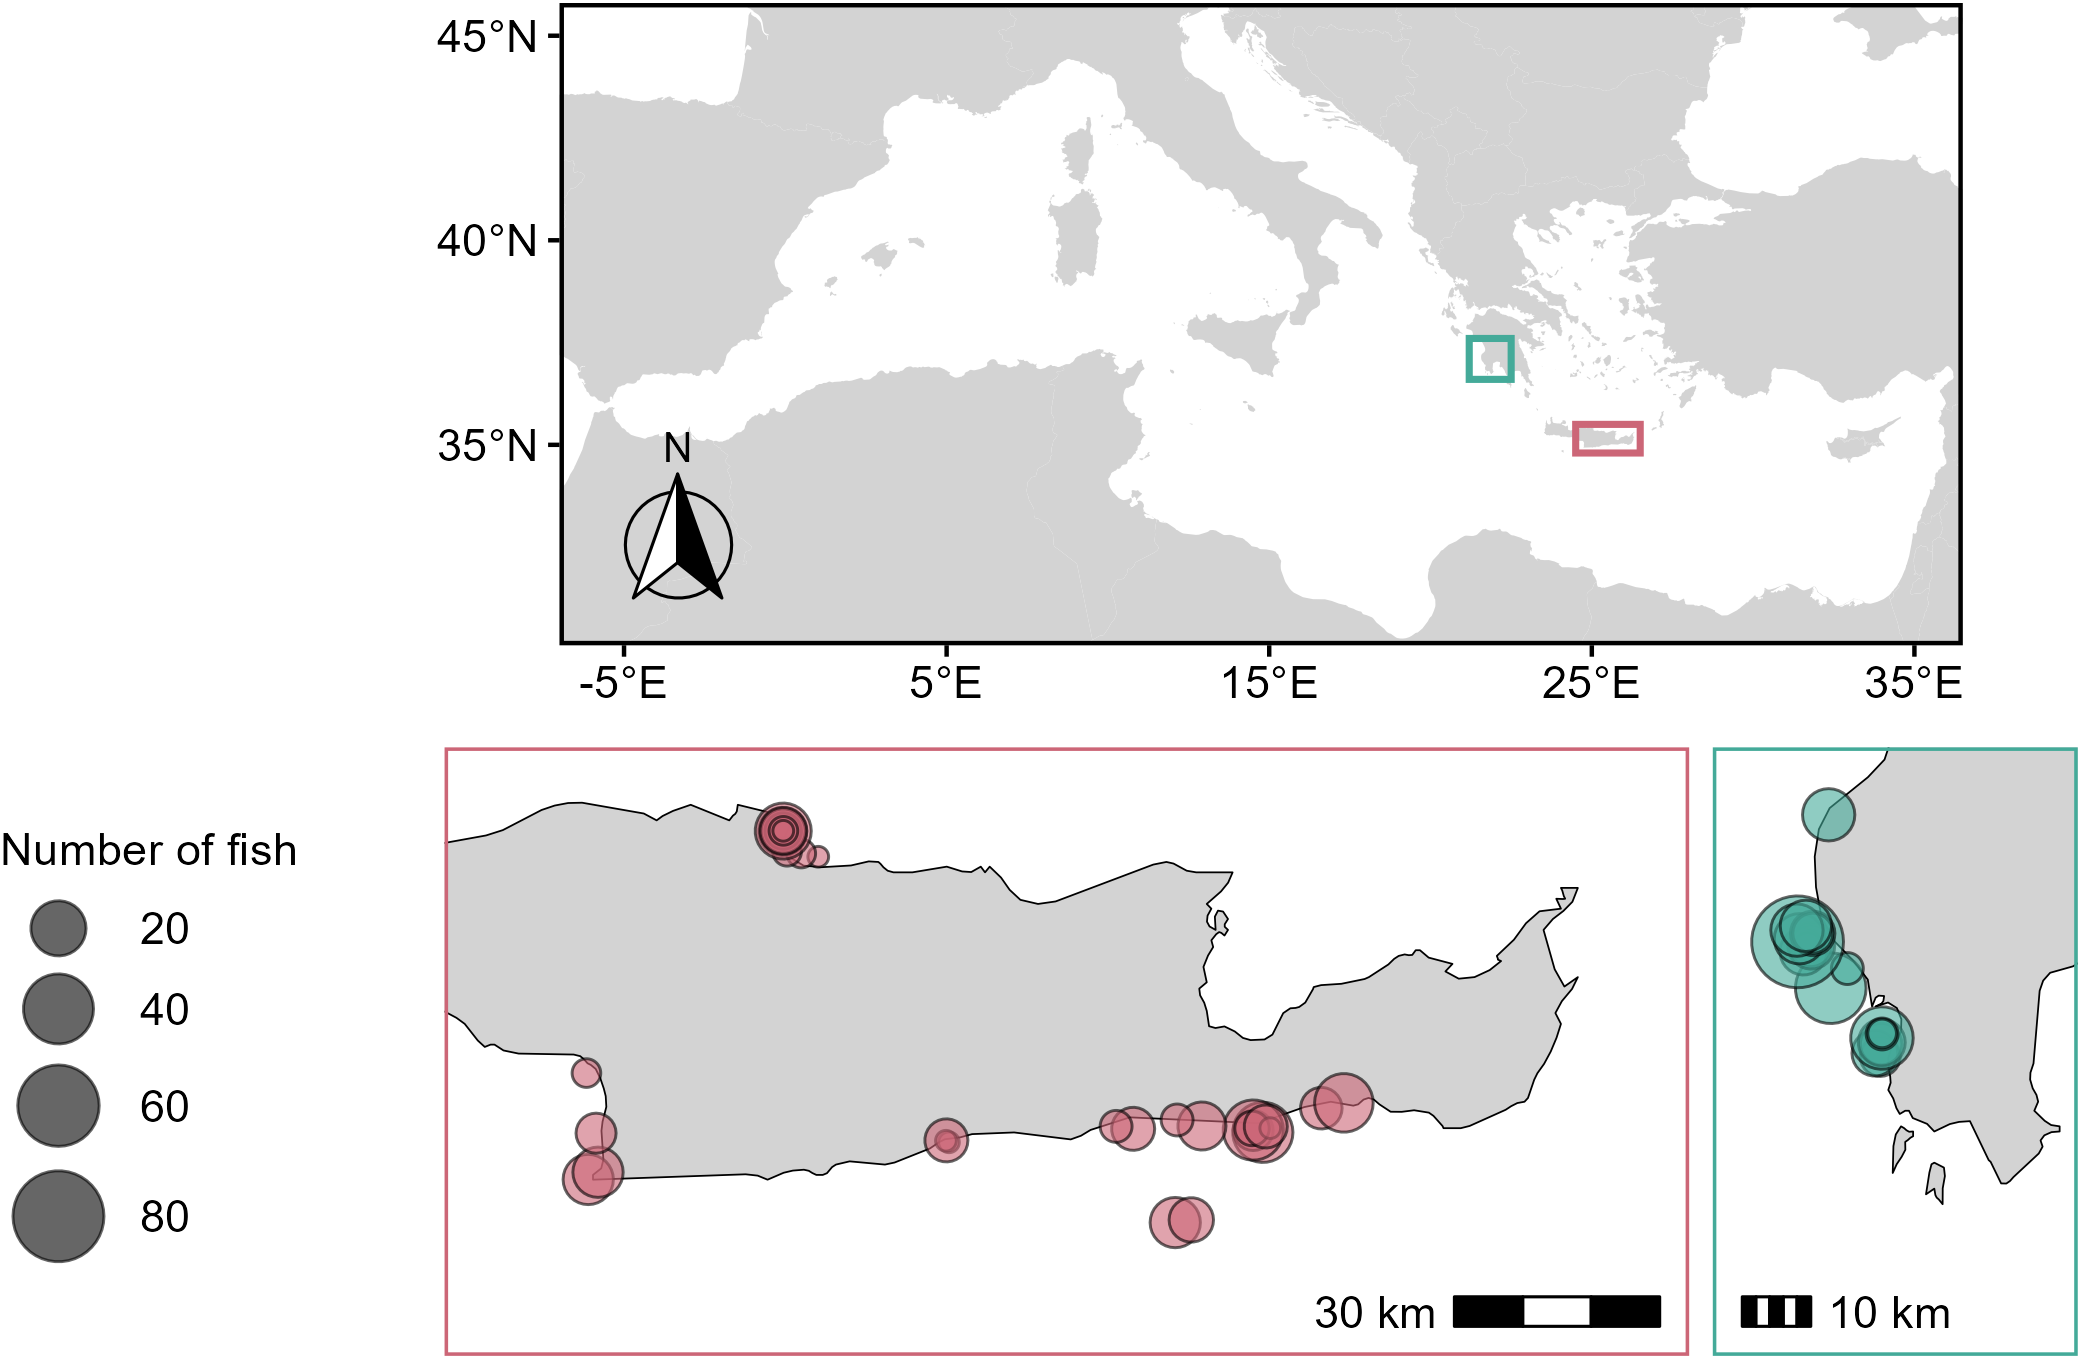
Sampling locations of Pterois miles collected during December 2020 – September 2022 in the Ionian Sea (green) and off the island of Crete (pink). Circle size indicates the number of fish collected from each location.
After collection, the fish were put in ice and transferred to the laboratory where their total length (L, mm), total weight (W, 0.01 g) were measured. Moreover, the sex of each specimen was identified macroscopically according to Green et al. (2012b). The third dorsal spine, which was longer and wider than the first two, was removed from each fish, freed from its membrane, rinsed with water, dried and stored in the freezer for further analysis.
2.2 Preparation of dorsal spines
Sections were prepared for the sampled spines following methods similar to those described in Bedford (1983) for gadoid otoliths. Specifically, a segment of about 1.5 cm long was removed from the lower portion of each spine by making two transverse cuts: one above the anteromedian groove and a second extending upward from this point (Figures 2A, B; see also Halstead et al. (1955) for detailed terminology of P. volitans spine anatomy). Each segment was embedded in an aluminum case (mould) filled with liquid polyester resin and enriched with hardener. In total, 30 spine samples were mounted in a single mould at a time (aligned in 6 rows of 5 spines each) offering the advantage of faster processing. All segments were aligned at the same level, and a consistent orientation was maintained, with the anterior side of each segment facing upward and the posterior side facing downward. The polyester block was left for ~24 hours for the plastic to harden and then the mould was removed. Finally, three or four transverse sections (~0.4 mm thick) were made in the posterior side of each sample row using a high-speed diamond saw (Extec Labcut 250).
Figure 2
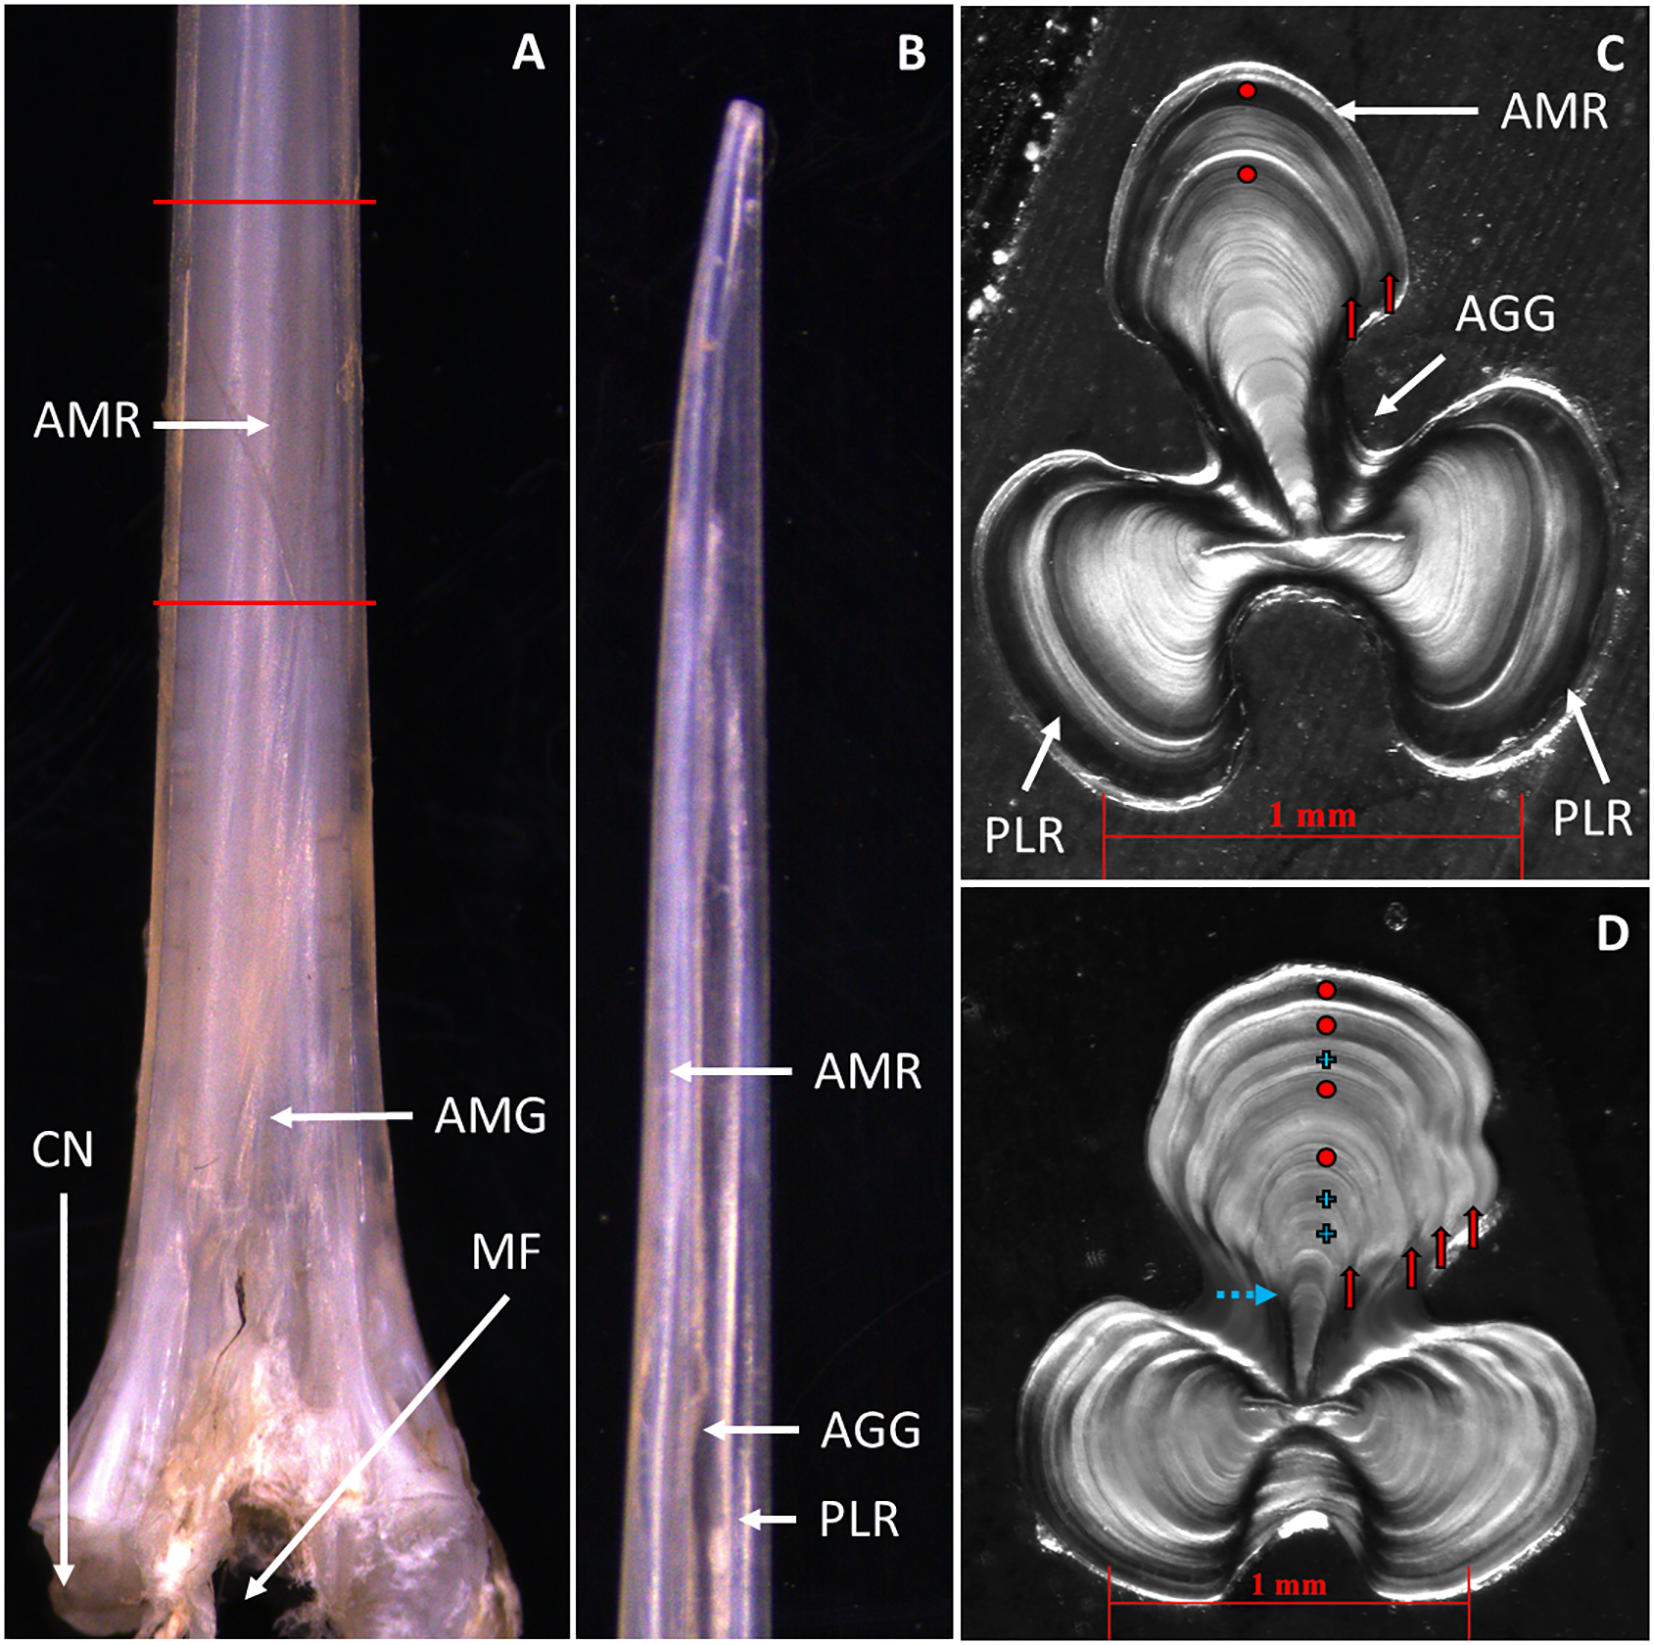
Pterois miles. (A) Anterior view of a membrane-free, third dorsal spine from the condyle (bottom edge) to the tip (top edge). The part between the red lines was used for sectioning. (B) Lateral view of the spine’s distal tip. (C) Transverse spine section of a two-years old female. (D) Spine section of a 4-years old male. Red dots indicate the annuli. Blue crosses indicate non annual checks. Red solid arrows show that annuli continue around the spine’s circumference. The blue dashed arrow indicates a hyaline band occasionally formed before the first annulus. The white arrows indicate anatomical parts of the spine. CN, Condyle; MF, Median foramen; DT, Distal tip; AMR, Anteromedian ridge; Posterolateral ridge; AGG, Anterolateral-granular groove; AMG, Anteromedian groove.
2.3 Reading spine sections
The prepared sections were examined using a binocular microscope under reflected light and a dark background. On each section, an alternating pattern of opaque and hyaline bands formed around the spine’s center, which was more clearly visible in the anteriomedian ridge of the spine (Figures 2C, D). Sections were read by two independent readers. Between–reader precision was quantified using the coefficient of variation (CV) and the average percentage error (APE) (Beamish and Fournier, 1981; Chang, 1982). Mean CV and APE were calculated by averaging individual values across sampled fish. Moreover, an age bias plot was constructed to evaluate potential systematic differences (bias) between the two readers’ age readings (Campana et al., 1995; Muir et al., 2008). Samples with between-reader disagreement (see Results section) were excluded from the subsequent analyses. Moreover, the distances (± 0.001 mm) from the spine’s center to the distal edge of the anteromedian ridge (spine radius) and to each hyaline band were measured with an image analysis software (LAS X 3.7.4) at a magnification of 32× or 40×. Finally, the distal edge of each spine was classified as opaque or hyaline.
2.4 Data analysis
The periodicity of annuli deposition was examined using marginal increment analysis. Specifically, the marginal increment ratio (MI) was estimated for each fish according to the equation (Morales-Nin et al., 1998):
where S is the spine radius, Ri the radius at the most recent annulus (i = I, II, III…), and Ri-1 the radius to the previously completed annulus. Finally, the median value of MI and the percentage of spines with hyaline and opaque edge were calculated for each month.
To investigate the growth of P. miles, body lengths at previous ages were estimated using a back-calculation procedure. Back-calculation is widely used in fish growth studies because it produces a larger, continuous sequence of length-at-age observations for each individual, which can improve fitting of growth curves (e.g., Francis, 1990; Vigliola and Meekan, 2009), especially in cases in which adequate sampling across all age classes is not feasible (see Results section). This approach helps correct the bias associated with the under-representation of small and large individuals in the dataset, which may arise from sampling selectivity and/or other factors such as size-dependent survival (Campana, 1990, 2001). In addition, back-calculation can help to overcome problems associated with the assignment of age to observed lengths. The later requires an agreed ageing scheme (based on an assumed birthdate, the date of capture and the timing of annulus formation) which is not currently available for most fish species in the Mediterranean (Carbonara and Follesa, 2019).
The initial examination of the length (L)-on-spine radius (S) relationship showed that a single regression line did not fit the data satisfactorily (Supplementary Figure 1A). Specifically, the distribution of residuals (Supplementary Figure 1B) was not random (structured) indicating a change in the slope of the relationship at some point of development. Therefore, a piecewise linear regression was fitted to the data (Nikolioudakis et al., 2011):
where a0 is the y-intercept, b0 is the slope of the regression before the shift in fish growth relative to spine growth, b2 is the change in slope that results in the slope of the relationship after the shift in growth, and b3 is the mean spine radius at which the slope changes (inflexion point). The slope and intercept after the slope change were calculated as follows:
The piecewise regression provided stage-specific length-on-spine radius regression coefficients (before and after the inflexion point), which were subsequently used to compute back-calculated lengths using the two-stage body proportional formula proposed by Bailey et al. (2022):
where Li is the back-calculated length at annulus formation, Lc is the observed length at capture, Si and Sc are the spine radius at annulus formation and capture, respectively.
-
If Si< b3 and Sc< b3, then ai = ac= a0 and bi = bc= b0
-
If Si ≥ b3 and Sc ≥ b3 then ai = ac= a1 and bi = bc= b1
-
If Si< b3 and Sc ≥ b3 then ai = a0, bi = b0, ac= a1 and bc= b1
Significant differences between observed and back-calculated lengths-at-age were tested with t-tests.
Furthermore, the effects of AREA (Crete, Ionian Sea), SEX (Male, Female) and AGE (1, 2, 3, …) on back-calculated lengths were tested using a separate ANOVA model for each individual annulus (I, II, III, …). In the initial models, all two-way interaction terms were included, however, since they were not statistically significant (not shown) they were excluded from the final models. For all other significant effects, least-square means were plotted and compared with a posteriori Bonferroni tests.
The von Bertalanffy growth function (VBGF) was fitted to the back-calculated lengths-at-age data:
where Lt is the back-calculated length at age t, L∞ is the asymptotic total length, K is the growth coefficient (year-1) and t0 is the theoretical age when length is zero. Growth parameters were estimated for each sex and area separately, as well as for pooled data.
To evaluate whether fitting separate growth models for each sex and area combination is statistically justified, we compared a pooled VBGF with alternative sex- or area-specific models. Model comparison was performed using the small-sample, bias-corrected form AICc (Hurvich and Tsai, 1989) of the AIC (Akaike, 1973; Burnham and Anderson, 2002) and likelihood ratio tests (LRTs). In all cases, the model with the lowest AICc, ΔAICc values >2 and a significant LRT (α = 0.05) was considered to provide a better fit to the data. AIC- and LRT-based model comparisons were conducted in R using the AICcmodavg and lmtest packages, respectively, following the framework described by Ogle (2016).
Additionally, all available information on lionfish growth (P. miles, P. volitans and P. miles/volitans complex) was collated and summarized (see Results section), including studies from the Pacific Ocean, the West Atlantic (coasts of Carolina and the Bermuda island), the Gulf of Mexico, the Caribbean Sea and the Mediterranean Sea. Since comparisons of individual L∞ and K across regions can be problematic (these parameters are negatively correlated (Pilling et al., 2002)), the phi-prime index (φ΄) (Pauly and Munro, 1984), a combination of L∞ and K in a single metric, was used to compare overall growth performance in different regions:
Finally, temperature data for our sampling locations (Figure 1) during the study period were obtained from E.U. Copernicus Marine Service Information (Escudier et al., 2020). Data were processed to estimate mean monthly temperatures within the 1–50 m depth range, corresponding to the depths at which P. miles specimens were collected. Significant regional differences in φ΄, as well as regional and temporal differences in temperature, were tested using one- and two-way ANOVA, respectively, followed by Bonferroni post-hoc tests. In all cases, the level of significance was set at α = 0.05.
3 Results
The age estimation of P. miles specimens was based on counting clear and relatively wide hyaline bands that continued around the entire circumference of the spine ridge (shown with vertical red arrows in Figures 2C, D) which were considered as ‘true’ annuli. These annuli were regularly spaced with decreasing distances as the fish ages (Figure 3). Other hyaline bands that did not continue around the entire spine ridge, were generally less clear, and/or exhibited ‘unusual’ spacing in relation to adjacent annuli (i.e., bands that were unusually narrow and did not follow the expected decrease in inter-annular distance with age [shown with blue crosses in (Figure 2D)] were ignored. In 61% of the samples, a clear check was also be observed near the spine center (indicated with a blue arrow in Figure 2D), with mean radius of 0.458 mm (standard deviation = 0.040 mm), corresponding to a mean back-calculated length of 118 mm (standard deviation = 14 mm, length range = 70–140 mm). These back-calculated lengths were much smaller than the reported lengths of one-year-old P. miles in the Mediterranean (Savva et al., 2020; Kondylatos et al., 2024) and this occasionally formed first check was not considered in age assignments.
Figure 3
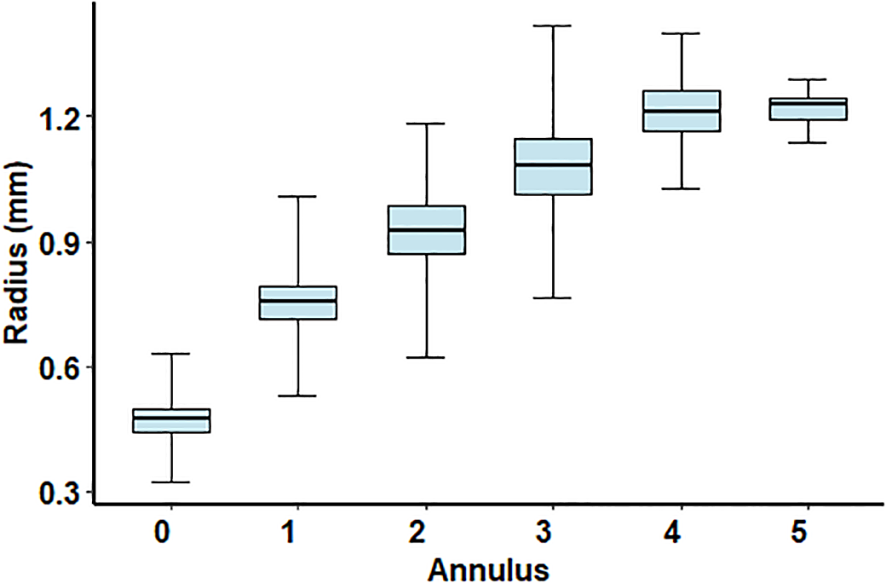
Pterois miles. Boxplots of annulus radius for each consecutive annulus. The horizontal line within each box represents the median. The lower and upper edges of each box represent the 25th and 75th percentiles, respectively. Whiskers represent the full range of values.
From the 617 spine sections examined, age agreement was reached in 583 specimens (342 males and 241 females - 271 specimens from Crete and 312 from the Ionian Sea). When disagreement occurred, it did not exceed one year. The mean CV and APE values were 6.4% and 4.5%, respectively. Furthermore, the age bias plot showed that age readings were not significantly different between the two readers, except for ages 0 and 1 (Supplementary Figure 2).
The total length ranged from 100 to 378 mm (Table 1) and maximum recorded age was four years for females and five years for males. The sample was dominated by two-year-old lionfish (age 0: 5%, age 1: 26%, age 2: 44%, age 3: 19%, age 4: 5%, age 5: 1%). Finally, the proportion of females presented a decreasing trend with length and age (Figures 4A, B), peaking at the length class of 200–220 mm (0.58). All specimens >320 mm were males (Figure 4A).
Table 1
| Sex | Area | N | Range L | mean L |
|---|---|---|---|---|
| Female | Crete | 130 | 109‐314 | 236 ± 42 |
| Male | Crete | 169 | 100‐378 | 262 ± 59 |
| Female | Ionian Sea | 132 | 161‐310 | 239 ± 29 |
| Male | Ionian Sea | 186 | 131‐351 | 258 ± 35 |
| Pooled | Crete | 299 | 100‐378 | 250 ± 54 |
| Pooled | Ionian Sea | 318 | 131‐351 | 250 ± 34 |
| Female | Pooled | 262 | 109‐314 | 238 ± 36 |
| Male | Pooled | 355 | 100‐378 | 260 ± 48 |
| Total | 617 | 100‐378 | 250 ± 44 | |
Pterois miles.
Range and mean (± standard deviation) total length (L, mm) per sex and area. N, number of fish.
Figure 4
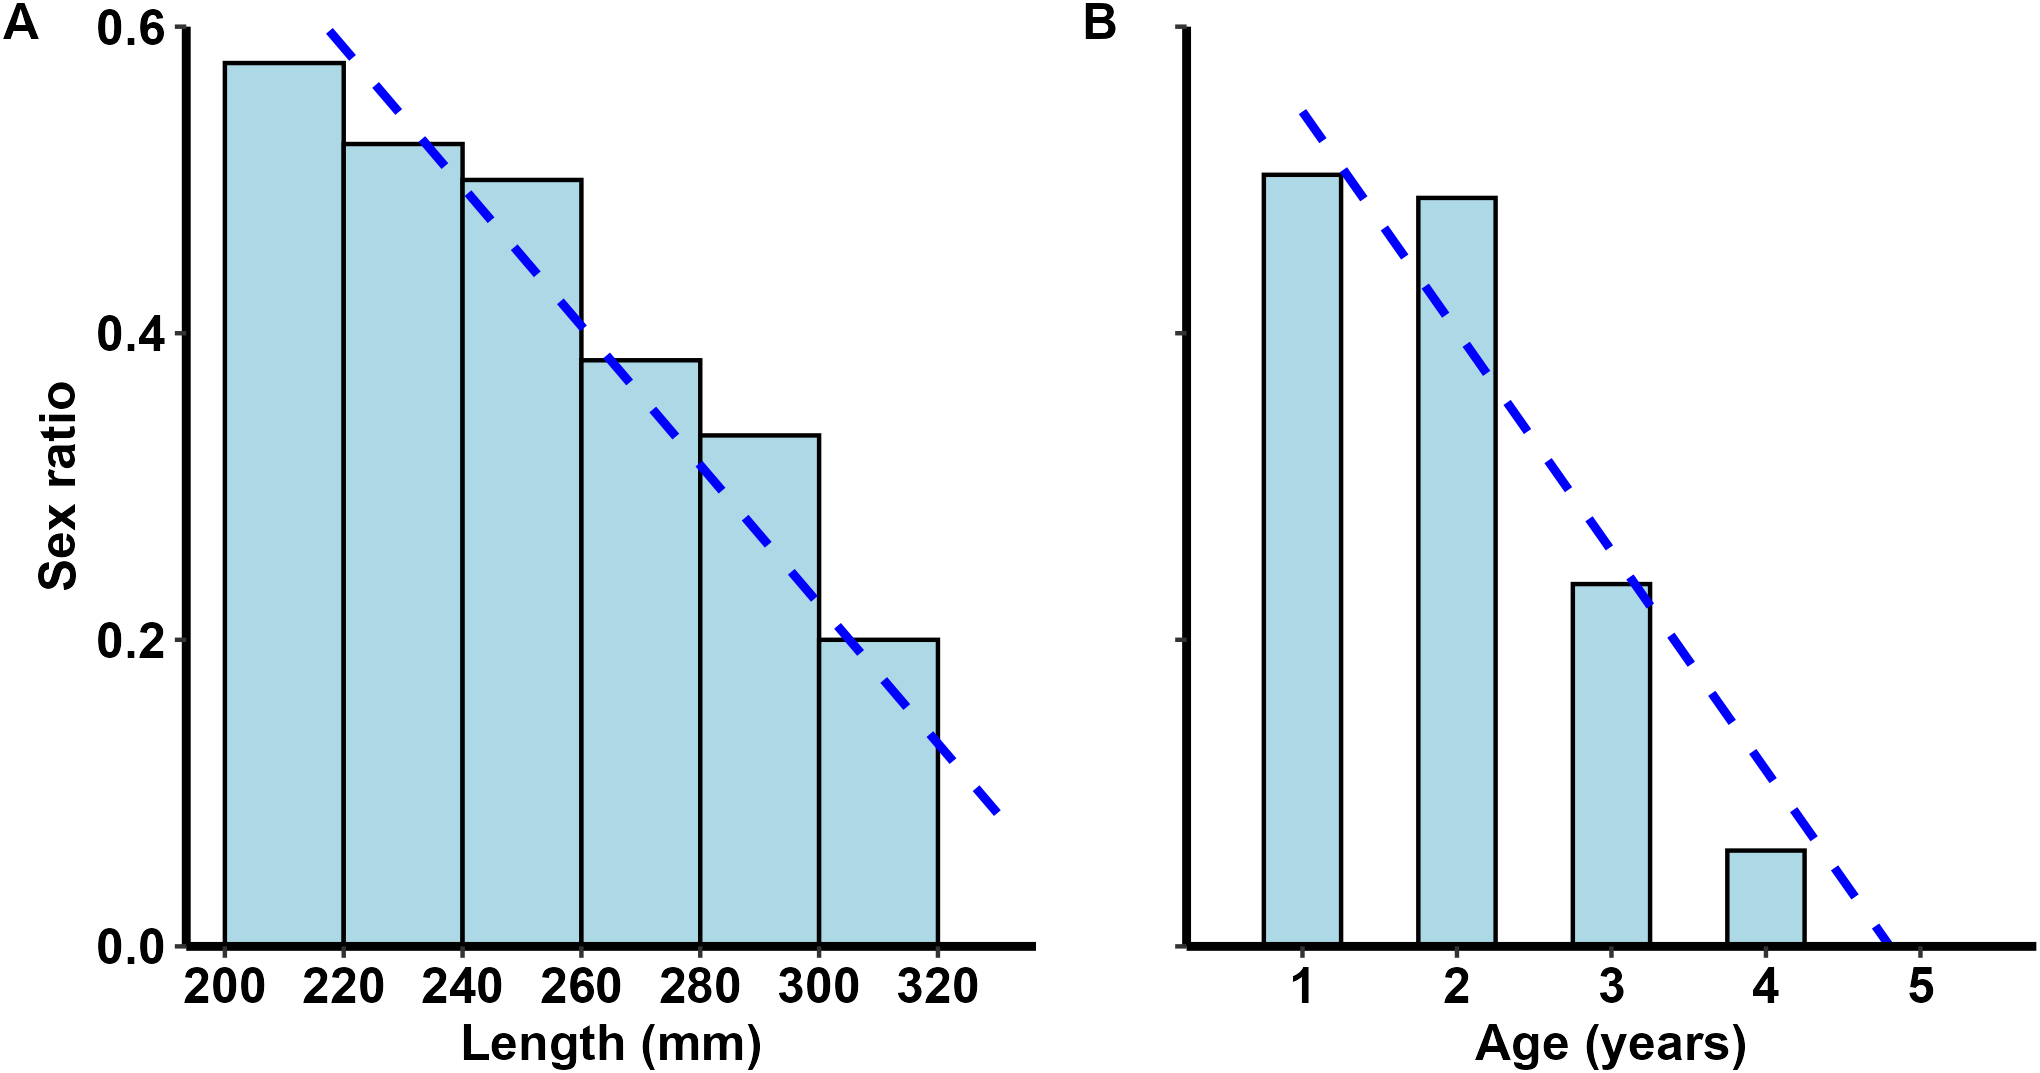
Pterois miles. Sex ratio (females/[females + males]) plotted against (A) length and (B) age. Dashed lines denote linear trends.
The analysis of the spine’s distal edge type (hyaline/opaque) showed that, during the period December-June, the percentage of specimens exhibiting hyaline spine margin was higher than 80% (Figure 5). The majority of fish collected from July to November had opaque spine edge and, particularly in July-August, more than 80% of the examined spines had opaque edge. Similarly, the marginal increment ratio was higher during summer and autumn (July to November) and lower during winter and spring (December to June) when its monthly median value was zero (Figure 5).
Figure 5
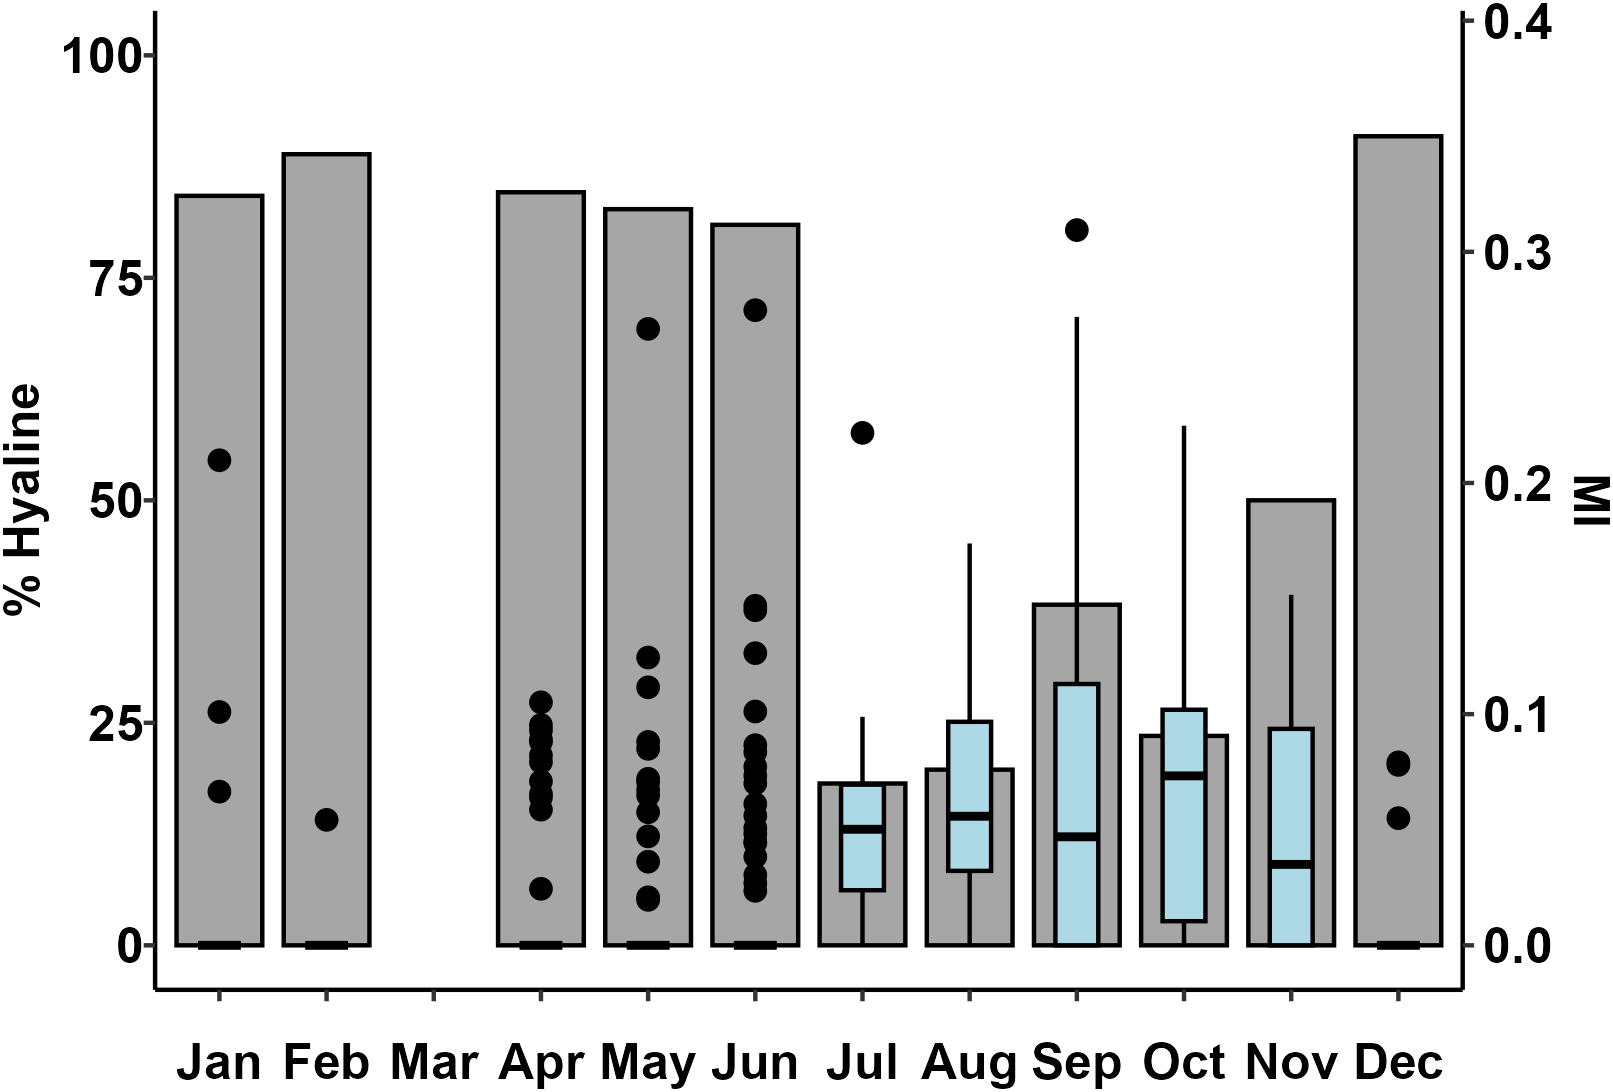
Monthly percentages of Pterois miles spines with hyaline distal edges (columns) and boxplots of the marginal increment ratio (MI). The lower and upper edges of each box represent the 25th and 75th percentiles, respectively. The horizontal line within each box represents the median. Whiskers represent the 1.5 interquartile range. Points indicate the outliers. Note that the median MI is zero from December to June.
The piecewise regression of length (L)-on-spine radius (S) had a significant (p < 0.0001) inflexion point at spine radius 0.7 mm (standard error: ± 0.032 mm) and explained a large amount of variation (r2 = 0.677) (Figure 6). In contrast to a single linear regression fitted to the full data range, the fit of the piecewise regression was more satisfactory in terms of residuals (randomly distributed around the regression model; Supplementary Figure 1D). The computed back-calculated lengths-at-age using the two-stage formula did not differ significantly from the respective observed lengths-at-age (Supplementary Table 1).
Figure 6
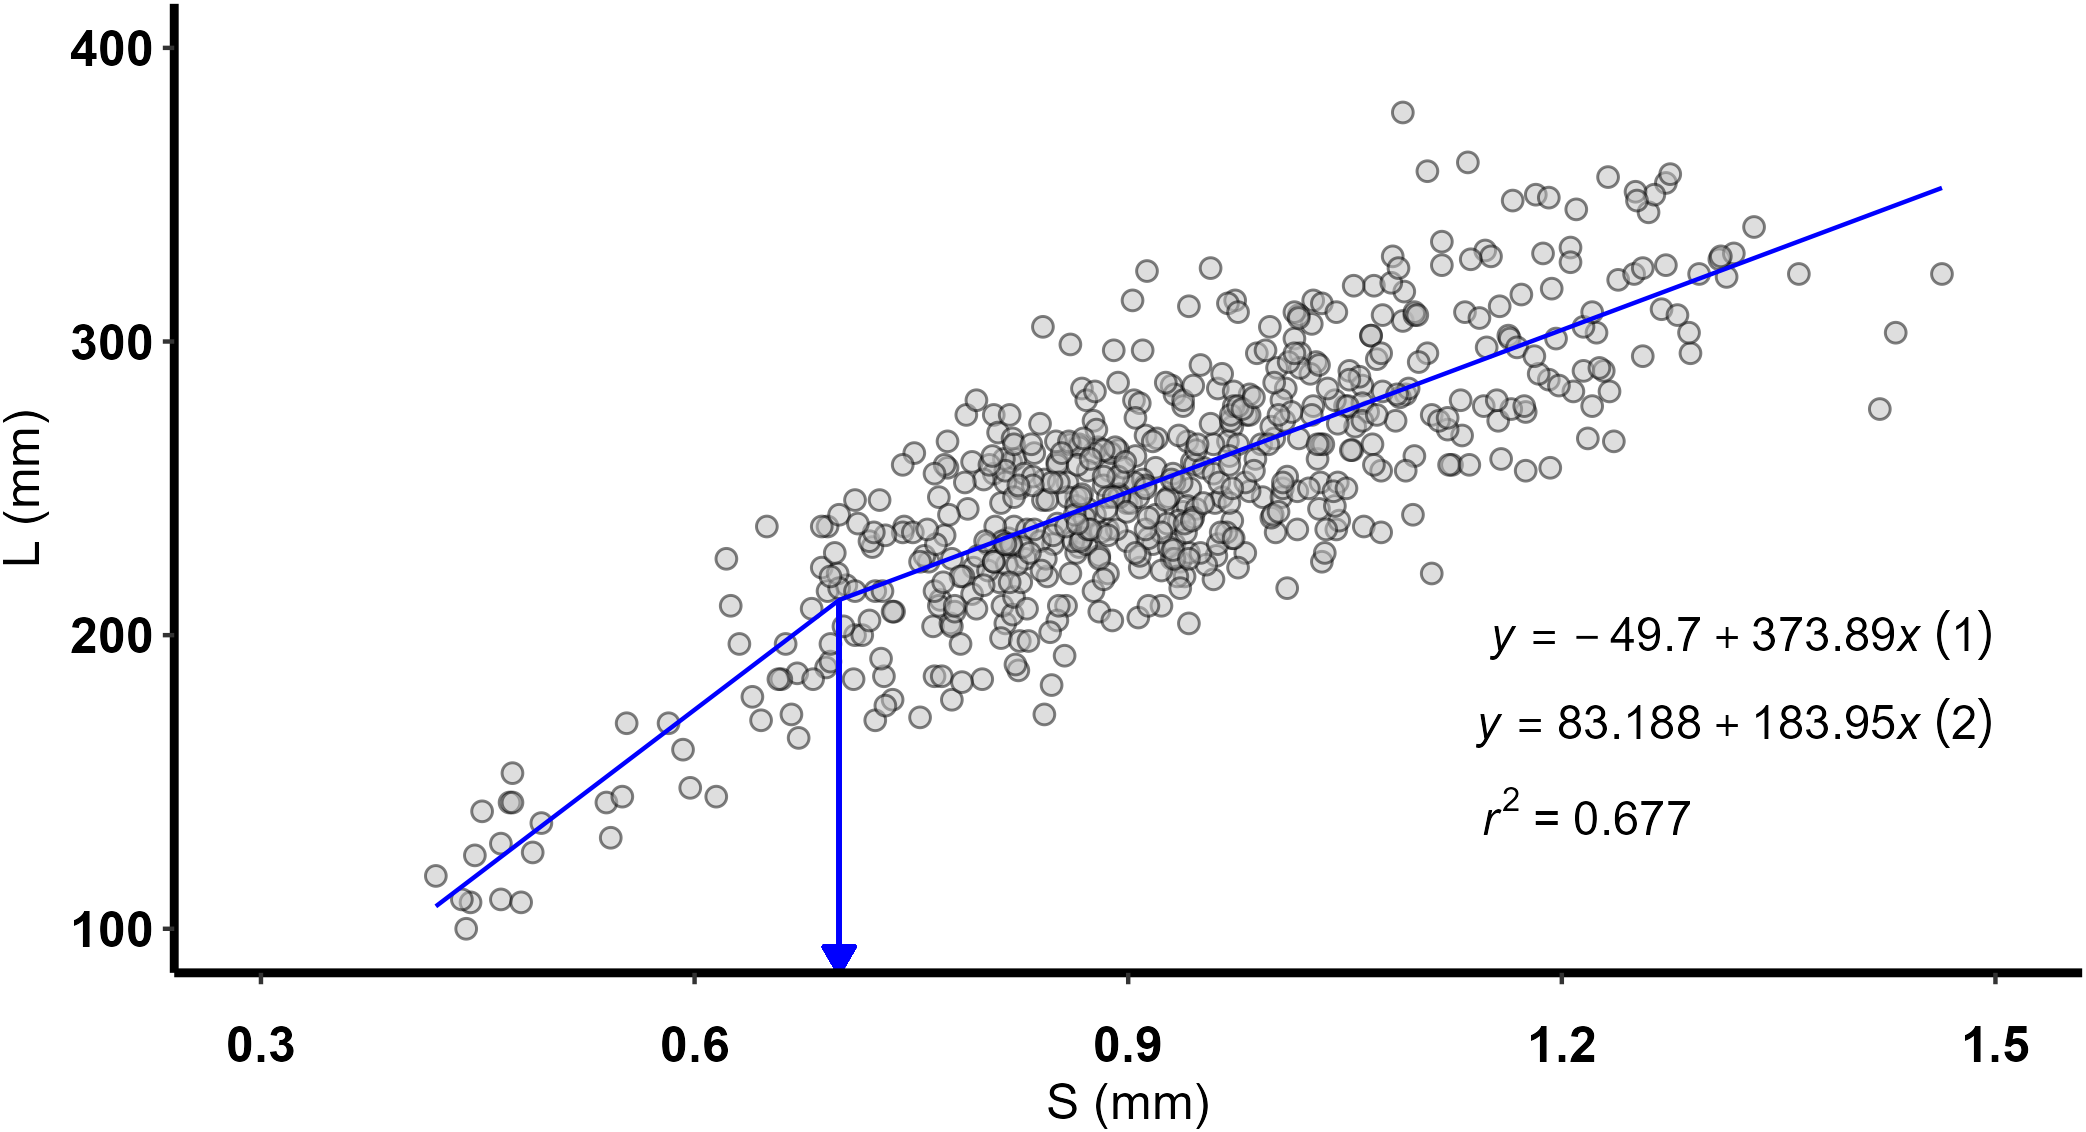
Pterois miles. Piecewise regression between length (L) and spine radius (S). Estimated spine radius at changing slope (inflection point = 0.7 mm) and equations of the linear regressions before (1) and after (2) the inflection point are also shown.
The ANOVA models showed that AREA, SEX and AGE were significant predictors for the back-calculated length at ages one-to-four (Table 2, Supplementary Figure 3). In Figure 7, these effects are exemplified for back-calculated length at age-2 (L2). All mean back-calculated lengths were higher in Crete compared to the Ionian Sea and higher in males compared to females. Moreover, back-calculated lengths were significantly increasing with AGE.
Table 2
| Annulus | Effect | SS | df | F | p |
|---|---|---|---|---|---|
| I | AREA | 3827 | 1 | 8.240 | 0.0043 |
| SEX | 3516 | 1 | 7.570 | 0.0061 | |
| AGE | 12033 | 3 | 8.637 | <0.0001 | |
| II | AREA | 13351 | 1 | 26.257 | <0.0001 |
| SEX | 8185 | 1 | 16.098 | <0.0001 | |
| AGE | 27871 | 2 | 27.407 | <0.0001 | |
| III | AREA | 14296 | 1 | 31.931 | <0.0001 |
| SEX | 10151 | 1 | 22.671 | <0.0001 | |
| AGE | 2730 | 1 | 6.098 | 0.0148 | |
| IV | AREA | 1852 | 1 | 4.329 | 0.0464 |
| SEX | 1927 | 1 | 4.505 | 0.0424 |
Results of the ANOVA models for Pterois miles back-calculated length at annulus formation.
SS, type III sum of squares; df, degrees of freedom; F, F-statistic; p, p-value.
Figure 7
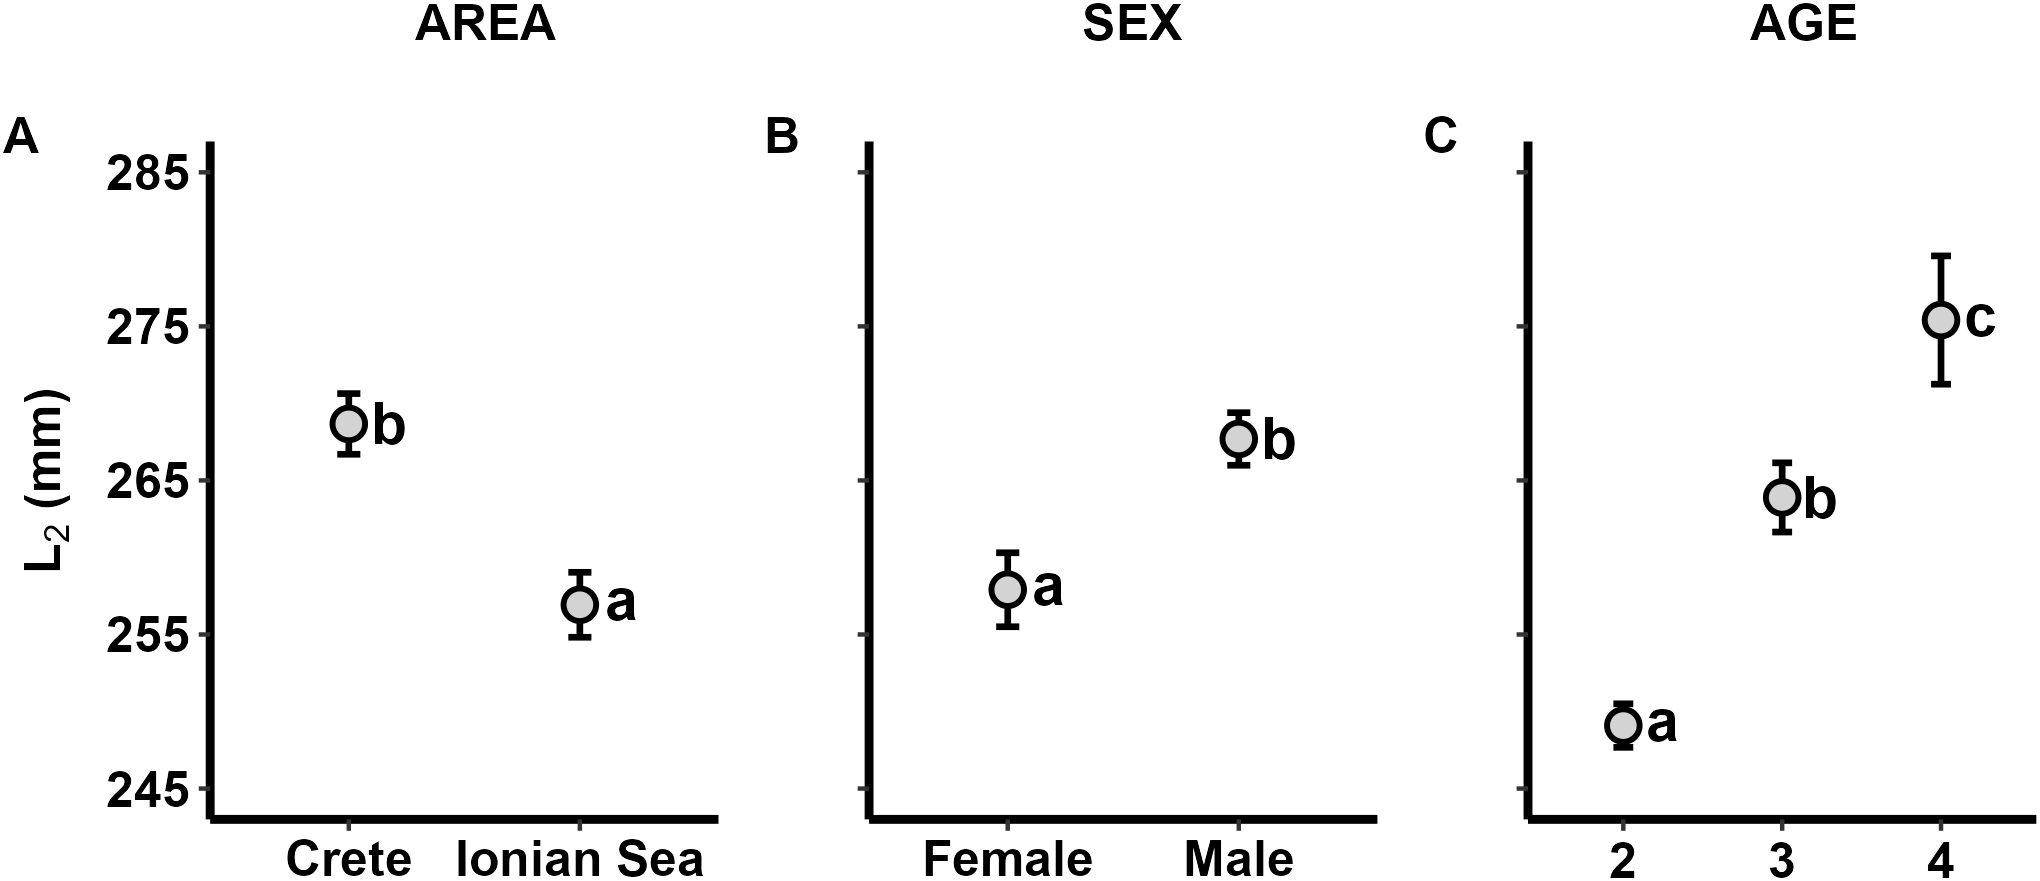
Least-square means of Pterois miles back-calculated length-at-age 2 (L2) for the effects of (A) AREA, (B) SEX and (C) AGE. Error bars represent standard errors. a< b< c: homogenous groups (Bonferroni test).
All sex-specific models fitted to pooled area data and in each area separately received strong support against combined-sex models (ΔAICc > 20; p< 0.001) (Table 3), indicating that males and females exhibit significantly different growth patterns. Moreover, area-specific models were supported against area-combined models in the cases of pooled sex and male data. On the contrary, only weak support was found for area-specific growth models of females (ΔAICc = 0.59; p = 0.08). Because this difference is below the conventional ΔAICc > 2 and p< 0.05 thresholds, the area-specific and combined models were considered to have essentially equivalent support, indicating that in females, growth differences between areas are minimal.
Table 3
| Group | Model | AIC-based comparison | LRT-based comparison | ||||
|---|---|---|---|---|---|---|---|
| AICc | ΔAICc | AICc Weight | LogLik | X2 | p | ||
| Pooled area | Sex-specific | 10468.54 | 0.00 | 1 | -5227.2 | 79.7 | <0.001 |
| Sex-combined | 10542.20 | 73.66 | 0 | -5267.1 | |||
| Pooled sex | Area-specific | 10467.09 | 0.00 | 1 | -5226.5 | 81.2 | <0.001 |
| Area-combined | 10542.20 | 75.11 | 0 | -5267.1 | |||
| Crete | Sex-specific | 4994.54 | 0.00 | 1 | -2490.2 | 63.4 | <0.001 |
| Sex-combined | 5051.78 | 57.24 | 0 | -2521.8 | |||
| Ionian Sea | Sex-specific | 5351.56 | 0.00 | 1 | -2668.7 | 28.5 | <0.001 |
| Sex-combined | 5373.95 | 22.39 | 0 | -2682.9 | |||
| Female | Area-specific | 3726.48 | 0.00 | 0.57 | -1856.1 | 6.8 | 0.08 |
| Area-combined | 3727.07 | 0.59 | 0.43 | -1859.5 | |||
| Male | Area-specific | 6652.59 | 0.00 | 1 | -3319.2 | 94.6 | <0.001 |
| Area-combined | 6741.09 | 88.51 | 0 | -3366.5 | |||
AIC- and LRT- (likelihood ratio tests) based comparisons of von Bertalanffy growth models.
AICc, corrected Akaike’s Information Criterion; ΔAICc, difference between the model value and the lowest obtained AICc value; AICc Weight, likelihood of the model; LogLik, log-likelihood; X², likelihood ratio χ²; p, p-value.
In both Crete and the Ionian Sea, males had higher asymptotic total length (L∞) and lower growth coefficient (K) compared to females (Table 4, Figures 8A, B). Regarding the models fitted to pooled area data, both L∞ and K were higher in males than in females (Table 4, Figure 8C). Moreover, growth parameters of females were similar between areas, whereas males from Crete had higher K and L∞ than in the Ionian Sea (Table 4, Figures 8D, E). Finally, for the models fitted to pooled sex data, K was higher in the Ionian Sea and L∞ was higher in Crete (Table 4, Figure 8F).
Table 4
| Sex | Area | L∞ | K | t0 |
|---|---|---|---|---|
| Female | Crete | 361 | 0.25 | -2.70 |
| Male | Crete | 436 | 0.24 | -2.13 |
| Female | Ionian Sea | 365 | 0.22 | -3.01 |
| Male | Ionian Sea | 425 | 0.18 | -3.11 |
| Pooled | Crete | 484 | 0.17 | -2.60 |
| Pooled | Ionian Sea | 417 | 0.19 | -3.01 |
| Female | Pooled | 400 | 0.18 | -3.29 |
| Male | Pooled | 446 | 0.19 | -2.66 |
Parameters of the von Bertalanffy growth functions for Pterois miles.
L∞, asymptotic total length (mm); K, growth coefficient (year-1); t0, theoretical age at length zero (years).
Figure 8
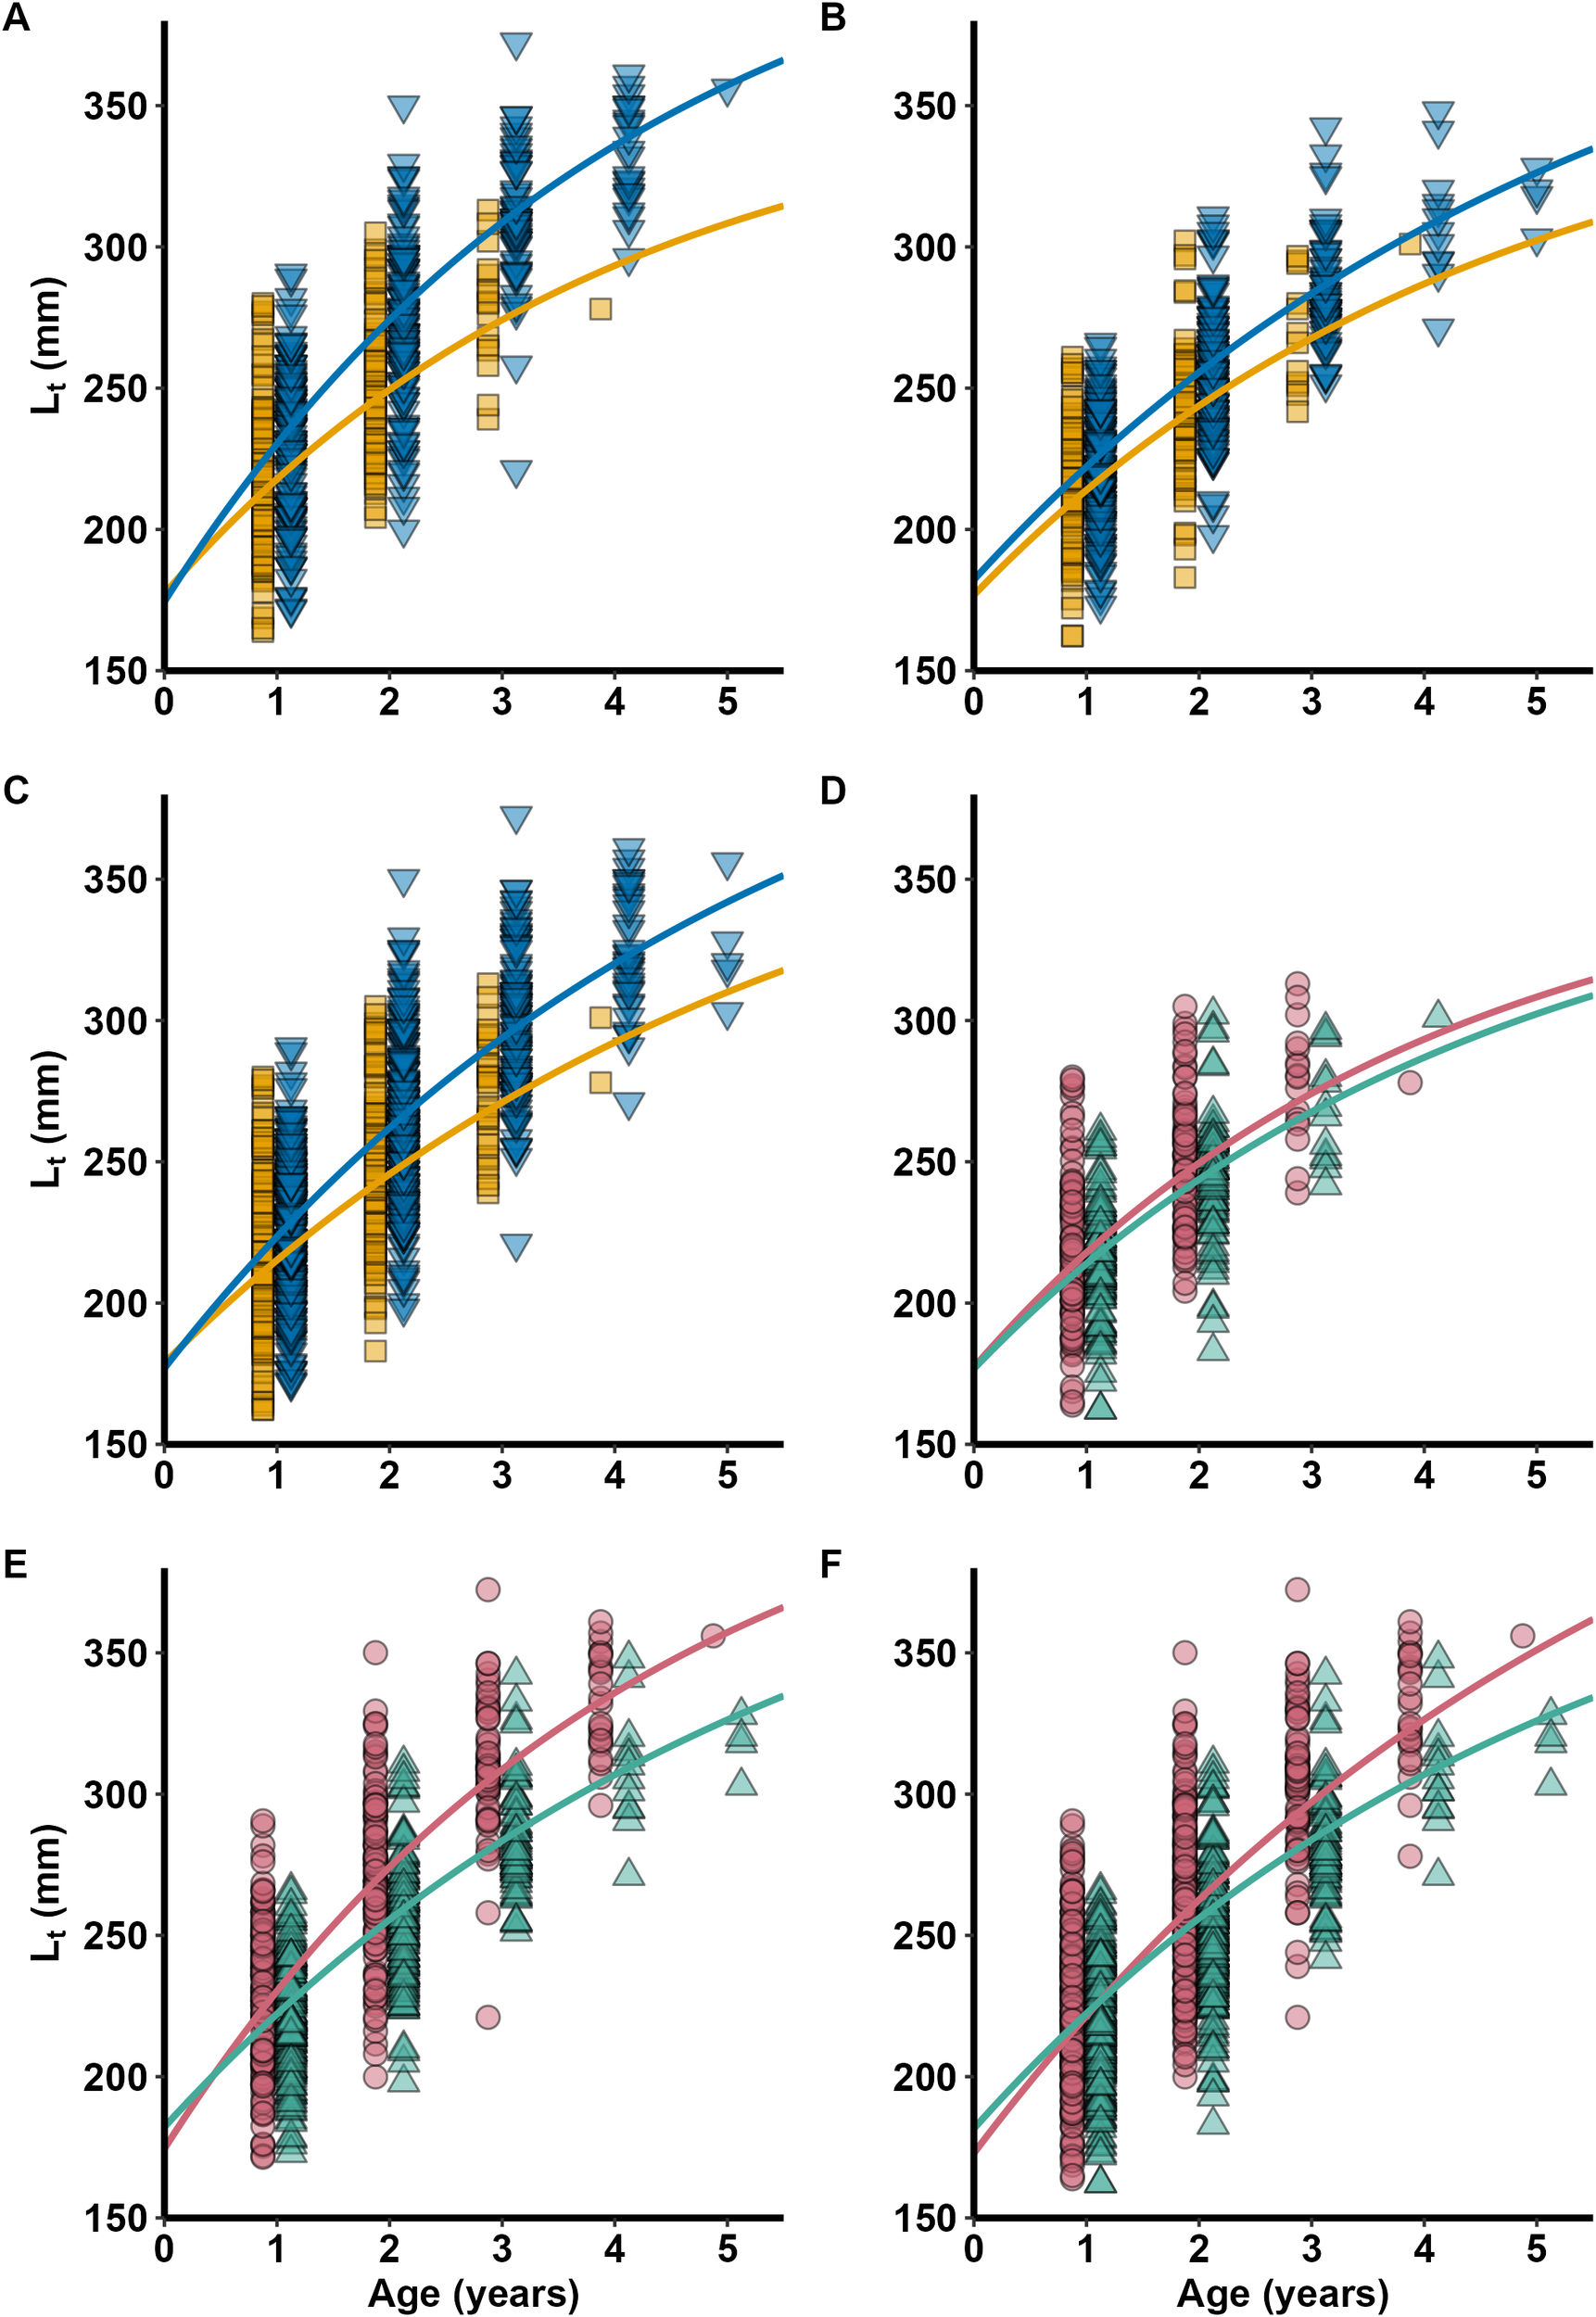
Pterois miles. Von Bertalanffy growth functions plotted with back-calculated lengths-at-age (Lt) for each sex (Female: orange square, Male: blue down-pointing triangle) by sampling area [(A) Crete, (B) Ionian Sea, (C) Pooled areas] and for each sampling area (Crete: pink circle, Ionian Sea: green up-pointing triangle) by sex [(D) Female, (E) Male, (F) Pooled sex].
Regarding temperature, mean monthly values within the 1–50 m depth range were significantly higher in Crete than in the Ionian Seas throughout the year (two-way ANOVA: F = 182.610, p < 0.0001), except the November–January period, when temperature differences were not significant (pairwise Bonferroni t-tests, p > 0.05) (Figure 9).
Figure 9
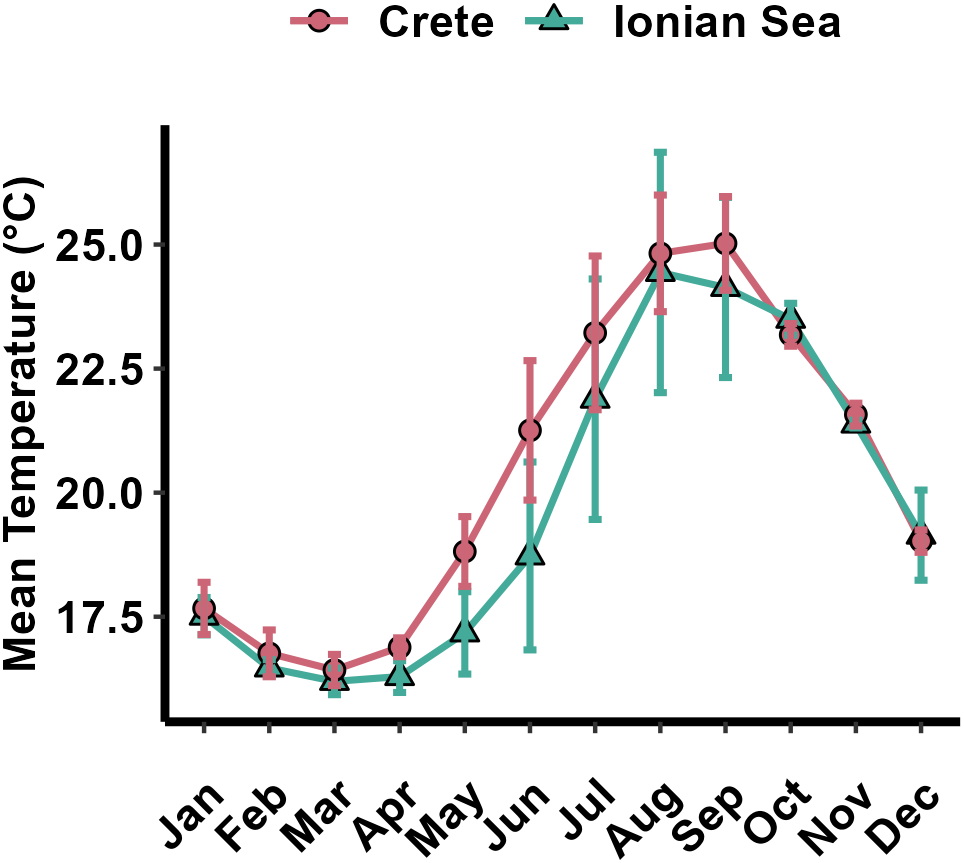
Mean temperature in the depth range 1–50 m per month and sampling area, during the sampling period December 2020-September 2022. Error bars indicate standard deviations.
Table 5 summarizes the von Bertalanffy growth parameters of lionfish (P. miles, P. volitans or P. miles/volitans complex) from studies published in the literature. These studies applied a variety of estimation methods including tagging, length frequency and otolith analyses. The asymptotic lengths and growth coefficients estimated in the present study were generally consistent with previous studies in the eastern Mediterranean Sea. The comparison of the phi-prime index (φ΄) between different regions (ANOVA: F = 7.357, p = 0.003) revealed that the growth performance was significantly lower in the eastern Mediterranean compared to the Atlantic regions (Figure 10).
Table 5
| Area | Species | Method | Sample size | L∞ | K | t0 | tmax | φ’ | Reference |
|---|---|---|---|---|---|---|---|---|---|
| Pacific Ocean | |||||||||
| Philippines and Marianas Islands | Pterois volitans | T | 36 | 225 | 1.62 | -0.07 | n/a | 4.914 | Pusack et al., 2016 |
| West Atlantic | |||||||||
| North Carolina | Pterois complex | OS | 814 | 455 | 0.32 | -1.22 | 8 | 4.821 | Potts et al., 2010 |
| North Carolina | Pterois volitans | OS | 774 | 425 | 0.47 | -0.50 | 8 | 4.929 | Barbour et al., 2011 |
| Northeast Florida | Pterois complex | LBM | 2137 | 448 | 0.47 | 0.00 | 3.3 | 4.975 | Johnson and Swenarton, 2016 |
| Bermuda | Pterois complex | OS | 587 | 381 | 0.77 | -0.42 | 9 | 5.048 | Eddy et al., 2019 |
| Gulf of Mexico | |||||||||
| South | Pterois volitans | LFA | 776 | 420 | 0.88 | 0.11 | n/a | 5.191 | Rodríguez-Cortés et al., 2015 |
| Southeast | Pterois volitans | OS | n/a | 423 | 0.57 | -0.15 | 4.5 | 5.009 | Fogg et al., 2019 |
| Northeast | Pterois volitans | OS | n/a | 393 | 0.54 | -0.08 | 4.5 | 4.921 | Fogg et al., 2019 |
| Central | Pterois volitans | OS | 389 | 0.54 | -0.34 | 4 | 4.912 | Fogg et al., 2019 | |
| Northeast | Pterois volitans | OS | 2996 | 381 | 0.30 | -0.52 | 7.7 | 4.643 | Dahl et al., 2019 |
| Western | Pterois volitans | OS | 110 | 368 | 0.34 | -2.01 | 10 | 4.660 | Blakeway et al., 2022 |
| Caribbean Sea | |||||||||
| Little Cayman Island | Pterois complex | WO | 499 | 349 | 0.42 | -1.01 | 5 | 4.709 | Edwards et al., 2014 |
| Bahamas and Cayman Islands | Pterois volitans | T | 156 | 322 | 1.48 | -0.07 | n/a | 5.186 | Pusack et al., 2016 |
| Colombian Caribbean | Pterois volitans | LFA | 249 | 425 | 0.56 | 0.63 | n/a | 5.005 | Bustos-Montes et al., 2020 |
| Colombian Caribbean | Pterois volitans | LFA | 351 | 402 | 0.51 | 0.47 | n/a | 4.916 | Bustos-Montes et al., 2020 |
| Colombian Caribbean | Pterois volitans | LFA | 498 | 425 | 0.47 | 0.36 | n/a | 4.929 | Bustos-Montes et al., 2020 |
| Eastern Mediterranean Sea | |||||||||
| Southeast Cyprus | Pterois miles | OS | 53 | 388 | 0.38 | -1.02 | 4 | 4.758 | Savva et al., 2020 |
| Iskenderun Bay | Pterois miles | WO | 116 | 446 | 0.19 | -1.35 | 6 | 4.577 | Dağhan and Demirhan, 2020 |
| Iskenderun Bay | Pterois miles | WO | 75 | 476 | 0.15 | -2.05 | 7 | 4.531 | Yilmaz and Demirhan, 2020 1 |
| Rhodes | Pterois miles | LFA | 363 | 454 | 0.19 | -1.55 | 5 | 4.586 | Kondylatos et al., 2024 |
| Crete | Pterois miles | SS | 271 | 484 | 0.17 | -2.63 | 5 | 4.600 | Present study |
| Ionian Sea | Pterois miles | SS | 312 | 417 | 0.19 | -3.05 | 5 | 4.519 | Present study |
Pterois miles, P. volitans or P. miles/volitans complex growth data from the Pacific Ocean, West Atlantic, Caribbean Sea, Gulf of Mexico and eastern Mediterranean Sea.
L∞, asymptotic total length (mm); K, growth coefficient (year-1); t0, theoretical age at length zero; tmax, maximum recorded age; and φ΄, growth performance index; LBM, length-based model; LFA, length frequency analysis; WO, whole otoliths; OS, otolith sections; SS, spine sections; T, Tagging.
1The authors claim that, in their study, they analyzed samples of both P. volitans and P. miles. However, based on the work of Çinar et al. (2021) all records of P. volitans in the Mediterranean are misidentifications of P. miles.
Figure 10
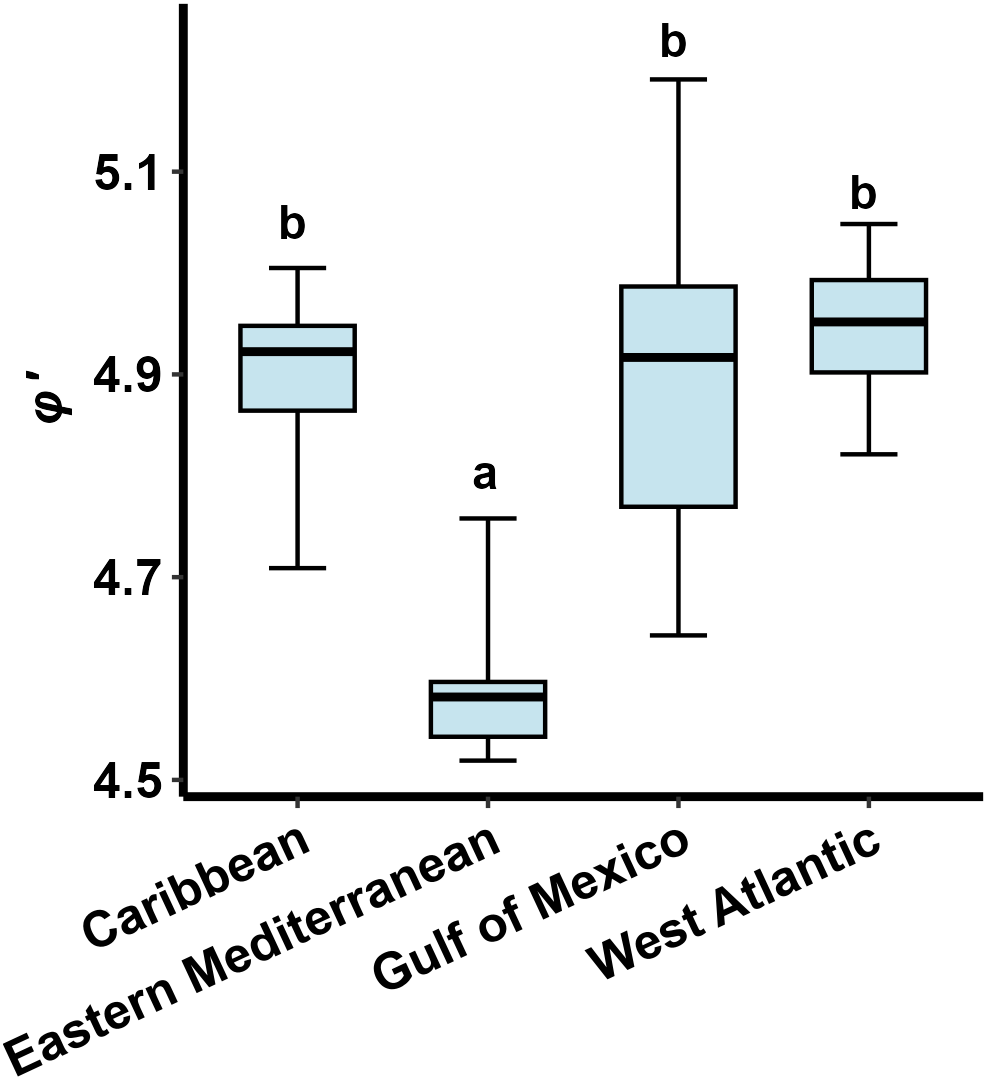
Boxplots of growth performance index (φ’) for lionfish within each invaded region. The lower and upper edges of each box represent the 25th and 75th percentiles, respectively. The horizontal line within each box represents the median. Whiskers represent the full range of values. a< b: homogenous groups (Bonferroni test).
4 Discussion
To our knowledge, this is the first study to determine lionfish age through the analysis of dorsal spine sections. The review of existing literature showed that reading sagittal otolith sections has been the most widely used method for determining the age of lionfish, especially in the Atlantic Ocean (see Table 5). As whole otoliths are highly opaque and their macrostructure is generally unclear, sectioning improves ageing precision (Potts et al., 2010). Still, the small size and fragility of lionfish otoliths makes the preparation of sections difficult and laborious. Moreover, a significant percentage of sections is often unreadable (e.g., 24% in Dahl et al. (2019)) and additional post-sectioning processing, such as polishing, is often required to improve interpretability (Savva et al., 2020).
Here, we demonstrate that reading dorsal spine sections could serve as a more practical approach for age determination in lionfish. The calculated CV and APE values were below the thresholds commonly reported as acceptable levels (Campana, 2001: CV< 7.6% and APE< 5.5%), indicating that ageing P. miles by means of dorsal spine sections is precise and reproducible. The advantages of this method stem from the easier and less costly acquisition of spines, as well as their faster processing. These benefits have been highlighted in other studies that used fin spines to age commercial species, such as swordfish and tunas (e.g., Tserpes and Tsimenides, 1995; Lessa and Duarte-Neto, 2004). The acquisition of P. miles samples from commercial fisheries in order to process the fish in the laboratory and extract the otoliths has become more difficult in recent years, due to the increasing commercialization of the species. P. miles now comprises an important bycatch of static nets in the eastern Mediterranean and is being sold in local markets providing important additional income for small-scale fishers (e.g., in Crete and Dodecanese islands lionfish price range from 8 to 16 € per kg [Kondylatos et al., 2023; unpublished data]). Before being sold, the venomous fin spines are removed and discarded, hence scientist can arrange to collect large samples of spines for ageing purposes at no cost.
The present study is the first to investigate the periodicity of annuli deposition on P. miles hard structures. The analysis of spine distal edge type (hyaline/opaque) and marginal increment ratio provide strong evidence that a single pair of opaque and hyaline zones is formed per year, with the hyaline zone primarily formed during winter and spring (December-June) and the opaque zone, during summer and autumn (July-November). The annual deposition of annuli has also been documented in the otoliths of P. volitans in the Gulf of Mexico and Pterois spp. in the Caribbean Sea, as well as in other scorpaenids in the Mediterranean Sea. More specifically, similar results were found for the black scorpionfish Scorpaena porcus Linnaeus, 1758 in the Adriatic Sea, in which the opaque band in the otoliths was deposited mainly from June to September (> 50% of otoliths with opaque edge), while the hyaline band was laid down from October to May (La Mesa et al., 2010). Additionally, the study of Edwards et al. (2014) in the Caribbean Sea, also showed that opaque band formation in the majority of Pterois otoliths was completed during the period August−December. On the other hand, in the Gulf of Mexico, more than 50% of P. volitans otoliths had opaque margins in the period March−July (Fogg et al., 2019; Dahl et al., 2019). The differences in the timing of zone formation between the Gulf of Mexico and the Mediterranean Sea may be attributed to different temperature regimes.
The criteria for assigning a hyaline band as a ‘true’ annulus were that the band was clear, relatively wide, ‘regularly’ spaced in relation to previous and subsequent annuli, and continuous around the entire circumference of the spine ridge. In the majority of our samples, a first check satisfying these criteria was also observed before the first assigned annulus which was located at a relatively long distance from the spine center. This check could be interpreted as being associated with settlement (Carbonara and Follesa, 2019) but such interpretation would imply that lionfish larvae have relatively wide spines at settlement (mean radius= 0.458 mm), an aspect which has not been investigated by any study. Available information suggests that body sizes at settlement are much smaller than those corresponding to the first check of the examined fish. Specifically, the completion of the pelagic larval phase and settlement of P. volitans occur at approximately 25 mm (Biggs and Olden, 2011), after a mean planktonic period of 26 days (Ahrenholz and Morris, 2010). In contrast, the mean back-calculated length at first check formation was 118 mm, suggesting that this check is unlikely to represent a settlement mark. Instead, it may reflect an early post-settlement ecological transition, such as a habitat shift. Supporting evidence for such transitions have been reported in the Atlantic, where the mean size of P. volitans in reef habitats was 115–119 mm, while smaller individuals (90 mm) occupied sea grass habitats (Biggs and Olden, 2011).
Both in Crete and the Ionian Sea the maximum age of P. miles was five years, corresponding to birth/settlement years between 2016 and 2021. This finding aligns with the first records of the species in 2015 and 2016 in Crete and the Ionian Sea, respectively (Dailianis et al., 2016; Dimitriadis et al., 2020). Previous studies in Greek waters have reported maximum ages of four years in the Messenian Gulf and five years around the island of Rhodes (Kondylatos et al., 2023; Koilakos et al., 2024), while in the Mediterranean Sea the oldest recorded P. miles was seven years old caught in the southeast coasts of Turkey (Yilmaz and Demirhan, 2020). Given these findings, along with evidence that lionfish can reach up to ten years in the wild (Blakeway et al., 2022), it is expected that older and therefore larger individuals will be documented in the Mediterranean in the future. However, since studies in the Atlantic have shown that lionfish migrate to deeper waters as they age (Andradi-Brown, 2019 and references therein), future research should include samples from a broader depth range in order to capture all age classes and investigate potential age-related bathymetric distribution patterns.
In our study, the length-on-spine radius relationship showed a significant change in slope indicating that beyond the estimated inflection point fish growth was slower in relation to spine growth. In general, body-hard structure size relationships in fish are expected to shift when fish undergo changes in body morphology during stage transitions (Bailey et al., 2022). However, in age and growth studies, hard structure-based back-calculations rarely account for ontogenetic shifts in the body-hard structure relationship. Živkov (1996) suggested that separate length-scale relationships should be fitted to different life stages in order to apply length back-calculations. Furthermore, studies in other fish species have shown that inflection points in the relationships between morphometric characters reflect ontogenetic shifts related to metamorphosis (Nikolioudakis et al., 2010, 2014) or first maturation (Nikolioudakis et al., 2011). In their study on P. volitans, Rojas-Vélez et al. (2024) showed that some morphometric features, associated with locomotion and prey capture, significantly correlated with fish size and changed from the juvenile to the adult stage. The change in slope of the length-on-spine radius relationship observed in this study may also be related to the onset of sexual maturity. Indeed, the fish length which corresponds to spine radius of 0.7 mm is 212 mm which matches well with a previously estimated length at maturity of P. miles in the Greek Seas (224 mm; Kondylatos et al., 2024).
On average, lionfish growth performance (φ’ index) was significantly lower in the Mediterranean Sea whereas no significant differences were found between the Atlantic subregions (Figure 10). Given that φ’ is a species- or stock-specific index (Munro and Pauly, 1983), the difference between the Atlantic and the Mediterranean may be attributed to lower growth performance of P. miles compared to P. volitans. Indeed, regarding the Atlantic regions, only P. volitans has been established in the Gulf of Mexico (Fogg et al., 2019), whereas in the western Atlantic and Caribbean both species coexist and, because of difficulties in identifying them morphologically, several age and growth studies (see Table 5) use the term ‘complex’ to indicate that both species may have been included in their sample. However, P. volitans is by far the most abundant species in the Atlantic (Wilcox et al., 2018). Due to limited data from the lionfish native range (Indo-Pacific and Red Sea), a statistical comparison of growth performance between invasive and native lionfish populations was not feasible here. However, the φ’ value calculated for P. volitans in the Pacific (Pusack et al., 2016) was similar to the mean value of the Atlantic regions (Pacific Ocean: φ’ = 4.914; Atlantic Ocean: φ’ = 4.909). On the other hand, lionfish in the Mediterranean are exclusively P. miles, while previous records of P. volitans in the basin (Yilmaz and Demirhan, 2020) have proved to be misidentifications of P. miles (Çinar et al., 2021). Additionally, temperature could also contribute to the variations observed in growth performance and in turn affect survival and invasion success at the subregional level. In particular, the generally lower temperatures recorded in the Mediterranean compared to most invaded tropical Atlantic regions (Chollett et al., 2012; Pastor et al., 2018) may partially explain the lower growth performance of the Mediterranean P. miles. Most importantly, minimum winter temperatures lower than 15.3 °C have been recognized as a natural barrier limiting P. miles expansion in the Mediterranean (Dimitriadis et al., 2020). Low winter temperatures are likely the main reason explaining the still scarce sightings of P. miles in the northern Aegean Sea and the Adriatic Sea (Bottacini et al., 2024). They may also act as a mechanism reducing population size by inducing growth-dependent overwinter mortality (see below), ultimately slowing the northward and westward expansion of the species in the Mediterranean.
A prominent characteristic of the lionfish is the high variability in growth at the individual level (e.g., see range of and overlap between lengths-at-age in Figure 8). High variability in individual growth is also shown in the Atlantic (e.g., see Dahl et al., 2019; Eddy et al., 2019; Fogg et al., 2019) and could be partly attributed to inherent variation in the metabolic phenotype (e.g., standard metabolic rate, maximum metabolic rate, aerobic scope) (Metcalfe et al., 2016). Individual lionfish vary largely in metabolic phenotype, with a 1.5-fold variation in standard metabolic rate and a 2-fold variation in the scope of activity (Steell et al., 2019). Furthermore, lionfish has an extended spawning season (e.g., Morris et al., 2011; Savva et al., 2020) which can largely increase variation in size at first annulus formation depending on when the fish was born along the spawning period and the seasonal changes in temperature and food availability.
In general, the estimated von Bertalanffy growth functions (VBGFs) differed significantly between Crete and the Ionian Sea. Additionally, mean lengths-at-age were significantly higher in Crete. Regional differences in average growth can be attributed to various factors, such as environmental conditions, invasion chronology, differences in population density, prey availability, and could even be attributed to sampling methodologies (Dahl et al., 2019). In our sampling areas (lower panel in Figure 1) water temperature was significantly higher in Crete compared to the Ionian Sea especially during spring and summer (Figure 9). Higher temperatures could therefore explain the overall higher growth of P. miles in Crete. Temperature is a major extrinsic factor controlling fish growth and, within an appropriate temperature window, higher temperature results in faster growth (Chen et al., 2022).
In alignment with previous studies in the Atlantic (Edwards et al., 2014; Eddy et al., 2019; Dahl et al., 2019; Fogg et al., 2019), P. miles also exhibits sexual dimorphic growth in the Mediterranean, with males attaining higher mean lengths-at-age compared to females (Supplementary Figures 2B, E, H, K). Sex-related differences in average size increase with age. Considering VBGFs for pooled area data (Table 4), males had higher asymptotic total length (L∞) and lower growth coefficient (K) compared to females, as also reported in the Atlantic (Edwards et al., 2014; Eddy et al., 2019; Dahl et al., 2019; Fogg et al., 2019; Blakeway et al., 2022). In general, sexual dimorphism in growth rate and size is common among scorpaenid species, with either males or females growing faster and larger (e.g., Kelly et al., 1999; La Mesa et al., 2005; Kutsyn et al., 2019; Pavlov and Emel’yanova, 2019). Such dimorphism may be partially explained in terms of bioenergetics, particularly, sex-related differences in energy acquisition and/or allocation (Roff, 1983; Henderson et al., 2003; Rennie et al., 2008). In the case of lionfish, females may channel less energy to somatic growth due to the higher energy cost of egg production. Finally, larger size may provide advantages to males during agonistic interactions that have been observed in the field (Fishelson, 1975; Fogg and Faletti, 2018).
The ANOVA models showed that mean back-calculated length at annulus formation (e.g., length at age 2) increases with increasing age (Figure 7). For example, 4-years-old P. miles was on average larger at age-2 than a 3-year-old fish. This increasing trend in back-calculated lengths suggests that, at a given age, larger fish (i.e., those with higher somatic growth rate) may have a higher chance of survival compared to smaller individuals (i.e., those with lower growth rate). In fish, growth-dependent mortality (the ‘faster is better’ hypothesis (Anderson, 1988)) is well-documented at the larval and juvenile stages (Sogard, 1997; Somarakis et al., 2019). On the other hand, in exploited adult populations, an inverse phenomenon (‘Rosa Lee phenomenon’) is usually observed in which size-selective fishing removes fast growing specimens at a higher rate than slow growing fish and back-calculated lengths of old fish are smaller than the mean lengths actually observed in the population (Ricker, 1969). In young fish, the ‘faster is better’ pattern is often attributed to predation, however predation pressure on adult lionfish is likely very low (Côté et al., 2013; Ulman et al., 2021). Alternatively, higher mortality of slow growing P. miles may be linked to size-related bioenergetic constrains. According to the Copernicus data (Figure 9), the mean monthly minimum temperatures in the study areas (February−March) ranged from 16.2 °C to 16.8 °C which is close to the mean temperature starvation threshold (16.1 °C) calculated by Kimball et al. (2004). The experimental work of Cerino et al. (2013) demonstrated that Pterois consumption and energy budgets are affected by temperature and, as in other fishes, there is a dome-shaped relationship between consumption rate and temperature with consumption rate initially increasing rapidly to reach a maximum at about 30 °C. Lionfish resting metabolic rate (g O2 g-1 wet weight day-1) scales negatively while energy density (KJ g-1 wet weight) scales positively with fish mass. Therefore, in the cooler (winter) temperatures of the invaded Mediterranean Sea, the P. miles seems to experience an energetic stress which is inversely related to fish size and could partially explain the ‘faster is better’ phenomenon observed in this study. In conjunction with the sexual dimorphic growth such a mechanism (higher mortality of the slower growing females) could also explain the reduction of the portion of females with size and age (Figure 4). Although the ANOVA models applied to the back-calculated lengths-at-age support the ‘faster is better’ (or ‘inverse Rosa Lee’) phenomenon, such hypothesis needs to be further tested and validated.
5 Conclusions
To our knowledge, this is the first time that dorsal spines are being used to study the age and growth of a lionfish species. The monthly evolution of spine’s edge type and marginal increment analysis confirmed that a single pair of opaque and hyaline zones is formed annually. Although individual variability in growth is high, mean lengths-at-age of males were higher than females (sexual dimorphic growth) and higher in Crete than in the Ionian Sea (regionally varying growth). In the Mediterranean Sea, P. miles has lower overall growth performance compared to the Atlantic populations, which could be explained by regional variations in temperature and/or species composition, given that P. volitans predominates in the Atlantic, whereas P. miles is the sole Pterois species in the Mediterranean. Finally, mean back-calculated length at each annulus formation increases with age, suggesting a probable growth dependent mortality in the recently invaded Mediterranean Sea. Given the potential full-scale commercialization of lionfish in the future, the use of dorsal spines is proposed as a more cost-effective approach to monitor lionfish growth compared to otolith-based ageing.
Statements
Data availability statement
The raw data supporting the conclusions of this article will be made available by the authors, without undue reservation.
Ethics statement
Ethical approval was not required for the study involving animals in accordance with the local legislation and institutional requirements because the majority of fish were obtained from commercial fisheries, where fish had already been caught for consumption, without additional experimental handling.
Author contributions
GC: Investigation, Writing – original draft, Visualization, Software, Formal analysis, Data curation, Writing – review & editing, Methodology. PP: Conceptualization, Writing – review & editing, Investigation. ET: Investigation, Writing – review & editing, Data curation. GT: Resources, Funding acquisition, Writing – review & editing, Investigation. AG: Data curation, Methodology, Writing – review & editing. MM: Data curation, Methodology, Writing – review & editing. AT: Data curation, Methodology, Writing – review & editing. SS: Methodology, Formal analysis, Supervision, Writing – review & editing, Investigation.
Funding
The author(s) declared that financial support was received for this work and/or its publication. This research is part of the LIONHARE project (https://lionhare.hcmr.gr/, accessed on October 8, 2025) funded by the Fisheries and Maritime Operational Program 2014–2020 of the Greek Ministry of Agricultural Development and Food and the European Maritime and Fisheries Fund.
Acknowledgments
The authors would like to thank all the colleagues and fishers who collaborated in the specimens’ collection and the laboratory work, and especially the colleagues Ioannis Kosoglou, Kyriakos Tampakakis and George Lazarakis. The authors also acknowledge the Copernicus Marine Environment Monitoring Service (CMEMS) for providing the “med-cmcc-tem-rean-m” dataset used in this study. This dataset is part of the “Mediterranean Sea Physics Reanalysis” product, which provides a comprehensive reanalysis of physical parameters in the Mediterranean Sea.
Conflict of interest
The authors declared that this work was conducted in the absence of any commercial or financial relationships that could be construed as a potential conflict of interest.
The author SS declared that they were an editorial board member of Frontiers, at the time of submission. This had no impact on the peer review process and the final decision.
Generative AI statement
The author(s) declared that Generative AI was not used in the creation of this manuscript.
Any alternative text (alt text) provided alongside figures in this article has been generated by Frontiers with the support of artificial intelligence and reasonable efforts have been made to ensure accuracy, including review by the authors wherever possible. If you identify any issues, please contact us.
Publisher’s note
All claims expressed in this article are solely those of the authors and do not necessarily represent those of their affiliated organizations, or those of the publisher, the editors and the reviewers. Any product that may be evaluated in this article, or claim that may be made by its manufacturer, is not guaranteed or endorsed by the publisher.
Supplementary material
The Supplementary Material for this article can be found online at: https://www.frontiersin.org/articles/10.3389/fmars.2026.1699123/full#supplementary-material
References
1
Ahrenholz D. W. Morris J. A. Jr (2010). Larval duration of the lionfish, Pterois volitans along the Bahamian Archipelago. Environ. Biol. Fishes.88, 305–309. doi: 10.1007/s10641-010-9647-4
2
Akaike H. (1973). “ Information theory and an extension of the maximum likelihood principle,” in Proceedings of the Second International Symposium on Information Theory. ( Budapest), 267–281.
3
Akins J. L. Morris J. A. Jr. Green S. J. (2014). In situ tagging technique for fishes provides insight into growth and movement of invasive lionfish. Ecol. Evol.4, 3768–3777. doi: 10.1002/ece3.1171
4
Albins M. A. Hixon M. A. (2008). Invasive Indo-Pacific lionfish Pterois volitans reduce recruitment of Atlantic coral-reef fishes. Mar. Ecol. Prog. Ser.367, 233–238. doi: 10.3354/meps07620
5
Anderson J. T. (1988). A review of size dependent survival during pre-recruit stages of fishes in relation to recruitment. J. Northw. Atl. Fish. Sci.8, 55–66.
6
Andradi-Brown D. A. (2019). “ Invasive lionfish (Pterois volitans and P. miles): distribution, impact, and management,” in Mesophotic coral ecosystems, coral reefs of the world 12. Eds. LoyaY.PugliseK. A.BridgeT. C. L. ( Springer Nature, Switzerland AG), 931–941. doi: 10.1007/978-3-319-92735-0_48
7
Arias-González J. E. González-Gándara C. Cabrera J. L. Christensen V. (2011). Predicted impact of the invasive lionfish Pterois volitans on the food web of a Caribbean coral reef. Environ. Res.111, 917–925. doi: 10.1016/j.envres.2011.07.008
8
Bailey C. J. Wilson K. L. More O’Ferrall M. Moore J. W. (2022). Fish length back-calculation from scales: advancing methodology and correction of bias. Can. J. Fish. Aquat. Sci.79, 1780–1797. doi: 10.1139/cjfas-2021-0270
9
Barbour A. B. Allen M. S. Frazer T. K. Sherman K. D. (2011). Evaluating the potential efficacy of invasive lionfish (Pterois volitans) removals. PLoS One.6, e19666. doi: 10.1371/annotation/01ecd7b0-1be0-4e2f-87c7-079d5f1a1c32
10
Bax N. Williamson A. Aguero M. Gonzalez E. Geeves W. (2003). Marine invasive alien species: a threat to global biodiversity. Mar. Policy.27, 313–323. doi: 10.1016/S0308-597X(03)00041-1
11
Beamish R. J. Fournier D. A. (1981). A method for comparing the precision of a set of age determinations. Can. J. Fish. Aquat. Sci.38, 982–983. doi: 10.1139/f81-132
12
Bedford B. C. (1983). A method for preparing sections of large numbers of otoliths embedded in black polyester resin. J. Cons. Int. Explor. Mer.41, 4–12. doi: 10.1093/icesjms/41.1.4
13
Biggs C. R. Olden J. D. (2011). Multi-scale habitat occupancy of invasive lionfish (Pterois volitans) in coral reef environments of Roatan, Honduras. Aquat. Invasions.6, 447–453. doi: 10.3391/ai.2011.6.3.11
14
Blakeway R. D. Fogg A. Q. Johnston M. A. Rooker J. R. Jones G. A. (2022). Key life history attributes and removal efforts of invasive lionfish (Pterois volitans) in the flower garden banks national marine sanctuary, northwestern Gulf of Mexico. Front. Mar. Sci.9, 774407. doi: 10.3389/fmars.2022.774407
15
Bogdanoff A. K. Shertzer K. W. Layman C. A. Chapman J. K. Fruitema M. L. Solomon J. et al . (2021). Optimum lionfish yield: a non-traditional management concept for invasive lionfish (Pterois spp.) fisheries. Biol. Invasions.23, 795–810. doi: 10.1007/s10530-020-02398-z
16
Boonstra W. J. Ottosen K. M. Ferreira A. S. A. Richter A. Rogers L. A. Pedersen M. W. et al . (2015). What are the major global threats and impacts in marine environments? Investigating the contours of a shared perception among marine scientists from the bottom-up. Mar. Policy.60, 197–201. doi: 10.1016/j.marpol.2015.06.007
17
Bottacini D. Pollux B. J. Nijland R. Jansen P. A. Naguib M. Kotrschal A. (2024). Lionfish (Pterois miles) in the Mediterranean Sea: a review of the available knowledge with an update on the invasion front. NeoBiota.92, 233–257. doi: 10.3897/neobiota.92.110442
18
Burnham K. P. Anderson D. R. (2002). Model selection and multimodel inference: a practical information-theoretic approach (New York: Springer).
19
Bustos-Montes D. Wolff M. Sanjuan-Muñoz A. Acero A. (2020). Growth parameters of the invasive lionfish (Pterois volitans) in the Colombian Caribbean. Reg. Stud. Mar. Sci.38, 101362. doi: 10.1016/j.rsma.2020.101362
20
Campana S. E. (1990). How reliable are growth back-calculations based on otoliths? Can. J. Fish. Aquat. Sci.47, 2219–2227. doi: 10.1139/f90-246
21
Campana S. E. (2001). Accuracy, precision and quality control in age determination, including a review of the use and abuse of age validation methods. J. Fish Biol.59, 197–242. doi: 10.1006/jfbi.2001.166
22
Campana S. E. Annand M. C. McMillan J. I. (1995). Graphical and statistical methods for determining the consistency of age determinations. Trans. Am. Fish. Soc.124, 131–138. doi: 10.1577/1548-8659(1995)124<0131:GASMFD>2.3.CO;2
23
Carbonara P. Follesa M. C. (2019). Handbook on fish age determination: a Mediterranean experience (Rome: FAO).
24
Carroll J. L. Ellis R. D. Collins A. B. Murie D. J. (2023). Dorsal fin spines and rays for nonlethal ageing of Goliath Grouper Epinephelus itajara. Fishes.8, 239. doi: 10.3390/fishes8050239
25
Casselman J. M. (1983). Age and growth assessment of fish from their calcified structures—techniques and tools. NOAA Tech. Rep. NMFS.8, 1–17.
26
Cerino D. Overton A. S. Rice J. A. Morris J. A. Jr. (2013). Bioenergetics and trophic impacts of the invasive Indo-Pacific lionfish. Trans. Am. Fish. Soc.142, 1522–1534. doi: 10.1080/00028487.2013.811098
27
Chang W. Y. (1982). A statistical method for evaluating the reproducibility of age determination. Can. J. Fish. Aquat. Sci.39, 1208–1210. doi: 10.1139/f82-158
28
Chen X. Liu B. Fang Z. (2022). “ Age and growth of fish. Chapter 4,” in Biology of Fishery Resources. Eds. ChenX.LiuB. ( Springer, Singapore). doi: 10.1007/978-981-16-6948-4_4
29
Chollett I. Müller-Karger F. E. Heron S. F. Skirving W. Mumby P. J. (2012). Seasonal and spatial heterogeneity of recent sea surface temperature trends in the Caribbean Sea and southeast Gulf of Mexico. Mar. pollut. Bull.64, 956–965. doi: 10.1016/j.marpolbul.2012.02.016
30
Çinar M. E. Bilecenoğlu M. Yokeş M. B. Öztürk B. Taşkin E. Bakir K. et al . (2021). Current status (as of end of 2020) of marine alien species in Turkey. PLoS One.16, e0251086. doi: 10.1371/journal.pone.0251086
31
Côté I. M. Green S. J. Hixon M. A. (2013). Predatory fish invaders: Insights from Indo-Pacific lionfish in the western Atlantic and Caribbean. Biol. Conserv.164, 50–61. doi: 10.1016/j.biocon.2013.04.014
32
Dağhan H. Demirhan S. A. (2020). Some bio-ecological characteristics of lionfish Pterois miles (Bennett 1828) in Iskenderun Bay. Mar. Life Sci.2, 28–40.
33
Dahl K. A. Edwards M. A. Patterson W. F. III (2019). Density-dependent condition and growth of invasive lionfish in the northern Gulf of Mexico. Mar. Ecol. Prog. Ser.623, 145–159. doi: 10.3354/meps13028
34
Dailianis T. Akyol O. Babali N. Bariche M. Crocetta F. Gerovasileiou V. (2016). New mediterranean biodiversity records (July 2016). Mediterr. Mar. Sci.17, 608–626. doi: 10.12681/mms.1734
35
Dimitriadis C. Galanidi M. Zenetos A. Corsini-Foka M. Giovos I. Karachle P. K. et al . (2020). Updating the occurrences of Pterois miles in the Mediterranean Sea, with considerations on thermal boundaries and future range expansion. Mediterr. Mar. Sci.21, 62–69. doi: 10.12681/mms.21845
36
Eddy C. Pitt J. Oliveira K. Morris J. A. Potts J. Bernal D. (2019). The life history characteristics of invasive lionfish (Pterois volitans and P. miles) in Bermuda. Environ. Biol. Fishes.102, 887–900. doi: 10.1007/s10641-019-00877-4
37
Edwards M. A. Frazer T. K. Jacoby C. A. (2014). Age and growth of invasive lionfish (Pterois spp.) in the Caribbean Sea, with implications for management. Bull. Mar. Sci.90, 953–966. doi: 10.5343/bms.2014.1022
38
Escudier R. Clementi E. Omar M. Cipollone A. Pistoia J. Aydogdu A. et al . (2020). Mediterranean Sea Physical Reanalysis (CMEMS MED-Currents) (Version 1) ( Copernicus Monitoring Environment Marine Service (CMEMS). doi: 10.25423/CMCC/MEDSEA_MULTIYEAR_PHY_006_004_E3R1
39
Fishelson L. (1975). Ethology and reproduction of pteroid fishes found in the Gulf of Aqaba (Red Sea), especially Dendrochirus brachypterus (Cuvier) (Pteroidae: Teleostei). Pubbl. Stn. Zool. Napoli.39, 635–656.
40
Fogg A. Q. Evans J. T. Peterson M. S. Brown-Peterson N. Hoffmayer E. R. Ingram G. W. Jr. (2019). Comparison of age and growth parameters of invasive red lionfish (Pterois volitans) across the northern Gulf of Mexico. Fish. Bull.117, 1. doi: 10.7755/FB.117.3.1
41
Fogg A. Q. Faletti M. E. (2018). Invasive lionfish (Pterois sp.) agonistic behavior observations. Bull. Mar. Sci.94, 1–2. doi: 10.5343/bms.2017.1129
42
Francis R. I. C. C. (1990). Back-calculation of fish length: a critical review. J. Fish Biol.36, 883–902. doi: 10.1111/j.1095-8649.1990.tb05636.x
43
Galanidi M. Zenetos A. Bacher S. (2018). Assessing the socio-economic impacts of priority marine invasive fishes in the Mediterranean with the newly proposed SEICAT methodology. Mediterr. Mar. Sci.19, 107–123. doi: 10.12681/mms.15940
44
Green S. J. Akins J. L. Maljković A. Côté I. M. (2012a). Invasive lionfish drive Atlantic coral reef fish declines. PLoS One.7, e32596. doi: 10.1371/journal.pone.0032596
45
Green S. J. Akins J. L. Morris J. A. Jr. (2012b). Lionfish dissection: Techniques and applications. NOAA Technical Memorandum NOS NCCOS (Beaufort, NC: NOAA’s National Centers for Coastal Ocean Science).
46
Halstead B. W. Chitwood M. J. Modglin F. R. (1955). The anatomy of the venom apparatus of the zebrafish, Pterois volitans (Linnaeus). Anat. Rec.122, 317–333. doi: 10.1002/ar.1091220304
47
Henderson B. A. Collins N. Morgan G. E. Vaillancourt A. (2003). Sexual size dimorphism of walleye (Stizostedion vitreum vitreum). Can. J. Fish. Aquat. Sci.60, 1345–1352. doi: 10.1139/F03-115
48
Hurvich C. M. Tsai C. L. (1989). Regression and time series model selection in small samples. Biometrika.76, 297–307. doi: 10.1093/biomet/76.2.297
49
Johnson E. G. Swenarton M. K. (2016). Age, growth and population structure of invasive lionfish (Pterois volitans/miles) in northeast Florida using a length-based, age-structured population model. PeerJ.4, e2730. doi: 10.7717/peerj.2730
50
Johnston M. W. Purkis S. J. Dodge R. E. (2015). Measuring Bahamian lionfish impacts to marine ecological services using habitat equivalency analysis. Mar. Biol.162, 2501–2512. doi: 10.1007/s00227-015-2745-2
51
Jud Z. R. Layman C. A. (2012). Site fidelity and movement patterns of invasive lionfish, Pterois spp., in a Florida estuary. J. Exp. Mar. Biol. Ecol.414, 69–74. doi: 10.1016/j.jembe.2012.01.015
52
Kelly C. J. Connolly P. L. Bracken J. J. (1999). Age estimation, growth, maturity, and distribution of the bluemouth rockfish Helicolenus d. dactylopterus (Delaroche 1809) from the Rockall Trough. ICES J. Mar. Sci.56, 61–74. doi: 10.1006/jmsc.1998.0426
53
Khan S. Khan M. A. Miyan K. Lone F. A. (2015). Precision of age estimates from different ageing structures in selected freshwater teleosts. J. Environ. Biol.36, 507–512.
54
Kimball M. E. Miller J. M. Whitfield P. E. Hare J. A. (2004). Thermal tolerance and potential distribution of invasive lionfish (Pterois volitans/miles complex) on the east coast of the United States. Mar. Ecol. Prog. Ser.283, 269–278. doi: 10.3354/meps283269
55
Koilakos S. M. Georgatis I. Leonardos I. (2024). Feeding strategies and biological traits of the lessepsian migrant Pterois miles (Bennett 1828) in the Messenian gulf, SW Greece. Fishes.9, 380. doi: 10.3390/fishes9100380
56
Kondylatos G. Theocharis A. Mandalakis M. Avgoustinaki M. Karagyaurova T. Koulocheri Z. (2024). The devil firefish Pterois miles (Bennett 1828): life history traits of a potential fishing resource in Rhodes (Eastern Mediterranean). Hydrobiology.3, 31–50. doi: 10.3390/hydrobiology3010003
57
Kondylatos G. Vagenas G. Kalaentzis K. Mavrouleas D. Conides A. Karachle P. K. et al . (2023). Exploring the structure of static net fisheries in a highly invaded region: the case of Rhodes island (Eastern Mediterranean). Sustainability.15, 14976. doi: 10.3390/su152014976
58
Kulbicki M. Beets J. Chabanet P. Cure K. Darling E. Floeter S. R. (2012). Distributions of Indo-Pacific lionfishes Pterois spp. in their native ranges: implications for the Atlantic invasion. Mar. Ecol. Prog. Ser.446, 189–205. doi: 10.3354/meps09442
59
Kutsyn D. N. Skuratovskaya E. N. Chesnokova I. I. (2019). Body size, age structure, growth, and maturation of black scorpionfish Scorpaena porcus (Scorpaenidae) from southwestern Crimea (Black Sea). J. Ichthyol.59, 864–869. doi: 10.1134/S0032945219060067
60
La Mesa M. La Mesa G. Micalizzi M. (2005). Age and growth of madeira scorpionfish, Scorpaena maderensis Valenciennes 1833, in the central Mediterranean. Fish. Res.74, 265–272. doi: 10.1016/j.fishres.2005.01.018
61
La Mesa M. Scarcella G. Grati F. Fabi G. (2010). Age and growth of the black scorpionfish, Scorpaena porcus (Pisces: Scorpaenidae) from artificial structures and natural reefs in the Adriatic Sea. Sci. Mar.74, 677–685. doi: 10.3989/scimar.2010.74n4677
62
Lessa R. Duarte-Neto P. (2004). Age and growth of yellowfin tuna (Thunnus albacares) in the western equatorial Atlantic, using dorsal fin spines. Fish. Res.69, 157–170. doi: 10.1016/j.fishres.2004.05.007
63
Metcalf S. J. Swearer S. E. (2005). Non-destructive ageing in Notolabrus tetricus using dorsal spines with an emphasis on the benefits for protected, endangered and fished species. J. Fish Biol.66, 1740–1747. doi: 10.1111/j.0022-1112.2005.00704.x
64
Metcalfe N. B. Van Leeuwen T. E. Killen S. S. (2016). Does individual variation in metabolic phenotype predict fish behaviour and performance? J. Fish Biol.88, 298–321. doi: 10.1111/jfb.12699
65
Morales-Nin B. Tores G. J. Lombarte A. Recasens L. (1998). Otolith growth and age estimation in the European hake. J. Fish Biol.53, 1155–1168. doi: 10.1111/j.1095-8649.1998.tb00239.x
66
Morris J. A. (2012). Invasive lionfish: a guide to control and management (Marathon: Gulf and Caribbean Fisheries Institute Special Publication Series Number 1).
67
Morris J. A. Sullivan C. V. Govoni J. J. (2011). Oogenesis and spawn formation in the invasive lionfish, Pterois miles and Pterois volitans. Sci. Mar.75, 147–154. doi: 10.3989/scimar.2011.75n1147
68
Muir A. M. Ebener M. P. He J. X. Johnson J. E. (2008). A comparison of the scale and otolith methods of age estimation for lake whitefish in Lake Huron. N. Am. J. Fish. Manage.28, 625–635. doi: 10.1577/M06-160.1
69
Munro J. L. Pauly D. (1983). A simple method for comparing the growth of fishes and invertebrates. Fishbyte.1, 5–6.
70
Nikolioudakis N. Koumoundouros G. Kiparissis S. Somarakis S. (2010). Defining length-at-metamorphosis in fishes: a multi-character approach. Mar. Biol.157, 991–1001. doi: 10.1007/s00227-009-1379-7
71
Nikolioudakis N. Koumoundouros G. Somarakis S. (2014). Synchronization in allometric and morphological changes during metamorphosis: comparison among four sparid species. Aquat. Biol.21, 155–165. doi: 10.3354/ab00579
72
Nikolioudakis N. Palomera I. Machias A. Somarakis S. (2011). Diel feeding intensity and daily ration of the sardine Sardina pilchardus. Mar. Ecol. Prog. Ser.437, 215–228. doi: 10.3354/meps09275
73
Ogle D. H. (2016). Introductory Fisheries Analyses with R (Boca Raton: CRC Press).
74
Pastor F. Valiente J. A. Palau J. L. (2018). Sea surface temperature in the Mediterranean: trends and spatial patterns, (1982–2016). Pure Appl. Geophys.175, 4017–4029. doi: 10.1007/s00024-017-1739-z
75
Pauly D. Munro J. L. (1984). Once more on growth comparisons in fish and invertebrates. Fishbyte2, 21.
76
Pavlov D. A. Emel’yanova N. G. (2019). Biological characteristics of Dendrochirus zebra (Cuvier 1829) (Scorpaeniformes: Scorpaenidae) from Nha Trang Bay, South China Sea. Russ. J. Mar. Biol.45, 75–85. doi: 10.1134/S106307401902010X
77
Pilling G. M. Kirkwood G. P. Walker S. G. (2002). An improved method for estimating individual growth variability in fish, and the correlation between von Bertalanffy growth parameters. Can. J. Fish. Aquat. Sci.59, 424–432. doi: 10.1139/f02-022
78
Potts J. C. Berrane D. Morris J. A. Jr. (2010). Age and growth of lionfish from the Western North Atlantic. Proc. 63rd Gulf Caribbean Fisheries Institute.63, 314.
79
Pusack T. J. Benkwitt C. E. Cure K. Kindinger T. L. (2016). Invasive Red Lionfish (Pterois volitans) grow faster in the Atlantic Ocean than in their native Pacific range. Environ. Biol. Fishes.99, 571–579. doi: 10.1007/s10641-016-0499-4
80
Rennie M. D. Purchase C. F. Lester N. Collins N. C. Shuter B. J. Abrams P. A. (2008). Lazy males? Bioenergetic differences in energy acquisition and metabolism help to explain sexual size dimorphism in percids. J. Anim. Ecol.77, 916–926. doi: 10.1111/j.1365-2656.2008.01412.x
81
Ricker W. E. (1969). Effects of size-selective mortality and sampling bias on estimates of growth, mortality, production, and yield. J. Fish. Board Can.26, 479–541. doi: 10.1139/f69-051
82
Rodríguez-Cortés K. D. Aguilar-Perera A. Bonilla-Gomez J. L. (2015). Growth and mortality of red lionfish, Pterois volitans (Actinopterygii: Scorpaeniformes: Scorpaenidae), in the Parque Nacional Arrecife Alacranes, southern Gulf of Mexico, as determined by size-frequency analysis. Acta Ichthyol. Piscat.45, 175–179. doi: 10.3750/AIP2015.45.2.07
83
Roff D. A. (1983). An allocation model of growth and reproduction in fish. Can. J. Fish. Aquat. Sci.40, 1395–1404. doi: 10.1139/f83-16
84
Rojas-Vélez S. Tavera J. A Acero P. (2024). Is lionfish ontogenetic dietary change mediated by morphological functionality? Hydrobiologia.851, 447–456. doi: 10.1007/s10750-023-05254-y
85
Savva I. Chartosia N. Antoniou C. Kleitou P. Georgiou A. Stern N. et al . (2020). They are here to stay: the biology and ecology of lionfish (Pterois miles) in the Mediterranean Sea. J. Fish Biol.97, 148–162. doi: 10.1111/jfb.14340
86
Schultz E. T. (1986). Pterois volitans and Pterois miles: two valid species. Copeia1986, 686–690. doi: 10.2307/1444950
87
Sogard S. M. (1997). Size-selective mortality in the juvenile stage of teleost fishes: a review. Bull. Mar. Sci.60, 1129–1157.
88
Somarakis S. Tsoukali S. Giannoulaki M. Schismenou E. Nikolioudakis N. (2019). Spawning stock, egg production and larval survival in relation to small pelagic fish recruitment. Mar. Ecol. Prog. Ser.617, 113–136. doi: 10.3354/meps12642
89
Steell S. C. Van Leeuwen T. E. Brownscombe J. W. Cooke S. J. Eliason E. J. (2019). An appetite for invasion: digestive physiology, thermal performance and food intake in lionfish (Pterois spp.). J. Exp. Biol.222, jeb209437. doi: 10.1242/jeb.209437
90
Tserpes G. Tsimenides N. (1995). Determination of age and growth of swordfish, Xiphias gladius L. Fish. Bull.93, 594–602.
91
Tsiamis K. Azzurro E. Bariche M. Çinar M. E. Crocetta F. De Clerck O. et al . (2020). Prioritizing marine invasive alien species in the European Union through horizon scanning. Aquat. Conserv.: Mar. Freshw. Ecosyst.30, 794–845. doi: 10.1002/aqc.3267
92
Ulman A. Ali F. Z. Harris H. E. Adel M. Mabruk S. A. A. Bariche M. et al . (2022). Lessons from the Western Atlantic lionfish invasion to inform management in the Mediterranean. Front. Mar. Sci.9, 865162. doi: 10.3389/fmars.2022.865162
93
Ulman A. Harris H. E. Doumpas N. Deniz Akbora H. Al Mabruk S. A. A. Azzurro E. et al . (2021). Low pufferfish and lionfish predation in their native and invaded ranges suggests human control mechanisms may be necessary to control their Mediterranean abundances. Front. Mar. Sci.8, 670413. doi: 10.3389/fmars.2021.670413
94
Vigliola L. Meekan M. G. (2009). “ The back-calculation of fish growth from otoliths,” in Tropical Fish Otoliths: Information for Assessment, Management and Ecology. Eds. GreenB. C.MapstoneB. D.CarlosG.BeggG. A. ( Spinger, Dordrecht), 174–211. doi: 10.1007/978-1-4020-5775-5_6
95
Walsworth T. E. Landom K. Gaeta J. W. (2020). Compensatory recruitment, dynamic habitat, and selective gear present challenges to large-scale invasive species control. Ecosphere11, e03158. doi: 10.1002/ecs2.3158
96
Whitfield P. E. Gardner T. Vives S. P. Gilligan M. R. Courtenay W. R. Jr. Ray G. C. et al . (2002). Biological invasion of the Indo-Pacific lionfish Pterois volitans along the Atlantic coast of North America. Mar. Ecol. Prog. Ser.235, 289–297. doi: 10.3354/meps235289
97
Wilcox C. L. Motomura H. Matsunuma M. Bowen B. W. (2018). Phylogeography of lionfishes (Pterois) indicate taxonomic over splitting and hybrid origin of the invasive Pterois volitans. J. Hered.109, 162–175. doi: 10.1093/jhered/esx056
98
Worthington D. G. Fowler A. J. Doherty P. J. (1995). Determining the most efficient method of age determination for estimating the age structure of a fish population. Can. J. Fish. Aquat. Sci.52, 2320–2326. doi: 10.1139/f95-224
99
Yilmaz S. Demirhan S. A. (2020). Age, growth parameters and food composition of Invasive Red Lionfish (Pterois volitans L. 1758) in İskenderun Bay. Nat. Eng. Sci.5, 82–91. doi: 10.28978/nesciences.756730
100
Živkov M. (1996). Critique of proportional hypotheses and methods for back-calculation of fish growth. Environ. Biol. Fishes.46, 309–320. doi: 10.1007/BF00005008
Summary
Keywords
ageing, back-calculation, growth-dependent mortality, lionfish, VBGF
Citation
Christidis G, Peristeraki P, Tzanatos E, Tserpes G, Giannakaki A, Metaxakis M, Tsiroglou A and Somarakis S (2026) Using dorsal fin spine sections to investigate the age and growth of devil firefish Pterois miles in the eastern Mediterranean (Cretan and Ionian Seas). Front. Mar. Sci. 13:1699123. doi: 10.3389/fmars.2026.1699123
Received
04 September 2025
Revised
18 December 2025
Accepted
07 January 2026
Published
27 January 2026
Volume
13 - 2026
Edited by
Tomaso Fortibuoni, Istituto Superiore per la Protezione e la Ricerca Ambientale (ISPRA), Italy
Reviewed by
Barbara Zorica, Institute of Oceanography and Fisheries (IZOR), Croatia
Cesar A. Salinas-Zavala, Centro de Investigación Biológica del Noroeste (CIBNOR), Mexico
Ana Rita Vieira, FCUL Microscopy Facility, Portugal
Maria Inês Silva, Center for Marine and Environmental Sciences (MARE), in collaboration with reviewer ARV
Updates
Copyright
© 2026 Christidis, Peristeraki, Tzanatos, Tserpes, Giannakaki, Metaxakis, Tsiroglou and Somarakis.
This is an open-access article distributed under the terms of the Creative Commons Attribution License (CC BY). The use, distribution or reproduction in other forums is permitted, provided the original author(s) and the copyright owner(s) are credited and that the original publication in this journal is cited, in accordance with accepted academic practice. No use, distribution or reproduction is permitted which does not comply with these terms.
*Correspondence: Georgios Christidis, chrisgeo@hcmr.gr
Disclaimer
All claims expressed in this article are solely those of the authors and do not necessarily represent those of their affiliated organizations, or those of the publisher, the editors and the reviewers. Any product that may be evaluated in this article or claim that may be made by its manufacturer is not guaranteed or endorsed by the publisher.