Abstract
This study evaluates the cumulative impact of fishing and aquaculture activities on the environmental quality of Samanco Bay (Áncash, Peru) through the integrated analysis of a 17-year monitoring record (2003–2019). Physicochemical, microbiological, and sedimentary variables were examined across eight stations, applying descriptive statistics, spatial differentiation tests, correlation analysis, and Principal Component Analysis (PCA), all conducted under rigorous quality assurance procedures (ISO/IEC 17025). The results revealed well-defined spatial patterns associated with gradients of anthropogenic pressure: reduced water transparency, significant accumulation of organic matter in sediments (14.08%), and recurrent episodes of reducing conditions with elevated hydrogen sulphide concentrations (0.91 mg/L). Dissolved oxygen exhibited high variability and critically low values in areas adjacent to processing plants and aquaculture zones, indicating intensive remineralization and a heightened risk of benthic hypoxia. Coliforms displayed highly skewed distributions, indicating sporadic faecal contamination events associated with intermittent discharges. PCA distinguished two dominant regimes: oxygenated surface waters and deeper waters enriched in nutrients and reduced compounds. Overall, the findings confirm an incipient process of structural environmental degradation in the bay, underscoring the need to strengthen effluent treatment, regulate aquaculture carrying capacity, and adopt adaptive management measures to prevent irreversible ecosystem impacts.
1 Introduction
Marine pollution represents one of the major environmental threats along the Peruvian coast, compromising both biodiversity and the sustainability of strategic productive sectors such as fisheries and aquaculture (Ibárcena Fernández, 2019). According to the Food and Agriculture Organization of the United Nations (FAO), aquaculture is the fastest growing food-production sector worldwide, with an average annual increase of 5.3% between 2001 and 2022 (FAO, 2024). However, this rapid expansion has been accompanied by increasing pressures derived from organic and inorganic wastes, nutrients, and chemical compounds that disrupt biogeochemical cycles and degrade coastal ecosystems (Mangan et al., 2022; Inostroza et al., 2024).
In the Eastern Pacific, the discharge of untreated domestic and industrial wastewater remains one of the principal drivers of coastal deterioration (Garg et al., 2022; Devlin et al., 2020). Countries such as Peru, Chile, Ecuador, and Colombia share particular vulnerability in bays where urban expansion, fish-processing industries, and aquaculture coexist (Galarza Mora Wilmer et al., 2022; Ucros-Rodríguez et al., 2025). In Peru, Samanco Bay located in the Ancash region constitutes one of these highly productive and biodiverse coastal systems (Tapia-Ugaz et al., 2022), yet it is subjected to intense anthropogenic pressure due to the presence of fishmeal and fish-oil processing plants and aquaculture concessions for Argopecten purpuratus (Loayza-Aguilar et al., 2024).
Fish processing plants in the bay generate effluents with high organic loads, including fish residues, blood, oils, wash waters from vessel holds, and operational discharges. These inputs increase nutrient concentrations, stimulate eutrophication, and contribute to oxygen depletion. Likewise, anchovy landings release viscera, biofluids, and cleaning waters from port facilities, elevating suspended solids and promoting localized hypoxic events. Additionally, A. purpuratus aquaculture through suspended and bottom-culture systems produces feces, pseudofeces, biodeposits, and biofouling residues that accumulate beneath farming structures, increasing sedimentation rates and fostering hydrogen sulphide formation (Henares et al., 2020; Montoya Rosas et al., 2020). Collectively, these mechanisms directly affect water quality, sediment biogeochemistry, and benthic community dynamics.
Environmental degradation associated with aquaculture and human-induced pressures has also been documented in continental and marine systems across Peru Pacucha Lagoon shows eutrophication and heavy metal contamination linked to agrochemical use and unregulated aquaculture (Peralta-Guevara et al., 2025), whereas ecological modelling in the El Pañe reservoir demonstrated that intensive aquaculture significantly increases cyanobacterial proliferation (Mamani Larico et al., 2021). At the marine scale, Callao Bay exhibits persistent pollution from industrial and port activities, reflected in elevated concentrations of heavy metals in water, sediments, and demersal fish tissues (Guabloche et al., 2024). These cases illustrate how productive activities can generate cumulative and long-lasting impacts on environmental quality.
Despite its ecological and economic relevance, research in Samanco Bay has remained limited and fragmented. Previous studies conducted by IMARPE and local authorities documented episodes of organic enrichment, dissolved oxygen depletion, and occasional exceedances of the National Environmental Quality Standards (ECA). This article is derived from a doctoral thesis completed in 2023 and archived in the institutional repository of the Universidad Nacional del Santa (UNS). Although that work provided a general characterization of environmental patterns in the bay, the present manuscript substantially expands the analysis by integrating 17 years of monitoring data (2003–2019), applying multivariate statistical approaches and mixed effects modelling, and explicitly examining environmental conditions before and after the implementation of the submarine outfalls. These methodological advances enable a more robust attribution of pressures derived from fisheries and aquaculture activities.
Nevertheless, no previous study has combined long-term environmental monitoring with fisheries and aquaculture production indicators to quantitatively assess compliance with environmental quality standards or estimate the relative contribution of these activities to water and sediment quality in Samanco Bay. Addressing this knowledge gap is essential for evaluating the effectiveness of management measures implemented since 2011 and for informing evidence-based decision making in coastal ecosystem governance.
Considering these gaps, the present study aims to evaluate, in an integrated manner, the spatial and temporal patterns of water and sediment quality in Samanco Bay during 2003–2019, considering physicochemical, microbiological, and sedimentary variables associated with fishing and aquaculture activities. The integration of 17 years of continuous environmental monitoring allows the identification of long-term trends, station-level differences, and signals of anthropogenic pressure on the ecosystem. Together, these results provide quantitative evidence on the environmental dynamics of the bay and offer relevant insights to guide management, mitigation, and conservation strategies in Samanco and other coastal systems subject to similar pressures.
2 Materials and methods
2.1 Study area
The study was conducted in Samanco Bay, located in the province of Santa (Áncash, Peru), covering approximately 6,900 ha between coordinates 09°10′–09°17′ S and 78°28′–78°34′ W. The bay hosts industrial anchovy-processing plants producing fishmeal and fish oil, as well as aquaculture concessions dedicated to the cultivation of Argopecten purpuratus. These activities represent the main anthropogenic pressures in the area: industrial processing generates effluents with high organic loads, oils, and cleaning waters, whereas bivalve aquaculture contributes faeces, pseudo faeces, and bio deposits that accumulate on the seafloor. Together, these inputs promote organic enrichment, increase biological oxygen demand, and enhance hydrogen sulphide formation in benthic sediments.
The environmental monitoring network consists of eight stations (S1–S8). Stations S1 and S8 serve as control sites due to their greater water renewal, whereas stations S2–S7 are in areas directly influenced by anthropogenic activities, including fish-processing facilities, effluent discharge points, port zones, and aquaculture areas. All geographic elements are shown in Figure 1.
Figure 1
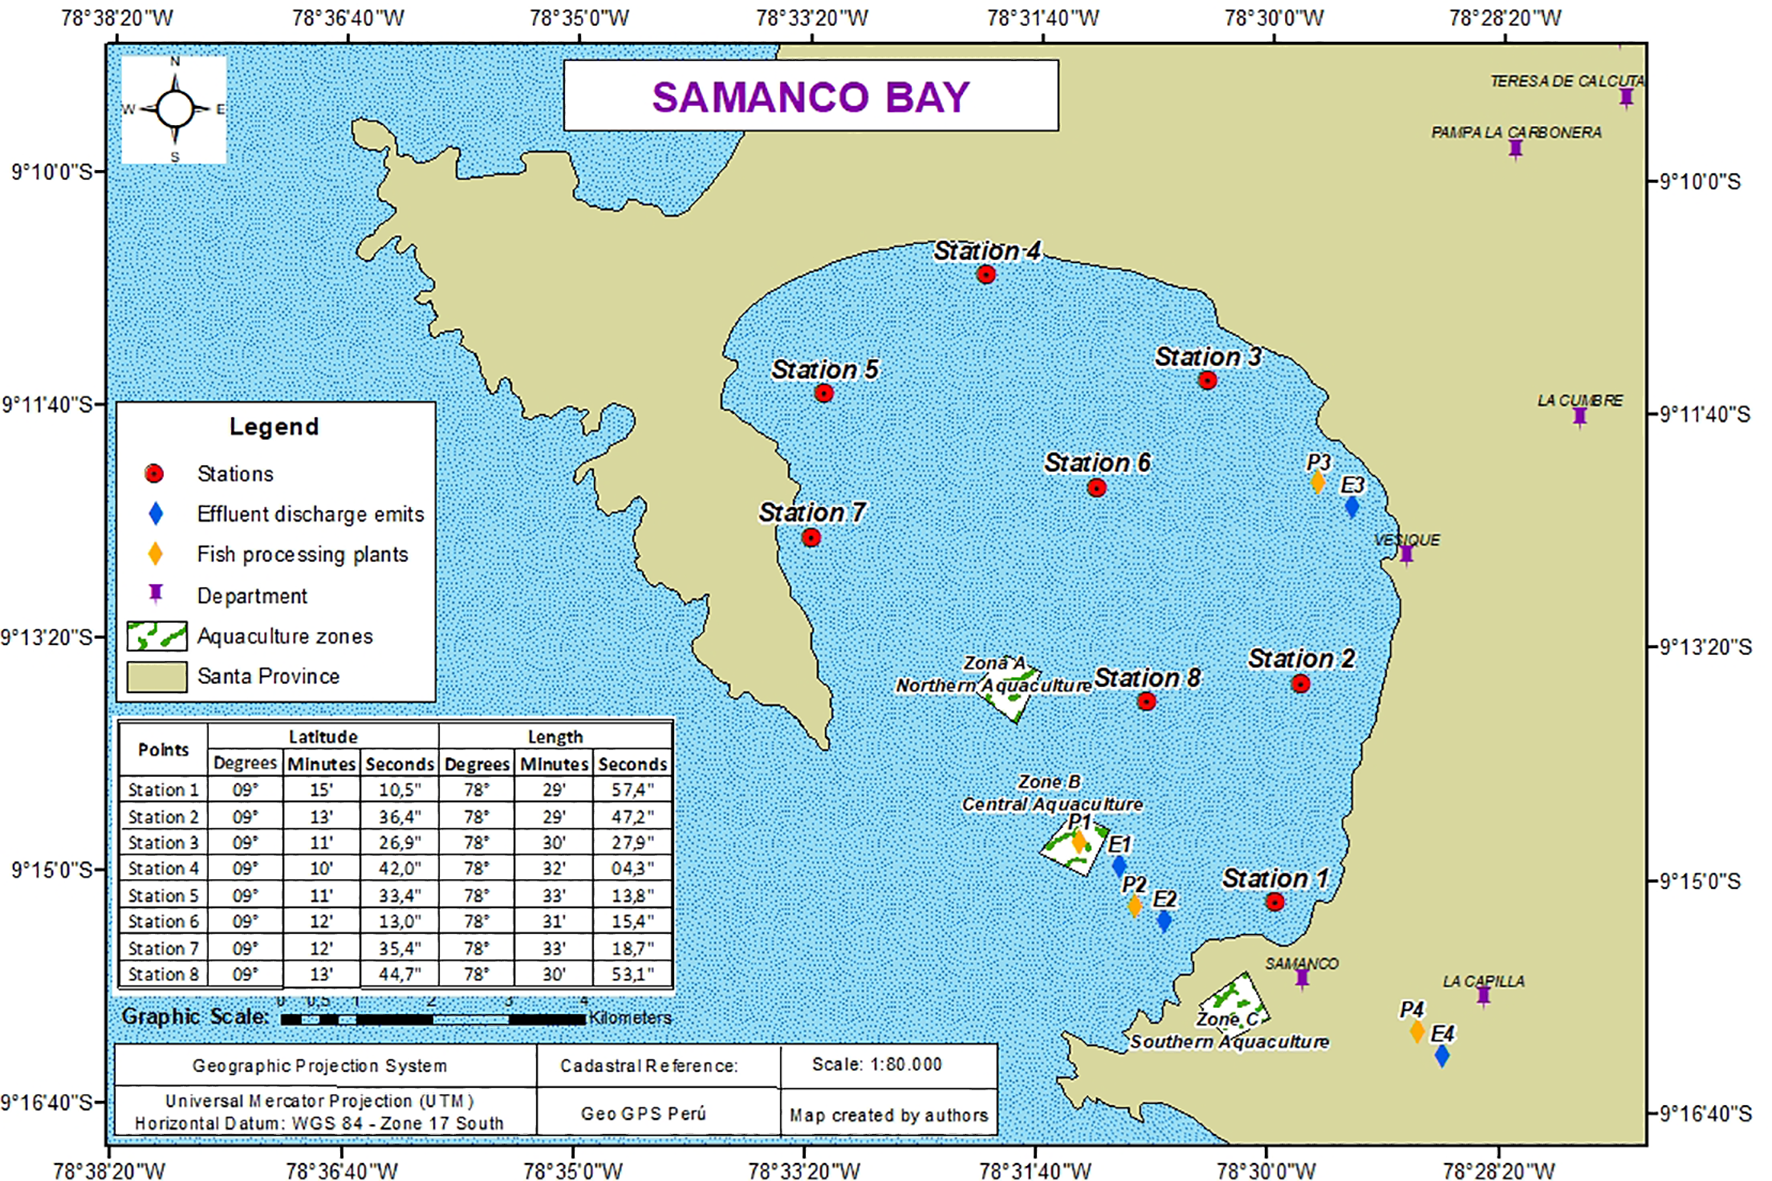
Shows the location of sampling stations, major fish-processing facilities, aquaculture areas, effluent discharge pipelines, coastlines, bathymetry contours, a north arrow, scale bar, and the WGS84 datum projection.
2.2 Sampling design
Environmental monitoring was conducted from 2003 to 2019 in accordance with the standardized protocols of the Peruvian Marine Institute (IMARPE). The sampling design was structured around discrete field campaigns rather than fixed monthly intervals, with each campaign determined by logistical availability, oceanographic and meteorological conditions, and institutional monitoring schedules. A total of 46 campaigns were carried out, during which stations S1–S8 were sampled simultaneously for the collection of surface water, bottom water, and sediment. Table 1 summarizes the months in which each campaign took place.
Table 1
| Year | Sampling months |
|---|---|
| 2003 | April, June |
| 2004 | February, May, August, December |
| 2005 | February, June, August, November |
| 2006 | April, August, November, December |
| 2007 | March, June, September, December |
| 2008 | April, June, September |
| 2009 | March, September |
| 2010 | June, October |
| 2011 | June, December |
| 2012 | April, October |
| 2013 | April |
| 2014 | April, September, December |
| 2015 | April, November |
| 2016 | May, November |
| 2017 | December |
| 2018 | November |
| 2019 | October |
Sampling months of environmental monitoring campaigns conducted in Samanco Bay (2003–2019).
Authors’ elaboration based on IMARPE (2003–2019).
2.3 Study design
A quantitative, non-experimental design with a longitudinal and correlational approach was adopted (Chávez Valdez et al., 2020; Sciberras and Dingli, 2023). The longitudinal component of the study is supported by the availability of systematic monitoring records from 2003 to 2019, which enabled the identification of temporal trends and interannual variability. In parallel, the correlational approach allowed the evaluation of statistical associations between indicators of productive activity and environmental quality parameters in Samanco Bay Haro Sarango et al. (2024); Lascano-Arias et al. (2025).
2.4 Data sources
Environmental data were obtained from the official monitoring program of the Peruvian Marine Institute (IMARPE). Physicochemical, microbiological, and sedimentary variables were evaluated, including temperature, salinity, dissolved oxygen, pH, total suspended solids, thermotolerant coliforms, hydrogen sulphide, oils and greases, nitrates, phosphates, and total organic matter. The recorded values were compared with the Environmental Quality Standards (ECA) for marine–coastal waters established under Supreme Decree No. 002-2008-MINAM.
2.5 Sampling procedures
2.5.1 Water sampling
Water samples were collected at each station following IMARPE’s standardized environmental monitoring protocols. At each site, surface water (0.5 m depth) and bottom water (1–2 m above the sediment) were obtained using a 5-L Niskin bottle to minimize contamination during retrieval. In situ measurements of temperature, salinity, dissolved oxygen, and pH were recorded with a YSI ProDSS multiparameter probe, previously calibrated according to the manufacturer’s specifications to ensure data accuracy and stability.
After collection, water samples were transferred into pre-washed high-density polyethylene bottles, maintained at 4 °C in dark, insulated containers, and transported to the laboratory within a maximum of six hours. Preservation procedures followed APHA (2017) guidelines: nutrient samples were acidified and refrigerated; samples for oils and greases were stored in glass containers without headspace; and microbiological samples were placed in sterile containers and processed within eight hours.
2.5.2 Sediment sampling
Sediment samples were collected using a Van Veen grab. From each deployment, subsamples corresponding to the upper 2 cm were obtained, avoiding contact with the grab walls to minimize contamination. The sediment samples were stored at 4 °C until laboratory processing for the determination of total organic matter (TOM), grain-size analysis, and sulphide quantification.
2.6 Analytical methods
2.6.1 Determination of thermotolerant coliforms
Thermotolerant coliforms were quantified using the Most Probable Number (MPN) technique, following the procedures established in Standard Methods for the Examination of Water and Wastewater (APHA, 1992c). At each station, 100 mL of water were collected in sterile containers and processed within a maximum of eight hours to prevent microbial viability loss.
Serial dilutions (10−1 to 10−3) were prepared using sterile buffered water, and aliquots from each dilution were inoculated into fermentation tubes containing lauryl tryptose broth. Tubes exhibiting gas production after 24–48 hours of incubation at 35°C were transferred to EC broth and subsequently incubated at 44.5 ± 0.2°C to confirm the presence of thermotolerant coliforms.
2.6.2 Determination of oils and greases
The determination of oils and greases was performed following the gravimetric procedure described in EPA Method 1664A EPA 1664A (1999). At each station, 1 L of water was collected in prewashed glass bottles to prevent the adsorption of hydrophobic compounds. Samples were preserved with 5 mL of hydrochloric acid (HCl) to adjust the pH to < 2 and were stored at 4°C until processing, within a maximum of 24 hours.
Extraction was carried out using n-hexane as the solvent. Each sample was transferred to a separatory funnel and subjected to three successive extractions by vigorous shaking with controlled volumes of n-hexane. The combined extracts were dried with anhydrous sodium sulphate to remove residual moisture and transferred to a pre-weighed evaporation dish. The solvent was completely evaporated in a water bath at 85–90°C under controlled ventilation, and the remaining residue was stabilized in a desiccator to constant weight.
The concentration of oils and greases was determined gravimetrically as the difference between the final mass of the dish containing the residue and the initial mass of the empty dish, with results expressed in mg/L. Each analytical batch included procedural controls to detect contamination or methodological deviations, ensuring compliance with EPA quality standards.
2.6.3 Determination of total suspended solids
Total suspended solids (TSS) were quantified using the gravimetric filtration procedure described in APHA Method 2540D APHA (2017). At each station, 1 L of water was collected in clean high-density polyethylene bottles and transported to the laboratory at 4°C for processing.
Glass fibre filters (Whatman GF/F, 0.7 μm) were pre-conditioned by rinsing, followed by drying at 105°C for one hour, cooling in a desiccator, and weighing to record the initial mass. A known volume of each sample was then vacuum filtered through the conditioned filters. After filtration, the filters containing the retained particulate matter were dried again at 105°C for one hour, cooled in a desiccator to constant weight, and reweighed to obtain the final mass.
TSS concentration was calculated using the standard gravimetric equation:
Where:
A = final mass of the filter plus residue (mg)
B = initial mass of the clean filter (mg)
V = volume of sample filtered (mL)
2.6.4 Determination of hydrogen sulphide
Hydrogen sulphide (H2S) was quantified using the methylene blue colorimetric method described in APHA 4500-S2− (APHA, 1992b). Samples were collected in airtight glass bottles with no headspace to minimize volatilization and were immediately preserved with a zinc acetate solution (20 g/L), which precipitates sulphide as zinc sulphide, ensuring sample stability during storage. Subsequently, samples were maintained at 4°C and analysed within 24 hours of collection.
The formation of the methylene blue complex was measured spectrophotometrically at 665 nm, and H2S concentrations were determined by interpolation from a calibration curve prepared with sodium sulphide standards. Analytical quality control included reagent blanks, duplicate analyses, and verification of calibration linearity (R² ≥ 0.995).
2.6.5 Determination of nitrates
Nitrate concentrations were determined using the UV spectrophotometric method described in APHA 4500-NO3−. Samples were filtered through 0.45 μm membrane filters to remove particulate interference. Absorbance was measured at 220 nm, the wavelength at which nitrate exhibits maximum absorption, and at 275 nm to correct for interference from dissolved organic matter. The corrected absorbance was calculated using the equation:
Final nitrate concentrations were obtained by interpolation on a calibration curve prepared with KNO3 standard solutions, ensuring appropriate linearity (R2 ≥ 0.995).
2.6.6 Determination of phosphates
Phosphate concentrations were determined using the ascorbic acid colorimetric method described in APHA 4500-P (APHA, 1992a). Samples were filtered through 0.45 μm membrane filters and subsequently reacted with the molybdate–antimony reagent under acidic conditions, followed by the addition of ascorbic acid, which reduces the complex to form the characteristic blue phosphor molybdenum complex. The absorbance of the resulting complex was measured at 880 nm using a UV–Vi’s spectrophotometer.
Concentrations were expressed as PO43−-P (mg/L) and were calculated by interpolation on a calibration curve whose linearity (R² ≥ 0.995) and detection limits were verified at the beginning of each analytical batch.
2.6.7 Determination of total, organic matter
Total organic matter (TOM) in sediments was determined using the loss-on-ignition (LOI) method, following the specifications of ASTM D2974. Samples were first dried at 105°C for 24 hours to obtain the dry mass (W(105°C)). They were then combusted in a muffle furnace at 550°C for 4 hours to determine the ash mass (W(;550°C)).
Where: = mass of the dry sample at 105°C (g) = mass of the sample after ignition at 550°C (g)
2.6.8 Determination of sediment texture
Sediment texture was determined following the procedures established in ISO 11277 (2020), using a combination of wet sieving for the coarse fraction (>63 μm) and laser diffraction for the fine fraction (<63 μm). Samples were first air-dried, gently disaggregated to avoid breaking natural aggregates, and manually cleaned to remove visible organic debris.
The sand fraction retained on the sieve was dried at 105°C and weighed to quantify its proportion. The silt–clay fraction was dispersed using a 5% sodium hexametaphosphate solution and subsequently analysed by laser granulometry.
2.7 Quality assurance and quality control
Rigorous quality assurance and quality control (QA/QC) procedures were implemented in both field and laboratory operations. These procedures included the collection of duplicate samples at 20% of the monitoring stations, daily calibration of all measurement instruments, and the analysis of samples in an ISO/IEC 17025 accredited laboratory. Calibration curves meeting strict linearity criteria (R² ≥ 0.995), certified reference materials, internal standards, analytical blanks, and replicates were also employed to ensure the accuracy and precision of the analytical results.
Outliers were evaluated using Grubbs’ test (α = 0.05) and were excluded only when clear evidence of analytical or procedural error was identified.
2.8 Statistical analysis
All statistical analyses were performed in Python (v.3.10) using the packages pandas, numpy, scipy, statsmodels, pingouin, scikit-posthocs, and seaborn. The analytical workflow included data preprocessing, assumption testing, univariate and multivariate analyses, and visualization of temporal and spatial patterns.
First, descriptive statistics (mean, median, standard deviation, range, variance, and standard error) were computed for all physicochemical, microbiological, and sedimentary variables across stations and sampling years. Normality was assessed using the Shapiro–Wilk test, and homogeneity of variances using Levene’s test. Variables that did not meet normality assumptions were analysed with non-parametric procedures.
To evaluate spatial differences among stations, one-way ANOVA was applied to normally distributed variables with homogeneous variances (Gökkuş and Şentürk, 2025), while the Kruskal Wallis test was used for non-normal datasets (Elliott and Hynan, 2011). When global tests were significant, pairwise comparisons were performed using the Games–Howell post hoc test, which does not assume equal variances or sample sizes (Ramsey and Ramsey, 2009).
Temporal trends were explored using correlation analyses. Pearson’s correlation coefficient was applied to normally distributed variables, whereas Spearman’s rho was used for non-parametric data. Correlation matrices and heatmaps were generated to visually assess clustering patterns among environmental indicators.
Multivariate patterns were examined through Principal Component Analysis (PCA) to identify the dominant environmental gradients structuring the system (Syms, 2019). Data were centred and scaled prior to PCA, and variable loadings were used to interpret the contribution of each parameter to major axes.
All statistical tests used a significance threshold of α = 0.05, and multiple comparisons were corrected using the False Discovery Rate (FDR) method when appropriate. Figures and visualizations were produced using matplotlib and seaborn.
3 Results
3.1 Physicochemical characteristics of the water column
Table 2 presents the descriptive patterns together with the results of the assumption tests and the multiple-comparison procedures (Games–Howell). Significant spatial differences were identified for transparency and organic matter, with consistently higher values at stations located near sources of anthropogenic pressure. In contrast, both oils and greases and hydrogen sulphide exhibited substantial temporal and spatial variability but no significant differences among stations, suggesting that their occurrence is driven by episodic events with highly localized distribution. Similarly, BOD did not show significant spatial differences, indicating that pulses of organic enrichment occur intermittently throughout the bay rather than being confined to specific locations.
Table 2
| Variable | Mean ± SD | Median | Range | Normality (Shapiro–Wilk) * | ANOVA (F, p) | Games–Howell – significant groups (p< 0.05) |
|---|---|---|---|---|---|---|
| Temperature (°C) | 18.96 ± 2.34 | 19.20 | 11.40 | S1, S6, S7, S8 non-normal | F = 13.98, p = 6.67×10⁻¹⁷ | S1 ≠ S3, S4, S5; S2 ≠ S3, S4, S5; S3 ≠ S6, S7, S8; S4 ≠ S6, S7, S8; etc. |
| Salinity (PSU) | 35.12 ± 0.11 | 35.12 | 1.54 | S2, S4, S8 non-normal | F = 9.05, p = 1.20×10⁻¹⁰ | S1 ≠ S3, S4, S5; S2 ≠ S3, S4, S5; S3 ≠ S6, S7, S8; etc. |
| pH (units) | 8.23 ± 0.38 | 8.21 | 2.21 | Mostly normal | F = 1.97, p = 0.0565 | Some differences (S1 ≠ S3, S4, S5; S4 ≠ S6, S7…), but the overall ANOVA is not significant. |
| Dissolved Oxygen (mg/L) | 5.02 ± 3.08 | 5.31 | 13.48 | S2, S6, S7, S8 non-normal | F = 4.53, p = 6.10×10⁻⁵ | S1 ≠ S3, S4; S3 ≠ S6, S7, S8; S4 ≠ S6, S7, S8; etc. |
| Total Suspended Solids (mg/L) | 34.39 ± 13.80 | 34.00 | 76.00 | S1, S5, S6 non-normal | F = 0.47, p = 0.857 | No significant differences |
Descriptive statistics, assumption tests, and multiple comparisons (Games–Howell) for physicochemical variables in Samanco Bay (2003–2019).
“non-normal” indicates that p< 0.05 in Shapiro–Wilk for that station
The physicochemical conditions of Samanco Bay between 2003 and 2019 exhibited pronounced spatial and temporal variability, driven both by natural hydrographic processes and by anthropogenic inputs associated with fish-processing and aquaculture activities. Water transparency ranged from 0.70 to 12.00 m (mean: 2.63 ± 1.28 m), reflecting fluctuations in water clarity linked to increases in suspended particulate matter and episodic sediment resuspension.
Concentrations of oils and greases displayed particularly high variability (0.10–9.10 mg/L; mean: 0.93 ± 0.98 mg/L), consistent with intermittent discharges of organic-rich effluents originating from fish-processing plants and vessel operations. Hydrogen sulphide showed the greatest relative variability among the evaluated parameters (0.0003–0.9078 mg/L; mean: 0.04 ± 0.12 mg/L), indicating the recurrent development of reducing conditions associated with intense organic matter remineralization, especially in areas with limited ventilation and water renewal.
Biochemical oxygen demand (BOD) ranged from 0.25 to 17.24 mg/L (mean: 2.95 ± 1.96 mg/L), highlighting episodic pulses of biodegradable organic inputs. Regarding sediments, total organic matter exhibited substantial spatial heterogeneity, with values ranging from 0.26 to 14.08% (mean: 3.56 ± 2.62%), reflecting differences in bio deposit accumulation and hydrodynamic retention across the bay.
Figure 2 depicts the multivariate structure of physicochemical conditions in Samanco Bay based on the Principal Component Analysis (PCA), which clearly distinguished surface and bottom samples throughout the study period. The first two principal components explained 33.2% of the total variance, with PC1 accounting for 21.5% and PC2 for 11.7%, thereby capturing the dominant environmental gradients structuring the system.
Figure 2
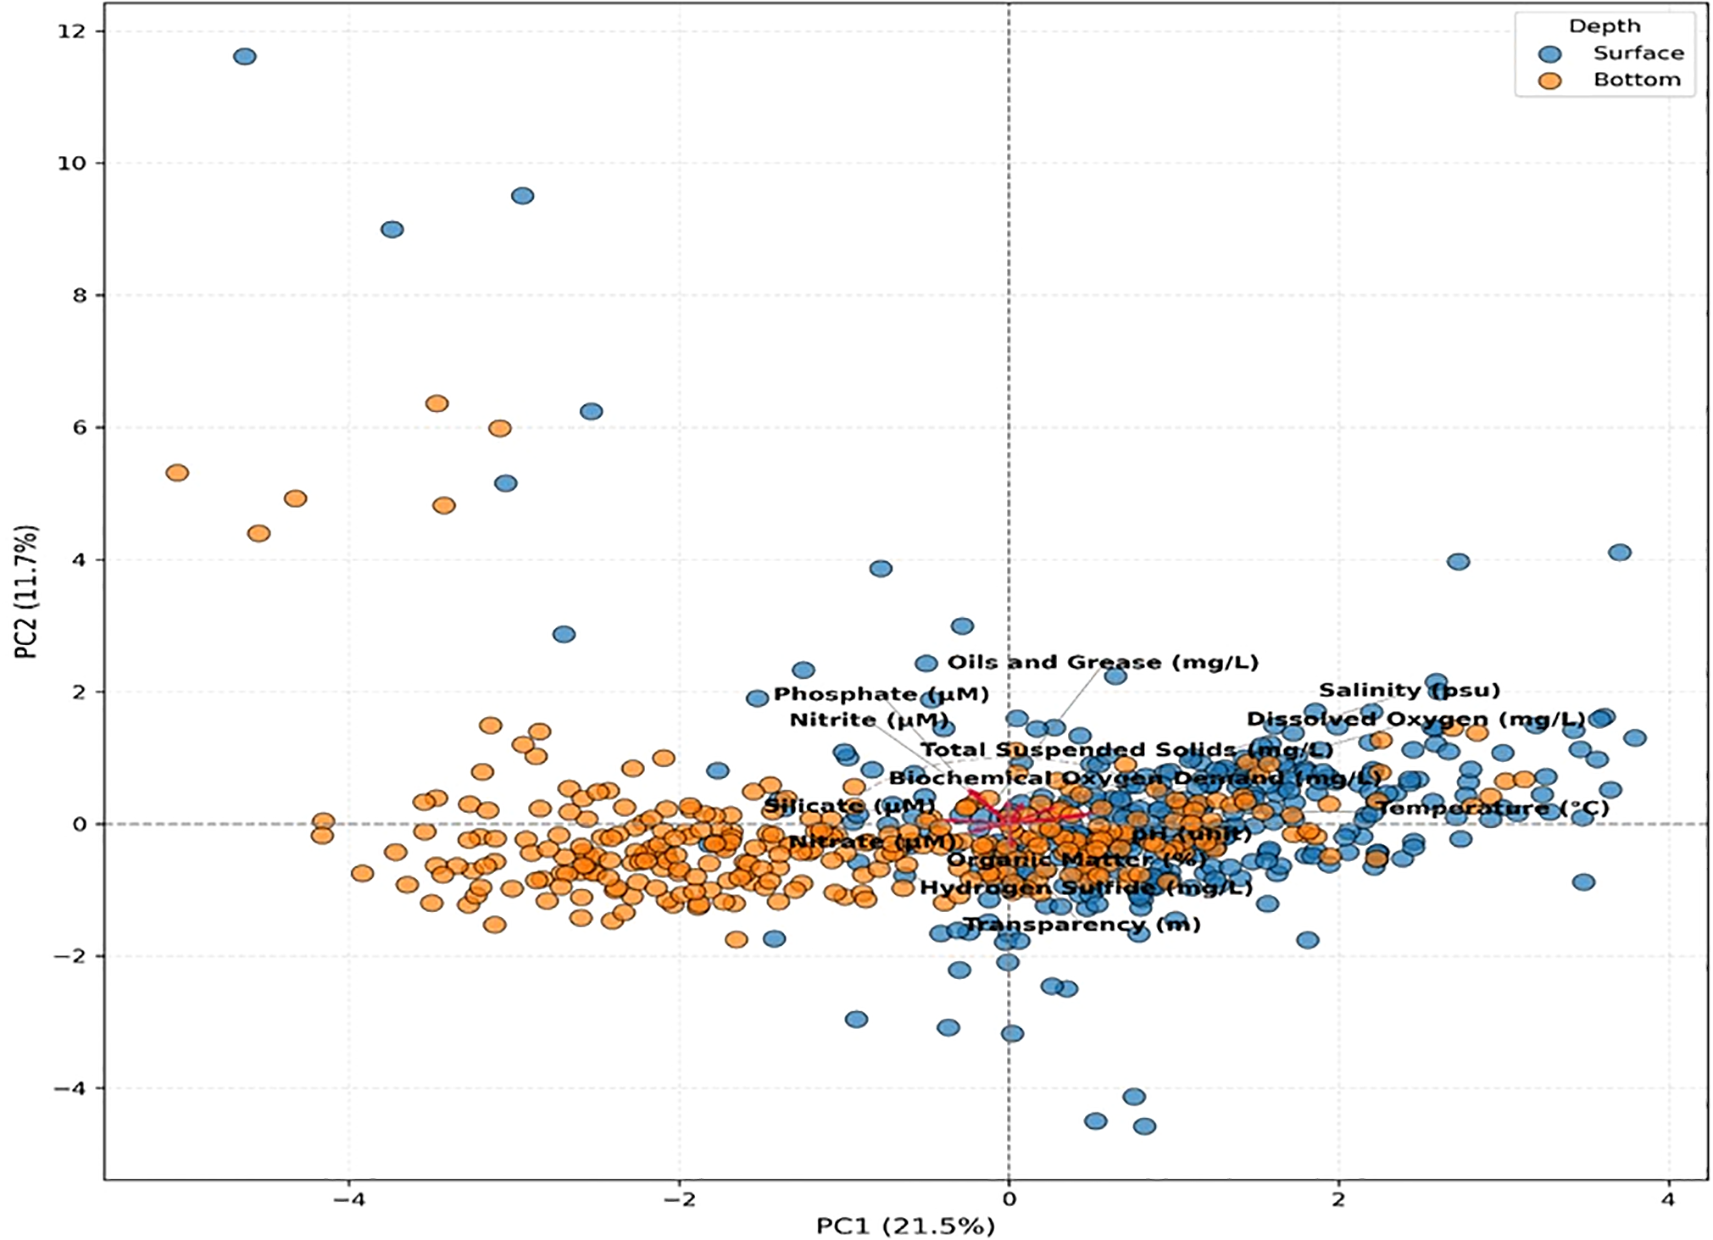
PCA biplot illustrating surface and bottom samples and the loadings of key physicochemical variables in Samanco Bay.
Along PC1, a pronounced vertical gradient was identified. Surface samples clustered toward positive scores and were associated with higher temperature, dissolved oxygen, pH, and salinity—conditions characteristic of well-ventilated waters influenced by atmospheric exchange. In contrast, bottom samples plotted toward negative PC1 values and showed strong associations with elevated concentrations of silicate, phosphate, nitrate, nitrite, hydrogen sulphide, organic matter, and biochemical oxygen demand. This pattern indicates restricted water renewal at depth, intensified organic matter remineralization, and the accumulation of nutrients and reduced compounds.
Figure 3 shows the heatmap of Pearson correlations among the physicochemical variables monitored in Samanco Bay. The overall structure reveals two major clusters that represent contrasting environmental regimes: one associated with well-oxygenated surface conditions, and another linked to nutrient accumulation, organic matter degradation, and the presence of reducing environments characteristic of deeper waters.
Figure 3
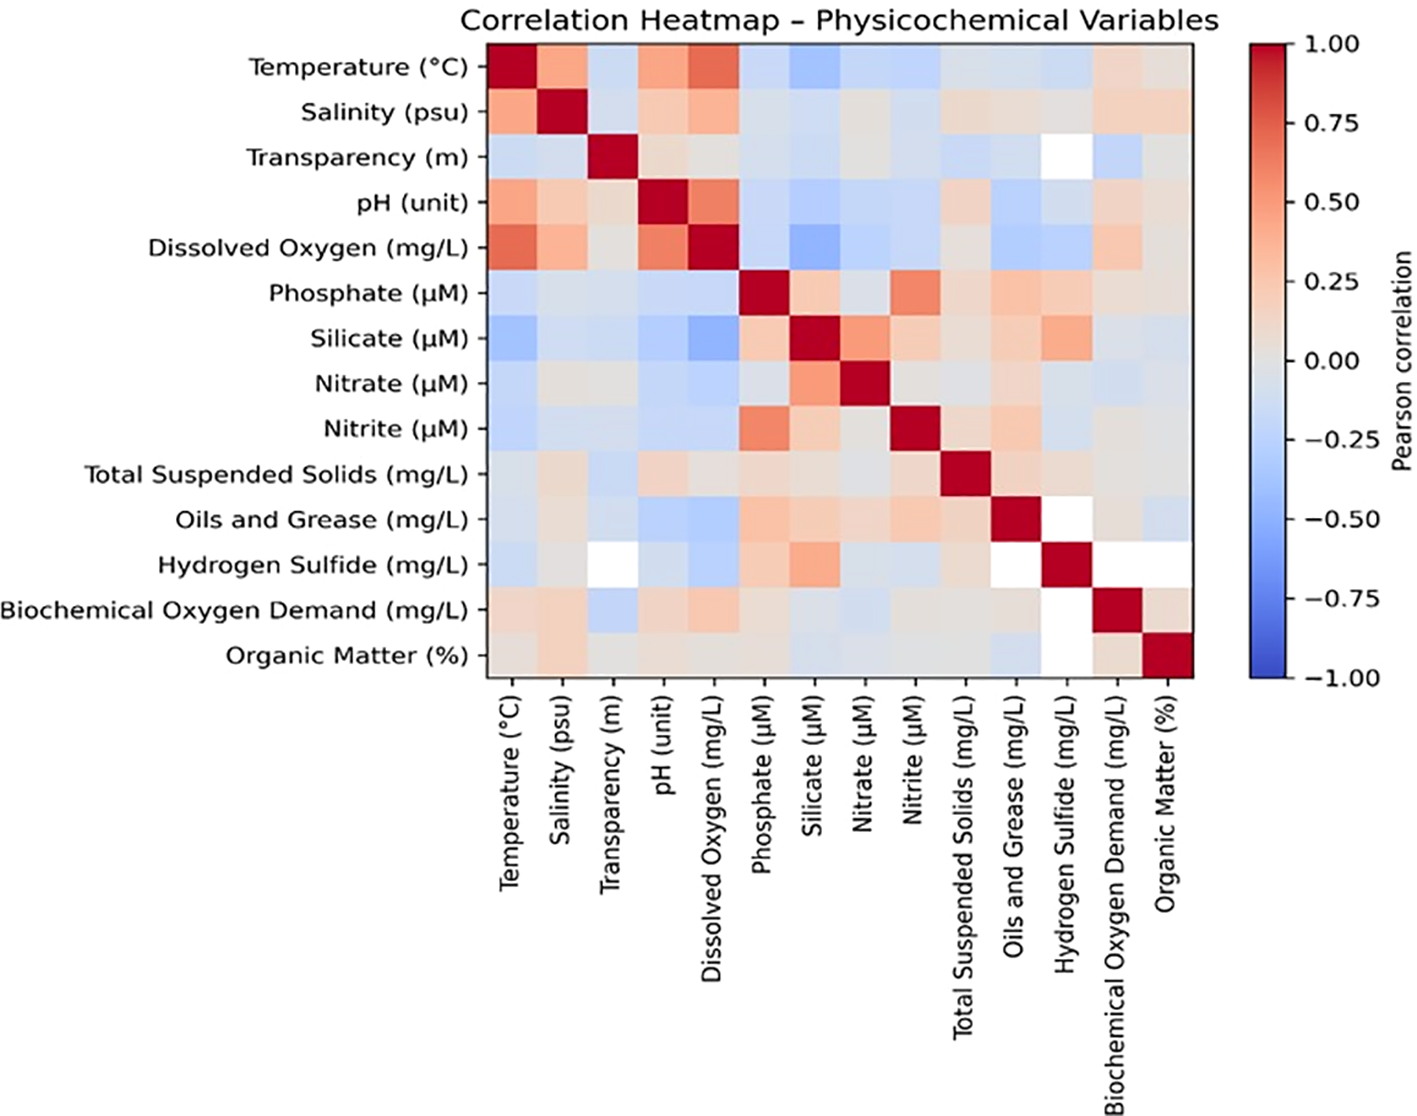
Correlation matrix of physicochemical and microbiological variables measured in Samanco Bay (2003–2019). Colours indicate the magnitude and direction of Pearson correlations.
Strong positive correlations were observed among phosphate, silicate, nitrate, nitrite, biochemical oxygen demand (BOD), hydrogen sulphide, and organic matter, indicating that these parameters increased concurrently. This pattern is typical of areas subjected to intense remineralization, limited water circulation, and sustained organic loading—conditions frequently associated with anthropogenic inputs from aquaculture effluents and industrial fish-processing discharges.
In contrast, temperature, pH, and dissolved oxygen exhibited negative correlations with most nutrient variables and reduced compounds. This pattern suggests that warmer, oxygen-rich surface waters were inversely related to the accumulation of nutrients and byproducts generated under hypoxic or anoxic conditions. These relationships are consistent with the vertical stratification pattern previously identified through principal component analysis (PCA), reinforcing the existence of two distinct physic biogeochemical regimes within the system.
3.2 Microbiological contamination
Table 3 summarizes the measures of central tendency, dispersion, and normality for total and thermotolerant coliform concentrations recorded in Samanco Bay between 2003 and 2019. Both microbiological indicators exhibited highly skewed distributions, as reflected by mean values (78.84 and 46.98 MPN/100 mL) that were substantially higher than the medians (15 MPN/100 mL). This pattern indicates the occurrence of extreme contamination events that markedly increased overall variability. The very high standard deviations (273.24 and 202.84) and associated variances further confirmed that coliform concentrations fluctuated widely throughout the sampling period, driven by sporadic but intense pulses of faecal contamination.
Table 3
| Total coliforms (MPN/100 mL) | Thermotolerant coliforms (MPN/100) | |
|---|---|---|
| Mean ± SD | 78.84 ± 273.24 | 46.98 ± 202.84 |
| Median | 15.00 | 15.00 |
| Mode | 15.00 | 15.00 |
| Variance | 74,657.40 | 41,145.23 |
| Shapiro–Wilk W | 0.2409 | 0.1528 |
| Shapiro–Wilk p-value | 4.62 × 10⁻³³ | 2.02 × 10⁻³⁴ |
Measures of central tendency, dispersion, and normality (Shapiro–Wilk) for microbiological concentrations recorded between 2003–2019.
Shapiro–Wilk tests indicate that neither microbiological variable follows a normal distribution (p< 0.001), thereby supporting the use of non-parametric or rank-based methods for inferential comparisons.
The modal value of 15 MPN/100 mL for both indicators suggests that low to moderate contamination levels were the most common condition in the bay; however, the pronounced upper tail of the distribution revealed the presence of episodic but severe microbiological pollution.
Normality tests yielded extremely low Shapiro–Wilk statistics (W = 0.2409 and 0.1528) and highly significant p-values (< 10−33), demonstrating that neither variable followed a normal distribution. This strong deviation from normality justified the application of non-parametric or rank-based methods for subsequent inferential analyses.
Figure 4 presents the Pearson correlation matrix for the two microbiological variables monitored in Samanco Bay: total coliforms and thermotolerant coliforms. The diagram shows a symmetric matrix in which the values along the main diagonal correspond to the autocorrelation of each variable (r = 1.00), while the off-diagonal value represents the correlation between them.
Figure 4
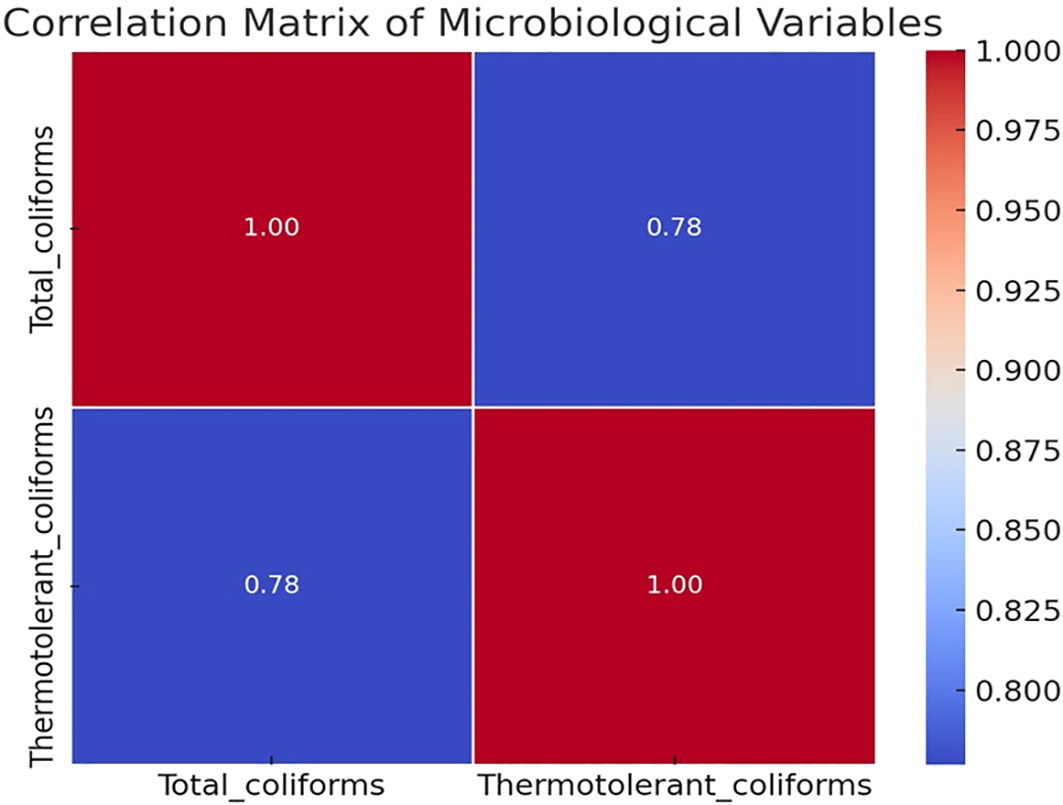
Correlation structure of microbiological contamination indicators in Samanco Bay (2003–2019).
The correlation coefficient between total coliforms and thermotolerant coliforms was r = 0.78, indicating a consistent positive association across the dataset and showing that both microbiological indicators exhibited closely related statistical patterns.
Figure 5 shows the distribution of total coliform concentrations (MPN/100 mL) across the eight monitoring stations. Median values ranged from approximately 12 to 20 MPN/100 mL in all stations, while the interquartile ranges were relatively similar, typically between ~10 and 35 MPN/100 mL.
Figure 5
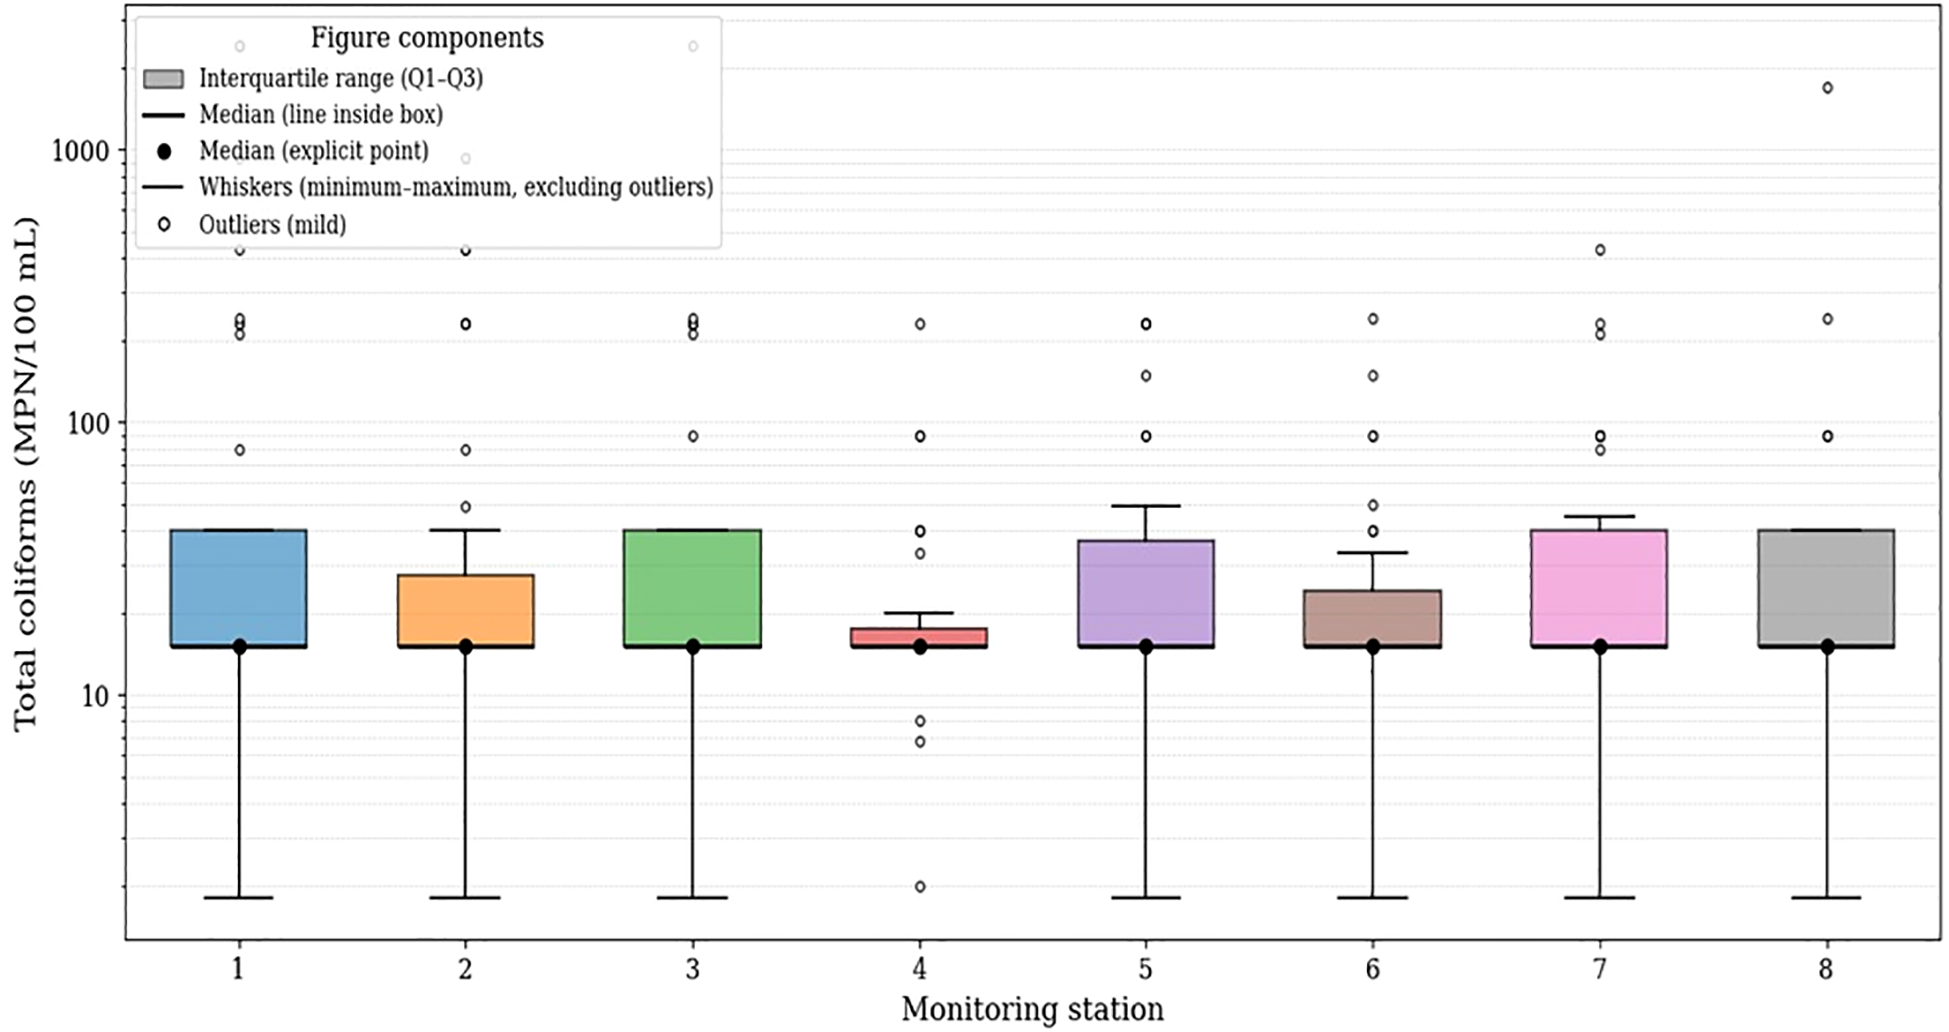
Box-and-whisker plots of total coliform concentrations by monitoring station.
Across all stations, minimum values were close to 1 MPN/100 mL, and maximum concentrations exceeded 100 MPN/100 mL, with multiple outliers surpassing 1,000 MPN/100 mL. Stations 1, 3, 5, 7, and 8 exhibited greater vertical dispersion in their boxplots, indicating broader variability in the recorded concentrations. In contrast, Station 4 showed the lowest dispersion, with a narrower box and values more tightly clustered around its median.
Overall, all stations displayed right-skewed distributions with recurrent extreme values, reflecting substantial variability in total coliform concentrations throughout the study area.
3.4 Sediment quality
Table 4 summarizes the descriptive statistics and inferential analyses for the sediment-related variables measured in Samanco Bay between 2003 and 2019. Overall, the results revealed pronounced spatial heterogeneity in water transparency and sedimentary organic matter, while oils and grease, hydrogen sulphide, and biochemical oxygen demand (BOD) exhibited high temporal variability but limited spatial structure among stations.
Table 4
| Mean ± SD | Median | Range | Normality (Shapiro–Wilk) | ANOVA (F, p) | Games–Howell – significant groups (p< 0.05) | |
|---|---|---|---|---|---|---|
| Transparency (m) | 2.63 ± 1.28 | 2.50 | 11.30 | S1, S2, S4, S5, S6 non-normal | F = 4.22, p = 1.82×10⁻⁴ | S1 ≠ S5; S1 ≠ S8; S2 ≠ S5; S2 ≠ S6; S2 ≠ S7; S2 ≠ S8; S3 ≠ S5; S3 ≠ S8; S4 ≠ S5; S4 ≠ S8; S6 ≠ S8; S7 ≠ S8 |
| Oils and Grease (mg/L) | 0.93 ± 0.98 | 0.65 | 9.00 | S1–S8 mostly non-normal | F = 0.94, p = 0.479 | S4 ≠ S8 |
| Hydrogen Sulphide (mg/L) | 0.04 ± 0.12 | 0.01 | 0.91 | S1–S8 non-normal | F = 1.44, p = 0.194 | No significant differences |
| Biochemical Oxygen Demand – BOD (mg/L) | 2.95 ± 1.96 | 2.45 | 16.99 | S1–S8 non-normal | F = 0.30, p = 0.955 | No significant differences |
| Organic Matter (%) | 3.56 ± 2.62 | 2.65 | 13.82 | S1–S8 non-normal | F = 22.85, p = 2.56×10⁻²⁴ | S1 ≠ S2, S3, S4, S6, S7, S8; S2 ≠ S3, S4, S5, S6, S7, S8; S3 ≠ S4, S5, S6, S7, S8; S4 ≠ S5, S6, S7, S8; S5 ≠ S6, S7, S8; S6 ≠ S7, S8; S7 ≠ S8 |
Descriptive statistics, assumption tests, and multiple comparisons (Games–Howell) for sediment-related variables in Samanco Bay (2003–2019).
“non-normal” indicates p< 0.05 in the Shapiro–Wilk test for that station.
Water transparency showed moderate variability (mean 2.63 ± 1.28 m; range 0.70–12.00 m) and significant differences among stations (ANOVA, p = 1.82×10⁻⁴). Games–Howell post hoc comparisons indicated that S5, S7, and S8 consistently displayed lower transparency values relative to the remaining stations, reflecting areas with increased suspended particulate matter or localized sediment resuspension.
Oils and grease exhibited a wide concentration range (0.10–9.00 mg/L; mean 0.93 ± 0.98 mg/L) and predominantly non-normal distributions. Despite this variability, no significant spatial differences were detected (ANOVA, p = 0.479), with only a single contrast (S4 ≠ S8) identified by the Games–Howell test. This pattern indicates that increases in oils and grease occurred sporadically and did not follow a consistent spatial distribution.
Hydrogen sulphide concentrations were generally low (mean 0.04 ± 0.12 mg/L), although the broad range (0.0003–0.9078 mg/L) and non-normality reflected occasional development of reducing conditions. No significant differences were detected among stations (ANOVA, p = 0.194), suggesting that anoxic or suboxic episodes occurred sporadically throughout the bay.
BOD showed similarly high variability (0.25–17.24 mg/L; mean 2.95 ± 1.96 mg/L) with no significant spatial differences (ANOVA, p = 0.955), indicating that inputs of biodegradable organic matter occurred intermittently across the system.
In contrast, total organic matter (TOM) displayed the clearest spatial structure. TOM ranged from 0.26% to 14.08% (mean 3.56 ± 2.62%) and showed highly significant differences among stations (ANOVA, p = 2.56×10⁻²⁴). Multiple contrasts identified by the Games–Howell test confirmed marked heterogeneity in TOM distribution across the bay, with certain stations exhibiting substantially higher accumulation of organic material.
4 Discussion
The environmental analysis conducted between 2003 and 2019 revealed that Samanco Bay exhibited significant spatial and temporal variation in its physicochemical, microbiological, and sedimentary parameters. These differences, supported by robust statistical tests and multivariate analyses, demonstrated that the system operated under strong anthropogenic pressure, primarily associated with fish-processing activities, port operations, and the cultivation of Argopecten purpuratus, the flagship resource of the area Cisneros et al. (2008); Loayza-Aguilar et al. (2024).
Temperature variations, particularly significant among stations (F = 13.98, p< 0.0001), reflected stratification processes and limitations in water exchange with the open ocean. Such patterns are characteristic of semi-enclosed bays where hydrodynamic confinement amplifies the effects of human activities (Reyes-Velarde et al., 2023). Similarly, salinity exhibited meaningful differences (F = 9.05, p< 0.0001), indicating localized inputs that modify the bay’s internal structure, as previously documented in systems affected by industrial discharges and continental inflows Galarza Mora Wilmer et al. (2022).
Dissolved oxygen emerged as one of the most sensitive variables to environmental degradation. Its significant variability (F = 4.53, p< 0.001) and minimum values recorded near industrial sites suggest intensified remineralization of organic matter, a phenomenon commonly observed in bays with high accumulation of bio deposits from aquaculture and fish processing effluents Peralta-Guevara et al. (2025); Vidya et al. (2020). Regional studies note that declining oxygen in sediments and bottom waters is a precursor to hypoxic events, with direct consequences for benthic fauna and ecosystem resilience Guevara del Aguila (2022).
The absence of significant differences in total suspended solids (F = 0.47, p > 0.05) suggests that this parameter was driven more by hydrodynamic and meteorological processes than by point-source pollution, consistent with recent findings from coastal sediment studies in Latin America Phuong et al. (2024); Rios-Mendoza et al. (2021).
Principal Component Analysis provided conclusive evidence of the system’s internal structuring. PC1, explaining 21.5% of total variance, clearly separated surface waters characterized by higher oxygenation and transparency from deeper waters enriched in nutrients, BOD, sulphide, and organic matter. This pattern closely aligns with the behaviour of highly productive bays where stratification accelerates benthic deterioration while surface layers remain relatively stable Puente-Padilla et al. (2021); FAO (2024). PC2, associated with episodic variation in oils and suspended solids, reflected intermittent inputs likely linked to port traffic and fish processing.
From a microbiological perspective, total and thermotolerant coliforms showed strongly skewed distributions, with low medians (15) but extremely high peaks, confirmed by highly significant normality tests. This pattern arises from occasional discharges of urban or industrial wastewater, generating episodic microbiological contamination Guabloche et al. (2024); Puente-Padilla et al., 2021). The strong correlation (r = 0.78) between both indicators suggests a common contamination source, likely linked to human activity along the coastal boundary.
Sedimentary analysis, however, revealed the deepest and most persistent impacts. Organic matter showed highly significant differences (F = 22.85, p< 0.0001), reaching values above 13%, placing Samanco among the most organically enriched coastal systems in the region Parent et al. (2021). Such accumulation is typical of high-load trophic bays, where bio deposit sedimentation exceeds the system’s dispersal capacity, promoting anaerobic conditions and the occasional production of hydrogen sulphide, which reached 0.91 mg/L in some stations. These processes have been extensively described in eutrophication and benthic degradation models in coastal systems of Peru and the Caribbean Montoya Rosas et al. (2020); Peralta-Guevara et al., 2025).
Water transparency, also significantly different among stations (F = 4.22, p< 0.001), served as an indirect tracer of sediment resuspension and organic deposition. Its spatial variation indicates zones of greater sedimentary instability, possibly associated with aquaculture activity or vessel traffic Gomes et al. (2020).
Comparison with other global systems helps contextualize Samanco’s condition. Although it has not yet reached the critical deterioration observed in heavily industrialized bays of Asia or intensive aquaculture regions of Europe, the patterns of benthic degradation, sulphide presence, and vertical stratification are consistent with early to intermediate stages of ecological decline documented worldwide FAO (2024). This suggests that the bay is entering an ecological transition stage which without adequate management may evolve into a more severe structural degradation.
From a socioeconomic perspective, the evidence is particularly relevant given the importance of Argopecten purpuratus aquaculture in Samanco. Chronic organic matter accumulation and the potential onset of hypoxia can directly compromise the growth, survival, and quality of cultivated scallops, as recently documented in the same bay Loayza-Aguilar et al. (2024). Moreover, episodic microbiological contamination may threaten product safety and lead to economic losses among local producers.
Ultimately, these findings underscore the urgent need to implement integrated environmental management strategies. Continuous monitoring of bottom-water oxygen, regulation of carrying capacity, proper bio deposit management, and improved treatment of fish processing effluents constitute priority measures. Experiences from other Peruvian and Latin American coastal systems highlight that early intervention is essential to prevent irreversible degradation Guevara del Aguila (2022); Ibárcena Fernández, 2019).
5 Conclusions
The study demonstrated that Samanco Bay exhibited a clearly structured environmental gradient, in which surface waters retained a certain degree of ecological resilience, whereas the seafloor showed signs of chronic degradation. Significant differences in temperature, salinity, and dissolved oxygen, together with the elevated accumulation of organic matter in sediments, indicated that the system operated under persistent anthropogenic pressure primarily associated with aquaculture and fish-processing activities. These patterns suggested that benthic deterioration processes were already underway and that the ecosystem’s natural capacity for recovery had begun to be compromised.
The microbiological results showed that contamination by coliforms in the bay was not continuous but episodic, with peaks far exceeding baseline levels. This behaviour, reinforced by the strong correlation between total and thermotolerant coliforms, revealed common sources of contamination linked to human activities along the coastline and to occasional discharges of wastewater. The intermittent nature of these events posed potential sanitary risks for marine fauna and for aquaculture operations, particularly in areas located near industrial facilities.
The sediment analysis identified the most critical component of environmental degradation: the substantial accumulation of organic matter and the sporadic presence of hydrogen sulphide, both indicators of advanced anaerobic processes. These conditions revealed that the seafloor acted as a sink for organic residues whose accumulation exceeded the ecosystem’s natural dispersal capacity. Consequently, the bay exhibited early signs of transitioning toward a state of structural environmental degradation, underscoring the need to implement stricter environmental management measures and to establish operational limits aligned with the system’s real carrying capacity.
Statements
Data availability statement
The data analyzed in this study is subject to the following licenses/restrictions: The dataset used in this study is provided by official government institutions, specifically the Marine Institute of Peru (IMARPE) and the Ministry of Production (PRODUCE). Access to the dataset is granted upon formal request and authorization from the respective institutions. Therefore, the dataset is not publicly available but can be obtained with the necessary permissions. Requests to access these datasets should be directed to Marine Institute of Peru (IMARPE) and the Ministry of Production (PRODUCE).
Author contributions
VG: Conceptualization, Investigation, Methodology, Project administration, Resources, Writing – original draft. LT: Conceptualization, Formal Analysis, Supervision, Validation, Writing – review & editing. YA: Data curation, Investigation, Validation, Visualization, Writing – review & editing. JM: Validation, Writing – review & editing.
Funding
The author(s) declared that financial support was not received for this work and/or its publication.
Acknowledgments
The authors wish to thank their institution, their families, and colleagues for their valuable support throughout the development of this research.
Conflict of interest
The author(s) declared that this work was conducted in the absence of any commercial or financial relationships that could be construed as a potential conflict of interest.
Generative AI statement
The author(s) declared that generative AI was not used in the creation of this manuscript.
Any alternative text (alt text) provided alongside figures in this article has been generated by Frontiers with the support of artificial intelligence and reasonable efforts have been made to ensure accuracy, including review by the authors wherever possible. If you identify any issues, please contact us.
Publisher’s note
All claims expressed in this article are solely those of the authors and do not necessarily represent those of their affiliated organizations, or those of the publisher, the editors and the reviewers. Any product that may be evaluated in this article, or claim that may be made by its manufacturer, is not guaranteed or endorsed by the publisher.
References
1
APHA (1992a). APHA method 4500-P (Washington, DC, USA: Standard Methods for the Examination of Water and Wastewater).
2
APHA (1992b). APHA method 4500-S2 (Washington, DC, USA: Standard Methods for the Examination of Water and Wastewater).
3
APHA (1992c). Multiple-tube fermentation technique for members of the Coliform group. Washington (Washington, DC, USA: American Public Health Association).
4
APHA (2017). Method 2540D: Total suspended solids. In standard methods for the examination of water and wastewater (Washington, DC, USA: American Public Health Association).
5
Chávez Valdez M. Ramos López J. Huamán Alarcón L. (2020). Longitudinal and correlational approaches in environmental monitoring studies. Journal of Environmental Research and Public Health.17, 1–15. doi: 10.3390/ijerph17186543
6
Cisneros R. Bautista J. Argüelles J. (2008). Crecimiento comparativo de la concha de abanico (Argopecten Purpuratus) en sistemas suspendidos. Ecología Aplicada7, 81. doi: 10.21704/rea.v7i1-2.363
7
Devlin M. Smith A. Graves C. A. Petus C. Tracey D. Maniel M. et al . (2020). Baseline assessment of coastal water quality, in Vanuatu, South Pacific: Insights gained from in-situ sampling. Mar. pollut. Bull.160, 111651. doi: 10.1016/j.marpolbul.2020.111651
8
Elliott A. C. Hynan L. S. (2011). A SAS® macro implementation of a multiple comparison post hoc test for a Kruskal–Wallis analysis. Comput. Methods Programs BioMed.102, 75–80. doi: 10.1016/j.cmpb.2010.11.002
9
EPA 1664A (1999). Method 1664, revision a: N-Hexane extractable material (hem; oil and grease) and silica gel treated n-hexane extractable material (sgt hem; non-polar material) by extraction and gravimetry (Washington, DC, USA: United States: Environmental Protection Agency).
10
FAO (2024). Versión resumida de El estado mundial de la pesca y la acuicultura 2024 (Rome, Italy: Food and Agriculture Organization of the United Nations). doi: 10.4060/cd0690es
11
Galarza Mora Wilmer G. Beatriz P. S. Patricio Q. C. Patricio R. M. J. Andrés M. L. (2022). Evaluación de los Impactos al Recurso de Agua y Derivados de la Operación de una Central Termoeléctrica “Termogas Machala (Lima, Peru: Polo del Conocimiento 7).
12
Garg S. Chowdhury Z. Z. Faisal A. N. M. Rumjit N. P. Thomas P. (2022). Impact of industrial wastewater on environment and human health (Amsterdam, The Netherlands: Elsevier). 197–209. doi: 10.1007/978-3-030-83811-9_10
13
Gökkuş Z. Şentürk S. (2025). Fuzzy post-hoc tests and an application (Cham, Switzerland: Springer). 499–507. doi: 10.1007/978-3-031-98565-2_54
14
Gomes A. C. Alcântara E. Rodrigues T. Bernardo N. (2020). Satellite estimates of euphotic zone and Secchi disk depths in a colored dissolved organic matter-dominated inland water. Ecol. Indic110, 105848. doi: 10.1016/j.ecolind.2019.105848
15
Guabloche A. Alvariño L. Acioly T. M. da S. Viana D. C. Iannacone J. (2024). Assessment of essential and potentially toxic elements in water and sediment and the tissues of sciaena deliciosa (Tschudi 1846) from the coast of callao bay, Peru. Toxics12, 68. doi: 10.3390/toxics12010068
16
Guevara del Aguila José (2022). Evaluación de los indicadores de impacto ambiental por el vertimiento de los efluentes industriales pesqueros en la Bahía de Coishco-Perú-2018. Ciencia Latina Rev. Científica Multidisciplinar6, 2249–2272. doi: 10.37811/cl_rcm.v6i1.1646
17
Haro Sarango A. F. Chisag Pallmay E. R. Ruiz Sarzosa J. P. Caicedo Pozo J. E. (2024). Tipos y clasificación de las investigaciones. LATAM Rev. Latinoamericana Cienc. Sociales y Humanidades5:114765. doi: 10.56712/latam.v5i2.1927
18
Henares M. N. P. Medeiros M. V. Camargo A. F. M. (2020). Overview of strategies that contribute to the environmental sustainability of pond aquaculture: rearing systems, residue treatment, and environmental assessment tools. Rev. Aquac12, 453–470. doi: 10.1111/raq.12327
19
Ibárcena Fernández W. (2019). Estudio de la contaminación por metales pesados en las costas de Tacna - Perú. Ciencia Desarrollo178, 113–118. doi: 10.33326/26176033.2007.11.238
20
Inostroza P. A. Soriano Y. Carmona E. Krauss M. Brack W. Backhaus T. et al . (2024). Preliminary dataset of emerging contaminants in surface water, bottom water, porewater, and sediment: Urban and aquaculture impacts in Coliumo bay and Caucahue Channel in the central and southern coast of Chile. Data Brief55, 110593. doi: 10.1016/j.dib.2024.110593
21
Lascano-Arias G. Cuesta-Andaluz E. Espinosa-Pinos C. A. (2025). Suicide risk and social support in young Ecuadorian women victims of violence: A psychosocial and educational analysis. J. Educ. Soc. Res.15, 22. doi: 10.36941/jesr-2025-0119
22
Loayza-Aguilar R. E. Carhuapoma-Garay J. Ramos-Falla K. Saldaña-Rojas G. B. Huamancondor-Paz Y. P. Campoverde-Vigo L. et al . (2024). Epibionts affect the growth and survival of Argopecten purpuratus (Lamarck 1819) cultivated in samanco bay, Peru. Aquaculture578, 740042. doi: 10.1016/j.aquaculture.2023.740042
23
Mamani Larico A. J. Rendón Dávila V. O. Figueroa Tapia Á.M. Quiroz Valdivia J. Zúñiga Medina S. A. (2021). Bioenergetic and water quality modeling for eutrophication assessment of El Pañe Reservoir, Peru. Ecohydrology Hydrobiology21, 114–128. doi: 10.1016/j.ecohyd.2020.08.004
24
Mangan S. Lohrer A. M. Thrush S. F. Ellis J. I. Pilditch C. A. (2022). The effects of long-term nitrogen enrichment on estuarine benthic-pelagic coupling. J. Mar. Sci. Eng.10, 1955. doi: 10.3390/jmse10121955
25
Montoya Rosas E. D. V. Rosas Cabrera J. A. Rincones León R. E. Narváez Rodríguez J. L. (2020). Evaluación del crecimiento de Eucheuma isiforme (Rhodophyta, Gigartinales) en sistemas de cultivo suspendidos en la isla de Cubagua, Venezuela (sureste del Mar Caribe). AquaTechnica: Rev. Iberoamericana Acuicultura.2, 86. doi: 10.33936/at.v2i2.2678
26
Parent B. Hyams-Kaphzan O. Barras C. Lubinevsky H. Jorissen F. (2021). Testing foraminiferal environmental quality indices along a well-defined organic matter gradient in the Eastern Mediterranean. Ecol. Indic125, 107498. doi: 10.1016/j.ecolind.2021.107498
27
Peralta-Guevara D. E. Quispe-Quispe Y. Palomino-Malpartida Y. G. Aronés-Medina E. G. Correa-Cuba O. Aróstegui León E. et al . (2025). A high andean lake: A current look at anthropogenic activities and water quality. Water (Basel)17, 1182. doi: 10.3390/w17081182
28
Phuong N. N. Duong T. T. Pham Q. T. Ngo T. X. T. Nguyen T. M. D. Phuong N. A. et al . (2024). Anthropogenic particle abundance and characteristics in seawater and intertidal sediments of the Tonkin Bay Coast (North Vietnam). Environ. Monit Assess.196, 514. doi: 10.1007/s10661-024-12674-3
29
Puente-Padilla G. Quintana-Zambrano G. R. González-Bedoya J. P. (2021). Contaminación marina, un enfoque desde el contexto latinoamericano. Rev. Científica Investigación Multidisciplinaria Arbitrada SCIENTIA3, 15–22. doi: 10.46296/sc.v3i6.0018
30
Ramsey P. H. Ramsey P. P. (2009). Power and Type I errors for pairwise comparisons of means in the unequal variances case. Br. J. Math. Stat. Psychol.62, 263–281. doi: 10.1348/000711008X291542
31
Reyes-Velarde P. M. Alonso-Rodríguez R. Domínguez-Jiménez V. P. Calvario-Martínez O. (2023). The spatial distribution and seasonal variation of the trophic state TRIX of a coastal lagoon system in the Gulf of California. J. Sea Res.193, 102385. doi: 10.1016/j.seares.2023.102385
32
Rios-Mendoza L. M. Ontiveros-Cuadras J. F. Leon-Vargas D. Ruiz-Fernández A. C. Rangel-García M. Pérez-Bernal L. H. et al . (2021). Microplastic contamination and fluxes in a touristic area at the SE Gulf of California. Mar. pollut. Bull.170, 112638. doi: 10.1016/j.marpolbul.2021.112638
33
Sciberras M. Dingli A. (2023). Quantitative research (London, United Kingdom: Routledge). 43–115. doi: 10.1007/978-3-031-19900-4_11
34
Syms C. (2019). “ Principal components analysis,” in Encyclopedia of ecology (Cambridge, United Kingdom: Elsevier), 566–573. doi: 10.1016/B978-0-12-409548-9.11152-2
35
Tapia-Ugaz L. D. R. Nizama O. Arteaga C. Chunga J. Chipana G. Refulio M. (2022). Caracterización biológica de los organismos incrustantes en sistemas de cultivo suspendido de <i<Argopecten purpuratus</i< en bahía Samanco (Ancash, Perú). Caldasia44, 567–582. doi: 10.15446/caldasia.v44n3.91786
36
Ucros-Rodríguez S. Araque-Romany F. Montero-Mendoza L. Sarmiento-Nater V. C. Calvo-Carrillo O. M. Johnson-Restrepo B. et al . (2025). Analysis of pollutant accumulation in the invasive bivalve perna viridis: current status in the Colombian caribbean 2020–2023. Toxics13, 77. doi: 10.3390/toxics13020077
37
Vidya V. Prasad G. Sheela A. M. (2020). Assessment of threats to a Ramsar site from seafood processing operation effluents. Lakes Reservoirs: Science Policy Manage. Sustain. Use25, 196–213. doi: 10.1111/lre.12321
Summary
Keywords
aquaculture, coastal environmental management, industrial fishing, marine biodiversity, marine pollution
Citation
García-Nolazco V, Torres-Cabrera L, Avalos-Ramírez Y and Medina-Moreno J (2026) Effects of pollution generated by fish processing and aquaculture activities on the marine ecosystem of Samanco Bay. Front. Mar. Sci. 13:1706798. doi: 10.3389/fmars.2026.1706798
Received
16 September 2025
Revised
03 January 2026
Accepted
05 January 2026
Published
28 January 2026
Volume
13 - 2026
Edited by
Pablo Muniz, University of the Republic, Uruguay
Reviewed by
Periyadan K Krishnakumar, National Center for Wildlife (Saudi Arabia), Saudi Arabia
Dilip Kumar Jha, National Institute of Ocean Technology, India
Updates
Copyright
© 2026 García-Nolazco, Torres-Cabrera, Avalos-Ramírez and Medina-Moreno.
This is an open-access article distributed under the terms of the Creative Commons Attribution License (CC BY). The use, distribution or reproduction in other forums is permitted, provided the original author(s) and the copyright owner(s) are credited and that the original publication in this journal is cited, in accordance with accepted academic practice. No use, distribution or reproduction is permitted which does not comply with these terms.
*Correspondence: Luis Torres-Cabrera, ltorres@uns.edu.pe
Disclaimer
All claims expressed in this article are solely those of the authors and do not necessarily represent those of their affiliated organizations, or those of the publisher, the editors and the reviewers. Any product that may be evaluated in this article or claim that may be made by its manufacturer is not guaranteed or endorsed by the publisher.