Abstract
River plumes are important parts of the land–ocean matter fluxes and provide the key stage of transformation of river discharge and river-borne matter in the sea. However, both the plume-sea mixing budget and the ultimate fate of continental discharge in the open sea remain poorly understood. In this study, we analyze the GLORYS12 ocean reanalysis data to assess structure and variability of the 10 largest river plumes in the World Ocean. We quantify the interrelated characteristics of plume-sea interaction, namely, (1) response of a river plume to variability of river discharge, (2) residence time of river water in a river plume, (3) mixing intensity at plume-sea frontal zone. Based on these characteristics, we distinguish three different types of large river plumes in relation to their horizontal advection and vertical mixing with ambient seawater. The opposite ends of this classification are illustrated by the Amazon plume, which is shallow and occupies wide area due to reduced vertical mixing, and the Changjiang and St. Lawrence plumes, which have deep penetration, albeit small area due to strong vertical mixing near the river mouths. Our results aim to contribute to our understanding of how river discharge merges with and alters ambient shelf and ocean waters. It provides new insights into the spreading and mixing patterns of river plumes formed by diverse river systems.
1 Introduction
River plumes are freshened water masses, which are formed at sea surface layer as a result of mixing of river discharge and saline seawater (Osadchiev and Yankovsky, 2022). Sharp density gradient separates river plumes and surrounding seawater. The dynamics of surface motion of a river plume is controlled by this density gradient (Horner-Devine et al., 2015). Generally, river plumes have large areas, but small depths. Area of a river plume exceeds its thickness by 3–5 orders of magnitude, therefore, even small rivers (with flow rates of several m3/s) form river plumes with spatial extents of tens and hundreds of meters (Romero et al., 2016; Zhao et al., 2018; Basdurak et al., 2020; Osadchiev et al., 2020; 2021c; Basdurak and Largier, 2022), while spatial extents of river plumes formed by the largest World rivers are equal to hundreds of kilometers (Kang et al., 2013; Osadchiev et al., 2021a; 2021b; 2023; Pargaonkar and Vinayachandran, 2021; Martins and Stammer, 2022; Morozov et al., 2024; Zavialov et al., 2015; Zavialov et al., 2024). Thus, although the global continental runoff is small as compared to the shelf seawater volume, river plumes in total seasonally cover 7–21% of the World Ocean shelf area that exceeds several million square kilometers (Kang et al., 2013).
River plumes serve as dynamic interfaces mediating exchanges between land and ocean. The river runoff is an important source of buoyancy, heat, terrigenous suspended sediments, nutrients, and anthropogenic pollution for the World Ocean (Tao et al., 2021; Clark et al., 2022; Hou et al., 2024; Ferchiche et al., 2024). River plumes are transitional water masses between river runoff and seawater, therefore, they govern transformation and redistribution of fluvial water, as well as river-borne dissolved and suspended matter (Torregroza-Espinosa et al., 2020; Lemos et al., 2022; Ody et al., 2022; Wu et al., 2023). As a result, river plumes significantly affect many physical, biological, and geochemical processes in the sea, including stratification, coastal and shelf circulation, carbon and nutrient cycles, primary production, seabed morphology, etc (Kang et al., 2024; Korotenko et al., 2014; Osadchiev et al., 2016; Baird et al., 2021; Zhou et al., 2023).
Physical processes in river-estuary-plume-sea continuum received large attention during the last decades. Previous research provided the general concept of transport and mixing processes in estuaries (MacCready and Geyer, 2010; Geyer and MacCready, 2014; Burchard et al., 2018) and river plumes (Yankovsky and Chapman, 1997; Lentz and Fewings, 2012; Horner-Devine et al., 2015). However, there are still significant gaps in understanding of many processes that determine structure, dynamics, and variability of river plumes, as well as influence of freshwater discharge on processes in coastal sea. The main reason for the existing gaps in the knowledge about river plumes consists in the fact that the majority of previous studies were focused on individual river plumes and/or specific areas in these river plumes. A few studies and a few river plume systems were explicitly studied from their formation in river estuary to their final dissipation in open sea. This is especially true for large plumes due to their vast spatial extents and the difficulty of in situ measurements over these wide regions. This is a principal limitation because still there is no general framework that sufficiently explains the relationship between plume forcing and mixing in various plume regions (Horner-Devine et al., 2015).
Moreover, the modern state of knowledge about river plumes lacks intercomparison of processes between different river plume systems. River plumes and estuaries have wide variety of spatial scales and regional features. Therefore, it is important to study them in different geographical regions. In particular, many previous studies reported dimensionless numbers, i.e., parameterizations of certain spreading and mixing processes in river plumes, which are believed to have general applicability (Garvine, 1987; Geyer et al., 2000; Nof and Pichevin, 2001; Fong and Geyer, 2002; Hetland, 2005; Nash et al., 2009; Kilcher and Nash, 2010; Pimenta and Kirwan, 2014; Mazzini and Chant, 2016; Yuan et al., 2023). However, very often these results developed for a specific river plume could not be applied to the other river plumes in the other regions. In particular, recent studies demonstrated principal differences in structure and dynamics of small and large river plumes (Osadchiev et al., 2020; 2021c; Basdurak and Largier, 2022). Therefore, it is necessary to consider different spatial and temporal scales of transformation of river runoff in the sea and distinguish the obtained regional results for specific river plumes in context of these scales.
In this study, we aim to provide comprehensive analysis of structure and seasonal variability of river plumes formed by 10 largest rivers (in terms of annual discharge) that inflow to the World Ocean (Figure 1). These rivers, namely, Amazon, Ganges–Brahmaputra, Congo, Orinoco, Ob–Yenisei, Changjiang, Rio de la Plata (Parana and Uruguay), Mississippi, Lena, and St. Lawrence provide approximately 1/3 of the total freshwater discharge to the World Ocean. First, we determine and compare areas, volumes, horizontal and vertical structure of the considered river plumes. Second, we reveal the relation of seasonal variability of these river plumes on river runoff variability. Third, we assess intensity of water exchange across the plume-sea fronts and the related residence time of river water in the river plumes in relation to local oceanographic conditions.
Figure 1
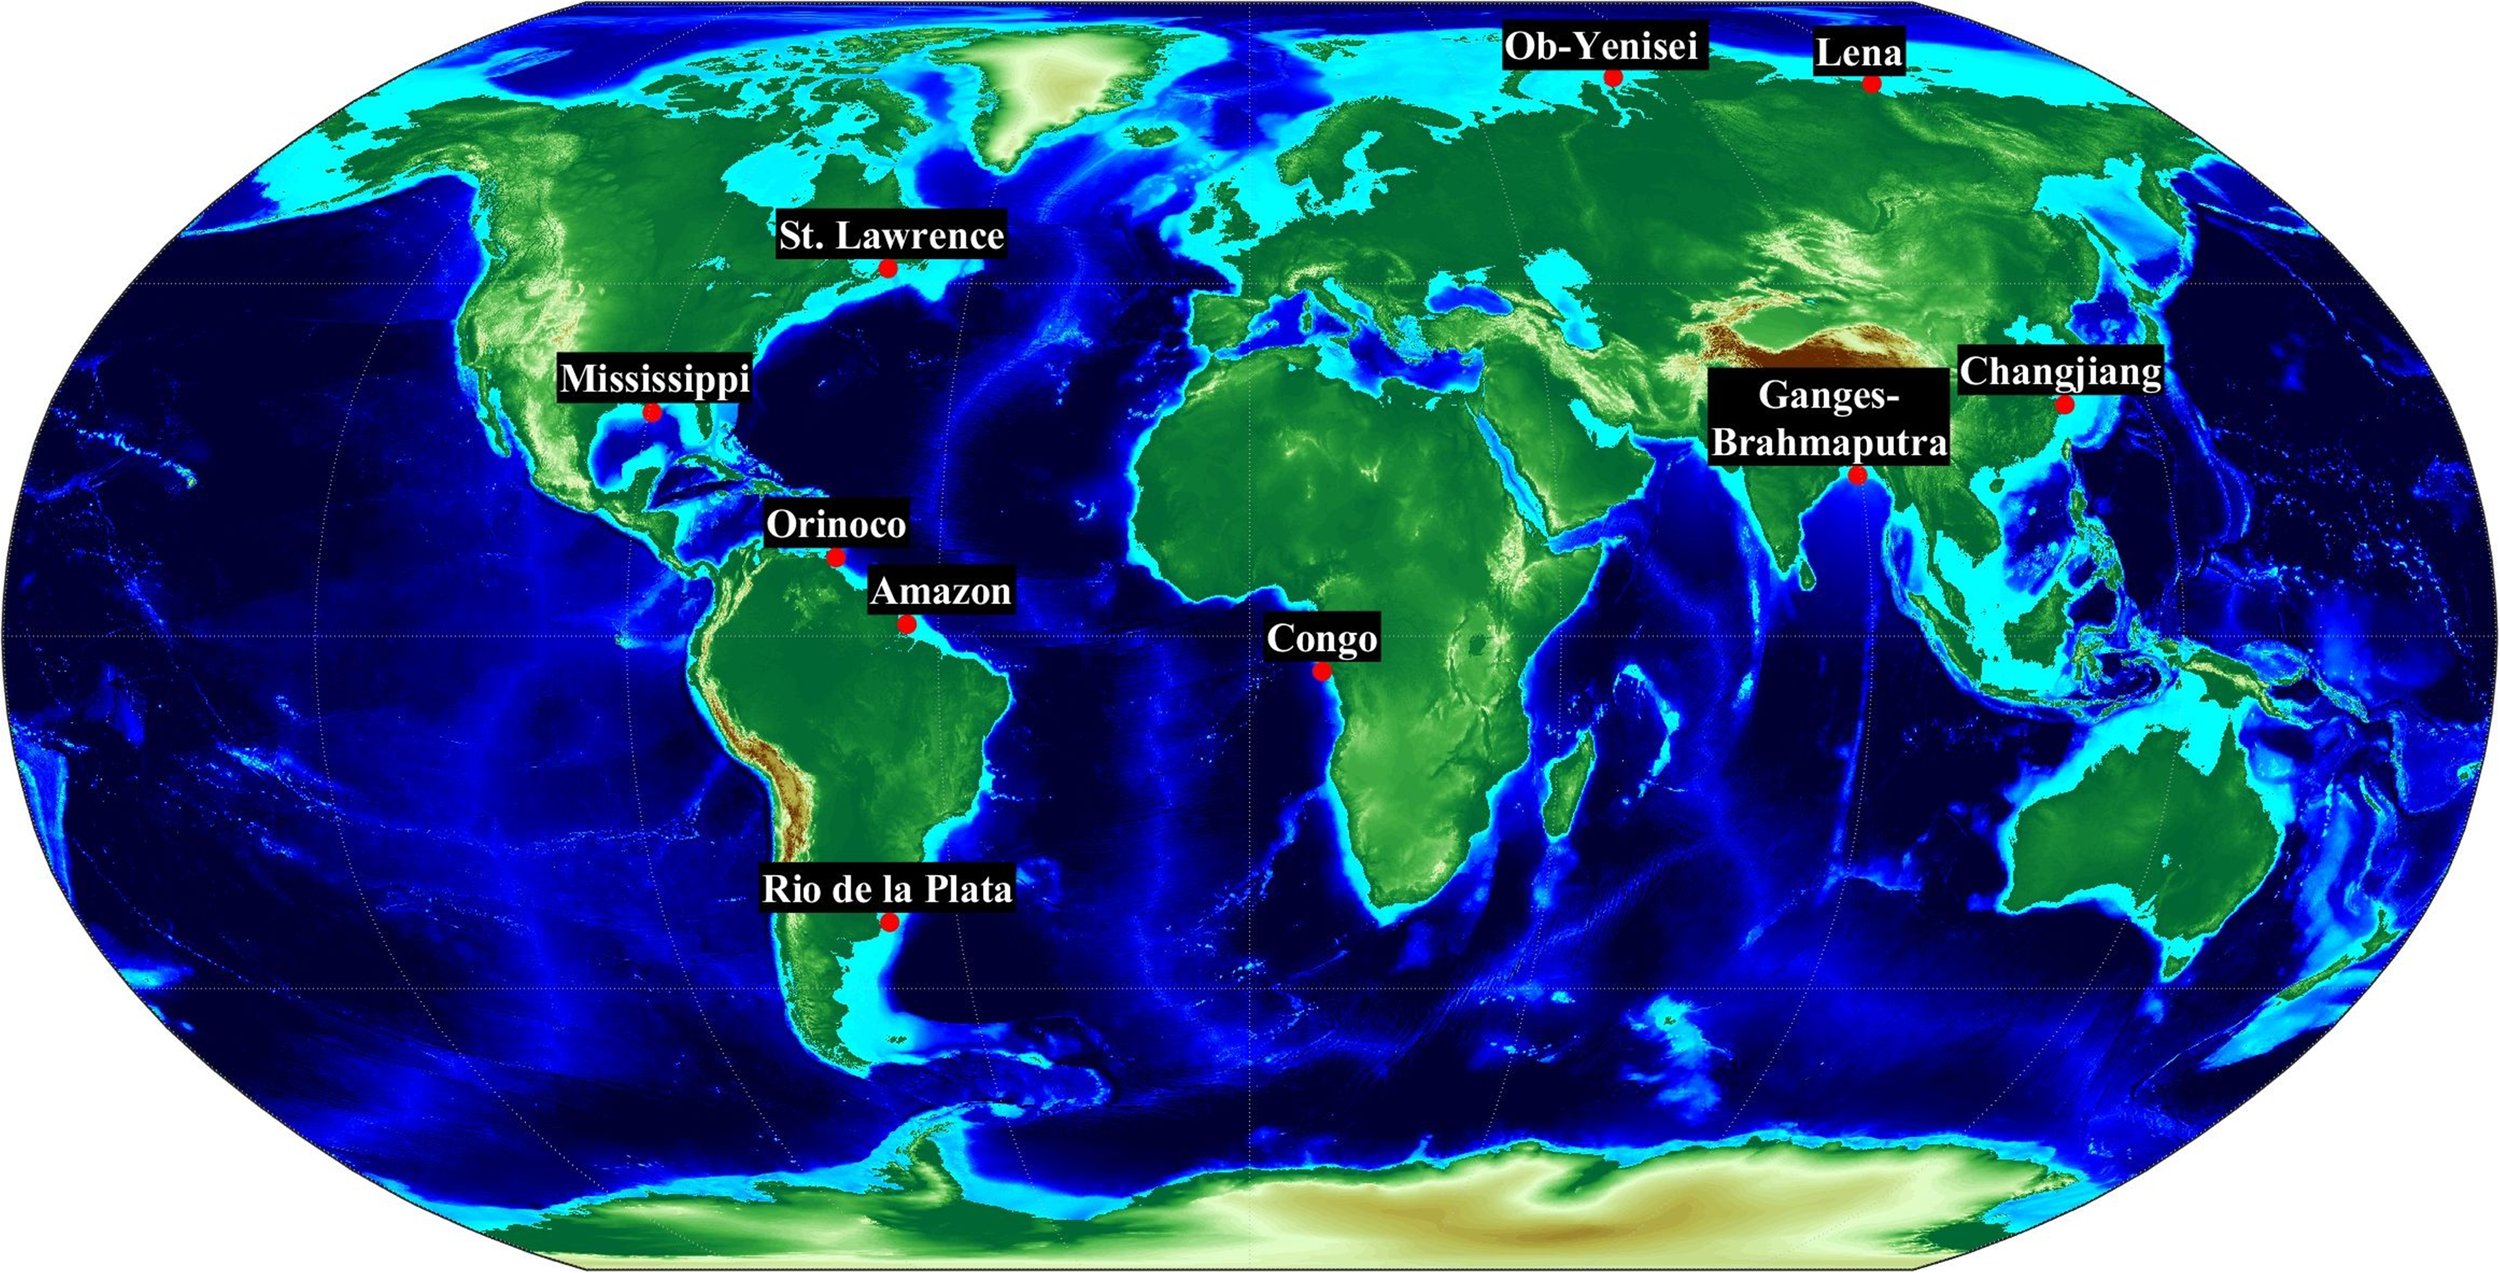
Location of mouths of 10 largest rivers that inflow to the World Ocean.
2 Methods
This study is based on the monthly CMEMS GLORYS12v1 ocean reanalysis data, which provides global coverage with 1/12° spatial resolution and daily temporal resolution. We consider reduced salinity in sea surface layer adjacent to river mouths as the main proxy of river plumes. The considered river plumes are located at different latitudes, namely, equatorial (Amazon, Congo, Orinoco), tropical (Ganges–Brahmaputra, Changjiang, Mississippi), moderate (Rio de la Plata, St. Lawrence), and polar (Ob–Yenisei, Lena) (Figure 1). Additionally, horizontal salinity fields from the NASA SMAP Level-3 satellite data with spatial resolution of 0.25°, as well as vertical in situ salinity profiles from Argo floats and shipborne observations (Osadchiev et al., 2021a; 2021b), were employed for comparison with the reanalysis data. It is important to recognize that both global reanalysis datasets and satellite salinity observations have reduced accuracy near the coast due to limitations of model parameterizations and capabilities of satellite radiometers. River discharge data was obtained from Global Runoff Data Centre, Arctic Great Rivers Observatory, Bangladesh Water Development Board, Changjiang Water Resources Commission, Argentine Undersecretariat for Water Resources repositories and GloFAS-ERA5 operational global river discharge reanalysis (Harrigan et al., 2020) (Table 1). The study period covers 20 years from 1993 till 2022. River discharge data used in this study are obtained from multiple observational sources, providing realistic seasonal variability. While the CMEMS GLORYS12v1 reanalysis prescribes river forcing from a climatological dataset (Dai, 2021), it has good consistency with average seasonal cycle calculated from river discharge data described above.
Table 1
| River | Gauge station | Measurement period | Average annual runoff, km3 | Data source |
|---|---|---|---|---|
| Ob–Yenisei | Salekhard and Igarka | 01.01.1993-31.01.2022 | 900 | https://arcticgreatrivers.org |
| Lena | Kyusyur | 01.01.1993-31.12.2022 | 780 | |
| St. Lawrence | Lasalle | 01.01.1993-31.12.2021 | 430 | https://portal.grdc.bafg.de |
| Changjiang | Datong | 01.01.2004-31.01.2022 | 1020 | https://portal.grdc.bafg.de |
| Mississippi | Vicksburg | 01.01.1993-31.12.2021 | 500 | https://portal.grdc.bafg.de |
| Ganges–Brahmaputra | Hardinge Bridge and Bahadurabad | 01.01.1993-31.12.2022 | 1060 | http://www.hydrology.bwdb.gov.bd |
| Orinoco | Puente Angostura | 01.01.1993-31.12.2009 | 770 | https://portal.grdc.bafg.de |
| Amazon | Obidos | 01.01.1993-31.12.2019 | 3930 | |
| Congo | Kinshasa | 01.01.1993-31.12.2010 | 1190 | |
| Rio de la Plata | Tunel Subfluvial and Paso de los Libres | 01.01.1993-31.01.2020 | 700 | https://snih.hidricosargentina.gob.ar |
Discharge data of 10 largest rivers that inflow to the World Ocean.
First, we analyzed seasonal variability of sea surface salinity at areas adjacent to the river mouths. We determined location of horizontal and vertical plume-sea borders as the zones with maximal salinity gradients. Once the borders were determined, we calculated and analyzed average values and seasonal variability of areas and volumes of the considered river plumes. Volumes of the river plumes were compared with the river discharge volumes, which is indicative of residence time of river water in the river plumes.
Second, we analyzed monthly averaged variability of vertical salinity distribution at certain points with depths >50 m near the river mouths (Figure 2). It provided information about the seasonal variability of the vertical river plume structure and its dependence on the seasonal river discharge cycle. These points were selected in offshore areas, away from the influence of estuarine processes and interaction with seabed on the river plumes. For several river plumes (Amazon, St. Lawrence, Ob–Yenisei, Lena) these points were located rather far from the river mouths (200–350 km), because these rivers inflow to wide shelf areas with shallow depths. Comparison of vertical salinity distribution at the considered river plumes provided the basis for assessment of the plume-sea mixing intensity and detection of the main local mixing mechanisms. It should be noted that the GLORYS12v1 reanalysis data used in this study do not contain explicit tidal signals, however, tides are among the main processes that govern plume-sea mixing. Tidal effects on the vertical structure of the river plumes are represented through baroclinic tidal mixing, which are included in GLORYS12v1 by mixing parameterization (Lavergne et al., 2016).
Figure 2
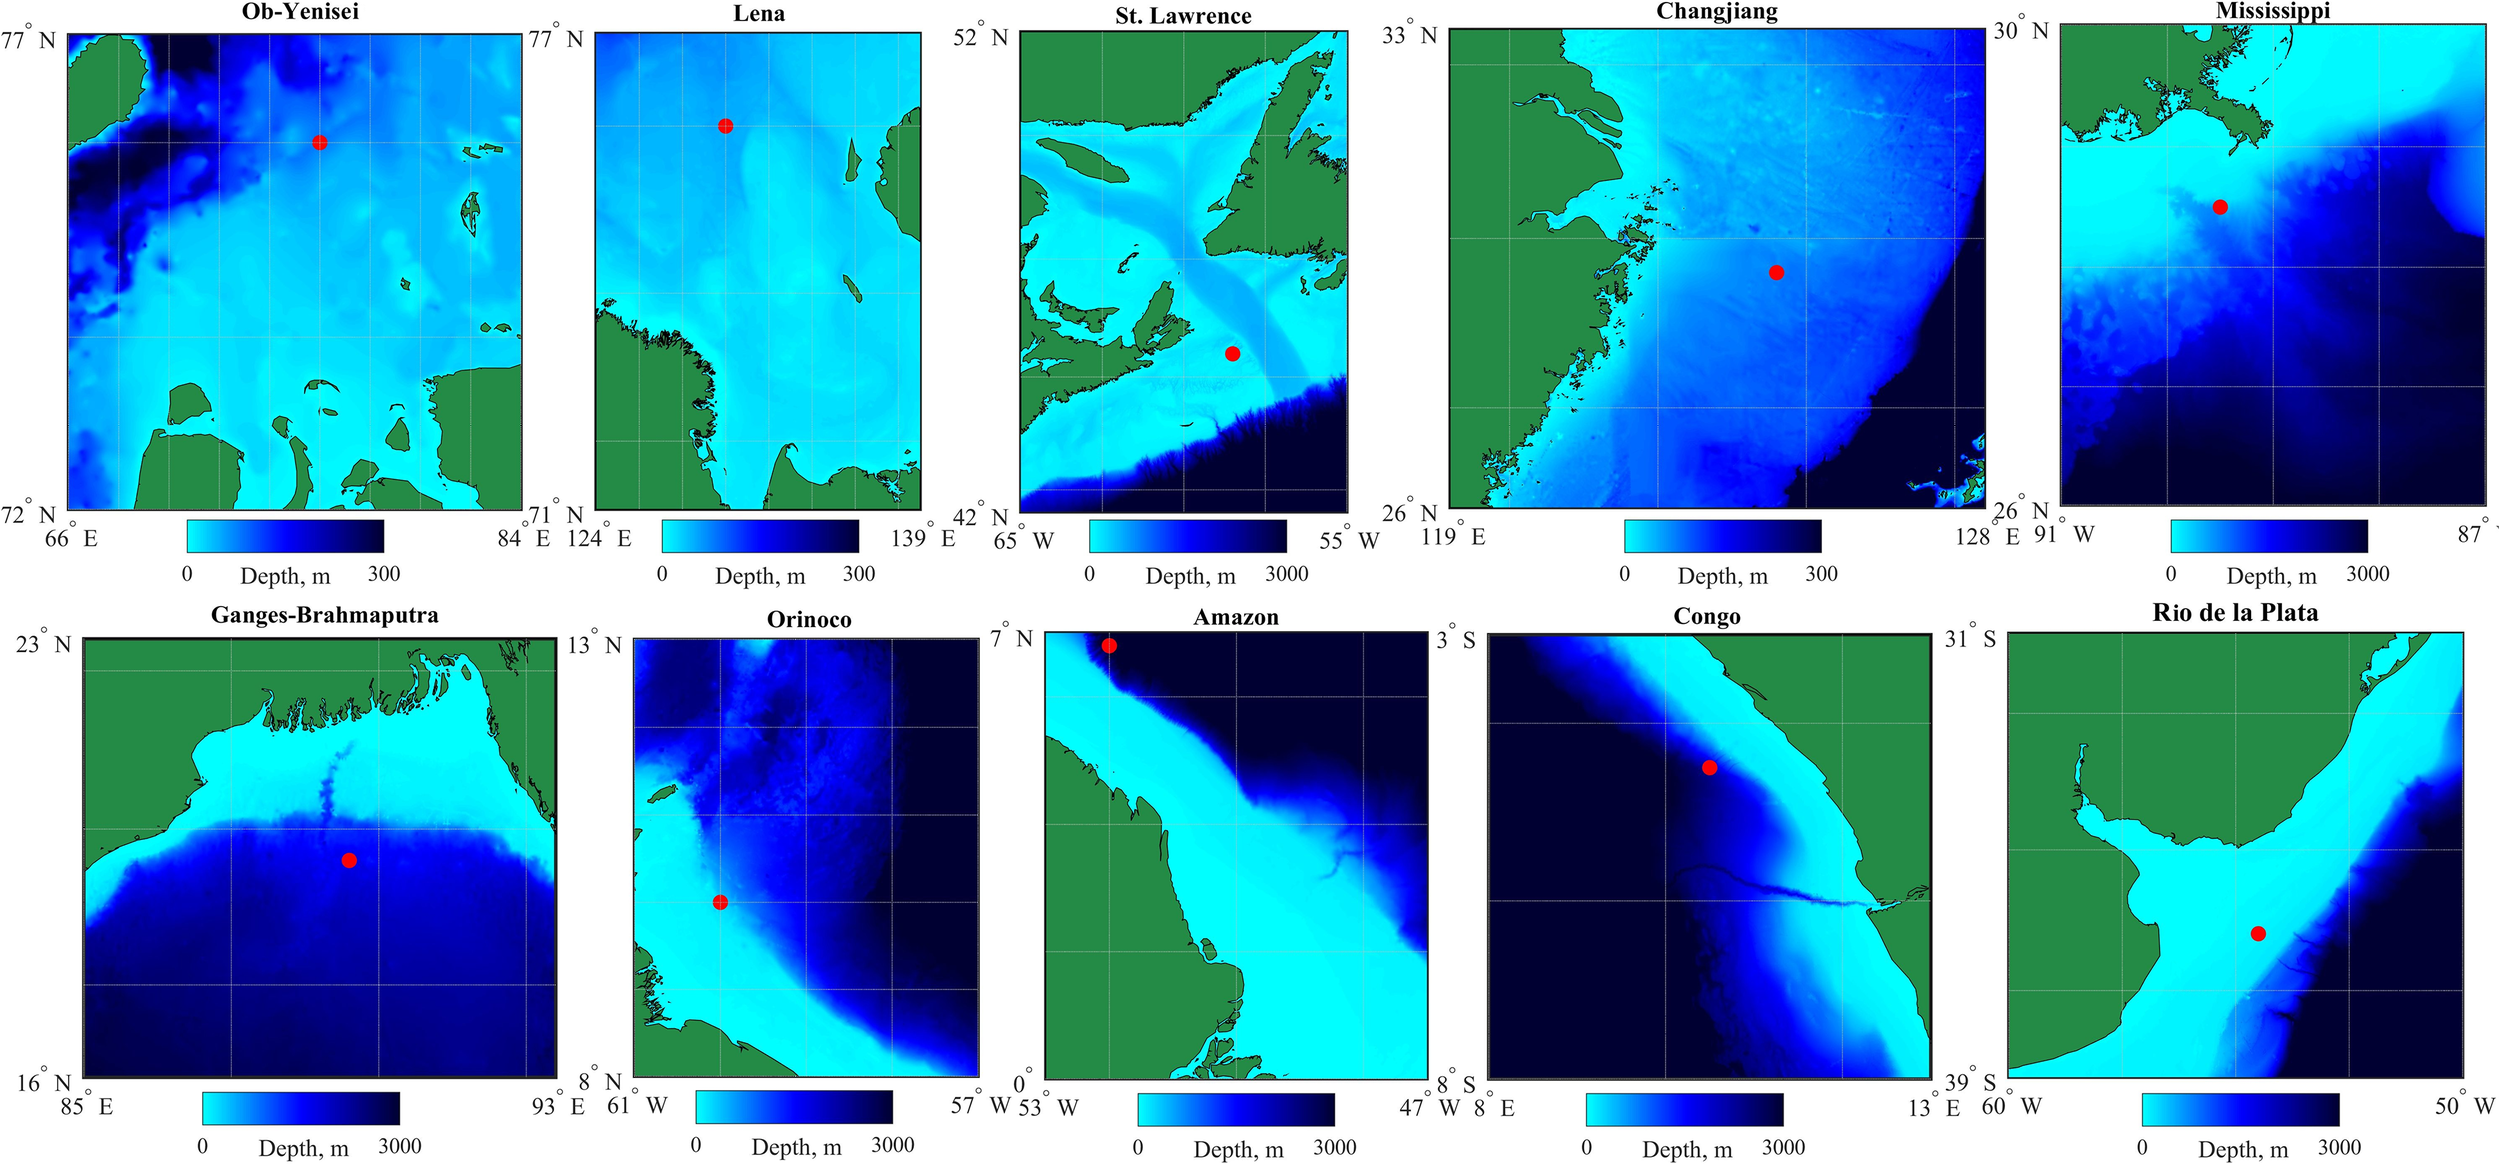
Bathymetry near the mouths of 10 largest rivers that inflow to the World Ocean. Red circles indicate points in GLORYS12 ocean reanalysis used for analysis of seasonal variability within the river plumes.
3 Results
3.1 Horizontal salinity structure of large river plumes
Analysis of sea surface salinity near the mouths of 10 largest rivers that inflow to the World Ocean is indicative of areas and positions of the related river plumes (Figure 3). Distinct areas of reduced surface salinity (<30 psu) are observed near all considered river mouths indicating spreading areas of the largest river plumes in the World Ocean. Once we determine the outer plume border by the maximal horizontal gradient for salinities between 25 psu and 30 psu (shown by the black lines in Figure 3), we could evaluate spatial extents and areas of these plumes.
Figure 3
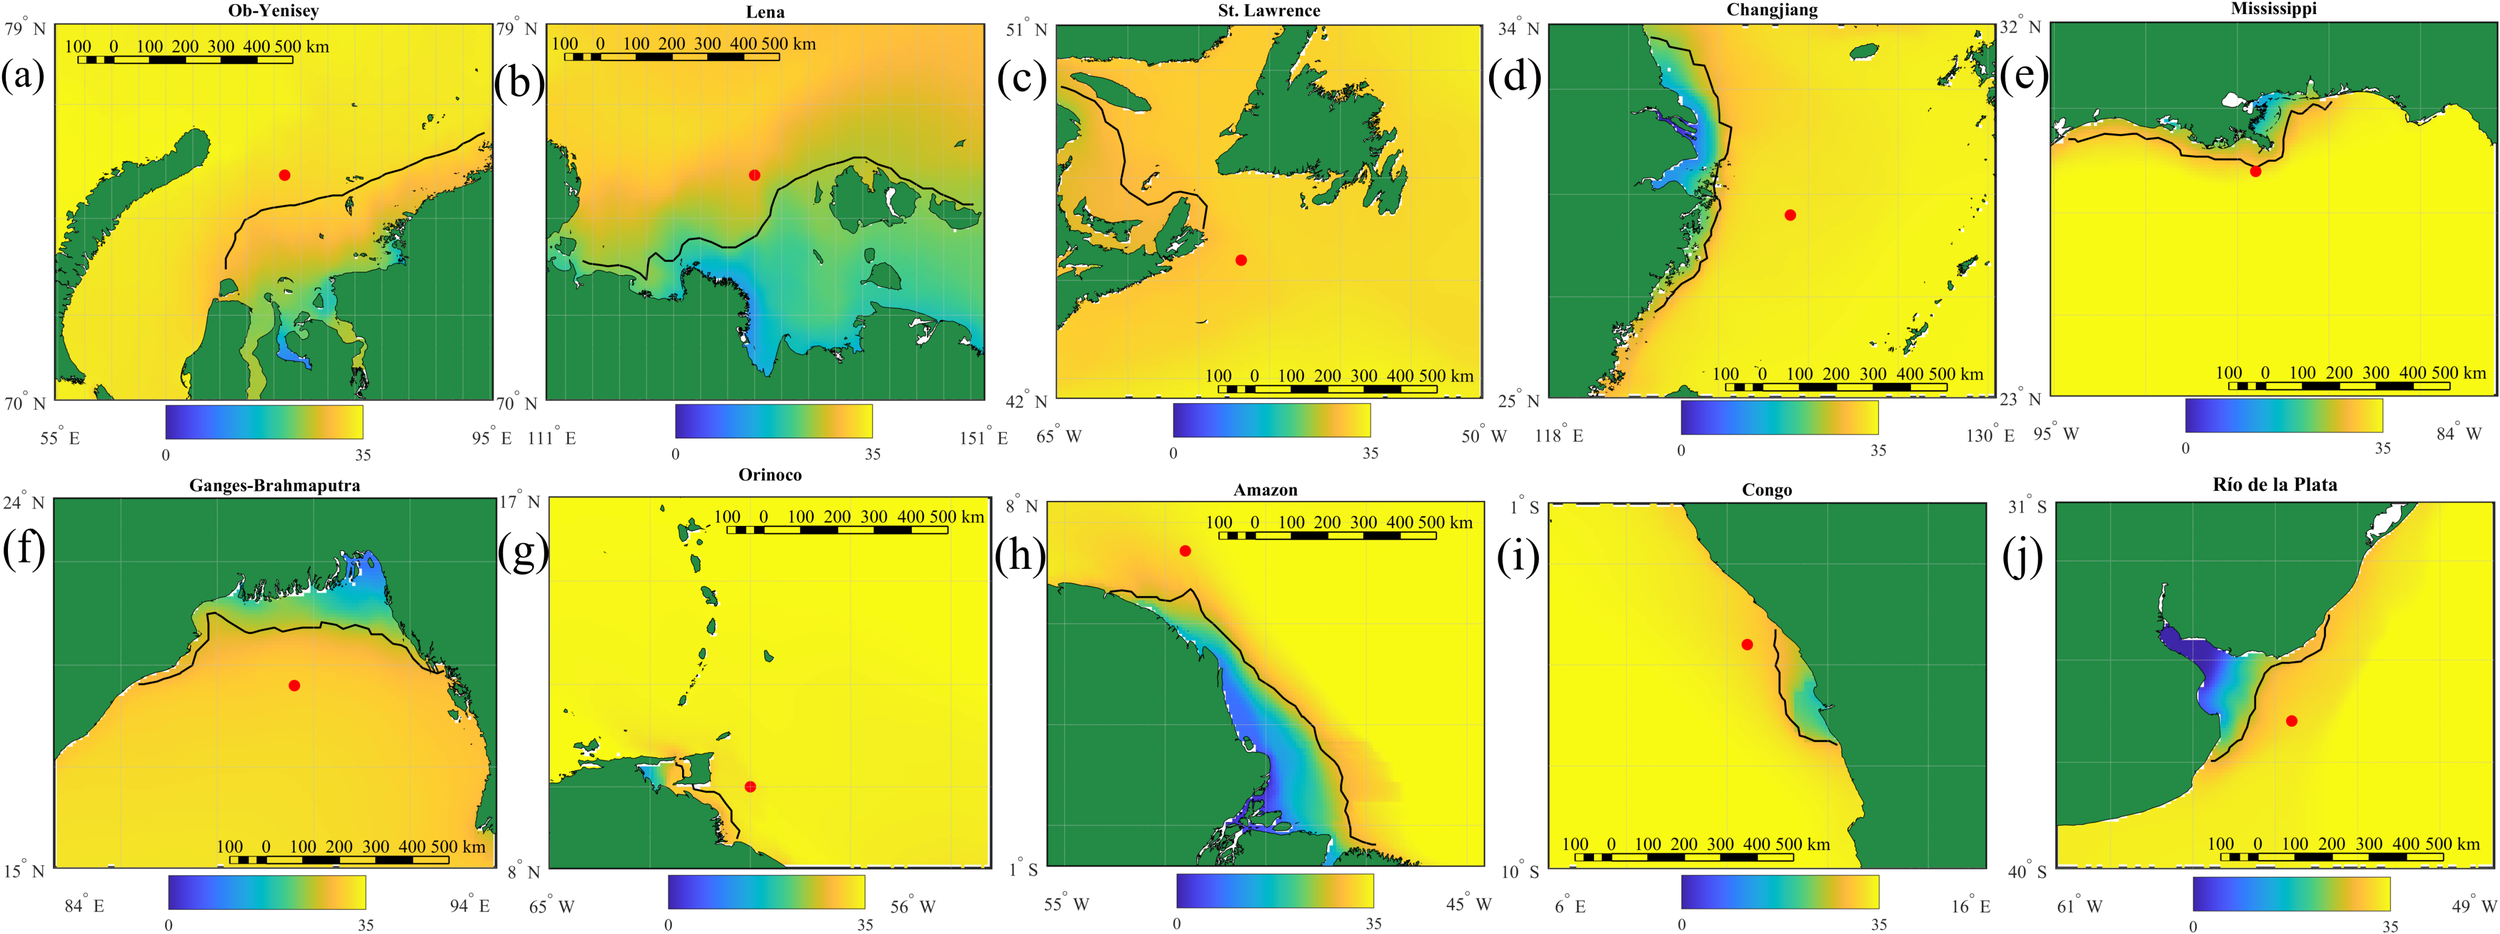
Surface salinity distribution near mouths of 10 largest rivers according to CMEMS GLORYS12v1 reanalysis data averaged for 1993-2022: (a) Ob–Yenisei, (b) Lena, (c) St. Lawrence, (d) Changjiang, (e) Mississippi, (f) Ganges–Brahmaputra, (g) Orinoco, (h) Amazon, (i) Congo, (j) Rio de la Plata. The black line indicates the horizontal boundary of the river plumes at the maximal values of salinity gradient. The red circles indicate points used for analysis of seasonal variability within the river plumes.
The Amazon and Lena plumes have the largest areas among all river plumes in the World Ocean. The northward spreading distance of the Amazon plume from the river mouth along the coast varies between 500 and 1200 km. Area of the Amazon plume changes from 150,000 km2 in December-January to 550,000 km2 in June-July. Seasonal variability of the Lena plume is even more pronounced. Average area of the Lena plume increases from 80,000 km2 in December-April to 350,000 km2 in August-October, in autumn its average eastward extent reaches 800 km. The Ob–Yenisei and Ganges–Brahmaputra plumes also have large areas, albeit their spatial extents are much less as compared to the Amazon and Lena plumes. The outer borders of these river plumes are located at the distances of 300–500 km from the river mouths. Seasonal variability of the Ob–Yenisei plume area is from 40,000 km2 in December-April to 150,000 km2 in August-October. Seasonal variability of the Ganges–Brahmaputra plume area is from 100,000 km2 to 260,000 km2.
The Congo, Changjiang, and Mississippi plumes are localized near the river deltas, while the Rio de la Plata plume occupies the wide river estuary. Spatial extents of these plumes are generally similar and equal to 100–200 km. The seasonal variability of these plumes varies from 25,000 to 70,000 km2. Area of the Changjiang plume is relatively stable during the whole year (40,000-60,000 km2). The St. Lawrence and Orinoco plumes are the smallest among the considered river plumes. Despite large freshwater discharge, both rivers do not form distinct low-saline areas adjacent to the river mouths. In particular, surface salinities near the Orinoco Delta and in the Gulf of St. Lawrence (that connects the St. Lawrence estuary with the Atlantic Ocean) are 29–30 psu. In this case, seasonal variability of the St. Lawrence and Orinoco plumes is low, maximal areas of these plumes are 7,000 and 13,000 km2.
A comparative analysis of the CMEMS GLORYS12v1 reanalysis and the multi-year satellite-derived sea surface salinity fields obtained from the SMAP satellite data (Figure 4) demonstrates generally consistent representation of spatial characteristics of the largest river plumes in the World Ocean. The best agreement is observed for the Amazon and Lena plumes. According to SMAP data, the Amazon plume occupies approximately 500,000 km², whereas the Lena plume extends over an area of 300,000 km² on average, which is in a good correspondence with the reanalysis-based estimates of their maximal spreading areas. Good agreement in spatial patterns is also observed for the Ob–Yenisei, Ganges–Brahmaputra, Congo, and Rio de la Plata plumes. However, the areas of these river plumes derived from SMAP data are 5–15% smaller than those derived from the reanalysis data. The discrepancy arises mainly from the coarse spatial resolution of satellite salinity products (1/4°) as compared to reanalysis products (1/12°) and their limited ability to accurately resolve estuarine regions and coastal zones. The discrepancy between these two datasets becomes more evident in case of river plumes with smaller spatial scales, such as the Changjiang, Mississippi, and Orinoco plumes. Differences in surface salinity values between the SMAP and GLORYS12v1 data follow the similar pattern. For the largest river plumes, mean surface salinity values derived from satellite data are generally consistent with those obtained from the reanalysis. In contrast, for smaller river plumes, the difference could reach 5–10 psu that significantly affects the accuracy of plume boundary detection.
Figure 4
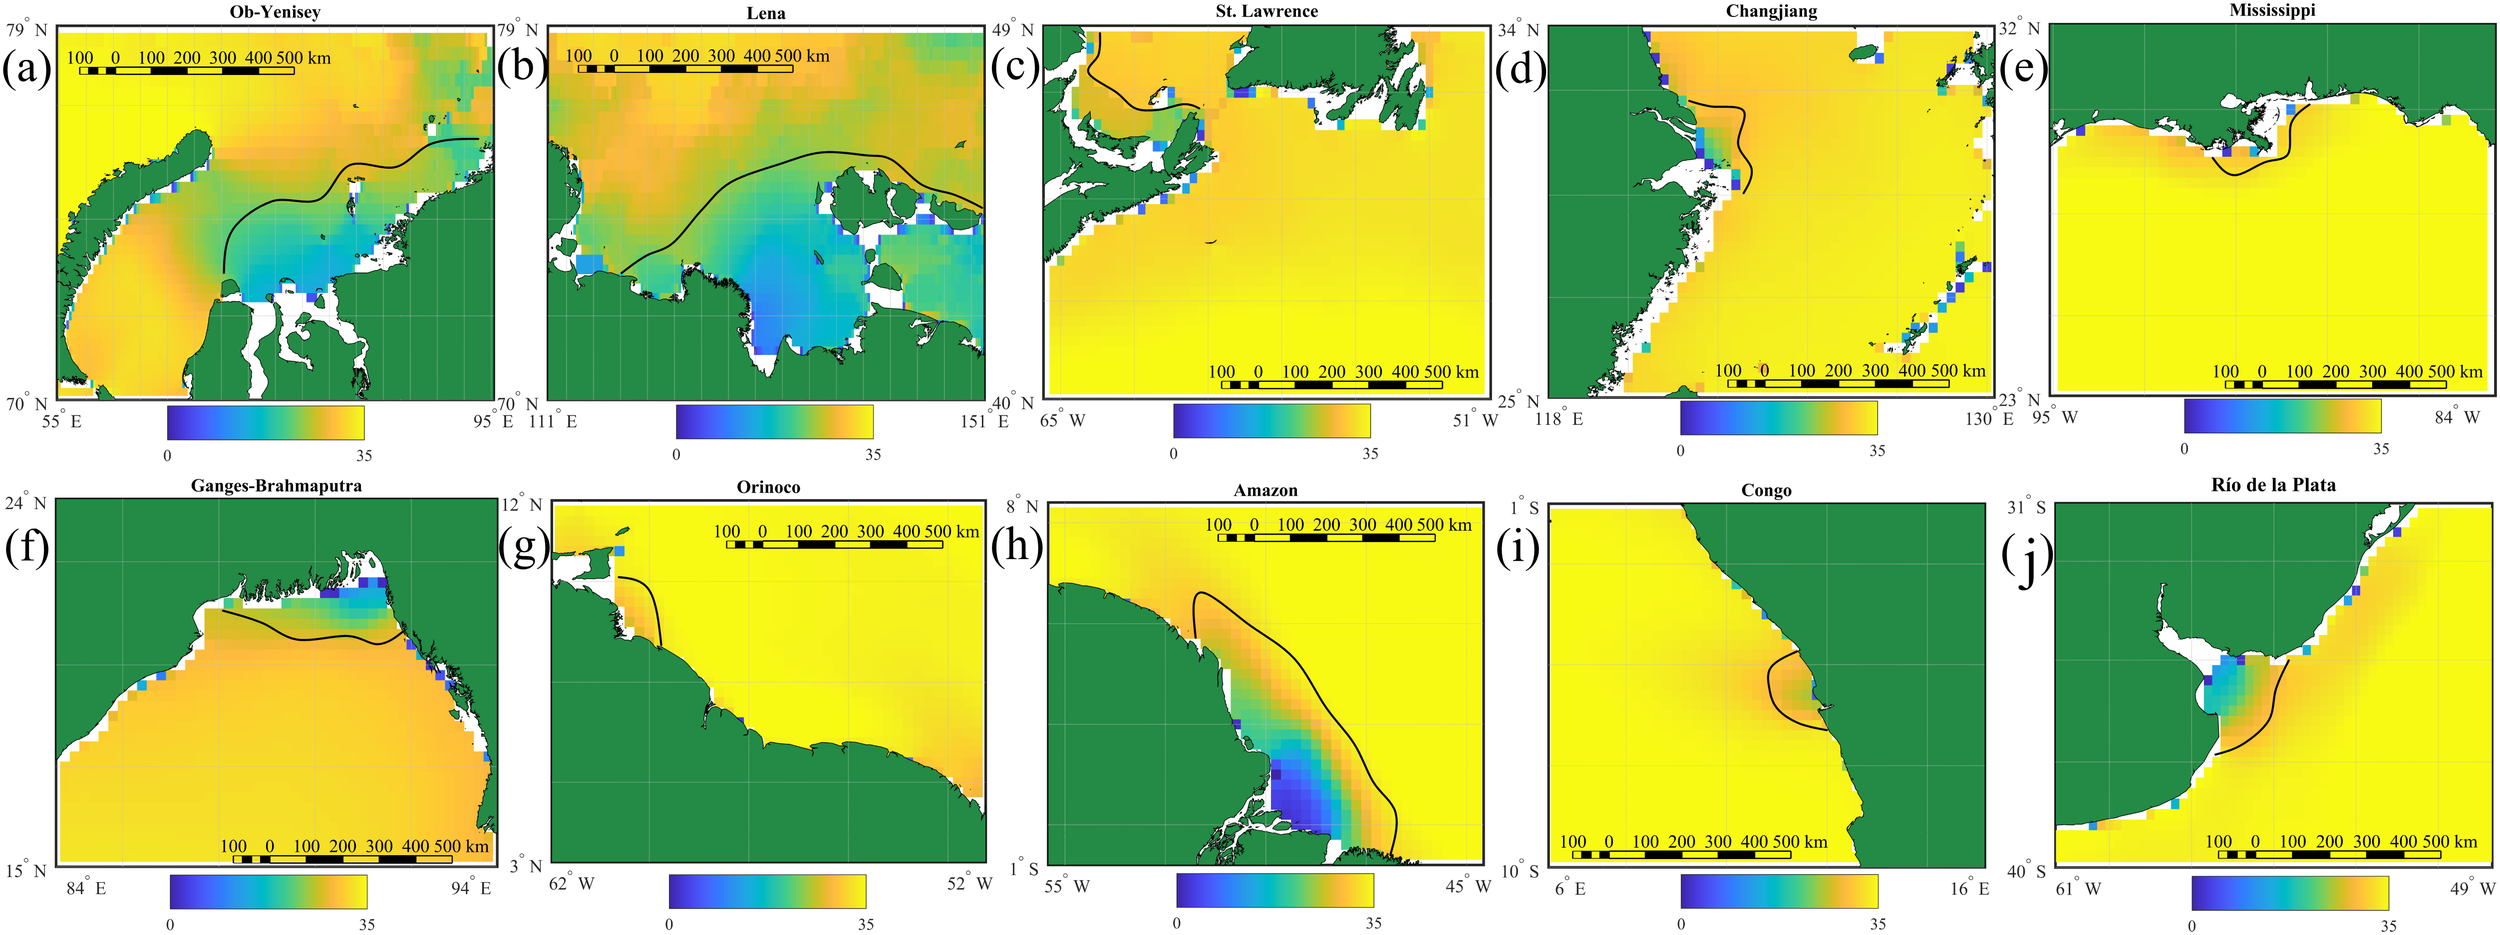
Surface salinity distribution near mouths of 10 largest rivers according to NASA SMAP data averaged for 2016–2023: (a) Ob–Yenisei, (b) Lena, (c) St. Lawrence, (d) Changjiang, (e) Mississippi, (f) Ganges–Brahmaputra, (g) Orinoco, (h) Amazon, (i) Congo, (j) Rio de la Plata. The black line indicates the horizontal boundary of the river plumes at the maximal values of salinity gradient. The red circles indicate points used for analysis of seasonal variability within the river plumes.
3.2 Vertical salinity structure of large river plumes
In order to study mixing of large river plumes with seawater, we analyzed changes in vertical salinity at the selected points near the river mouths over 1993–2022 using the averaged seasonal cycle of vertical salinity (Figure 5). The results demonstrate surface-advected freshening related to all considered river plumes with distinct seasonal cycle, i.e., reduced/increased salinity governed by flooding/drought discharge conditions. Two river plumes located in the polar latitudes, namely, the Ob–Yenisei and Lena plumes, exhibit very pronounced salinity differences between summer freshet and winter drought periods because, discharge of the large Arctic rivers during cold season is 1–2 orders of magnitude less than during warm season (Osadchiev et al., 2021a; 2021b). Surface salinity in the Lena plume changes from 25 psu in summer and autumn to 30–31 psu in winter and spring. The Ob–Yenisei plume in summer and autumn has salinities equal to 27–28 psu, while in winter and spring the plume is absent at the selected point. Reduced salinity of the Ob–Yenisei and Lena plumes during warm season penetrates till the depths of 20–40 m.
Figure 5
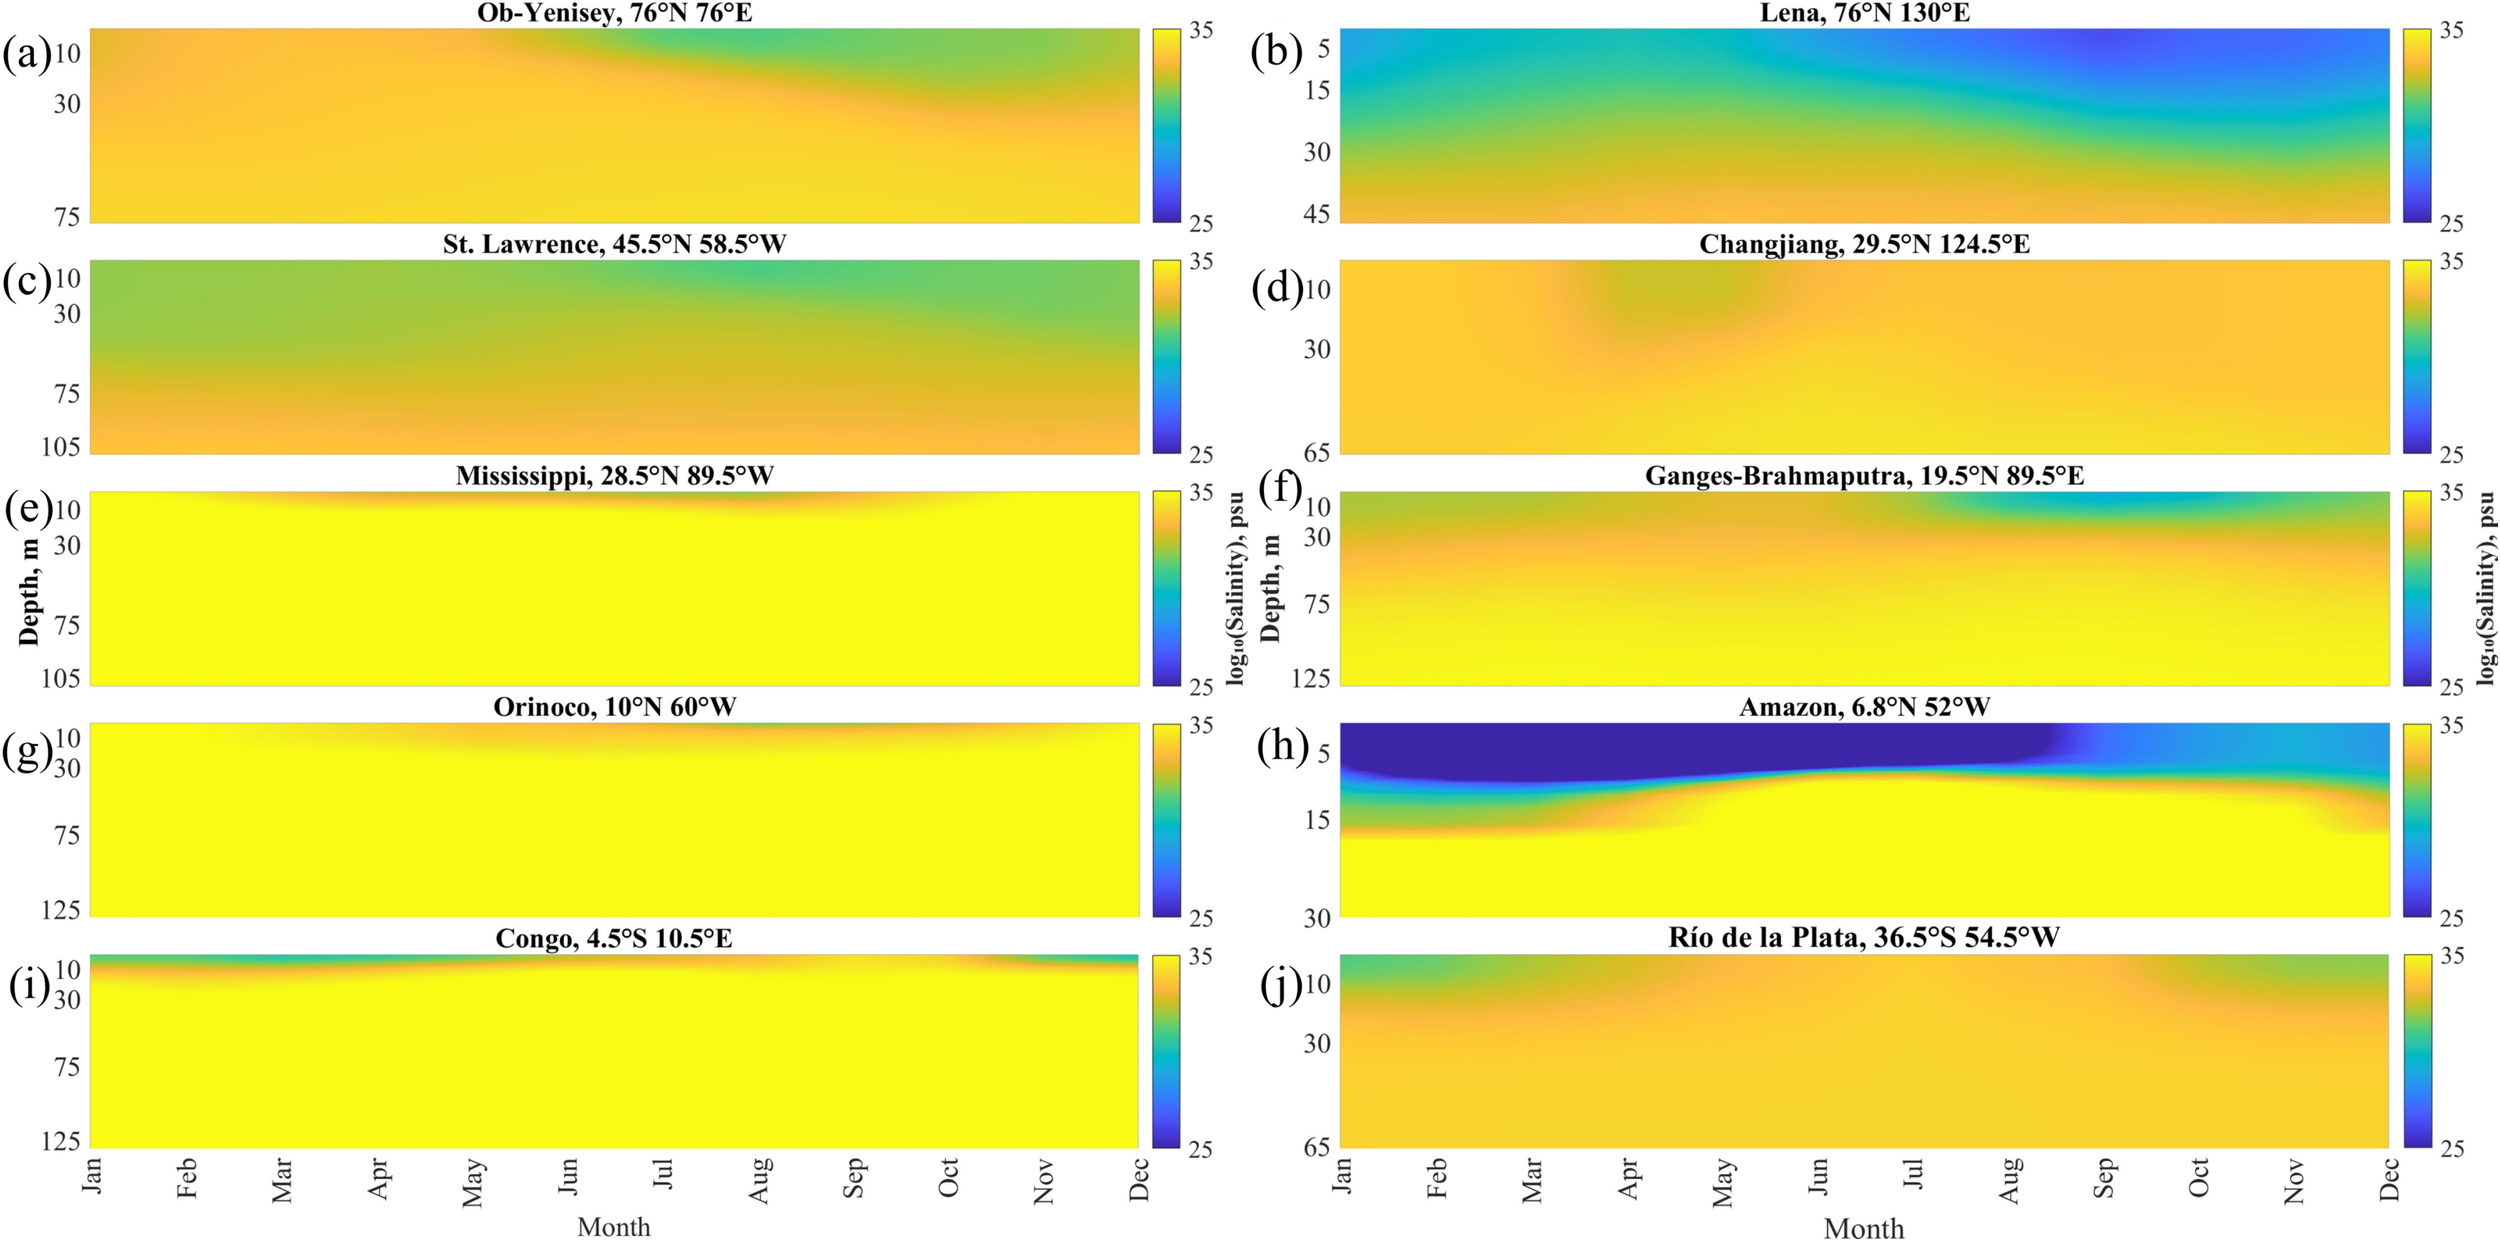
Seasonal variability of vertical salinity distribution at the selected points near the mouths of 10 largest rivers averaged for 1993–2022: (a) Ob–Yenisei, (b) Lena, (c) St. Lawrence, (d) Changjiang, (e) Mississippi, (f) Ganges–Brahmaputra, (g) Orinoco, (h) Amazon, (i) Congo, (j) Rio de la Plata.
The St. Lawrence plume is the deepest and the least stratified among the analyzed plumes. Surface salinity in this plume changes between 30 psu and 32 psu, while its depth varies between 60 and 100 m. Relatively high surface salinity and extremely deep penetration of salinity anomaly is caused by intense mixing of the St. Lawrence freshwater discharge within the Gulf of St. Lawrence before its inflow to open ocean (Ohashi and Sheng, 2013; Dumas and Gilbert, 2023). The lowest salinity observed at the surface layer till the depth of 30 m in June-September deepens till the depths of 60–70 m in November-February, which could be the result of winter convection in this area (Galbraith, 2006). Later in spring and summer, salinity below the depth of 30 m steadily increases. However, reduced salinity at the selected point is observed till the depths of 60–100 m during the whole year.
The Changjiang plume provides the smallest freshening of the surface layer among the analyzed river plumes. The lowest salinity (30–31 psu) till the depth of 30 m is observed only in April-May during the flooding season. Later the Changjiang plume becomes well-mixed and surface salinity remains >31 psu during the rest of the year. At this time no distinct vertical salinity gradient, which could be associated with the plume-sea border, is observed. On the other hand, reduced salinity of the Changjiang plume after the flooding season penetrates till the depth of 70–80 m. These features are caused by intense tidal mixing in the spreading area of the Changjiang plume (Wu et al., 2011; Li and Rong, 2012).
The Rio de la Plata plume located in the Southern Hemisphere shows similar variability as the Changjiang plume. Albeit, the Rio de la Plata plume is present at the selected point from September to March with salinity of 30–31 psu and depth of 30 m. Salinity below the Rio de la Plata plume remains stable during the whole season that demonstrates low mixing at the bottom plume boundary. The reason for absence of the Rio de la Plata plume at the selected point during the drought discharge season from April to August consists in its northward propagation as a narrow coastal current (50 km) at the shelf area (Guerrero et al., 1997; Burrage et al., 2008).
The Ganges–Brahmaputra plume also shows prominent seasonal variability with the lowest salinity in July-September and the highest salinity in May-June. Depth of the Ganges–Brahmaputra plume is 20–30 m, while reduced salinity at the selected point penetrates till the depths of 60–70 m. This feature demonstrates the moderate impact of vertical tidal mixing at the plume-sea interface in the northern part of the Bay of Bengal (Rose and Bhaskaran, 2017; Bhagawati et al., 2018).
The Mississippi, Orinoco and Congo plumes have similar surface salinities (28–30 psu) and depths (10–30 m). All these plumes have distinct salinity decrease (by 3–5 psu) during the flooding season and increase during the drought season. The Mississippi, Orinoco and Congo plumes do not affect the underlying seawater, which salinity remains stable (>35 psu) during the whole year.
The Amazon plume shows the lowest salinity (<25 psu) from January to August and slightly higher salinity (26–28 psu) in September-December. Depth of the Amazon plume is anomalously small with distinct seasonal variability from 25 m during the high-discharge season to 15 m during the low-discharge season. As a result, the Amazon plume has the greatest vertical salinity gradient among all considered river plumes, with salinity differences reaching up to 12 the plume-sea interface. Similarly to the Mississippi, Orinoco and Congo plumes, the Amazon plume do not affect the underlying seawater that indicates the lowest influence of vertical mixing on the Amazon plume among the analyzed plumes.
Comparison of vertical salinity structure obtained from the GLORYS12v1 reanalysis and field measurements (Figure 6) shows that the river plumes are well represented by GLORYS12v1. For most of the considered river plumes including the Ob-Yenisei (Frey and Osadchiev, 2021; Osadchiev et al., 2021a; 2021d; 2022), Lena (Osadchiev et al., 2021b; Savin and Osadchiev, 2025), St. Lawrence (Galbraith et al., 2015), Changjiang (Liang et al., 2025; Zeng et al., 2025), Ganges-Brahmaputra (Li et al., 2021), Orinoco (Gevaudan et al., 2022), Amazon (Geyer et al., 1996; Molinas et al., 2014), and Rio de la Plata (Maciel et al., 2021) plumes, the discrepancy between the GLORYS12v1 and in situ measurements does not exceed 2 psu.
Figure 6
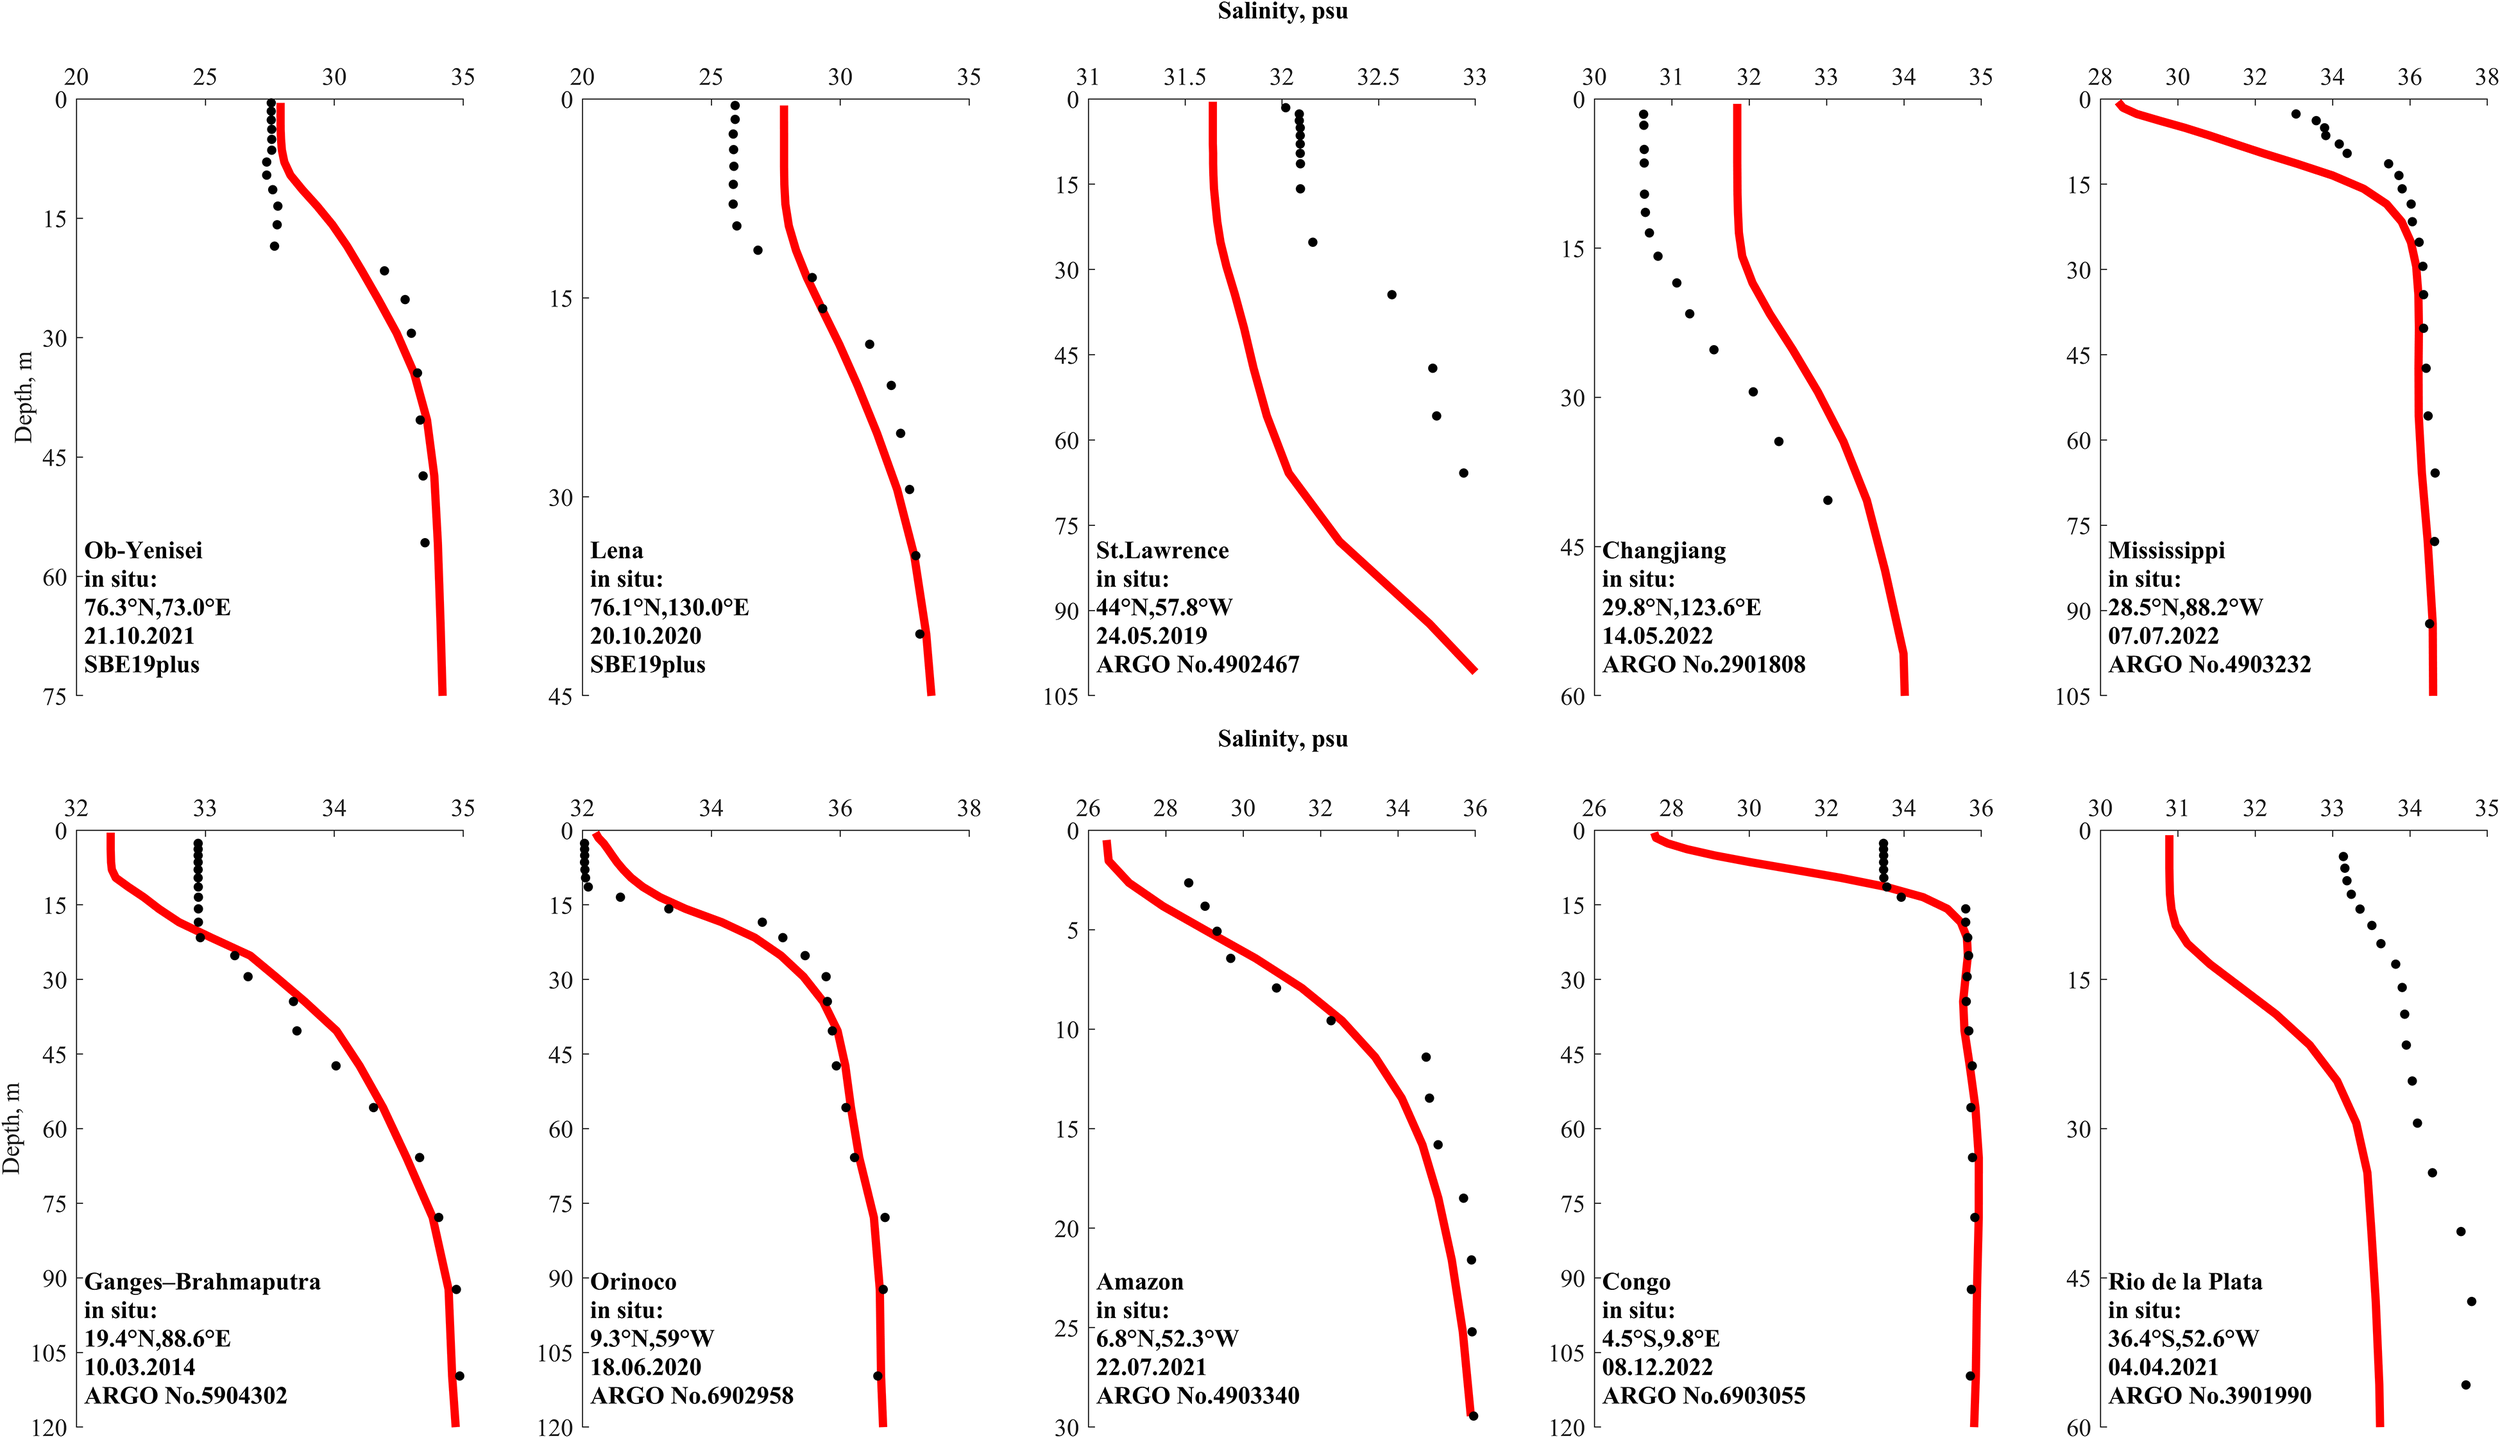
Vertical salinity profiles near the mouths of the analyzed rivers: CMEMS GLORYS12v1 reanalysis (red lines) and the nearest available in situ measurements from ARGO floats or r/v CTD data (black dots) from (Osadchiev et al., 2021a; 2021b). Each panel shows the reanalysis profile extracted at the closest coordinates and on the same date as the corresponding in situ measurement: (a) Ob–Yenisei, (b) Lena, (c) St. Lawrence, (d) Changjiang, (e) Mississippi, (f) Ganges–Brahmaputra, (g) Orinoco, (h) Amazon, (i) Congo, (j) Rio de la Plata.
The seasonal fluctuations in river discharge could significantly change surface salinity in river plumes. However, seasonal fluctuations in the climatologic river discharge could be smaller/greater and earlier/later than those in the actual discharge for a given river. As a result, actual surface salinity could be underestimated or overestimated by several psu in certain months and years. This is especially the case of the Mississippi (Lane et al., 2007) and Congo (Martins and Stammer, 2022) plumes. Nevertheless, the overall vertical structure, namely, strong surface freshening and rapid transition to saline shelf waters, is resolved reasonably well by the GLORYS12v1 reanalysis.
Vertical salinity gradients at the selected points near the mouths of the 10 largest rivers were analyzed using the averaged seasonal cycle over 1993-2022 (Figure 7). Similarly to horizontal salinity, the vertical salinity gradient is commonly used to detect the plume-sea interface as the area of maximal gradient values. In addition, it is indicative of mixing intensity between plumes and subjacent sea, because strong mixing results in reduced salinity gradients.
Figure 7
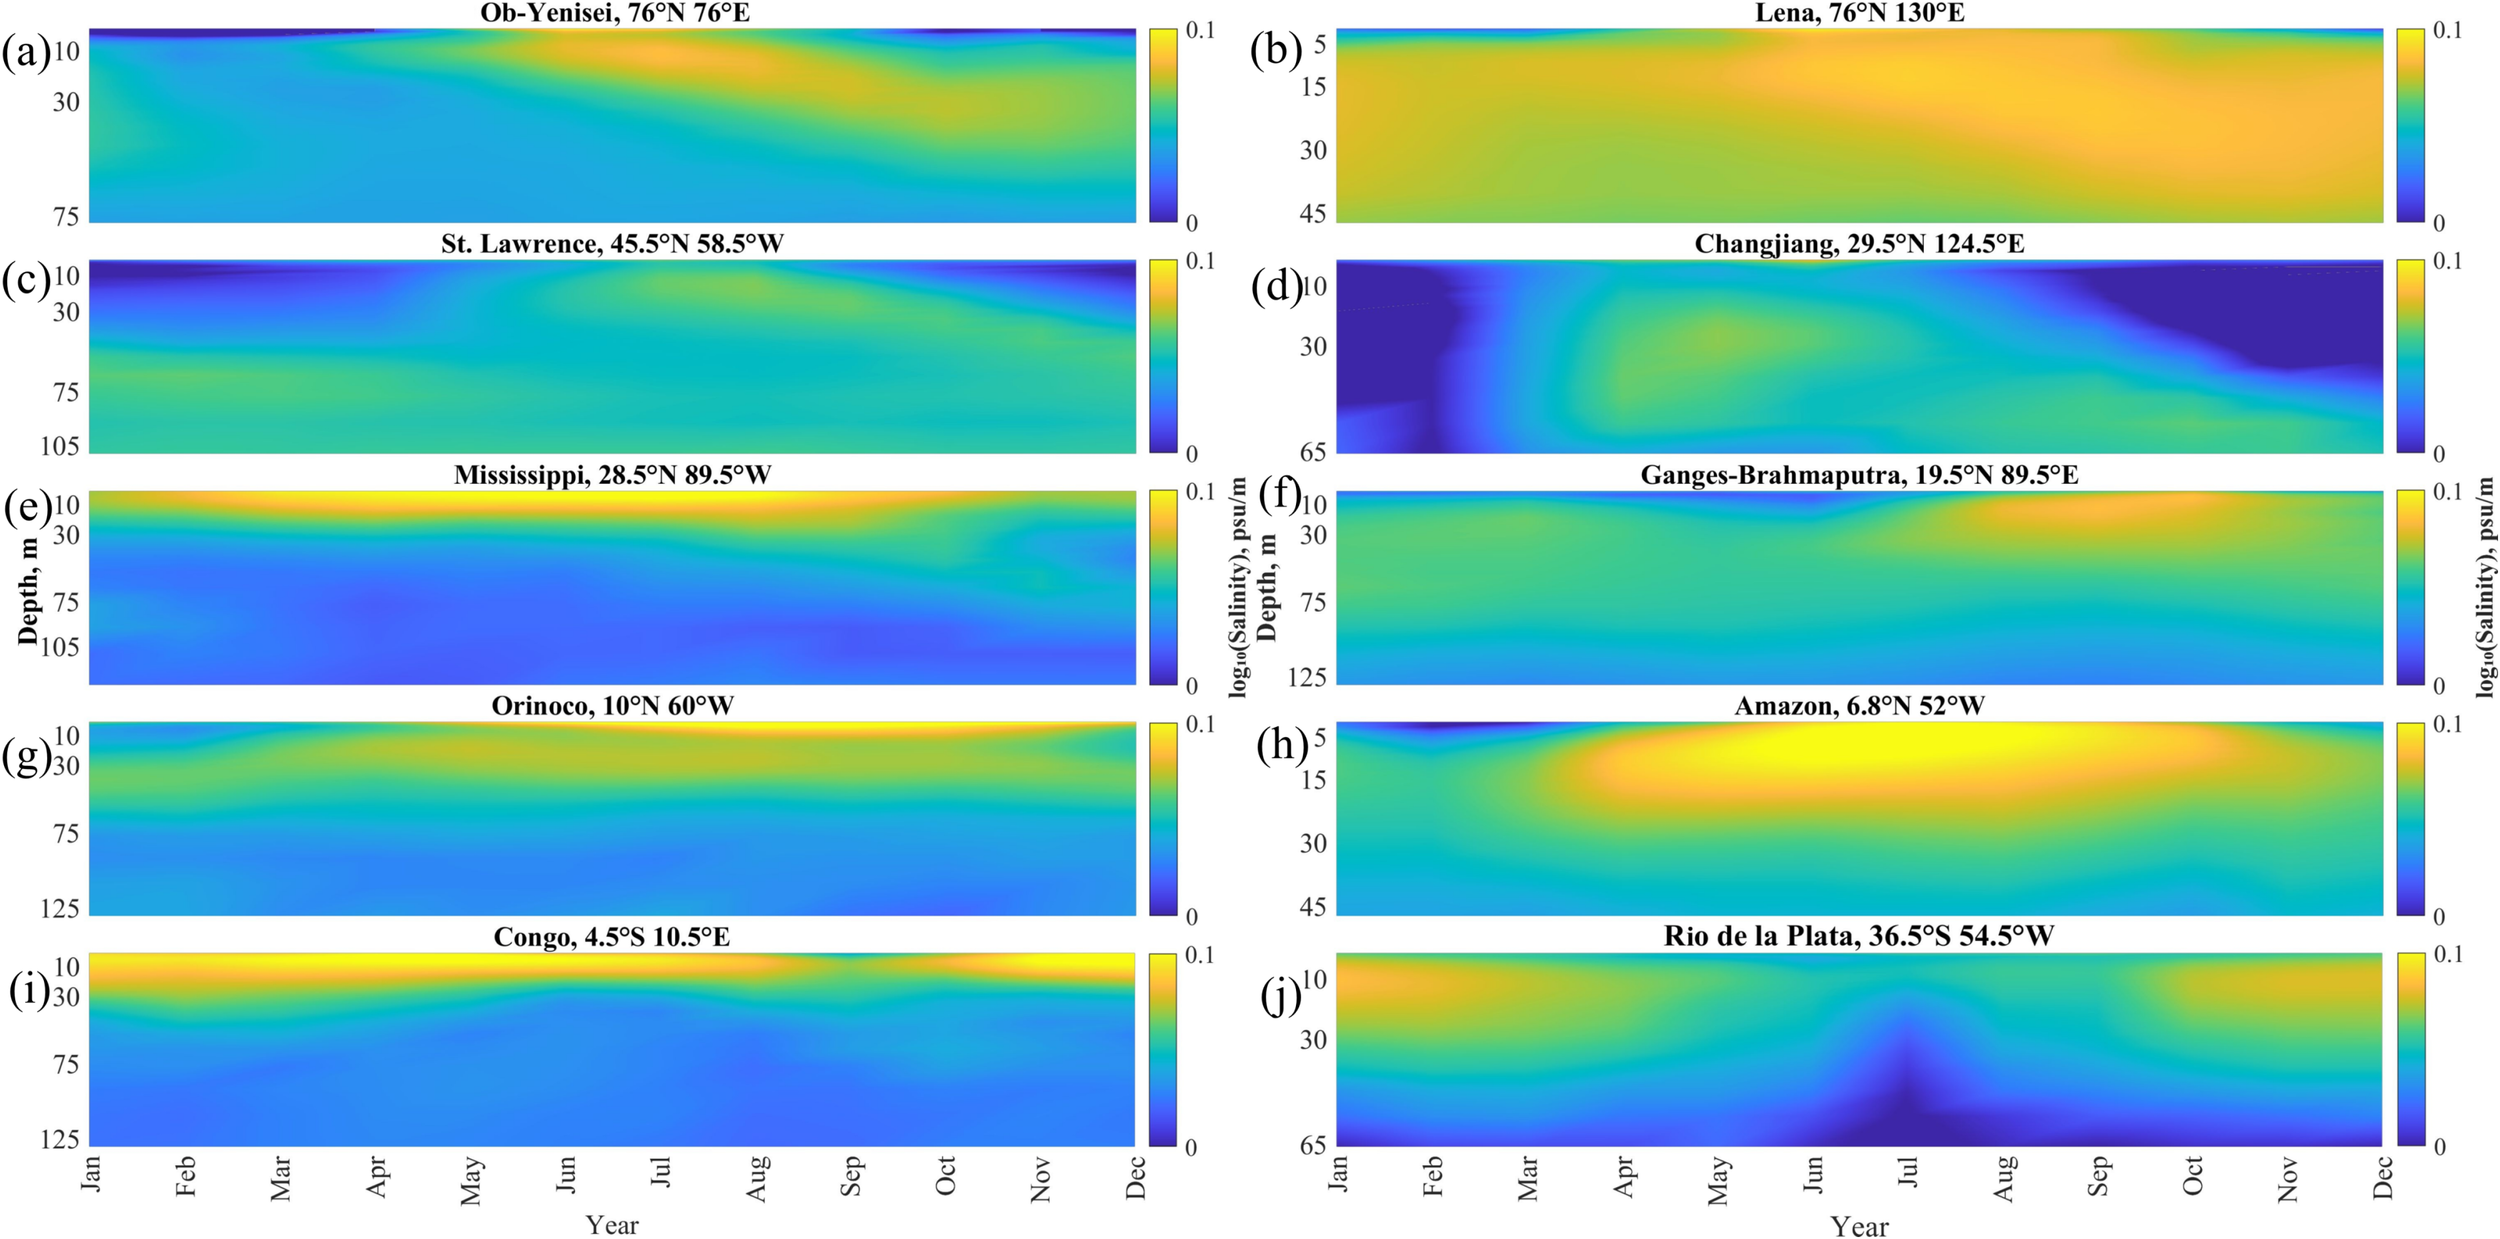
Seasonal variability of vertical salinity gradients at the selected points near the mouths of 10 largest rivers averaged for 1993–2022: (a) Ob–Yenisei, (b) Lena, (c) St. Lawrence, (d) Changjiang, (e) Mississippi, (f) Ganges–Brahmaputra, (g) Orinoco, (h) Amazon, (i) Congo, (j) Rio de la Plata.
The Amazon, Congo, and Mississippi plumes have the largest vertical salinity gradients (>0.03 psu/m) at the surface layer. High gradient values indicate presence of a pronounced frontal zone below the Amazon, Congo, and Mississippi plumes which is characterized by stable stratification that inhibits vertical mixing at the plume-sea interface. Lower salinity gradients (0.05 psu/m) are observed at the Ob–Yenisei, Lena, Rio de la Plata, Ganges–Brahmaputra and Orinoco plumes. All these river plumes have distinct seasonal cycle, when salinity decrease during the flooding season is accompanied by the increased vertical salinity gradients. Later, during the drought season, the vertical salinity gradients at these plumes become <0.15 psu/m, which is caused by mixing dynamics in the frontal area. The lowest stratification and the most intense mixing of river discharge occurs at the Changjiang and St. Lawrence plumes. The vertical salinity gradients at these plumes do not exceed 0.1 psu/m during the high-discharge season and become as low as 0.01 psu/m during the low-discharge season. The vertical salinity gradient at the surface layer is especially low (<0.01 psu/m) near the Changjiang river mouth from September to January.
3.3 Response of large river plumes to seasonal variability of river discharge
Seasonal variability of freshwater volume in the river plumes were compared with seasonal variability of the river discharge rates. (Figure 8). The time lag between peak river discharge and maximal river plume area reflects the response of a river plume to discharge variability. In case of a small time lag between the peak river discharge and the maximal plume volume, the inflowing river discharge exhibits reduced mixing with the subjacent seawater near river mouths even during the high discharge period. In case of a large time lag, intense mixing of the inflowing river discharge and seawater during the high discharge period results in delayed maximal values of freshwater volume within these plumes.
Figure 8
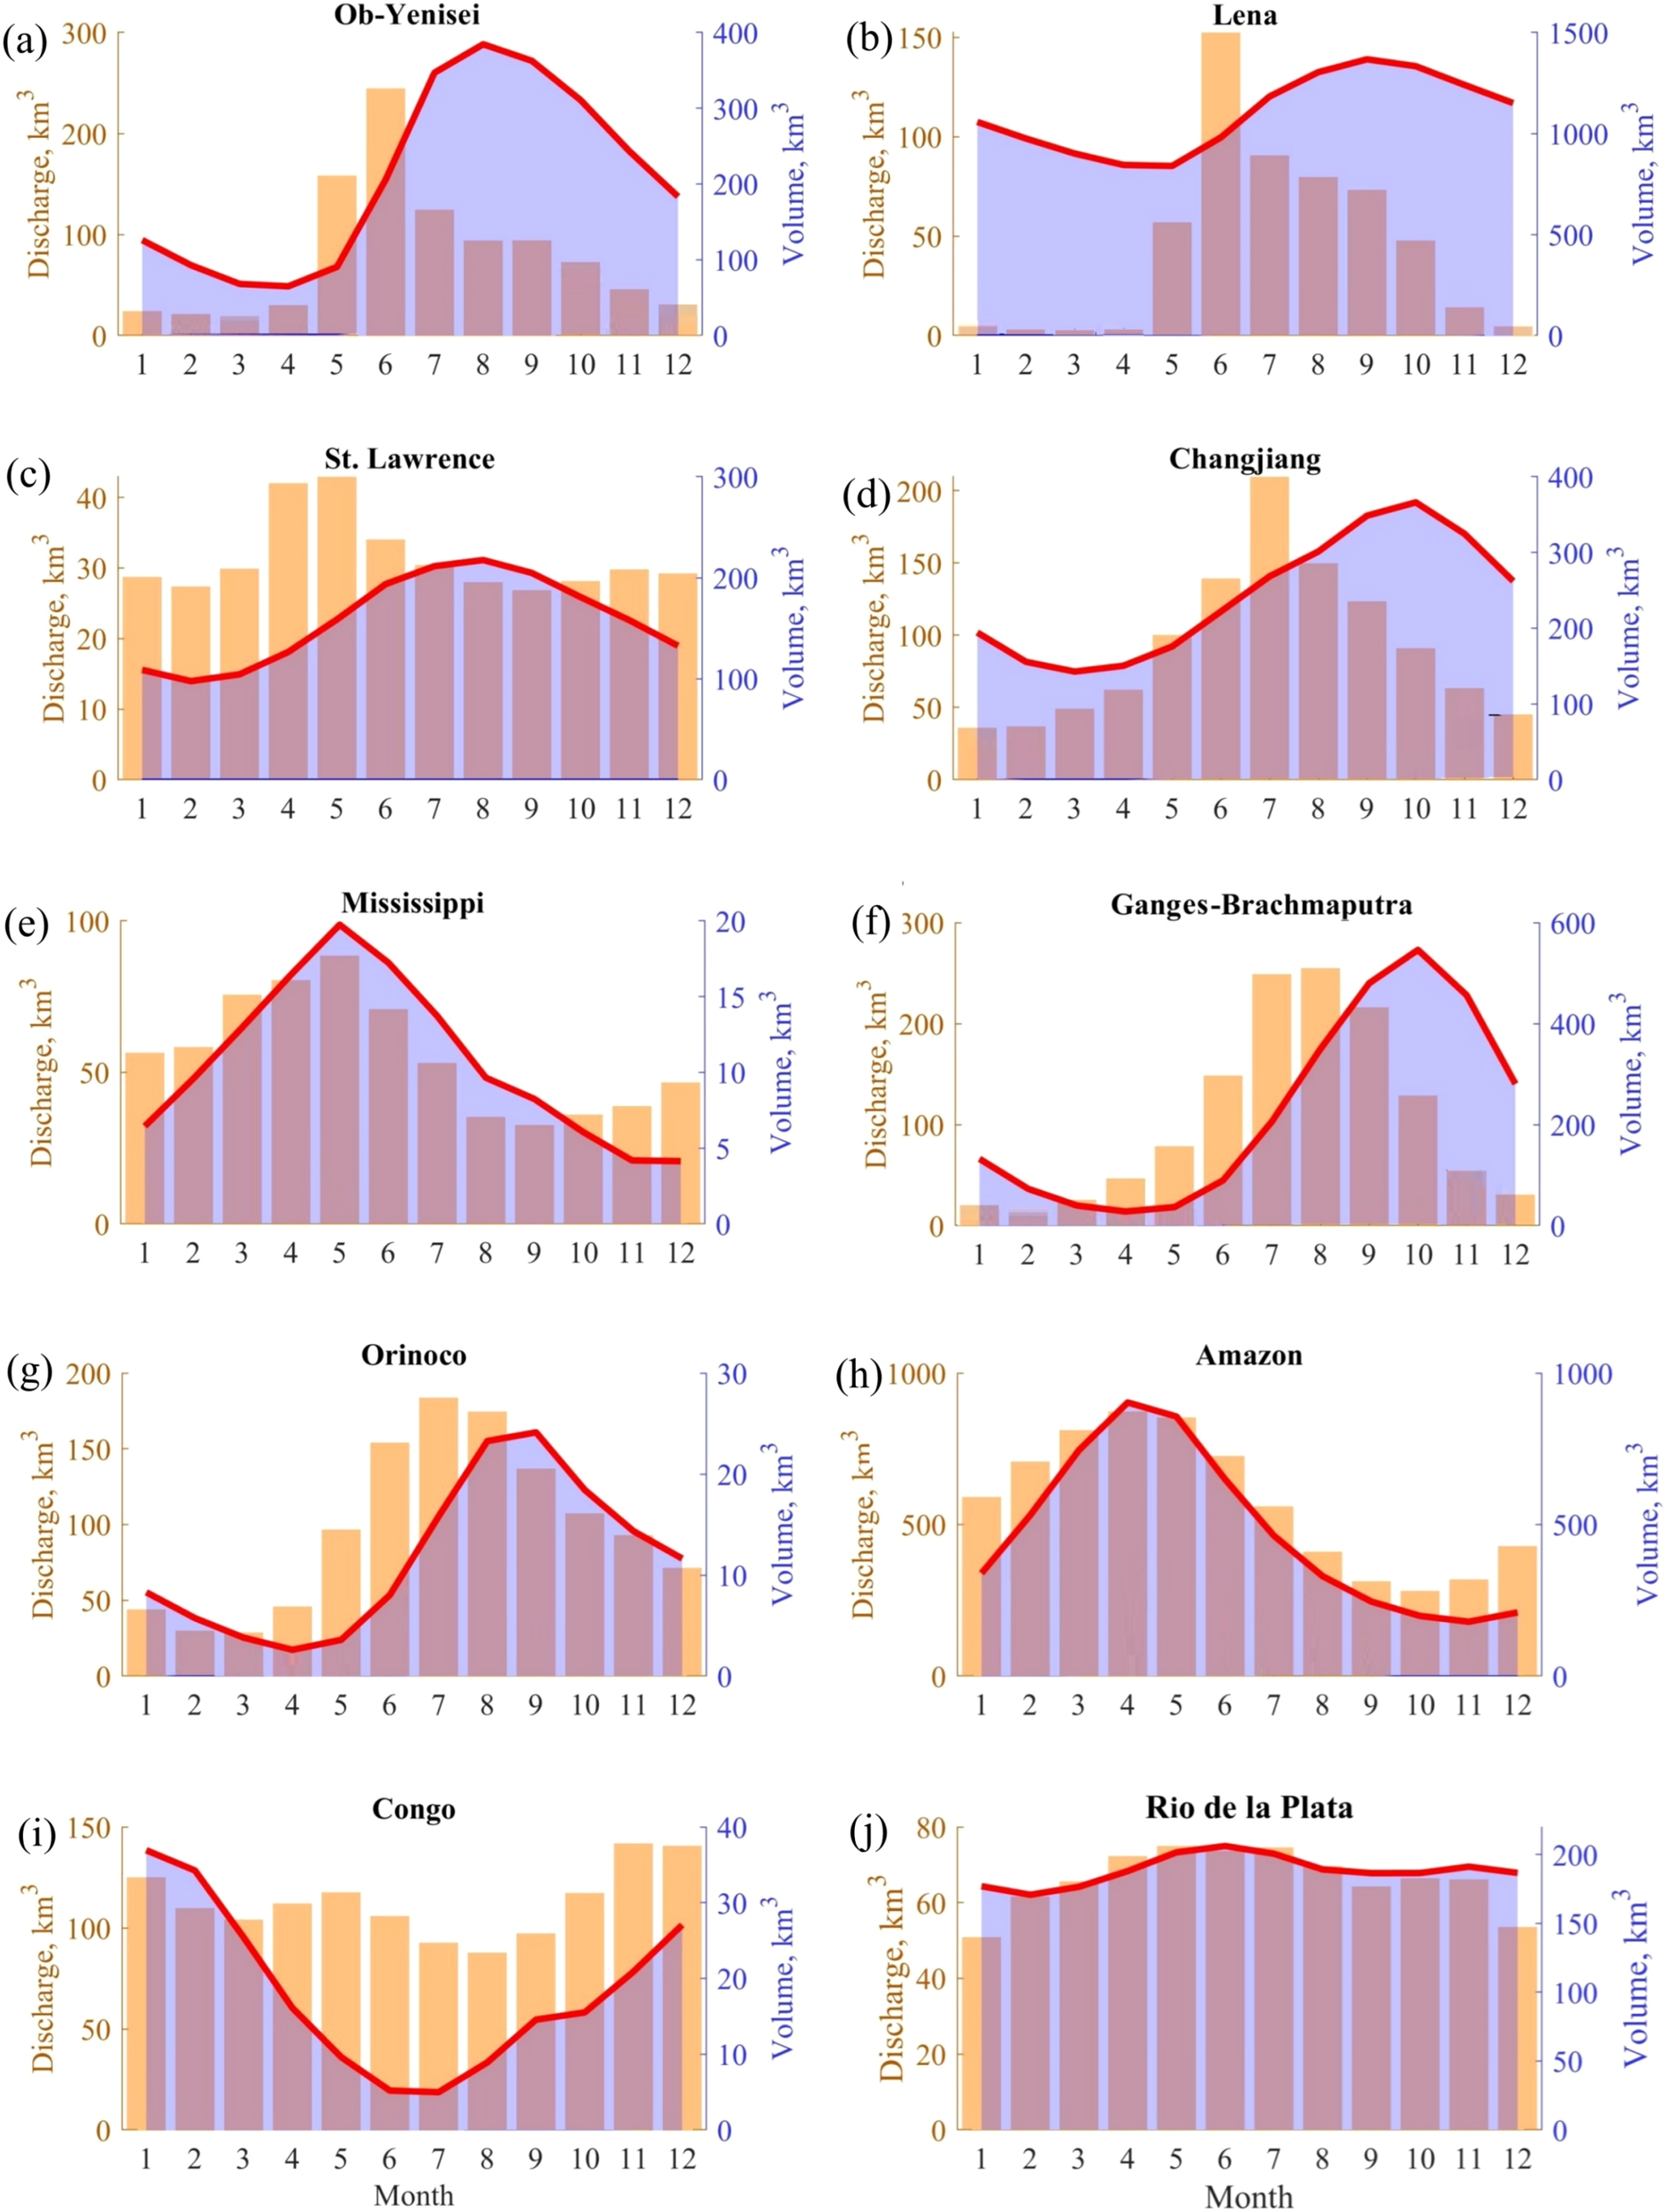
Mean monthly river discharge (orange bars) and freshwater volume (blue shading) in the river plumes: (A) Ob–Yenisei, (B) Lena, (C) St. Lawrence, (D) Changjiang, (E) Mississippi, (F) Ganges–Brahmaputra, (G) Orinoco, (H) Amazon, (I) Congo, (J) Rio de la Plata. The red lines indicate freshwater volume within the isohaline 30 psu.
Among the considered river plumes, the time difference between the peak river discharge and the maximal plume volume is <3 months. The smallest value (<1 month) is observed for the Mississippi, Amazon, Congo, and Rio de la Plata plumes, which is consistent with the largest vertical salinity gradients at the plume-sea interface. At these river plumes, reduced plume-sea mixing near river mouths even during the high discharge period results in almost synchronous increase of river discharge and freshwater volume within the plumes. The largest time lag (3 months) between the peak discharge and the peak freshwater volume is observed for the St. Lawrence, Changjiang, and Lena plumes, which is consistent with the largest vertical salinity gradients at the plume-sea interface. Intense mixing during the high discharge period in these plumes causes delayed maximal freshwater volume.
Table 2 summarizes the key characteristics of the vertical salinity structure of 10 largest river plumes, evaluated at the selected locations near their river mouths. These characteristics include the plume thickness, the vertical salinity gradient across the plume-sea interface, and the average horizonal freshwater content. All these characteristics reflect the strength of vertical stratification and the intensity of mixing at the bottom plume boundary. Among the examined plumes, the St. Lawrence plume receives the smallest river discharge, albeit exhibits the greatest thickness (80 m). These features are consistent with strong tidal mixing in the Gulf of St. Lawrence and sustained vertical convection during the cold season. Similarly, large thickness of the Changjiang plume (70 m) results from intense tidal mixing near the river delta.
Table 2
| River plume | Plume thickness, m | Plume-sea salinity gradient, psu/m | Average horizontal freshwater content, km2 |
|---|---|---|---|
| Ob–Yenisei | 30 | 0.03 | 0.03 |
| Lena | 30 | 0.06 | 0.03 |
| St. Lawrence | 80 | 0.01 | 0.01 |
| Changjiang | 70 | 0.01 | 0.01 |
| Mississippi | 15 | 0.02 | 0.05 |
| Ganges–Brahmaputra | 30 | 0.03 | 0.04 |
| Orinoco | 30 | 0.02 | 0.03 |
| Amazon | 20 | 0.1 | 0.2 |
| Congo | 20 | 0.005 | 0.06 |
| Rio de la Plata | 30 | 0.005 | 0.02 |
Mean values of plume thickness, vertical salinity gradient at plume-sea interface at the selected points near the mouths of 10 largest rivers averaged for 1993–2022, as well as the ratio between the annual river discharge and the plume thickness.
In contrast, the Amazon plume, despite its exceptionally high river discharge, is among the shallowest plumes and is confined to only 20 m of sea surface layer. This shallow structure of the Amazon plume indicates limited vertical mixing and efficient lateral advection of freshwater discharge, which suppresses its downward penetration. As a result, the Amazon plume has the largest plume-sea salinity gradient (0.1 psu/m), followed by the Lena (0.06 psu/m), Ob–Yenisei (0.03 psu/m), and Ganges–Brahmaputra (0.03 psu/m) plumes. These values exceed by several times the gradients observed in the St. Lawrence and Changjiang plumes (0.01 psu/m), as well as in the Congo and Rio de la Plata plumes (0.005 psu/m).
Finally, we calculated the average horizontal freshwater content, which is determined as the ratio between the annual river discharge and the plume thickness. This characteristic is indicative of downward penetration of river discharge as a result of vertical mixing. The St. Lawrence and Changjiang plumes have the lowest value of average horizontal freshwater content (0.01 km2) due to their large thickness caused by vertical mixing. On the opposite, horizontal freshwater content of the Amazon plume (0.2 km2) is one order of magnitude greater due to large river discharge and small plume thickness. Large horizontal freshwater content is also observed in the Congo (0.06 km2) and Mississippi (0.05 km2) plumes. The differences described above underscore the contrasting stratification regimes between strongly stratified Amazon, Congo and Mississippi plumes and diffuse St. Lawrence and Changjiang plumes with gradual transitions from freshwater to marine conditions.
Seasonal salinity changes in river plumes are governed by seasonal variability of river discharge and plume-sea mixing. In order to study intensity of vertical mixing in 10 largest river plumes, we analyzed the time lag between the minimum and maximum salinity at different depths at the selected points near the river mouths (Figure 9). In the river-sea systems, the peak river discharge is followed by minimum sea surface salinity near the estuary (with a certain time lag), which then steadily increases and later reaches its annual maximum. The time lag between maximum and minimum plume salinity anomaly near river estuary is indicative of freshwater residence time in the river plume. Minimum salinity is formed in response to freshet river discharge. In the sea surface layer, minimum salinities are observed 1–3 months after the peak river discharge to the sea for all considered river plumes (except the Changjiang plume). Note that minimum salinity at the Rio de la Plata plume is observed in December, while the peak river discharge occurs in June (Figure 8J). However, seasonal changes in the river runoff volume are not very prominent for the Rio de la Plata due to coalescence of freshet season in March-May at the Parana River and in July-October at the Uruguay River. Once the Rio de la Plata is formed by the confluence of the Uruguay and Parana rivers, its flooding season is spanned between June and November. As a result, the minimum salinity observed in the Rio de la Plata plume in December occurs one month later after the end of the flooding season.
Figure 9
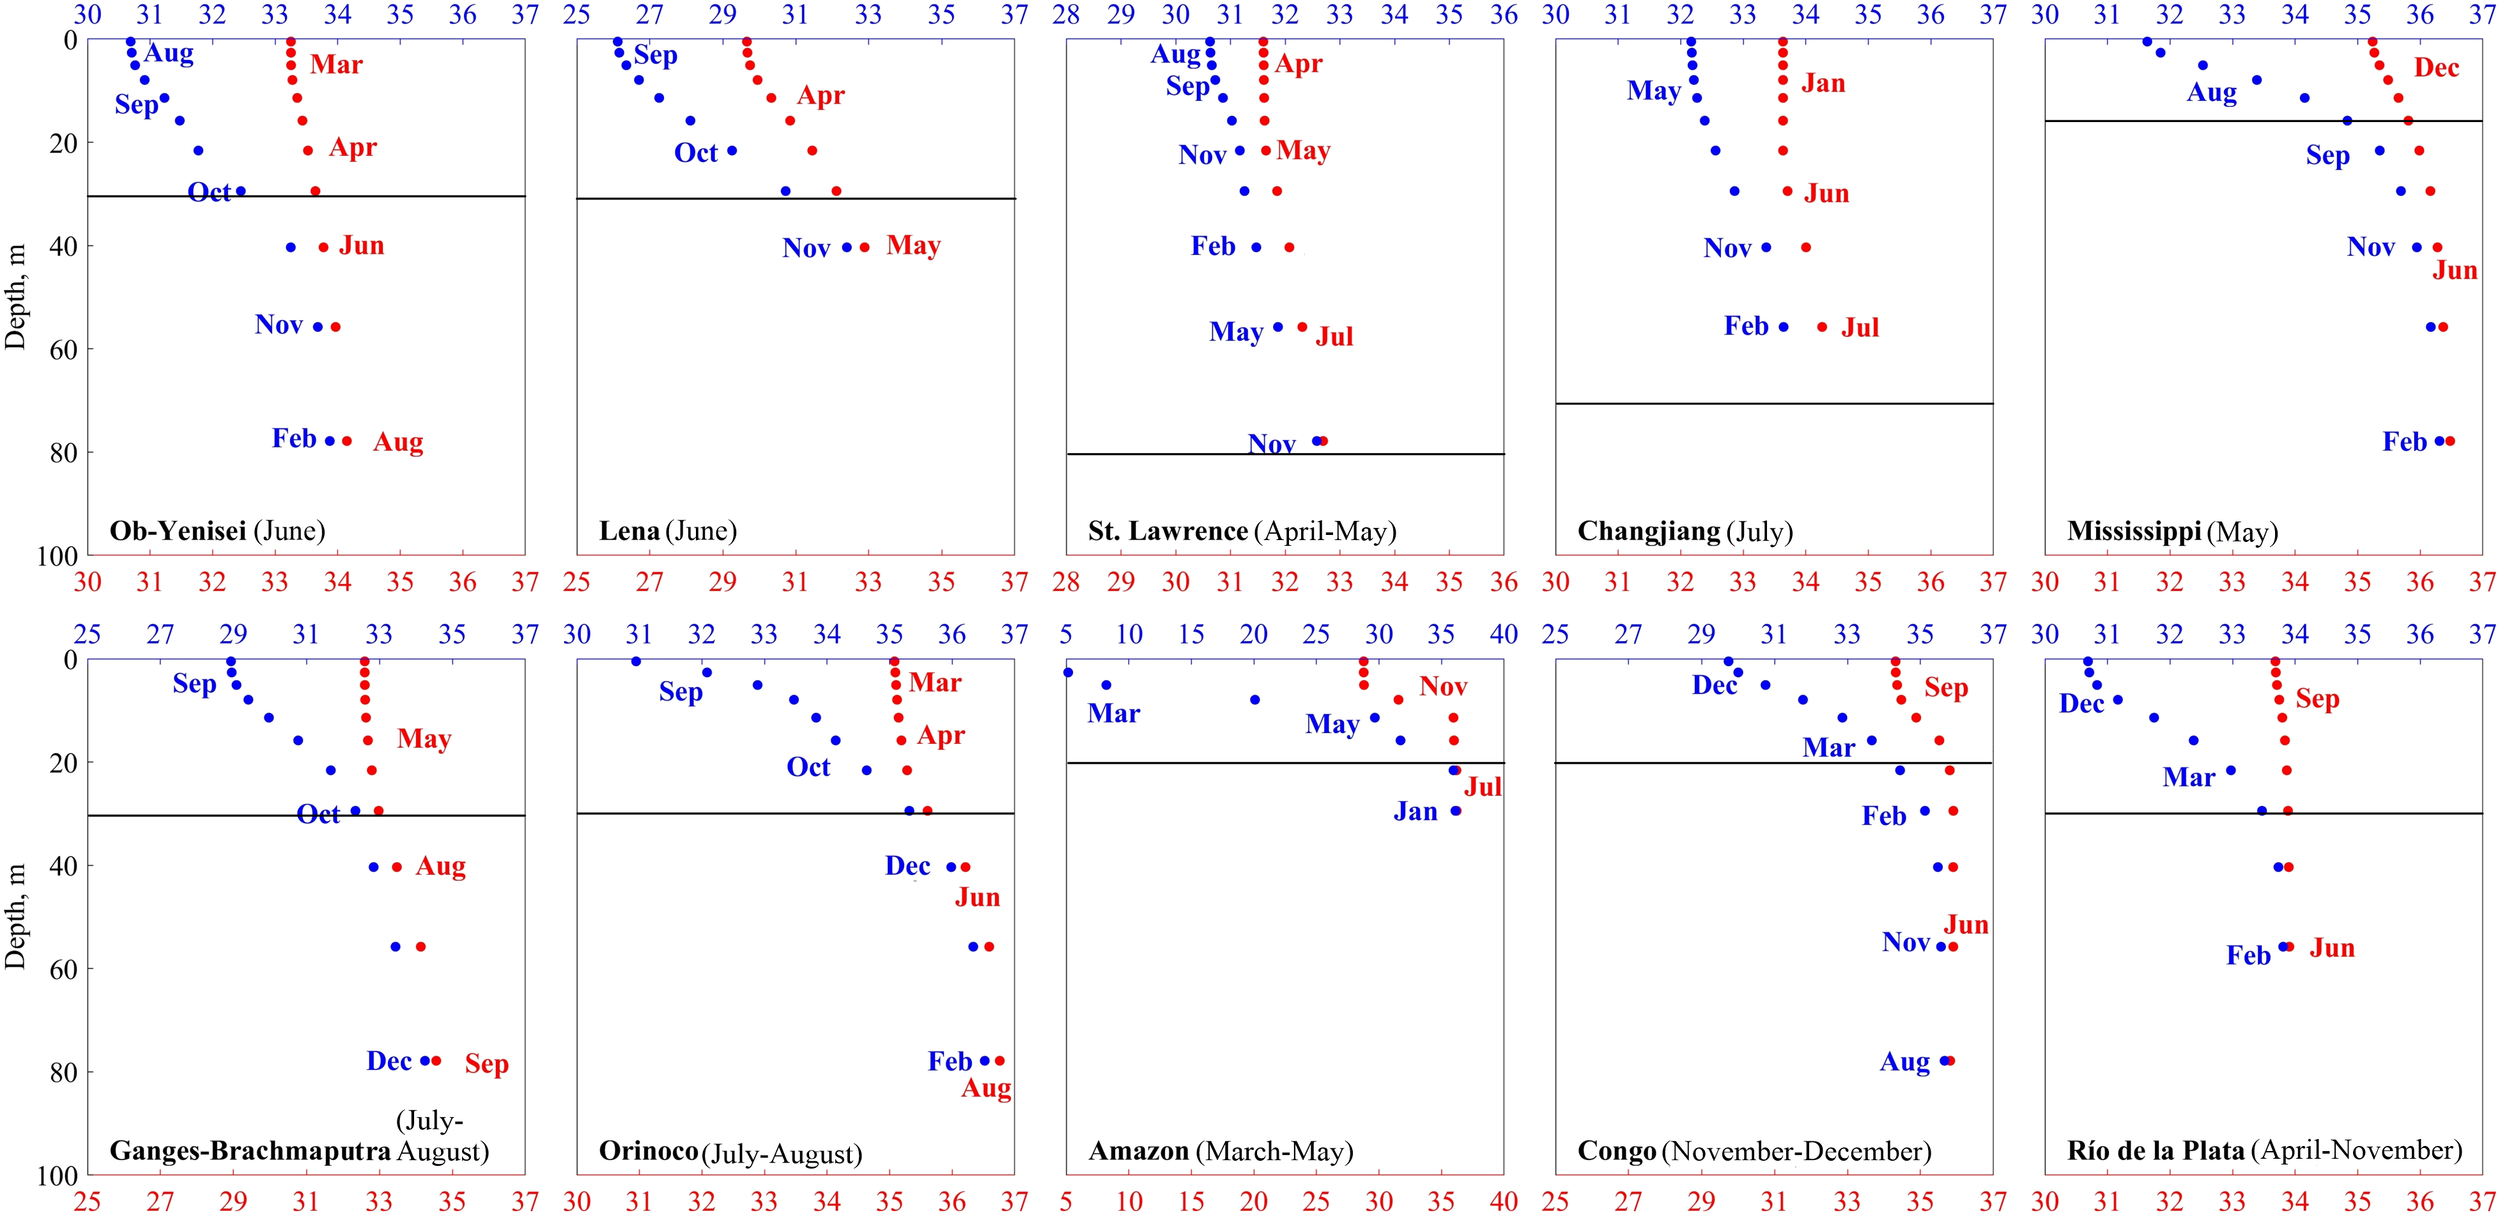
Minimum (blue color) and maximum (red color) salinity values from surface to the depth of 80 m and the months of their occurrence at the selected points near the mouths of 10 largest rivers averaged for 1993-2022. Note that salinity scales are different for different river plumes. Black lines indicate plume depths. In all panels, the period of peak river discharge is given in brackets after the river name.
For the Changjiang River, the peak discharge is in July, but the minimum surface salinity in the Changjiang plume is in May, which is 10 months later. However, the overall annual salinity variability at this point is very small (<1.5 psu), which is the smallest among all analyzed river plumes (Figures 7d). We presume, that the signal of the peak river discharge does not reach the selected point, despite its proximity to the Changjiang river delta. This feature is caused by strong tidal forcing and wind-driven ocean circulation resulting in very complex upshelf and downshelf advection of the Changjiang plume, which was addressed in many previous studies (e.g., Wu et al., 2011; Chi and Rong, 2023; Guan et al., 2025). Therefore, the time lag between the peak river discharge and the minimum salinity is not representative for this river plume.
Maximum surface salinity, which is formed due to plume-sea mixing after the freshet season, occurs with the time lag of 4–6 months (Amazon and Mississippi) to 10–11 months (Congo, Ganges–Brahmaputra, Rio de la Plata, Changjiang, St. Lawrence) relative to the minimum surface salinity. The smallest difference between the minimum and maximum values at surface layer is observed for the Changjiang and St. Lawrence plumes (1–1.5 psu). All other plumes have this difference equal to 3–4 psu, except the Amazon plume with the largest difference equal to 25 psu.
Salinity difference between the minimum and maximum values is the largest at sea surface and decreases with depth. At individual river plumes, seasonal salinity variability (the difference between the minimum and maximum salinity values) becomes low at similar depths as the river plume depths, which are determined by the maximal vertical salinity gradient (Table 2). Minimum salinities from surface to the plume depths occur at similar months (within 1–2 months difference), while below the plume minimum salinities are observed with much greater time lag (up to 5–6 months).
3.4 Horizontal advection and vertical mixing in large river plumes
In order to study the role of horizontal advection and vertical mixing in spreading of river discharge and formation of horizontal structure of the large river plumes, we analyzed areas within certain isohalines at the sea surface, namely, areas between the isohalines 1 and 2 psu, 2 and 3 psu, 3 and 4 psu, etc. till 31 and 32 psu. These areas were calculated and averaged for different months of the year and were compared with the seasonal cycles of river discharges. Three different types of river plumes previously distinguished by intensity of vertical mixing also demonstrated different patterns of horizontal advection (Figures 10–12).
Figure 10
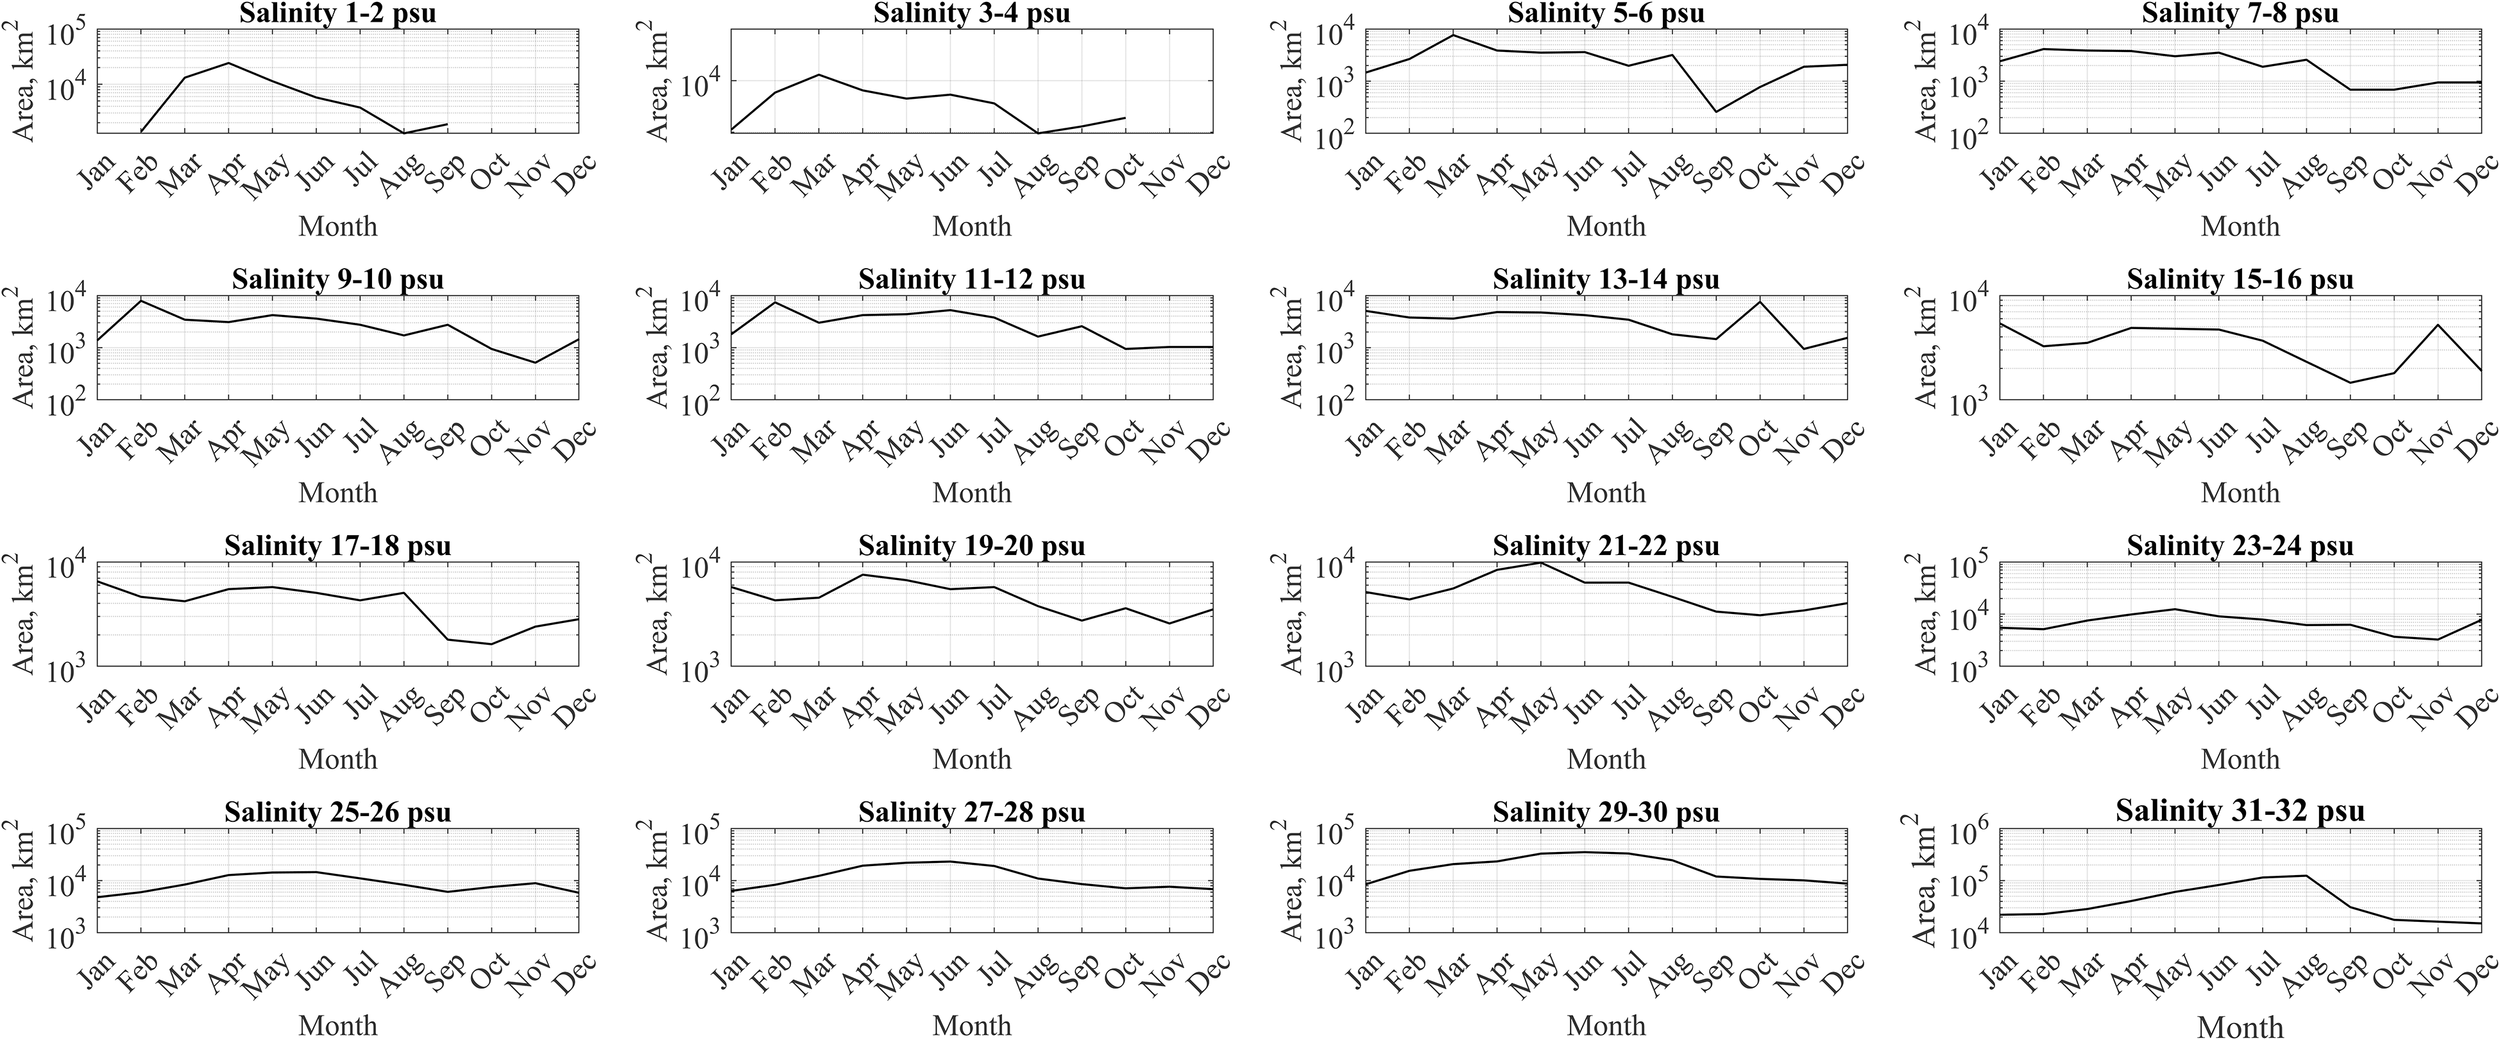
Mean surface sea areas within certain isohalines for the Amazon plume and the adjacent sea.
Figure 11
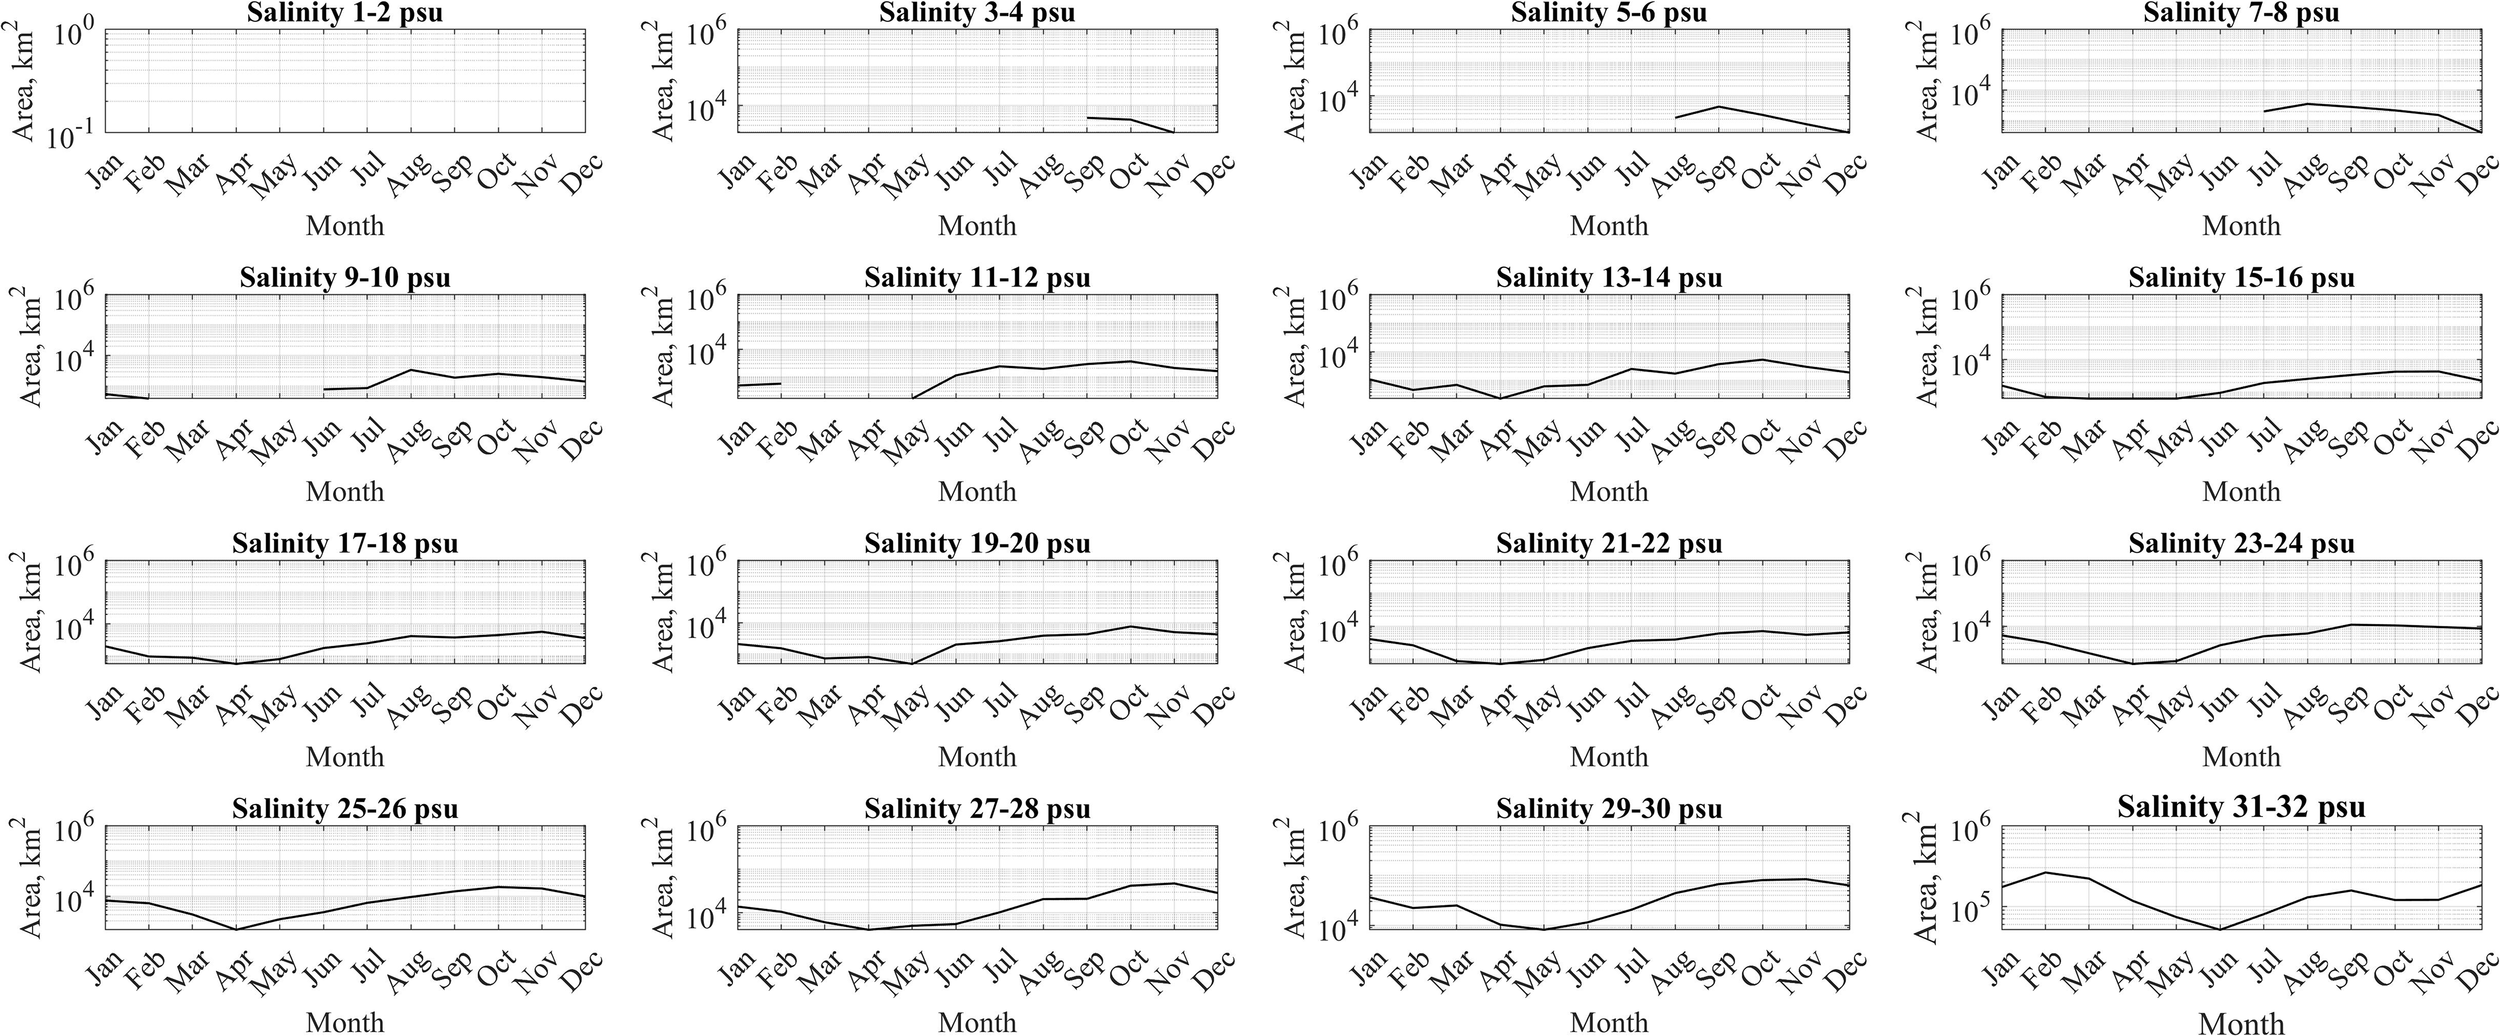
Mean surface sea areas within certain isohalines for the Ganges–Brahmaputra plume and the adjacent sea.
Figure 12
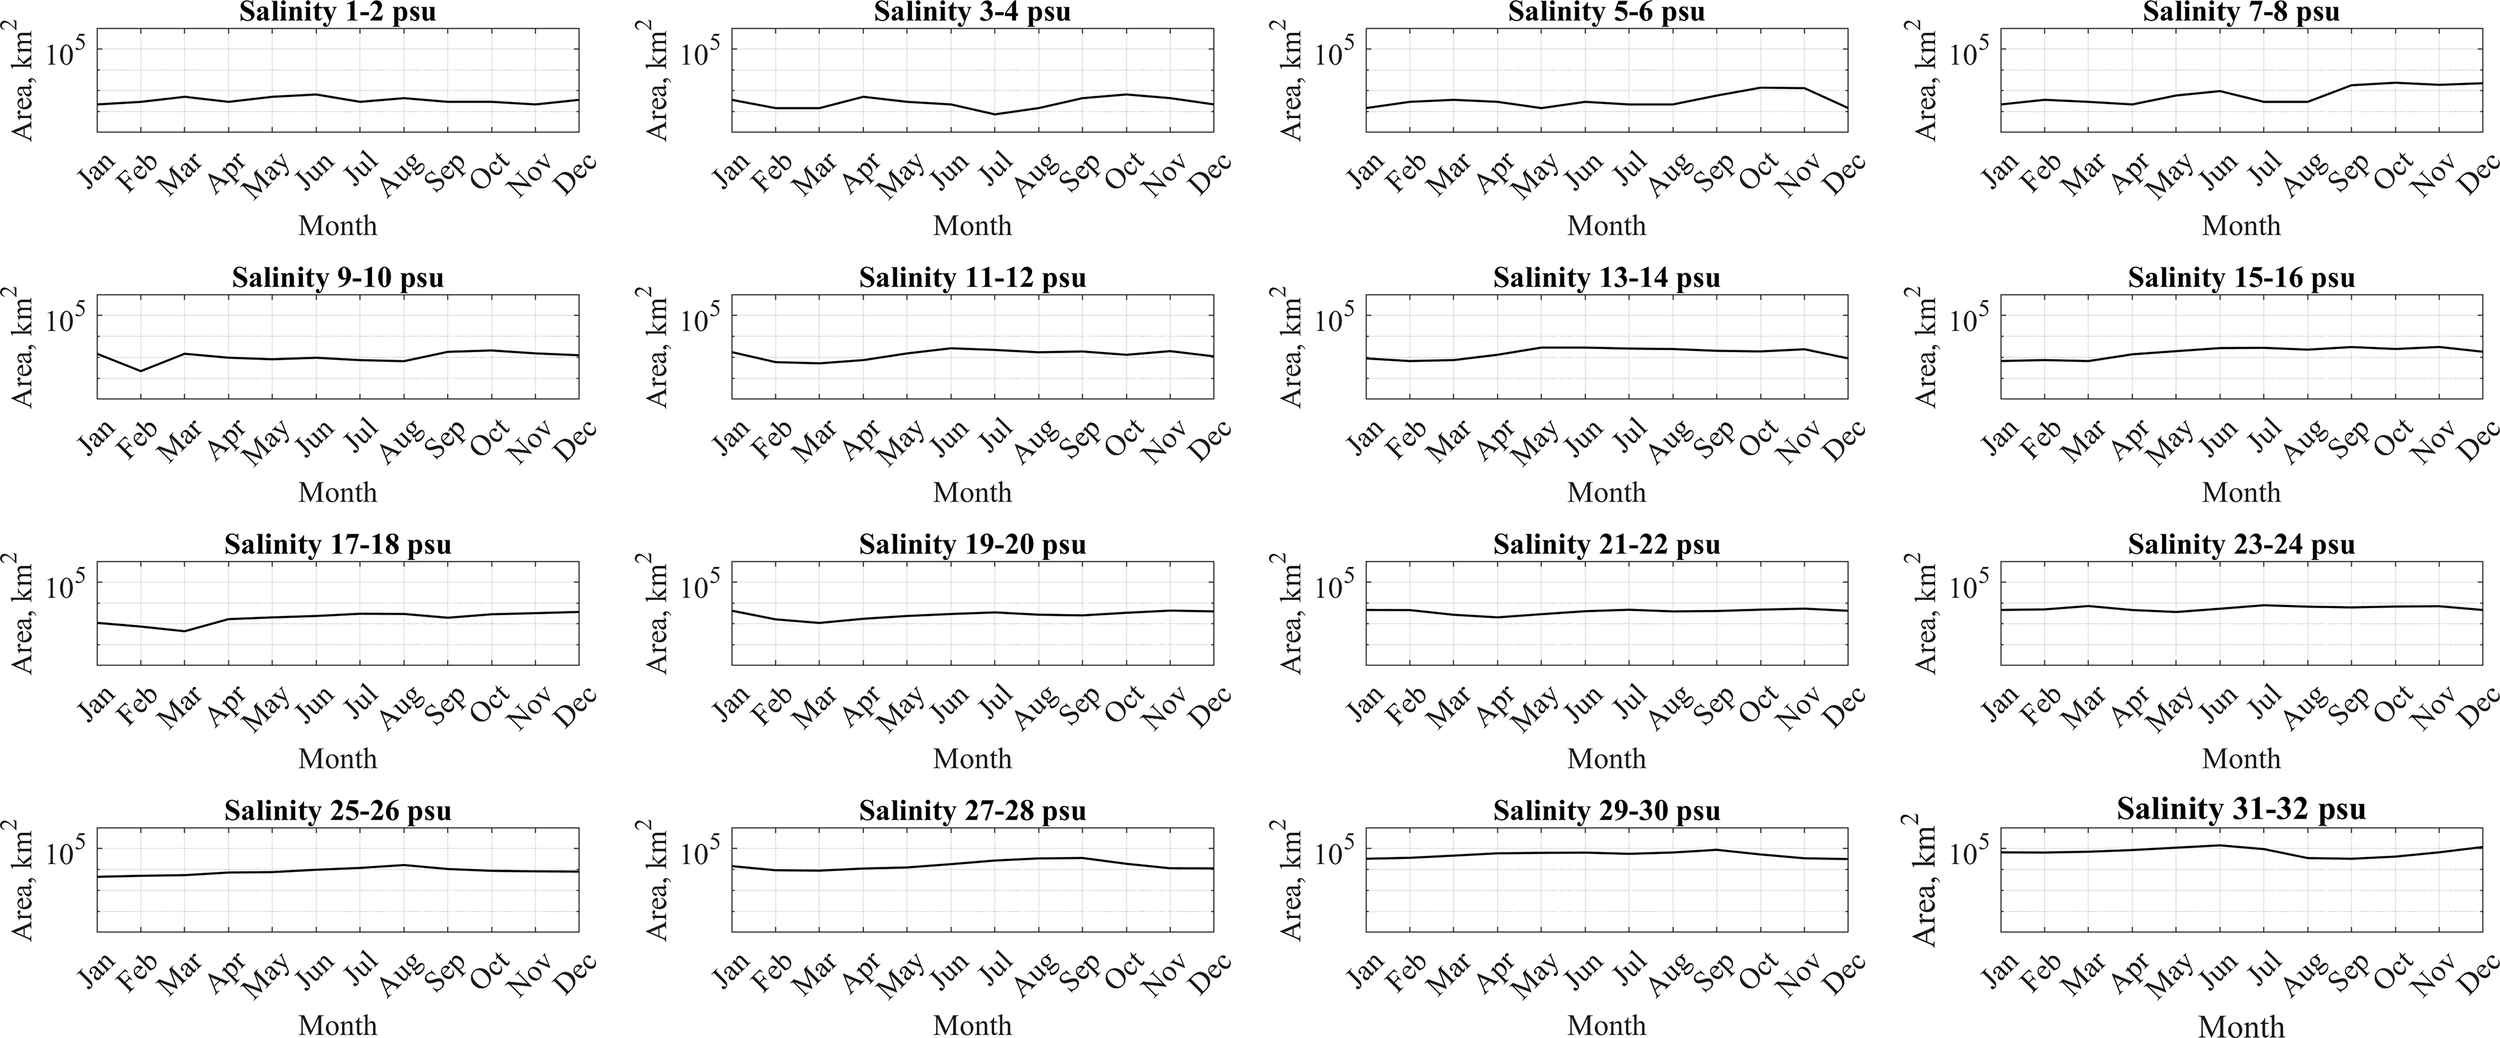
Mean surface sea areas within certain isohalines for the Changjiang plume and the adjacent sea.
River plumes with low vertical mixing, namely, the Amazon, Congo, and Mississippi plumes, have strong horizontal advection of riverine water from river mouth to open sea. This feature is demonstrated by the temporal shifts of months with peak areas between the isohalines. The greater are the isohalines, the later the related peak area is observed after the peak river discharge (Figure 10). On the other hand, the areas of intermediate and higher salinity waters are also regulated by vertical mixing, which in certain cases tends to increase these areas. The Amazon plume exhibits the largest spatial extent of low-saline waters (1–8 psu) during winter-spring period, which is related to the peak river discharge. Later in April–May, a gradual reduction in the area of low-saline water is observed, accompanied by an expansion of medium-saline waters (9–24 psu). By June–August, the maximal spatial coverage shifts to high-saline waters (25–32 psu) spanning over 105–106 km². During autumn, this trend reverses, the area of high-saline waters decreases, while low-saline and medium-saline waters expand. It completes the annual surface salinity cycle in this area.
Note that at salinities of 9–16 psu, the overall trend (the increase in March-April and April-May) is masked by unexpected peaks in February (9–12 psu) and October-November (13–16 psu). The peak in February is possibly caused by the following feature. The increase in river discharge in February leads to increase in both low and intermediate salinities. Peak river discharge in March-May causes very prominent increase in low salinities and more moderate increase in intermediate salinities, because it forms very strong vertical stratification and inhibits vertical mixing at the study point. The subsequent spread of the river plume is primarily driven by horizontal advection. The increase in low salinities (1–8 psu) occurs in March-May, while the increase in intermediate salinities (9–12 psu) occurs later in May-July. As a result, the increase in low salinities (1–8 psu) in February is surpassed by later increase in March, while the increase in intermediate salinities (9–12 psu) in February remains greater than the peak in May-July. It could be caused by advection of low saline water off the river mouth in March-May and its slower transformation to intermediate saline water in May-July due to inhibited vertical mixing in the Amazon plume, as compared to more intense of low saline water to intermediate saline water in February with less volume of low saline water (due to smaller river discharge), smaller vertical stratification and greater vertical mixing.
The peak in October-November at salinities of 13–16 psu is preceded by a smaller peak in August at salinities of 5–8 psu and in September at salinities of 9–12 psu. Moreover, it is followed by a smaller peak in December-January at salinities of 17–24 psu. We presume that this feature is caused by the advection of the Amazon plume by the complex ocean current system in the Western Equatorial Atlantic, namely, the interplay between the North Equatorial Current and the North Equatorial Countercurrent (Morozov et al., 2024).
Similar seasonal pattern is observed for the Congo and Mississippi plumes. In the Congo plume, freshened waters (<23 psu) dominate during winter-spring, transitioning to high-saline waters (>25 psu) by summer with the maximal area of ~105 km². Salinity decreases later in autumn. The Mississippi plume has similar regime with freshened waters reaching maximal extent in late spring and early summer, while high-saline waters prevail by late summer. Both plumes exhibit a distinct intra-annual shift for waters of low and high salinities, transitioning from freshened waters near the estuary to saline open-ocean conditions over a period of 2–3 months. This shift reflects velocity of horizontal advection of river discharge from the estuarine zones towards the open ocean.
River plumes with moderate vertical mixing, namely, the Ganges–Brahmaputra, Orinoco, Rio de la Plata, Ob–Yenisei, and Lena plumes, have less prominent horizontal advection within the plumes, but distinct advection from the plumes to open sea. In the Ganges–Brahmaputra plume, the expansion of freshened waters (9–24 psu) occurs gradually and uniformly from early summer to late autumn, while the area of high-saline waters (25–32 psu) expands a half year later during winter-spring period (Figure 11). Similarly, the freshened waters of the Ob–Yenisei and Lena plumes expand from early spring through late summer. The area of high-saline waters increases in late autumn and remain large until spring. The Orinoco plume demonstrates the largest spreading of surface freshened waters from February to October. The largest areas of saline waters are confined to winter and early spring months. The Rio de la Plata plume has less prominent seasonal variability due to the smallest seasonal river runoff variability. Nevertheless, the largest area of the Rio de la Plata plume is observed in summer and early autumn followed by reduced area in winter and early spring. In general, consistent seasonal changes of salinity gradient are evident across the Ganges–Brahmaputra, Orinoco, Rio de la Plata, Ob–Yenisei, and Lena plumes, transitioning from freshened waters near the river estuaries to saline open-ocean conditions. This shift occurs over a period ranging from 5 to 9 months reflecting the average residence time of river discharge within these plumes.
The Changjiang and St. Lawrence plumes experience intense vertical mixing, which results in absence of pronounced seasonal cycle in their isohaline distribution. Neither freshened waters of these plumes, nor saline marine waters exhibit substantial seasonal shifts in their spatial extents (Figure 12). Consequently, the intensity of horizontal advection driven by river-ocean transport appears negligible in these river plume systems in comparison with vertical mixing.
4 Discussion and conclusions
In this study, we aim to investigate the fate of river discharge in the shelf and open ocean waters. We focus on 10 largest river plumes in the World Ocean formed by the Amazon, Ganges–Brahmaputra, Congo, Orinoco, Ob–Yenisei, Changjiang, Rio de la Plata, Mississippi, Lena, and St. Lawrence rivers. For this purpose, we analyze CMEMS GLORYS12v1 ocean reanalysis data, which provides global coverage with 1/12° spatial resolution and daily temporal resolution. Despite certain limitations inherent to all global ocean reanalysis (mainly related to their accuracy in reconstruction of salinity fields) they are the only data sources that could be used to study and compare the 10 largest river plumes. Year-round coverage of all these river plumes by in situ salinity measurements with high enough spatial and temporal resolution does not seem to be real even in the next few decades.
First, we determine and compare areas, volumes, horizontal and vertical structure of the considered river plumes. River plume boundaries can be determined using multiple approaches, e.g., the exact salinity value or maximal salinity gradient (Fong and Geyer, 2002; Hetland, 2005; Osadchiev et al., 2021a; 2021b), maximal pressure gradient (McCabe et al., 2008), maximal divergence of horizontal velocity (Garvine, 1987), satellite-derived values of temperature, concentration of chlorophyll a, suspended matter, etc (Guerrero et al., 1997; Lemos et al., 2022; Ody et al., 2022; Martins and Stammer, 2022; Konik and Osadchiev, 2025). Choice of the approach depends on the available data and the analyzed processes in river plumes. In this study, we analyzed horizontal and vertical salinity gradients to determine outer borders of river plumes. In the 25–30 psu range, horizontal salinity gradients commonly peaked at ~1 psu/km, marking the outer borders of the considered river plumes. Maximal vertical salinity gradients (with values up to 0.1 psu/m at the considered river plumes) defined thickness of the surface mixed layer associated with river plumes. Together, these diagnostics provided the most accurate assessment of river plume boundaries in both horizontal and vertical dimensions that could be applied to large river plumes.
Second, we reveal the relation of seasonal variability of the river plumes on the river runoff variability and assess the residence time of river water in the river plumes. River plumes act as transient pathways for freshwater discharge from river mouths to open ocean. Freshwater enters river plumes through river mouths and gradually mixes as it propagates seaward. As a result, freshwater parcels increase their salinities, i.e., they steadily cross the isohalines from river mouth to outer plume border. Residence time of freshwater within a river plume is determined by the time lag of response of these isohalines to river discharge variability, such as seasonal freshet-drought cycle or flash floods.
Annual variability of salinity in 10 largest river plumes generally follows the seasonal river discharge cycle with decreasing salinities during and after the high discharge periods followed by increasing salinities as a result of plume-sea mixing. The time lag between the peak river discharge and the maximal river plume area reflects the response of the river plume to discharge variability. For all considered 10 largest river plumes, regardless of their size, their response to river discharge variability is equal to 1–3 months (except the Changjiang plume due to very strong mixing). The time lag between the maximal and minimal plume areas is indicative of freshwater residence time in the river plume. This residence time varies from 4–6 months for the Amazon and Mississippi plumes to 10–11 months for the Congo, Ganges–Brahmaputra, Rio de la Plata, Changjiang, St. Lawrence plumes.
Based on the performed analysis of seasonal variability of plume area, depth, horizontal and vertical salinity structure, we could distinguish three groups among the considered 10 largest river plumes that have different vertical mixing regimes and horizontal advection patterns (Figure 13). The Amazon, Congo, and Mississippi plumes have low mixing regimes (advective plumes) (Figure 13A). These plumes have small thickness, stable stratification and strong vertical salinity gradients that inhibit vertical mixing at the plume-sea interface. This process is supported by (1) extremely large river discharge for the Amazon plume, that overcomes strong tidal forcing; (2) large river discharge for the Congo and Mississippi plumes, that overcomes moderate or low tidal forcing in the spreading areas of these river plumes. Salinity increase in these river plumes in a seasonal cycle is governed by horizontal advection of freshwater at large distances from the river mouths followed by vertical mixing at more shallow and less stratified outer parts of the plumes.
Figure 13
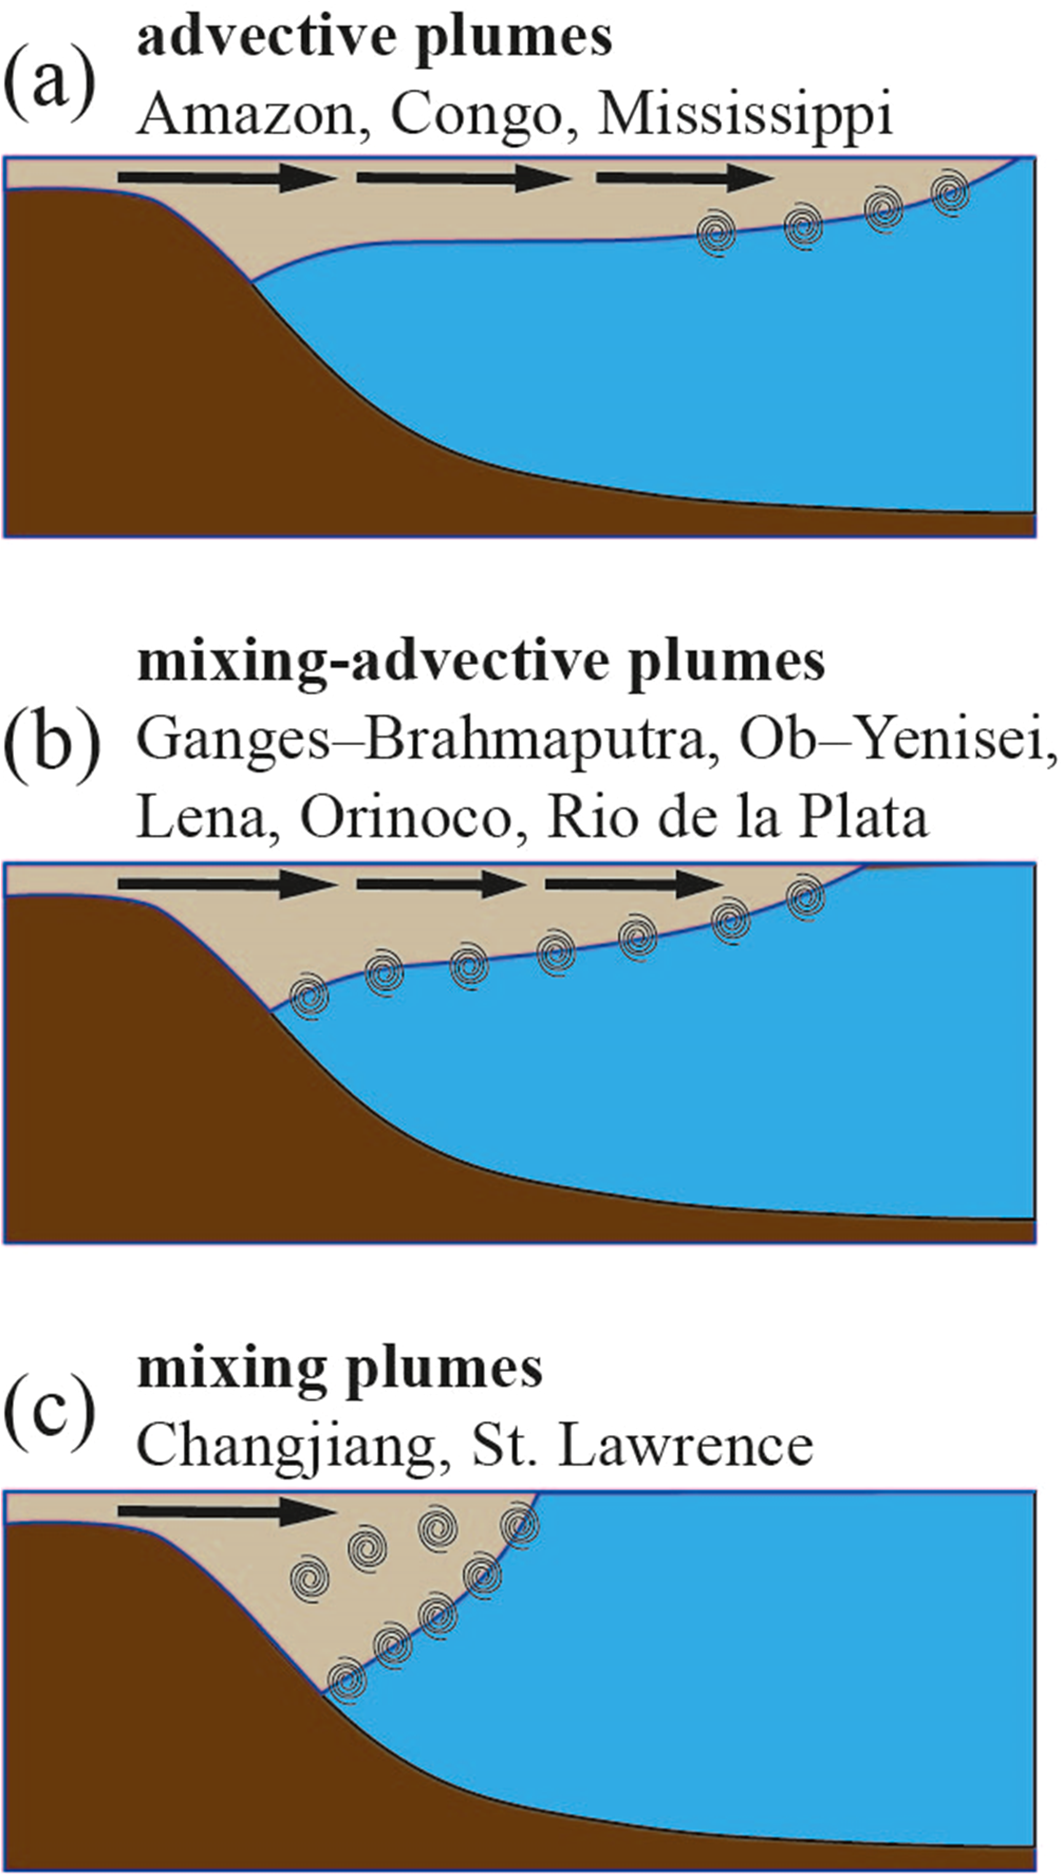
The general scheme of three different mixing regimes in the large river plumes, namely, advective (A), mixing-advective (B), and mixing (C).
Intermediate mixing regime (mixing-advective plumes) is observed at the Ganges–Brahmaputra, Ob–Yenisei, Lena, Orinoco, and Rio de la Plata plumes (Figure 13B). These river plumes form stratified surface layers during high the discharge period, which is eroded during the low discharge season. Salinity below these river plumes exhibits pronounced seasonal variability reflecting freshwater entrainment as a result of vertical mixing after the freshet season and increased freshwater volume in these plumes. Mixing at the plume-sea interfaces is driven by (1) moderate tidal forcing (for the Ganges–Brahmaputra and Orinoco plumes) (Fournier et al., 2017; Rose and Bhaskaran, 2017; Bhagawati et al., 2018); (2) river-sea exchange flows in wide river estuary (for the Rio de la Plata plume) (Guerrero et al., 1997); (3) reduced freshwater discharge during the cold season for the Arctic rivers (for the Ob–Yenisei and Lena plumes) (Osadchiev et al., 2021a, 2021b). Salinity increase in these river plumes in a seasonal cycle is governed by both vertical mixing and horizontal advection.
The Changjiang and St. Lawrence plumes exhibit strong mixing regimes (mixing plumes) (Figure 13C). In these river plumes, inflowing river discharge is rapidly mixed till the depths of >50 m. As a result, these plumes have the highest surface salinities (>30 psu) and the weakest stratification among the considered 10 largest river plumes. Vertical salinity gradients at the Changjiang and St. Lawrence plumes are < 0.1 psu/m even during the flooding season and reduce by one order of magnitude during the drought season. Strong mixing is governed by (1) strong tidal forcing for the Changjiang plume (Wu et al., 2011; Li and Rong, 2012); (2) the combined effect of moderate tidal forcing, river-sea exchange flows in wide river estuary, and winter convection for the St. Lawrence plume (Galbraith, 2006; Ohashi and Sheng, 2013; Dumas and Gilbert, 2023).
In summary, river plumes represent dynamic transition zones where the interplay between river discharge, advection, and mixing governs the freshwater retention. Location of horizontal and vertical boundaries of river plumes reflects the ultimate balance between river discharge, advection and mixing. Tidal forcing is the primary mixing process that affects most of the largest river plumes in the World Ocean (McCabe et al., 2009; Baldoni et al., 2022; Schlichting et al., 2023; Dzwonkowski et al., 2023). Mixing also could be caused by river-sea exchange flows for plumes formed by rivers with wide estuaries, and winter convection for plumes located in certain regions in moderate and polar latitudes. Horizontal mixing plays much less important role than wind- and buoyancy-driven advection and vertical mixing in regulating the area and internal structure of large river plumes (e.g., Horner-Devine et al., 2015).
The obtained results show that differences in mixing regimes control the efficiency of vertical exchange of nutrients, organic matter, and suspended sediments between riverine and marine environments, thereby influencing coastal productivity and carbon cycling on both regional and global scales (Liu et al., 2002; Shi, 2010). The related effects were reported in many previous studies of river plumes in different coastal areas of the World Ocean region, where specific attention was given to the role of coastal circulation, topographic constraints, and lateral advection in shaping the dispersion pathways, vertical stratification, and temporal variability of river plumes (Hickey et al., 2005; Saldias et al., 2012; 2016; Rojas et al., 2022; Salcedo-Castro et al., 2023).
The provided classification of large river plumes into three types, namely, advective, mixing-advective and mixing plumes, highlights the relative roles of horizontal advection and vertical mixing in determining the fate of freshwater in the ocean (Figure 13). The mixing-advective plumes have the largest areas where seasonal variability of river discharge significantly affects the vertical thermohaline structure of the ocean. The whole spreading area of a mixing-advective plume has intense vertical plume-sea mixing which governs distinct seasonal salinity variation in the underlying seawater. For the advective plumes, intense vertical plume-sea mixing typically occurs only at the outer parts of these river plumes. As a result, thermohaline structure of seawater below the advective plumes is relatively stable at areas adjacent to river mouths and has seasonal changes at the outer parts of advective plumes. The mixing plumes cause the lowest seasonal changes in thermohaline structure of ambient ocean, which occur only in the areas adjacent to the river mouths.
The balance among river discharge, advection, and mixing conditions governs the response of river plumes to variability in river inflow, as well as the residence time of freshwater within them. The obtained results provide the framework that explains the relationships between plume forcing and mixing in the large river plumes. It is essential for understanding the influence of river discharge on the ocean thermohaline structure, as well as the ultimate fate of river plumes as they merge with and alter ambient shelf and ocean waters.
Statements
Data availability statement
The original contributions presented in the study are included in the article/supplementary material. Further inquiries can be directed to the corresponding author.
Author contributions
AK: Writing – review & editing, Conceptualization, Funding acquisition, Writing – original draft, Formal analysis, Data curation. AO: Writing – original draft, Formal analysis, Conceptualization, Methodology, Writing – review & editing.
Funding
The author(s) declared financial support was received for this work and/or its publication. This research was funded by the Russian Science Foundation, project 25-47-01005 (https://rscf.ru/en/project/25-47-01005/) (analysis of river plume structure) and the Moscow Institute of Physics and Technology under the Agreement No. 075-03-2025–662 dated January 17, 2025 (processing of ocean reanalysis data).
Conflict of interest
The author(s) declared that this work was conducted in the absence of any commercial or financial relationships that could be construed as a potential conflict of interest.
Generative AI statement
The author(s) declared that generative AI was not used in the creation of this manuscript.
Any alternative text (alt text) provided alongside figures in this article has been generated by Frontiers with the support of artificial intelligence and reasonable efforts have been made to ensure accuracy, including review by the authors wherever possible. If you identify any issues, please contact us.
Publisher’s note
All claims expressed in this article are solely those of the authors and do not necessarily represent those of their affiliated organizations, or those of the publisher, the editors and the reviewers. Any product that may be evaluated in this article, or claim that may be made by its manufacturer, is not guaranteed or endorsed by the publisher.
References
1
Baird M. E. Mongin M. Skerratt J. Margvelashvili N. Tickell S. Steven A. D. et al . (2021). Impact of catchment-derived nutrients and sediments on marine water quality on the Great Barrier Reef: An application of the eReefs marine modelling system. Mar. Poll. Bull.167, 112297. doi: 10.1016/j.marpolbul.2021.112297
2
Baldoni A. Perugini E. Penna P. Parlagreco L. Brocchini M. (2022). A comprehensive study of the river plume in a microtidal setting. Estuar. Coast. Shelf Sci.275, 107995. doi: 10.1016/j.ecss.2022.107995
3
Basdurak N. B. Largier J. L. (2022). Wind effects on small-scale river and creek plumes. J. Geophys. Res. Oceans127, e2021JC018381. doi: 10.1029/2021JC018381
4
Basdurak N. B. Largier J. L. Nidzieko N. J. (2020). Modeling the dynamics of small-scale river and creek plumes in tidal waters. J. Geophys. Res. Oceans125, e2019JC015737. doi: 10.1029/2019JC015737
5
Bhagawati C. Pandey S. Dandapat S. Chakraborty A. (2018). Dynamical significance of tides over the Bay of Bengal. Dyn. Atmos. Oceans82, 89–106. doi: 10.1016/j.dynatmoce.2018.05.002
6
Burchard H. Schuttelaars H. M. Ralston D. K. (2018). Sediment trapping in estuaries. Ann. Rev. Mar. Sci.10, 371–395. doi: 10.1146/annurev-marine-010816-060535
7
Burrage D. Wesson J. Martinez C. Pérez T. Möller O. Jr. Piola A. (2008). Patos Lagoon outflow within the Rio de la Plata plume using an airborne salinity mapper: Observing an embedded plume. Cont. Shelf Res.28, 1625–1638. doi: 10.1016/j.csr.2007.02.014
8
Chi Y. Rong Z. (2023). Effects of breaking and non-breaking surface wave mixing on the Changjiang river plume dynamics in summer. J. Geophys. Res. Oceans128, e2022JC019501. doi: 10.1029/2022JC019501
9
Clark J. B. Mannino A. Tzortziou M. Spencer R. G. Hernes P. (2022). The transformation and export of organic carbon across an Arctic river-delta-ocean continuum. J. Geophys. Res. Biogeosci.127, e2022JG007139. doi: 10.1029/2022JG007139
10
Dai A. (2021). Hydroclimatic trends during 1950–2018 over global land. Clim. Dyn.56, 4027–4049. doi: 10.1007/s00382-021-05684-1
11
Dumas J. Gilbert D. (2023). Comparison of SMOS, SMAP and in situ sea surface salinity in the Gulf of St. Lawrence. Atmos. Ocean61, 148–161. doi: 10.1080/07055900.2022.2155103
12
Dzwonkowski B. Kang X. Sahoo B. Veeramony J. Mitchell S. Xia M. (2023). Mixing and transport in estuaries and coastal waters: A special issue in Estuarine, Coastal and Shelf Science. Estuar. Coast. Shelf Sci.288, 108370. doi: 10.1016/j.ecss.2023.108370
13
Ferchiche F. Liénart C. Charlier K. Coynel A. Gorse-Labadie L. Savoye N. (2024). Quantifying particulate organic matter: source composition and fluxes at the river-estuary interface. Front. Freshw. Sci.2. doi: 10.3389/ffwsc.2024.1437431
14
Fong D. A. Geyer W. R. (2002). The alongshore transport of freshwater in a surface-trapped river plume. J. Phys. Oceanogr.32, 957–972. doi: 10.1175/1520-0485(2002)032<0957:TATOFI>2.0.CO;2
15
Fournier S. Vandemark D. Gaultier L. Lee T. Jonsson B. Gierach M. M. (2017). Interannual variation in offshore advection of Amazon-Orinoco plume waters: Observations, forcing mechanisms, and impacts. J. Geophys. Res. Oceans122, 8966–8982. doi: 10.1002/2017JC013103
16
Frey D. I. Osadchiev A. A. (2021). Large river plumes detection by satellite altimetry: case study of the Ob-Yenisei plume. Rem. Sens.13, 5014. doi: 10.3390/rs13245014
17
Galbraith P. S. (2006). Winter water masses in the Gulf of St. Lawrence. J. Geophys. Res.111, C06022. doi: 10.1029/2005JC003159
18
Galbraith P. S. Chassé J. Nicot P. Caverhill C. Gilbert D. Pettigrew B. et al . (2015). Physical oceanographic conditions in the Gulf of St. Lawrence in 2014. DFO Can. Sci. Advis. Sec. Res. Doc. v + 82.
19
Garvine R. W. (1987). Estuary plumes and fronts in shelf waters: A layer model. J. Phys. Oceanogr.17, 1877–1896. doi: 10.1175/1520-0485(1987)017<1877:EPAFIS>2.0.CO;2
20
Gevaudan M. Durand F. Jouanno J. (2022). Influence of the Amazon-Orinoco discharge interannual variability on the western tropical Atlantic salinity and temperature. J. Geophys. Res. Oceans127, e2022JC018495. doi: 10.1029/2022JC018495
21
Geyer W. R. Beardsley R. C. Lentz S. J. Candela J. Limeburner R. Johns W. E. et al . (1996). Physical oceanography of the Amazon shelf. Cont. Shelf Res.16, 575–616. doi: 10.1016/0278-4343(95)00051-8
22
Geyer W. R. Hill P. Milligan T. Traykovski P. (2000). The structure of the Eel River plume during floods. Cont. Shelf Res.20, 2067–2093. doi: 10.1016/S0278-4343(00)00063-7
23
Geyer W. R. MacCready P. (2014). The estuarine circulation. Ann. Rev. Fluid Mech.46, 175–197. doi: 10.1146/annurev-fluid-010313-141302
24
Guan S. Huang M. Lin I. I. Wu H. Lin Y. Wu Z. et al . (2025). Widespread sea surface salinification induced by tropical cyclones over the Changjiang River Plume. Commun. Earth Environ.6, 337. doi: 10.1038/s43247-025-02317-x
25
Guerrero R. A. Acha E. M. Framinan M. B. Lasta C. A. (1997). Physical oceanography of the Rio de la Plata Estuary, Argentina. Cont. Shelf Res.17, 727–742. doi: 10.1016/S0278-4343(96)00061-1
26
Harrigan S. Zsoter E. Alfieri L. Prudhomme C. Salamon P. Wetterhall F. et al . (2020). GloFAS-ERA5 operational global river discharge reanalysis 1979–present. Earth Syst. Sci. Data12, 2043–2060. doi: 10.5194/essd-12-2043-2020
27
Hetland R. (2005). Relating river plume structure to vertical mixing. J. Phys. Oceanogr.35, 1667–1688. doi: 10.1175/JPO2774.1
28
Hickey B. Geier S. Kachel N. MacFadyen A. (2005). A bi-directional river plume: The Columbia in summer. Cont. Shelf Res.25, 1631–1656. doi: 10.1016/j.csr.2005.04.010
29
Horner-Devine A. R. Hetland R. D. MacDonald D. G. (2015). Mixing and transport in coastal river plumes. Ann. Rev. Fluid Mech.47, 569–594. doi: 10.1146/annurev-fluid-010313-141408
30
Hou X. Xie D. Feng L. Shen F. Nienhuis J. H. (2024). Sustained increase in suspended sediments near global river deltas over the past two decades. Nat. Commun.15, 3319. doi: 10.1038/s41467-024-47598-6
31
Kang S.-Y. Moon J.-H. Kim T. Jeon C. Song Y. T. (2024). Impact of river-discharged freshwater on surface ocean environments revealed by synergistic use of satellite measurements in the East China Sea. Estuar. Coast. Shelf Sci.307, 108909. doi: 10.1016/j.ecss.2024.108909
32
Kang Y. Pan D. Bai Y. He X. Chen X. Chen C. T. A. et al . (2013). Areas of the global major river plumes. Acta Oceanol. Sin.32, 79–88. doi: 10.1007/s13131-013-0269-5
33
Kilcher L. F. Nash J. D. (2010). Structure and dynamics of the Columbia River tidal plume front. J. Geophys. Res. Oceans115, C5. doi: 10.1029/2009JC006066
34
Konik A. A. Osadchiev A. A. (2025). Dynamics of the Iokanga River plume according to SAR and optical satellite data. J. Mar. Sys.250, 104093. doi: 10.1016/j.jmarsys.2025.104093
35
Korotenko K. A. Osadchiev A. A. Zavialov P. O. Kao R.-C. Ding C.-F. (2014). Effects of bottom topography on dynamics of river discharges in tidal regions: case study of twin plumes in Taiwan Strait. Ocean Sci.10, 865–879. doi: 10.5194/os-10-863-2014
36
Lane R. R. Day J. W. Jr. Marx B. D. Reyes E. Hyfield E. Day J. N. (2007). The effects of riverine discharge on temperature, salinity, suspended sediment and chlorophyll a in a Mississippi delta estuary measured using a flow-through system. Estuar. Coast. Shelf Sci.74, 145–154. doi: 10.1016/j.ecss.2007.04.008
37
Lavergne C. Madec G. Le Sommer J. Nurser A. J. G. Naveira Garabato A. C. (2016). The impact of a variable mixing efficiency on the abyssal overturning. J. Phys. Oceanogr.46, 663–681. doi: 10.1175/JPO-D-14-0259.1
38
Lemos A. T. Osadchiev A. Mazzini P. L. Mill G. N. Fonseca S. A. Ghisolfi R. D. (2022). Spreading and accumulation of river-borne sediments in the coastal ocean after the environmental disaster at the Doce River in Brazil. Ocean Coast. Res.70, e22025. doi: 10.1590/2675-2824070.21097atl
39
Lentz S. J. Fewings M. R. (2012). The wind- and wave-driven inner-shelf circulation. Ann. Rev. Mar. Sci.41, 317–343. doi: 10.1146/annurev-marine-120709-142745
40
Li M. Rong Z. (2012). Effects of tides on freshwater and volume transports in the Changjiang River plume. J. Geophys. Res. Oceans117, C6. doi: 10.1029/2011JC007716
41
Li Z. Huang S. Zhu X. Sun Z. Long Y. Xie H. (2021). Short-term offshore extension of Brahmaputra-Ganges and Irrawaddy freshwater plumes to the central northern Bay of Bengal based on in situ and satellite observations. Acta Oceanol. Sin.40, 80–93. doi: 10.1007/s13131-021-1729-y
42
Liang S. Yang J. Bai P. Wu Q. Yu C. Ruan Z. et al . (2025). High-frequency detachment of low salinity water from the Changjiang River plume. Ocean Model.196, 102538. doi: 10.1016/j.ocemod.2025.102538
43
Liu J. T. Chao S.-Y. Hsu R. T. (2002). Numerical modeling study of sediment dispersal by a river plume. Cont. Shelf Res.22, 1745–1773. doi: 10.1016/S0278-4343(02)00036-5
44
MacCready P. Geyer W. R. (2010). Advances in estuarine physics. Ann. Rev. Mar. Sci.2, 35–58. doi: 10.1146/annurev-marine-120308-081015
45
Maciel F. P. Santoro P. E. Pedocchi F. (2021). Spatio-temporal dynamics of the Río de la Plata turbidity front: Combining remote sensing with in-situ measurements and numerical modeling. Cont. Shelf Res.213, 104301. doi: 10.1016/j.csr.2020.104301
46
Martins M. S. Stammer D. (2022). Interannual variability of the Congo River plume-induced sea surface salinity. Rem. Sens.14, 1013. doi: 10.3390/rs14041013
47
Mazzini P. L. F. Chant R. J. (2016). Two-dimensional circulation and mixing in the far field of a surface-advected river plume. J. Geophys. Res. Oceans121, 3757–3776. doi: 10.1002/2015JC011059
48
McCabe R. M. Hickey B. M. MacCready P. (2008). Observational estimates of entrainment and vertical salt flux in the interior of a spreading river plume. J. Geophys. Res. Oceans113, C08027. doi: 10.1029/2007JC004361
49
McCabe R. M. MacCready P. Hickey B. M. (2009). Ebb-tide dynamics and spreading of a large river plume. J. Phys. Oceanogr.39, 2839–2856. doi: 10.1175/2009JPO4061.1
50
Molinas E. Vinzon S. B. de Paula Xavier Vilela C. Gallo M. N. (2014). Structure and position of the bottom salinity front in the Amazon Estuary. Ocean Dyn.64, 1583–1599. doi: 10.1007/s10236-014-0763-0
51
Morozov E. G. Frey D. I. Salyuk P. A. Budyansky M. V. (2024). Amazon River plume in the western tropical North Atlantic. J. Mar. Sci. Eng.12, 851. doi: 10.3390/jmse12060851
52
Nash J. D. Kilcher L. F. Moum J. N. (2009). Structure and composition of a strongly stratified, tidally pulsed river plume. J. Geophys. Res. Oceans114, C2. doi: 10.1029/2008JC005036
53
Nof D. Pichevin T. (2001). The ballooning of outflows. J. Phys. Oceanogr.31, 3045–3058. doi: 10.1175/1520-0485(2001)031<3045:TBOO>2.0.CO;2
54
Ody A. Doxaran D. Verney R. Bourrin F. Morin G. P. Pairaud I. et al . (2022). Ocean color remote sensing of suspended sediments along a continuum from rivers to river plumes: concentration, transport, fluxes and dynamics. Rem. Sens.14, 2026. doi: 10.3390/rs14092026
55
Ohashi K. Sheng J. (2013). Influence of St. Lawrence discharge on the circulation and hydrography in Canadian Atlantic waters. Cont. Shelf Res.58, 32–49. doi: 10.1016/j.csr.2013.03.005
56
Osadchiev A. Barymova A. Sedakov R. Zhiba R. Dbar R. (2020). Spatial structure, short-temporal variability, and dynamical features of small river plumes as observed by aerial drones: Case study of the Kodor and Bzyp river plumes. Rem. Sens.12, 3079. doi: 10.3390/rs12183079
57
Osadchiev A. A. Frey D. I. Shchuka S. A. Tilinina N. D. Morozov E. G. Zavialov P. O. (2021b). Structure of freshened surface layer in the Kara Sea during ice-free periods. J. Geophys. Res. Oceans126, e2020JC016486. doi: 10.1029/2020JC016486
58
Osadchiev A. Frey D. Spivak E. Shchuka S. Tilinina N. Semiletov I. (2021a). Structure and inter-annual variability of the freshened surface layer in the Laptev and East-Siberian seas during ice-free periods. Front. Mar. Sci.8. doi: 10.3389/fmars.2021.735011
59
Osadchiev A. A. Konovalova O. P. Gordey A. S. (2021d). Water exchange between the Gulf of Ob and the Kara Sea during ice-free seasons: the roles of river discharge and wind forcing. Front. Mar. Sci.8. doi: 10.3389/fmars.2021.741143
60
Osadchiev A. A. Korotenko K. A. Zavialov P. O. Chiang W.-S. Liu C.-C. (2016). Transport and bottom accumulation of fine river sediments under typhoon conditions and associated submarine landslides: case study of the Peinan River, Taiwan. Nat. Hazards Earth Syst. Sci.16, 41–54. doi: 10.5194/nhess-16-41-2016
61
Osadchiev A. Sedakov R. Barymova A. (2021c). Response of a small river plume on wind forcing. Front. Mar. Sci.8. doi: 10.3389/fmars.2021.809566
62
Osadchiev A. Sedakov R. Frey D. Gordey A. Rogozhin V. Zabudkina Z. et al . (2023). Intense zonal freshwater transport in the Eurasian Arctic during ice-covered season revealed by in situ measurements. Sci. Rep.13, 16508. doi: 10.1038/s41598-023-43524-w
63
Osadchiev A. Viting K. Frey D. Demeshko D. Dzhamalova A. Nurlibaeva A. et al . (2022). Structure and circulation of Atlantic water masses in the St. Anna Trough in the Kara Sea. Front. Mar. Sci.9. doi: 10.3389/fmars.2022.915674
64
Osadchiev A. Yankovsky A. (2022). Editorial: River plumes and estuaries. Front. Mar. Sci.9. doi: 10.3389/fmars.2022.986114
65
Pargaonkar S. M. Vinayachandran P. N. (2021). Wind forcing of the Ganga-Brahmaputra river plume. Ocean Dyn.71, 125–156. doi: 10.1007/s10236-020-01429-6
66
Pimenta F. M. Kirwan A. D. Jr. (2014). The response of large outflows to wind forcing. Cont. Shelf Res.89, 24–37. doi: 10.1016/j.csr.2013.11.006
67
Rojas C. M. Saldías G. S. Flores R. P. Vásquez S. I. Salas C. Vargas C. A. (2022). A modeling study of hydrographic and flow variability along the river-influenced coastal ocean off central Chile. Ocean Model.181, 102155. doi: 10.1016/j.ocemod.2022.102155
68
Romero L. Siegel D. A. McWilliams J. C. Uchiyama Y. Jones C. (2016). Characterizing storm water dispersion and dilution from mall coastal streams. J. Geophys. Res. Oceans121, 3926–3943. doi: 10.1002/2015JC011323
69
Rose L. Bhaskaran P. K. (2017). Tidal propagation and its non-linear characteristics in the Head Bay of Bengal. Estuar. Coast. Shelf Sci.188, 181–198. doi: 10.1016/j.ecss.2017.02.024
70
Salcedo-Castro J. Olita A. Saavedra F. Saldías G. S. Cruz-Gómez R. C. de la Torre Martínez C. D. (2023). Modeling the interannual variability in Maipo and Rapel river plumes off central Chile. Ocean Sci.19, 1687–1703. doi: 10.5194/os-19-1687-2023
71
Saldias G. S. Largier J. L. Mendes R. Perez-Santos I. Vargas C. A. Sobarzo M. (2016). Satellite-measured interannual variability of turbid river plumes off central-southern Chile: Spatial patterns and the influence of climate variability. Progr. Oceanogr.146, 212–222. doi: 10.1016/j.pocean.2016.07.007
72
Saldias G. S. Sobarzo M. Largier J. Moffat C. Letelier R. (2012). Seasonal variability of turbid river plumes off central Chile based on high-resolution MODIS imagery. Rem. Sens. Environ.123, 220–233. doi: 10.1016/j.rse.2012.03.010
73
Savin A. S. Osadchiev A. A. (2025). Ob-Yenisei and Lena plumes: wind-driven dynamics and variability. Front. Mar. Sci.12. doi: 10.3389/fmars.2025.1681563
74
Schlichting D. Qu L. Kobashi D. Hetland R. (2023). Quantification of physical and numerical mixing in a coastal ocean model using salinity variance budgets. J. Adv. Model. Earth Syst.15, e2022MS003380. doi: 10.1029/2022MS003380
75
Shi J. Z. (2010). Tidal resuspension and transport processes of fine sediment within the river plume in the partially-mixed Changjiang River estuary, China: A personal perspective. Geomorphology121, 133–151. doi: 10.1016/j.geomorph.2010.04.021
76
Tao W. Niu L. Dong Y. Fu T. Lou Q. (2021). Nutrient pollution and its dynamic source-sink pattern in the Pearl River Estuary (South China). Front. Mar. Sci.8. doi: 10.3389/fmars.2021.713907
77
Torregroza-Espinosa A. C. Restrepo J. C. Correa-Metrio A. Hoyos N. Escobar J. Pierini J. et al . (2020). Fluvial and oceanographic influences on suspended sediment dispersal in the Magdalena River Estuary. J. Mar. Syst.204, 103282. doi: 10.1016/j.jmarsys.2019.103282
78
Wu H. Zhu J. Shen J. Wang H. (2011). Tidal modulation on the Changjiang River plume in summer. J. Geophys. Res. Oceans116, C8. doi: 10.1029/2011JC007209
79
Wu J. Xiao K. Liu Y. Duque C. Wang Q. (2023). Nutrient biogeochemistry in the land-sea continuum. Front. Mar. Sci.10. doi: 10.3389/fmars.2023.1286709
80
Yankovsky A. E. Chapman D. C. (1997). A simple theory for the fate of buoyant coastal discharges. J. Phys. Oceanogr.27, 1386–1401. doi: 10.1175/1520-0485(1997)027<1386:astftf>2.0.co;2
81
Yuan Y. Tan X. Lin Y. T. (2023). Effect of sloping bottom on river plume dynamics on a laboratory-scale rotating table. Front. Mar. Sci.10. doi: 10.3389/fmars.2023.1126088
82
Zavialov P. O. Drozdova A. N. Möller O. O. Krylov I. N. Lentini C. A. Pérez C. R. et al . (2024). Note on volume and distribution of fresh water in the Amazon River plume under low discharge conditions. Environ. Res. Commun.6, 041002. doi: 10.1088/2515-7620/ad352e
83
Zavialov P. O. Izhitskiy A. S. Osadchiev A. A. Pelevin V. V. Grabovskiy A. B. (2015). The structure of thermohaline and bio-optical fields in the surface layer of the Kara Sea in September 2011. Oceanology55, 461–471. doi: 10.1134/S0001437015040177
84
Zeng C. Li D. Wang B. Jin H. Ye R. Sun Q. et al . (2025). Influences of nutrients on summer algal bloom in the Changjiang plume revealed by high-resolution profiles. Mar. Environ. Res.210, 107318. doi: 10.1016/j.marenvres.2025.107318
85
Zhao J. Gong W. Shen J. (2018). The effect of wind on the dispersal of a tropical small river plume. Front. Earth Sci.12, 170–190. doi: 10.1007/s11707-016-0628-6
86
Zhou X. Ge J. Wallhead P. Shi S. (2023). Changes in nutrient concentration resulting from floods and their impact on the estuary–sea continuum. J. Geophys. Res. Oceans128, e2022JC019327. doi: 10.1029/2022JC019327
Summary
Keywords
estuarine processes, ocean circulation, ocean mixing, river plume, surface layer, tidal forcing
Citation
Konik A and Osadchiev A (2026) Spreading and mixing of large river plumes in the World Ocean. Front. Mar. Sci. 13:1714561. doi: 10.3389/fmars.2026.1714561
Received
27 September 2025
Revised
13 January 2026
Accepted
23 January 2026
Published
06 February 2026
Volume
13 - 2026
Edited by
Chunyan Li, Louisiana State University, United States
Reviewed by
Guangyu Xu, University of Washington, United States
Raul Cruz, University Hospital of Guadalajara, Spain
Updates
Copyright
© 2026 Konik and Osadchiev.
This is an open-access article distributed under the terms of the Creative Commons Attribution License (CC BY). The use, distribution or reproduction in other forums is permitted, provided the original author(s) and the copyright owner(s) are credited and that the original publication in this journal is cited, in accordance with accepted academic practice. No use, distribution or reproduction is permitted which does not comply with these terms.
*Correspondence: Alexander Osadchiev, osadchiev@ocean.ru
Disclaimer
All claims expressed in this article are solely those of the authors and do not necessarily represent those of their affiliated organizations, or those of the publisher, the editors and the reviewers. Any product that may be evaluated in this article or claim that may be made by its manufacturer is not guaranteed or endorsed by the publisher.