Abstract
Introduction:
Nursery habitats sustain populations only when individuals are able to move to habitats used by later life stages. For anadromous fishes such as Alewife (Alosa pseudoharengus), anthropogenic barriers and drought can disrupt this connectivity, entrapping juveniles and potentially depressing year-class success. We hypothesized that drought, by preventing juveniles prepared to emigrate from the nursery, maintains them at relatively high densities and keeps forage at relatively low levels, thus depressing growth rates and body condition.
Methods:
Juvenile Alewife were sampled at the outlet of Bride Lake in East Lyme, Connecticut during a non-drought year and a prolonged drought year. We measured total length and dry mass, determined daily age from otoliths, quantified condition using the residual mass index, and estimated daily growth over the lifetime as well as in stanzas from 0 to 30 days, 0 to 100 days, and 70 to 100 days post hatch. Our sampling design enabled us to distinguish between year differences between early migrants and late migrants, who would be most affected by entrapment in the drought year.
Results:
The hypothesis was supported by data. Seasonal increase in size of emigrating fish was 50% lower in the year of drought than the previous year. Late emigrants that had been entrapped had reduced condition, grew less over their lifetime, and had lower condition than their counterparts the previous year. While growth over the first 30 days post-hatch, prior to the onset of drought, did not differ between years, growth from 70 to 100 days post-hatch, coincident with a period of drought in the second year, was less than that in the previous year.
Discussion:
Drought-induced entrapment curtailed growth and reduced size and condition of late-season juveniles, consistent with density-dependent competition, diminished forage, and declining autumn temperatures. Conservation of species of concern like the Alewife should prioritize maintaining juvenile connectivity. Future work should quantify entrapment-related mortality, extend drought forecasting to guide water management that minimizes the probability of entrapment, and integrate entrapment processes into population models to evaluate long-term consequences for Alewife recovery.
1 Introduction
Many species of fish spawn in specific habitats that serve as nursery sites for their offspring. These habitats are often high in food availability, and are structurally complex, providing offspring with shelter to avoid predation (Jenkins and Wheatley, 1998; Bloomfield and Gillanders, 2005; Schaeffler and Swilling, 2013). Emigration of early life stages from nurseries may require physiological preparations for energetically expensive transition to and performance in subsequent habitats (Colby, 2022). Hence any environmental factors in the nursery that mediate the ability to make these preparations, such as feeding conditions, can influence subsequent survival and year class success (Cushing, 1990; Heath, 1992; Leggett and Deblois, 1994).
Nursery habitats do not function to sustain the population if their connectivity to habitats used by subsequent ontogenetic stages is lost. This is of particular concern for diadromous fish, who migrate between freshwater and marine habitats to reproduce. All 24 species of diadromous fish in the North Atlantic Ocean have declined by 90% or more since the end of the 19th century (Limburg and Waldman, 2009; Drouineau et al., 2018). Dams and other anthropogenic structures commonly break connectivity between the marine and freshwater environments, preventing upstream migration and reducing accessibility to spawning grounds. This loss of spawning habitat has contributed to the precipitous decline of diadromous species (Hall et al., 2011; Mattocks et al., 2017). Fish ladders and similar passageways have been implemented at barriers to facilitate upstream migration. However, their facilitation of connectivity for spawning adults does not necessarily facilitate connectivity for young fish emigrating from the nursery (Sabater et al., 2018; Verhelst et al., 2021).
Our study focuses on Alewife (Alosa pseudoharengus), a diadromous species of fish native to the eastern coast of the United States. Alewives are typically anadromous, a form of diadromy characterized by migrations from marine to freshwater environments to spawn. The native range of alewives spans from Labrador to South Carolina (Loesch, 1987). Since the 19th century, populations of alewives and Blueback Herring (Alosa aestivalis), collectively known as river herring, have declined along the Atlantic Coast (Hare et al., 2021). Commercial landings of river herring collapsed in the 1970s (Atlantic States Marine Fisheries Commission, 2024). Declines have been linked to overfishing, bycatch, rebounding predator populations, and broken connectivity (Jones et al., 2010; Hall et al., 2011; Davis et al., 2012; Hasselman et al., 2016). In response to population declines, alewives have been listed as a species of concern by the U.S. National Marine Fisheries Service (NOAA National Marine Fisheries Service, 2007). Since then, moratoria on fisheries have been placed throughout much of their native range to reduce fishing pressure on the population. However, reductions in fishing pressure alone may not be sufficient to increase populations. Simulation modeling using historical data and the Ecopath with Ecosim framework indicated that reduced fishing pressure yields minimal population recovery, whereas restoring access to spawning grounds through dam removal produces significant population increases (Dias et al., 2022). Alewives preferentially spawn in lentic habitats such as ponds and lakes. In the Northeastern United States, the connections between the marine environment and these spawning grounds are often small first order streams. Loss of historic spawning grounds resulting from dams has contributed to 90-95% reductions in abundance (Hall et al., 2011; Mattocks et al., 2017). Recent restoration efforts have focused on improving passage for spawning alewives including the installation of new fish ladders, improvement of current fish ladders, and out-right dam removal. As a result, access to historic spawning grounds has been restored for many spawning runs. Despite increased access to spawning grounds and improved reproductive potential, populations have continued to decline.
A potential impediment to population recovery is juvenile entrapment; episodes of hydrological drought can break connectivity between the freshwater and marine environments. In contrast with an atmospheric drought (i.e., reduced precipitation and high vapor pressure deficits over some period of time), hydrologic drought describes a negative anomaly of water within terrestrial and aquatic ecosystems (i.e., streams, lakes, groundwater) occurring over some period of time (Van Loon, 2015). Reference to drought hereafter refers specifically to periods of hydrologic drought in which freshwater flow out of nursery habitat is insufficient to sustain downstream fish migration, so that juveniles are trapped. Previous researchers have identified entrapment as an area of concern (Vigerstad and Cobb, 1978; Kosa and Mather, 2001; Yako et al., 2002; Gahagan et al., 2010), yet studies assessing the potential impacts of drought are few.
We hypothesize that prolonged entrapment in nursery habitat adversely affects conditions for juveniles. Alewives spawn in nursery habitat over a roughly two-month period (Gahagan et al., 2010; Ganias et al., 2015). In the absence of drought, large pulses of emigration occur in the early summer months (Yako et al., 2002; Iafrate and Oliveira, 2007; Gahagan et al., 2010; Turner and Limburg, 2016). Forage is severely depleted around the time the first pulse has occurred and rebuilds over the summer (Post et al., 2008). Emigration continues at lower rates (Gahagan et al., 2010), and then a second pulse of emigration occurs in the fall (Kosa and Mather, 2001; Yako et al., 2002; Iafrate and Oliveira, 2007; Turner and Limburg, 2016) prior to lethal winter temperatures (McCormick et al., 1997). In contrast, drought is expected to entrap juveniles in nursery habitat at high densities and induce high levels of competition for forage.
In the present study we test this hypothesis by comparing features of emigrating juvenile alewives in two successive years, the second of which was marked by a prolonged summertime drought. We examined differences in length, growth rate, and body condition (i.e. mass at length) throughout the migration season in both years, collecting samples at the outlet to a lake that represents a relatively large nursery habitat in Southern New England. The summertime drought in the second year of our study occurred after the early pulse of emigration was complete. Hence, we predicted that late emigrants in the drought year were smaller, in relatively poor condition, and had grown more slowly than their counterparts in the previous year; i.e. that seasonal changes in these emigrant traits were reduced by drought conditions.
2 Methods
2.1 Study site and sampling
The study location is the outflow of Bride Lake (7 km2 watershed drainage area) in East Lyme Connecticut, United States (41°19’30”N 72°14’26”W). Bride Lake is 29 ha with a mean depth of 8 m. Bride Brook, its outflow, is approximately 1 km long and empties into Long Island Sound. Bride Lake is the spawning location for the largest run of alewives in Connecticut and has been the focus of research on this species for at least six decades (Kissil, 1974). The region has a temperate climate with a mean annual precipitation of 1.1 m and mean annual temperate of 10 °C (NOAA National Centers for Environmental Information, 2025).
We collected juvenile fish as they emigrated (Table 1), in a two-year study of emigration dynamics that offered a comparison of two years with different hydrological conditions. In 2021, we employed free-standing traps of ¼” rebar and a ⅛” to ¼” chicken wire mesh pen. We set traps for 24 hours once per week, beginning in early June and ending in the second week of November. Periods of high flow dislodged traps and prevented sampling in the first three weeks of September. The run of spawning adults declined from 2021 to 2022; as a precaution, fisheries biologists in Connecticut’s Department of Energy and Environmental Protection requested that overnight sampling cease. In 2022, we set traps beginning at 0500 until 1600, sampling twice per week, beginning in early June to early December. An extensive drought broke connectivity at Bride Lake for 5 months beginning in early July. Sampling of emigrants was not possible during this period due to entrapment. However, we observed staging behavior indicating that juveniles were attempting to leave; as observed during previous drought periods (Colby, 2022), a school of juveniles pooled in shallow water where outflow would have occurred with sufficient flow. We collected samples of these juveniles and regarded them as attempted emigrants. In all sampling efforts, we collected as many as 30 fish. The fish were euthanized using a 0.25 g l-1 neutral-buffered solution of MS-222 (tricaine; Syndel, USA) and placed on ice; samples were brought back to the lab immediately and frozen. If more than 30 samples were caught in the net, 30 individuals were randomly selected, and the rest released. In some cases, more than 30 individuals died upon collection, and all captured individuals were collected.
Table 1
| Date | N |
|---|---|
| 06/09/2021 | 30 |
| 06/16/2021 | 36 |
| 08/23/2021 | 32 |
| 10/05/2021 | 30 |
| 6/13/2022 | 30 |
| 6/17/2022 | 35 |
| 7/5/2022 | 35 |
| 10/07/20221 | 35 |
| 10/25/20221 | 24 |
| 11/07/20221 | 28 |
| 11/28/20221 | 39 |
| 12/7/2022 | 32 |
| 12/9/2022 | 33 |
Samples of juvenile alewives collected from the outflow of Bride Lake.
1Individuals were staging for emigration but unable to leave because of drought.
Entries of the table include the calendar date of collection and the number of individuals retained for analysis (N).
2.2 Specimen workup
We measured the fish sampled shortly after collection. All fish were thawed at room temperature and blotted dry with a paper towel prior to measurement. We measured total length to the nearest tenth of a millimeter, and wet mass to the nearest hundredth of a gram. After measurements were taken, each fish was given a unique individual identifier and refrozen. We then surgically removed the head of each fish and extracted both sagittal otoliths. The otoliths were cleaned with deionized water and dried for a period of 24 hours. The body and head of the fish were then refrozen for later measurements.
To assess the loss of biomass throughout the extraction process, we measured wet mass again after the otoliths had been removed; the loss of biological material through the extraction process was less than 2%. We placed the samples into a 60 °C drying oven for a period sufficient to reach constant mass, 24 to 72 h depending on the specimen size. We then recorded dry mass.
2.3 Daily aging
To permit estimation of lifetime daily growth, we extracted otoliths from 492 individuals. We prepared otoliths for storage 24 hours after extraction; otoliths were mounted rostrum side up on microscope slides using crystal bond adhesive. Sandpaper (400–2000 grit) and lapping paper (3000–10000 grit) were used to polish the otoliths to increase the visibility of growth increments (Gahagan et al., 2010). We polished small otoliths (<500 um) by hand, and larger otoliths (>500 um) using a handheld rotary tool (Dremel Model 7350; Robert Bosch Tool Corp.). The otoliths from 12 emigrants were lost or destroyed in the polishing stage.
In order to determine the age of each fish, we enumerated the daily growth rings on a minimum of one otolith for each fish. We prepared the otoliths for aging by soaking them in immersion oil. Otoliths were counted live under a compound microscope (Zeiss Axioscop) using an oil immersion lens. Daily increments have not been validated in alewives but have been validated in a congener American Shad (Alosa sapidissima) from collections taken in the same region (Limburg, 1994).
We estimated the age of each emigrant by averaging multiple independent counts. Three counts were recorded for each otolith: one count by an expert reader and two counts by student readers. All otoliths were randomized and counted blind to reduce bias. Each counter recorded the count of daily rings, confidence, and direction of counting for each otolith. Counters re-aged their first and last 10% of otoliths to account for changes in interpretation throughout the counting process. We used Chang’s coefficient of variation (CV) for testing the precision of counts (Chang, 1982). When the CV for both student counts exceeded 10%, a recount was done by the expert. If the CV between the expert count and recount exceeded 10%, the otolith was removed from the study. We then checked for systematic bias in the remaining otoliths using Evan and Hoenig’s symmetry test and a paired t test (Supplementary Table S1). The age was taken as the mean reader counts that were within the stated criteria. We added an additional 2 days to each count to account for the delay in increment formation after hatch (Höök et al., 2007).
Application of these quality control criteria reduced sample size. Individuals captured on or after October 25th in 2022 (N = 156) yielded unreliable daily age values; their late-season growth was sufficiently slow that daily growth otolith increment widths were <1 um, considered unreliable markers of daily age (Campana et al., 1987). These specimens yielded significant undercounts by student readers (Supplementary Figure S1). A total of 321 otoliths were then subjected to tests of CV among the expert and student readers. 72 otoliths exceeded the 10% CV cutoff for both student readers and had to be recounted by an expert. After removing expert recounts that exceeded a 10% CV, an additional 20 otoliths were removed leaving 301 otoliths for further analysis. Estimates of precision for the remaining otoliths are provided in Supplementary Table 1.
2.4 Calculations of growth in stanzas
In addition to estimating lifetime daily growth, we also estimated growth over specific intervals of daily age, i.e. in stanzas, via measurements of otolith daily increment widths. To that end, we collected images of otoliths using a camera (Micropublisher 6 QImaging) mounted on the compound microscope. The microscope was set to 100x magnification. The camera was rotated so that the image of the otolith was oriented with the rostrum at the top of the image. Several images were taken for each otolith; the image that produced the clearest image of the increments was selected. We selectively imaged the right otolith first; if the right otolith was absent or damaged, the left otolith was used. Camera-related software (Ocular, QImaging) was used to catalog images. In ImageJ v1.51, we converted images to 8-bit greyscale, and improved contrast to improve increment visibility. Along a straight line from the center of the otolith to a position ventral to the rostrum (Supplementary Figure 2), we measured the distance from the growth center to the edge and marked growth increments. On fish under 100 days old we measured otolith radius at the position of the 30th daily increment, and on fish that were over 100 days old we measured otolith radius at the position of the 30th, 70th, and 100th daily increment. We used the biological intercept growth model (Campana and Jones, 1992) to interpret otolith radius at age in terms of body size at age, using the equation:
where La is the back-calculated length at age a, Oc and Lc are the radius of the otolith and length of fish at capture, and Oi and Li are the radius of the otolith and length of fish at the biological intercept, set to the smallest otolith and length coordinates at which a linear relationship ensues. This was determined to be at hatch (9 um otolith radius of a 3.5 mm hatchling) based on Auer et al. (1982). To focus on the potential effects of drought, we restricted the analysis of growth stanzas to late- season emigrants, those that we sampled in October We collected growth data on 20 late-season emigrants each year.
2.5 Statistical tests
We tested for between-year differences in emigrant length, lifetime growth, and condition via analysis of covariance (ANCOVA). In these models, year was included as a factor, while date was transformed as the number of days since January 1 (Julian dates) and included as a continuous variable. We analyzed length with year and date as predictors, lifetime growth by adding age in days as a covariate along with year and date, and condition as mass-at-length, with log(mass) as the response variable, and log(length) as a covariate along with year and date. In these analyses a year-by-date interaction and a smaller change in the response variable over the season in the drought year represents support for the prediction that entrapment reduces size, growth, and condition of emigrants. Therefore, as we found year-by-date interactions, we estimated changes in length, lifetime growth and condition separately by year: the models were bivariate regressions of emigrant length against date of emigration, emigrant length-at-age against date of emigration, and emigrant mass-at-length against date of emigration. The response variables in the latter two models were residual values that take into account the effect of covariates; hence, we coded emigrant length-at-age as each emigrant’s residual in the bivariate regression of length against age, and mass-at-length as each emigrant’s residual in the bivariate regression of log(mass) against log(length). This estimate of condition is known as the residual mass index (Jakob et al., 1996).
We tested for between-year differences in growth in stanzas via two sample Welch’s t-tests. Late emigrants in 2022 were not subjected to drought during their first 30 days and we did not expect their growth in that stanza to differ from that of late emigrants the previous year. In contrast, late emigrants in 2022 were subjected to drought when their third month of life. We therefore conducted a one-tailed t-test of differences between years in growth over the 70 to 100 day period after hatch, and over the full 100 day period after hatch.
3 Results
As observed in previous studies, emigrants later in the season were larger than emigrants earlier; results supported our prediction that this seasonal increase in emigrant length was more gradual in the drought year than the year before. The change over the season in emigrant length differed between years (Supplementary Table 2: ANCOVA, year*date interaction p < 0.0001). The increase in length over time in the drought year was about 50% less than the previous year (Figure 1; slope of total length against date: 0.31 and 0.22 in 2021 and 2022 respectively; test of difference between slopes t = 9.7, df = 427, one-tailed p < 0.0001; complete regression statistics reported in Supplementary Table 3).
Figure 1
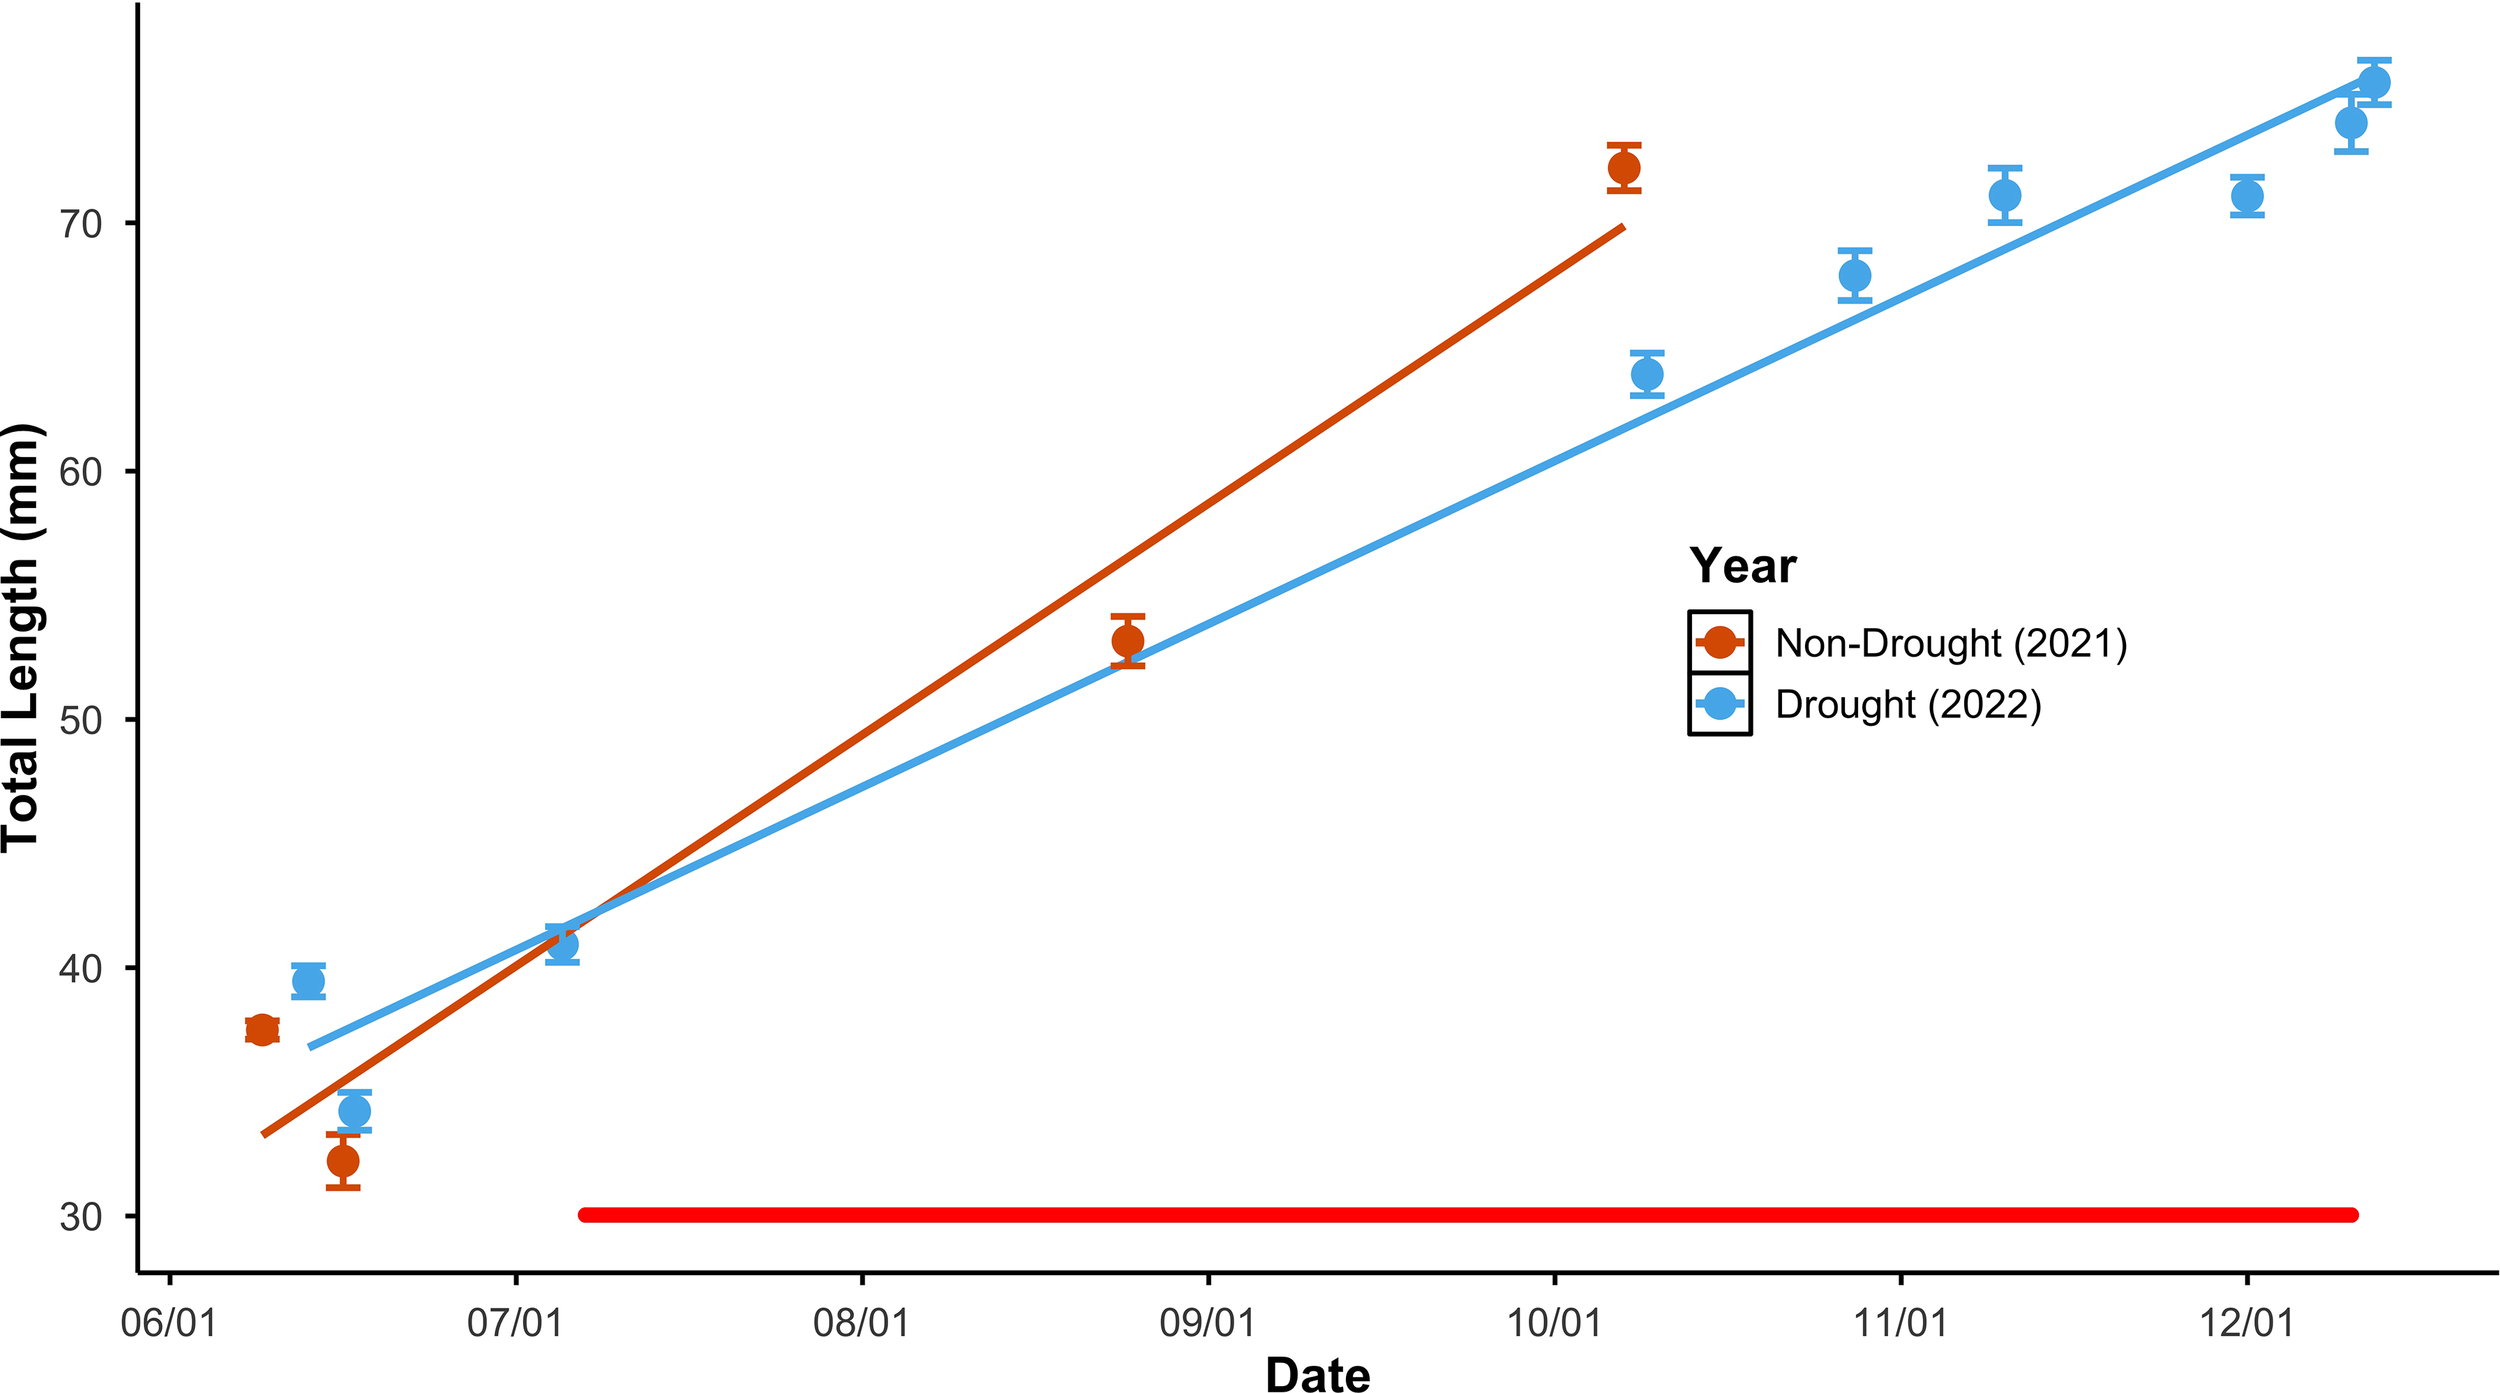
Seasonal change in emigrant size at Bride Lake plotted against date of emigration in a year with a summertime drought and in a year without drought. To facilitate comparison and reflect regression analyses that code date as Julian Date, data for both years are plotted with date as mm/dd, omitting year. Mean sample values are plotted as points, and error bars represent 1 standard error above and below the mean. Best fit lines represent the bivariate regression relationships. The horizontal red line indicates the period in 2022 when individuals could not emigrate; data from that period was taken from individuals that exhibited migration behavior.
As predicted, the change over the season in condition differed between years (Supplementary Table 4: ANCOVA, year*date interaction p = 0.001). Emigrant condition, estimated as residual mass index, increased with emigration date in 2021, but decreased with emigration date in 2022 (Figure 2; test of difference between slopes t = 6.47, df = 427, one-tailed p < 0.01; complete regression statistics in Supplementary Table 5).
Figure 2
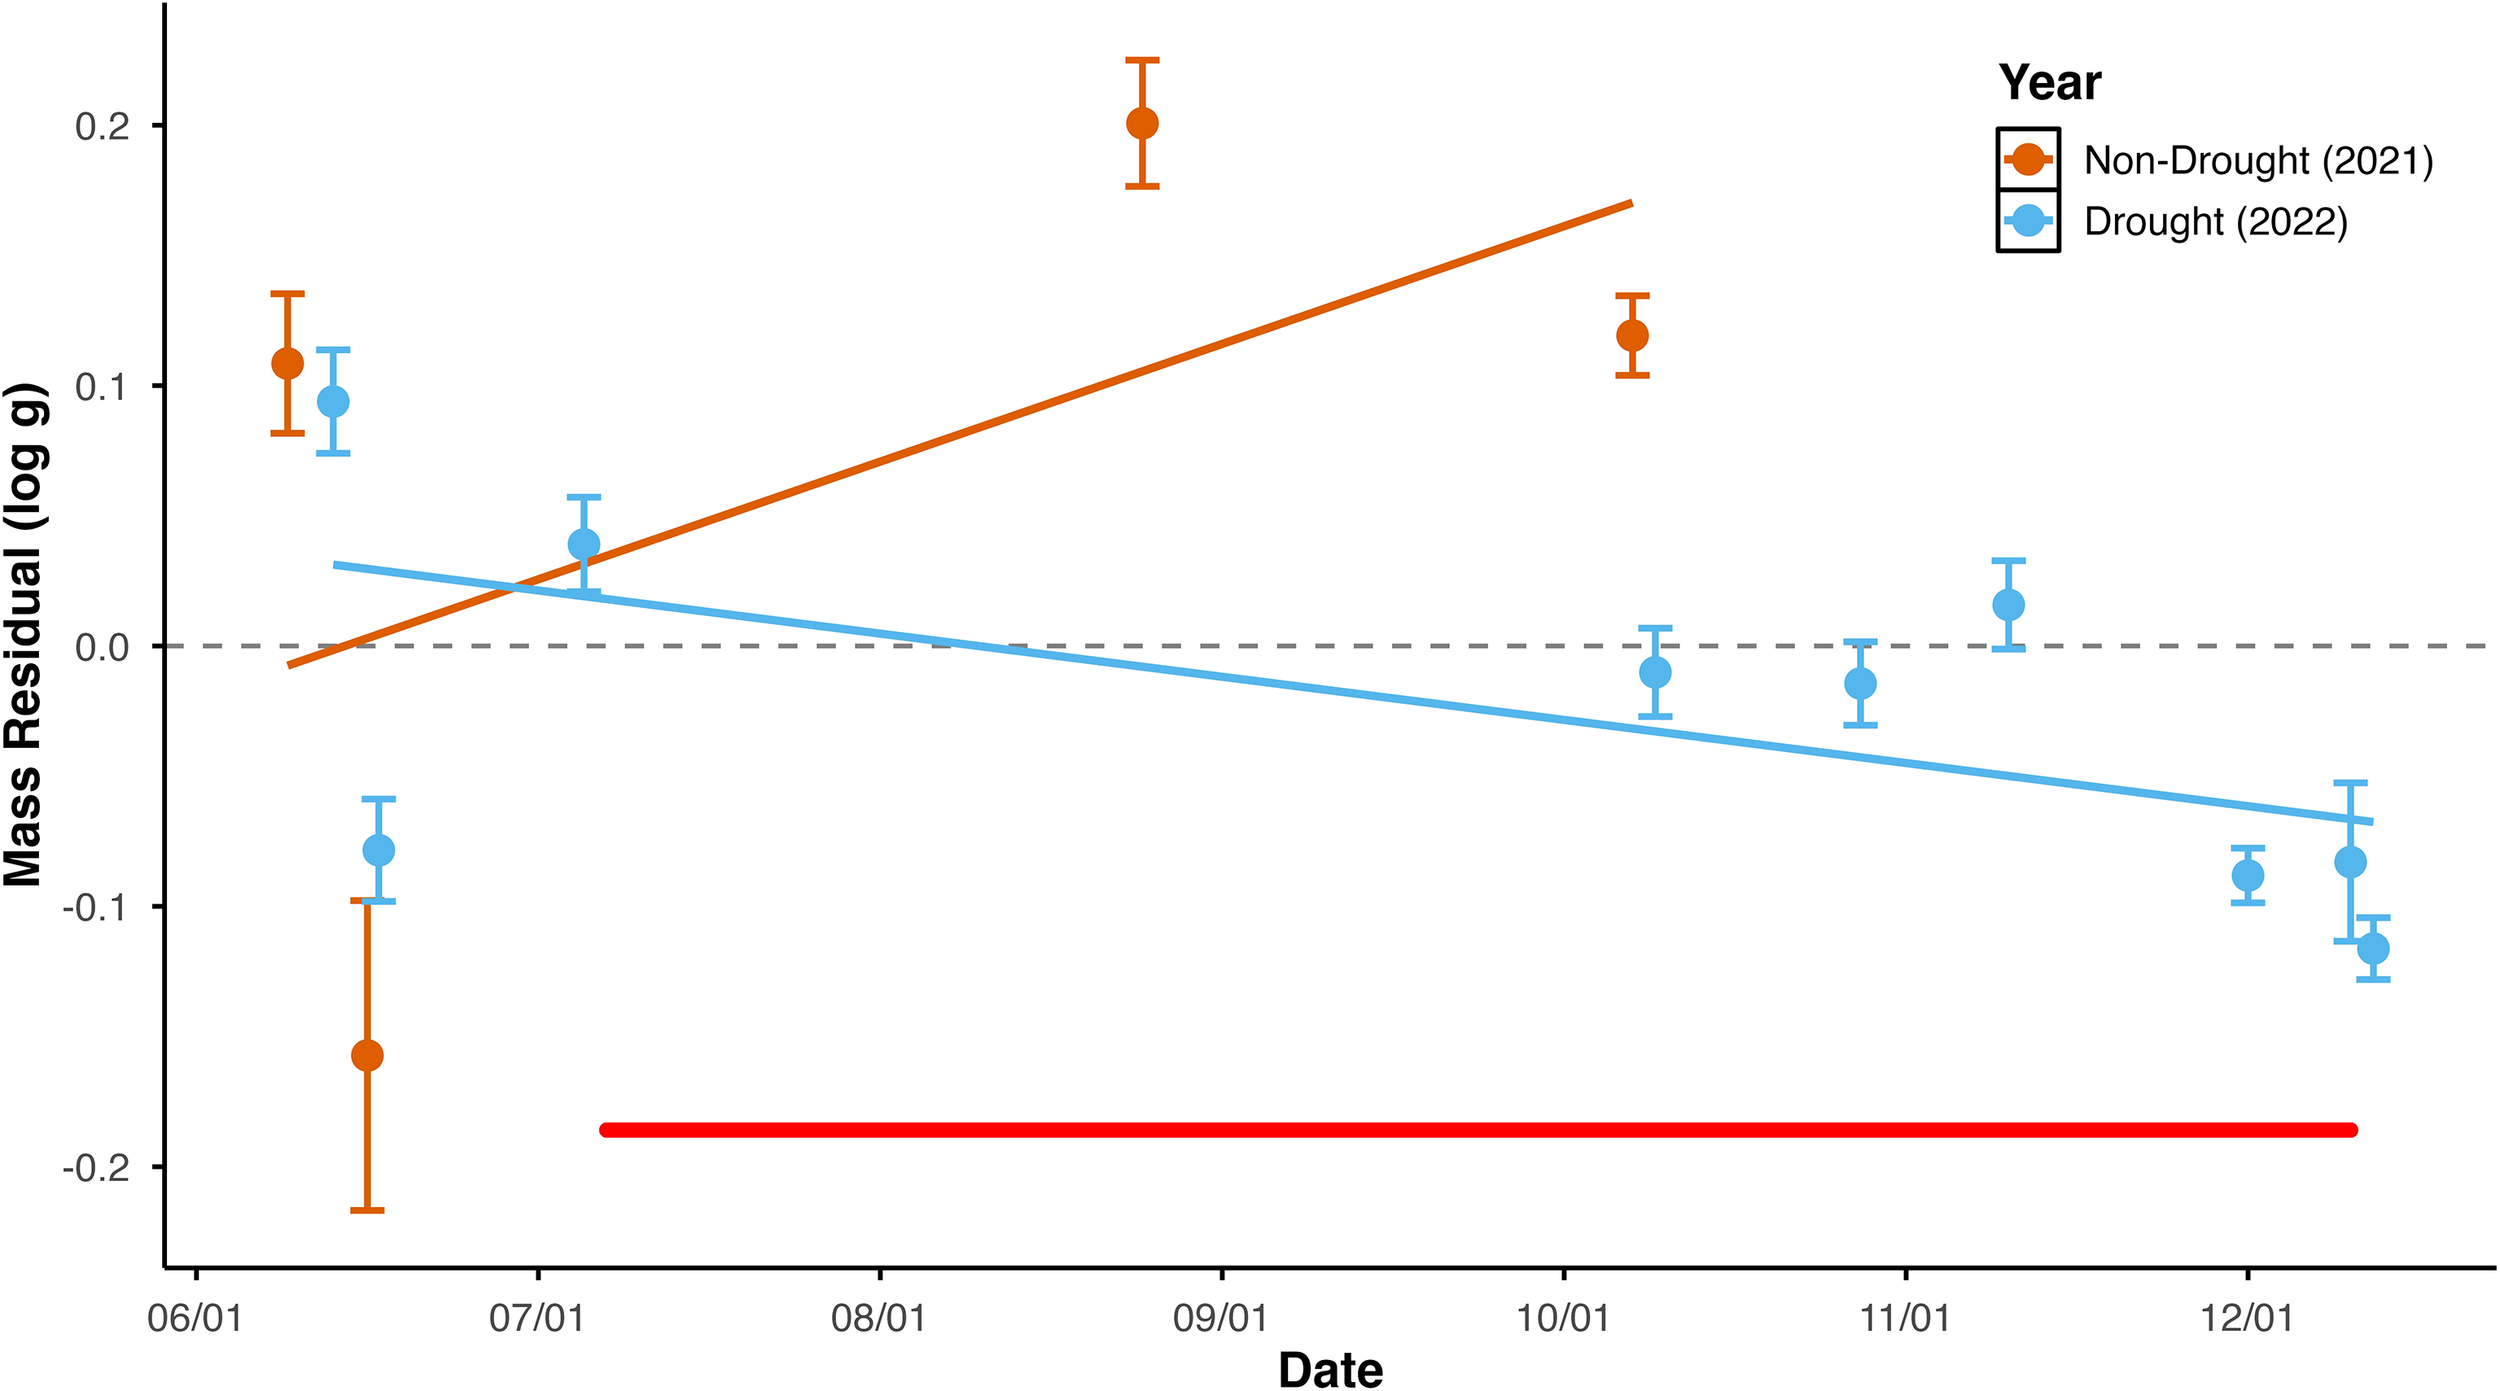
Seasonal change in emigrant condition at Bride Lake plotted against date of emigration in a year with a summertime drought and in a year without drought. To facilitate comparison and reflect regression analyses that code date as Julian Date, data for both years are plotted with date as mm/dd, omitting year. Condition is represented as residual mass-at-length, i.e. residual values from bivariate regression of log(mass) versus log(length). Mean sample values are plotted as points, and error bars represent 1 standard error above and below the mean. Best fit lines represent the bivariate regression relationships. The horizontal red line indicates the period in 2022 when individuals could not emigrate; data from that period was taken from individuals that exhibited migration behavior.
Results support our prediction that the seasonal change in emigrant lifetime growth was less in the drought year. The change over the season in emigrant size-at-age differed between years (Supplementary Table 6: ANCOVA, year*date interaction p < 0.001). Emigrant size-at-age increased over the season in 2021 but decreased over the season in 2022 (Figure 3; test of difference between slopes t = 5.8, df = 247, one-tailed p < 0.0001; regression statistics in Supplementary Table 7).
Figure 3
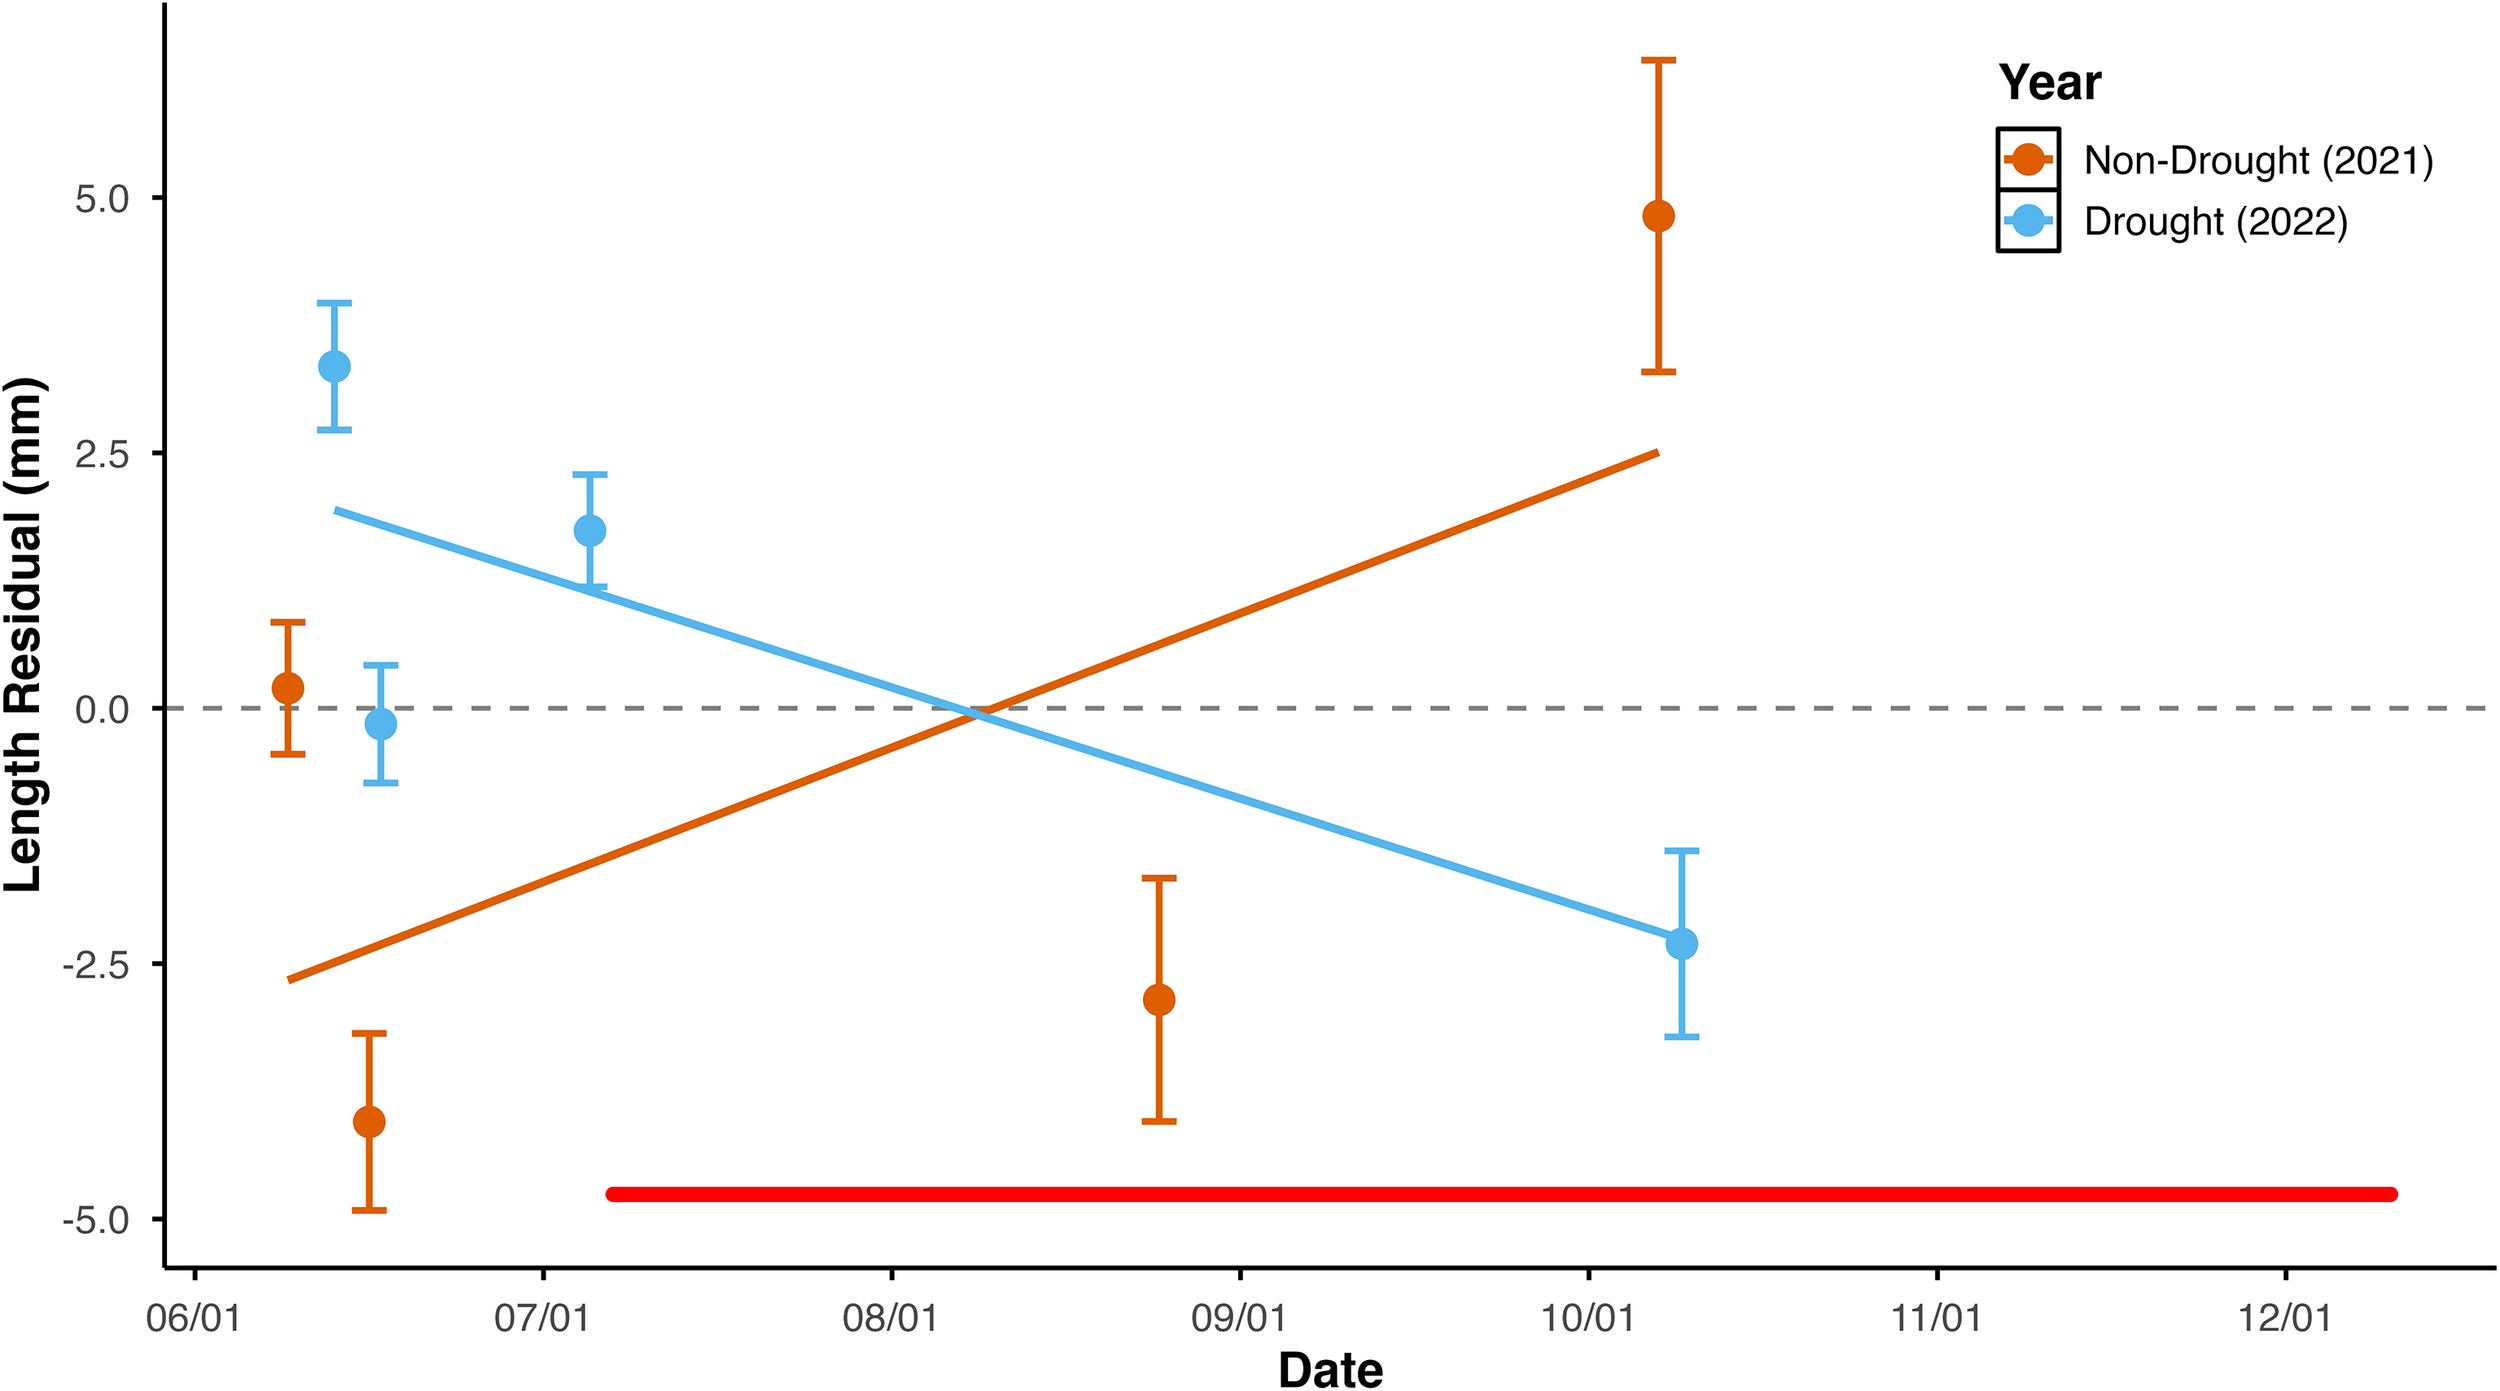
Seasonal change in emigrant lifetime growth at Bride Lake plotted against date of emigration in a year with a summertime drought and in a year without drought. To facilitate comparison and reflect regression analyses that code date as Julian Date, data for both years are plotted with date as mm/dd, omitting year. Growth is represented as residual length-at-age, i.e. residual values from bivariate regression of length versus age. Mean sample values are plotted as points, and error bars represent 1 standard error above and below the mean. Best fit lines represent the bivariate regression relationships. The horizontal red line indicates the period in 2022 when individuals could not emigrate; data from that period was taken from individuals that exhibited migration behavior.
Results support our prediction that late-season emigrants grew less in 2022 than those in the previous year in the range of ages when the fish in 2022 were subjected to drought. The 100-day growth increment was less in the drought year than the non-drought year (Figure 4A; two-sample t test, t=-1.78, df = 32.6, one-tailed p < 0.05). Between 70 and 100 days after hatch, drought fish grew 3 mm less than non-drought fish (Figure 4C; two-sample t test, t=-4.35, df = 32.6, one-tailed p < 0.001). In contrast, the 30-day growth increment, which occurred prior to the drought, did not differ between years (Figure 4B; two-sample t test, t=1.12, df = 32.6, p > 0.05).
Figure 4
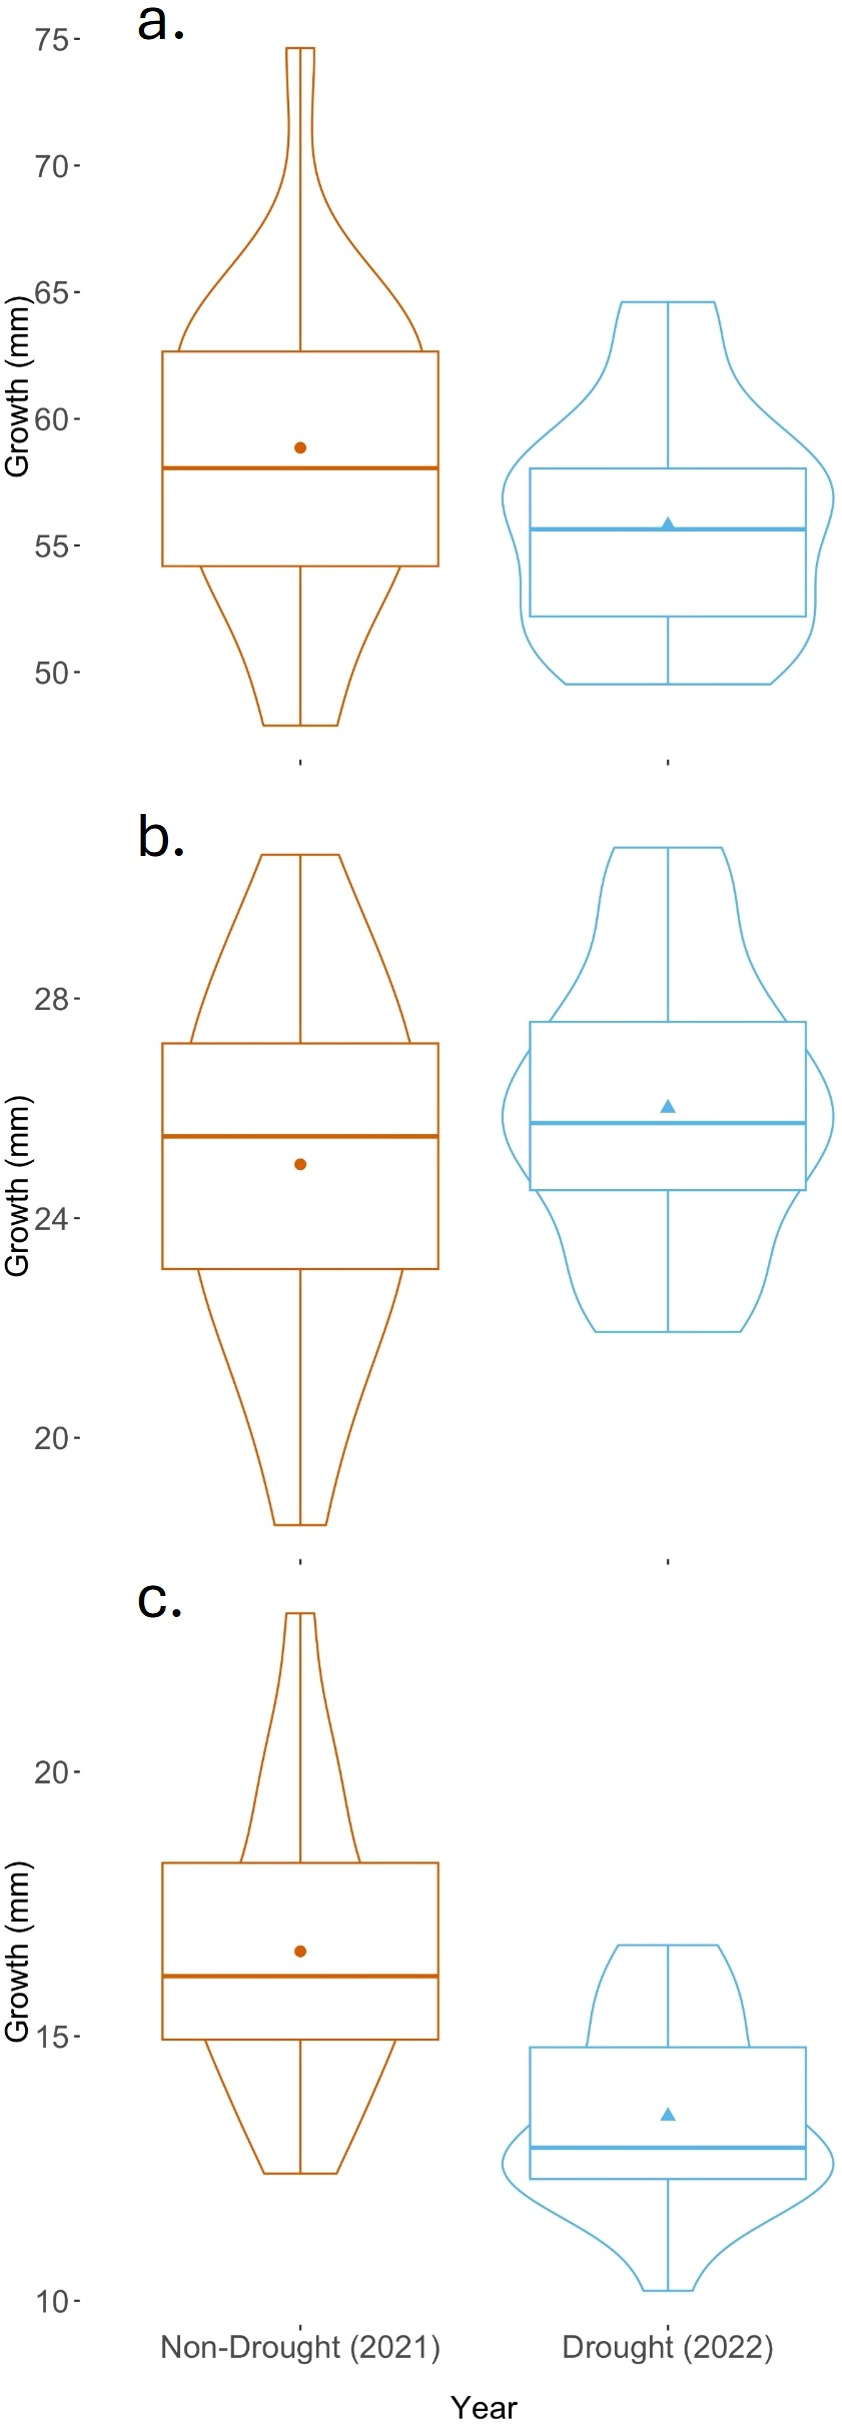
Growth in stanzas of late-season emigrants in a year with a summertime drought and in a year without drought. Violin plots represent the density of points at each measurement. The horizontal line represents the median, the black dot represents the mean, the box represents the interquartile range, and the whiskers are 1.5*IQR. (a) Growth over the first 100 days after hatch. (b) Growth over the first 30 days after hatch. (c) Growth over the 70 to 100 day interval after hatch.
4 Discussion
We found that juveniles that had been entrapped by drought conditions for extended periods of time were smaller, in poorer condition, and grew less, than juveniles that were not. Previous work has shown that emigrants differ in multiple ways (larger size, greater age, and in some years greater condition) from pre-migrants that remain in nursery habitat, and that these preparatory changes for migration bestow greater performance in ecologically-relevant functions such as swimming (Colby, 2022).The impacts of drought that we document here are likely to reduce performance and fitness.
Seasonal changes in forage conditions that affect the growth of juvenile alewives provides important context for understanding the effects of drought. Juvenile densities are highest in June, as adult spawning is nearly complete, and there is then in late June and early July a pulse of outmigration comprising primarily early-hatched individuals (Gahagan et al., 2010). Preferred forms of zooplankton are significantly depleted by early July (Post et al., 2008). We interpret the early pulse of emigration as reflecting the strategic advantage, for individuals that are capable, of avoiding strong competition for forage. Emigration by individuals hatched later in the spring continues at lower rates through summer months under non-drought conditions (Gahagan et al., 2010). As the initial wave of emigration reduces the population density in the nursery, intraspecific competition decreases, and it may be advantageous for the late-born juveniles to then remain in the nursery site to take advantage of remaining forage.
Emigrants that remain in the nursery grounds past the initial wave of migration risk entrapment, as occurred in 2022 from July 7th to December 7th. Drought has been highlighted as an area of concern by previous researchers (Kosa and Mather, 2001; Yako et al., 2002; Gahagan et al., 2010). Entrapment intensifies intraspecific competition and may extend into a season of declining temperatures, resulting in detectable individual-level effects. Intraspecific competition strongly influences juvenile growth (Jessop, 1994; Iafrate and Oliveira, 2007). We saw evidence of this in 2022: emigrants that had been entrapped were significantly smaller and in worse body condition than emigrants captured at the same time in the season the prior year. This was not the result of differences between years in conditions prior to the development of drought, as we found that growth in the first month of life was similar between the year classes. Body condition as well as growth was reduced by drought. Mortality may also be higher for individuals that are entrapped; in early December 2022, water temperatures fell as low as 4° C, below temperatures known to cause death (McCormick et al., 1997).
Drought and entrapment are likely to become more frequent in the future, compounding other anthropogenic stressors on juveniles. Coastal areas constituting nursery habitat for alewives are subject to land use changes (i.e. conversion to developed land, which has amounted to changes in about 5% of land cover along the Connecticut coastline since 1985: Center for Land Use Education and Research, 2025) and increasing water withdrawals that affect the frequency and intensity of drought (Nadim et al., 2007; King et al., 2023). Climate change threatens to increase temperatures, reduce seasonal snowfall, and decrease summer precipitation in the northeastern United States (Moore et al., 1997; Hayhoe et al., 2008; Nelson et al., 2009; Demaria et al., 2016). Increasing urbanization, pollution, and impervious cover reduce the growth of juvenile alewives (Limburg and Waldman, 2009).
The extent to which entrapment events have detectable impacts on the year class should be further investigated. While we have shown what we believe to be the effects of entrapment on a portion of emigrants in the 2022 year class, the extent to which it affected prospects for the entire year class is not clear from our study. Colby (2022) found that droughts do indeed have detectable effects on year class-scale attributes. She aligned regional indices of drought with measures taken of adults returning to spawning habitat from eight year classes. Individuals whose hatch years were marked by drought conditions were smaller at age 1 and were less likely to return to spawning habitat over multiple years.
While we demonstrated that a severe drought impacted the growth and body condition of juveniles, our study does not examine the potential effects of smaller, more frequent droughts. Droughts of the magnitude we observed in 2022 occur every few years (in fact, another loss of connectivity began in July 2025 and has extended at least into December); smaller droughts of less severe frequency occur on a near annual basis. It is unclear at what point drought begins to affect juvenile growth and body condition. Further studies need to be conducted to establish a baseline in the severity of drought that adversely affects juveniles. Furthermore, developing effective tools to predict the occurrence of drought could be paramount in the conservation of the species. A tool has recently been developed that can predict drought up to 1 month in advance (King et al., 2023). Further research developing this tool and extending the range of its predictions will provide researchers and municipal water managers with the information needed to accurately assess the threat of drought in advance, and adjust water use accordingly.
Our findings suggest directions for future research. This study does not provide insight into the effects of drought on juvenile survivorship or impacts to future reproductive potential. Larger sizes often improve the survivorship of juvenile fish (Pepin, 1991; Sogard, 1997; Schultz et al., 1998; Munch et al., 2003), and it would be valuable to determine the extent to which entrapment-related reduction in size at age and condition affects future prospects. This study’s reliance on individuals that have survived to the point of emigrating means that our samples are likely biased toward those individuals that fared better under extant conditions, and therefore probably diminished the apparent effects of drought. Direct empirical estimation of survivorship and assessment of its size dependence would be especially challenging when working with migratory juveniles. Simulation modeling is a promising alternative that is not dependent on the direct observation of mortality. A model accurately depicting changes in alewife populations due to several mortality factors has been developed (Nelson et al., 2020). Adapting this model, or a model like it, to incorporate the impacts of drought on the remainder of the life cycle would provide much needed insight on the long-term effects of these events. Overall, further research examining the impacts of drought temporally and spatially will be critical to effective conservation planning for alewives.
Statements
Data availability statement
The datasets presented in this study and code used in analysis can be found in Dryad as "Juvenile alewives (Alosa sapidissima): size, growth and date of emigration from natal lake", DOI: https://doi.org/10.5061/dryad.6hdr7srfb.
Ethics statement
The animal study was approved by Institutional Animal Care and Use Committee, University of Connecticut. The study was conducted in accordance with state and university requirements.
Author contributions
MB: Writing – original draft, Formal Analysis, Investigation, Data curation. RA: Investigation, Writing – review & editing. JK: Funding acquisition, Writing – review & editing. ES: Writing – review & editing, Funding acquisition, Project administration, Resources, Conceptualization, Methodology, Supervision, Data curation.
Funding
The author(s) declared that financial support was received for this work and/or its publication. Funding for this project was provided by EPA - Long Island Sound Study/Sea Grant New York/Sea Grant Connecticut R/FBF-25-CTNY, EPA Award LI-00A00284, and with support from LVAO and the University of Connecticut.
Acknowledgments
Fisheries biologists with the Connecticut Department of Energy and Environmental Protection, especially Kevin Job, and Ben Gahagan (Massachusetts Division of Marine Fisheries) provided invaluable guidance and assistance with field components of this project. Discussions with Robert Bagchi, Carolina Carcamo, Adrian Jordaan, Sebastian Klarian, Foivos Mouchlianitis, Nicholas Piscitelli, and Allison Roy helped to shape and execute the research. This work was completed as a portion of requirements for MB’s MS degree.
Conflict of interest
The author(s) declared that this work was conducted in the absence of any commercial or financial relationships that could be construed as a potential conflict of interest.
Generative AI statement
The author(s) declared that generative AI was not used in the creation of this manuscript.
Any alternative text (alt text) provided alongside figures in this article has been generated by Frontiers with the support of artificial intelligence and reasonable efforts have been made to ensure accuracy, including review by the authors wherever possible. If you identify any issues, please contact us.
Publisher’s note
All claims expressed in this article are solely those of the authors and do not necessarily represent those of their affiliated organizations, or those of the publisher, the editors and the reviewers. Any product that may be evaluated in this article, or claim that may be made by its manufacturer, is not guaranteed or endorsed by the publisher.
Supplementary material
The Supplementary Material for this article can be found online at: https://www.frontiersin.org/articles/10.3389/fmars.2026.1721762/full#supplementary-material
References
1
Atlantic States Marine Fisheries Commission (2024). River herring benchmark stock assessment and peer review report (Arlington VA).
2
Auer M. T. Canale R. P. Grundler H. C. Matsuoka Y. (1982). Ecological studies and mathematical modeling of Cladophora glomerata in Lake Huron North America 1. Program description and field monitoring of growth dynamics. J. Great Lakes Res.8, 73–83. doi: 10.1016/S0380-1330(82)71945-8
3
Bloomfield A. Gillanders B. (2005). Fish and invertebrate assemblages in seagrass, mangrove, saltmarsh, and nonvegetated habitats. Estuaries28, 63–77. doi: 10.1007/BF02732754
4
Campana S. E. Gagne J. A. Munro J. (1987). Otolith microstructure of larval herring Clupea harengus: Image or reality? Can. J. Fisheries Aquat. Sci.44, 1922–1929. doi: 10.1139/f87-236
5
Campana S. E. Jones C. M. (1992). “ "Analysis of otolith microstructure data,” in Otolith microstructure examination and analysis. Canadian Special Publication of Fisheries and Aquatic Sciences, eds. D.K. Stevenson & S.E. Campana. (Ottawa: Department of Fisheries and Oceans), 73–100.
6
Center for Land Use Education and Research (2025). CT land cover viewer. Available online at: https://clear.uconn.edu/projects/landscape/ct-landcoverviewer/ (Accessed October 2 2025).
7
Chang W. Y. B. (1982). A statistical method for evaluating the reproducibility of age determination. Can. J. Fisheries Aquat. Sci.39, 1208–1210. doi: 10.1139/f82-158
8
Colby R. S. (2022). From stream to sea: physiological and population ecology of juvenile diadromous alewife (Alosa pseudoharengus) migration. Ph.D. Dissertation (Storrs, CT: University of Connecticut).
9
Cushing D. H. (1990). Plankton production and year-class strength in fish populations: An update of the Match/Mismatch Hypothesis. Adv. Mar. Biol.26, 249–293. doi: 10.1016/S0065-2881(08)60202-3
10
Davis J. P. Schultz E. T. Vokoun J. C. (2012). Striped Bass consumption of Blueback Herring during vernal riverine migrations: Does relaxing harvest restrictions on a predator help conserve a prey species of concern? Mar. Coast. Fisheries4, 239–251. doi: 10.1080/19425120.2012.675972
11
Demaria E. M. C. Roundy J. K. Wi S. Palmer R. N. (2016). The effects of climate change on seasonal snowpack and the hydrology of the Northeastern and Upper Midwest United States. J. Climate29, 6527–6541. doi: 10.1175/JCLI-D-15-0632.1
12
Dias B. S. Frisk M. G. Jordaan A. (2022). Contrasting fishing effort reduction and habitat connectivity as management strategies to promote alewife (Alosa pseudoharengus) recovery using an ecosystem model. Limnology Oceanography67:S5–S22. doi: 10.1002/lno.11871
13
Drouineau H. Carter C. Rambonilaza M. Beaufaron G. Bouleau G. Gassiat A. et al . (2018). River continuity restoration and diadromous fishes: Much more than an ecological issue. Environ. Manage.61, 671–686. doi: 10.1007/s00267-017-0992-3
14
Gahagan B. I. Gherard K. E. Schultz E. T. (2010). Environmental and endogenous factors influencing emigration in juvenile anadromous alewives. Trans. Am. Fisheries Soc.139, 1069–1082. doi: 10.1577/T09-128.1
15
Ganias K. Divino J. N. Gherard K. E. Davis J. P. Mouchlianitis F. Schultz E. T. (2015). A reappraisal of reproduction in anadromous alewives: Determinate versus indeterminate fecundity, batch size, and batch number. Trans. Am. Fisheries Soc.144, 1143–1158. doi: 10.1080/00028487.2015.1073620
16
Hall C. J. Jordaan A. Frisk M. G. (2011). The historic influence of dams on diadromous fish habitat with a focus on river herring and hydrologic longitudinal connectivity. Landscape Ecol.26, 95–107. doi: 10.1007/s10980-010-9539-1
17
Hare J. A. Borggaard D. L. Alexander M. A. Bailey M. M. Bowden A. A. Damon-Randall K. et al . (2021). A review of river herring science in support of species conservation and ecosystem restoration. Mar. Coast. Fisheries13, 627–664. doi: 10.1002/mcf2.10174
18
Hasselman D. J. Anderson E. C. Argo E. E. Bethoney N. D. Gephard S. R. Post D. M. et al . (2016). Genetic stock composition of marine bycatch reveals disproportional impacts on depleted river herring genetic stocks. Can. J. Fisheries Aquat. Sci.73, 951–963. doi: 10.1139/cjfas-2015-0402
19
Hayhoe K. Wake C. Anderson B. Liang X.-Z. Maurer E. Zhu J. et al . (2008). Regional climate change projections for the Northeast USA. Mitigation Adaptation Strategies Global Change13, 425–436. doi: 10.1007/s11027-007-9133-2
20
Heath M. (1992). Field investigations of the early life stages of marine fish. Adv. Mar. Biol.28, 1–174. doi: 10.1016/S0065-2881(08)60039-5
21
Höök T. O. Rutherford E. S. Mason D. M. Carter G. S. (2007). Hatch dates, growth, survival, and overwinter mortality of age-0 alewives in Lake Michigan: Implications for habitat-specific recruitment success. Trans. Am. Fisheries Soc.136, 1298–1312. doi: 10.1577/t06-194.1
22
Iafrate J. Oliveira K. (2007). Factors affecting migration patterns of juvenile river herring in a coastal Massachusetts stream. Environ. Biol. Fishes81, 101–110. doi: 10.1007/s10641-006-9178-1
23
Jakob E. M. Marshall S. D. Uetz G. W. (1996). Estimating fitness: a comparison of body condition indices. Oikos77:61–67. doi: 10.2307/3545585
24
Jenkins G. P. Wheatley M. J. (1998). The influence of habitat structure on nearshore fish assemblages in a southern Australian embayment: Comparison of shallow seagrass, reef-algal and unvegetated sand habitats, with emphasis on their importance to recruitment. J. Exp. Mar. Biol. Ecol.221, 147–172. doi: 10.1016/s0022-0981(97)00121-4
25
Jessop B. M. (1994). Relations between stock and environmental variables, and an index of abundance, for juvenile alewives and blueback herring. North Am. J. Fisheries Manage.14, 564–579. doi: 10.1577/1548-8675(1994)014<0564:Rbsaev>2.3.Co;2
26
Jones A. W. Dalton C. M. Stowe E. S. Post D. M. (2010). Contribution of declining anadromous fishes to the reproductive investment of a common piscivorous seabird, the double-crested cormorant (Phalacrocorax auritus). Auk127, 696–703. doi: 10.1525/auk.2010.09200
27
King K. Burgess M. Schultz E. T. Knighton J. (2023). Forecasting hydrologic controls on juvenile anadromous fish out-migration with process-based modeling and machine learning. J. Environ. Manage.344, 118420. doi: 10.1016/j.jenvman.2023.118420
28
Kissil G. W. (1974). Spawning of the anadromous Alewife, Alosa pseudoharengus, in Bride Lake, Connecticut. Trans. Am. Fisheries Soc.103:312–317. doi: 10.1577/1548-8659(1974)103<312:SOTAAA>2.0.CO;2
29
Kosa J. T. Mather M. E. (2001). Processes contributing to variability in regional patterns of juvenile river herring abundance across small coastal systems. Trans. Am. Fisheries Soc.130, 600–619. doi: 10.1577/1548-8659(2001)130<0600:PCTVIR>2.0.CO;2
30
Leggett W. Deblois E. (1994). Recruitment in marine fishes: is it regulated by starvation and predation in the egg and larval stages? Netherlands J. Sea Res.32, 119–134. doi: 10.1016/0077-7579(94)90036-1
31
Limburg K. E. (1994). Ecological constraints on growth and migration of juvenile American shad (Alosa sapidissima Wilson) in the Hudson River Estuary, New York. Ph.D. Dissertation (Ithaca, NY: Cornell University).
32
Limburg K. E. Waldman J. R. (2009). Dramatic declines in North Atlantic diadromous fishes. BioScience59, 955–965. doi: 10.1525/bio.2009.59.11.7
33
Loesch J. G. (1987). “ Overview of life history aspects of anadromous alewife and blueback herring in freshwater habitats,” in Common strategies of anadromous and catadromous fishes. Eds. DadswellM. J.KlaudaR. J.MoffittC. M.SaundersR. L.RulifsonR. A.CooperJ. E.. (Bethesda, MD: American Fisheries Society).
34
Mattocks S. Hall C. J. Jordaan A. (2017). Damming, lost connectivity, and the historical role of anadromous fish in freshwater ecosystem dynamics. Bioscience67, 713–728. doi: 10.1093/biosci/bix069
35
McCormick S. D. Shrimpton J. M. Zydlewski J. D. (1997). “ pTemperature effects on osmoregulatory physiology of juvenile anadromous fish,” in Society for Experimental Biology Seminar Series; Global warming: Implications for freshwater and marine fish. Eds. WoodC. M.McDonaldD. G., (New York, NY: Cambridge U. Press) 279–301.
36
Moore M. V. Pace M. L. Mather J. R. Murdoch P. S. Howarth R. W. Folt C. L. et al . (1997). Potential effects of climate change on freshwater ecosystems of the New England/Mid-Atlantic region. Hydrological processes11, (New York, NY: Cambridge U. Press) 925–947. doi: 10.1002/(SICI)1099-1085(19970630)11:8<925::AID-HYP512>3.0.CO;2-X
37
Munch S. B. Mangel M. Conover D. O. (2003). Quantifying natural selection on body size from field data: Winter mortality in Menidia menidia. Ecology84, 2168–2177. doi: 10.1890/02-0137
38
Nadim F. Bagtzoglou A. C. Baun S. A. Warner G. S. Ogden F. Jacobson R. A. et al . (2007). Management of adverse effects of a public water supply well field on the aquatic habitat of a stratified drift stream in eastern Connecticut. Water Environ. Res.79, 43–56. doi: 10.2175/106143006x136801
39
Nelson G. A. Gahagan B. I. Armstrong M. P. Jordaan A. Bowden A. (2020). A life cycle simulation model for exploring causes of population change in Alewife (Alosa pseudoharengus). Ecol. Model.422, 109004. doi: 10.1016/j.ecolmodel.2020.109004
40
Nelson K. C. Palmer M. A. Pizzuto J. E. Moglen G. E. Angermeier P. L. Hilderbrand R. H. et al . (2009). Forecasting the combined effects of urbanization and climate change on stream ecosystems: from impacts to management options. J. Appl. Ecol.46, 154–163. doi: 10.1111/j.1365-2664.2008.01599.x
41
NOAA National Centers for Environmental Information (2025). Climate data online. Available online at: https://www.ncdc.noaa.gov/cdo-web/datatools/findstation (Accessed October 2 2025).
42
NOAA National Marine Fisheries Service (2007). "Species of concern: river herring (Alewife and Blueback Herring)". in NMFS, office of protected resources. (Silver Spring, MD: NMFS Office of Protected Resources).
43
Pepin P. (1991). Effect of temperature and size on development, mortality, and survival rates of the pelagic early life history stages of marine fish. Can. J. Fisheries Aquat. Sci.48, 503–518. doi: 10.1139/f91-065
44
Post D. M. Palkovacs E. P. Schielke E. G. Dodson S. I. (2008). Intraspecific variation in a predator affects community structure and cascading trophic interactions. Ecol. (Washington D C)89, 2019–2032. doi: 10.1890/07-1216.1
45
Sabater S. Bregoli F. Acuña V. Barceló D. Elosegi A. Ginebreda A. et al . (2018). Effects of human-driven water stress on river ecosystems: a meta-analysis. Sci. Rep.8, 11462. doi: 10.1038/s41598-018-29807-7
46
Schaeffler A. Swilling M. (2013). Valuing green infrastructure in an urban environment under pressure - The Johannesburg case. Ecol. Econ86, 246–257. doi: 10.1016/j.ecolecon.2012.05.008
47
Schultz E. T. Conover D. O. Ehtisham A. (1998). The dead of winter: size-dependent variation and genetic differences in seasonal mortality among Atlantic silversides (Atherinidae: Menidia menidia) from different latitudes. Can. J. Fisheries Aquat. Sci.55, 1149–1157. doi: 10.1139/f97-320
48
Sogard S. M. (1997). Size-selective mortality in the juvenile stage of teleost fishes: a review. Bull. Mar. Sci.60, 1129–1157.
49
Turner S. M. Limburg K. E. (2016). Juvenile river herring habitat use and marine emigration trends: comparing populations. Oecologia180, 77–89. doi: 10.1007/s00442-015-3443-y
50
Van Loon A. F. (2015). Hydrological drought explained. WIREs Water2, 359–392. doi: 10.1002/wat2.1085
51
Verhelst P. Reubens J. Buysse D. Goethals P. Van Wichelen J. Moens T. (2021). Toward a roadmap for diadromous fish conservation: the Big Five considerations. Front. Ecol. Environ.19, 396–403. doi: 10.1002/fee.2361
52
Vigerstad T. J. Cobb J. S. (1978). Effects of predation by sea-run juvenile alewise (Alosa pseudoharengus) on the zooplankton community at Hamilton Reservoir, Rhode Island. Estuaries1, 36–45. doi: 10.2307/1351648
53
Yako L. A. Mather M. E. Juanes F. (2002). Mechanisms for migration of anadromous herring: An ecological basis for effective conservation. Ecol. Appl.12, 521–534. doi: 10.1890/1051-0761(2002)012[0521:MFMOAH]2.0.CO;2
Summary
Keywords
anadromy, daily growth, drought, migration, otolith
Citation
Burgess MN, Adams R, Knighton J and Schultz ET (2026) Trapped in the nursery: poor growth and condition in juvenile alewives (Alosa pseudoharengus) stemming from drought-imposed loss of connectivity to marine habitat. Front. Mar. Sci. 13:1721762. doi: 10.3389/fmars.2026.1721762
Received
09 October 2025
Revised
30 December 2025
Accepted
26 January 2026
Published
18 February 2026
Volume
13 - 2026
Edited by
Tomas Chalde, CONICET Centro Austral de Investigaciones Científicas (CADIC), Argentina
Reviewed by
Maria Flavia Gravina, University of Rome Tor Vergata, Italy
Tim Arciszewski, City of Eugene, United States
Updates
Copyright
© 2026 Burgess, Adams, Knighton and Schultz.
This is an open-access article distributed under the terms of the Creative Commons Attribution License (CC BY). The use, distribution or reproduction in other forums is permitted, provided the original author(s) and the copyright owner(s) are credited and that the original publication in this journal is cited, in accordance with accepted academic practice. No use, distribution or reproduction is permitted which does not comply with these terms.
*Correspondence: Eric T. Schultz, eric.schultz@uconn.edu
† Present address: Michael N. Burgess, Massachusetts Division of Marine Fisheries, New Bedford, MA, United States; Ryan Adams, Department of Biological Sciences, University of New Hampshire, Durham, NH, United States
Disclaimer
All claims expressed in this article are solely those of the authors and do not necessarily represent those of their affiliated organizations, or those of the publisher, the editors and the reviewers. Any product that may be evaluated in this article or claim that may be made by its manufacturer is not guaranteed or endorsed by the publisher.