Abstract
Seafood industries of Busan in South Korea have currently suffered a notable decline in both regional output and value-added unlike the production growth in the past. In this situation, this study tries to evaluate the economic contribution of Busan’s seafood industries using the hypothetical extraction method (HEM), a well-established technique that has rarely been applied in fisheries contexts. Also, this study is a rare attempt to utilize the theoretically rigorous HEM to quantify the economic contribution of seafood industries within the SAM framework, addressing the limitation of IO models that do not consider distributional effects. The results showed, among others, that Wholesale Trade and Transportation Services are key industries for fishery managers and policymakers to recognize, as the economic contribution of the seafood industries to these sectors account for a large share of the regional economy due to their strong direct and total linkages. Interestingly, this study also discovered that the seafood industries make substantial contributions to several unexpected industries compared to their direct contributions, such as Real Estate & Leasing and Health & Social Services, due to accounting for the distributional effects captured in the SAM model.
1 Introduction
Busan is one of the regions in South Korea where the seafood industries are well developed. In 2023, fisheries production (all raw fish species traded in local fish market) in Busan accounted for 12.3% (561 billion KRW) of the national total (4,548 billion KRW) (National Federation of Fisheries Cooperatives, 2024). In the same year, the region ranked first in the nation for fishing capital (vessel gross tonnage of 231,645 tons), the quantity of seafood processing (407,792 tons).
Although Busan’s seafood industries still account for a significant portion of the nation’s total seafood production, their status has been deteriorating. Figure 1 shows that wild capture fishery production (all landed species inside and outside fish market) in Busan has steadily decreased from 381,212 tons in 2000 to 238,845 tons in 2023 (Ministry of Ocean and Fisheries, 2024). This decline could be directly attributed to (i) the depletion of major commercial fish stocks from global warming, such as mackerel (Hong and Kim, 2021; Seung et al., 2024) and overfishing, (ii) intense competition in the global seafood market (Ahmed, 2006), (iii) trade barriers such as tariffs (Kim and Yang, 2008), and weakening fishing capacity (Lee and Cheong, 2013).
Figure 1
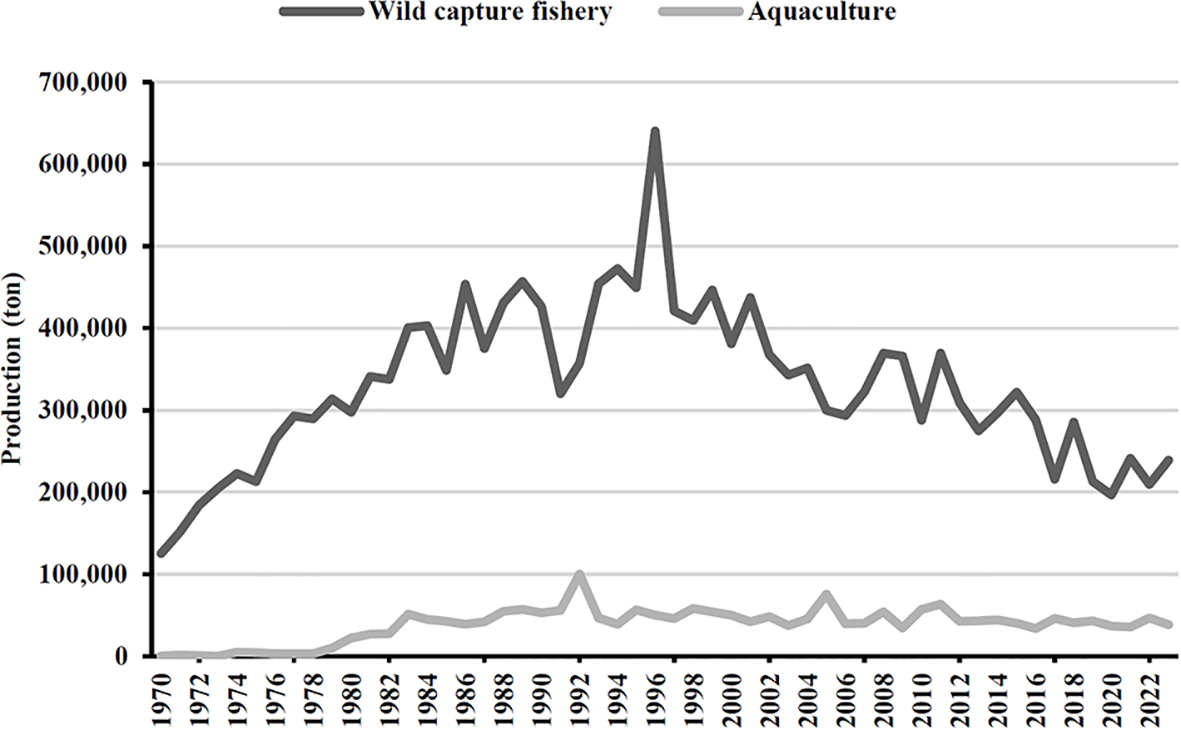
Fish production from wild capture fishery and aquaculture in Busan from 1970 to 2023.
In the last decade (2010-2020), the share of total regional output from the seafood industries in Busan, encompassing both upstream and downstream sectors, dropped from 16.01% to 7.62%, as represented in Figure 2 (Busan Metropolitan City Fisheries Industry Statistics, 2023). Here, upstream (backward) sectors refer to industries that supply inputs to seafood industries while downstream (forward) sectors purchase inputs from seafood industries (Seung and Kim, 2020; Miller and Blair, 2009). The former includes fish box or fishing net manufacturer, whereas the latter involves seafood restaurants. The reduction in output from both the seafood industries and related sectors may have led to significant negative economic impacts on the broader economy of Busan. Given the deteriorating condition of Busan’s seafood industries, fishery managers and policymakers are increasingly concerned about the economic contributions of these industries and how to improve them. To develop effective policy instruments that overcome these challenges and mitigate their negative economic impacts, fishery managers and regional policymakers require a deeper understanding of the economic contributions of the seafood industries.
Figure 2
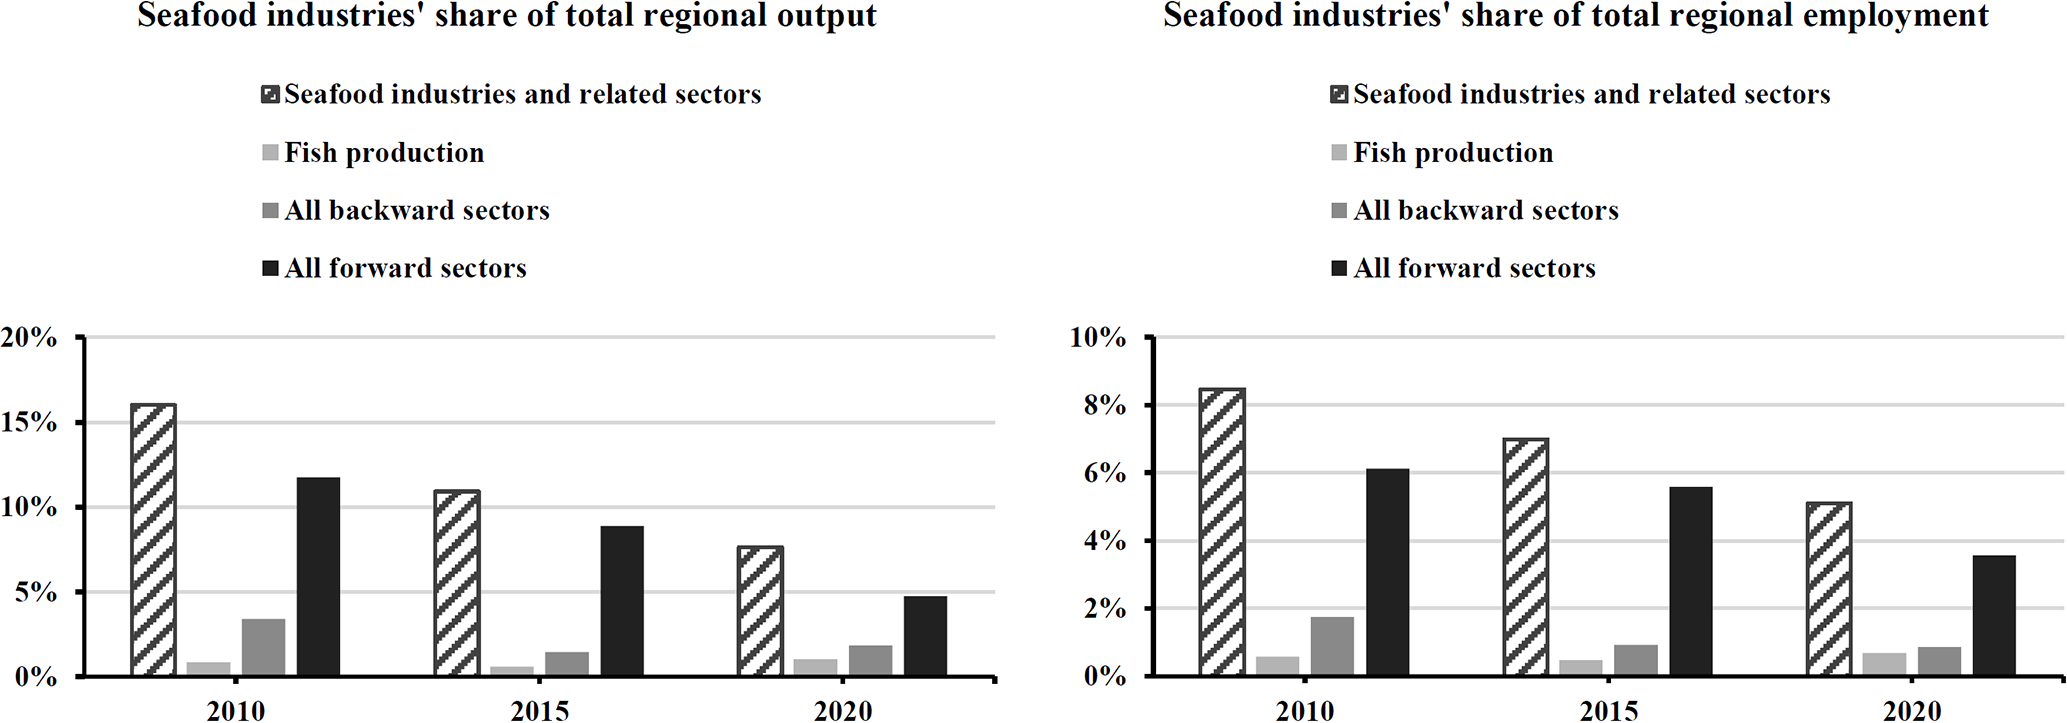
The share of the seafood industries in total regional output and employment in Busan from 2010 to 2020.
A widely used tool for analyzing the economic impacts of changes in an industry or the industry’s economic contribution to a region or country is the input-output (IO) model (Clouse et al., 2023). This model calculates economic impacts (or contributions) based on the interrelationships among various industries, generating multipliers. At this juncture, it is important to distinguish between economic impact analysis and economic contribution analysis. There are two types of analyses that can be performed using economic impact models, such as Input-Output (IO) and Social Accounting Matrix (SAM) models, which are also known as fixed-price models. These analyses are economic impact analysis and economic contribution analysis. Economic impact analysis is an ex-ante analysis that typically examines changes in sales, value-added, and employment resulting from a change in final demand. In contrast, economic contribution analysis is an analysis that measures the current status of an industry (or industries) and quantifies its role or importance in an economy. This paper conducts an economic contribution analysis. It is important to note that economic impact models cannot compute the welfare effects because they do not account for the substitution effects in production and consumption due to their fixed-price nature. For welfare analysis, a computable general equilibrium (CGE) model would be necessary, as it allows prices to be determined endogenously.
Although IO models have been widely used, it has a critical limitation: it cannot analyze the distributional effects, meaning it does not consider how income from industries flows to value-added sectors, households, and regional governments. To address this limitation, a social accounting matrix (SAM) model, which extends the IO model, is used. The SAM model incorporates several institutional accounts, such as households and regional governments, allowing it to capture distributional effects. For more detailed discussion of the linkages between institutional accounts income and their spending in SAM modeling, which are more accurately captured by treating them as endogenous variables, see, for example, Holland and Wyeth (1993).
This study assesses the economic contribution of the seafood industries (Wild Capture Fishery, Aquaculture, and Seafood Processing sectors) in Busan using the hypothetical extraction method (HEM). HEM measures the impact on a country’s or region’s total output resulting from the hypothetical removal of an industry (or a set of industries) within an economic impact model, such as an input-output (IO) model. When an industry is removed from the economy, its purchases of intermediate inputs will cease (backward linkage), and its sales to other industries will also be eliminated (forward linkage), resulting in an economy-wide decrease in production. The total decrease in the economy’s output is calculated as the difference between the total output before and after the industry’s removal, providing a measure of the contribution (role or importance) of the industry to the economy.
By using HEM within a regional SAM modeling framework, this study has several advantages over many previous contribution studies. First, this study overcomes the limitations associated with traditional IO models by employing a SAM model. Second, this study employs HEM, a well-established method for measuring an industry’s contribution within the regional economic analysis literature (Kay et al., 2007). However, this method based on SAM is rarely applied to the fishery sector and its result will represent more comprehensive economic importance than that based on IO such as previous studies in the next paragraph, especially at the regional level in terms of differences between local and import contributions. Third, this study disaggregates the whole seafood sector and related sectors into smaller industries. These sectors are often presented in a highly aggregated manner in publicly available data (such as that from the Bank of Korea). By breaking down these sectors, this study can quantify the economic contribution of the smaller seafood industries. Finally, but most importantly, this study identifies a number of non-seafood industries that policymakers should target to increase the contribution of the seafood industries.
When it comes to literature reviews regarding the economic contributions of fisheries and other marine sectors, numerous studies have been carried out so far. Morrissey and O’Donoghue (2013) and Lee and Yoo (2014) employed an IO model to assess the economic contributions of marine sectors, focusing on both backward and forward linkage effects in Ireland and South Korea, respectively. Similarly, Garza-Gil et al. (2017) used an IO model to evaluate the economic significance of fishing and aquaculture in Galicia, Spain, considering their contributions to value-added and employment.
Other research has adopted a SAM model to address the limitations of the IO model. For instance, Arita et al. (2011) applied a SAM model to determine the backward and forward linkage effects of the fisheries sector within Hawaii’s economy, examining how income distribution varies based on labor skill levels. In a recent study, Kim and Seung (2020) investigated the economic contributions of wild fisheries and aquaculture in Gyeong-Nam Province, South Korea. They used an adjusted demand-driven SAM modeling approach, setting regional purchase coefficients to zero to prevent double counting.
Most previous efforts have separately calculated the backward and forward linkages to measure economic contributions (Morrissey and O’Donoghue, 2013; Lee and Yoo, 2014; Arita et al., 2011; Sigfusson et al., 2013; Wang and Wang, 2019, 2021). However, when measuring forward linkages, these studies relied on the Ghosh (1958) model, which has serious theoretical issues if used as a quantity model (see Oosterhaven, 1988, 1989). In contrast, the HEM is an established approach (Strassert, 1968; Schultz, 1977; Miller and Lahr, 2001; Temurshoev, 2009) for quantifying the economic contribution of an industry or a group of industries.
Despite its wide acceptance, there have been only a few applications of this method in the fisheries sector (Johansen et al., 2019; Sakurai and Shibusawa, 2021). However, those applications were conducted within an IO model. This study is a rare attempt to employ HEM within a SAM model, providing more accurate estimates of economic contributions than previous efforts due to the distributional effects of institutional accounts.
This study is structured as follows. The methods section describes the structures of Busan SAM model and the HEM. The data section outlines the data used, enumerates the steps to disaggregate the seafood industries-related sectors, and describes how Busan SAM was constructed. The result section presents the measured economic contributions, followed by discussion, which offers explanations of the results, including policy implications. The final section includes conclusions.
2 Methods
2.1 Busan SAM model
This study utilizes the Busan SAM model (Supplementary Table S1 in Supplementary Material Appendix), which consists of fifty-two accounts. This includes forty-four endogenous industry accounts, five non-industry endogenous accounts, and three exogenous accounts. The non-industry endogenous accounts comprise two value-added accounts (labor and capital), as well as households, enterprises, and regional government. Finally, the exogenous accounts include the national government, investment and savings, and trade with external regions.
SAM direct coefficient matrix (S) is derived by dividing elements in each column in the SAM by its column sum as shown in Equation 1:
where:
A = matrix of technical coefficients.
L = matrix of labor income payment coefficients.
K = matrix of capital income payment coefficients.
Tb = matrix of coefficients representing business tax payments by industries to regional government.
Lh = matrix of coefficients representing the distribution of labor income to households.
E = matrix of coefficients representing the distribution of capital income to enterprise income.
C = matrix of coefficients representing household consumption demand.
Th = matrix of coefficients representing household payments of income tax to regional government.
Kh = matrix of coefficients representing the distribution of enterprise income to households.
G = matrix of regional government demand coefficients.
Tr = matrix of coefficients representing regional government transfers to households.
Then, the SAM model can be expressed as (Equations 2, 3):
or
where:
X = vector of regional industry output (endogenous).
VA(L) = vector of labor factor payments (endogenous).
VA(K) = vector of capital factor payments (endogenous).
IN(H) = vector of total household income (endogenous).
IN(E) = vector of total enterprise earnings (endogenous).
IN(RG) = vector of regional government income or revenue (endogenous).
ex = vector of exogenous demand for regional output.
eva(L) = vector of exogenous labor income payments.
eva(K) = vector of exogenous capital income payments.
ein(H) = vector of exogenous income to households.
ein(E) = vector of exogenous enterprise earnings.
ein(RG) = vector of exogenous income to regional government including national government transfers and regional government non-tax revenue.
(I-S)-1 = SAM multiplier matrix.
Here, X, VA(L), VA(K), IN(H), IN(E), and IN(RG) are endogenous variables while ex, eva(L), eva(K), ein(H), ein(E), and ein(RG) are the exogenous variables. Once the SAM multipliers are derived, the change in the endogenous variables can be computed by multiplying the change in the exogenous variables by the SAM multiplier matrix.
2.2 Hypothetical extraction method
In input-output (IO) literature, key sectors are defined as industries that substantially contribute to a regional or national economy. Numerous key sector analyses have identified which sectors hold the greatest potential for economic contribution. Early examples of these analyses include works by Rasmussen (1956); Chenery and Watanabe (1958), and Hirschman (1958).
Rasmussen (1956) used the Leontief inverse matrix to quantify total backward and forward linkages, while Chenery and Watanabe (1958) employed the direct IO coefficient matrix to assess direct backward and forward linkages. In both instances, the strength of these linkages was gauged by the column sums and row sums in the respective matrices. Other studies, such as those by Beyers (1976) and Jones (1976), used the output distribution matrix from the Ghosh model (1958) to calculate direct forward linkages and the Ghosh inverse matrix to determine total forward linkages.
However, to measure the total linkage or the total contribution of an industry, distinguishing between the backward and forward linkages is not appropriate (Miller and Lahr, 2001). Rather, a HEM (Strassert, 1968; Schultz, 1977) is more suitable for measuring the total contribution of an industry. When HEM was first developed, it was used to measure the economic contribution of an industry using the “total linkage” measure.
Some argue that the total linkage should be divided into backward and forward linkages (Meller and Marfan, 1981; Cella, 1984; Clements, 1990; Dietzenbacher and Linden, 1997). However, these two linkage measures are subject to a double-counting problem. That is, the forward linkage effects are present in the backward linkage measure and vice versa (Temurshoev, 2010).
The total linkage measure in the original HEM (Paelinck et al., 1965; Strassert, 1968) does not have this problem and is argued to be “totally adequate” for measuring the economy-wide contribution (Miller and Lahr, 2001; Temurshoev, 2010). Following the endorsement by these two studies (Miller and Lahr, 2001; Temurshoev, 2010), this study uses the original HEM version based on the Leontief model where the seafood industries are hypothetically extracted.
The HEM approach calculates the change (decrease) of total output for each sector in an economy if a specific sector(s) is eliminated (Miller and Blair, 2009). Technically, this involves replacing the elements in the row and column for the sector to be extracted in the direct-input coefficient matrix (A) with zeros and replacing the element for this sector in the final demand vector (f) with zero. This yields the new direct input coefficient matrix, , and the new final demand vector, . The output after extraction is derived as . Then, the reduction in the total output, or the economic contribution, is calculated as . See Miller and Blair (2009) for details.
Since this study uses a SAM model, Busan SAM considers the five non-industry endogenous accounts (labor, capital, enterprises, households, and regional government) as well as the industry accounts, as presented in the matrix of Busan SAM in Methods section. We zero out the column and row elements for both industry and the five non-industry endogenous accounts in the original SAM direct coefficient matrix (S), while also zeroing out their corresponding final demand elements. The multiplier matrix is now where is the SAM direct coefficient matrix obtained after the extraction. Also, the post-extraction output vector includes the five non-industry endogenous sectors (, , , , and ) as well as the industry sectors.
Similarly, the new final demand vector includes the five non-industry sectors (, , , , and ) in addition to the final demand for industries’ output (). Finally, the economic contribution in the SAM model is computed as . To measure the contribution to the total regional output, this study considers only that portion of the which shows the changes in the industries’ output.
Due to its theoretical soundness, the HEM approach is widely used in the literatures (see, for example, Miller and Lahr, 2001; Temurshoev, 2009) as the most suitable approach for assessing the total contribution (total linkage). This study represents an exceptional, especially the first in South Korea, application of this method to fisheries within a SAM framework. This study hypothetically extracts the three seafood industries simultaneously, which include Wild Capture Fishery, Aquaculture, and Seafood Processing. The contribution to the regional economy is measured in terms of three key variables: total regional output, total regional employment, and total value-added (combined labor and capital income).
3 Data
3.1 Multi-regional input-output and non-industry values
To develop the Busan social accounting matrix (SAM), this study begins with a multi-regional input-output (MRIO) matrix for 2015 (Bank of Korea, 2020). The MRIO data includes 17 regions, with Busan being one of them. This MRIO dataset contains information on the following: (i) inter-industry transactions within each of the 16 regions; (ii) employee compensation, (iii) operational surplus, (iv) indirect business taxes, (v) final demand, which encompasses consumer demand, investment demand, government demand, and both domestic and foreign exports for commodities, and (vi) transactions between industries within the region and those in other regions.
All 16 regions outside of Busan are included in the Rest of the World (ROW) account, which encompasses the rest of Korea as well as all foreign countries. The trade flows between Busan and the ROW are estimated using the MRIO data. To estimate total government demand, this study first combines government expenditure and government investment for each commodity in the Busan IO data. The single government sector in the data is then divided into two components: national and regional. In this context, the regional government comprises both the provincial government of Busan and all lower-level governments, such as those of Gun and Gus.
To determine the allocation of total government demand for goods and services between national and regional governments, this study first subtracts the expenditures of the regional government—estimated using the Local Finance Integrated Open System (LFIOS) (Ministry of Public Administration and Security, 2024)—from the total government demand. This calculation yields the demand for the national government. Additionally, national government revenues (such as taxes) and expenditures on items other than goods and services (for instance, transfer payments) are estimated using data from the National Tax Service Annual Report (NTSAR) (National Tax Service of Korea, 2016, which provides data for 2015).
The information regarding regional government revenue is sourced from the Annual Local Tax Statistics Report (ALTSR) (Ministry of the Interior, 2016, for 2015 data) and regional tax statistics (Busan Metropolitan City Statistics, 2022a, for 2015 data), which encompass both direct and indirect taxes. Data on government subsidies and social welfare payments to households are derived from local finance expenditure statistics (Busan Metropolitan City Statistics, 2022b, for the year 2015). Moreover, data on household tax payments to both national and regional governments was estimated based on the data for 2015 from NTSAR and ALTSR. The data sources used for constructing Busan SAM are listed in Supplementary Table S3 in Supplementary Material Appendix.
3.2 Seafood industries separation and balancing
Fish production and processing are not categorized as separate sectors in the 33-sector MRIO dataset. In this dataset, fish production (Wild Capture Fishery, Aquaculture) falls under the Agriculture, Forestry & Fisheries Product sector, while Seafood Processing is classified within the Food & Drink sector. To separate Wild Capture Fishery and Aquaculture from the Agriculture, Forestry & Fisheries Product sector, and to separate Seafood Processing from the Food & Drink sector, this study used the 165-sector MRIO data for 2015 (Bank of Korea, 2020).
Additionally, the 170-sector single-region IO (SRIO) table for Busan (Kim et al., 2012, for 2010) was employed to identify sectors that have strong backward and forward linkages to the seafood industries. Specifically, the respective intermediate input use ratios for the smaller seafood and related sectors (Wild Capture Fishery, Aquaculture, Fishing Net & Rope, Wholesale Trade, and Retail Trade) and other sectors estimated from the 2010 SRIO data were used for disaggregating the aggregate sectors in the 2015 MRIO data as in Kim and Seung, 2020. Consequently, the final number of industries included in Busan SAM model is 44 (Supplementary Table S2 in Supplementary Material Appendix). For more details, see Table 1 and Supplementary Table S4 in Supplementary Material Appendix. The Busan SAM (Supplementary Table S1 in Supplementary Material Appendix) was constructed using the estimated data above.
Table 1
| Sectors | Aggregated categories | Disaggregated categories | Remark |
|---|---|---|---|
| Seafood industry backward subsectors (6 sectors) |
Food & Drink | Feeds | Including fish feed |
| Non-alcoholic Beverages & Ice | Including ice for seafood freshness and storage | ||
| Textile & Leather Product | Fishing Net & Rope | ||
| Wood, Paper & Printing | Wood Product | Including fish containing box | |
| Machinery & Equipment | Internal Combustion Engine & Turbine | Including engines for fishing vessel | |
| Transportation Equipment | Ships | Including fishing vessel and repairment | |
| Seafood industries (3 sectors) |
Agriculture, Forestry & Fisheries Product | Wild Capture Fishery | Raw fish production |
| Aquaculture | Raw fish production | ||
| Food & Drink | Seafood Processing | Intermediate or finished seafood products for retail | |
| Seafood industry forward subsectors (4 sectors) |
Transportation Services | Storage & Warehousing Services | Including raw fish and seafood products |
| Wholesale & Retail Trade | Wholesale Trade | Including seafood wholesale | |
| Retail Trade | Including seafood retail | ||
| Restaurant & Lodging Services | Restaurant Food & Pubs | Including seafood dishes provided to commercial and institutional restaurant |
Industry classification for Busan SAM (BOK 33-sector and seafood-related 13-subsector).
To balance the SAM that still has empty cells due to unavailable data, this study adjusted the elements in the exogenous accounts (five elements in the investment & savings row corresponding to household, enterprise, regional government, national government, and ROW) until the column sums matched the row sums by filling residuals. The ratios of balanced values to each account total ranged from 2.9% to 34.2%.
4 Results
4.1 Regional technical coefficient of seafood industries in Busan
This study first identified the top ten industries that provide the highest value of intermediate inputs to each seafood industry (see Table 2). It is important to note that the technical coefficients in Table 2 represent the purchase of locally produced intermediate inputs by the seafood industries and do not include imported inputs, which are detailed in Table 3. According to Table 2, the three industries from which Wild Capture Fishery purchases the largest amounts of intermediate inputs are Transportation Services, Wood Product, and Finance & Insurance.
Table 2
| No. | Wild Capture Fishery | Aquaculture | Seafood Processing | Sum of seafood industries | ||||
|---|---|---|---|---|---|---|---|---|
| Sector | TC | Sector | TC | Sector | TC | Sector | TC | |
| 1 | Others | 0.019 (-) |
Electricity, Gas & Steam | 0.115 (0.010) |
Wild Capture Fishery |
0.277 (0.055) |
Wild Capture Fishery | 0.156 (0.032) |
| 2 | Transportation Services |
0.016 (0.038) |
Agriculture & Forestry Products | 0.105 (0.061) |
Seafood Processing |
0.131 (0.076) |
Seafood Processing | 0.072 (0.042) |
| 3 | Wood Product | 0.015 (0.028) |
Feeds | 0.031 (0.016) |
Wholesale Trade |
0.042 (0.033) |
Wholesale Trade | 0.029 (0.023) |
| 4 | Finance & Insurance |
0.014 (0.009) |
Other Food & Drink | 0.025 (0.015) |
Transportation Services |
0.029 (0.006) |
Transportation Services | 0.023 (0.019) |
| 5 | Wholesale Trade |
0.012 (0.010) |
Others | 0.023 (-) |
Other Manufacturing |
0.024 (0.005) |
Other Manufacturing | 0.015 (0.003) |
| 6 | Ships | 0.011 (0.025) |
Wholesale Trade | 0.022 (0.017) |
Retail Trade | 0.013 (0.010) |
Finance & Insurance | 0.009 (0.005) |
| 7 | Chemical Products |
0.007 (0.017) |
Fishing Net & Rope | 0.021 (0.076) |
Aquaculture | 0.010 (0.002) |
Others | 0.009 (-) |
| 8 | Fishing Net & Rope |
0.007 (0.026) |
Finance & Insurance | 0.017 (0.011) |
Other Food & Drink |
0.009 (0.010) |
Retail Trade | 0.008 (0.007) |
| 9 | Wild Capture Fishery |
0.007 (0.003) |
Ships | 0.016 (0.035) |
Electricity, Gas & Steam |
0.008 (0.001) |
Electricity, Gas & Steam | 0.008 (0.001) |
| 10 | Restaurant Food & Pubs |
0.006 (0.006) |
Health & Social Services | 0.014 (0.003) |
Chemical Products |
0.006 (0.030) |
Wood Product | 0.007 (0.013) |
The top ten backward-linked sectors by the size of the technical coefficients (TC) of seafood industries in Busan.
The values in the bracket are import coefficients.
Table 3
| No. | Wild Capture Fishery | Aquaculture | Seafood Processing | Sum of seafood industries | ||||
|---|---|---|---|---|---|---|---|---|
| Sector | IC | Sector | IC | Sector | IC | Sector | IC | |
| 1 | Coal & Petroleum Products |
0.141 (0.001) |
Fishing Net & Rope | 0.076 (0.021) |
Seafood Processing |
0.076 (0.131) |
Coal & Petroleum Products |
0.063 (0.001) |
| 2 | Transportation Services |
0.038 (0.016) |
Agriculture & Forestry Products | 0.061 (0.105) |
Wild Capture Fishery |
0.055 (0.277) |
Seafood Processing | 0.042 (0.072) |
| 3 | Wood Product | 0.028 (0.015) |
Coal & Petroleum Products | 0.048 (0.001) |
Wholesale Trade |
0.033 (0.042) |
Wild Capture Fishery | 0.031 (0.156) |
| 4 | Fishing Net & Rope |
0.026 (0.007) |
Ships | 0.035 (0.016) |
Chemical Products |
0.030 (0.006) |
Chemical Products | 0.024 (0.007) |
| 5 | Ships | 0.025 (0.011) |
Chemical Products | 0.024 (0.010) |
Wood, Paper & Printing |
0.015 (0.004) |
Wholesale Trade | 0.023 (0.029) |
| 6 | Public Administration & Defense |
0.020 (-) |
Wholesale Trade | 0.017 (0.022) |
Retail Trade | 0.010 (0.013) |
Transportation Services | 0.019 (0.023) |
| 7 | Chemical Products |
0.017 (0.007) |
Feeds | 0.016 (0.031) |
Other Food & Drink |
0.010 (0.009) |
Fishing Net & Rope | 0.013 (0.004) |
| 8 | Non-alcoholic Beverages & Ice |
0.016 (0.001) |
Other Food & Drink | 0.015 (0.025) |
Metal Products |
0.009 (0.004) |
Wood Product | 0.013 (0.007) |
| 9 | Electric & Electronic Equipment |
0.014 (0.001) |
Finance & Insurance | 0.011 (0.017) |
Professional, Scientific & Tech. Serv. |
0.008 (0.006) |
Ships | 0.012 (0.005) |
| 10 | Storage & Warehousing Services |
0.012 (0.003) |
Electricity, Gas & Steam | 0.010 (0.115) |
Storage & Warehousing Services |
0.008 (0.005) |
Storage & Warehousing Services |
0.010 (0.004) |
The top ten backward-linked sectors by the size of the import coefficients (IC) of seafood industries in Busan.
The values in the bracket are technical coefficients.
Aquaculture sector purchases the largest quantities of inputs from Electricity, Gas & Steam, as well as from Agriculture & Forestry Products and Feeds. In contrast, the Seafood Processing sector heavily relies on inputs from Wholesale Trade, Transportation Services, and Other Manufacturing, in addition to Wild Capture Fishery and Aquaculture. Overall, the seafood industries in Busan are heavily dependent on three main industries (excluding the seafood sectors themselves): Wholesale Trade, Transportation Services, and Finance & Insurance (the last two columns of Table 2).
4.2 Import coefficient of seafood industries in Busan
Table 3 presents the top ten industries ranked by the size of import coefficients for the seafood industries. It shows that the leading products imported by Wild Capture Fishery are Coal & Petroleum Products, Transportation Services, and Wood product. The data reveals that Wild Capture Fishery relies more on imports of these goods than on locally produced alternatives.
Notably, several industries listed in Table 2, such as Wood product, Fishing Net & Rope, Ships, and Chemical Products, also appear in the top ten list of Table 3. In contrast, the top three products imported by Seafood Processing for their operations include commodities or services produced in Wholesale Trade, Chemical Products, and Wood, Paper & Printing. Overall, the seafood industries as a whole rely more on imports of Coal & Petroleum Products, Chemical Products, and Wholesale Trade than on their locally produced versions.
4.3 Total economic contributions of seafood industries in Busan
Table 4 illustrates the economic contributions of the three seafood industries to the Busan economy. The contribution to the total regional output was calculated to be 5,131,877 million KRW, representing 2.83% of the total regional output (181,467,332 million KRW) for the base year (2015). The combined direct contribution of all three seafood industries amounted to 3,486,930 million KRW (the last grouped column of Table 4), accounting for 67.9% of the total contribution. Among these, Seafood Processing made the most significant direct contribution at 37.5%.
Table 4
| Variables | The Busan economy in the base year (2015) | Total contributions | Seafood industries’ direct contributions (% of total contribution in parentheses) | |||
|---|---|---|---|---|---|---|
| Wild Capture Fishery | Aquaculture | Seafood Processing | Sum of seafood industries | |||
| Industry output | 181,467,332 | 5,131,877 | 1,493,079 (29.1%) |
71,281 (1.4%) |
1,922,570 (37.5%) |
3,486,930 (67.9%) |
| Employment (FTEs) |
1,437,772 | 29,312 | 6,920 (23.6%) |
807 (2.8%) |
6,064 (20.7%) |
13,791 (47.0%) |
| Labor income (employee compensation) |
41,592,470 | 1,060,331 | 537,767 (50.7%) |
13,599 (1.3%) |
126,383 (11.9%) |
677,749 (63.9%) |
| Capital income (business surplus) |
22,504,893 | 384,018 | 57,379 (14.9%) |
8,099 (2.1%) |
59,762 (15.6%) |
125,240 (32.6%) |
| Regional gov’t revenue (indirect tax) | 10,649,153 | 99,065 | 921 (0.9%) |
61 (0.1%) |
5,688 (5.7%) |
6,670 (6.7%) |
| Household income | 55,712,748 | 1,267,259 | ||||
Total economic contributions of seafood industries in Busan.
All units are in million KRW except for the employment variable that uses the number of laborers (FTEs) per million KRW.
This study also measured the contributions to employment, labor income, and capital income (Table 4). First, the economic contribution to total employment (Full time equivalent, FTEs per million KRW) was calculated to be 29,312, representing 2.03% of the total regional employment of 1,437,772. In contrast to the contribution to total regional output, Wild Capture Fishery contributes slightly more to total regional employment (23.6%) compared to Seafood Processing (20.7%).
The total contribution to labor income (employee compensation) amounts to 1,060,331 million KRW, or 2.55% of the total regional labor income. The results further indicate that the direct contribution to labor income from Wild Capture Fishery is substantially larger (50.7%) compared to Seafood Processing (11.9%). This is despite the fact that the employment levels in the two industries are similar (6,920 for Wild Capture Fishery and 6,024 for Seafood Processing).
In contrast, the contribution to total capital income from business surplus was 384,018 million KRW, which represents 1.71% of the total regional capital income in the base year (2015). The results indicate that a slightly higher share of this contribution comes from Seafood Processing, at 15.6%, compared to Wild Capture Fishery, at 14.9%. The total contribution to regional government revenue amounted to 99,065 million KRW, or 0.93% of the total regional government revenue in the base year (2015).
The combined direct contribution of all three seafood industries to regional government revenue was 6,670 million KRW, accounting for only 6.7%. Furthermore, the contribution to household income totaled 1,267,259 million KRW, which represents 2.27% of the base year’s total household income.
Table 5 displays the decrease in output for the top 15 industries resulting from the extraction of seafood industries, along with the corresponding share of this decrease in total regional output. Results reveal that the three sectors (excluding the extracted sectors) experiencing the largest declines in output are Real Estate & Leasing (161,057 million KRW), Wholesale Trade (157,647 million KRW), and Finance & Insurance (150,504 million KRW).
Table 5
| No. | Sector | Output (million KRW) | Share of the total contribution |
|---|---|---|---|
| 1 | Real Estate & Leasing | 161,057 | 3.14% |
| 2 | Wholesale Trade | 157,647 | 3.07% |
| 3 | Finance & Insurance | 150,504 | 2.93% |
| 4 | Transportation Services | 127,291 | 2.48% |
| 5 | Health & Social Services | 96,498 | 1.88% |
| 6 | Electricity, Gas & Steam | 87,778 | 1.71% |
| 7 | Restaurant Food & Pubs | 87,548 | 1.71% |
| 8 | Educational Services | 75,365 | 1.47% |
| 9 | Retail Trade | 75,090 | 1.46% |
| 10 | Other Manufacturing | 69,040 | 1.35% |
| 11 | Other Services | 65,010 | 1.27% |
| 12 | Public Administration & Defense | 51,930 | 1.01% |
| 13 | Other Food & Drink | 50,624 | 0.99% |
| 14 | Professional, Scientific & Tech. Serv. | 41,375 | 0.81% |
| 15 | Telecommunications & Broadcasting | 39,168 | 0.76% |
Total contributions of seafood industries to industry output (Top 15 sectors).
This study also assessed the contribution of the seafood industries to employment and value-added (combined labor and capital income) in non-seafood industries (see Table 6). The industries that experienced the largest decreases in employment were Retail Trade (2,668 FTEs), Wholesale Trade (1,498 FTEs), and Other Services (1,472 FTEs).
Table 6
| No. | Sector | Employment (FTEs) | Combined value-added (million KRW) |
|---|---|---|---|
| 1 | Retail Trade | 2,668 (9.10%) | 42,267 (2.93%) |
| 2 | Wholesale Trade | 1,498 (5.11%) | 81,258 (5.63%) |
| 3 | Other Services | 1,472 (5.02%) | 23,297 (1.61%) |
| 4 | Restaurant Food & Pubs | 1,393 (4.75%) | 23,513 (1.63%) |
| 5 | Health & Social Services | 1,134 (3.87%) | 45,072 (3.12%) |
| 6 | Educational Services | 987 (3.37%) | 47,011 (3.25%) |
| 7 | Transportation Services | 956 (3.26%) | 30,605 (2.12%) |
| 8 | Finance & Insurance | 765 (2.61%) | 76,911 (5.32%) |
| 9 | Other Manufacturing | 654 (2.23%) | 30,531 (2.11%) |
| 10 | Business Support | 611 (2.08%) | 20,622 (1.43%) |
| 11 | Public Administration & Defense | 520 (1.77%) | 27,989 (1.94%) |
| 12 | Real Estate & Leasing | 456 (1.56%) | 69,634 (4.82%) |
| 13 | Art, Sports & Cultural Services | 406 (1.38%) | 11,795 (0.82%) |
| 14 | Agriculture & Forestry Products | 296 (1.01%) | 5,755 (0.40%) |
| 15 | Professional, Scientific & Tech. Serv. | 283 (0.97%) | 21,176 (1.47%) |
Total contributions to employment and value-added (combined labor and capital income) (Top 15 sectors by the size of the contribution to employment).
Values in brackets represent the share of total contribution.
However, it is important to note that this does not necessarily imply that these three industries are the top beneficiaries of the seafood industries in terms of value-added. In terms of value-added (combined labor and capital income), the top three sectors with the most significant decreases were Wholesale Trade (81,258 million KRW), Finance & Insurance (76,911 million KRW), and Real Estate & Leasing (69,634 million KRW).
4.4 Comparison of SAM model to IO model
Table 7 presents the output results from the IO and SAM models. The table shows that the total regional output calculated by the SAM model, amounting to 5,131,877 million KRW, is significantly higher than that estimated by the IO model, which totals 4,230,318 million KRW. The difference between the two approaches is 901,559 million KRW, representing 21.3% of the IO model’s estimate.
Table 7
| No. | SAM | IO | Difference |
|---|---|---|---|
| Total contributions | 5,131,877 | 4,230,318 | 901,559 |
| Seafood industries (3 sectors) |
3,486,930 (67.96%) |
3,486,930 (82.43%) |
– |
| Seafood industry subsectors (10 sectors) |
405,565 (7.90%) |
249,294 (5.89%) |
156,272 (17.33%) |
| Feeds | 4,058 (0.08%) |
2,626 (0.06%) |
1,431 (0.16%) |
| Non-alcoholic Beverages & Ice | 1,152 (0.02%) |
977 (0.02%) |
175 (0.02%) |
| Fishing Net & Rope | 13,056 (0.25%) |
12,922 (0.31%) |
133 (0.01%) |
| Wood Product | 24,081 (0.47%) |
23,930 (0.57%) |
151 (0.02%) |
| Internal Combustion Engine & Turbine | 7,422 (0.14%) |
7,380 (0.17%) |
41 (<0.00%) |
| Ships | 18,606 (0.36%) |
18,490 (0.44%) |
116 (0.01%) |
| Storage & Warehousing Services | 16,905 (0.33%) |
15,952 (0.38%) |
954 (0.11%) |
| Wholesale Trade | 157,647 (3.07%) |
113,555 (2.68%) |
44,092 (4.89%) |
| Retail Trade | 75,090 (1.46%) |
32,649 (0.77%) |
42,440 (4.71%) |
| Restaurant Food & Pubs | 87,548 (1.71%) |
20,812 (0.49%) |
66,736 (7.40%) |
| Non-seafood industry sectors (31 sectors) |
1,239,382 (24.15%) |
494,094 (11.68%) |
745,287 (82.67%) |
Total contributions to output from SAM and IO models.
The seafood industries include Wild Capture Fishery, Aquaculture, and Seafood Processing. The percentages in brackets indicate changes relative to total contributions in each sector.
Notably, the disparity between the IO and SAM results is significantly larger for non-seafood industry sectors, with a difference of 745,287 million KRW (82.67% of the total difference) compared to only 156,272 million KRW (17.33% of the total difference) for the 10 sectors closely linked to the seafood industries. Among these, Restaurant Food & Pubs sector shows the largest discrepancy, with a difference of 66,736 million KRW. In contrast, the smallest difference of just 41 million KRW occurs in Internal Combustion Engine & Turbine sector.
5 Discussion
This study examined both the direct and total contributions of the seafood industries to other industries of the economy. Table 2 illustrates that the seafood industry has strong direct economic linkages with the Transportation Services and Finance & Insurance sectors. Within these industries, subsectors such as Road Transportation Services, Other Transportation Services, and Central Bank & Depository Institutions (within the Finance sector) provide significant inputs to the seafood industries, as indicated by the 165-sector MRIO. Therefore, these subsectors should be carefully considered by policymakers when identifying considerable direct contributions.
Also, it is shown that while the direct contributions of the seafood industries to several non-seafood industries are significant, their total contributions to these industries are relatively small. In addition, Wild Capture Fishery has a notable locally direct contribution to Wood product (0.015), Fishing Net & Rope (0.007), Ships (0.011), and Chemical Products (0.007) industries, as highlighted in Table 2 (local totals of four sectors: 0.041). Yet, these industries locally provide only a small portion of total inputs to Wild Capture Fishery, with the rest sourced from outside the region, as indicated in Table 3 (imported totals of four sectors: 0.096). Therefore, this finding suggests that policymakers should consider promotion policies such as substituting imports with local production to increase the economic importance of seafood sectors to these industries to some extent.
In comparison, this study identified several industries where the seafood industries make both substantial direct and total contributions. For instance, the seafood industries significantly contribute to Wholesale Trade, with their direct output contribution being the largest among all industries, measured by the technical coefficient (0.029) in Table 2. Additionally, their total contribution (including direct, indirect, and induced impacts) to this industry ranks second, amounting to 157,647 million KRW (as shown in Table 5).
The next industry where the seafood industries make a substantial direct contribution is Transportation Services (0.029, Table 2). The seafood industries’ total contribution to Transportation Services ranks fourth (127,291 million KRW, Table 5). Finance & Insurance is one of the industries to which the seafood industries make the largest direct and total contributions (Tables 2, 5).
Notably, a considerable portion of inputs from two of these three industries (Wholesale Trade and Transportation Services) is sourced from imports. This suggests that the economic importance of the seafood industries could be substantially enhanced due to substantial total contributions as well as direct ones, if policymakers promote local production of these services, thereby reducing dependence on imports.
Looking at Table 4, labor income in Wild Capture Fishery (537,767 million KRW) is higher than that in Seafood Processing (126,383 million KRW), whereas Seafood Processing (1,922,570 million KRW) has a greater industry output than Wild Capture Fishery (1,493,079 million KRW). This difference arises mainly because the baseline employment per unit of output in Wild Capture Fishery is larger than that in Seafood Processing.
On the other hand, employment contributions in two sectors are similar (6,920 for Wild Capture Fishery and 6,024 for Seafood Processing), which indicates that, in the base year, the average wage rate in Wild Capture Fishery is considerably greater due to its high labor income than that in Seafood Processing. Regarding contributions to regional government revenue, the seafood industries’ value is considerably smaller than other variables such as output or value-added (labor and capital income). This lower figure (6.7%) may be attributed to the government providing subsidies to the seafood industries, which offset income.
The direct contribution of the seafood industries to Real Estate & Leasing is relatively small. However, it ranks first in their total contributions, totaling 161,057 million KRW (Table 5). Similarly, the seafood industries’ direct contributions to sectors such as Restaurant Food & Pubs and Health & Social Services are also minimal, but their total contributions to these non-seafood industries are significant (Table 5).
These findings result from the distributional effects captured in Busan SAM model. For example, an increase in a seafood industry’s output will lead to a higher demand for intermediate inputs produced across the non-seafood industries. Consequently, the output and value-added (labor and capital) in these industries will increase, resulting in increased income for factor owners (households) and a boost in regional government revenues.
As a result, both households and regional governments will increase their “typical” consumption of goods and services regarding daily life or general budget. Households, in particular, tend to spend a significant portion of their income on services such as Real Estate & Leasing (housing) and Health & Social Services. This finding could not be derived from an IO model that does not capture distributional effects on institutional income and spending. Policymakers should recognize that IO-based contribution analyses may underestimate the importance of the seafood industries to these non-seafood industries.
When comparing the results in Tables 5 and 6, it is evident that the contributions of the seafood industries to other industries vary depending on the metric used. According to Table 5, the seafood industries make the largest contribution to Real Estate & Leasing in terms of output. In contrast, as shown in Table 6, their greatest contribution to employment is in Retail Trade. Additionally, when measured in total value-added (combined labor income and capital income) (as presented in Table 6), the seafood industries make the largest contribution to Wholesale Trade in addition to Retail Trade.
This study observed a significant disparity between the results of SAM and those of IO models (see Table 7). The differences were particularly pronounced in Wholesale Trade, Retail Trade, and Restaurant Food & Pubs sectors. This is because households and the regional government allocate a substantial portion of their income to commodities produced in these sectors.
In contrast, the minimal discrepancy between the IO and SAM results in the sector such as Internal Combustion Engine & Turbine indicates that households and the regional government are unlikely to considerably alter their consumption of this product in response to changes in income; thus, the distributional effects in the SAM model for this sector are negligible.
Mostly, the SAM model, which treats institutions as endogenous, reveals contributions to output that are considerably larger than those of the IO model. Base-year data indicate that households and the regional government accounted for approximately 79.1% and 20.9%, respectively, of their combined expenditures on regionally produced commodities, totaling 37.2 trillion KRW (Supplementary Table S1 in Supplementary Material Appendix). Moreover, 41.2% of the total revenue received by the regional government (10.6 trillion KRW) is distributed to households as transfer income. Thus, by making these two institutions endogenous, the SAM model predicts a substantially greater contribution of the seafood industries to these non-seafood industries.
This finding underscores the importance of using a SAM model that comprehensively captures the effect of institutional spending on regionally produced commodities. Previous studies have attempted to account for household spending by endogenizing the household sector through a “closed” IO model (e.g., Garza-Gil et al., 2017). However, the income distribution mechanism in the closed IO model is oversimplified, as it allocates all value-added (or, in some cases, solely labor income) to households.
In comparison, Busan SAM differentiates between labor and capital incomes, distributing capital income to enterprise account before allocating these incomes to household account. By overlooking these connections, the closed IO model may either overestimate or underestimate the actual contribution. Moreover, Busan SAM model endogenizes regional government, recognizing that its revenue and expenditure will change in response to a change in regional economic activity.
6 Conclusion
This study examined the economic contributions of the seafood industries to the Busan economy by using HEM within a SAM modeling framework. It is found, first of all, that the total output contribution (5,131,877 million KRW) estimated using the SAM model is significantly larger (21.3%) than that (4,230,318 million KRW) calculated with an IO model, emphasizing the importance of employing a SAM model for such analyses.
Second, this study identified the industries that are severely impacted when the seafood industries are hypothetically extracted. The results from this study can be helpful to policymakers in several ways. Among others, policymakers must pay attention to these industries when seafood sectors face challenges due to fishery management actions or environmental shocks.
For example, fishery managers may reduce the total allowable catch (TAC) for certain species due to declining fish stock biomass levels or the implementation of individual transferable quotas (ITQs), which typically result in a limitation of fisheries production in a short-term. In this case, seafood industries should be separated by species to differently capture their economic contributions, rather than simply targeting regional industries—one of the limitations of this study.
Further, fisheries production can significantly decrease due to external factors such as climate change or other fishery disasters. In these situations, this research will offer valuable insights for fishery managers. It will help them design policies to compensate for the losses incurred by the affected industries (for example, through government relief), or develop strategies to alleviate or adapt to these adverse effects.
Third, this study identified several industries in the region (Wholesale Trade and Transportation Services, among others), that are considerably affected by the seafood industries’ extraction. However, these industries supply only a small portion of the intermediate inputs to the seafood industries, with the rest being met by imports. If these imports are replaced with increased local production in these regional industries, the economic contribution (importance) of the seafood industries could be greatly enhanced. Because the greater the ratio of purchases that go to imports, the smaller the multiplier (Hoover and Giarrantani, 1999; Stimson et al., 2006; Shuman, 2007; Elvin, 2008).
Policymakers require this information to recognize the regional seafood industries’ economic contribution and the associated benefits for Busan residents. To promote local production and reduce dependence on imports for improving seafood industries’ contributions, the regional government could, for instance, offer tax incentives to the firms. An increase in local production would lead to a greater economic contribution from the seafood industries in terms of in-region economic importance, thereby enlarging employment opportunities and value-added for the residents of Busan.
Finally, this study revealed that the seafood industries have a substantial total contribution to several seemingly unlikely industries, such as Real Estate & Leasing, as well as Health & Social Services. This finding is derived from the application of the SAM model. Policymakers may also want to consider identifying these industries. While one might assume that the seafood industries have no strong linkages with these sectors, this study demonstrates that this is not the case.
Currently, the Busan government is investing in the modernization of the fish market, providing assistance to vessel owners for replacing aging fishing equipment, and automating the fish selection process. Additionally, the city government has made efforts to enhance the quality and diversity of regional seafood to increase household consumption. While these initiatives are beneficial, this study offers valuable insights into which industries the government should target in addition to its current efforts.
This study has several limitations. First, it employs a single-region model. A multi-regional model would be necessary to assess the contributions of Busan’s seafood industries to other regions in the country. Second, the results of this study may be sensitive to the way industries or sectors are categorized. Our SAM includes 44 industries and 5 non-industry endogenous sectors. Changing the number of industries or non-industry sectors could produce different outcomes. For example, the results may vary if we model different types of labor or households within the SAM. However, this limitation is not unique to our study; all research using IO or SAM models suffer from this limitation to varying degrees.
Statements
Data availability statement
The original contributions presented in the study are included in the article/Supplementary Material, further inquiries can be directed to the corresponding author/s.
Author contributions
W-HC: Data curation, Formal Analysis, Investigation, Software, Writing – original draft. CS: Conceptualization, Methodology, Project administration, Validation, Writing – review & editing. J-HC: Funding acquisition, Validation, Writing – review & editing. D-HK: Conceptualization, Project administration, Supervision, Writing – review & editing.
Funding
The author(s) declared that financial support was received for this work and/or its publication. This study was supported by a grant from the National Institute of Fisheries Science (R2026002).
Acknowledgments
This study was conducted as part of a cooperative research project under the US-Korea Joint Project Agreement (JPA).
Conflict of interest
The author(s) declared that this work was conducted in the absence of any commercial or financial relationships that could be construed as a potential conflict of interest.
Generative AI statement
The author(s) declared that generative AI was not used in the creation of this manuscript.
Any alternative text (alt text) provided alongside figures in this article has been generated by Frontiers with the support of artificial intelligence and reasonable efforts have been made to ensure accuracy, including review by the authors wherever possible. If you identify any issues, please contact us.
Publisher’s note
All claims expressed in this article are solely those of the authors and do not necessarily represent those of their affiliated organizations, or those of the publisher, the editors and the reviewers. Any product that may be evaluated in this article, or claim that may be made by its manufacturer, is not guaranteed or endorsed by the publisher.
Supplementary material
The Supplementary Material for this article can be found online at: https://www.frontiersin.org/articles/10.3389/fmars.2026.1732248/full#supplementary-material
Supplementary Table 1Structure of Busan SAM (including values in million KRW).
Supplementary Table 2List of the final industry classification for Busan SAM.
Supplementary Table 3List of industry and non-industry values data used for constructing Busan SAM model.
Supplementary Table 4List of the seafood industry subsectors and the corresponding data source for disaggregation.
References
1
Ahmed M. (2006). Market access and trade liberalisation in fisheries (Geneva: ICTSD).
2
Arita S. Pan M. Hospital J. Leung P. S. (2011). Contribution, Linkages and Impacts of the Fisheries Sector to Hawaii's Economy: A Social Accounting Matrix AnalysisSOEST Publication 11-01, JIMAR Contribution 11-373., 54.
3
Bank of Korea (2020). Regional Input-Output Statistics, (2015). Available online at: https://ecos.bok.or.kr//SearchStat (Accessed September 11, 2024).
4
Beyers W. B. (1976). Empirical identification of key sectors: some further evidence. Environ. Plann. A8, 231–236. doi: 10.1068/a080231
5
Busan Metropolitan City Fisheries Industry Statistics (2023). The number of firm, labor, and output on the fishery and its forward and backward industries, (2010, 2015, 2020). Available online at: https://kosis.kr/statHtml/statHtml.do?orgId=202&tblId=DT_20213_01&conn_path=I3 (Accessed February 2, 2025).
6
Busan Metropolitan City Statistics (2022a). Regional tax statistics, (2015). Available online at: https://kosis.kr/statHtml/statHtml.do?orgId=202&tblId=DT_202N_BSY1414&conn_path=I3 (Accessed July 16, 2024).
7
Busan Metropolitan City Statistics (2022b). General account expenditures, (2015). Available online at: https://kosis.kr/statHtml/statHtml.do?orgId=202&tblId=DT_202N_BSY140804&conn_path=I3 (Accessed July 16, 2024).
8
Cella G. (1984). The Input-output measurements of interindustry linkages. Oxford Bull. Econ Stat46, 73–84. doi: 10.1111/j.1468-0084.1984.mp46001005.x
9
Chenery H. B. Watanabe T. (1958). International comparisons of the structure of production. Econometrica: J. Econometric Soc.26(4), 26, 487–521. doi: 10.2307/1907514
10
Clements B. J. (1990). On the decomposition and normalization of interindustry linkages. Econ Lett.33, 337–340. doi: 10.1016/0165-1765(90)90084-E
11
Clouse C. Jenny T. Jolley G. J. (2023). Impact factors: Methodological standards for applied input-output analysis. J. Regional Anal. Policy53, 1–14. doi: 10.22004/ag.econ.339975
12
Dietzenbacher E. Linden J. A.V. (1997). Sectoral and spatial linkages in the EC production structure. J. Regional Sci.37, 235–257. doi: 10.1111/0022-4146.00053
13
Elvin D. (2008). An analysis of methods for identifying local import substitution opportunities to foster sustainable regional economies (Amherst, MA: University of Massachusetts Amherst).
14
Garza-Gil M. D. Surís-Regueiro J. C. Varela-Lafuente M. M. (2017). Using input–output methods to assess the effects of fishing and aquaculture on a regional economy: The case of Galicia, Spain. Mar. Policy85, 48–53. doi: 10.1016/j.marpol.2017.08.003
15
Ghosh A. (1958). Input-output approach in an allocation system. Economica25, 58–64. doi: 10.2307/2550694
16
Hirschman A. O. (1958). The Strategy of Economic Development (New Haven, CT: Yale University Press).
17
Holland D. Wyeth P. (1993). SAM multipliers: their decomposition, interpretation and relationship to input-output multipliers (Washington, DC: Research bulletin (USA) no. XB1027).
18
Hong J. B. Kim D. H. (2021). A study on stock assessment of chub mackerel (Scomber japonicus) in South Korea using CMSY and BSS models. J. Fish Mar. Stud. Educ.33, 1272–1283. doi: 10.13000/JFMSE.2021.10.33.5.1272
19
Hoover E. M. Giarratani F. (1999). An introduction to regional economics. West Virginia University: Wholbk from Regional Research Institute.
20
Johansen U. Bull-Berg H. Vik L. H. Stokka A. M. Richardsen R. Winther U. (2019). The Norwegian seafood industry–importance for the national economy. Mar. Policy110, 103561. doi: 10.1016/j.marpol.2019.103561
21
Jones L. P. (1976). The measurement of Hirschmanian linkages. Q. J. Econ90, 323–333. doi: 10.2307/1884635
22
Kay D. L. Pratt J. E. Warner M. E. (2007). Measuring the role of local services with hypothetical extraction. Growth Change38, 1–22. doi: 10.1111/j.1468-2257.2007.00377.x
23
Kim D. H. Seung C. K. (2020). Economic contributions of wild fisheries and aquaculture: A social accounting matrix (SAM) analysis for Gyeong-Nam Province, Korea. Ocean Coast. Manage.188, 105072. doi: 10.1016/j.ocecoaman.2019.105072
24
Kim H. R. Yang J. S. (2008). The economic effect and implications of a FTA on Busan fisheries industry. J. Int. Trade Ind. Stud.13, 73–103.
25
Kim J-W. Joo S-H. Lee S-Y. Kim D. K. Yoon S-H. Lee J-H. et al . (2012). 2010 Input-Output Tables of Busan. Busan, Republic of Korea: Busan Development Institute.
26
Lee K. N. Cheong J. H. (2013). Plan for countermeasure and prospect of demand and supply about seamen in Korea. J. Fish Business Administration44, 47–60. doi: 10.12939/FBA.2013.44.3.047
27
Lee M. K. Yoo S. H. (2014). The role of the capture fisheries and aquaculture sectors in the Korean national economy: An input–output analysis. Mar. Policy44, 448–456. doi: 10.1016/j.marpol.2013.10.014
28
Meller P. Marfan M. (1981). Small and large industry: employment generation, linkages, and key sectors. Economic Dev. Cultural Change29, 263–274. doi: 10.1086/451246
29
Miller R. E. Blair P. D. (2009). Input-output analysis: foundations and extensions (Cambridge, UK: Cambridge university press).
30
Miller R. E. Lahr M. L. (2001). A taxonomy of extractions. Contributions to Economic Anal.249, 407–441.
31
Ministry of Ocean and Fisheries (2024). Annual statistics on fishery production trend, (1970–2023). Available online at: https://kosis.kr/statHtml/statHtml.do?orgId=101&tblId=DT_1EW0001&conn_path=I3 (Accessed November 21, 2024).
32
Ministry of Public Administration and Security . Local Finance Integrated Open System. Available online at: https://www.lofin365.go.kr (Accessed July 16, 2024).
33
Ministry of the Interior (2016). Annual Local Tax Statistics Report for 2015. Sejong, Republic of Korea
34
Morrissey K. O’Donoghue C. (2013). The role of the marine sector in the Irish national economy: An input–output analysis. Mar. Policy37, 230–238. doi: 10.1016/j.marpol.2012.05.004
35
National Federation of Fisheries Cooperatives (2024). Annual statistics on cooperative sales of fishery products, (2023). Available online at: https://www.fips.go.kr/p/S020601/ (Accessed November 21, 2024).
36
National Tax Service of Korea (2016). National Tax Service Annual Report for 2015. Sejong, Republic of Korea.
37
Oosterhaven J. (1988). On the plausibility of the supply-driven input-output model. J. Regional Sci.28, 203–217. doi: 10.1111/j.1467-9787.1988.tb01208.x
38
Oosterhaven J. (1989). The supply-driven input-output model: A new interpretation but still implausible. J. Regional Sci.29, 459–465. doi: 10.1111/j.1467-9787.1989.tb01391.x
39
Paelinck J. De Caevel J. Degueldre J. (1965). Analyse quantitative de certaines phénomenes du développment régional polarisé: Essai de simulation statique d’itérarires de propogation. Bibliothèque l’Institut Sci. économique7, 341–387.
40
Rasmussen P. N. (1956). Studies in intersectorial relations. J. Dev. Stud.14.
41
Sakurai K. Shibusawa H. (2021). The economic impact of the inland water fisheries/aquaculture industry: The case of the eel industry in Japan. Regional Sci. Policy Pract.13, 1729–1749. doi: 10.1111/rsp3.12323
42
Schultz S. (1977). Approaches to identifying key sectors empirically by means of input-output analysis. J. Dev. Stud.14, 77–96. doi: 10.1080/00220387708421663
43
Seung C. K. Kim D. H. (2020). Examining supply chain for seafood industries using structural path analysis. Sustainability12, 2061. doi: 10.3390/su12052061
44
Seung C. K. Kim D. H. Choi J. H. (2024). Effects of stock rebuilding–A computable general equilibrium analysis for a mackerel fishery in Korea. NPJ Ocean Sustainability3, 55. doi: 10.1038/s44183-024-00092-4
45
Shuman M. (2007). The small-mart revolution: How local businesses are beating the global competition (San Francisco, CA: Berrett-Koehler Publishers).
46
Sigfusson T. Arnason R. Morrissey K. (2013). The economic importance of the Icelandic fisheries cluster—Understanding the role of fisheries in a small economy. Mar. Policy39, 154–161. doi: 10.1016/j.marpol.2012.10.015
47
Stimson R. J. Stough R. R. Roberts B. H. (2006). Regional economic development: analysis and planning strategy (Berlin, Germany: Springer Science & Business Media). doi: 10.1007/3-540-34829-8_1
48
Strassert G. (1968). Zur bestimmung strategischer sektoren mit hilfe von input-output-modellen. Jahrbücher für Nationalökonomie und Statistik182, 211–215. doi: 10.1515/jbnst-1968-0114
49
Temurshoev U. (2009). Hypothetical extraction and fields of influence approaches: integration and policy implications (Kyiv, Ukraine: Working Paper09/06, EERC Research Network).
50
Temurshoev U. (2010). Identifying optimal sector groupings with the hypothetical extraction method. J. Regional Sci.50, 872–890. doi: 10.1111/j.1467-9787.2010.00678.x
51
Wang Y. Wang N. (2019). The role of the marine industry in China's national economy: An input–output analysis. Mar. Policy99, 42–49. doi: 10.1016/j.marpol.2018.10.019
52
Wang Y. Wang N. (2021). Exploring the role of the fisheries sector in China’s national economy: An input–output analysis. Fish Res.243, 106055. doi: 10.1016/j.fishres.2021.106055
Summary
Keywords
economic contribution, hypothetical extraction method, input-output model, seafood industries, social accounting matrix model
Citation
Cho W-H, Seung CK, Choi J-H and Kim D-H (2026) Evaluating economic contribution of seafood industries in Busan using hypothetical extraction method. Front. Mar. Sci. 13:1732248. doi: 10.3389/fmars.2026.1732248
Received
25 October 2025
Revised
08 January 2026
Accepted
15 January 2026
Published
04 February 2026
Volume
13 - 2026
Edited by
Mohammad Mahfujul Haque, Bangladesh Agricultural University, Bangladesh
Reviewed by
Sri Andaiyani, Sriwijaya University, Indonesia
Fabian Rocha Aponte, SINTEF Industry, Norway
Updates
Copyright
© 2026 Cho, Seung, Choi and Kim.
This is an open-access article distributed under the terms of the Creative Commons Attribution License (CC BY). The use, distribution or reproduction in other forums is permitted, provided the original author(s) and the copyright owner(s) are credited and that the original publication in this journal is cited, in accordance with accepted academic practice. No use, distribution or reproduction is permitted which does not comply with these terms.
*Correspondence: Do-Hoon Kim, delaware310@pknu.ac.kr
Disclaimer
All claims expressed in this article are solely those of the authors and do not necessarily represent those of their affiliated organizations, or those of the publisher, the editors and the reviewers. Any product that may be evaluated in this article or claim that may be made by its manufacturer is not guaranteed or endorsed by the publisher.