Abstract
Introduction:
Offshore wind farms (OWFs) are vital for sustainable energy. The underwater foundations of those wind turbines provide a complex structure that creates new habitats and attracts fishes. However, whether OWFs had the same ecological function as purpose-built artificial reef (AR) and how they alter the original fish community remain unclear.
Methods:
To evaluate the spatial and temporal variations in fish assemblages, we conducted a multi-part investigation at the Formosa Wind Farm, located off the coast of Miaoli County, Taiwan. Temporal changes were assessed through SCUBA surveys at turbine foundations in 2017, 2018, and 2025, with the 2025 data allowing for a direct comparison with the nearby existing artificial reefs. To assess spatial effects, pole-and-line surveys were conducted from Apr to Oct in 2024 and 2025 at varying distances from the turbines.
Results:
Our investigation documented 86 species of reef-associated fishes exclusively within 50 m of turbine foundations; none were caught in the surrounding sandy areas or documented in pervious fishery records. The results demonstrated that fish assemblages around the turbine piles changed successively over the years. Although the species composition in 2025 differed between the OWF and the established AR sites, key ecological metrics such as species richness, diversity, and trophic structures showed no significant differences.
Discussion:
These findings demonstrated that the underwater structure of offshore wind turbines can function as AR, creating novel reef habitats and supporting reef-associated fish community within a finite spatial extent. Overall, OWFs may provide ecological benefits in addition to renewable energy, highlighting their potential role in balancing energy development with marine conservation.
Highlights
-
Offshore wind turbine foundations act as artificial reefs, creating new habitats
-
The fish assemblages around the turbine piles changed over the years
-
Fish assemblages near turbines show similar diversity and trophic structure as long-established artificial reefs.
-
Wind turbine installations alter species composition only within a short distance.
-
OWFs may have positive effects on local fishery resources and biodiversity.
Introduction
Human-made underwater structures, such as those found in offshore wind and petroleum platforms, can create new hard-bottom habitats on sandy and muddy areas that support fish feeding, shelter, and habitation, thereby boosting coastal fishery resources. They function in a manner similar to artificial reefs (ARs). Since Japan began using artificial reefs to enhance coastal fisheries at the end of the 18th century, tens of thousands have been deployed in coastal areas globally (Stone et al., 1991). However, the deployment of ARs may also bring challenges. For instance, ARs may concentrate fish populations, changing traditional fishing patterns. This may result in overfishing of certain species, as fishermen focus on these areas, potentially disrupting the local fishery resources (Polovina, 1989). The installation of those underwater structures may also alter the natural topography and disrupt the existing biome. Newcomers or reef-associated species that immigrate to the new habitat may also outcompete the original soft bottom species (Ajemian et al., 2015; Shipley et al., 2018), possibly causing a decline in local resources. These two main dilemmas have been longstanding controversies in studies evaluating the efficacy of artificial reefs (Bergström et al., 2014; Coates et al., 2016; Degraer et al., 2020; Lindberg, 1997).
Wind power is a clean and renewable energy source that reduces reliance on fossil fuels. To exploit superior wind resources and minimize competition for land use, offshore wind farm development has expanded rapidly in areas with suitable wind conditions (Dolores Esteban et al., 2011; review inLi et al., 2020). Since the first offshore wind farm (OWF) began operating in Vindeby, Denmark, in 1991, global installed offshore wind capacity has grown to several tens of gigawatts, with substantial expansion over the past decade in Asia and along the North American Atlantic coast (Methratta et al., 2020; Bilgili and Alphan, 2022) (Supplementary Data S1).
Although those OWFs can provide energy with lower carbon emissions, the possible negative effects on the marine life and fishery resources also cause concerns. The base structures that anchor the offshore wind turbines to the seafloor, along with the riprap or rock bags that prevent scouring and erosion, create new habitats and shelters for marine animals seeking food or breeding grounds. Observations of OWFs installed in North America (review in Ashley et al., 2014) and European waters (Vrooman et al., 2019; Wilhelmsson, 2010) show effects similar to those observed on ARs. For example, studies at North America’s first offshore wind farm, the Block Island Wind Farm (BIWF), reported increased catch per unit effort (CPUE) for structure-oriented species such as Black Sea Bass (Centropristis striata) and Atlantic Cod (Gadus morhua) near the turbines during operation (Wilber et al., 2022), consistent with observations from European OWFs (Reubens et al., 2014; Werner et al., 2024). In addition, acoustic surveys at the BIWF detected elevated fish abundance within 130–160 m of the turbine structures (Jech et al., 2023) However, the resident species that colonize the base structures mainly originate from reef areas and may be distinct from the species found in original sandy areas. The introduction of these reef-associated species raises concerns about the alteration of the local fish community structure.
However, the development of fish assemblages on artificial structures is widely recognized as a dynamic successional process influenced by multiple environmental and structural factors (Plumlee et al., 2020). Among these, reef age is a particularly important determinant, as species diversity and community composition tend to evolve and gradually stabilize over time (Folpp et al., 2011). While colonization can be rapid in the initial years, empirical evidence suggests that community stabilization is often a prolonged process; for instance, fish assemblages on large artificial structures in the Gulf of Mexico required approximately five years to reach a stable equilibrium (Hicks et al., 2025). Similarly, long-term studies in Portugal demonstrate that while functional groups may remain stable, metrics such as biomass, species richness, and eco-exergy can continue to shift or increase significantly even 14 years post-deployment (Santos and Monteiro, 2007). In parallel, the physical architecture of the substrate, including its material, surface complexity (rugosity), and vertical relief, plays a decisive role in shaping the structure of associated fish communities by influencing habitat suitability and species recruitment (Perkol-Finkel et al., 2006; Vivier et al., 2021; Walker et al., 2002). High vertical relief and large structural footprints, such as the shipwreck off South Padre Island, US, have been linked to increased species richness by providing diverse microhabitats and trophic niches (Becker et al., 2017). Therefore, long-term monitoring of fish communities at OWFs since their installation, and comparing these assemblages with those at pre-existing ARs, provides valuable insight into the successional trajectories of these novel habitats. Such a comparative approach is crucial for elucidating how structural design and habitat age jointly affect community development, biodiversity, and the functional equivalence between OWFs and traditional reef systems.
For Taiwan and countries nearby, offshore wind farms are viewed as an important solution to long-term energy demands. However, empirical studies assessing the ecological and fisheries impacts of offshore wind turbines in this region remain limited, leading to frequent concerns and skepticism from local fishing sectors regarding the development of offshore wind energy (review in Tsai et al., 2022; Shibuya, 2024). Formosa Wind Farm, developed by Synera Renewable Energy Group Co., is one of the major offshore wind projects established along the eastern margin of the Taiwan Strait. This OWF comprise 69 turbines spanning an area of approximately 90 km². Because this region overlaps with historically productive fishing grounds, concerns have arisen regarding whether the installation of wind turbines may significantly alter local fish communities or negatively affect the original sandy and muddy demersal fishery resources.
Numerous studies have shown that artificial structures, including turbine piles and ARs, often generate strong but localized effects on fish communities, with reef-associated species aggregating within tens to a few hundred meters, while soft-bottom assemblages remain largely unchanged at greater distances (Alevizon and Gorham, 1989; Methratta and Dardick, 2019; Jech et al., 2023). To investigate spatial and temporal variations in fish assemblages within this OWF and to assess whether turbine foundations function similarly to purpose-built ARs, we conducted SCUBA surveys at turbine bases in 2017, 2018, and 2025, as well as pole-and-line surveys in 2024–2025 across distances from the foundations.
Material and methods
Study areas
The Formosa Wind Farm (24.71°N, 120.77°E), located off the coast of Miaoli County Taiwan 2-9.5 km away from the shoreline. The development consists of two phases: Formosa 1 (F1), constructed between 2017 and 2019, and Formosa 2 (F2), which began in 2019 and became fully operational in 2023. Within this offshore wind farm, the distance between neighboring turbines ranges from approximately 800 to 1,600 m. The turbine foundations built during the earlier phase (F1) are monopiles with scour protection, whereas those installed in the later phase (F2) are jacket-type structures without dedicated scour-protection layer. The water depth across this OWF ranges from 15 to 55 m, and the seabed consists primarily of sandy and muddy substrates. No natural reef habitat was found in this area. At F1, scour protection is composed mainly of rock bags and boulders distributed within approximately 20 m surrounding the turbine foundation, with rock density decreasing toward the outer boundary. Beyond this 20 m zone, the seabed transitions back to its natural substrate.
This area is a commercial fishing ground that can be accessed by two fishery harbors, Long Fong Fishing Port (9 km in the east) and Waipu Fishing Port (7 km in the south) (Figure 1). The ocean currents in the Taiwan Strait exhibit a dynamic seasonal shift driven by monsoons system, which in turn shape the seasonal composition of fish catches. During summer (May–September), the warm Kuroshio Branch Current and the South China Sea Current flow northward, transporting tropical pelagic species such as Scombridae and Carangidae. In contrast, the winter northeasterly monsoon (October–March) drives the cold, nutrient-rich China Coastal Current southward, bringing Mugilidae into the region (reviewed in Liang et al., 2003; data from the Fisheries Agency, Council of Agriculture, Taiwan). Prior to the establishment of the offshore wind farm, the Fisheries Agency, Ministry of Agriculture (MOA), deployed several artificial reefs in the region to help sustain local fishery resources. Among these, the Wai-Pu (WP: 24.66°N, 120.74°E) and Chi-Ding (CD: 24.73°N, 120.82°E) artificial reef sites are situated adjacent to the wind farm boundary. However, following development regulations, the nearest turbines are positioned more than 1.2 km away from these reefs. The Wai-Pu site, located south of the OWF, consists of a random aggregation utility-pole reefs (UPRs) and four independent steel reefs (SRs) deployed between 2000 and 2003 at a depth of approximately 28 m. The Chi-Ding site, to the north, comprises eight steel reefs installed between 2004 and 2005 at a depth of about 21 m. After the Formosa Wind Farm was constructed, the authorities did not impose any specific fishing restrictions within the OWF. However, under Taiwan’s fisheries regulations, bottom trawling is prohibited within 3 nautical miles of the coast and in areas where artificial reefs have been deployed.
Figure 1
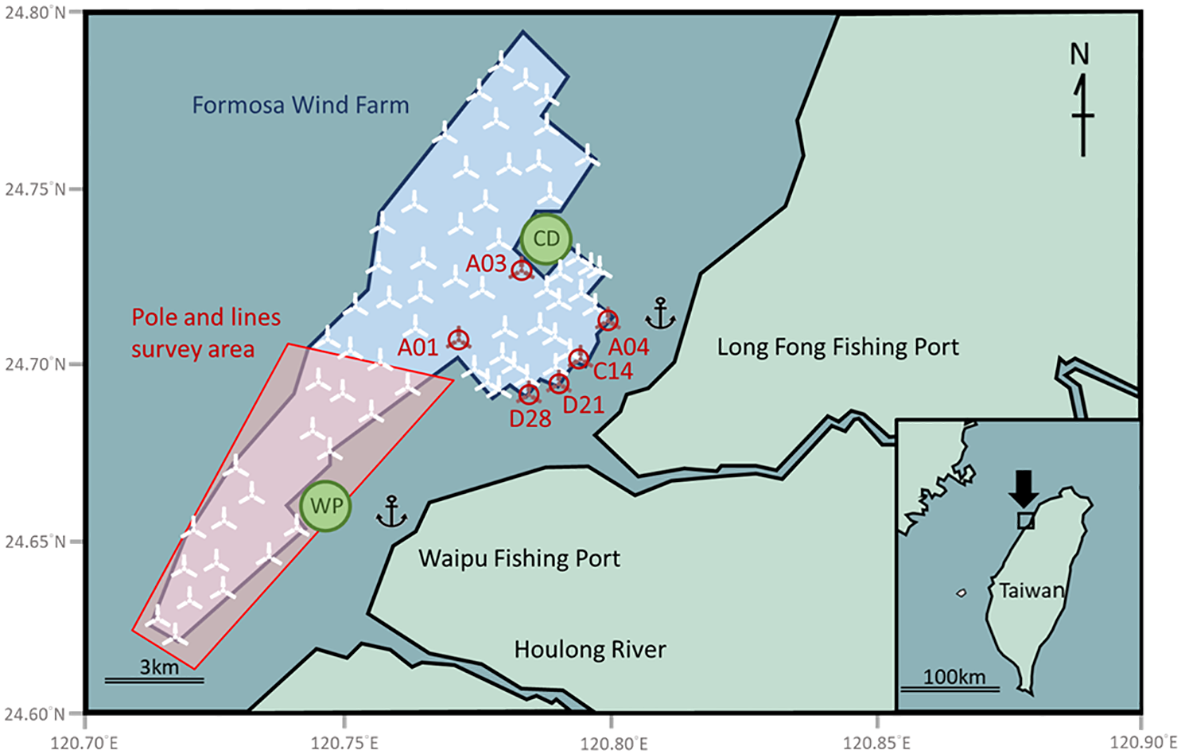
Schematic diagram the study area, which shows the locations of Formosa Wind Farm (blue shadow) and two adjacent artificial reef sites (Wai-Pu: WP and Chi-Ding: CD). Red shadow area indicates the range of pole and line survey. White fan icons indicate the sites of wind turbines. The SCUBA surveys were conducted at wind turbine sites marked by red on the map (see Material and Methods for details). The size of icons and markers on the map does not represent the actual scale.
Field methods and data collection
SCUBA surveys
To determine the species compositions and abundances of fish around the turbine piles and ARs, we conducted SCUBA visual censuses (Samoilys and Carlos, 2000). The fish species and their abundance around the underwater foundations of two earliest-installed wind turbines (D21 and D28, F1: monopiles with ripraps) were recorded in June and August 2017, and again in June 2018. In 2025, the survey scope was expanded to include additional wind turbines built during F1 phase (A04, C14, D21, and D28, monopiles with ripraps) and F2 phase (A01, A03, jacket-type structures without ripraps). The depths of those wind turbines ranged from 23 to 28 m with sampling conducted between May and August. During the same period, comparable SCUBA surveys were also performed at the WP (covering three 10m x 10m quadrats of the UPRs areas and 3 randomly selected SRs) and CD (covering 3 randomly selected SRs) AR sites. Among the surveyed wind turbines, the base structures of C14, A04, D21, and D28 are protected by ripraps, while those of A01 and A03 are not.
At each site, four divers surveyed the water column within 5 m of the structures. Following Walker et al. (2002); Lu et al. (2021), surveys were conducted from the seafloor to the surface along wind-turbine piles, or from the seabed to a height of 5 m above the ARs. Each survey lasting approximately 45–50 minutes. For safety reasons, surveys were only undertaken during slack water when the swell height was less than 2.5 m, and all operations adhered to strict safety regulations. During each underwater survey, team members were assigned distinct responsibilities: one diver was responsible for documenting fish, another for recording benthic invertebrates, and two divers for conducting photography and providing safety supervision.
Fishing surveys
To assess the spatial distribution of fish, we conducted 37 pole and line fishing surveys at multiple sites within the central area of the OWF between April and October in 2024 and 2025 (Figure 1). The surveys were stratified by distance from the turbine foundations, i.e. 23 surveys were conducted 25–50 m from the bases, while the other 14 surveys were located over 250 m away. The depths of the survey sites ranged from 25 to 50 m.
Each survey consisted of a standardized effort of 6 line-hours (Williams et al., 1997) with three replications, using at least two fishing lines simultaneously, each with two fishhooks (sizes No. 12 and No. 20). Based on earlier bottom gillnet surveys indicating a prevalence of carnivorous fish in this area (Prista et al., 2003), chopped squid or shrimp meat was used as bait. Due to safety constraints preventing large fishing boats from approaching the turbine bases, additional surveys were conducted within 10 m of the foundations. These were carried out on July 6, 7, and 21 by volunteer local anglers using smaller, more maneuverable rafts, following identical pole and line procedures. All results from the pole and line fishing surveys were used for qualitative analyses. Table 1 shows the months covered by these surveys, while the catches and detailed survey conditions are provided in Supplementary Data S2.
Table 1
| Year | 2024 | 2025 | ||||||||||||||||||
|---|---|---|---|---|---|---|---|---|---|---|---|---|---|---|---|---|---|---|---|---|
| Month | …… | Apr | May | Jun | Jul | Aug | Sep | Oct | Nov | Dec | Jan | Feb | Mar | Apr | May | Jun | Jul | Aug | Sep | Oct |
| Pole and lines<10m | ||||||||||||||||||||
| Pole and lines<50m | ||||||||||||||||||||
| Pole and lines >250m | ||||||||||||||||||||
The months covered by the fishing surveys involved in these analyses.
Gray block indicates the month when surveys were conducted.
According to the administering authority, the Miaoli County Marine and Fisheries Management Office, this site is not a protected area, and therefore no permission was required for the catch. No additional experimental treatments were applied to the animals in this study.
Data analysis
The fish assemblages, including species composition and abundance, recorded at the wind turbines and AR sites through SCUBA surveys were used for quantitative analyses, whereas the species caught by pole and line fishing at varying distances from the turbine were analyzed only qualitatively.
To understand trophic structure and habitat use, fish species were categorized by habitat, i.e. reef-associated, soft-bottom, surface-dwelling, and midwater-dwelling; and by feeding guild, i.e. carnivores, omnivores, and zooplankton feeders, based on information from FishBase (Froese and Pauly, 2024). The classifications are largely consistent with the habitats categories summarized in Methratta and Dardick (2019) and the feeding habit framework proposed by Şensurat-Genç et al. (2022). The trophic level of each species was obtained from FishBase, and the community-level trophic structure was calculated as an abundance-weighted mean, with species contributions weighted by the number of individuals recorded (Pauly et al., 1998). Fish assemblage diversity was quantified using Shannon’s diversity index (Islam and Yasmin, 2018), while the Sørensen–Dice coefficient was applied to assess species composition similarity between groups (de Albuquerque et al., 2022; Dice, 1945).
Where c is the number of species common to both communities and S1 or S2 is the number of species in community 1 or 2.
The numeric data were analyzed by nonparametric Kruskal-Wallis test followed by post-hoc analysis with a Dunn test (Blaker, 1987). Those tests were done using SPSS 20.0. Variation in fish assemblages for each group was investigated using a multivariate analysis in PRIMER v.6.1.5. Abundance data was standardized through Log(X + 1) transformation and then a Bray–Curtis similarity matrix was generated to calculate similarity among groups. For the comparisons of qualitative results, the similarity of the data was also analyzed by an additional Jaccard qualitative similarity index (Jackson et al., 1989). NMDS (non-metric multidimensional scaling) plots were generated to examine the ordination pattern of samples between groups. When distinctive clustering was detected, ANOSIM (analysis of similarities) was used to test for significant differences among pairs of groups (Clarke and Warwick, 2001). This test creates a global R-statistic that ranges from -1 to 1 to represent relative significance levels between groups (Clarke, 1993).
Pairwise Gower distances and Principal Coordinates Analysis (PCoA) were used to ordinate fish functional traits and obtain a Euclidean representation of functional space, following Richardson et al. (2017). Centroids for habitat and feeding categories were added, a trophic-level vector was projected, and species occurrence sites (OWF only, AR only, or both) were color-coded, with diet type indicated by point shape. Those PCoA analyses were conducted in R.
Results
Overview
Throughout the study, a total of number of 510 individuals representing 40 species, 28 genera and 17 families of fish were collected using pole and line surveys, while another 11552 individuals from 97 species (65 genera and 34 families) were recorded by SCUBA near the piles or ARs (Supplementary Data S3).
The composition of fish species varied significantly among the distances. Soft-bottom species, such as Ariidae, Sciaenidae, and Terapontidae, comprised a higher proportion of fish caught by pole and line at distances of 25–50m (41%) and >250m (72%). Conversely, these species were far less common in samples taken closer to the structures, accounting for only 20% of pole-and-line catches at<10m and a mere 14–18% of observations from SCUBA surveys near the piles and ARs.
In contrast, reef-associated fishes, including Haemulidae, were dominant near the structures. They constituted 80% of catches by pole and line at<10m and were the prevailing group in SCUBA surveys, making up 83% of species near the piles and 78% near the ARs. Other common reef-associated families observed by SCUBA divers near the structures included Kyphosidae, Labridae, Oplegnathidae, Chaetodontidae, Scaridae, Serranidae, Lutjanidae, Pomacentridae, and Apogonidae (Figure 2).
Figure 2
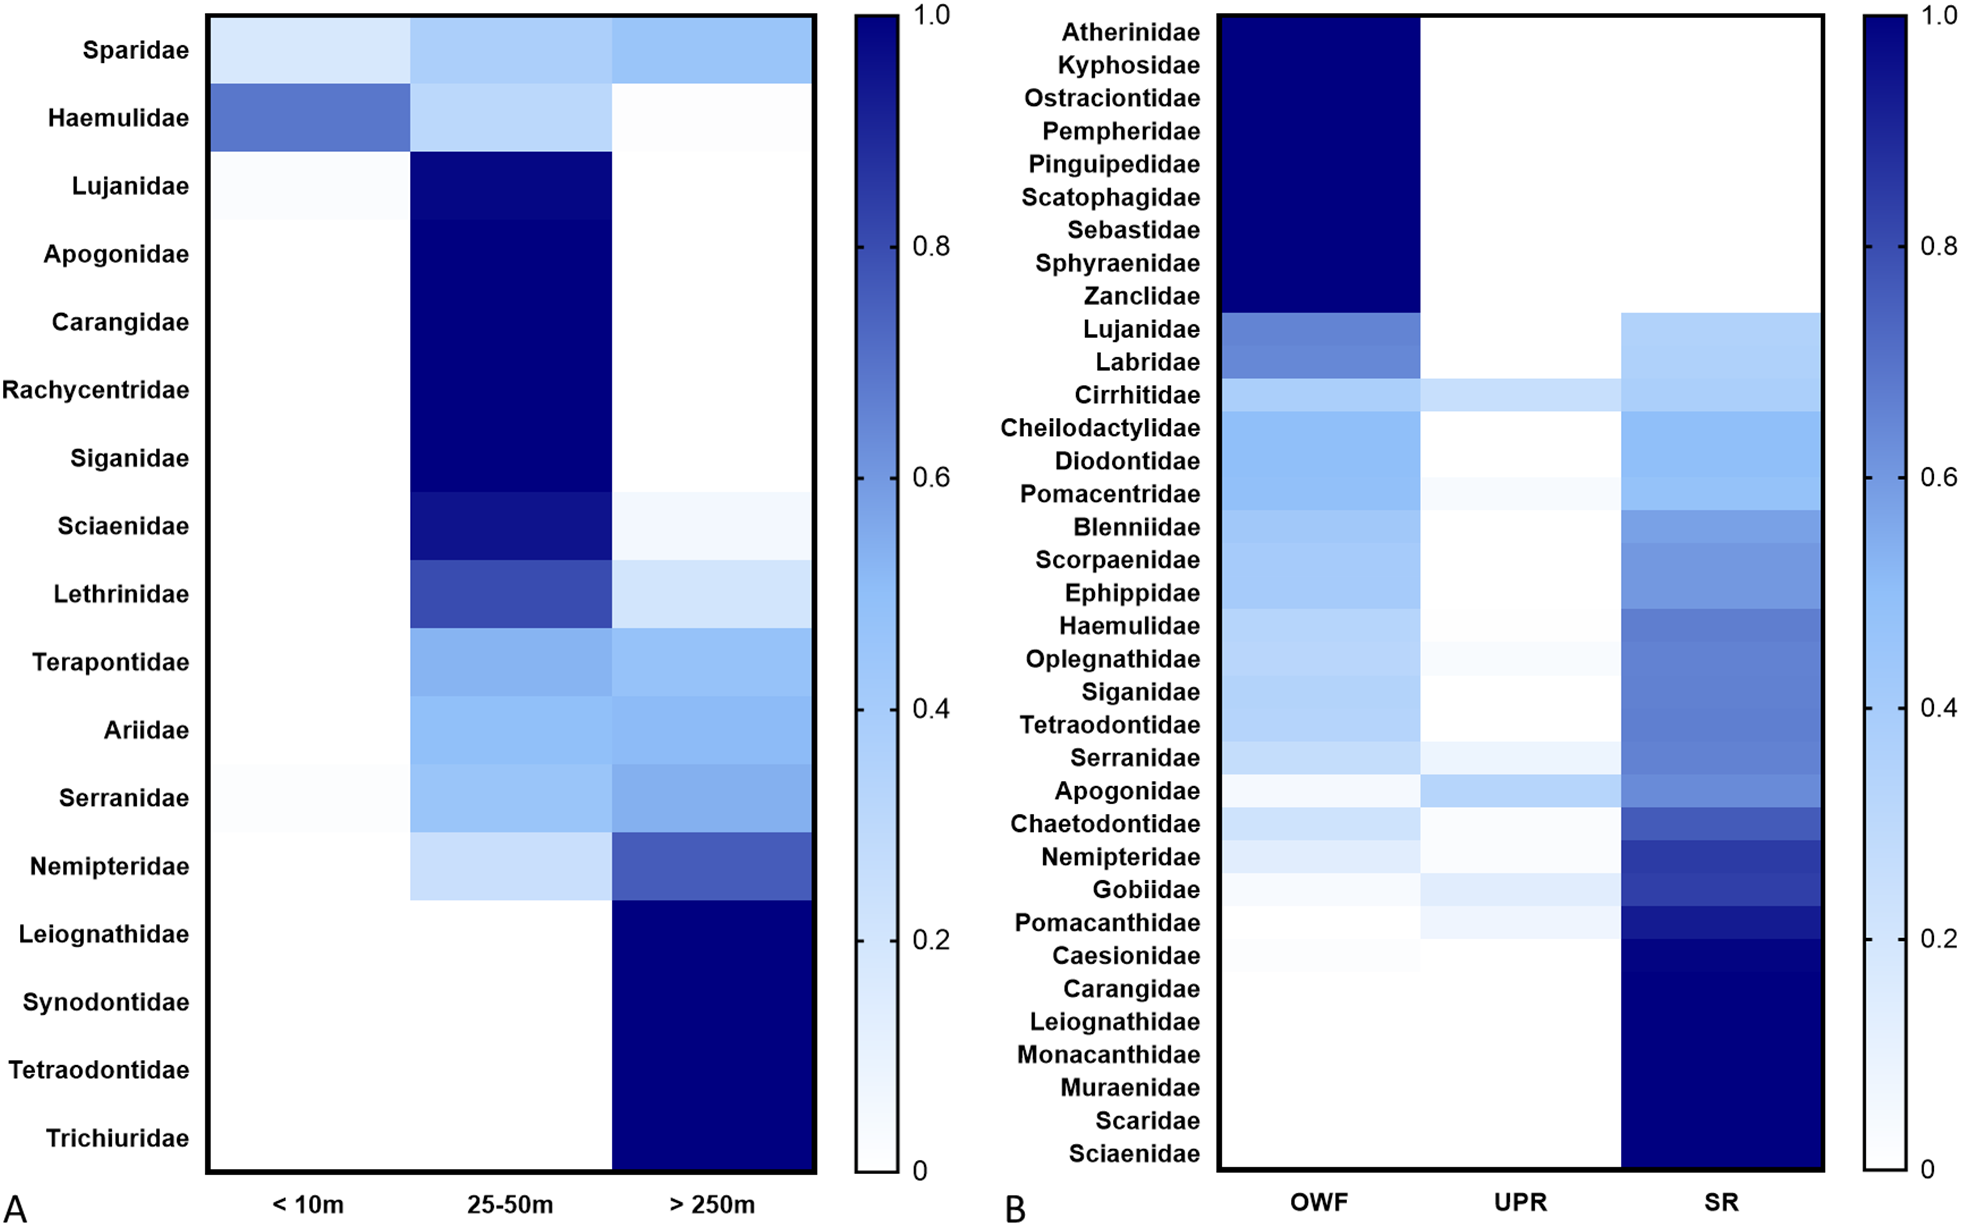
Heatmap of fish families recorded in Formosa Wind Farm and nearby artificial reefs. (A) The comparison according to the fishing surveys distances. (B) The comparison of the fish found around the wind turbine (OWF), utility-pole reefs (UPR) and steel reefs (SR). The blue scale represents the relative species number of each family. according to distance and survey methods profile.
Fish community development in OWF
Due to the small sample size, data from D21 and D28 were not analyzed independently in the descriptive statistics. At these two continuously monitored wind turbines, both fish species richness and abundance increased steadily from 2017 to 2025. The number of individuals recorded was significantly higher in 2025 than in 2017 (Kruskal-Wallis test, df = 2, p = 0.008). Similarly, species richness was significantly higher in 2018 than in 2017 (Kruskal-Wallis test, df = 2, p = 0.031). In contrast to these trends, the Shannon diversity index of the fish assemblage was lowest during the 2025 surveys (Kruskal-Wallis test, df = 2, p = 0.01 or 0.006) (Figure 3).
Figure 3
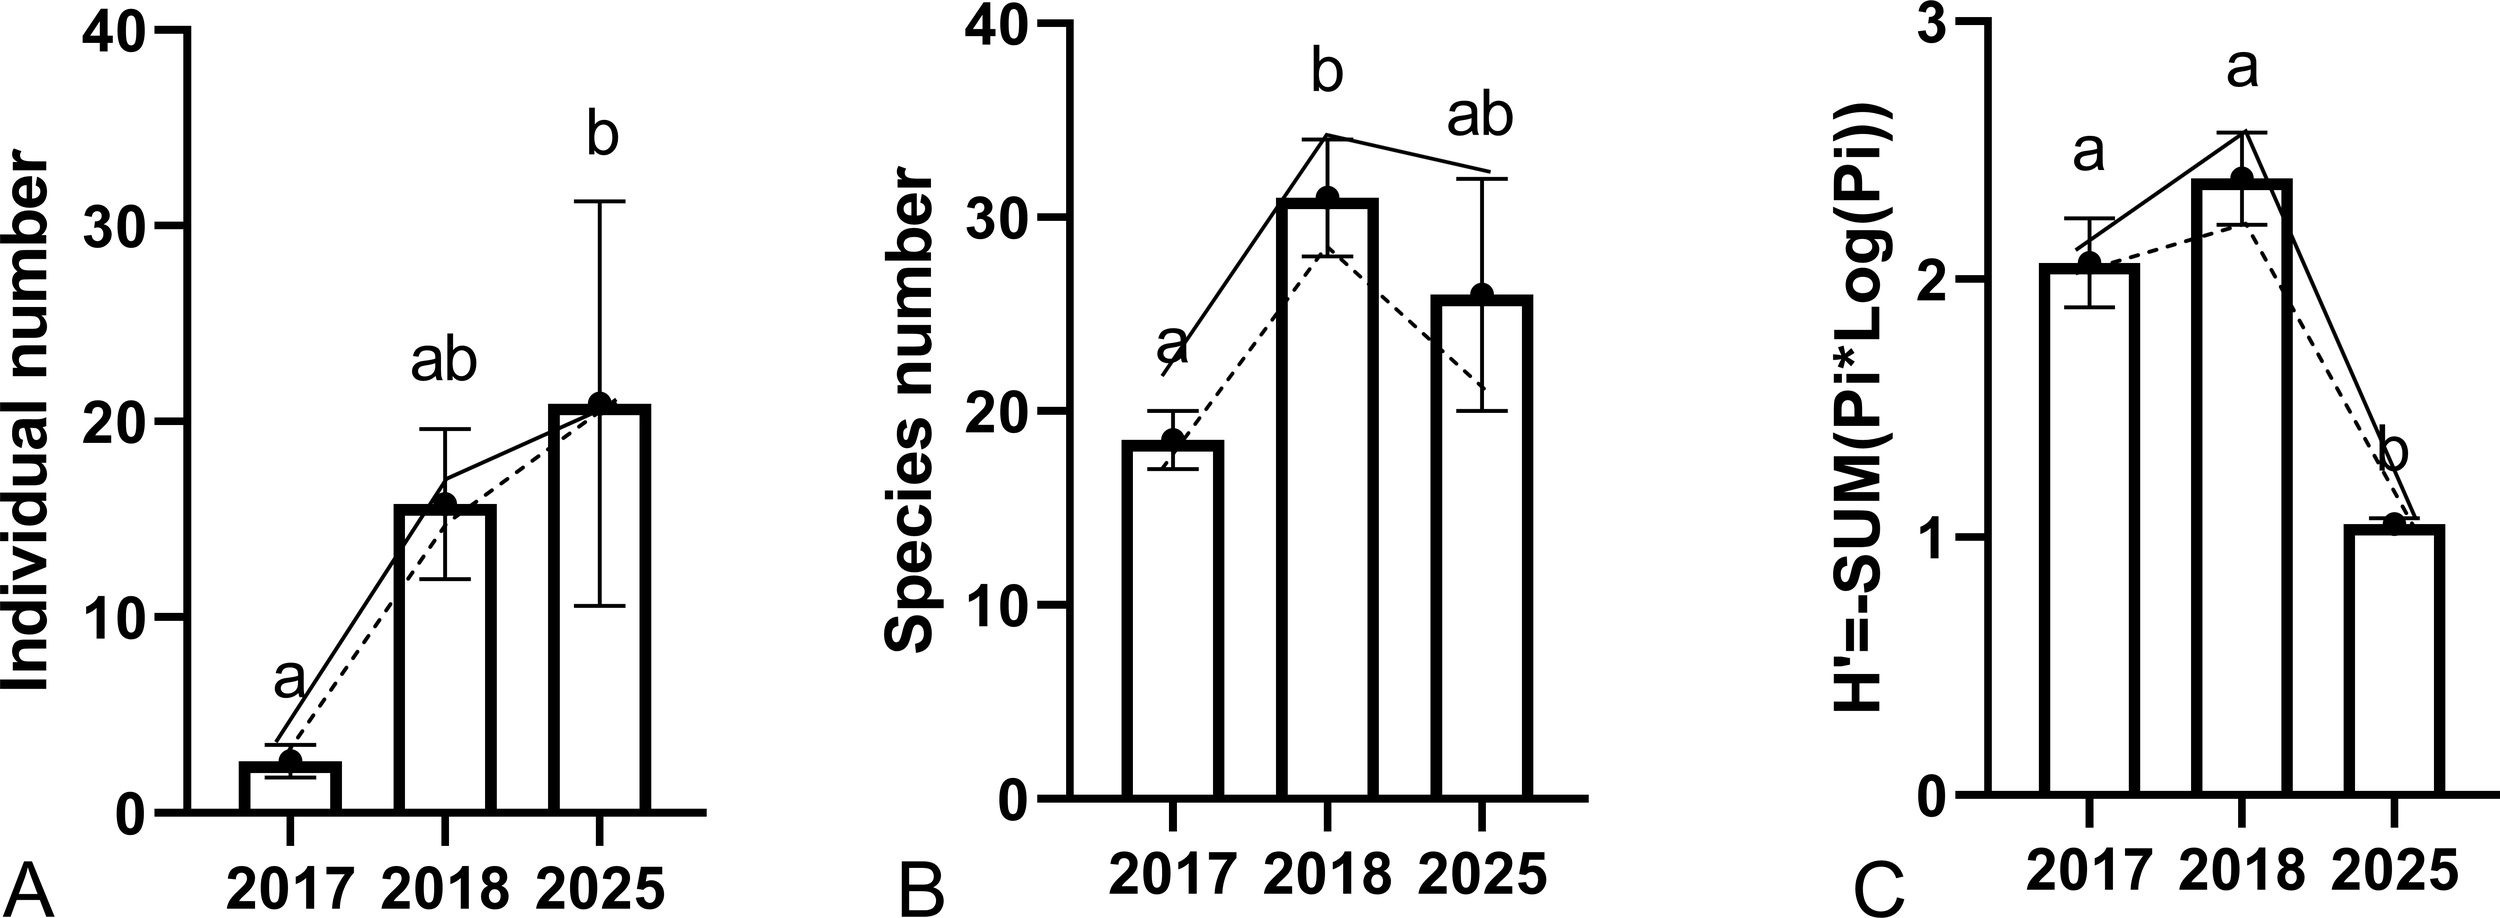
Fish recorded around wind turbines D21 and D28 across years. (A) Abundance, (B) species richness, and (C) Shannon’s diversity index. Different letters indicate significant differences among years (Kruskal–Wallis test, p< 0.05). The solid and dashed lines represent data from D21 and D28, respectively, and open bars represent means ± standard error (SE).
The species compositions in D21 and D28 were also distinct among the years. Qualitative non-metric multidimensional scaling (nMDS) analysis revealed three groups at a Bray-Curtis similarity level of 40%, and these groups were fully consistent with the year of survey, but not the sites (Figure 4). A one-way Analysis of Similarities (ANOSIM) confirmed that the species compositions at these different years were significantly distinct (R = 0.875, p = 0.001).
Figure 4
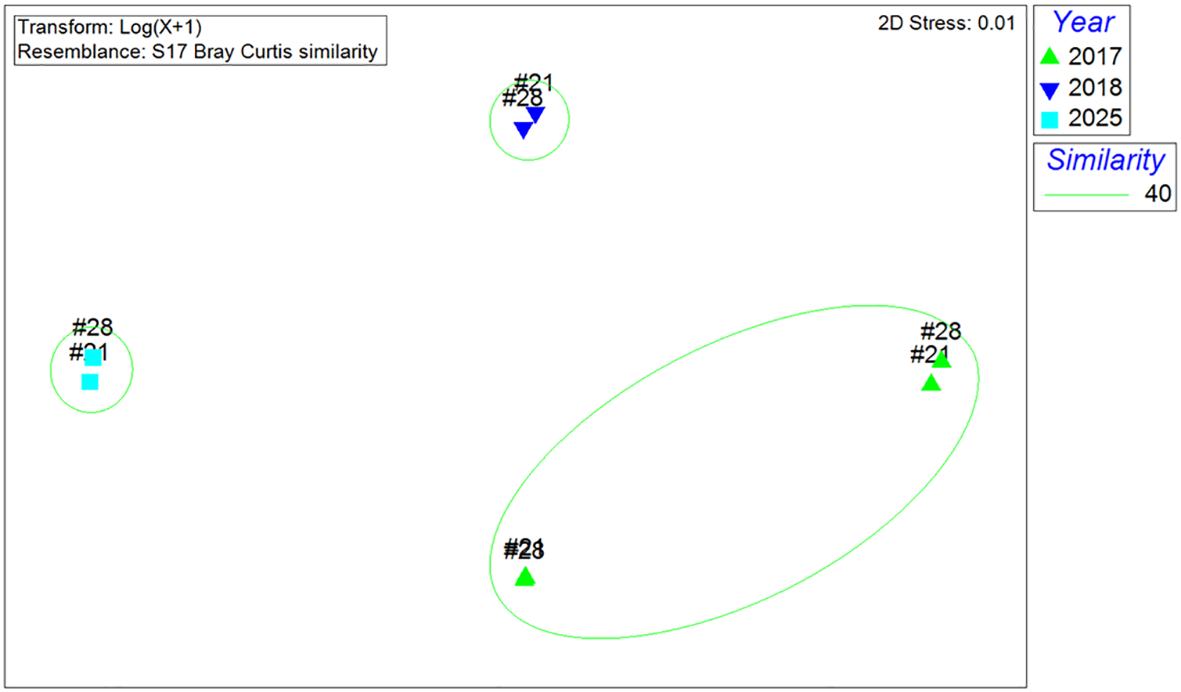
Non-metric multidimensional scaling (NMDS) analysis of species compositions of the fish around wind turbine D21 and D28 recorded in SCUBA surveys conducted in 2017, 2018 and 2025 (Bray–Curtis similarity).
Compared to 2017 and 2018, the proportion of reef-associated species showed an increasing trend by 2025. Conversely, the trophic structure of the fish assemblage appeared stable throughout the study period (Figure 5). No significant differences were found in the trophic levels among the years when analyzed at either the family or species levels (Figure 6) (Kruskal-Wallis test, df = 2; family, p = 0.679; species, p = 0.732).
Figure 5
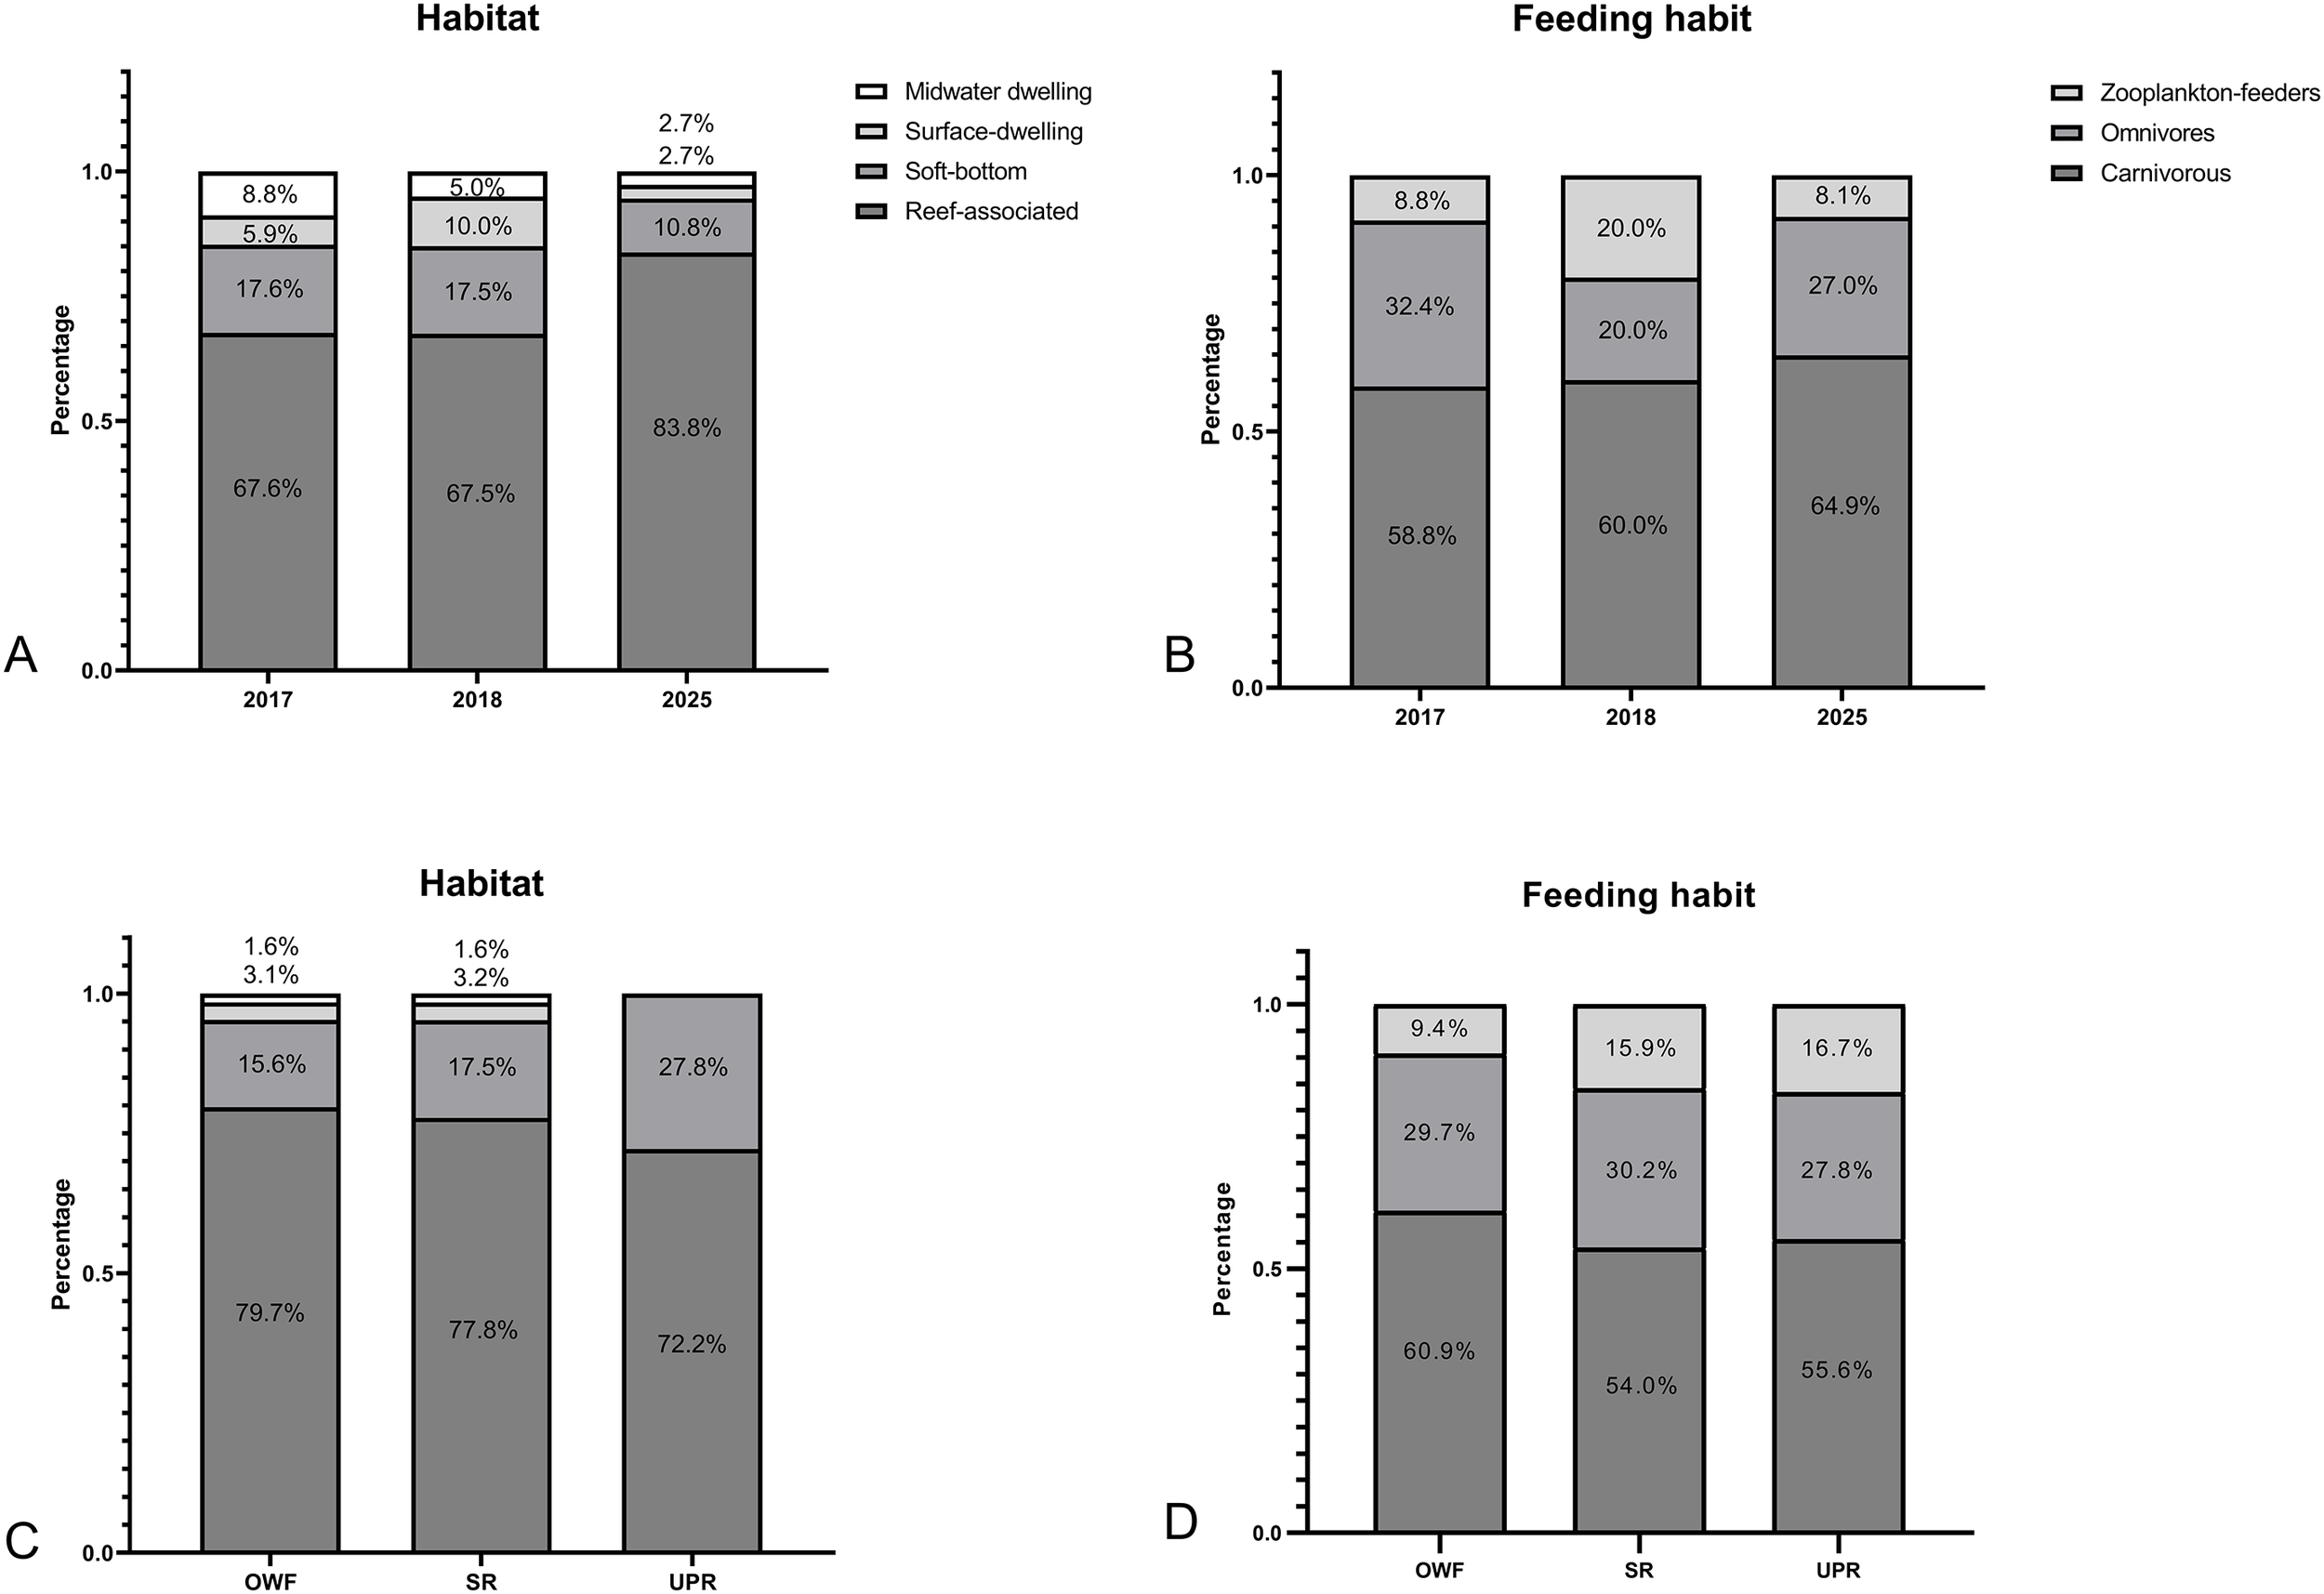
Habitats (A) and trophic composition (B) of fish assemblages observed at turbine foundations in each year. Habitats (C) and trophic composition (D) of fish assemblages observed at turbine foundations (OWF) utility-pole reefs (UPR) or steel reef (SR) in 2025.
Figure 6
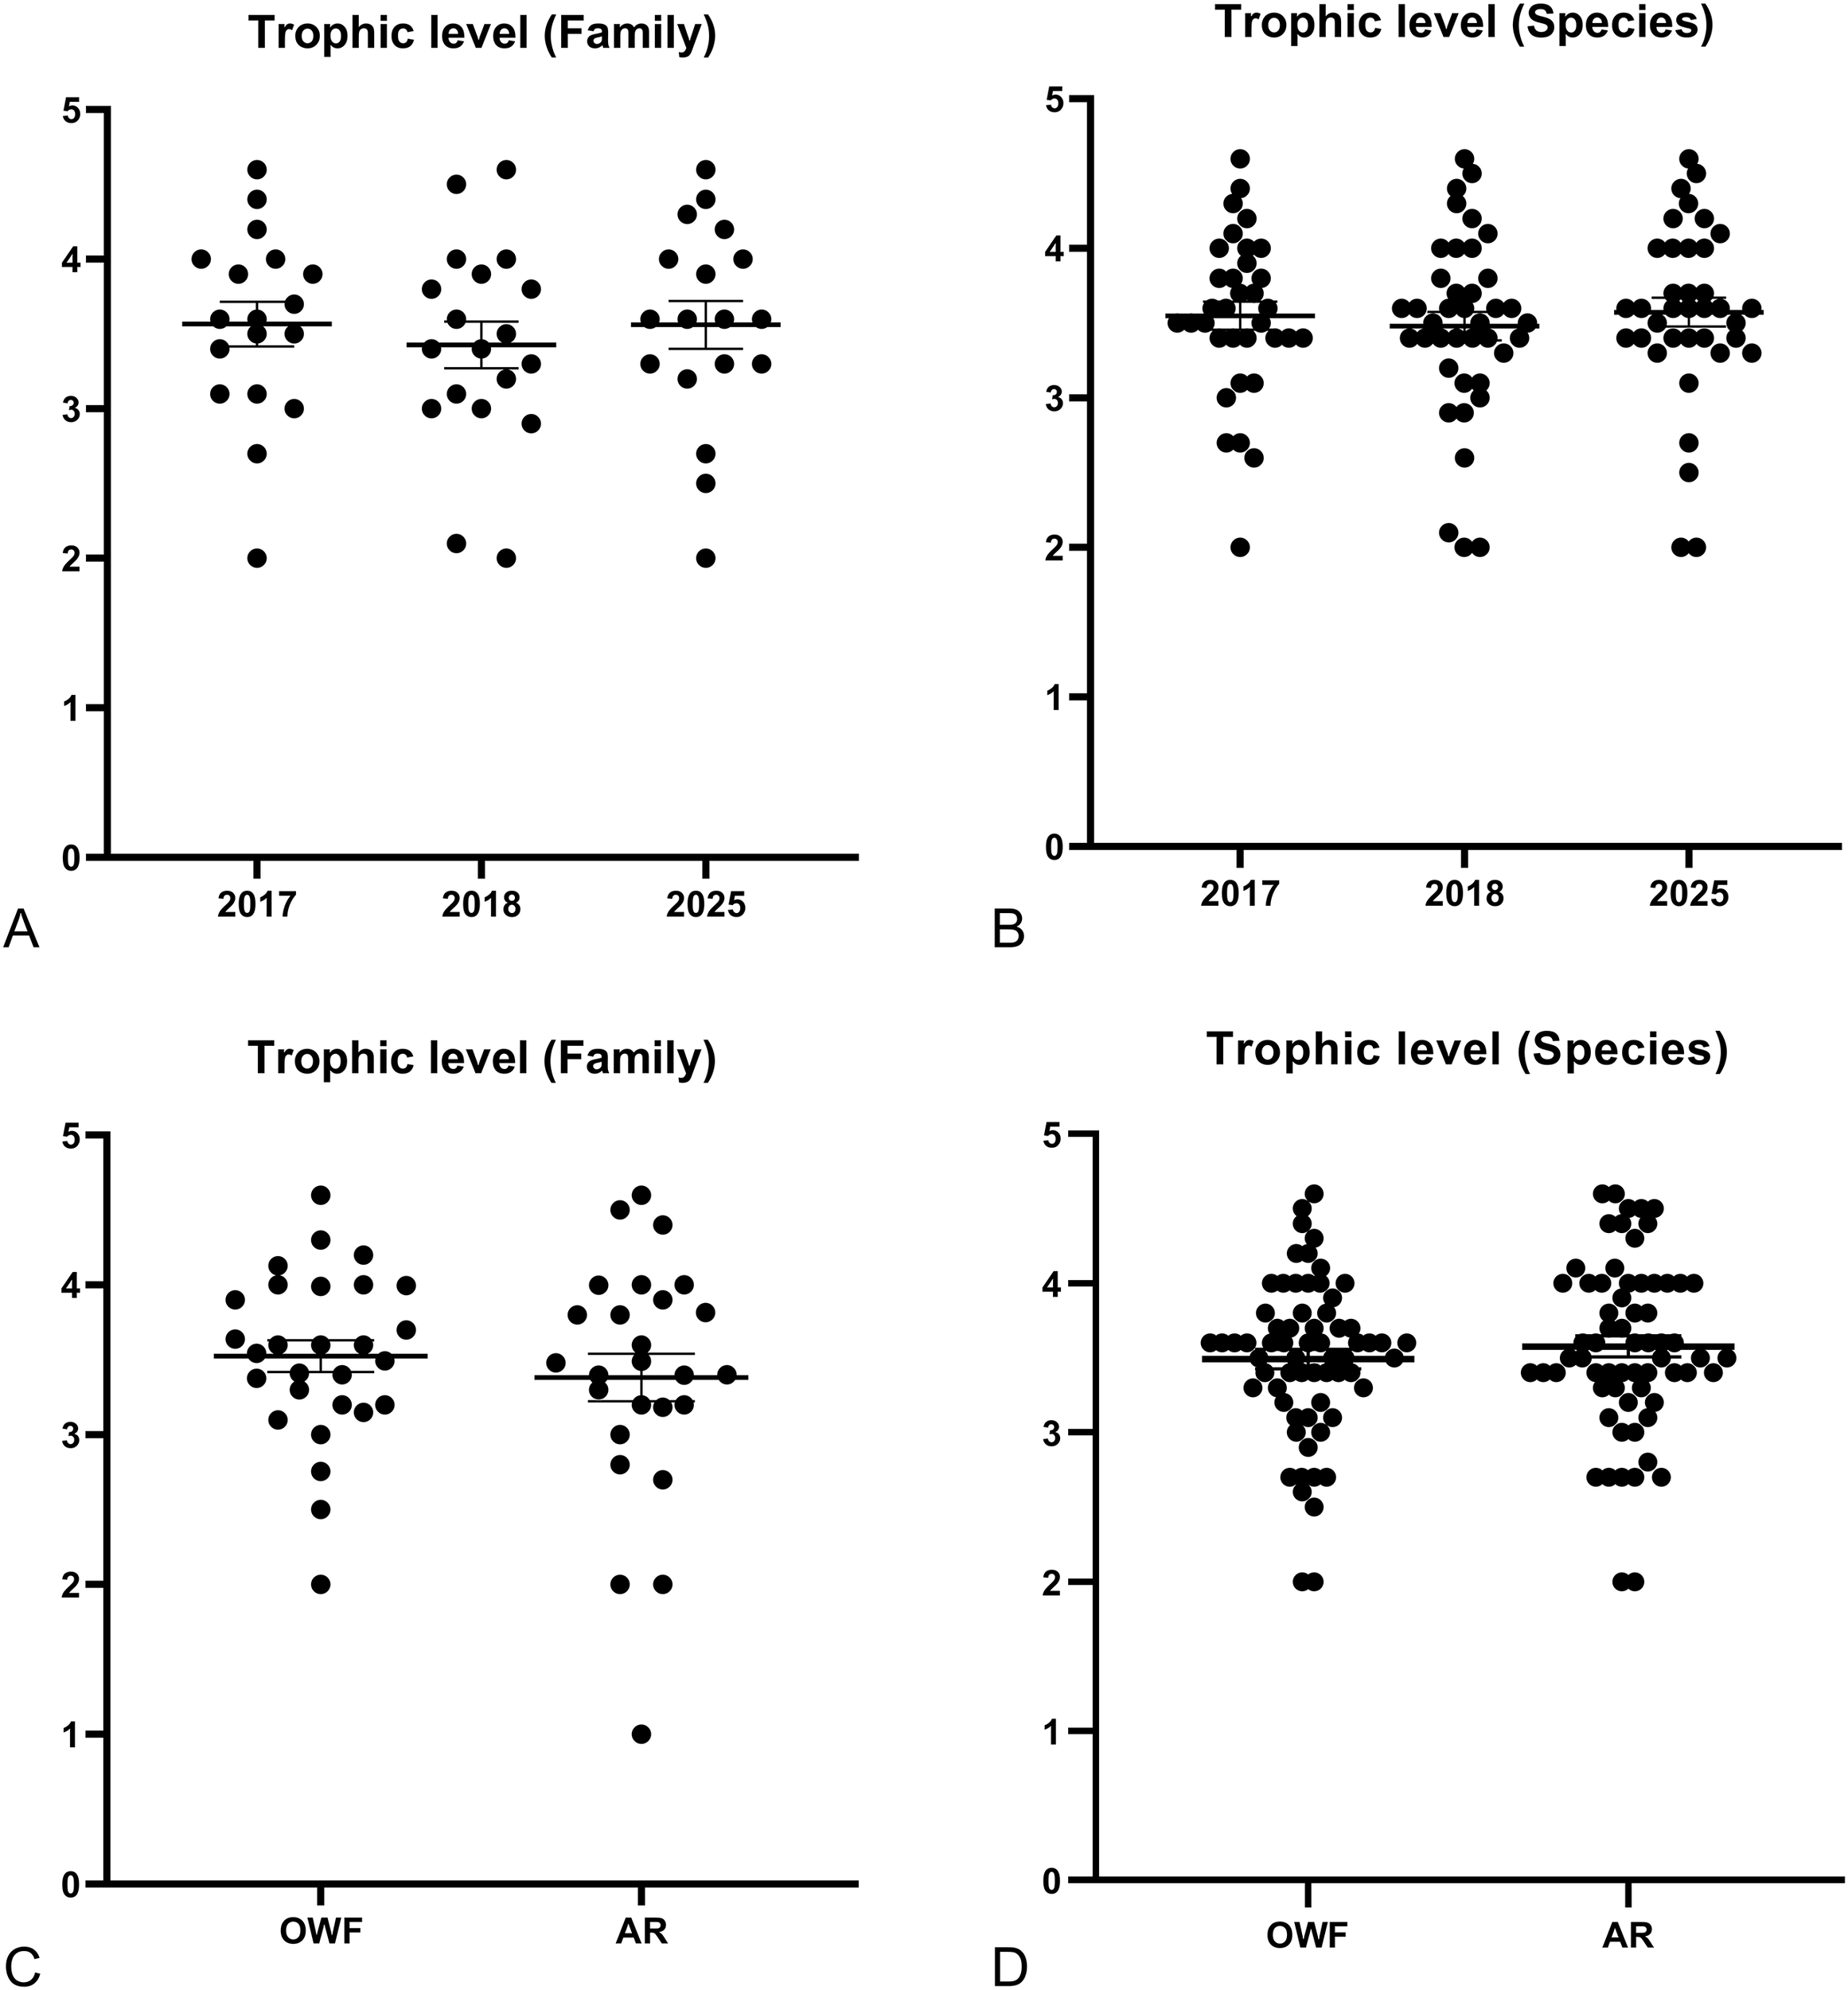
Trophic level of fish families (A) and species (B) observed at turbine foundations in each year. Trophic level of fish families (C) and species (D) observed at turbine foundations (OWF) or artificial reefs (AR) in 2025.
A Principal Coordinates Analysis (PCoA) of functional gradients across the years showed the first two axes explained 37.7% and 26.9% of the variation, respectively (cumulative 64.6%), while the first four axes accounted for 87.5% (Figure 7). Although the species present in 2017, 2018, and 2025 occupied broadly overlapping regions of the functional space, a clear temporal trend emerged. In comparison to 2017 and 2018, the functional representation of soft-bottom species was visibly reduced in 2025, indicating a successional shift in the community’s composition.
Figure 7
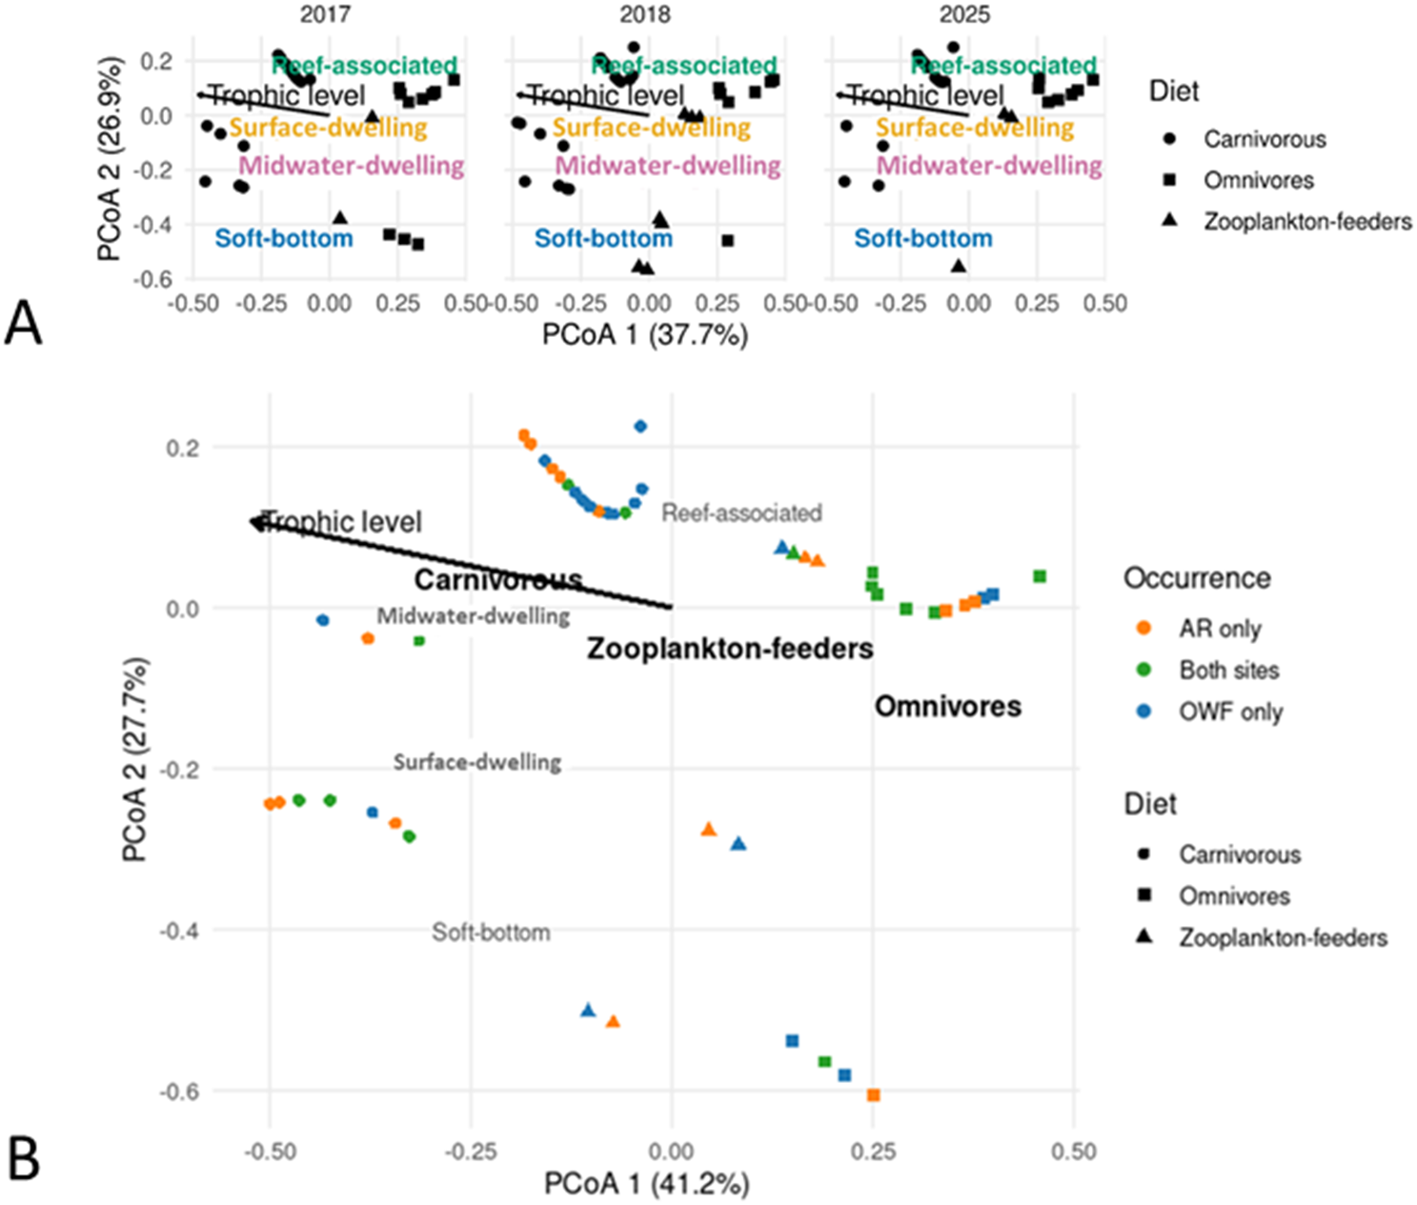
Principal coordinates analysis (PCoA) showing (A) temporal changes in the functional composition of fish assemblages recorded at turbine foundations in the Formosa Wind Farm across years. Species are categorized by diet (carnivores, omnivores, and zooplankton feeders; see symbols) and habitat associations (soft-bottom, midwater-dwelling, surface-dwelling, and reef-associated; see text labels). (B) Functional differentiation of fish assemblages between offshore wind farm (OWF) and artificial reef (AR) sites. Species are categorized by diet (carnivores, omnivores, and zooplankton feeders; see symbols) and occurrence (present only at ARs, only at the OWF, or at both sites; see colors). Habitat associations (soft-bottom, surface-dwelling, midwater-dwelling, and reef-associated) and trophic levels are indicated. The first two PCoA axes explain 37.7% and 26.9% of the total variation in (A), and 41.2% and 27.7% in (B), respectively.
Species composition comparison of OWF and AR
The species number and diversity index did not show significant difference between OWF and AR (including both SR and UPR) sites surveyed in 2025 (Figure 8) (Kruskal-Wallis test, df = 1, p = 0.189 and 0.190). In addition, the species recorded at OWF were highly similar to what were found in the SR of the AR sites with higher Sørensen-Dice coefficient similarity than the comparisons to UPR (Table 2).
Figure 8
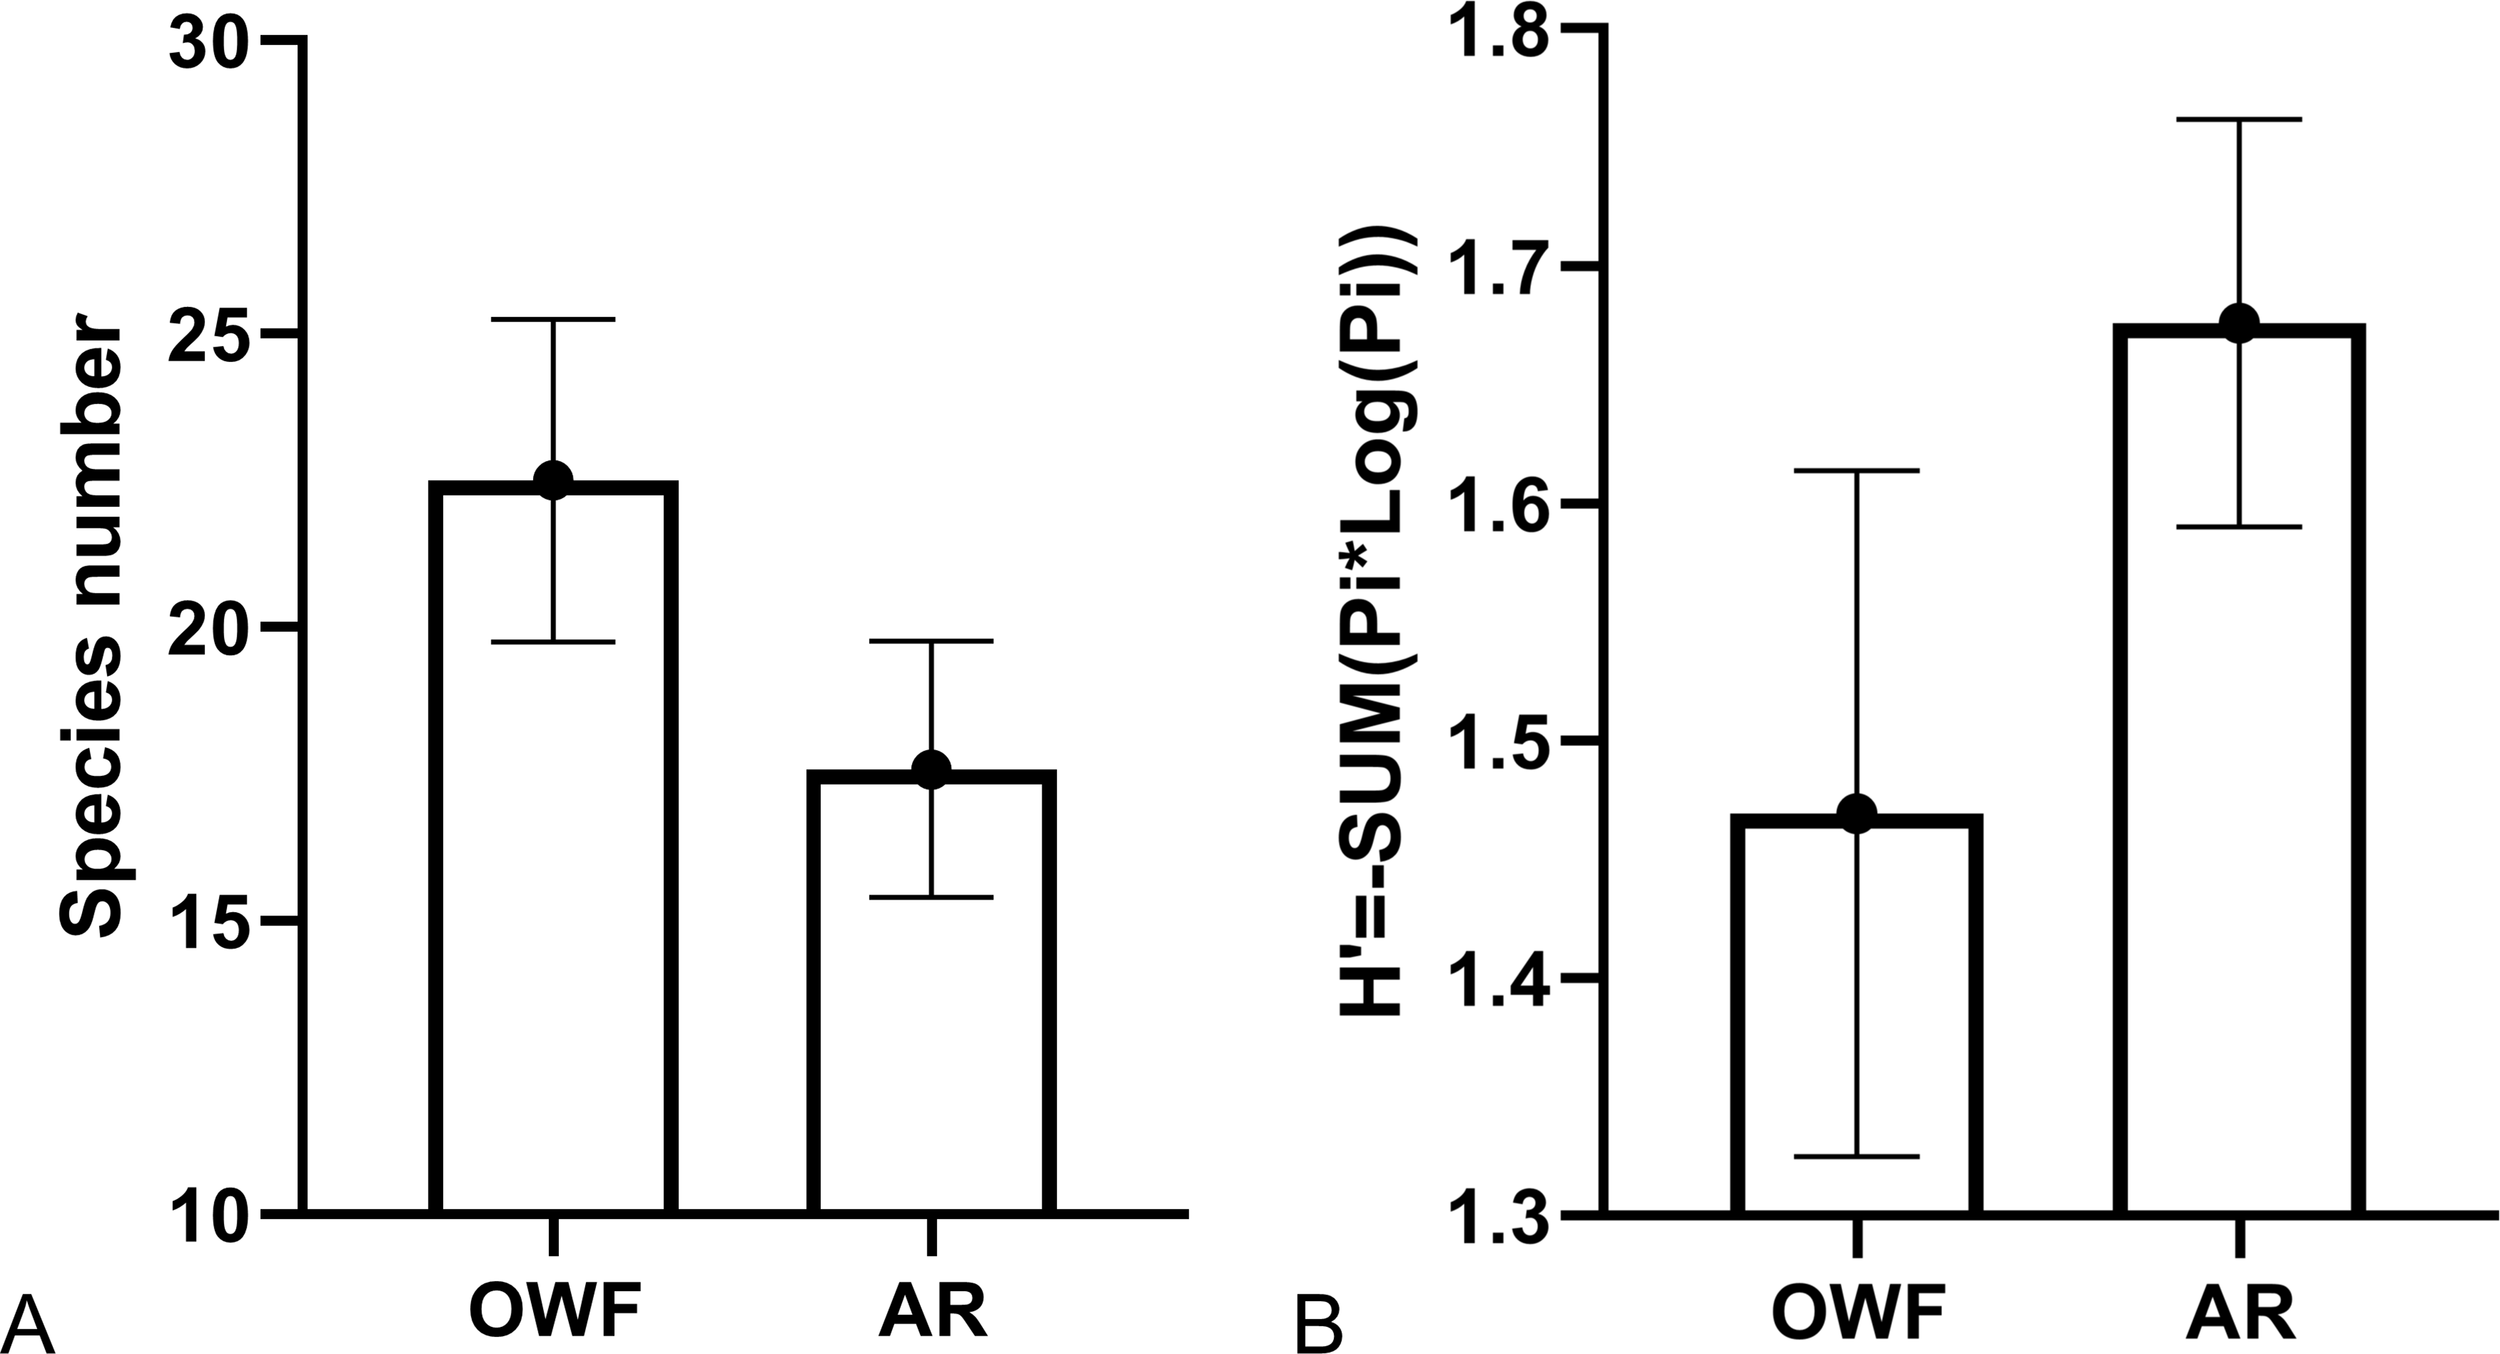
The fishes recorded around the wind turbines (OWF) and artificial reefs (AR) in 2025. (A) Species richness (B) Shannon’s diversity index. Due to the small sample size (only two surveys) of UPR, the data of SR and UPR were not analyzed independently in this comparative statistics. Mean ± SE.
Table 2
| A | |||
|---|---|---|---|
| Survey site | OWF | SR | UPR |
| OWF | 1.00 | ||
| SR | 0.72 | 1.00 | |
| UPR | 0.37 | 0.49 | 1.00 |
| B | |||
|---|---|---|---|
| Survey method | Pole and lines | ||
| Distance from the pile | <10m | 25-50m | >250m |
| Pole and lines<10m | 1.00 | ||
| Pole and lines 25-50m | 0.29 | 1.00 | |
| Pole and lines >250m | 0.19 | 0.31 | 1.00 |
Sorensen-Dice coefficient of the fish compositions (A) between wind turbine and artificial reefs and (B) collected at vary distances from the wind turbine.
Wind turbines (OWF), utility-pole reefs (UPRs) and steel reef (SR).
However, a quantitative nMDS analysis of SCUBA survey data revealed six distinct fish community groups at a Bray-Curtis similarity level of 35%. A subsequent Analysis of Similarities confirmed that the species compositions at the offshore wind farm (OWF) and AR sites (SR or UPR) were significantly different from each other (Global R = 0.468, p < 0.001). The analysis also indicated that species composition may differ between the two types of ARs, UPR and SR, as well as between the wind turbines with and without riprape. In addition, the nMDS analysis suggested that seasonality may be another factor driving differences in species composition, particularly in SRs, where fish assemblages recorded in May were distinct from those observed in August, and were associated with a higher occurrence of migration species, such as Leiognathus spp. (Figure 9).
Figure 9
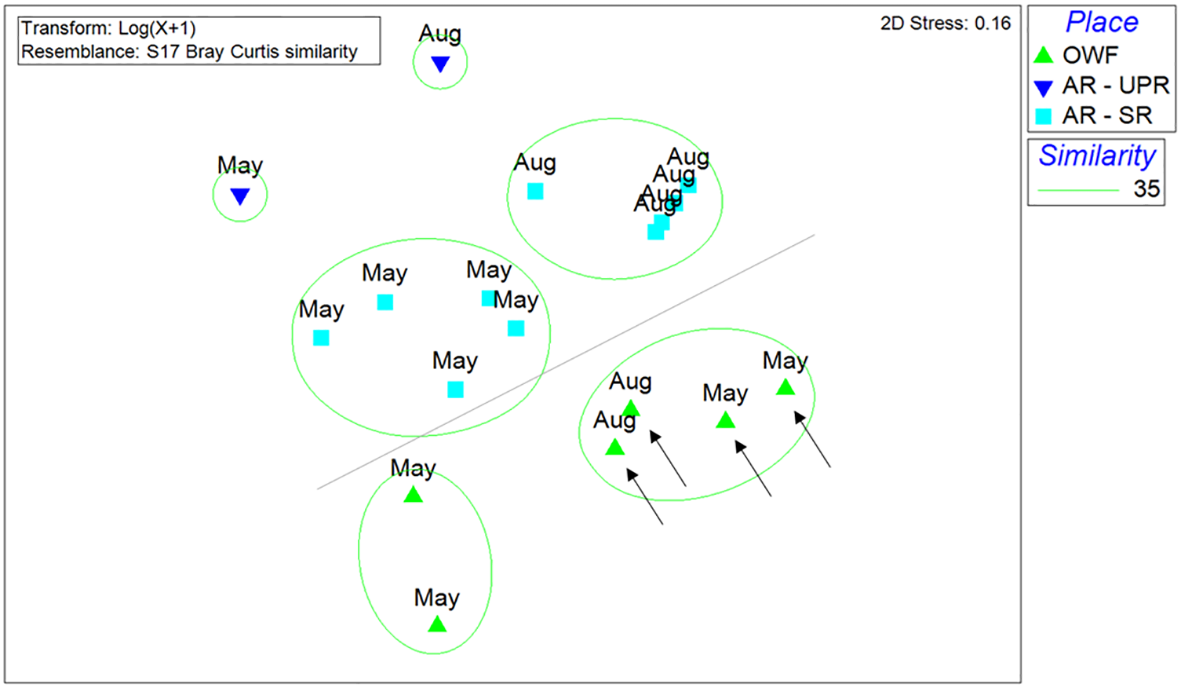
Non-metric multidimensional scaling (NMDS) analysis of species compositions of the fish around wind turbines (OWF), utility-pole reefs (AR-UPRs) or steel reef (AR-SR) in 2025. Arrows indicate the wind turbine sites (A04, C14, D21, and D28) with ripraps. (Bray–Curtis similarity).
Regarding habitat use and feeding habits, no surface-dwelling or midwater-dwelling species were observed at the UPR site (Figure 5). Despite differences in species assemblage, no significant differences were found in the trophic levels of families or species between the OWF and ARs sites (Figure 6) (Kruskal-Wallis test, df = 1; family, p = 0.603; species, p = 0.517).
As for the fish functional diversity, the first four axes of the PCoA cumulatively explained 91.0%. The first two axes explained 41.2% and 27.7% (cumulative 68.9%) of the projected inertia and illustrated in Figure 7. The ordination showed a clear separation of functional groups along the first axis, distinguishing reef-associated species (e.g., carnivorous and omnivorous feeders) from soft-bottom and pelagic species. Species found at both site types and those exclusive to the ARs occupied a similar functional space, clustering with reef-associated traits. In contrast, species found only at the OWF were dispersed across the functional space, indicating a broader range of traits that included soft-bottom and pelagic characteristics.
Species composition at different distances of OWF
Although the fish species richness did not differ among the distances (<10m, 25-50m and >250m; Kruskal-Wallis test, df = 2, p = 0.135) (Figure 10), the species compositions were different. Sørensen-Dice coefficient showed that the fish species caught closer to the turbines exhibited lower similarity to those at sandy areas (>250m) (Table 2).
Figure 10
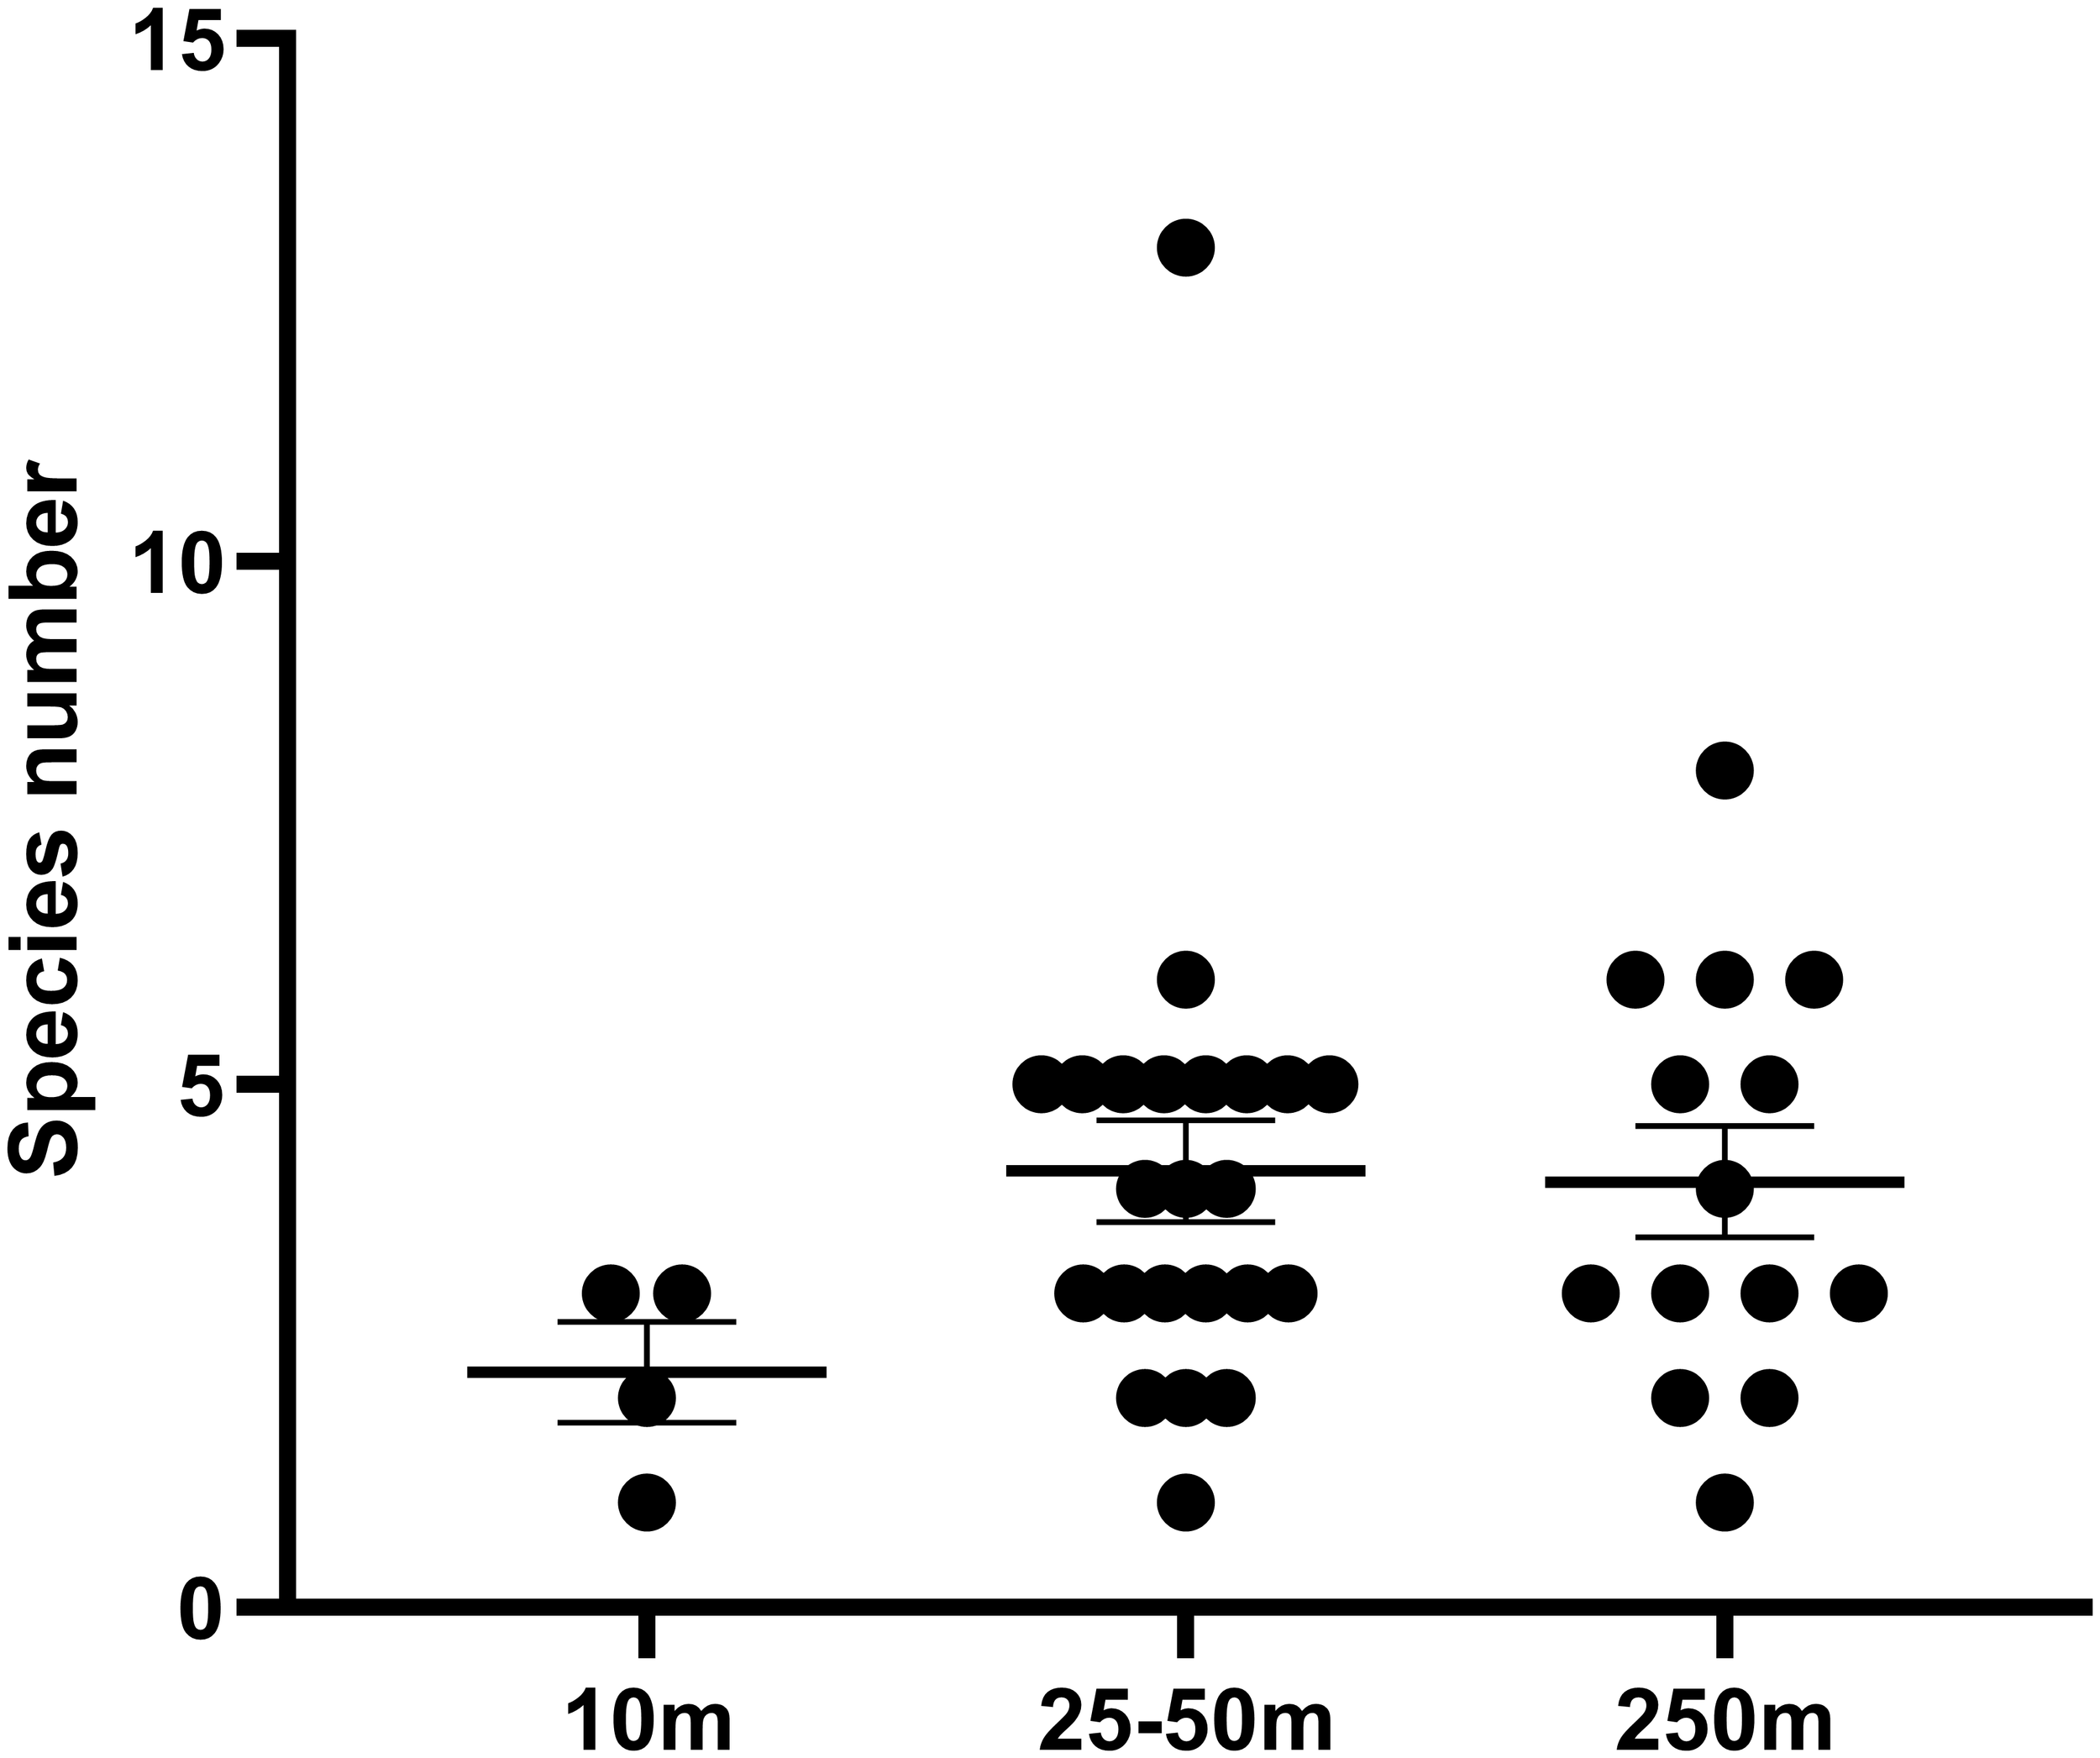
Species richness of the fish collected at vary distances from the wind turbine. Mean ± SE.
A nMDS analysis revealed distinct groupings of fish assemblages, producing eight main clusters at a Jaccard similarity level of 30%. While these groups generally reflected a distance-related gradient from the wind turbines (Figure 11), some samples from the 25–50 m and >250 m groups clustered together. A one-way ANOSIM indicated that species compositions across these distances were only weakly different (Global R = 0.141, p = 0.005). In contrast, although pole and line surveys were conducted mostly during the summer monsoon season, fish assemblages recorded in July were slightly different from those observed in other months (Figure 11; Supplementary Data S2).
Figure 11
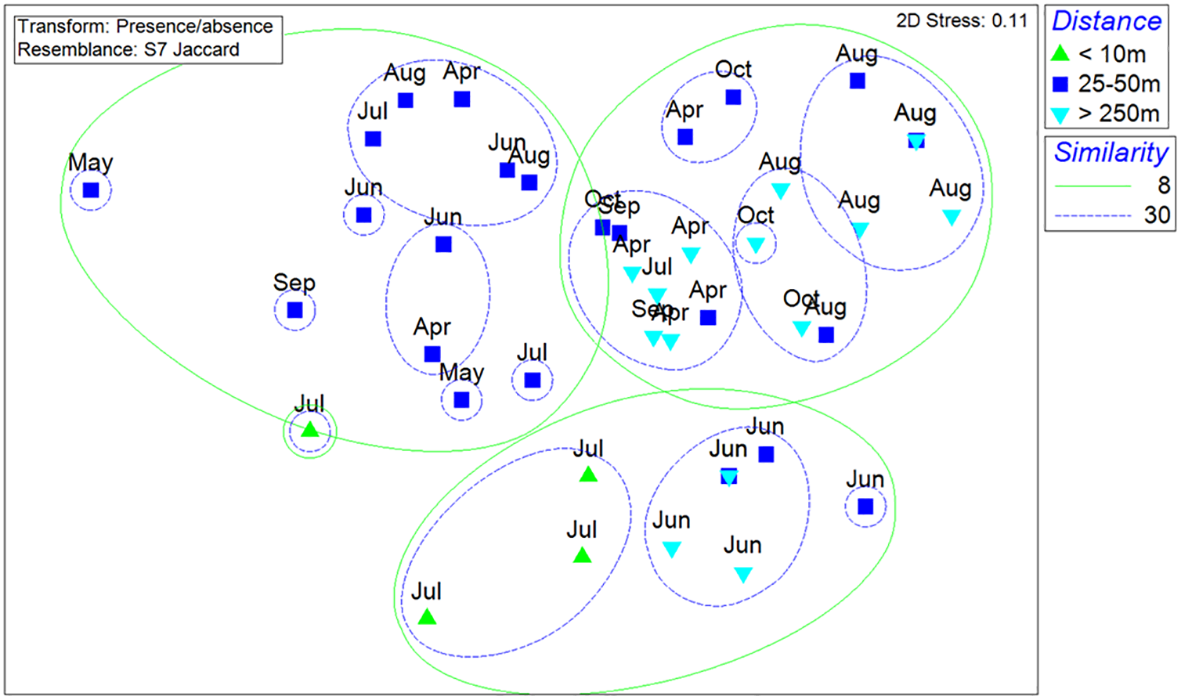
Non-metric multidimensional scaling (NMDS) analysis of species compositions of the fish collected by pole and line at the distance less than 10m, 25-50m and over 250m (Jaccard qualitative similarity).
Discussion
The rapid expansion of offshore wind farms (OWFs) highlights the need to better understand their ecological functions, particularly in soft-sediment environments where turbine foundations introduce novel hard substrates. This study presents a multi-year, integrative assessment of the Formosa Wind Farm, revealing a clear successional trajectory in its fish assemblages and delineating the spatial extent of its reef effects. Our findings demonstrate that OWF foundations can function as effective artificial reefs, substantially enhancing local fish diversity and restructuring community composition, while attaining functional equivalence to older ARs within few years.
Temporal succession: the maturation of a novel reef ecosystem
Fish assemblages at the Formosa Wind Farm exhibited a distinct, progressive development between 2017 and 2025, consistent with classic ecological succession patterns observed on artificial structures. Both fish abundance and species richness increased significantly over the eight-year monitoring period. This temporal trend supports the established model in which reef aging promotes faunal complexity through the gradual accumulation of encrusting organisms, which in turn enhance habitat complexity and food availability (Zhou et al., 2022; Zupan et al., 2023). While previous studies have reported the most pronounced increases within the first two years post-construction (Folpp et al., 2011), our data indicate that in this subtropical environment, community maturation may continue over a longer timescale.
Functional trait analysis through PCoA further elucidates this ecological transition. The progressive shift from soft-bottom species dominance in 2017 to a higher representation of reef-associated taxa in 2025 indicates that OWFs not only attract fish but also facilitate a fundamental habitat transformation (Boakes et al., 2025). This transition reflects the replacement of soft-sediment communities by assemblages typical of hard-bottom reef ecosystems (Boakes et al., 2025; Jansen et al., 2025).
However, despite the overall increase in abundance and richness, the Shannon’s diversity index was lowest in 2025, largely due to the overwhelming dominance of Sphyraena flavicauda (yellowtail barracuda), which accounted for over 65% of total individuals. This observation illustrates that ecological maturity does not necessarily correspond to maximum evenness (Yuan et al., 2022). The dominance of schooling, mid-trophic predators may transiently lower evenness-based diversity indices, while simultaneously reflecting the system’s enhanced capacity to support higher trophic levels.
Spatial extent: a localized oasis of biodiversity
A key question for marine spatial planning is the extent to which OWFs modify surrounding ecosystems. While wind turbines can create reef habitats in the region, those structures may also alter and disrupt the existing sandy-bottom ecosystems, potentially leading to a decline in sandy-bottom fish resources (Bohnsack, 1989; Grossman et al., 1997; Lindberg, 1997; Pickering and Whitmarsh, 1997).
To address this issue, Roa-Ureta et al. (2019) developed a modeling framework to quantify the impacts of ARs on the ecosystem, suggesting that evaluating the growth of area K (carrying capacity) can eliminate the attraction versus production concern. Thus, the increase of K in the area counters the hypothesis that artificial reefs only aggregate fish without contributing to resource production. The positive effects of ARs on resource cultivation are also demonstrated in an earlier study that simultaneously assessing the biomass of the entire reef structure and broader ecosystem during the pre-, mid-, and post-deployment phases (Carr and Hixon, 1997). Likewise, based on the species richness and abundances data collected from 13 OWFs across seven European countries, Methratta and Dardick (2019) concluded that both reef-associated and sandy-bottom fish abundances within wind farms were higher than those in surrounding control areas, while only pelagic fish did not show a significant difference.
An acoustical survey at the Block Island Wind Farm indicated that fish aggregated within 200 m of the turbine structures, suggesting that the proximate effects of the wind array were spatially limited (Jech et al., 2023). Similarly, the pole-and-line surveys stratified by distance from turbines in this study revealed that the reef effect in this OWF is highly localized. Although the installation of turbine foundations enhanced overall species diversity within the wind farm, reef-associated species were restricted to areas within approximately 50 m of the piles, and the broader demersal and benthopelagic communities remained largely unchanged beyond 250 m. This pronounced spatial gradient is consistent with the results of a meta-analysis of published data by Methratta and Dardick (2019), which demonstrated that turbine-associated aggregation effects are strongest within tens of meters of the structure. Given that the spacing between turbines in the Formosa Wind Farm typically exceeds 1,000 m, the results suggest that the overall impact on the soft-bottom ecosystem is minimal. Rather than transforming the seafloor on a large scale, turbines act as discrete biodiversity “oasis” embedded within an expansive soft-sediment matrix. Such habitat diversification may increase regional biodiversity (Witte et al., 2024) without disrupting existing benthic fish communities (Alevizon and Gorham, 1989).
Functional equivalence with mature artificial reefs
By 2025, fish assemblages at turbine foundations displayed species richness, diversity, and trophic structures statistically indistinguishable from those at nearby ARs constructed roughly 15 years earlier. This suggests that OWF foundations can attain a level of functional maturity equivalent to purpose-built reefs in a substantially shorter timeframe.
So far, it is inconclusive whether the fish aggregation effects of the wind turbines or other ARs can improve over the years following construction or if they peak at climax and then decline. In general, the fish aggregation effects of ARs may depend on the location, materials, deployed pattern and the condition of the ARs, such as damage, burial, or being covered by nets (review inJan et al., 2003). However, based on observations of traditional artificial reefs in this region, it is generally believed that as long as the reef remains intact, the ARs with longer history have thicker layer of encrusting organisms on the surface, potentially they may attract more fish. Methratta and Dardick (2019) suggested that following the completion of the OWFs, the increase in fish numbers is most significant within the first two years, while the effects become less pronounced in the following years. This pattern is applied for both soft-bottom species and hard-bottom species. In contrast, a ten-year monitoring study on shipwrecks in the Texas Gulf of Mexico showed that fish assemblages remained highly dynamic rather than stabilizing quickly, and certain species exhibited exceptionally high abundances in specific years. However, that study also documented an overall increase in species richness and a reduction in dominant species (Hicks et al., 2025). Consistent with these findings, our SCUBA diving survey data from Formosa Offshore Windfarm, collected eight years apart, also indicated that for fish aggregation has increased substantially around turbines that have been in place for longer periods.
Nonetheless, there could be compositional differences between OWF and ARs. Although the functional space of the species recorded in OWF or ARs were largely overlapping in PCoA analysis. The species unique to the OWF occupied a broader functional space encompassing both reef-associated and soft-bottom traits, while AR-exclusive species clustered more narrowly within the reef-associated domain. These findings indicate that OWFs support a hybrid community that retains elements of the original soft-bottom fauna while hosting typical reef taxa, yielding a unique assemblage distinct from that of conventional ARs. This pattern reinforces the notion that structural attributes, such as vertical relief, surface material, and scour protection design, play a decisive role in shaping community composition (Brock and Norris, 1989; Cruz et al., 2018). Furthermore, a primary structural distinction is the high vertical relief of the turbine foundations, which span the entire water column and create a shallow-water hard substrate habitat within the upper 10 meters that is absent at the fully submerged SR and UPR sites. This unique shallow zone supports a distinct assemblage of reef-associated fishes, including Pomacentridae (e.g. Abudefduf), Oplegnathidae, and Kyphosidae (Figure 3B). The OWF foundations, therefore, differ markedly from the utility-pole and steel-frame reefs at the AR sites, potentially explaining persistent compositional distinctions despite converging functional characteristics (Perkol-Finkel et al., 2006; Granneman and Steele, 2015). Furthermore, our results support that the presence or absence of riprap may lead to differences in fish assemblage composition at turbine foundations. Scour protection in offshore wind farms serves an ecological function beyond its primary engineering role of preventing seabed erosion, as it can act as critical hard-substrate habitat in predominantly soft-bottom marine environments. Previous research has demonstrated that increased surface area and material diversity of riprap significantly enhance taxonomic richness and attract distinct functional groups (Kingma et al., 2024; Werner et al., 2024). Hence, scour protection structures may represent an important component in contributing to nature positive goals within an OWF (Pardo et al., 2025).
Attraction, production, and fishery implications
Whether artificial structures merely attract existing fish or promote new biomass production remains a central debate (Gill et al., 2020). Over the past 30 years, fishery resources in this region have rapidly declined due to overfishing and environmental changes (Liao et al., 2019; Wu et al., 2024). As a result, it is challenging to separate the impacts of recent OWF development on fishery resources from the broader trend of declining resources. Although this study was not explicitly designed to resolve that issue, several findings suggest potential contributions to new production. The presence of dense schools of juvenile or young fish, such as snappers, grunts, or jack near turbine pile indicates that these structures could serve as nursery habitats, enhancing their survival rather than simply aggregating adults (Supplementary Data S4).
The establishment of a diverse fouling community on turbine surfaces further promotes a novel benthic food web, channeling energy from pelagic primary production toward benthic consumers (Layman and Allgeier, 2020). This newly formed trophic pathway was largely absent in the original soft-bottom habitat, implying a net increase in local productivity. In combination with the de facto exclusion of mobile fishing gears such as bottom trawls, these conditions create a refuge that facilitates stock replenishment and may contribute to spillover into adjacent fishing grounds.
Numerous studies have demonstrated that OWFs can function similarly to marine protected areas (MPAs) by passively reducing the use of mobile fishing gear and protecting benthic habitats from disturbance (Busch et al., 2011; Langhamer, 2012; Coates et al., 2016; Ashley, 2014). Empirical data from the Kentish Flats and North Hoyle wind farms in the UK showed no significant differences in CPUE before and after construction, while trawl surveys at Kentish Flats even reported increased CPUE for most species (Mangi, 2013). Likewise, although fishing is technically permitted within Irish Sea wind farms, many fishermen tend to avoid these areas due to the risk of gear entanglement and collision with turbines, thereby creating de facto refuges (Gray et al., 2016). Similarly, Voyage Data Recorder (VDR) data from fishing vessels operating out of nearby Long Fong and Waipu Fishing Port, as provided by the Fisheries Agency of Taiwan, showed that the frequency of fishing operations within the wind farm area in 2024 was markedly lower than in 2017, prior to the construction of this wind farm.
Conclusions and future perspectives
The findings indicate that the underwater foundations of this OWF act as efficient artificial reefs, although their ecological influence remains spatially restricted. Over an eight-year period, the fish assemblage in this ecological oasis underwent a clear successional shift, transitioning from a soft-bottom community to a functionally mature reef-associated community that is comparable to purpose-built artificial reefs nearly twice its age. This habitat diversification significantly enhances local biodiversity in a region dominated by soft substrates. From a management perspective, our findings have important implications for the sustainable development of offshore wind energy in Taiwan and globally. They confirm that OWFs can provide tangible ecological benefits in addition to renewable energy, highlighting their potential role in balancing energy development with marine conservation. Nevertheless, the observed differences in species composition between the OWF and mature ARs emphasize that structural design plays a key role in shaping reef communities. Future wind farm developments should incorporate ecological engineering principles, particularly in the design of scour protection, to maximize habitat complexity and target the enhancement of specific, commercially or ecologically valuable species.
Statements
Data availability statement
The raw data supporting the conclusions of this article will be made available by the authors, without undue reservation.
Ethics statement
The animal study was approved by Institutional Animal Care and Use Committee of National Taiwan Ocean University. The study was conducted in accordance with the local legislation and institutional requirements.
Author contributions
KS: Funding acquisition, Writing – review & editing, Writing – original draft, Conceptualization, Project administration, Supervision. CC: Writing – original draft, Investigation, Data curation. CC: Methodology, Data curation, Writing – review & editing. LH: Methodology, Writing – review & editing. YS: Writing – original draft, Data curation, Conceptualization, Investigation, Writing – review & editing. HC: Methodology, Writing – review & editing. WL: Resources, Writing – review & editing. HT: Resources, Writing – review & editing. TH: Writing – review & editing, Resources. CC: Resources, Writing – review & editing.
Funding
The author(s) declared that financial support was received for this work and/or its publication. This study was supported by grants from the Energy Administration, Ministry of Economic Affairs in 2024-2025, from the Fisheries Agency, MOA in 2025 and from the Ministry of Science and Technology, Taiwan (MOST 106-2119-M- 110-002) in 2016-2017 to KS and (MOST 108-2621-M-019 -002 -MY3) in 2019 to YTS.
Acknowledgments
We appreciate the support from the Center of Excellence for the Oceans and Intelligent Maritime Research Center, National Taiwan Ocean University, from its Featured Areas Research Center Program within the framework of the Higher Education Sprout Project by the Ministry of Education (MOE) in Taiwan. We would like to thank Unitech New Energy Engineering Ltd. Co. for supporting EIA monitoring project. We also very much appreciate the Central Weather Bureau of Taiwan for kindly providing temperature data, and sincerely thank Dr. Daniel Sheehy who not only polished English writing but also given professional comments and suggestions to the manuscript.
Conflict of interest
The author(s) declared that this work was conducted in the absence of any commercial or financial relationships that could be construed as a potential conflict of interest.
Generative AI statement
The author(s) declared that generative AI was not used in the creation of this manuscript.
Any alternative text (alt text) provided alongside figures in this article has been generated by Frontiers with the support of artificial intelligence and reasonable efforts have been made to ensure accuracy, including review by the authors wherever possible. If you identify any issues, please contact us.
Publisher’s note
All claims expressed in this article are solely those of the authors and do not necessarily represent those of their affiliated organizations, or those of the publisher, the editors and the reviewers. Any product that may be evaluated in this article, or claim that may be made by its manufacturer, is not guaranteed or endorsed by the publisher.
Supplementary material
The Supplementary Material for this article can be found online at: https://www.frontiersin.org/articles/10.3389/fmars.2026.1733177/full#supplementary-material
References
1
Ajemian M. J. Wetz J. J. Shipley-Lozano B. Shively J. D. Stunz G. W. (2015). An analysis of artificial reef fish community structure along the northwestern Gulf of Mexico shelf: potential impacts of “Rigs-to-Reefs” programs. PloS One.10, e0126354. doi: 10.1371/journal.pone.0126354
2
Alevizon W. S. Gorham J. C. (1989). Effects of artificial reef deployment on nearby resident fishes. Bull. Mar. Sci.44, 646–661.
3
Ashley M. (2014). The implications of co-locating marine protected areas around offshore wind farms (UK: University of Plymouth), 407. doi: 10.24382/3515
4
Ashley M. C. Mangi S. C. Rodwell L. D. (2014). The potential of offshore windfarms to act as marine protected areas–A systematic review of current evidence. Mar. Policy.45, 301–309. doi: 10.1016/j.marpol.2013.09.002
5
Becker A. Taylor M. D. Lowry M. B. (2017). Monitoring of reef associated and pelagic fish communities on Australia’s first purpose built offshore artificial reef. ICES. J. Mar. Sci.74, 277–285. doi: 10.1093/icesjms/fsw133
6
Bergström L. Kautsky L. Malm T. Rosenberg R. Wahlberg M. Capetillo N.Å. et al . (2014). Effects of offshore wind farms on marine wildlife—a generalized impact assessment. Environ. Res. Lett.9, 34012. doi: 10.1088/1748-9326/9/3/034012
7
Bilgili M. Alphan H. (2022). Global growth in offshore wind turbine technology. Clean. Technol. Environ. Policy.24, 2215–2227. doi: 10.1007/s10098-022-02314-0
8
Blaker W. D. (1987). Computer program for the parametric and nonparametric comparison of several groups to a control. Comput. Biol. Med.17, 37–44. doi: 10.1016/0010-4825(87)90032-1
9
Boakes Z. Hall A. E. Sulaiman A. Cahyarini S. Y. Stafford R. (2025). Long-term monitoring describes unique fish communities across natural and artificial reef habitats in Indonesia. Mar. Biol.172, 1–12. doi: 10.1007/s00227-025-04733-1
10
Bohnsack J. A. (1989). Are high densities of fishes at artificial reefs the result of habitat limitation or behavioral preference? Bull. Mar. Sci.44, 631–645.
11
Brock R. E. Norris J. E. (1989). An analysis of the efficacy of four artificial reef designs in tropical waters. Bull. Mar. Sci.44, 934–941.
12
Busch M. Gee K. Burkhard B. Lange M. Stelljes N. (2011). Conceptualizing the link between marine ecosystem services and human well-being: the case of offshore wind farming. Int. J. Biodivers. Sci. Ecosyst. Serv. Manage.7, 190–203. doi: 10.1080/21513732.2011.618465
13
Carr M. H. Hixon M. A. (1997). Artificial reefs: the importance of comparisons with natural reefs. Fisheries.22, 28–33. doi: 10.1577/1548-8446(1997)022<0028:ARTIOC>2.0.CO;2
14
Clarke K. R. (1993). Non-parametric multivariate analyses of changes in community structure. Aust. J. Ecol.18, 117–143. doi: 10.1111/j.1442-9993.1993.tb00438.x
15
Clarke K. R. Warwick R. M. (2001). Change in marine communities: An approach to statistical analysis and interpretation (Plymouth, UK: Primer-E Ltd), 1–168.
16
Coates D. A. Kapasakali D. A. Vincx M. Vanaverbeke J. (2016). Short-term effects of fishery exclusion in offshore wind farms on macrofaunal communities in the Belgian part of the North Sea. Fish. Res.179, 131–138. doi: 10.1016/j.fishres.2016.02.019
17
Cruz F. Pereira E. Valente I. B. Tiago M. Maslov D. Pinheiro M. (2018). “ Structural design of an innovative multifunctional artificial reef,” in OCEANS 2018 MTS/IEEE Charleston (Piscataway, New Jersey, USA: IEEE), 1–7. doi: 10.1109/OCEANS.2018.8604587
18
de Albuquerque M. A. do Nascimento E. R. de Oliveira Barros K. N. N. Barros P. S. N. (2022). Comparison between similarity coefficients with application in forest sciences. Res. Soc Dev.11, e48511226046–e48511226046. doi: 10.33448/rsd-v11i2.26046
19
Degraer S. Carey D. A. Coolen J. W. Hutchison Z. L. Kerckhof F. Rumes B. et al . (2020). Offshore wind farm artificial reefs affect ecosystem structure and functioning. Oceanography.33, 48–57. doi: 10.5670/oceanog.2020.405
20
Dice L. R. (1945). Measures of the amount of ecologic association between species. Ecology26, 297–302. doi: 10.2307/1932409
21
Dolores Esteban M. Javier Diez J. Lopez J. S. Negro V. (2011). Why offshore wind energy? Renew. Energy36, 444–450. doi: 10.1016/j.renene.2010.07.009
22
Folpp H. Lowry M. Gregson M. Suthers I. M. (2011). Colonization and community development of fish assemblages associated with estuarine artificial reefs. Braz. J. Oceanography.59, 55–67. doi: 10.1590/S1679-87592011000500008
23
Froese R. Pauly D. (Eds.) (2024). FishBase (Los Baños, Laguna, Philippines: World Wide Web electronic publication). Available online at: www.fishbase.org (Accessed October 27, 2025).
24
Gill A. B. Degraer S. Lipsky A. Mavraki N. Methratta E. Brabant R. (2020). Setting the context for offshore wind development effects on fish and fisheries. Oceanography.33, 118–127. doi: 10.5670/oceanog.2020.411
25
Granneman J. E. Steele M. A. (2015). Effects of reef attributes on fish assemblage similarity between artificial and natural reefs. ICES. J. Mar. Sci.72, 2385–2397. doi: 10.1093/icesjms/fsv094
26
Gray M. Stromberg P. L. Rodmell D. (2016). Changes to fishing practices around the UK as a result of the development of offshore windfarms–Phase 1 (Revised) (London, UK: The Crown Estate).
27
Grossman G. D. Jones G. P. Seaman W. J. Jr (1997). Do artificial reefs increase regional fish production? A review of existing data. Fisheries.22, 17–23. doi: 10.1577/1548-8446(1997)022
28
Hicks D. Getz E. Kline R. Cintra Buenrostro C. (2025). A decade of monitoring reveals a dynamic fish assemblage on a substantial artificial reef in the texas gulf of Mexico. Fish. Manage. Ecol.32, e12756. doi: 10.1111/fme.12756
29
Islam M. Yasmin R. (2018). Assemblage, abundance and diversity of fish species in River Dhaleshwari, Bangladesh. Asian J. Fish. Aquat. Res.2, 1–28. doi: 10.9734/AJFAR/2018/v2i126112
30
Jackson D. A. Somers K. M. Harvey H. H. (1989). Similarity coefficients: measures of co-occurrence and association or simply measures of occurrence? Am. Nat.133, 436–453. doi: 10.1086/284927
31
Jan R. Q. Liu Y. H. Chen C. Y. Wang M. C. Song G. S. Lin H. C. et al . (2003). Effects of pile size of artificial reefs on the standing stocks of fishes. Fish. Res.63, 327–337. doi: 10.1016/S0165-7836(03)00081-X
32
Jansen L. Loos E. Murk A. J. Priesmann B. Valk S. Walles B. et al . (2025). Coming of age: 13 years after construction an artificial oyster reef in a North Sea estuary hosts a mature benthic community. Mar. Environ. Res.212, 107551. doi: 10.1016/j.marenvres.2025.107551
33
Jech J. M. Lipsky A. Moran P. Matte G. Diaz G. (2023). Fish distribution in three dimensions around the Block Island Wind Farm as observed with conventional and volumetric echosounders. Mar. Coast. Fish.15, e210265. doi: 10.1002/mcf2.10265
34
Kingma E. M. ter Hofstede R. Kardinaal E. Bakker R. Bittner O. van der Weide B. et al . (2024). Guardians of the seabed: Nature-inclusive design of scour protection in offshore wind farms enhances benthic diversity. J. Sea. Res.199, 102502. doi: 10.1016/j.seares.2024.102502
35
Langhamer O. (2012). Artificial reef effect in relation to offshore renewable energy conversion: state of the art. Sci. World J.2012, 386713. doi: 10.1100/2012/386713
36
Layman C. A. Allgeier J. E. (2020). An ecosystem ecology perspective on artificial reef production. J. Appl. Ecol.57, 2139–2148. doi: 10.1111/1365-2664.13748
37
Li J. Wang G. Li Z. Yang S. Chong W. T. Xiang X. (2020). A review on development of offshore wind energy conversion system. Int. J. Energy Res.44, 9283–9297. doi: 10.1002/er.5751
38
Liang W. D. Tang T. Y. Yang Y. J. Ko M. T. Chuang W. S. (2023). Upper-ocean currents around Taiwan. Deep-Sea Res.Pt. II, 50, 1085–1105. doi: 10.1016/S0967-0645(03)00011-0
39
Liao C. P. Huang H. W. Lu H. J. (2019). Fishermen's perceptions of coastal fisheries management regulations: Key factors to rebuilding coastal fishery resources in Taiwan. OCM.172, 1–13. doi: 10.1016/j.ocecoaman.2019.01.015
40
Lindberg W. J. (1997). Can science resolve the attraction-production issue? Fisheries.22, 10–13. doi: 10.1577/1548-8446-22-4
41
Lu H. J. Lin J. R. Huang T. C. Sinaga S. (2021). Comparison of fish assemblages aggregated by artificial reefs using scuba diving and acoustic surveys. J. Mar. Sci. Tech. (NTOU).29, 8. doi: 10.51400/2709-6998.1085
42
Mangi S. C. (2013). The impact of offshore wind farms on marine ecosystems: a review taking an ecosystem services perspective. Proc. IEEE.101, 999–1009. doi: 10.1109/JPROC.2012.2232251
43
Methratta E. T. Dardick W. R. (2019). Meta-analysis of finfish abundance at offshore wind farms. Rev. Fish. Sci. Aquac.27, 242–260. doi: 10.1080/23308249.2019.1584601
44
Methratta E. T. Hawkins A. Hooker B. R. Lipsky A. Hare J. A. (2020). Offshore wind development in the northeast US shelf large marine ecosystem. Oceanography.33, 16–27. doi: 10.5670/oceanog.2020.402
45
Pardo J. C. F. Aune M. Harman C. Walday M. Skjellum S. F. (2025). A synthesis review of nature positive approaches and coexistence in the offshore wind industry. ICES. J. Mar. Sci.82, fsad191. doi: 10.1093/icesjms/fsad191
46
Pauly D. Christensen V. Dalsgaard J. Froese R. Torres F. Jr (1998). Fishing down marine food webs. Science.279, 860–863. doi: 10.1126/science.279.5352.860
47
Perkol-Finkel S. Shashar N. Benayahu Y. (2006). Can artificial reefs mimic natural reef communities? The roles of structural features and age. Mar. Environ. Res.61, 121–135. doi: 10.1016/j.marenvres.2005.08.001
48
Pickering H. Whitmarsh D. (1997). Artificial reefs and fisheries exploitation: a review of the ‘attraction versus production’debate, the influence of design and its significance for policy. Fish. Res.31, 39–59. doi: 10.1016/S0165-7836(97)00019-2
49
Plumlee J. D. Dance K. M. Dance M. A. Rooker J. R. TinHan T. C. Shipley J. B. et al . (2020). Fish assemblages associated with artificial reefs assessed using multiple gear types in the northwest Gulf of Mexico. Bull. Mar. Sci.96, 655–678. doi: 10.5343/bms.2019.0091
50
Polovina J. J. (1989). Artificial reefs: nothing more than benthic fish aggregators. CalCOFI. Rep.30, 37–39.
51
Prista N. Vasconcelos R. P. Costa M. J. Cabral H. (2003). The demersal fish assemblage of the coastal area adjacent to the Tagus estuary (Portugal): relationships with environmental conditions. Oceanologica. Acta.26, 525–536. doi: 10.1016/S0399-1784(03)00047-1
52
Reubens J. T. Degraer S. Vincx M. (2014). The ecology of benthopelagic fishes at offshore wind farms: a synthesis of 4 years of research. Hydrobiologia.727, 121–136. doi: 10.1007/s10750-013-1793-1
53
Richardson L. E. Graham N. A. Pratchett M. S. Hoey A. S. (2017). Structural complexity mediates functional structure of reef fish assemblages among coral habitats. Environ. Biol. Fish.100, 193–207. doi: 10.1007/s10641-016-0571-0
54
Roa-Ureta R. H. Santos M. N. Leitão F. (2019). Modelling long-term fisheries data to resolve the attraction versus production dilemma of artificial reefs. Ecol. Model.407, 108727. doi: 10.1016/j.ecolmodel.2019.108727
55
Şensurat-Genç T. Lök A. Özgül A. Oruç A.Ç. (2022). No effect of nearby natural reef existence on fish assemblages at shipwrecks in the Aegean Sea. J. Mar. Biol. Assoc. U. K.102, 613–626. doi: 10.1017/S0025315422001011
56
Samoilys M. A. Carlos G. (2000). Determining methods of underwater visual census for estimating the abundance of coral reef fishes. Environ. Biol. Fish.57, 289–304. doi: 10.1023/A:1007679109359
57
Santos M. N. Monteiro C. C. (2007). A fourteen-year overview of the fish assemblages and yield of the two oldest Algarve artificial reefs (southern Portugal). Hydrobiologia.580, 225–231. doi: 10.1007/s10750-006-0451-2
58
Shibuya M. (2024). Creating offshore wind power generation that coexists and prospers with local communities and fisheries (Part 2) (Tokyo: KK Long Seller), ISBN: ISBN 978-4-8454-2514-3.
59
Shipley M. F. Coy S. P. Brooke Shipley J. (2018). Utilizing statistical significance in fuzzy interval-valued evidence sets for assessing artificial reef structure impact. J. Oper. Res. Soc69, 905–918. doi: 10.1057/s41274-017-0277-5
60
Stone R. B. Sprague L. M. McGurrin J. M. Seaman W. Jr (1991). Artificial habitats of the world: synopsis and major trends. Artif. Hab. Mar. Freshw. Fish.31–60. doi: 10.1016/B978-0-08-057117-1.50008-1
61
Tsai H. H. Tseng H. S. Huang C. K. Yu S. C. (2022). Review on the conflicts between offshore wind power and fishery rights: Marine spatial planning in Taiwan. Energies.15, 8768. doi: 10.3390/en15228768
62
Vivier B. Dauvin J. C. Navon M. Rusig A. M. Mussio I. Orvain F. et al . (2021). Marine artificial reefs, a meta-analysis of their design, objectives and effectiveness. Glob. Ecol. Conserv.27, e01538. doi: 10.1016/j.gecco.2021.e01538
63
Vrooman J. Schild G. Rodriguez A. G. van Hest. F. (2019). North Sea wind farms: ecological risks and opportunities (Utrecht, the Netherlands: North Sea Foundation).
64
Walker B. K. Henderson B. Spieler R. E. (2002). Fish assemblages associated with artificial reefs of concrete aggregates or quarry stone offshore Miami Beach, Florida, USA. Aquat. Living. Resour.15, 95–105. doi: 10.1016/S0990-7440(02)01154-3
65
Werner K. M. Haslob H. Reichel A. F. Gimpel A. Stelzenmüller V. (2024). Offshore wind farm foundations as artificial reefs: The devil is in the detail. Fish. Res.272, 106937. doi: 10.1016/j.fishres.2024.106937
66
Wilber D. H. Brown L. Griffin M. DeCelles G. R. Carey D. A. (2022). Demersal fish and invertebrate catches relative to construction and operation of North America's first offshore wind farm. ICES. J. Mar. Sci.79, 1274–1288. doi: 10.1093/icesjms/fsac051
67
Wilhelmsson D. (2010). Greening Blue Energy: Identifying and managing the biodiversity risks and opportunities of offshore renewable energy (Gland, Switzerland: IUCN).
68
Williams D. M. Fowler A. J. Newman S. J. (1997). Development of trap and drop-line sampling techniques for reef fishes: a report to the Great Barrier Reef Marine Park Authority. Great Barrier Reef Marine Park Authority. Available online at: https://hdl.handle.net/11017/299 (Accessed July 4, 2025).
69
Witte S. Dickson J. Franken O. Holthuijsen S. Govers L. L. Olff H. et al . (2024). Enhancing ecological complexity in soft-bottom coastal ecosystems: the impact of introducing hard substrates. Restor. Ecol.32, e14126. doi: 10.1111/rec.14126
70
Wu Y. L. Lim I. C. L. Li L. Chen L. C. Hsiao P. Y. Lee W. Y. et al . (2024). The evolution of resource management in Taiwanese fisheries: coastal and offshore perspectives. PeerJ12, e18434. doi: 10.7717/peerj.18434
71
Yuan H. Chen P. Li X. (2022). Taxonomic diversity and eco-exergy changes in fishery resources associated with artificial reefs over 14 years in Daya Bay, China. Front. Mar. Sci.9. doi: 10.3389/fmars.2022.1054933
72
Zhou W. Xu P. Ding D. Suo A. Xie M. Zhang L. et al . (2022). Trophic structure of fishes and macroinvertebrates in relation to environmental indicators in artificial reef ecosystems of Pearl River Estuary. Ecol. Indic.138, 108823. doi: 10.1016/j.ecolind.2022.108823
73
Zupan M. Rumes B. Vanaverbeke J. Degraer S. Kerckhof F. (2023). Long-term succession on offshore wind farms and the role of species interactions. Diversity.15, 288. doi: 10.3390/d15020288
Summary
Keywords
artificial reef, fish composition, fisheries conservation, life below water, offshore wind farm
Citation
Shao KT, Chang CH, Chen CY, Ho LT, Shao YT, Chiang H-C, Lee W-N, Tsai HJ, Huang T-Y and Chang C-Y (2026) Spatio-temporal dynamics of fish assemblages at an offshore wind farm and a comparison with mature artificial reefs. Front. Mar. Sci. 13:1733177. doi: 10.3389/fmars.2026.1733177
Received
27 October 2025
Revised
24 December 2025
Accepted
07 January 2026
Published
28 January 2026
Volume
13 - 2026
Edited by
Vitor H. Paiva, University of Coimbra, Portugal
Reviewed by
Vanessa Stelzenmüller, Forestry and Fisheries, Germany
Dara Wilber, Inspire Environmental, United States
Updates
Copyright
© 2026 Shao, Chang, Chen, Ho, Shao, Chiang, Lee, Tsai, Huang and Chang.
This is an open-access article distributed under the terms of the Creative Commons Attribution License (CC BY). The use, distribution or reproduction in other forums is permitted, provided the original author(s) and the copyright owner(s) are credited and that the original publication in this journal is cited, in accordance with accepted academic practice. No use, distribution or reproduction is permitted which does not comply with these terms.
*Correspondence: Kwang Tsao Shao, zoskt@gate.sinica.edu.tw; Yi Ta Shao, itshao@mail.ntou.edu.tw
Disclaimer
All claims expressed in this article are solely those of the authors and do not necessarily represent those of their affiliated organizations, or those of the publisher, the editors and the reviewers. Any product that may be evaluated in this article or claim that may be made by its manufacturer is not guaranteed or endorsed by the publisher.