Abstract
This study aimed to examine the physiological responses of juvenile yellowfin tuna (Thunnus albacares) to short-term cold stress by comparing oxidative stress, metabolic regulation, and immune-related transcriptional responses in red and white muscles under two low-temperature conditions (24 °C and 18 °C) and a control temperature (30 °C). Juvenile tuna were exposed to these temperature conditions for 36 h, and muscle samples were collected at multiple time points to assess enzyme activities, biochemical indicators, and gene expression. Antioxidant enzymes, including superoxide dismutase (SOD), catalase (CAT), and glutathione peroxidase (GSH-Px), exhibited a biphasic response, characterized by an initial upregulation at 18 °C after 12 h followed by a decline under prolonged cold exposure. Elevated malondialdehyde (MDA) levels in the red muscle at 24 h indicated enhanced lipid peroxidation and oxidative stress. At 36 h, increased activities of aspartate aminotransferase (AST), alanine aminotransferase (ALT), and acid phosphatase (ACP) in the red muscle reflected altered metabolic status and enhanced involvement of amino acid-related processes, whereas reduced lactate dehydrogenase (LDH) activity suggested suppression of anaerobic metabolic capacity under prolonged cold stress. Gene expression analysis revealed tissue-specific responses: the red muscle showed a pronounced and sustained induction of hspa1b and acadm, while the white muscle exhibited a faster but less persistent transcriptional response. In addition, the immune-related gene irf3 was downregulated in the red muscle but transiently upregulated in the white muscle. Overall, red muscle displayed slower yet more sustained regulation, whereas white muscle responded more rapidly but exhibited greater sensitivity to cold-induced biochemical perturbations. These findings highlight time- and tissue-specific mechanisms underlying tuna muscle responses to cold stress and provide insights relevant to adaptive management strategies for pelagic fish under climate change scenarios.
1 Introduction
As global climate change intensifies, episodic extreme temperature events, including short-term cold anomalies, have become increasingly frequent in marine ecosystems. Regarding fish, sudden decreases in water temperature represent acute environmental stressors that can disrupt physiological homeostasis and induce rapid physiological, biochemical, and transcriptional responses. These acute physiological responses may influence short-term performance and stress sensitivity of fish under sudden temperature fluctuations (Reynolds and Casterlin, 1980; Refaey et al., 2023). The South China Sea is especially susceptible to the impacts of global climate change (Liu et al., 2025), with the La Niña phenomenon exacerbating local cooling trends and increasing the frequency of climatic anomalies (Zheng et al., 2022). A moderate La Niña event reached its mature phase during the winter of 2020/21, leading to unusually low sea surface temperatures in the central and eastern equatorial Pacific, which in turn trigger global atmospheric anomalies, especially amplifying cold air patterns in Asia (Liu et al., 2025). Water temperature is a key environmental variable determining the ecological distribution, migration patterns, and physiological status of aquatic organisms (Dallas, 2009). Episodic low-temperature events associated with climate variability have been linked to interannual changes in marine community structure in the South China Sea, accompanied by substantial changes in species composition (Wang et al., 2024).
Fish skeletal muscle is typically categorized into two primary types: red muscle and white muscle (Lu et al., 2025). Red muscle is abundant in myoglobin and mitochondria, whereas white muscle contains lower levels of myoglobin (Johnston et al., 1977). As a migratory species, yellowfin tuna requires substantial amounts of fat, glycogen, and myoglobin to sustain high-intensity exercise during long-distance migrations. Consequently, the proportion of red muscle is significantly higher than that of white muscle, reaching up to 48% (Sun et al., 2024). This unique muscle tissue characteristic enables yellowfin tuna to maintain high-speed movement over extended periods (Zapata et al., 2011). In contrast, white muscle is primarily associated with brief bursts of explosive movement, with lower oxygen requirements and higher glycogen reserves, making it suitable for rapid, short-distance swimming (Videler, 2011). Fish rely on white muscle for brief, intense movements during activities such as escape responses or predation, while it is rarely engaged during routine swimming (Videler, 2011). The response of red and white muscle to cold stress differs significantly. Red muscle shows heightened sensitivity to cold stress, evidenced by the upregulation of enzymes related to aerobic function, accompanied by enhanced expression of immune-related factors (Dieter et al., 1970). In contrast, white muscle, with lower mitochondrial density and reduced reactive oxygen species production, exhibits a weaker or delayed antioxidant stress response (Clarke, 1991). These differences in response reflect their distinct roles in physiological function and stress adaptation.
Investigating the impact of cold stress on the red and white muscles of yellowfin tuna (Thunnus albacares) is essential for advancing the aquaculture industry. While earlier research has provided partial insights into the antioxidant and metabolic regulation mechanisms in fish under cold stress, the significant structural and functional differences between red and white muscle tissues may lead to different response patterns and adaptation strategies when facing acute cold challenges. Furthermore, research on the response of red and white muscle in yellowfin tuna to acute cold stress are still limited and lack a comprehensive and systematic analysis. Hence, this research concentrates on juvenile yellowfin tuna and employs experimentally controlled low-temperature conditions, with 18 °C selected to simulate acute cold stress rather than to reflect natural habitat temperatures. Earlier studies have indicated that the water temperature in the South China Sea can drop to about 18 °C under severe cold weather events (Yan et al., 2015), and this temperature was therefore selected as an experimental extreme to simulate acute cold stress under controlled conditions rather than to represent routine environmental exposure in the wild.
Yellowfin tuna (Thunnus albacares) is a huge migratory pelagic species observed across tropical and subtropical waters, particularly in the South China Sea, East China Sea, and along the coast of Taiwan in China (Zhang et al., 2023). Unlike fully ectothermic fishes, yellowfin tuna is a regionally endothermic species, possessing a well-developed countercurrent heat exchange system in its red musculature that enables the maintenance of elevated muscle and visceral temperatures relative to ambient water conditions (Graham and Dickson, 2004). Despite this ability, yellowfin tuna remains susceptible to rapid changes in ambient water temperature, which can elicit complex metabolic and physiological responses. These responses emphasize the species’ reliance on highly coordinated physiological regulation to adapt to environmental changes (Huang et al., 2025a). The health-related adjustments of yellowfin tuna to cold stress offer an important framework for comprehending the ecological resilience of huge pelagic fish in harsh environments, with broad implications for their ecological adaptability and population dynamics in the context of global climate change. This research thoroughly examines the response of juvenile yellowfin tuna to acute cold stress, focusing on the differential adaptive mechanisms in red and white muscle tissues, encompassing physiology, metabolism, and immunity. Using two experimentally imposed low-temperature treatments (24 °C and 18 °C) and a control temperature (30 °C), we investigate the physiological and transcriptional responses of juvenile yellowfin tuna to experimentally imposed low water temperature exposure. The research seeks to clarify the oxidative stress response, metabolic regulatory pathways, and immune mechanisms in the red and white muscles under acute cold stress, highlighting the physiological and molecular regulatory differences between these muscle tissues at varying stress intensities. The findings will deepen our insight of tissue-specific adaptation mechanisms in migratory pelagic fish and offer a theoretical foundation for resource management and long-term viability growth of tuna aquaculture in harsh climate conditions.
2 Materials and methods
2.1 Fish used in the experiment and study design
Juvenile yellowfin tuna (Thunnus albacares), totaling 180 individuals with a fork length of 30.26 ± 2.79 cm and a body weight of 384.88 ± 58.04 g, were supplied by the Tropical Marine Fisheries Research and Development Center of the South China Sea Fisheries Research Institute, where they were farmed in net cages in the waters off Xincun Town, Lingshui Li Autonomous County, Hainan Province. The experimental fish were housed in circular recirculating aquaculture tanks, each with a radius and height of 1.5 m. Each tank was filled with 10 m³ of filtered seawater, and the water exchange rate was maintained at 300% daily. Before the experiment, the fish were kept in tanks for a 7-day acclimatization period. During this period, every day at 8:00 AM, they were given fresh mixed fish (2 × 2 cm) at a feeding rate of 5-8% of their body weight until they were satiated. No feeding took place on the day prior to or during the experiment. The experimental setup involved three distinct groups: a control group (CG) maintained at 30 °C, a low-temperature group (LT) set at 24 °C, and an ultra-low-temperature group (ULT), in which the water temperature was set at 18 °C. Each treatment group consisted of three independent tanks, with 15 fish per tank, and the experiment was conducted over a 36-hour period to assess short-term responses to low-temperature exposure. The environmental conditions for aquaculture were controlled with a salinity of 32‰, dissolved oxygen levels exceeding 7.50 mg/L, a pH of 7.93 ± 0.12 and ammonia nitrogen levels less than 0.1 mg/L, and nitrite nitrogen concentrations under 0.05 mg/L. For the LT and ULT groups, the water temperature was gradually diminished by 2 °C per hour using a Haier brand chiller (China) until the target temperatures were attained. The timer was then activated once the desired temperature was reached. Thus, the 0 h sampling point was defined as the moment when the ambient water temperature in each group reached the target level in each treatment group, marking the onset of short-term low-temperature exposure. Samples were collected at the time points of 0, 12, 24, and 36 hours. During the experimental period, no mortality was observed in any treatment group. At each sampling time point, three fish were randomly selected from each tank and euthanized with an overdose of MS-222 (Gao et al., 2025; Topic Popovic et al., 2012), resulting in a total of nine fish sampled per treatment at each time point. Red and white muscle tissues were quickly removed after the fish loss of equilibrium, and following RNA extractions and enzyme activity assays were performed. The tissue samples were immediately flash-frozen in liquid nitrogen and preserved at -80 °C for subsequent analysis.
2.2 Assessment of antioxidant activity and metabolic enzyme function in red and white muscle tissues
Approximately 0.1 g samples of red and white muscle tissues from each juvenile yellowfin tuna were collected and transferred into individual 2 mL centrifuge tubes. Subsequently, physiological saline solution (0.86%) was added at a ratio of nine parts solution to one part tissue volume. The samples were subsequently homogenized on ice with a handheld Prima PB100 homogenizer (Gloucester, England). After homogenization, samples were subjected to centrifugation at 3500 × g for 10 min, and the resulting supernatants were carefully transferred into new tubes and maintained at -80 °C pending further assays of antioxidant capacity and metabolic enzyme activities. All samples were processed on ice immediately after tissue collection and stored at −80 °C prior to analysis. No visible hemolysis or protein degradation was observed, and all enzyme assays were conducted within the recommended storage period specified by the manufacturer.
The antioxidant parameters analyzed in both red and white muscle tissues included superoxide dismutase (SOD), catalase (CAT), malondialdehyde (MDA), and glutathione peroxidase (GSH-PX). These parameters were quantified using commercially available assay kits obtained from Nanjing Jiancheng Bioengineering Institute (Nanjing, China). Specifically, kits employed were SOD (Cat. No. A001-3-2), CAT (Cat. No. A007-1-1), MDA (Cat. No. A003-1-2), and GSH-PX (Cat. No. A005-1-2). Additionally, protein concentrations within the homogenates were assessed with a BCA protein assay kit (Cat. No. A045-4-2, Nanjing Jiancheng Bioengineering Institute), following the provided protocol.
Metabolic enzyme activities measured in this study included aspartate aminotransferase (AST), lactate dehydrogenase (LDH), alanine aminotransferase (ALT), and acid phosphatase (ACP). These enzyme activities were also quantified using commercial assay kits sourced from Nanjing Jiancheng Bioengineering Institute: AST (Cat. No. C010-2-1), LDH (Cat. No. A020-2-2), ALT (Cat. No. C009-2-1), and ACP (Cat. No. A060-2-1). Measurements were carried out according to the instructions provided by the manufacturer, and protein content in the homogenates was determined using the aforementioned BCA protein assay kit.
2.3 Quantitative real-time PCR analysis of selected genes
Total RNA was isolated from both red and white muscle tissues using the Thermo Scientific GeneJET RNA Purification Kit (Waltham, MA, USA), following the manufacturer’s instructions. The quality, concentration, and purity of the RNA were assessed by agarose gel electrophoresis, Nanodrop2000 (Thermo Fisher Scientific, Waltham, MA, USA), and the 2100 Bioanalyzer (Agilent Technologies, Waldbronn, Germany) (Hong et al., 2021). Only RNA of high integrity (OD260/280 = 1.8 ~ 2.2, OD260/230 ≥ 2.0, 28S: 18S ≥ 1.0, total RNA > 10 μg) was used for subsequent analysis. Two microliters of RNA were used for cDNA synthesis according to the protocol of the EasyScript All-in-One First-Strand cDNA Synthesis SuperMix for qPCR (One-Step gDNA Removal) kit. The resultant cDNA was used as a template for gene expression analysis.
For immune gene expression quantification, the gene expression level at 0h in the control group (CG0h) was used as the reference baseline for relative comparison among treatments and time points. This normalization strategy was applied to facilitate comparison of relative transcriptional responses following exposure to target temperatures, rather than to imply biological equivalence of the 0 h samples across groups. Four stress- and metabolic-related genes were selected as representative molecular indicators for validation using quantitative real-time PCR (RT-qPCR) with a real-time qPCR system (Analytik Jena GmbH, Germany) and SYBR Green (Tiangen Biotech Co., Ltd., China). The selected genes were chosen based on their well-established involvement in stress response, immune regulation, and energy metabolism in teleost fishes, and their documented sensitivity to temperature-related stress in previous studies (Tu et al., 2023; Huang et al., 2025b, 2025a; Mang et al., 2024). Primers were designed using Primer Premier 5 software (Table 1) (Nasution et al., 2022). The PCR reaction mixture (20 μL total) included 10 μL of 2× RealUniversal PreMix, 0.6 μL of each primer (10 μM), and 2 μL of the diluted cDNA. The amplification conditions incorporated an initial denaturation step at 95 °C for 15 minutes, followed by 40 cycles of amplification (95 °C for 10 seconds, 58 °C for 20 seconds, and 72 °C for 30 seconds). A melt curve analysis was performed after each cycle to verify the specificity of the product and ensure there were no primer dimers. Each experiment also included a no-template control to detect potential contamination in the reaction mixture. Relative mRNA expression levels of the target genes were calculated using the 2-ΔΔCt method, with β-actin as the reference gene and normalization to the 0h control group. β-actin was used as the reference gene for RT-qPCR normalization (Han et al., 2025; Ma and Luo, 2020; Purohit et al., 2016). The coefficient of variation (CV) calculated using all samples was 6.87% in red muscle and 5.18% in white muscle of β-actin. Amplification efficiencies of all primer sets, determined from standard curves, ranged from 90% to 110%, and the corresponding standard curves showed high linearity with Pearson correlation coefficient (R²) greater than 0.97.
Table 1
| Gene abbreviation | Primer sequence (5’–3’) | Amplicon size (bp) | Accession NO |
|---|---|---|---|
| β-actin | F: TCCCTGTATGCCTCTGGT R: TGATGTCACGCACGATTT |
217 | XM_044332395.1 |
| hspa1b | F: TGGGCACCACCTACTCCT R: GGTTCTTGGCAGCATCTC |
141 | XM_044351072.1 |
| blmh | F: CAGTTCAGTCGTGGATTT R: GTCTGTGCGTGTTTCTTT |
81 | OU607597.1 |
| Irf3 | F: AGCCAAACTGACCCAACG R: ATTCTATTCGCCCACCTC |
215 | OU607611.1 |
| acadm | F: AGAAGAGTTGGCTTATGG R: TGAGAAGTGGTGGTAGGA |
184 | OU607603.1 |
Primer sequences used for specific gene analysis by qRT-PCR.
2.4 Calculations and statistical analysis
Data were analyzed statistically using SPSS version 26.0 software (IBM Corp., Armonk, NY, USA). Results were presented as mean ± standard deviation (SD). For statistical analyses, data were averaged at the tank level. At each time point, each experimental group included three tanks, and tank-level means were used for analysis. The Shapiro–Wilk test was employed to verify data normality, and Levene’s test was used to confirm the homogeneity of variances prior to further analysis. A two-way analysis of variance (ANOVA) was conducted using tank-level means as the experimental unit to determine the effects of temperature (group), exposure duration (time), and their potential interaction on the parameters measured. If significant differences or interactions were found, multiple comparisons were carried out using Tukey’s post hoc test. Independent-sample t-tests were utilized for comparisons between two groups when appropriate. Graphical representations were created using Origin 2021 (OriginLab, Northampton, MA, USA). Statistical significance was set at p < 0.05. Statistical analyses were conducted separately for each response variable (enzyme activity or gene expression) using predefined experimental factors (temperature and time).
2.5 Clustering heatmap analysis
Clustering heatmap analysis of enzyme activities was performed to visualize relative patterns of variation among treatments and time points. Prior to clustering, enzyme activity data were normalized using Z-score transformation within each enzyme to minimize scale effects. Hierarchical clustering was conducted using Euclidean distance as the distance metric and the complete linkage method. Heatmaps were generated using Origin 2021 (OriginLab, Northampton, MA, USA).
3 Results
3.1 Effect of cold stress on antioxidant indicators in the red muscle tissue of juvenile yellowfin tuna
The impact of cold stress on antioxidant parameters in the red muscle of juvenile yellowfin tuna are shown in Figures 1A–D. Two-way ANOVA indicated that group (temperature), sampling time, and their interaction had a notable impact on SOD, CAT, MDA, and GSH-PX activities (Supplementary Tables S1–S4; p < 0.05).
Figure 1
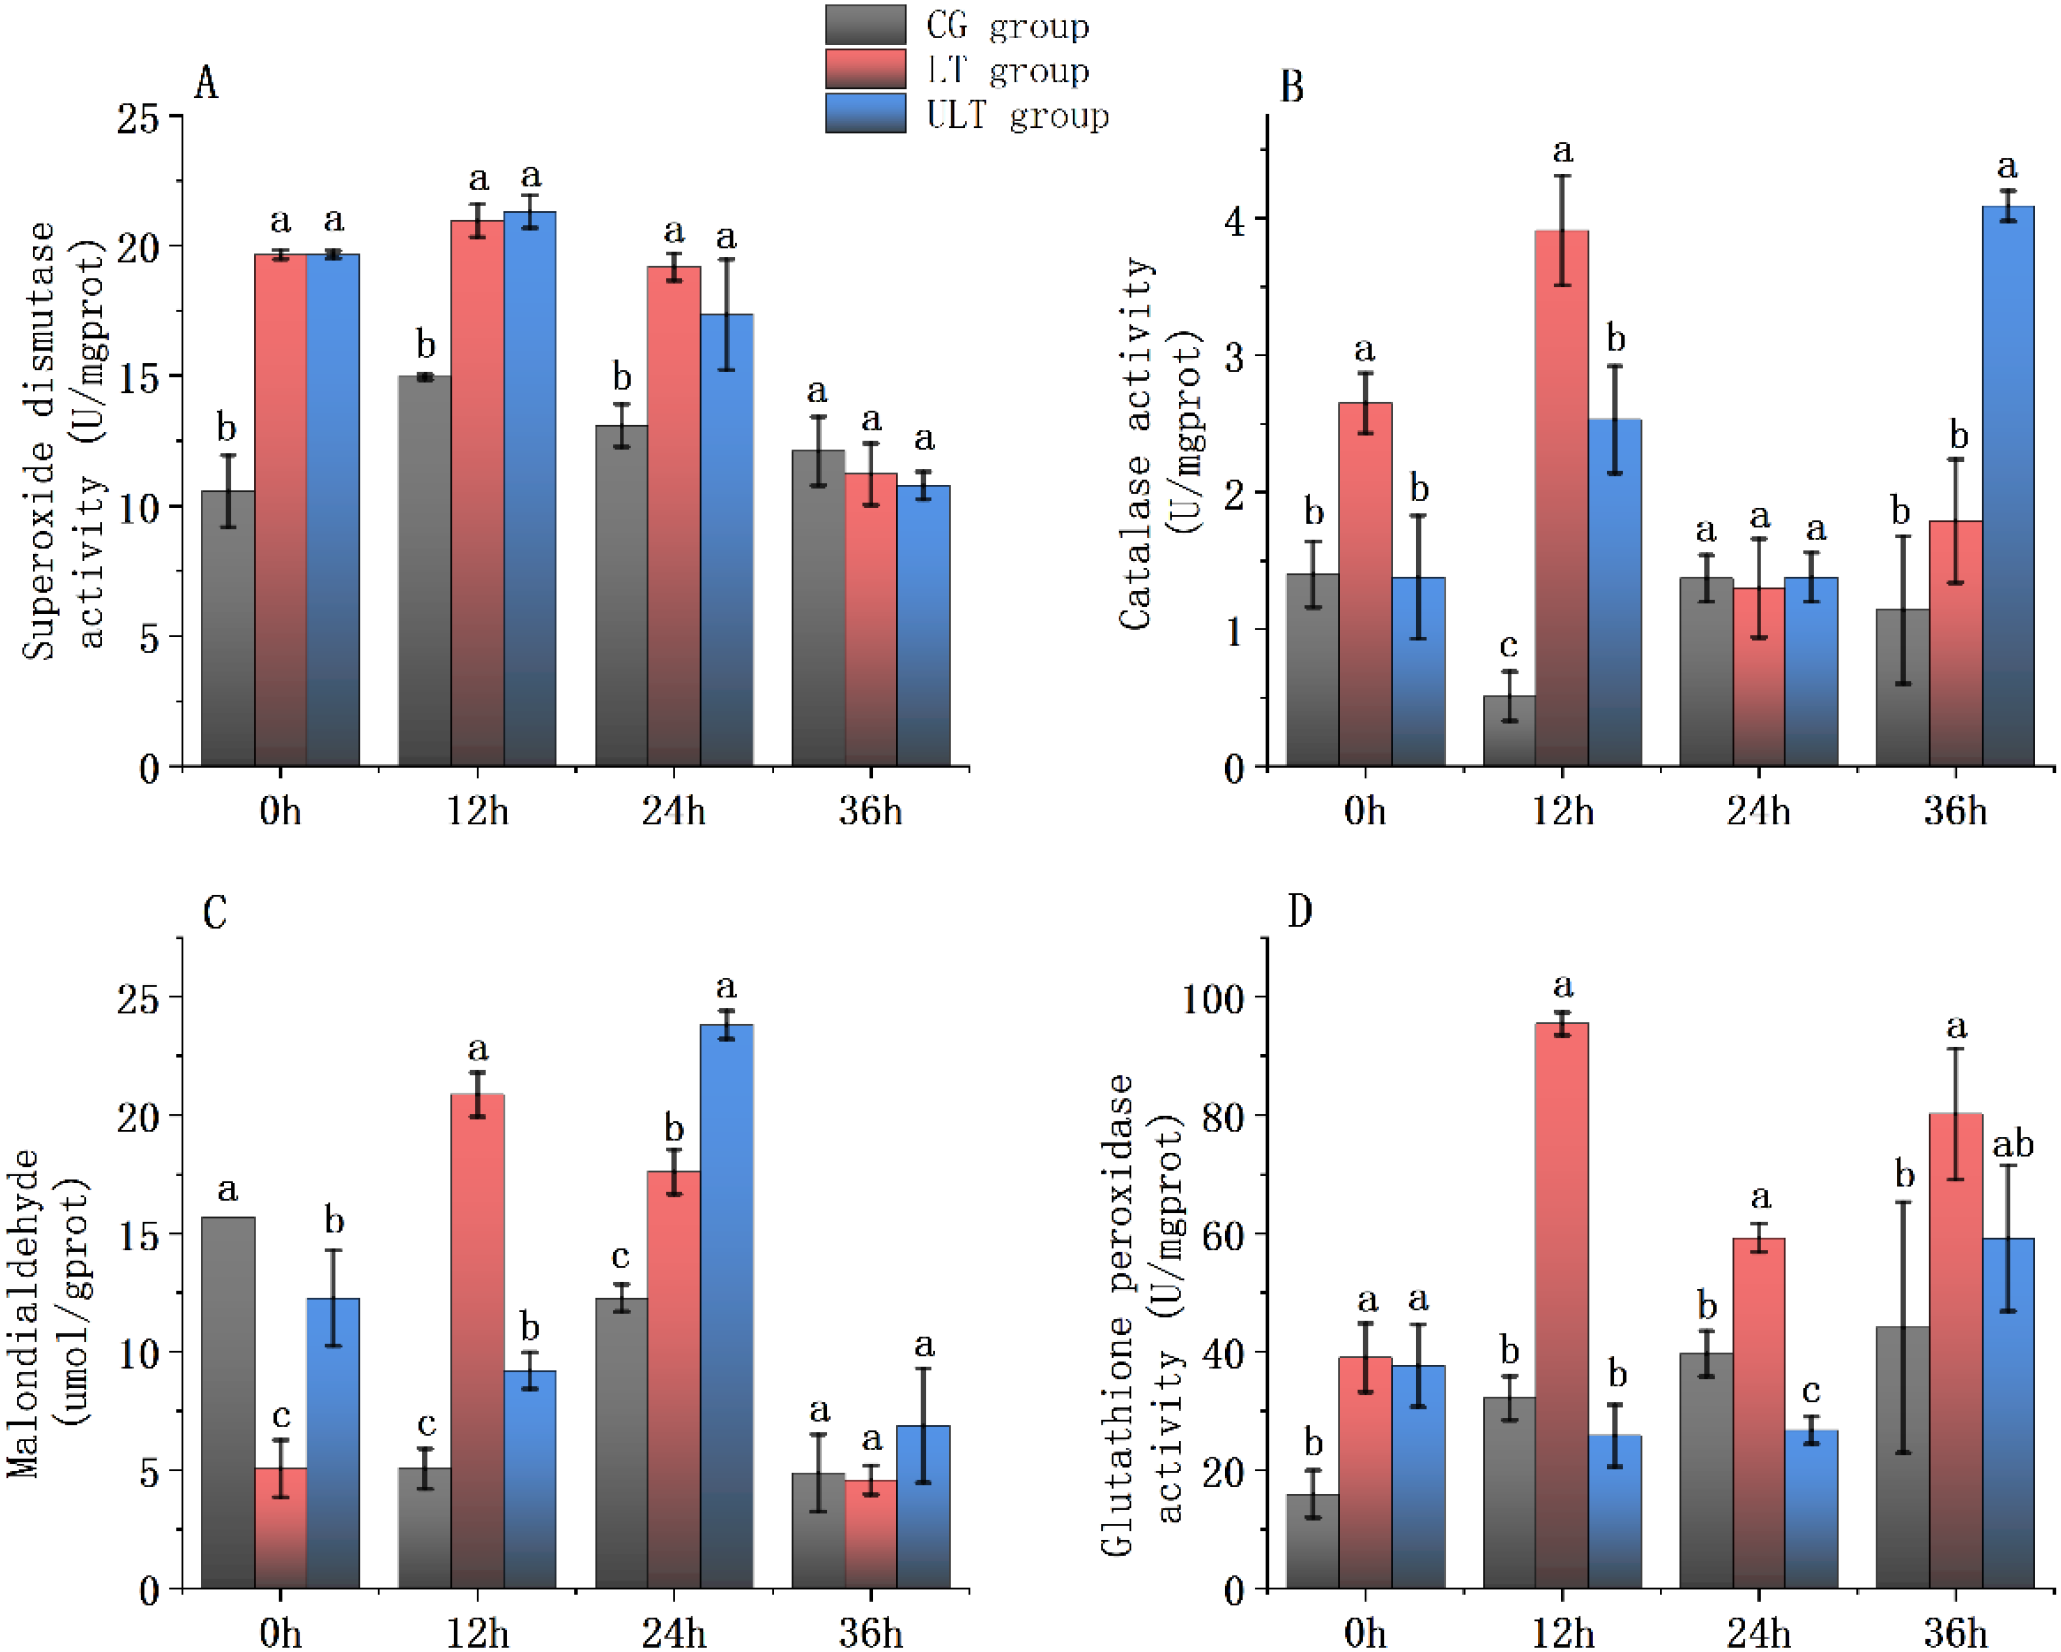
Immediate impact of cold stress on antioxidant enzyme activity in the red muscle tissue of juvenile Thunnus albacares [(A) SOD activity; (B) CAT activity; (C) MDA content; (D) GSH-PX activity]. Different letters in the figure indicate notable differences between groups at the same time interval (p < 0.05).
For SOD activity (Figure 1A), CG showed its lowest value at 0h (10.57 ± 1.38 U/mg protein), increased at 12 h, and declined thereafter. In contrast, LT and ULT groups showed an initial increase, which was subsequently followed by a decrease, with ULT peaking at 12 h (21.31 ± 0.63 U/mg protein). Post hoc analysis revealed that SOD activity in LT and ULT groups was notably higher compared to the CG at 0h, 12 h, and 24 h (p < 0.05), while no significant difference was detected among groups at 36 h (p > 0.05).
For CAT activity (Figure 1B), CG displayed a fluctuating pattern, with the lowest activity recorded at 12 h (0.51 ± 0.18 U/mg protein). LT and ULT groups displayed a U-shaped pattern, and ULT reached its highest level at 36 h (4.09 ± 0.11 U/mg protein). At 0h, CAT activity was notably higher in LT than CG (p < 0.05), while ULT did not differ from CG (p > 0.05). At 12 h, CAT activity in both the LT and ULT groups was notably higher than that in the CG group (p < 0.05). By 24 h, no significant differences were detected among the groups (p > 0.05). At 36 h, ULT remained significantly higher than CG (p < 0.05), while LT and CG showed no noticeable difference (p > 0.05).
For MDA content (Figure 1C), CG exhibited significantly lower values at 12 h, 24 h, and 36 h compared with 0 h (p < 0.05). LT showed a peak at 12 h followed by a decline to the lowest value at 36 h (4.58 ± 0.61 μmol/g protein). ULT followed a decreasing–increasing–decreasing pattern, peaking at 24 h (23.81 ± 0.60 μmol/g protein). Post hoc tests showed that at 0 h, MDA content in LT and ULT groups was significantly reduced compared to the CG (p < 0.05). At 12 h and 24 h, MDA content in LT and ULT was noticeably greater than CG (p < 0.05), whereas no noticeable difference was found between the groups at 36 h (p > 0.05).
For GSH-PX activity (Figure 1D), CG showed the lowest activity at 0 h (15.95 ± 3.99 U/mg protein) and increased gradually with time. LT exhibited sustained elevation from 12 h to 36 h, peaking at 12 h (95.46 ± 1.95 U/mg protein). ULT showed an initial decline, which was then followed by an increase. At 0h, GSH-PX was noticeably greater in both the LT and ULT groups than CG (p < 0.05). At 12 h, 24 h, and 36 h, LT remained noticeably higher than CG (p < 0.05). For ULT, no significant differences were found compared to CG at 12 h and 36 h (p > 0.05), whereas at 24 h, GSH-PX activity was notably lower than in CG (p < 0.05).
3.2 Effect of cold stress on metabolic enzyme activity in the red muscle tissue of juvenile yellowfin tuna
The impact of cold stress on key metabolic enzyme activities (AST, LDH, ALT, and ACP) in the red muscle tissue of juvenile yellowfin tuna are presented in Figures 2A–D. Results from a two-way ANOVA indicated that the factors of group (temperature), time, and their interaction had a significant influence on all four enzymes (refer to Supplementary Tables S5–S8; p < 0.05).
Figure 2
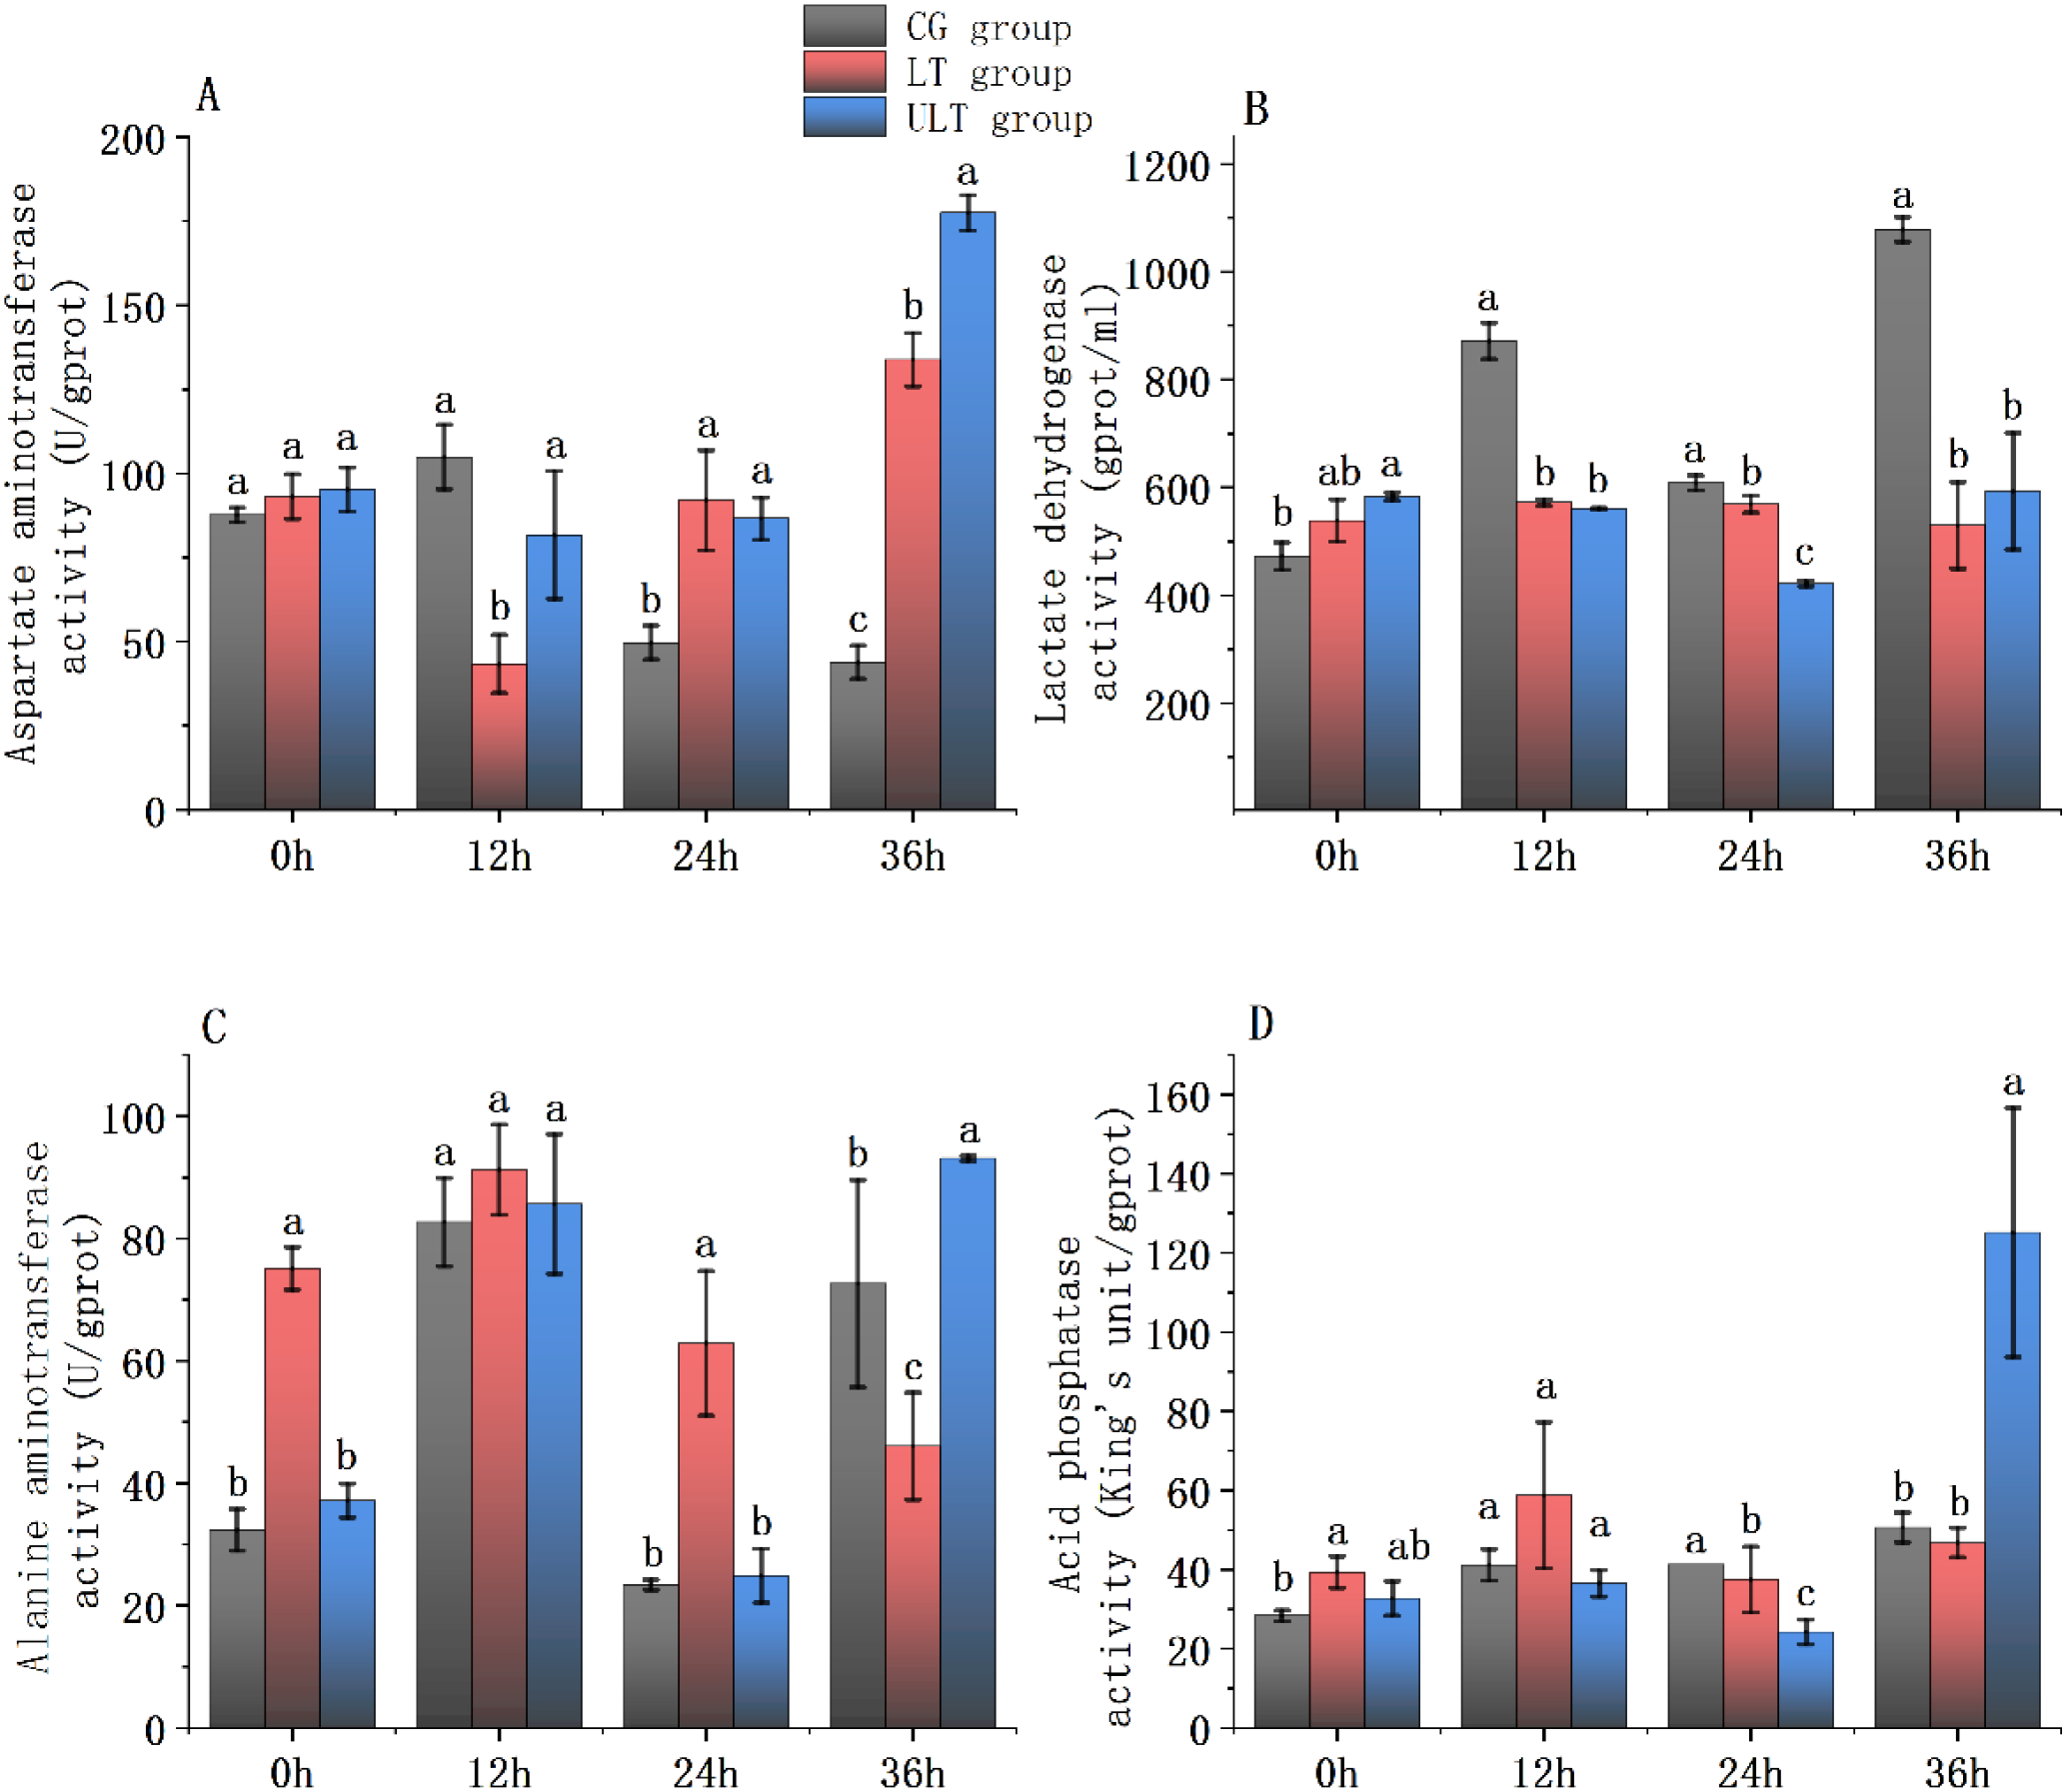
Immediate impact of cold stress on metabolic enzyme activity in the red muscle tissue of juvenile Thunnus albacares [(A) AST activity; (B) LDH activity; (C) ALT activity; (D) ACP activity]. Different letters in the figure indicate notable differences between groups at the same time interval (p < 0.05).
For AST activity (Figure 2A), CG showed a moderate fluctuation over time, whereas LT and ULT groups displayed contrasting patterns, with LT decreasing at 12 h and then increasing, and ULT steadily rising to the highest level at 36 h (p < 0.05). Post hoc analyses showed no noticeable differences between groups at 0 h (p > 0.05). At 12 h, AST activity in LT was noticeably decreased compared to CG (p < 0.05), while ULT did not differ from CG (p > 0.05). At 24 h and 36 h, both LT and ULT exhibited significantly higher levels than CG (p < 0.05), with ULT reaching the maximum value (177.46 ± 5.25 U/g protein) at 36 h.
For LDH activity (Figure 2B), CG exhibited time-dependent fluctuations, peaking at 36 h (1078.4 ± 22.83 U/g protein). In contrast, LT and ULT groups showed a relatively stable but lower activity, with ULT reaching the minimum at 24 h (422.14 ± 5.65 U/g protein). At 0 h, LDH activity in ULT was noticeably greater compared to CG (p < 0.05), while LT did not differ (p > 0.05). At 12 h, 24 h, and 36 h, both LT and ULT showed noticeably lower values than CG (p < 0.05).
For ALT activity (Figure 2C), CG and ULT showed fluctuating trends, with ULT peaking at 12 h (93.1 ± 0.44 U/g protein). LT initially increased but declined thereafter. At 0 h and 24 h, ALT activity in LT was noticeably greater compared to CG (p < 0.05), whereas ULT did not differ (p > 0.05). At 12 h, no noticeable differences were found between the three groups (p > 0.05). At 36 h, ALT activity in ULT was noticeably higher compared to CG (p < 0.05), whereas LT was notably reduced compared to CG (p < 0.05).
For ACP activity (Figure 2D), all groups showed time-dependent fluctuations, with a pronounced increase observed in ULT at 36 h (125.15 ± 31.53 U/g protein; p < 0.05). At 0h, LT was noticeably greater than CG (p < 0.05), while ULT and CG did not differ (p > 0.05). At 12 h, no noticeable differences were found between the groups (p > 0.05). At 24 h, both LT and ULT were significantly lower than CG (p < 0.05). At 36 h, ULT was noticeably greater compared to CG (p < 0.05), while LT and CG were not different (p > 0.05).
3.3 Effect of cold stress on antioxidant indicators in the white muscle tissue of juvenile yellowfin tuna
The impact of cold stress on antioxidant parameters (SOD, CAT, MDA, and GSH-PX) in the white muscle of juvenile yellowfin tuna are presented in Figures 3A–D. Two-way ANOVA showed a significant impact of group (temperature), time, and their interaction on all four parameters (Supplementary Tables S9–S12; p < 0.05).
Figure 3
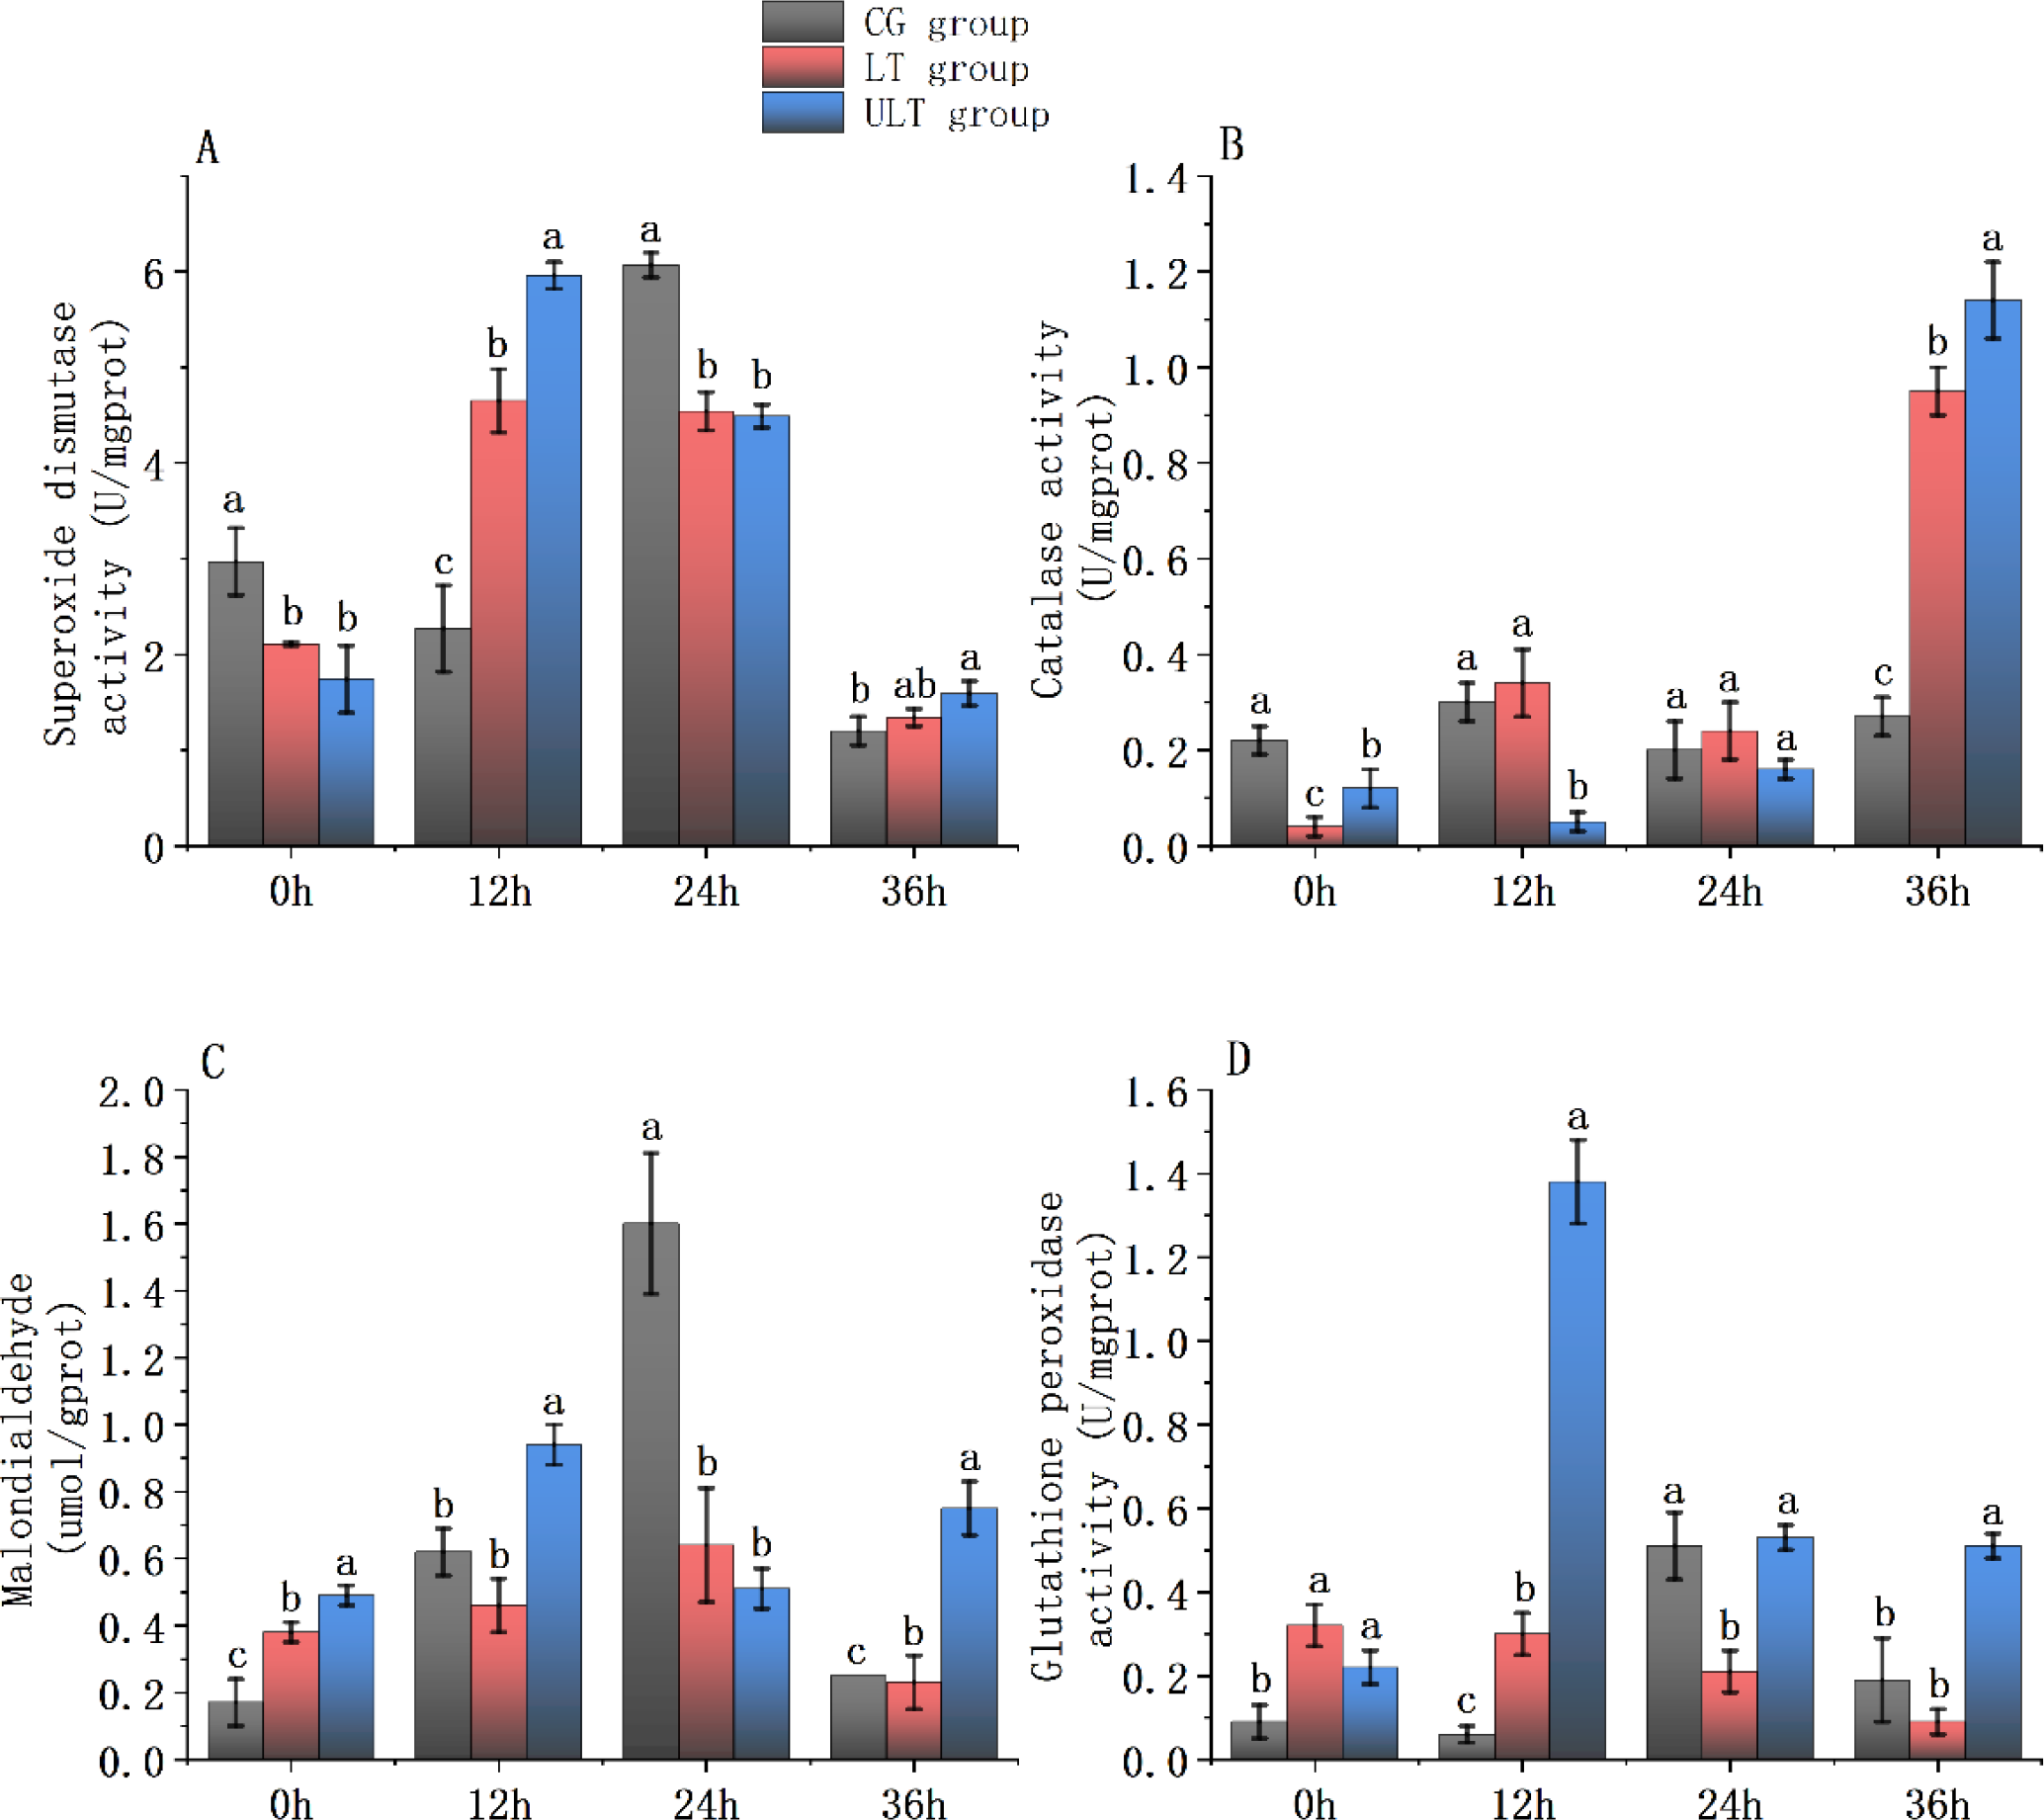
Immediate impact of cold stress on antioxidant enzyme activity in the white muscle tissue of juvenile Thunnus albacares [(A) SOD activity; (B) CAT activity; (C) MDA content; (D) GSH-PX activity]. Different letters in the figure indicate notable differences between groups at the same time interval (p < 0.05).
For SOD activity (Figure 3A), CG showed a peak at 12 h (6.07 ± 0.13 U/mg protein), followed by a sharp decline to its lowest value at 36 h (1.2 ± 0.15 U/mg protein). LT and ULT groups showed an initial rise followed by a decrease, with ULT showing consistently higher values than LT at later time points. Post hoc analysis revealed that SOD activity in LT and ULT groups was noticeably reduced compared to CG at 0 h and 24 h (p < 0.05). At 12 h, SOD activity in both LT and ULT was noticeably greater compared to CG (p < 0.05), while at 36 h only ULT displayed a notably greater activity compared to CG (p < 0.05).
For CAT activity (Figure 3B), all groups showed time-dependent fluctuations, with a marked increase in ULT at 36 h, reaching its highest value (1.14 ± 0.08 U/mg protein). At 0 h, CAT activity in LT and ULT was notably lower compared to CG (p < 0.05). At 12 h, CAT activity in ULT remained significantly decreased compared to the CG (p < 0.05), whereas no difference was found between LT and CG (p > 0.05). No group differences were detected at 24 h (p > 0.05), but at 36 h, CAT activity in both LT and ULT groups was noticeably greater compared to CG (p < 0.05).
For MDA content (Figure 3C), CG and LT groups both showed an initial rise followed by a decrease, with CG peaking at 24 h (1.6 ± 0.21 μmol/g protein). ULT displayed a more variable trend. Post hoc tests showed that at 0h and 36 h, MDA content in LT and ULT was noticeably greater compared to CG (p < 0.05). At 12 h, MDA in ULT was significantly higher while LT was notably lower than CG (p < 0.05). At 24 h, both LT and ULT were noticeably decreased compared to CG (p < 0.05).
For GSH-PX activity (Figure 3D), CG and ULT showed fluctuating activities, with ULT reaching its maximum at 12 h (1.38 ± 0.10 U/mg protein). LT exhibited a gradual decline over time. At 0 h and 12 h, both LT and ULT had significantly greater GSH-PX activity compared to CG (p < 0.05). At 24 h, LT was noticeably decreased compared to the CG (p < 0.05), whereas ULT showed no significant difference (p > 0.05). At 36 h, ULT was noticeably greater compared to CG (p < 0.05), whereas LT and CG were not different (p > 0.05).
3.4 Effect of cold stress on metabolic enzyme activity in the white muscle tissue of juvenile yellowfin tuna
The effects of cold stress on key metabolic enzyme activities (AST, LDH, ALT, and ACP) in the white muscle tissue of juvenile yellowfin tuna are shown in Figures 4A–D. Two-way ANOVA revealed significant impact of group (temperature), time, and their interaction on all four enzymes (Supplementary Tables S13–S16; p < 0.05).
Figure 4
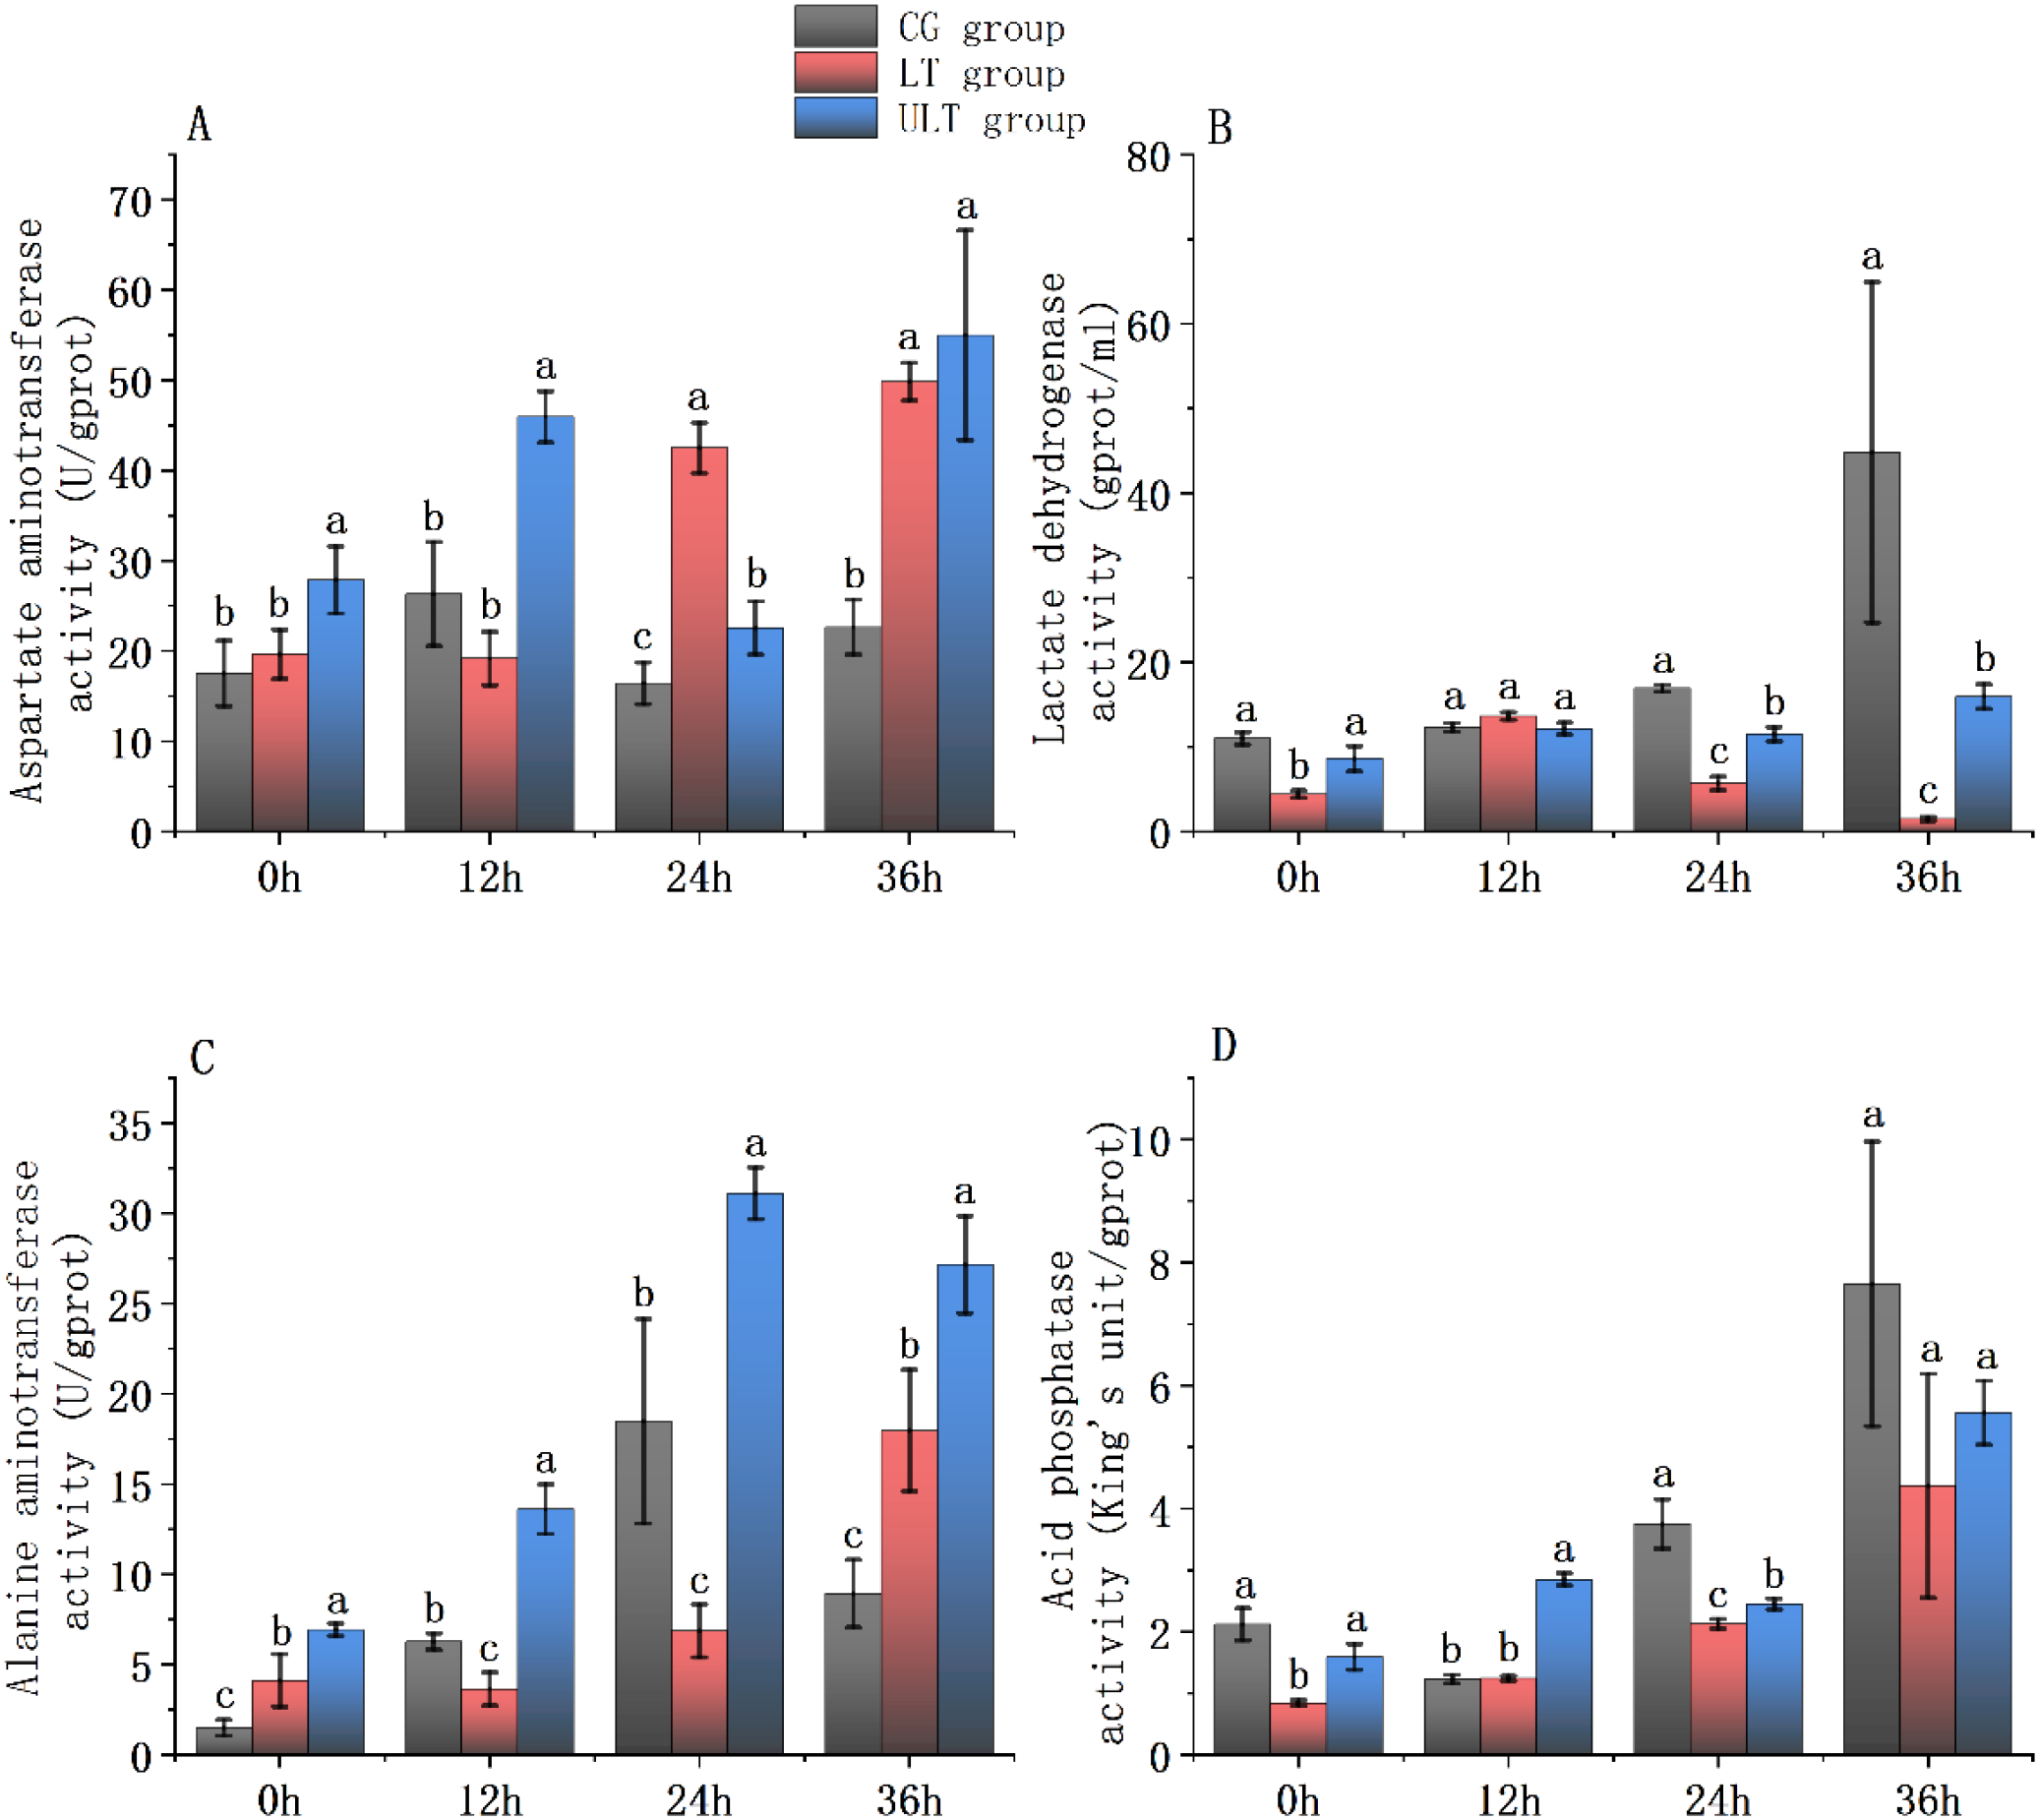
Immediate impact of cold stress on metabolic enzyme activity in the white muscle tissue of juvenile Thunnus albacares [(A) AST activity; (B) LDH activity; (C) ALT activity; (D) ACP activity]. Different letters in the figure indicate notable differences between groups at the same time interval (p < 0.05).
For AST activity (Figure 4A), CG and ULT groups exhibited time-dependent fluctuations, with ULT reaching the highest value at 36 h (54.98 ± 11.62 U/g protein). In LT, AST activity decreased initially and then increased. Post hoc tests showed that at 0h and 12h, AST activity in ULT was notably greater compared to CG (p < 0.05), while LT did not differ from CG (p > 0.05). At 24 h and 36 h, AST activity in both LT and ULT groups was noticeably greater compared to CG (p < 0.05).
For LDH activity (Figure 4B), CG showed a gradual increase over time, peaking at 36 h (44.8 ± 20.12 U/g protein), while LT displayed an initial increase followed by a sharp drop, reaching a very low activity level at 36 h (1.47 ± 0.25 U/g protein). ULT showed moderate fluctuations. At 0 h, LDH activity in LT was noticeably decreased compared to CG (p < 0.05), whereas ULT did not differ (p > 0.05). At 12 h, no noticeable differences were found between the groups (p > 0.05). At 24 h and 36 h, both LT and ULT groups had noticeably lower LDH activity than the CG (p < 0.05).
For ALT activity (Figure 4C), CG and ULT groups displayed an initial rise followed by a decline, with ULT peaking at 24 h (31.11 ± 1.44 U/g protein). LT showed the opposite trend, decreasing initially and then increasing. Post hoc analysis revealed that at 0 h and 36 h, ALT activity in both LT and ULT groups was noticeably greater compared to CG (p < 0.05). At 12 h and 24 h, ULT activity was noticeably greater (p < 0.05), whereas LT activity was significantly decreased compared to CG (p < 0.05).
For ACP activity (Figure 4D), CG displayed a decline followed by a rise, peaking at 36 h (7.65 ± 2.13 U/g protein). LT showed a gradual increase, whereas ULT fluctuated over time. At 0 h, ACP activity in LT was significantly decreased compared to CG (p < 0.05), whereas ULT showed no difference (p > 0.05). At 12 h, ACP activity in ULT was noticeably higher compared to CG (p < 0.05), while LT did not differ from CG (p > 0.05). At 24 h, both LT and ULT were noticeably decreased compared to CG (p < 0.05). At 36 h, no notable group differences were found (p > 0.05).
3.5 Enzyme activity clustering heatmap analysis
Based on the clustering heatmap analysis of enzyme activity in red muscle tissue (Figure 5), several descriptive clustering patterns were observed. GSH-PX and ALT showed similar patterns, with the LT group experiencing an increase at 12 h followed by a decrease at 36 h. Both enzymes in the LT group showed a pattern of initial rise followed by a decrease, with peak values observed at 12 h. CAT and AST displayed similar trends, with fluctuations observed in the ULT group over time, reaching the highest value in the ULT group at 36 h. ALT and ACP also exhibited similar trends, with both enzymes showing a fluctuating growth pattern in all three groups, and a general increase relative to 0 h over time.
Figure 5
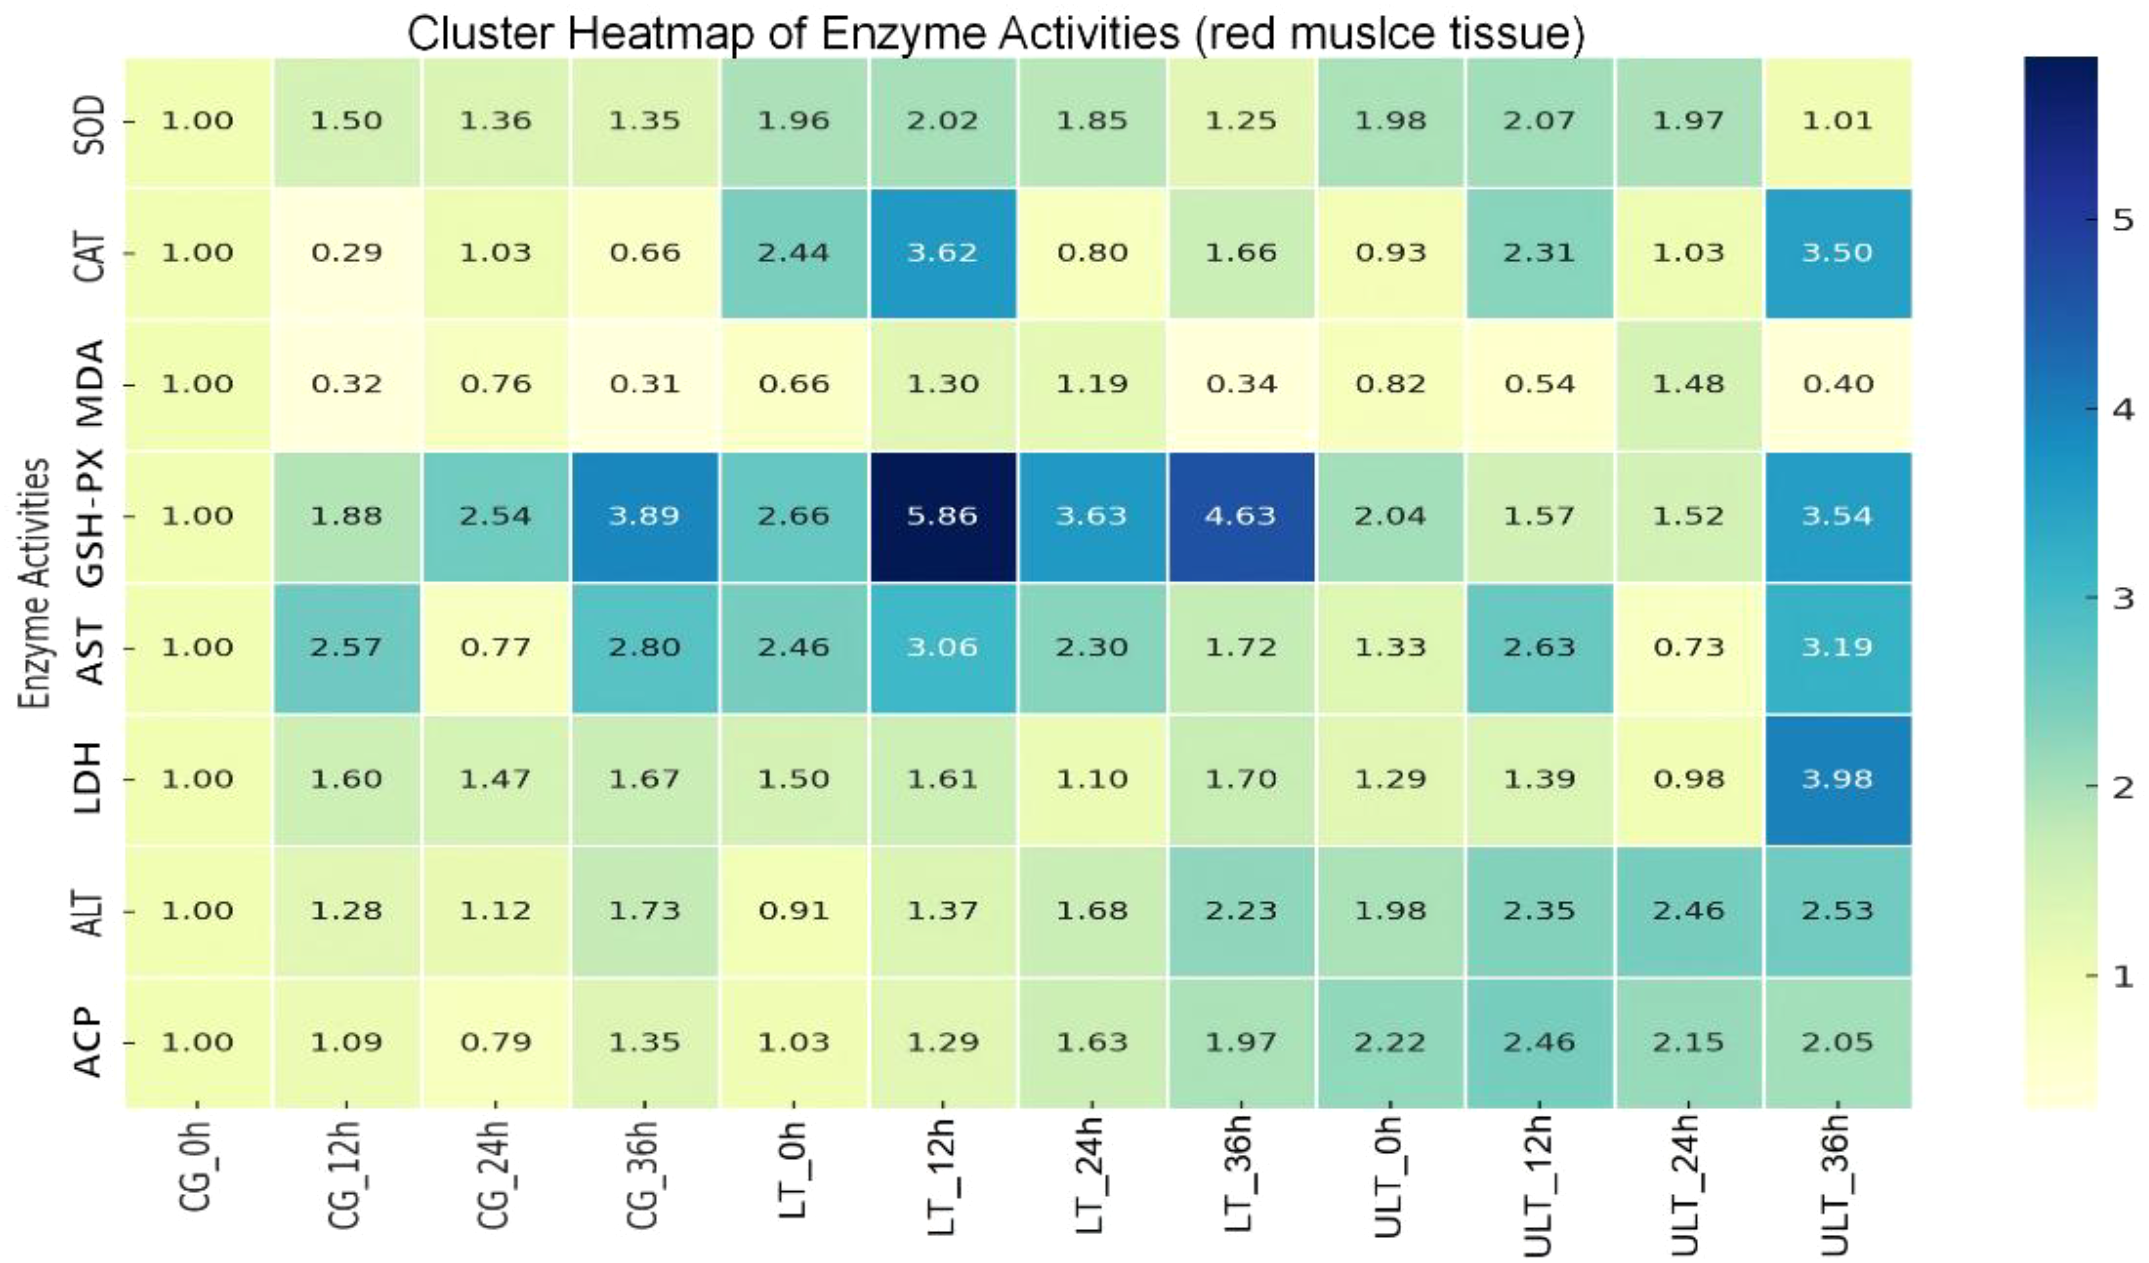
Antioxidant and metabolic enzyme activity clustering in juvenile Thunnus albacares under acute cold stress, with normalization applied for comparison.
The clustering heatmap analysis of enzyme activity in white muscle tissue (Figure 6) revealed four distinct sub-cluster trends. SOD, MDA, and GSH-PX displayed similar trends, with increases observed at 12 h and 24 h in all three groups. In the CG group, both SOD and MDA reached peak values at 24 h, while the ULT group for GSH-PX reached its peak at 12 h. AST and ALT exhibited similar trends, with both enzymes increasing over time in the LT and ULT groups, reaching their highest values at 36 h and 24 h, respectively, in the ULT group. CAT and LDH showed similar trends, with both enzymes exhibiting an increase only at 36 h, reaching their peak values.
Figure 6
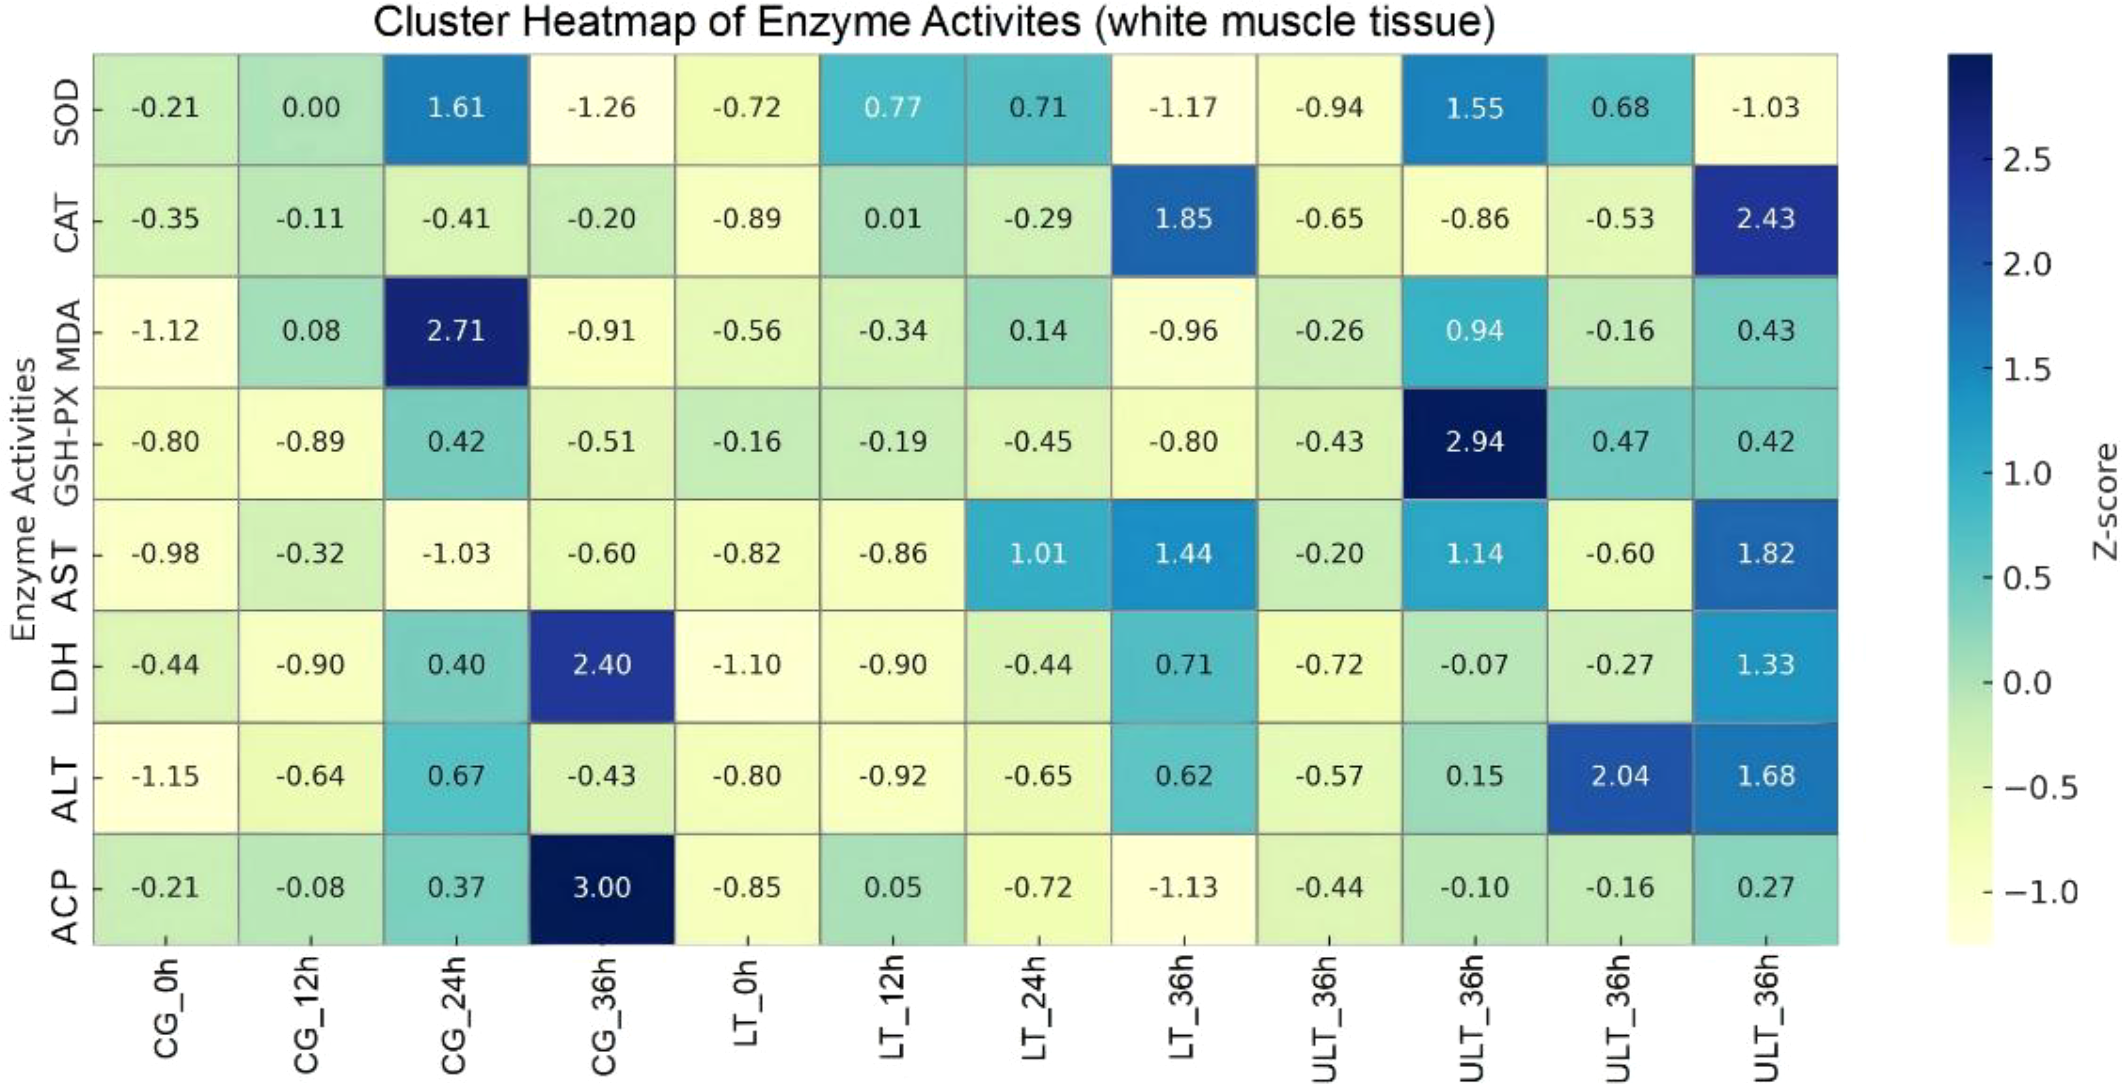
Antioxidant and metabolic enzyme activity clustering in juvenile Thunnus albacares under acute cold stress, with normalization applied for comparison.
The clustering heatmap was used to visually summarize similarities in enzyme activity trends among treatments and time points and should be interpreted as a descriptive representation rather than a statistically validated classification.
3.6 Effect of cold stress on immune and metabolic gene expression in the red muscle tissue of juvenile yellowfin tuna
The expression levels relative to the hspa1b, blmh, irf3, and acadm genes in the red muscle tissue of juvenile yellowfin tuna under cold stress are presented in Figures 7A–D. Two-way ANOVA revealed that group (temperature), time, and their interaction noticeably influenced the activity of all four genes (Supplementary Tables S17–S20; p < 0.05).
Figure 7
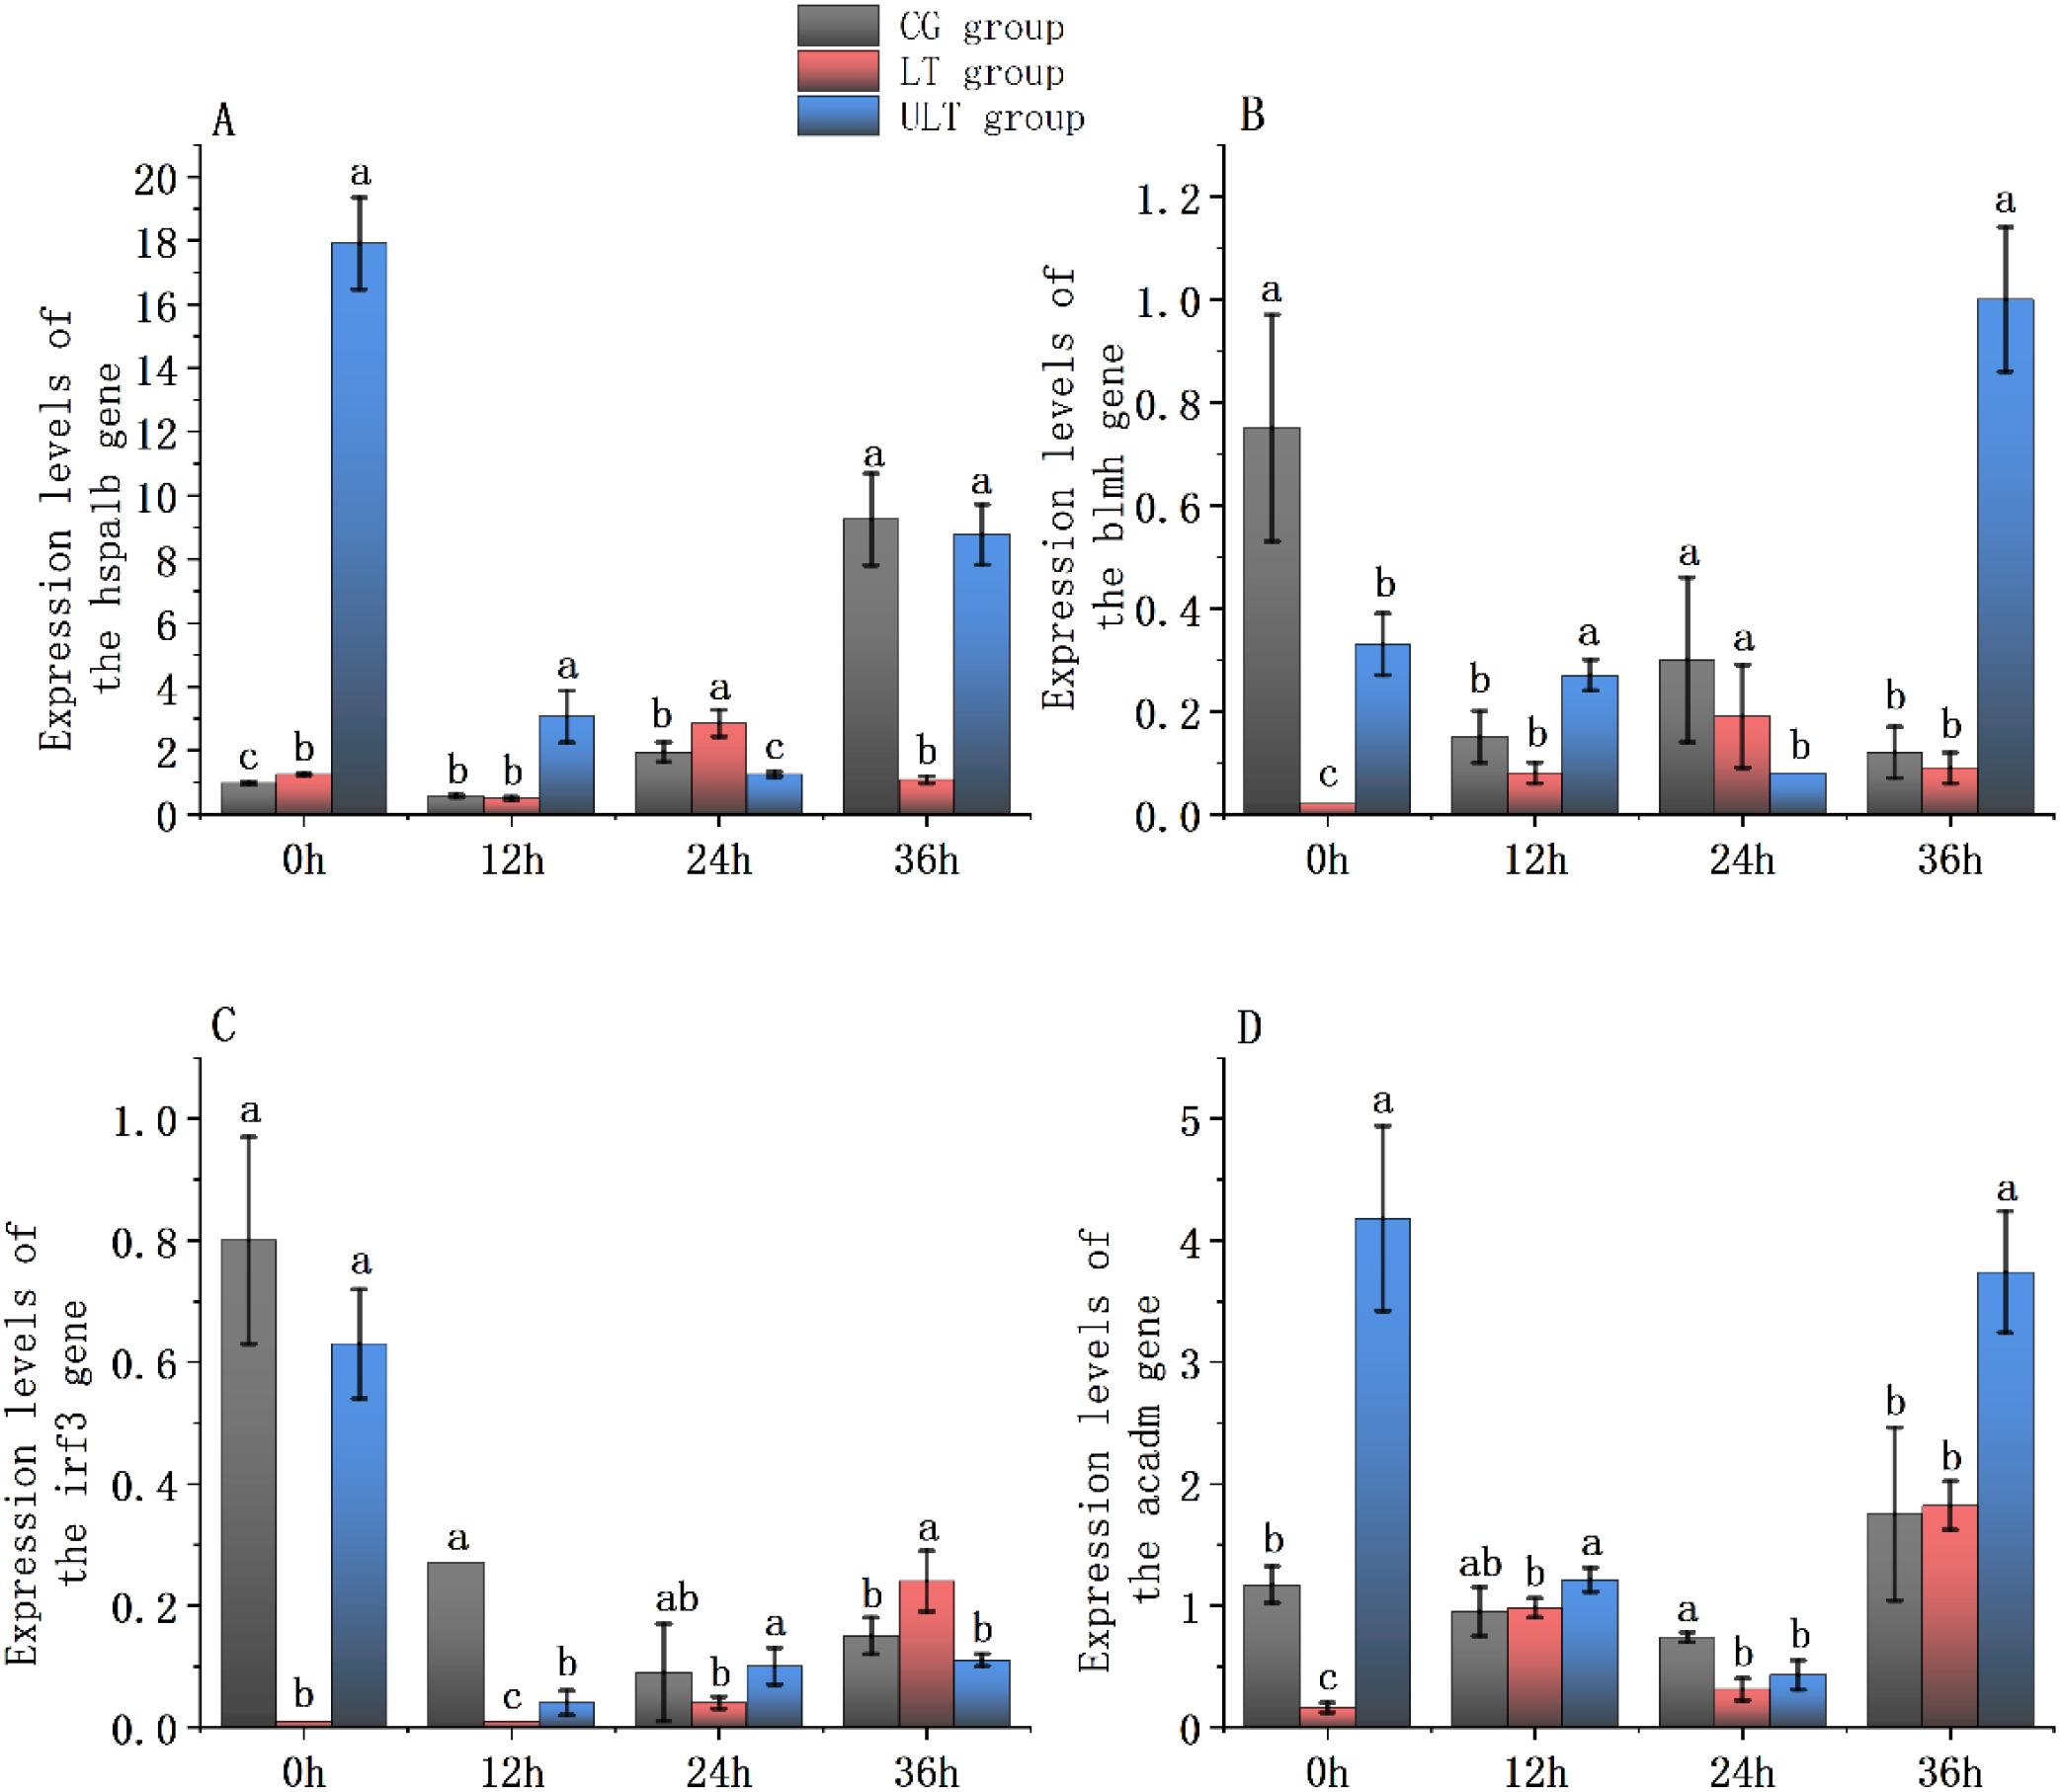
Immune and metabolic gene expression patterns in the red muscle tissue of juvenile Thunnus albacares under acute cold stress [(A)hspa1b gene; (B)blmh gene; (C)irf3 gene; (D)acadm gene. Different letters denote notable differences between groups at the same time interval; p < 0.05].
For hspa1b (Figure 7A), activity in the CG group was noticeably downregulated at 12 h (p < 0.05) but significantly upregulated at 24 h and 36 h compared with 0 h (p < 0.05). In the LT group, hspa1b activity showed a noticeable increase at 24 h (p < 0.05), exceeding that of the CG group (p < 0.05). In contrast, the ULT group showed markedly higher expression than CG at 0 h (p < 0.05) and remained significantly higher than CG at 12 h, 24 h, and 36 h (p < 0.05).
For blmh (Figure 7B), the CG group showed a continuous downregulation, with expression significantly lower at 12 h, 24 h, and 36 h than at 0h (p < 0.05). In the LT group, blmh activity at 0 h was noticeably decreased compared to CG (p < 0.05), but no notable differences were shown between the two groups at 12 h, 24 h, and 36 h (p > 0.05). In the ULT group, blmh activity was noticeably greater compared to CG at 0 h, 12 h, and 36 h (p < 0.05), but noticeably lower at 24 h (p < 0.05).
For irf3 (Figure 7C), CG exhibited significant downregulation at 12 h, 24 h, and 36 h compared with 0 h (p < 0.05). The LT group showed a similar trend, with expression significantly downregulated at all subsequent time points (p < 0.05). In ULT, irf3 activity was noticeably lower to the CG only at 12 h (p < 0.05), whereas no notable differences were shown at 0 h, 24 h, and 36 h (p > 0.05).
For acadm (Figure 7D), expression in CG was significantly downregulated at 12 h and 24 h compared with 0 h (p < 0.05), followed by a marked upregulation at 36 h (p < 0.05). In LT, acadm activity was noticeably increased at 36 h (p < 0.05), but no notable differences were detected between LT and CG at any time point (p > 0.05). In the ULT group, acadm activity was noticeably greater than CG at 0 h (p < 0.05), reaching its peak, and remained elevated throughout the exposure.
3.7 Effect of cold stress on immune and metabolic gene expression in the white muscle tissue of juvenile yellowfin tuna
The expression levels relative to the hspa1b, blmh, irf3, and acadm genes in the white muscle tissue of juvenile yellowfin tuna under cold stress are shown in Figures 8A–D. Two-way ANOVA revealed that the expression of hspa1b, irf3, and acadm was noticeably affected by temperature (group), time, and their interaction (Supplementary Tables S21, S23, S24; p < 0.05). In contrast, the expression of blmh was noticeably influenced by time and the interaction term (p < 0.05), but not by temperature (Supplementary Table S22; p > 0.05).
For hspa1b (Figure 8A), expression in the CG group was significantly enhanced at 24 h and 36 h compared to 0 h (p < 0.05). In the LT group, hspa1b activity enhanced markedly at 12 h, peaking and surpassing CG (p < 0.05). In ULT, hspa1b activity was noticeably greater than CG at 24 h (p < 0.05), but at 36h it was noticeably decreased (p < 0.05).
For blmh (Figure 8B), no differences of significance were found between the groups (p > 0.05), but time and interaction impact were significant (p < 0.05). In CG, blmh expression was noticeably upregulated at 12 h and 24 h compared with 0 h (p < 0.05). LT showed no notable differences compared with CG at any time point (p > 0.05). ULT displayed significantly greater expression than CG at 12 h (p < 0.05), reaching its peak.
For irf3 (Figure 8C), CG exhibited significant downregulation at 12 h, 24 h, and 36 h relative to 0 h (p < 0.05). In LT, irf3 activity was noticeably greater than CG at 12 h (p < 0.05). ULT showed noticeably greater expression than CG at both 0 h and 12 h (p < 0.05), with the greatest value at 0 h.
For acadm (Figure 8D), CG showed a notable increase at 36 h (p < 0.05), reaching peak expression. LT did not differ significantly from CG at 0 h, 12 h, or 24 h (p > 0.05). ULT exhibited significantly greater expression than CG at 0 h and 12 h (p < 0.05).
Figure 8
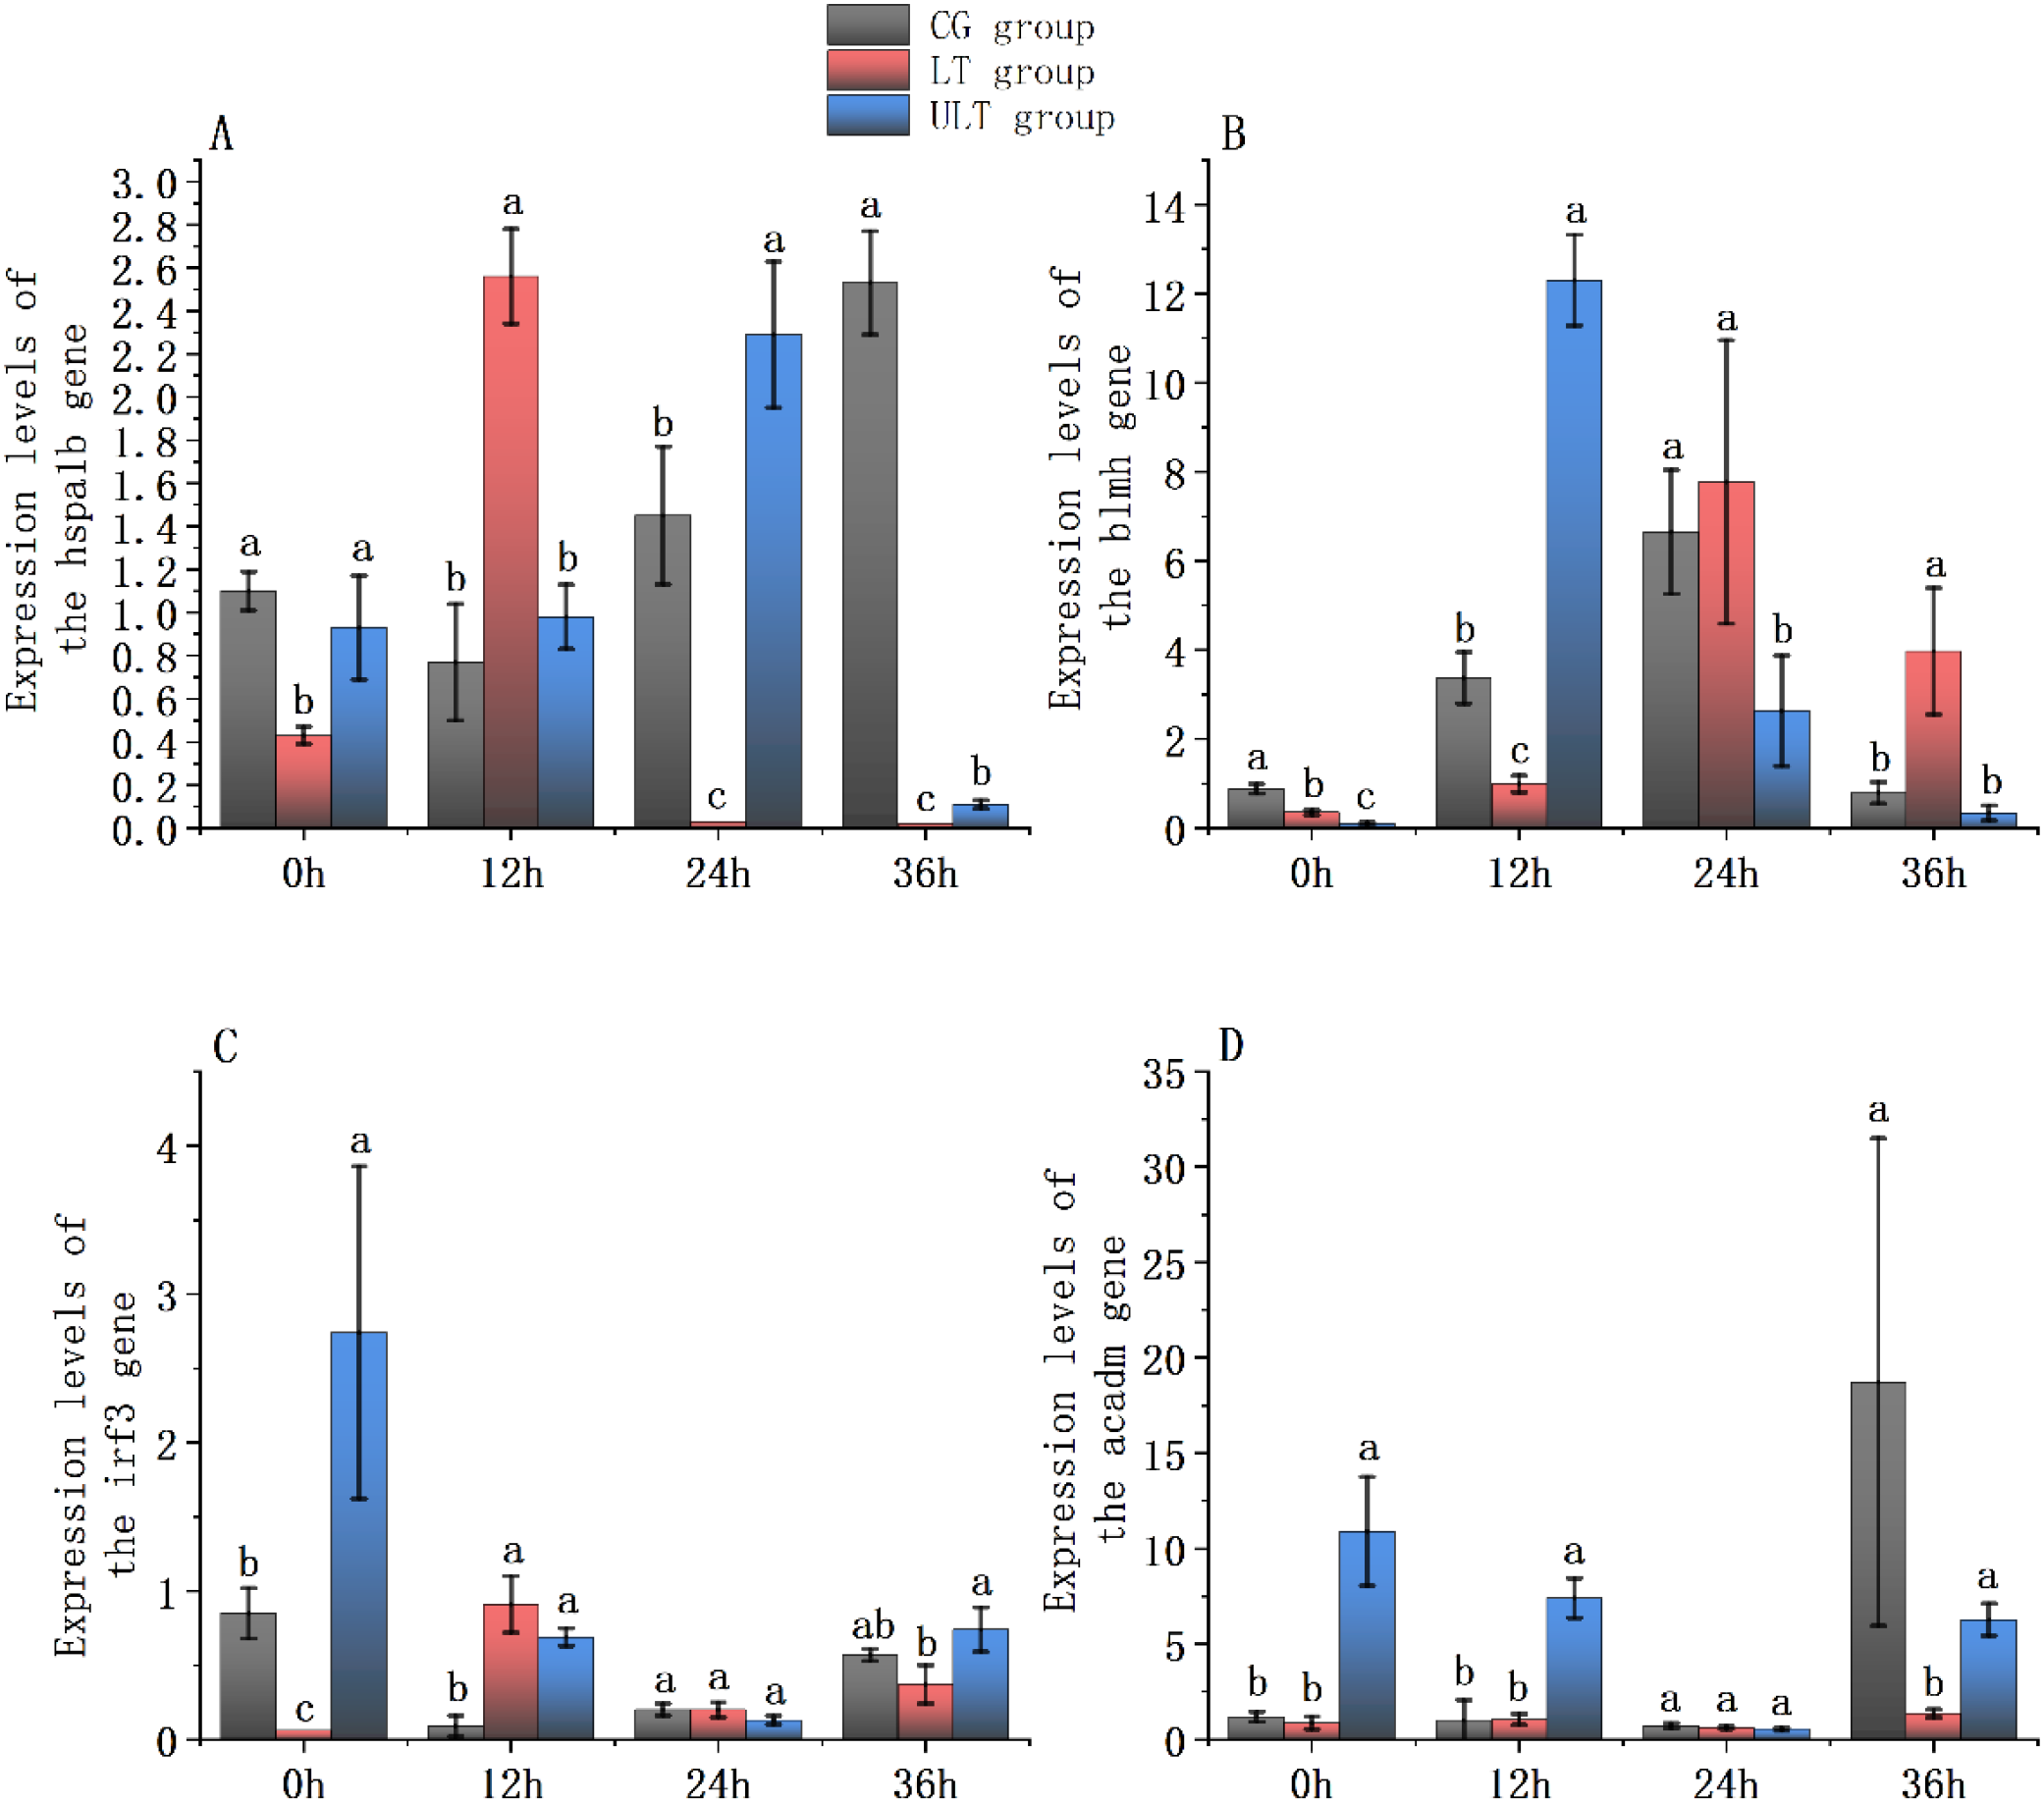
Gene expression patterns related to immunity and metabolism in the white muscle tissue of juvenile Thunnus albacares under acute cold stress [(A)hspa1b gene; (B)blmh gene; (C)irf3 gene; (D)acadm gene. Different letters denote notable differences between groups at the same time interval; p < 0.05].
4 Discussion
In this study, the effects of acute cold stress on juvenile yellowfin tuna exhibited significant time-dependent and intensity-dependent variations, particularly in antioxidant responses, energy metabolism, and immune responses. These changes not only indicate the physiological impact of low temperature on yellowfin tuna but also reveal the complex mechanisms involved in their response to cold stress (Huang et al., 2025a, 2025b). As the duration of stress increases, alterations in the activities of SOD, CAT, and GSH-PX suggest a limitation in antioxidant system function, resulting in the buildup of excess reactive oxygen species (ROS) and initiating oxidative stress responses (Dreyer and Dietz, 2018; Lv et al., 2021). In response to the energy supply-demand imbalance caused by low temperatures, juvenile fish may undergo metabolic adjustments at the level of enzyme activity and gene expression to maintain physiological homeostasis (Liu et al., 2023). However, these observations reflect regulatory responses at the biochemical and transcriptional levels rather than pathway-level metabolic reprogramming. At the same time, immune- and metabolism-related genes, such as hspa1b, blmh, irf3, and acadm, in both red and white muscle tissues exhibit significant differential expression, reflecting tissue-specific stress regulation mechanisms.
During the early stages of stress (12 h), antioxidant enzyme activities in both red and white muscle tissues significantly increased, particularly in the ULT group, where SOD and CAT activities were more pronounced. This result is highly consistent with the response of Larimichthys crocea under cold stress (Lv et al., 2021). This early-phase activation is also consistent with a transient endocrine stress signal observed under similar cold exposure conditions, where plasma cortisol increased in juvenile Thunnus albacares (unpublished data from our research group). Previous studies have shown that temperature fluctuations are a major driving factor for oxidative stress. In some tissues, excessive accumulation of reactive oxygen species (ROS) leads to unsustainable antioxidant enzyme activity. This is consistent with the unique antioxidant enzyme activity pattern observed in red muscle in the present study. Specifically, in the ULT group of red muscle, SOD activity decreased while CAT levels increased, suggesting that the antioxidant system may have been insufficient to fully counteract elevated ROS production under these conditions. This implies that red muscle, due to its higher metabolic rate, is more sensitive to cold stress and more prone to antioxidant system collapse (Refaey et al., 2023). Meanwhile, MDA levels increased significantly (p < 0.05), reaching a peak at 24 h in the ULT group, suggesting increased lipid peroxidation–related oxidative stress under prolonged low-temperature exposure. Similar patterns have also been reported in other fish species, such as Eleutheronema tetradactylum (Jin et al., 2025). The observed increase in GSH-PX activity may represent a compensatory mechanism aimed at reinforcing antioxidant defenses to mitigate oxidative stress–related cellular perturbations (Wang et al., 2021). However, the underlying molecular mechanisms driving this response warrant further investigation to fully elucidate their role in cellular protection.
In white muscle tissue, although SOD activity showed a significant increase at 12 h (p < 0.05), it then showed a decreasing trend over time. A similar pattern has also been observed in the gill tissue of yellowfin tuna (Thunnus albacares) under cold stress (Huang et al., 2025a). Additionally, GSH-PX activity was significantly higher in the ULT group than in the CG group at all four time points (p < 0.05), which may be a response to the rapid production of ROS under cold stress (Wang et al., 2021; Refaey et al., 2023). The concurrent changes in SOD, MDA, and GSH-PX highlight the close association between antioxidant defense mechanisms and lipid peroxidation, which may be related to the higher sensitivity of white muscle tissue to oxidative stress (Monteiro et al., 2006). However, over time, the increase in GSH-PX activity appeared insufficient to fully alleviate oxidative damage. For example, in Larimichthys crocea under cold stress, SOD and GSH-PX activity briefly increased before rapidly declining, suggesting that the antioxidant system is unable to counteract oxidative damage in the long term, highlighting the limited capacity of these defenses (Grădinariu et al., 2025; Lv et al., 2021). These findings underscore the need for further research to better understand the long-term dynamics and limitations of antioxidant responses in combating oxidative stress under cold exposure.
The activities of AST, LDH, ALT, and ACP were measured to reveal metabolic alterations in the red and white muscles of Thunnus albacares under stress conditions. At 36 h, both AST and ALT activities in the ULT group of red and white muscle tissues significantly increased, indicating enhanced amino acid metabolism and transamination to compensate for the insufficient tissue energy supply during cold stress, as well as the activation of anaerobic metabolic pathways and accelerated amino acid catabolism (Youssuf et al., 2025). Although this metabolic adjustment helps maintain energy supply, it inevitably generates ROS, further exacerbating oxidative stress and leading to tissue damage (Luo et al., 2022; Liu et al., 2025). LDH activity was significantly reduced in both experimental groups compared to the CG group, indicating that cold stress suppressed anaerobic metabolic capacity. Notably, LDH activity in white muscle was markedly reduced under low-temperature treatments, reaching very low values in the LT group at later time points. While LDH is generally abundant in glycolytic tissues (Gibb and Dickson, 2002), its activity can be strongly suppressed under low-temperature conditions due to reduced anaerobic metabolic demand and enzymatic regulation (Winter et al., 2018). In addition, LDH activity in this study was measured under standardized in vitro assay conditions and normalized to protein content, reflecting relative enzymatic capacity rather than absolute in vivo metabolic flux. Therefore, the low LDH values observed in white muscle should be interpreted as indicators of pronounced suppression of glycolytic potential under short-term low-temperature exposure, rather than as evidence of assay failure or sample degradation. Rather than reflecting a metabolic shift toward enhanced aerobic metabolism, the reduction in LDH activity more likely reflects enzyme inhibition, metabolic depression, or reduced glycolytic flux under low-temperature conditions. Cold stress is known to impair mitochondrial efficiency and overall metabolic performance in fishes, thereby constraining both aerobic and anaerobic energy production (Regan et al., 2017; Steffensen, 2002). In this context, the observed decrease in LDH activity suggests an overall limitation of energy metabolism rather than a preferential reliance on aerobic pathways. In red muscle tissue, AST and ACP activities peaked at 36h in the ULT group, indicating that prolonged cold stress may activate the lysosomal pathway involved in protein degradation, providing amino acids for energy supply or cellular repair (Higuchi-Sanabria et al., 2020; Liu et al., 2020). The cold tolerance mechanism of Litopenaeus vannamei may rely on the combined effect of enhanced antioxidant enzymes and lipid metabolism (Zhu et al., 2024). Therefore, the synchronous changes of ALT and GSH-Px observed in red muscle tissue may indicate that energy metabolism and the antioxidant defense system work synergistically to maintain tissue homeostasis (Resende et al., 2022). Persistent low-temperature exposure has been shown to impair mitochondrial function in Danio rerio, compromising anaerobic metabolism and intensifying oxidative damage (Wang et al., 2024). In the current study, although LDH activity in white muscle increased briefly to alleviate energy shortages through anaerobic metabolism, the subsequent decline in LDH and ACP activities suggests that metabolic regulation remained unstable under prolonged cold stress. This instability poses a sustained oxidative challenge to white muscle tissues (Chang et al., 2020). These findings underscore the complex and adaptive metabolic responses of Thunnus albacares to cold stress, highlighting the interplay between energy metabolism and oxidative stress, which warrants further investigation to uncover the full scope of the metabolic and cellular mechanisms involved.
Hspa1b, a member of the heat shock protein Hsp70 family, is an important molecular chaperone involved in cellular responses to various stresses such as heat stress, cold, and oxidative stress (Gombos et al., 2008). In Lates calcarifer (Newton et al., 2012) and Sparus aurata (Feidantsis et al., 2013), seasonal temperature fluctuations elicit distinct tissue-specific cellular stress responses, a phenomenon closely associated with the functional role of Hsp70. In red muscle tissue, hspa1b expression in the ULT group remained elevated relative to the control group throughout the exposure period, but showed a phase-dependent modulation over time when compared with its initial level at 0 h. The early upregulation of hspa1b may represent a protective adjustment by the cells to rapidly adapt to cold stress, but the subsequent modulation indicates a stage-dependent expression response to cold stress that is also dependent on temperature intensity changes (Luo et al., 2022). In contrast, white muscle tissue showed a different pattern, with hspa1b expression significantly upregulated in the LT and ULT groups at 12 h and 24 h, respectively (p < 0.05). This suggests that the white muscle response is more delayed and may require more time to initiate the corresponding stress response. The irf3 gene, a transcription factor, plays a key role in immune response, inflammation, and antiviral defense (Wang et al., 2020). In the red muscle tissue of the ULT group, the expression of the irf3 gene was significantly downregulated during the early phase of cold stress (0–12 h) compared to the CG group (p < 0.05), a similar expression pattern was also observed in the spleen tissue of Thunnus albacares (Huang et al., 2025b).In contrast, in white muscle tissue, irf3 expression was upregulated (p < 0.05). In red muscle, the downregulation of irf3 may be associated with a reduced immune-related transcriptional activity during the early phase of cold stress, potentially reflecting a regulatory adjustment rather than an active immune response. However, it is also possible that the immune or inflammatory response was suppressed during the early cold stress phase (Muralidharan and Mandrekar, 2013; Huang et al., 2025b). In white muscle, the transient upregulation of irf3 may indicate increased sensitivity of immune-associated signaling pathways at the transcriptional level in response to cold stress (Huang et al., 2015). It should be noted that skeletal muscle is not a primary immune organ; therefore, the observed changes in irf3 expression reflect immune-related transcriptional signaling within muscle tissue rather than systemic immune function or immune competence (Bjørgen and Koppang, 2022). These differential expression patterns of hspa1b and irf3 across muscle tissues underscore the complex and tissue-specific nature of cellular stress responses to cold exposure, which warrant further investigation to elucidate their underlying regulatory mechanisms.
The blmh and acadm are both involved in the catabolic processes of proteins and fatty acids, respectively, and play essential roles in cellular energy supply and the maintenance of metabolic homeostasis. blmh reached its peak in both red and white muscle tissues in the ULT group, but with different timing: in red muscle, it peaked at 36 h, while in white muscle, it peaked at 12 h. This indicates that red muscle may require more time to activate the protective mechanisms in response to cold stress (Komoroske et al., 2015). White muscle, on the other hand, responds more quickly, primarily relying on anaerobic metabolism. Although it has lower mitochondrial density, its adaptive response to environmental changes is typically faster (Stoiber et al., 2002). Additionally, acadm gene expression was upregulated during both early and late stages of cold stress (p < 0.05), especially in the ULT group of red muscle tissue, suggesting the activation of the fatty acid β-oxidation pathway to meet the increased long-term energy demands (Stancic et al., 2013). In white muscle tissue, acadm expression in the CG group was significantly upregulated at 36 h (p < 0.05) and reached its peak, indicating that prolonged cold exposure requires increased energy supply to maintain muscle function and adapt to the cold environment.
5 Conclusions
This research reveals the significant impact of acute cold stress on antioxidant enzyme activity, metabolic enzyme activity, and gene expression in the red and white muscle tissues of juvenile yellowfin tuna. The results indicate that cold stress induced noticeable changes in the antioxidant system of both red and white muscles. Antioxidant enzyme activities (SOD, CAT, GSH-PX) significantly increased in the early phase (12 h) and then declined with prolonged stress, particularly in the LT group. Red muscle tissue exhibited a stronger antioxidant response and metabolic adjustment, while white muscle tissue appeared more vulnerable. Metabolic enzyme activities (AST, ALT, ACP) showed significant metabolic responses in red muscle tissue at 36 h (p < 0.05). Gene expression analysis revealed temporal changes in hspa1b, blmh, irf3, and acadm expression, reflecting the relatively persistent stress regulation capability of red muscle, while white muscle responded more rapidly but was more prone to damage. In conclusion, acute cold stress has time-dependent and intensity-dependent physiological effects on juvenile yellowfin tuna. The results provide baseline information on the short-term physiological and transcriptional responses of tuna muscle to acute cold stress.
Statements
Data availability statement
The original contributions presented in the study are included in the article/Supplementary Material. Further inquiries can be directed to the corresponding author/s.
Ethics statement
The animal study was approved by Animal Care and Use Committee of the South China Sea Fisheries Research Institute, Chinese Academy of Fishery Sciences. The study was conducted in accordance with the local legislation and institutional requirements.
Author contributions
XL: Data curation, Conceptualization, Methodology, Writing – original draft. JH: Formal analysis, Investigation, Methodology, Visualization, Writing – original draft. ZF: Data curation, Investigation, Resources, Writing – review & editing. JC: Funding acquisition, Project administration, Supervision, Writing – review & editing. ZM: Conceptualization, Funding acquisition, Supervision, Writing – review & editing.
Funding
The author(s) declared that financial support was received for this work and/or its publication. This work was supported by the Fund of Key Laboratory of Efficient Utilization and Processing of Marine Fishery Resources of Hainan Province (KLEU2025-3), the National Natural Science Foundation of China (32460927); the Guangxi Science and Technology Planning Project (guike AD21238026); the Central Fund for Guiding Local Science and Technology Development (guike ZY22096005); the Science and Technology special fund of Hainan Province (ZDYF2024XDNY247); the Central Public-interest Scientific Institution Basal Research Fund, CAFS (2025XT03, 2023TD58).
Conflict of interest
The author(s) declared that this work was conducted in the absence of any commercial or financial relationships that could be construed as a potential conflict of interest.
Generative AI statement
The author(s) declared that generative AI was used in the creation of this manuscript. During the preparation of this manuscript, ChatGPT (version 5.2) was used for language editing and grammar checking. The authors are fully responsible for the content of this work.
Any alternative text (alt text) provided alongside figures in this article has been generated by Frontiers with the support of artificial intelligence and reasonable efforts have been made to ensure accuracy, including review by the authors wherever possible. If you identify any issues, please contact us.
Publisher’s note
All claims expressed in this article are solely those of the authors and do not necessarily represent those of their affiliated organizations, or those of the publisher, the editors and the reviewers. Any product that may be evaluated in this article, or claim that may be made by its manufacturer, is not guaranteed or endorsed by the publisher.
Supplementary material
The Supplementary Material for this article can be found online at: https://www.frontiersin.org/articles/10.3389/fmars.2026.1744499/full#supplementary-material
References
1
Bjørgen H. Koppang E. O. (2022). “ Anatomy of teleost fish immune structures and organs,” in Principles of Fish Immunology: From Cells and Molecules to Host Protection, (Cham, Switzerland: Springer Nature), 1–30.
2
Chang C.-H. Zhou X.-W. Wang Y.-C. Lee T.-H. (2020). Differential effects of hypothermal stress on lactate metabolism in fresh water-and seawater-acclimated milkfish, Chanos chanos. Comp. Biochem. Physiol. Part A: Mol. Integr. Physiol.248, 110744. doi: 10.1016/j.cbpa.2020.110744
3
Clarke A. (1991). What is cold adaptation and how should we measure it? Am. Zoologist31, 81–92. doi: 10.1093/icb/31.1.81
4
Dallas H. F. (2009). The effect of water temperature on aquatic organisms: a review of knowledge and methods for assessing biotic responses to temperature. Water Res. Commission Rep. KV213, (09).
5
Dieter M. P. Altland P. D. Highman. B. (1970). Tolerance of unacclimated and cold-acclimated rats to exercise in the cold: serum, red and white muscle enzymes, and histological changes. Can. J. Physiol. Pharmacol.48, 723–731. doi: 10.1139/y70-104
6
Dreyer A. Dietz K.-J. (2018). Reactive oxygen species and the redox-regulatory network in cold stress acclimation. Antioxidants7, 169. doi: 10.3390/antiox7110169
7
Feidantsis K. Antonopoulou E. Lazou A. Pörtner H. O. Michaelidis B. (2013). Seasonal variations of cellular stress response of the gilthead sea bream (Sparus aurata). J. Comp. Physiol. B183, 625–639. doi: 10.1007/s00360-012-0735-y
8
Gao P. Chen R. Ma D. Lin S. Yu H. Zhang X. (2025). An Integrated Analysis of Transcriptomic and Metabolomic Effects Reveals Insights into Stress Responses in Largemouth Bass (Micropterus salmoides) Under MS-222 (Tricaine Methanesulfonate) Exposure. Metabolites15, 349. doi: 10.3390/metabo15060349
9
Gibb A. C. Dickson K. A. (2002). Functional morphology and biochemical indices of performance: is there a correlation between metabolic enzyme activity and swimming performance? Integr. Comp. Biol.42, 199–207. doi: 10.1093/icb/42.2.199
10
Gombos T. Förhécz Z. Pozsonyi Z. Jánoskuti L. Prohászka Z. (2008). Interaction of serum 70-kDa heat shock protein levels and HspA1B (+ 1267) gene polymorphism with disease severity in patients with chronic heart failure. Cell Stress Chaperones13, 199–206. doi: 10.1007/s12192-007-0001-5
11
Grădinariu L. Crețu M. Vizireanu C. Dediu L. (2025). Oxidative stress biomarkers in fish exposed to environmental concentrations of pharmaceutical pollutants: A review. Biology14, 472. doi: 10.3390/biology14050472
12
Graham J. B. Dickson K. A. (2004). Tuna comparative physiology. J. Exp. Biol.207, 4015–4024. doi: 10.1242/jeb.01267
13
Han P. Chen J. Sun Z. Ren S. Wang X. (2025). Evaluation of reference genes for gene expression analysis in Japanese flounder (Paralichthys olivaceus) under temperature stress. BMC Genomics26, 117. doi: 10.1186/s12864-025-11285-7
14
Higuchi-Sanabria R. Shen K. Kelet N. Frankino P. A. Durieux J. Bar-Ziv R. et al . (2020). Lysosomal recycling of amino acids affects ER quality control. Sci. Adv.6, eaaz9805. doi: 10.1126/sciadv.aaz9805
15
Hong H. Wang J. Shi D. (2021). Effects of salinity on the chronic toxicity of 4-methylbenzylidene camphor (4-MBC) in the marine copepod Tigriopus japonicus. Aquatic Toxicology.232, 105742.
16
Huang J. Fu Z. Bai J. Ma Z. (2025a). Cold stress disrupts gill homeostasis in juvenile yellowfin tuna (Thunnus albacares) by altering oxidative, metabolic, and immune responses. Mar. Environ. Res.210, 107300. doi: 10.1016/j.marenvres.2025.107300
17
Huang J. Fu Z. Liu X. Ma Z. (2025b). Splenic tissue injury and physiological response mechanisms in juvenile yellowfin tuna (Thunnus albacares) under acute cold stress. Dev. Comp. Immunol.169, 105421. doi: 10.1016/j.dci.2025.105421
18
Huang Y. Huang X. Cai J. OuYang Z. Wei S. Wei J. et al . (2015). Identification of orange-spotted grouper (Epinephelus coioides) interferon regulatory factor 3 involved in antiviral immune response against fish RNA virus. Fish shellfish Immunol.42, 345–352. doi: 10.1016/j.fsi.2014.11.025
19
Jin M. Zheng A. Mkulo E. M. Wang L. Zhang H. Tang B. et al . (2025). Metabolomics-based analysis of adaptive mechanism of eleutheronema tetradactylum to low-temperature stress. Animals15, 1174. doi: 10.3390/ani15081174
20
Johnston I. A. Davison W. Goldspink. G. (1977). Energy metabolism of carp swimming muscles. J. Comp. Physiol.114, 203–216. doi: 10.1007/BF00688970
21
Komoroske L. M. Connon R. E. Jeffries K. M. Fangue N. A. (2015). Linking transcriptional responses to organismal tolerance reveals mechanisms of thermal sensitivity in a mesothermal endangered fish. Mol. Ecol.24, 4960–4981. doi: 10.1111/mec.13373
22
Liu A. Duan G. Yang L. Hu Y. Zhou H. Wang H. (2025). Low-temperature stress-induced hepatic injury in darkbarbel catfish (Pelteobagrus vachelli): mediated by gut–liver axis dysregulation. Antioxidants14, 762. doi: 10.3390/antiox14070762
23
Liu Z. Li J. Zhang J. Chen Z. Zhang K. (2025). Climate variability and fish community dynamics: impacts of la niña events on the continental shelf of the Northern South China Sea. J. Mar. Sci. Eng.13, 474. doi: 10.3390/jmse13030474
24
Liu S. Tian F. Qi D. Qi H. Wang Y. Xu S. et al . (2023). Physiological, metabolomic, and transcriptomic reveal metabolic pathway alterations in Gymnocypris przewalskii due to cold exposure. BMC Genomics24, 545. doi: 10.1186/s12864-023-09587-9
25
Liu L. Zhang R. Wang X. Zhu H. Tian Z. (2020). Transcriptome analysis reveals molecular mechanisms responsive to acute cold stress in the tropical stenothermal fish tiger barb (Puntius tetrazona). BMC Genomics21, 737. doi: 10.1186/s12864-020-07139-z
26
Lu Z. Li Q. Yongo E. Xiao J. Guo Z. (2025). Comparative energy metabolism in red and white muscles of juvenile yellowfin tuna, Thunnus albacore. Front. Mar. Sci.12, 1585044. doi: 10.3389/fmars.2025.1585044
27
Luo L. Huang J.-H. Liu D.-L. Jiang S.-G. Zhou F.-L. Jiang S. et al . (2022). Comparative transcriptome analysis of differentially expressed genes and pathways in Procambarus clarkii (Louisiana crawfish) at different acute temperature stress. Genomics114, 110415. doi: 10.1016/j.ygeno.2022.110415
28
Luo L. Zhao Z. Zhang R. Guo K. Wang S. Xu W. et al . (2022). The effects of temperature changes on the isozyme and Hsp70 levels of the Amur sturgeon, Acipenser schrenckii, at two acclimation temperatures. Aquaculture551, 737743. doi: 10.1016/j.aquaculture.2021.737743
29
Lv H. Liu Y. Li H. Yin X. Wang P. Qu X. et al . (2021). Modulation of antioxidant enzymes, heat shock protein, and intestinal microbiota of large yellow croaker (Larimichthys crocea) under acute cold stress. Front. Mar. Sci.8, 725899. doi: 10.3389/fmars.2021.725899
30
Ma F. Luo L. (2020). Genome-wide identification of Hsp70/110 genes in rainbow trout and their regulated expression in response to heat stress. PeerJ8, e10022. doi: 10.7717/peerj.10022
31
Mang Q. Gao J. Li Q. Sun Y. Xu G. Xu P. (2024). Probiotics Enhance Coilia nasus Growth Performance and Nutritional Value by Regulating Glucolipid Metabolism via the Gut–Liver Axis. Int. J. Mol. Sci.25, 12196. doi: 10.3390/ijms252212196
32
Monteiro D. A. de Almeida J. A. Rantin F. T. Kalinin A. L. (2006). Oxidative stress biomarkers in the freshwater characid fish, Brycon cephalus, exposed to organophosphorus insecticide Folisuper 600 (methyl parathion). Comp. Biochem. Physiol. Part C: Toxicol. Pharmacol.143, 141–149.
33
Muralidharan S. Mandrekar P. (2013). Cellular stress response and innate immune signaling: integrating pathways in host defense and inflammation. J. leukocyte Biol.94, 1167–1184. doi: 10.1189/jlb.0313153
34
Nasution M. K. M. Nasution R. M. W. Syah R. Elveny M. (2022). “ Biotechnology among computer science and data science: A review of scientific development.” in Proceedings of the Computational Methods in Systems and Software. pp. 903–911.
35
Newton J. R. De Santis C. Jerry. D. R. (2012). The gene expression response of the catadromous perciform barramundi Lates calcarifer to an acute heat stress. J. Fish Biol.81, 81–93. doi: 10.1111/j.1095-8649.2012.03310.x
36
Purohit G. K. Mahanty A. Mohanty B. P. Mohanty S. (2016). “Evaluation of housekeeping genes as references for quantitative real-time PCR analysis of gene expression in the murrel Channa striatus under high-temperature stress. Fish Physiol. Biochem.42, 125–135. doi: 10.1007/s10695-015-0123-0
37
Refaey M. M. Mehrim A. I. El-Komy M. M. Zenhom O. A. Mansour A. T. (2023). Chronic cold-stress induced histopathological changes, oxidative stress, and alterations in liver functions and nutrient composition of hybrid red tilapia and the potential protection of unsaturated fatty acids. Front. Mar. Sci.10, 1148978. doi: 10.3389/fmars.2023.1148978
38
Regan M. D. Gill I. S. Richards J. G. (2017). Calorespirometry reveals that goldfish prioritize aerobic metabolism over metabolic rate depression in all but near-anoxic environments. J. Exp. Biol.220, 564–572. doi: 10.1242/jeb.145169
39
Resende A. C. Pereira D. M. C. Schleger I. C. Souza M. R. D. P. Neundorf A. K. A. Romao S. et al . (2022). Effects of heat shock on energy metabolism and antioxidant defence in a tropical fish species Psalidodon bifasciatus. J. Fish Biol.100, 1245–1263. doi: 10.1111/jfb.15036
40
Reynolds W. W. Casterlin M. E. (1980). “ The role of temperature in the environmental physiology of fishes,” in Environmental physiology of fishes (New York: Springer), 497–518.
41
Stancic A. Buzadzic B. Korac A. Otasevic V. Jankovic A. Vucetic M. et al . (2013). Regulatory role of PGC-1α/PPAR signaling in skeletal muscle metabolic recruitment during cold acclimation. J. Exp. Biol.216, 4233–4241.
42
Steffensen J. F. (2002). Metabolic cold adaptation of polar fish based on measurements of aerobic oxygen consumption: fact or artefact? Artefact! Comp. Biochem. Physiol. Part A: Mol. Integr. Physiol.132, 789–795. doi: 10.1016/S1095-6433(02)00048-X
43
Stoiber W. Haslett J. R. Wenk R. Steinbacher P. Gollmann H.-P. Sänger A. M. (2002). Cellularity changes in developing red and white fish muscle at different temperatures: simulating natural environmental conditions for a temperate freshwater cyprinid. J. Exp. Biol.205, 2349–2364. doi: 10.1242/jeb.205.16.2349
44
Sun Y. Fu Z. Liu X. Ma Z. (2024). The impact of Acute Ammonia Nitrogen Stress on the Gill Tissue Structure and Antioxidant Ability of Gills and Red and White Muscle in Juvenile Yellowfin Tuna (Thunnus albacares). Antioxidants13, 1357. doi: 10.3390/antiox13111357
45
Topic Popovic N. Strunjak-Perovic I. Coz-Rakovac R. Barisic J. Jadan M. Berakovic A.P. et al . (2012). Tricaine methane-sulfonate (MS-222) application in fish anaesthesia. J. Appl. Ichthyology28, 553–564. doi: 10.1111/j.1439-0426.2012.01950.x
46
Tu H. Peng X. Yao X. Tang Q. Xia Z. Li J. et al . (2023). Integrated transcriptomic and metabolomic analyses reveal low-temperature tolerance mechanism in giant freshwater prawn Macrobrachium rosenbergii. Animals13, 1605. doi: 10.3390/ani13101605
47
Videler J. J. (2011). An opinion paper: emphasis on white muscle development and growth to improve farmed fish flesh quality. Fish Physiol. Biochem.37, 337–343. doi: 10.1007/s10695-011-9501-4
48
Wang J. Li H. Xue B. Deng R. Huang X. Xu Y. et al . (2020). IRF1 promotes the innate immune response to viral infection by enhancing the activation of IRF3. J. Virol.94, e01231-20. doi: 10.1128/jvi.01231-20
49
Wang L. Liu Y. Yang C. Shan B. Sun D. Qiu Y. (2024). Response of the spatiotemporal distribution of crimson seabream (Paerargyrops edita) to La Niña event in the northern Beibu Gulf, South China Sea. Global Ecol. Conserv.54, e03076. doi: 10.1016/j.gecco.2024.e03076
50
Wang D. Tian Y. Wang Q. Zhang Y. Ye B. Zuo Z. et al . (2024). Cold stress-induced autophagy and apoptosis disorders are mainly mediated by AMPK/PPAR/PI3K/AKT/mTOR pathways. Aquaculture583, 740574. doi: 10.1016/j.aquaculture.2024.740574
51
Wang H. Wang M. Niu M. Hu L. Chen L. (2021). Cold Acclimation for enhancing the cold tolerance of zebrafish cells. Front. Physiol.12, 813451. doi: 10.3389/fphys.2021.813451
52
Winter H. N. Louison M. J. Stein J. A. Suski C. D. (2018). Metabolic response of bluegill to exercise at low water temperature: implications for angling conservation. Environ. Biol. Fishes101, 1657–1667. doi: 10.1007/s10641-018-0814-3
53
Yan H. Soon W. Wang Y. (2015). A composite sea surface temperature record of the northern South China Sea for the past 2500 years: A unique look into seasonality and seasonal climate changes during warm and cold periods. Earth-Science Rev.141, 122–135. doi: 10.1016/j.earscirev.2014.12.003
54
Youssuf H. Soror E. I. Shehab A. El-daim A. M. Abo-Gamil Z. H. Ahmed-Farid O. et al . (2025). Amelioration of hypoxia and cold stress in Nile tilapia: comparative effect of Chlorella vulgaris and its nanoparticle dietary supplementation on performance, antioxidant, hepatic functions, and meat quality. Aquaculture Int.33, 66. doi: 10.1007/s10499-024-01739-2
55
Zapata E. S. Amensour M. Oliver R. Zaragoza E. F. Navarro C. Lopez J. F. et al . (2011). Quality characteristics of dark muscle from Yellowfin tuna Thunnus albacares to its potential application in the food industry. J. Food Nutr. Sci.2, 22–30.
56
Zhang N. Yang R. Fu Z. Yu G. Ma Z. (2023). Mechanisms of digestive enzyme response to acute salinity stress in juvenile yellowfin tuna (Thunnus albacares). Animals13, 3454. doi: 10.3390/ani13223454
57
Zheng F. Yuan Y. Ding Y. Li K. Fang X. Zhao Y. et al . (2022). The 2020/21 extremely cold winter in China influenced by the synergistic effect of La Niña and warm Arctic (Switzerland/International: Springer).
58
Zhu W. Li Q. Peng M. Yang C. Chen X. Feng P. et al . (2024). Biochemical indicators, cell apoptosis, and metabolomic analyses of the low-temperature stress response and cold tolerance mechanisms in Litopenaeus vannamei. Sci. Rep.14, 15242. doi: 10.1038/s41598-024-65851-2
Summary
Keywords
acute cold stress, antioxidant response, immune gene expression, metabolic regulation, muscle, Thunnus albacares
Citation
Liu X, Huang J, Fu Z, Chang J and Ma Z (2026) Short-term cold stress effects on antioxidant, metabolic, and immune responses in the red and white muscles of juvenile yellowfin tuna (Thunnus albacares). Front. Mar. Sci. 13:1744499. doi: 10.3389/fmars.2026.1744499
Received
12 November 2025
Revised
15 January 2026
Accepted
26 January 2026
Published
10 February 2026
Volume
13 - 2026
Edited by
Analía Ale, CONICET Santa Fe, Argentina
Reviewed by
Basanta Kumar Das, Central Inland Fisheries Research Institute (ICAR), India
Sofia Priyadarsani Das, National Taiwan Ocean University, Taiwan
Updates
Copyright
© 2026 Liu, Huang, Fu, Chang and Ma.
This is an open-access article distributed under the terms of the Creative Commons Attribution License (CC BY). The use, distribution or reproduction in other forums is permitted, provided the original author(s) and the copyright owner(s) are credited and that the original publication in this journal is cited, in accordance with accepted academic practice. No use, distribution or reproduction is permitted which does not comply with these terms.
*Correspondence: Jie Chang, changjieouc@163.com; Zhenhua Ma, zhenhua.ma@scsfri.ac.cn
Disclaimer
All claims expressed in this article are solely those of the authors and do not necessarily represent those of their affiliated organizations, or those of the publisher, the editors and the reviewers. Any product that may be evaluated in this article or claim that may be made by its manufacturer is not guaranteed or endorsed by the publisher.