Abstract
Entanglement of large whales in static fishing gear, specifically in pot fisheries, is an increasing issue worldwide. This study assessed the entanglement risk of Ireland’s three most frequently observed large whales, humpback (Megaptera novaeangliae), minke (Balaenoptera acutorostrata), and fin whales (Balaenoptera physalus), with pot fisheries within the Irish Exclusive Economic Zone. Pot fisheries in Ireland are steadily growing, increasing the likelihood of present, and future, negative interactions with whales. An estimated 85% of the Irish pot fisheries take place within the 12-nautical mile limit, resulting in an increased vulnerability for whales distributed near the coast. This study determined the likelihood of co-occurrence of pot fisheries and large whales, identified areas and times of the year where the risk of entanglement was highest, and reports on actual entanglement cases associated with pot fisheries. Humpback and minke whales have a higher risk of entanglement off the southwest and south coasts of Ireland, while higher-risk areas for fin whales were located off the south coast. This study also identified data gaps that need to be addressed to improve future assessments and identify risk areas at a finer spatial resolution.
1 Introduction
Entanglement in fishing gear is a major threat to whale populations worldwide (Hamilton and Baker, 2019), with the risk of entanglement in static gear increasing globally (Read, 2008; Cassoff et al., 2011; Rya et al., 2016; MacLennan et al., 2020). An estimated 300,000 cetaceans die each year from accidental bycatch and entanglement (Benjamins et al., 2012; Knowlton et al., 2016; Basran et al., 2019; MacLennan et al., 2021), with entanglement in static fishing gear identified as the leading cause of mortality in large whales in certain regions of the Northern Atlantic (Robbins, 2012; Pace et al., 2021).
Pot fisheries account for the majority of static fishing gears. Pots, also known as creels, are basketlike structures covered in a net that are deployed on the seafloor and baited with fresh or salted fish. They are typically used to catch decapod crustaceans such as crabs and lobsters (Slack-Smith, 2001; He, 2011). Creels can be deployed singularly or as a fleet, where multiple creels are laid on the seafloor, interconnected by a ground rope made of polypropylene. Each end of the fleet is attached to a buoy line and surface marker buoy to mark the location of the pots (Northridge et al., 2010; Leaper et al., 2022). These vertical buoy lines along with the occasionally buoyant and arching ground ropes pose an entanglement risk for diving whales (Myers et al., 2019; Pierre et al., 2022).
The International Whaling Commission (International Whaling Commission (IWC), 2010) defines entanglement as involving “any part of the body that gets wrapped in lines, netting, or other materials”. These instances can be lethal due to the whale drowning or sustaining life-threatening injuries with sub-lethal effects including increased energetic demand during entanglement, physiological stress that may affect the animal’s health, and impaired swimming and foraging due to towing gear for a period of time (Benjamins et al., 2012; Knowlton et al., 2016; Basran et al., 2019; MacLennan et al., 2021; Aranha and Torres-Florez, 2024; Mooney, 2003).
Since the 1985/1986 whaling moratorium, large whale populations have begun to increase, with some populations returning to pre-whaling levels (Clapham, 2016; Cheeseman et al., 2024). The increased abundance of whales in our oceans along with a growing global fishing industry increases the risk of negative interactions between the two (Northridge, 2018; Muscolino, 2025). The specific life-history traits of whales, such as late sexual maturity, slow growth, low reproductive rates, and low fecundity, make these species particularly vulnerable to increased anthropogenic mortality (Breen et al., 2017). Even a slight increase in mortality can eventually lead to population crashes (Benjamins et al., 2012). Large whale species provide a range of ecosystem services, such as increased primary production, mitigation of climate change effects, and the circulation of nutrients (Roman et al., 2014; Knowlton et al., 2016; Durfort et al., 2022).
Cetaceans are also economically important, with the whale-watching industry reported to generate over $2 billion annually in tourism, as well as significant regional employment (O’Connor et al., 2009). Approximately 14% of Europe’s recreational whale watchers are found in Ireland, producing 8%–9% of Europe’s whale watching revenue, highlighting the importance of whale watching tourism in Ireland (O’Connor et al., 2009). Additionally, a study in Scotland estimated an average loss of £240 in income per entanglement event for fishermen, with a maximum loss of up to £2,000 (MacLennan et al., 2021), illustrating an additional negative financial impact of entanglement incidents.
In 2013, a first screening procedure based on the Productivity Susceptibility Analysis method was carried out to estimate the risk of entanglement for 14 different cetacean species in six different fisheries in Irish waters (Brown et al., 2013). This study concluded that fin and minke whales were at low entanglement risk, while humpback was at moderate risk. A later study by Breen et al. (2016) modeled fin and minke whale distributions and calculated exposure scores to fishing activity for boats ≥12 m and determined that the northwest coast of Ireland was an area of high exposure for both minke and fin whales. However, neither study accounted for boats less than 12 m in length (85% of the Irish fleet), almost all of which use pots to target lobster and crab. Moreover, only limited sightings data were available, and no opportunistic sightings were included in these studies.
In recent years, studies in Scotland highlighted the vulnerability of minke and humpback whales especially to pot/creel fisheries, with entanglement listed as their primary cause of mortality in Scottish waters (Northridge et al., 2010; MacLennan et al., 2020; Leaper et al., 2022; Rayner et al., 2024). An estimated 5 humpback and 30 minke whales die annually from entanglement in pot fishery gear, resulting in the inshore waters of Scotland being incapable of supporting the current humpback whale population (MacLennan et al., 2020). Whale populations are distributed in coastal waters of Ireland and Scotland, and both nations also have a similar and large creel fishing industry, suggesting that whale entanglement risk may be similar in both areas. Therefore, despite Ireland only having a few confirmed records of entanglements of large whales in static gear (Massett, 2020; Lusher et al., 2018; Levesque et al., 2023), this could be due to the lack of a necropsy scheme to determine cause of death or lower reporting rates rather than a lower rate of entanglements.
The estimation of the entanglement risk is particularly difficult to estimate as there are no precise recent estimates of the number of pots used by the Irish fleet. Tully (2017) estimated that there were 342,000 pots in the crab and lobster fleets in 2013–2014. Additional information is found in the Marine Institute (MI) Atlases of Commercial Fisheries through Vessel Management System (VMS) data. VMS is carried by large vessels, ≥15 m vessels from 2008 to 2012 and ≥12 m from 2013 onwards, and records the position, speed, and type of vessel continuously. These data were used to identify trends and changes in pot fishing activity.
Crucially, all editions of the Atlases of Commercial Fishing note that the majority of pot fishing effort (84%–85%) is represented by smaller fishing vessels that do not carry the VMS and were therefore excluded from all estimates and figures in these atlases (Anon, 2020). The reports also showed consistent pot fishing by non-Irish vessels within the Irish EEZ, particularly by UK and German ships. Irish vessels accounted for 64% of the fishing effort within the Irish EEZ in 2008–2021, but this increased to 82% by 2018. Overall estimates of total pot fishing effort remain uncertain, but anecdotally, they are thought to be increasing and are currently probably higher that the 342,000 estimated by Tully (2017).
To date, 26 different cetacean species have been recorded in Irish waters (Berrow, 2001; Whooley et al., 2011; Levesque et al., 2024). Minke whale (Balaenoptera acutorostrata) is the most frequently recorded and abundant baleen whale species in Irish waters, followed by fin whale (Balaenoptera physalus) (Rogan et al., 2018; Giralt Paradell et al., 2024). Humpback whales (Megaptera novaeangliae) are also frequently recorded in territorial waters [<12 nautical miles (NM)] with numbers increasing over the last 10 years (Berrow and Whooley, 2022; Blázquez et al., 2023). A large proportion of these individuals use inshore Irish waters as feeding grounds for several months of the year (Berrow and Whooley, 2022). Evidence of entanglement of large whales in Irish waters has been documented by the Irish Whale and Dolphin Group (IWDG) WhaleTrack Project (Massett, 2020) as well as through the IWDG cetacean stranding scheme (Lusher et al., 2018; Levesque et al., 2023).
As global (Northridge, 2018; Muscolino, 2025) and national pot fisheries grow (Anon, 2009; Gerritsen and Lordan, 2019; Gerritsen and Kelly, 2014; Gerritsen, 2024), so does the entanglement risk for large whale populations. It is essential to quantify this risk for Ireland’s diverse cetacean fauna and to incorporate mitigation of entanglement risk into fishery management measures. This study aimed to assess the risk of entanglement of humpback, minke, and fin whales with pot fisheries in the Irish Exclusive Economic Zone exploring a wide array of cetacean sightings and pot fisheries data.
2 Materials and methods
2.1 Study area
The study area consisted of the entire Irish Exclusive Economic Zone (EEZ), which extends up to 200 NM from the coastal baseline of Ireland. It includes part of the Atlantic Ocean, the Irish Sea, and the Celtic Sea and covers a total area of 437,500 km² (Department of Agriculture Food and the Marine, 2022) (Figure 1).
Figure 1
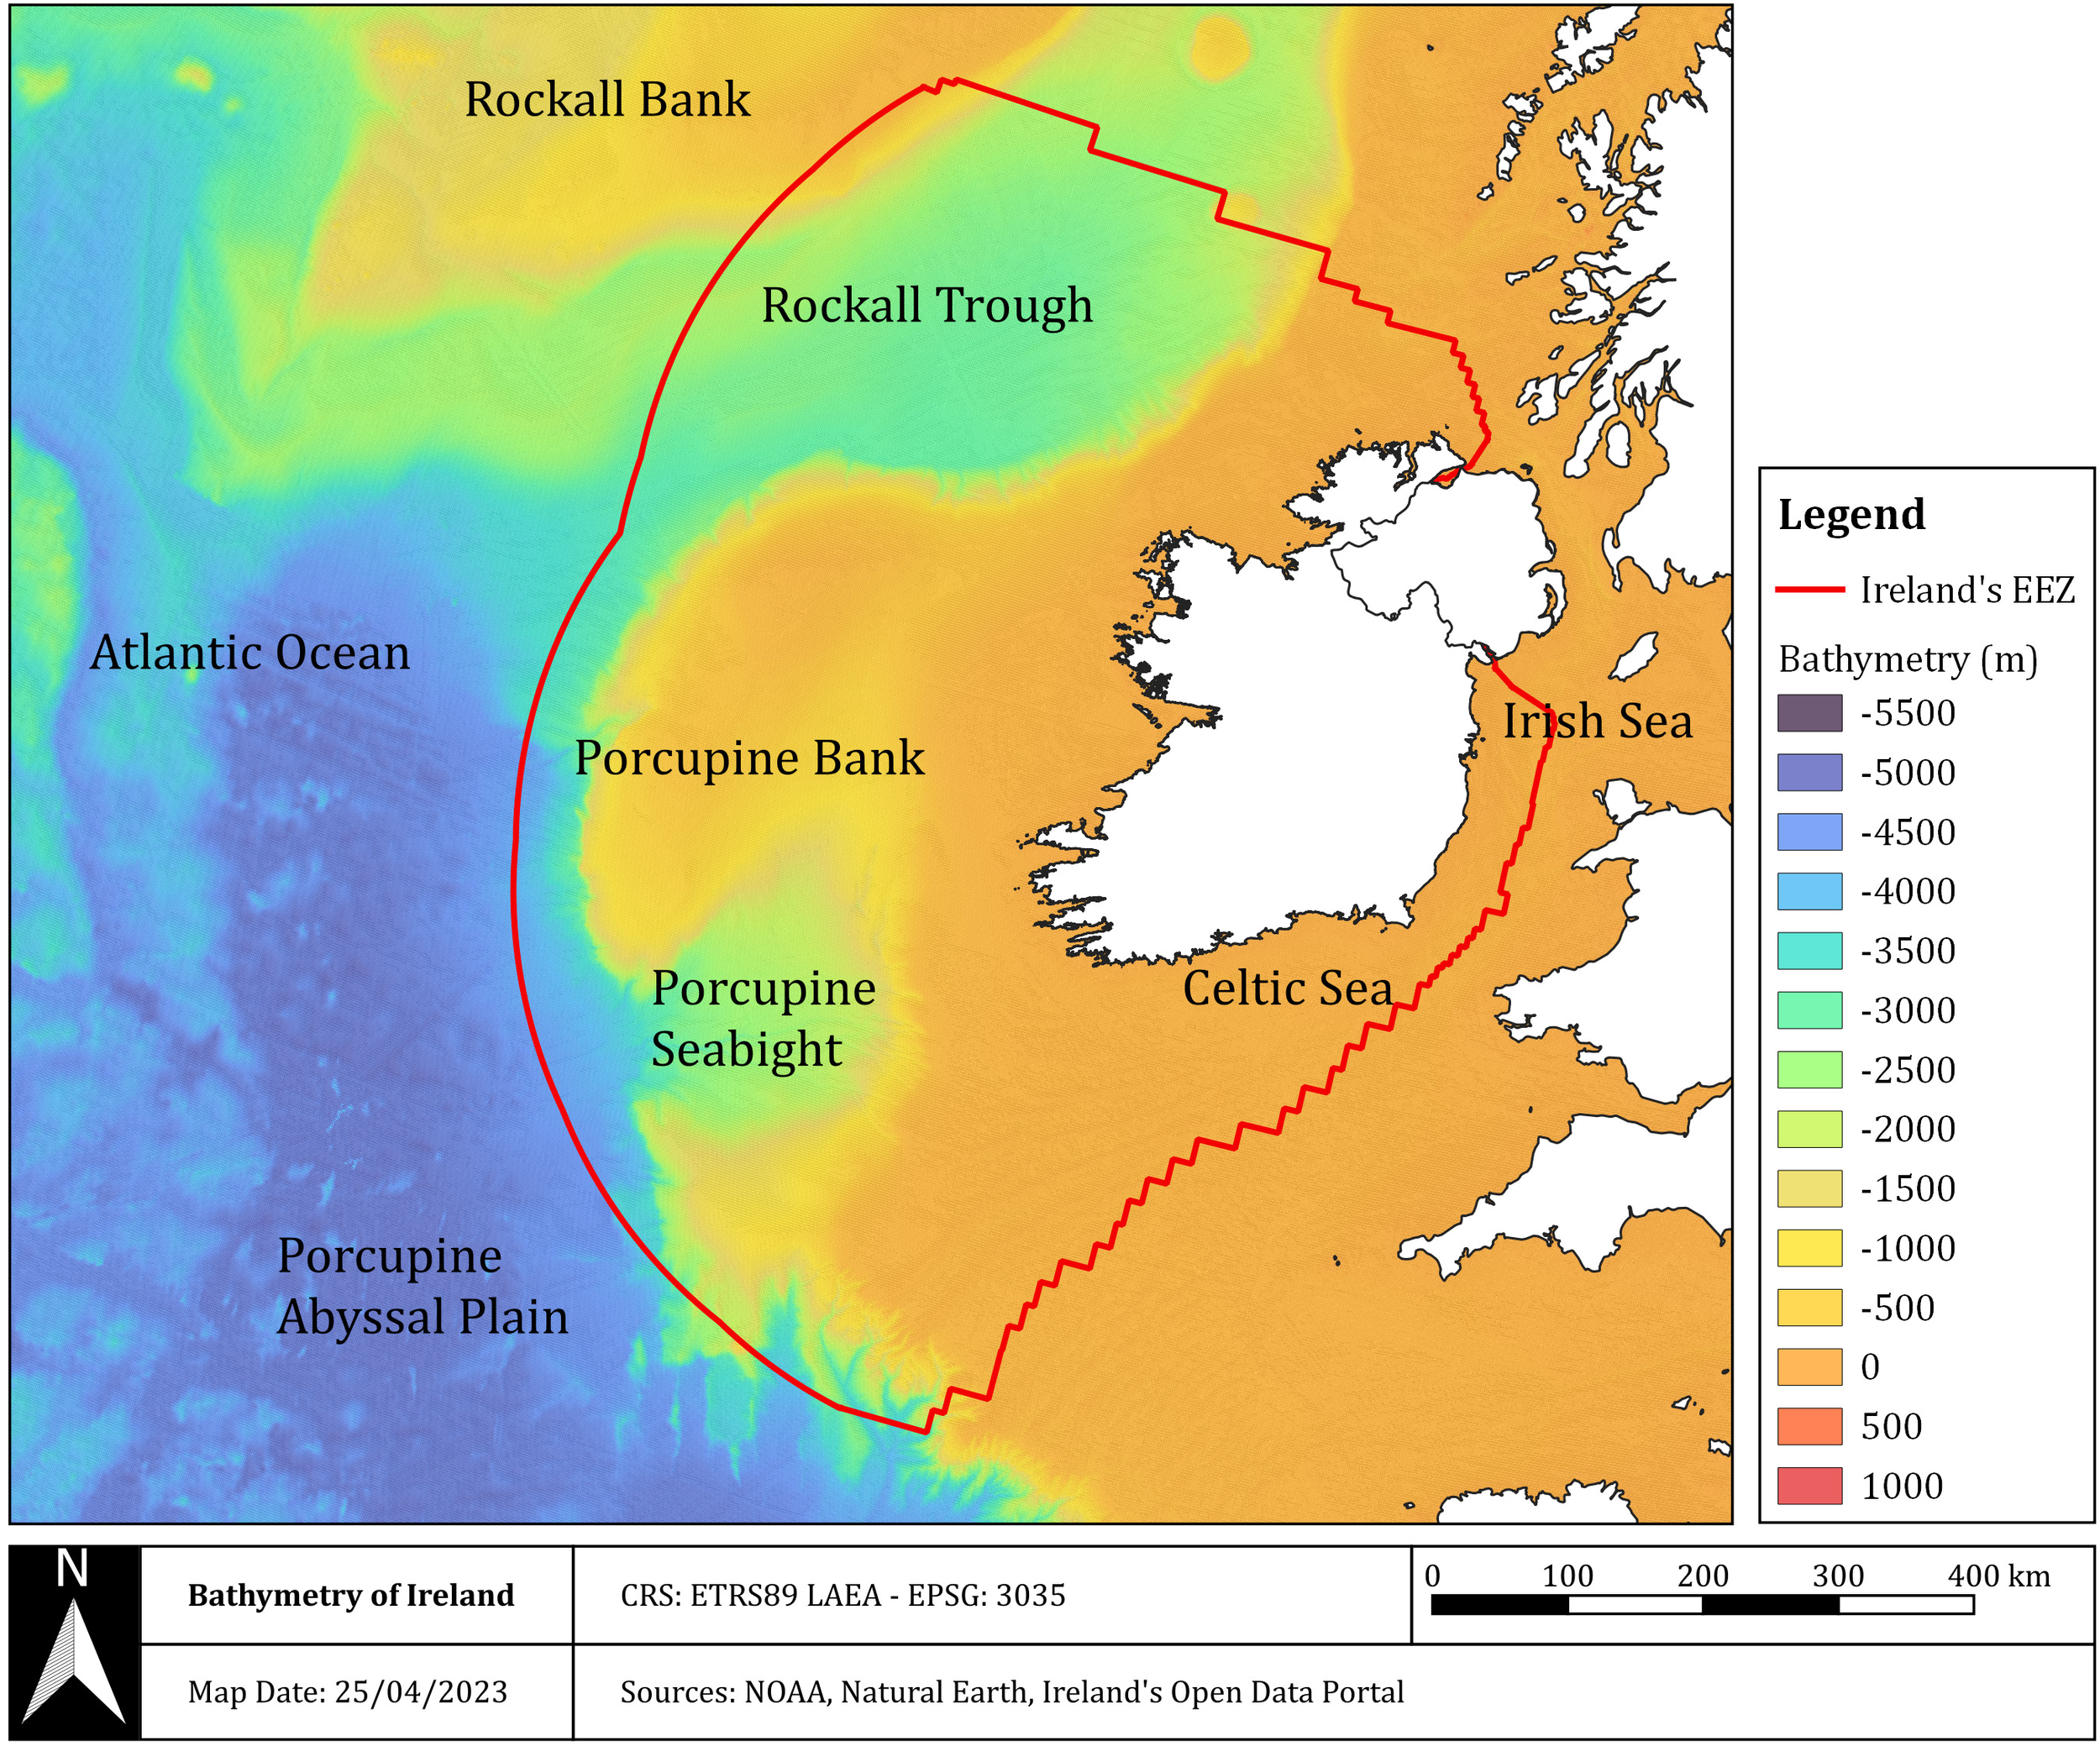
A map of the study area including the Irish EEZ, sea basin areas, and bathymetry (which is highlighted); Irish coastal county names are shown.
2.2 Data collection and sources
2.2.1 Whale data
Humpback, minke, and fin whale sightings data were sourced from the IWDG database, populated predominantly through the IWDG citizen science sightings scheme without associated effort (Whooley et al., 2010). All sightings were validated by the IWDG sightings officer before being included in the database to ensure only high quality and reliable data were logged and to avoid including duplicates (Berrow et al., 2010; Whooley et al., 2010; Irish Whale and Dolphin Group (IWDG), 2023). The IWDG database was further supplemented by sightings from over 100 different databases consisting of dedicated cetacean abundance surveys as well as surveys carried out from platforms of opportunity (Appendix 1).
Total counts of each whale species per sighting, with its associated geographic coordinates, were spatially joined to the European Environmental Agency (EEA) 10 by 10 km² vector polygon reference grid to sum the individuals per 100-km² grid cell. Spatial densities (individuals per km²) were then calculated within each grid cell. To determine monthly deviation in whale density, monthly data were compared to the overall mean during the study period.
As an indication of the spatial distribution of observation effort, the density of the IWDG sightings reports of all non-target species was mapped. The IWDG sighting database is predominantly made up of citizen science reports without associated effort; this would illustrate any potential biases. The database was filtered to include all species for which the IWDG has a concerted sightings scheme from 2005 to 2022 (cetaceans and basking sharks), excluding the target species (humpback, fin, and minke whales) as to avoid correlation with the whale sightings data. These sightings were spatially joined to the EEA 10 by 10 km² vector polygon reference grid to sum the sightings per 100-km² grid cell. Spatial densities (sightings per km²) were then calculated within each grid cell.
Alongside the sightings scheme, the IWDG has coordinated an all-Ireland stranding scheme since 1991, collecting data on cetaceans stranded on the coast. For each reported stranding, one or multiple members of the IWDG stranding network are contacted by the scheme to obtain basic information on the stranded animal, including species identification, length, and sex. Lesions are recorded and multiple images were taken. These are reviewed by an experienced Strandings Officer, and strandings are rated from unknown, no entanglement, possible entanglement, probable entanglement, and entanglement based on the evidence collected at the scene.
Additionally, since 1999, the IWDG has recorded photo-ID of individually recognizable humpback and fin whales under WhaleTrack Ireland, a project that uses photo-ID to identify individuals and track their movements in and outside of Irish waters (https://iwdg.ie/whale-track-ireland). The IWDG Cetacean Sighting and Stranding Schemes have resulted in the IWDG receiving large numbers of images and footage of whales in Irish waters. The stranding database, data from WhaleTrack Ireland, and IWDG media catalogue were all examined from 1991 to 2024 for evidence of large whale entanglement. These cases were analyzed for spatial or temporal patterns in entanglement cases.
2.2.2 Fishing data
Fishing data were collected from two sources: the Vessel Monitoring System (VMS) data for vessels of 12 m or longer and landings records for the Irish potting fleet under 12 m. Only the impact of pots used for lobsters and brown crabs were investigated. Other species targeted with pots such as shrimp (Palaemon serratus) were considered low risk due to their placement inside bays and estuaries. Whelk pot fisheries in the south Irish Sea were excluded as catch rate data for the fishery, which would be used to estimate total effort relative to landings, which were not available.
2.2.2.1 Vessel monitoring system data
VMS records and transmits the geographic location (latitude and longitude) and speed of fishing vessels of ≥12 m (Gerritsen and Kelly, 2019) at least every 2 h (Lordan and Gerritsen, 2011). The Sea Fisheries Protection Authority (SFPA) collects these data from Irish vessels and provides it to the Marine Institute (MI) on a regular basis (Tully, 2017). The VMS data do not include information on fishing gears. To identify which vessels were using pots, the VMS was linked by time and date to logbook data, which record the fishing gear being used on that date. To identify when a potting vessel was fishing, a speed filter was applied to the VMS data using gear-specific speed ranges for potting in Lordan and Gerritsen (2011). Speed was estimated from the change in position per time interval between two VMS records. Pot fishing effort, in hours per year, for all Irish potting vessels were aggregated to a 1-km² raster grid for years 2014–2018.
Fishing hours per year per 1 km2 were joined to the 10 × 10 km² vector polygon reference grid, to aggregate the fishing effort per 100-km² grid cell. As with the whale data, geographic analysis and map creation were carried out using QGIS, version 3.28.2. All maps were created in the projected coordinate system ETRS 1989 LAEA – EPSG: 3035. These were used to analyze overlap between fishing effort of vessels ≥12 m and whale densities.
2.2.2.2 Landings data
Vessels between 10 and 12 m in length report the method of fishing employed and landings data by species per ICES rectangle in logbooks (Northridge et al., 2010), which is reported to the International Council for the Exploration for the Sea (ICES) (International Council for the Exploration of the Sea, 2023; Gerritsen and Hans, 2024). Days at sea can be estimated from these declarations. One logbook declaration per vessel is usually reported per day.
Vessels <10 m in length do not report landings, but the volume, the value of the catch by species, and port of sale are reported in sales notes by registered buyers (Tully, 2017; Marine Institute, 2021). There is no fishing effort information or other location data associated with the sales data. The SFPA is responsible for collecting and managing all landings data from Irish vessels (Tully, 2017). For vessels <10 m, landings were assigned to a specific ICES rectangle by assuming that fishing occurred in the ICES rectangle where the port of sale was located. Landings (tons) were aggregated by ICES rectangle by species. An arbitrary threshold value of 1 ton or less was used to remove ICES rectangles where it was “most likely” that lobsters and crabs were not the targeted species and were caught as bycatch in fishing gears other than pots.
The pot density in the water (Pd; number of pots per km2) was calculated by dividing the number of pots hauled by the number of hauling events. To calculate the number of pots hauled, the landings of vessels under 12 m (L<12) are divided by the annual average landings per unit of effort (LPUE; kg/pot). The LPUE are reported to the Marine Institute and Bord Iascaigh Mhara (BIM) by approximately 75 sentinel potting vessels (SVP) annually and were used to estimate LPUE at the ICES rectangle level for trips targeting either crab or lobster. Hauling events are estimated as the number of days at sea (D) divided by the soak time of the pot (S). The annual average soak time for trips targeting crab and lobster derived from the SVP database was 3.4 days for both species.
Pot densities (number of pots per km2) were joined at the ICES rectangle level and were calculated by dividing the number of pots in the rectangle by the ICES rectangle area (km2) using the join tool in QGIS. The pot densities of the entire Irish fleet were compared to the whale density maps to determine spatial overlap.
2.3 Risk assessment
The risk of entanglement was calculated through the index of co-occurrence developed by Northridge et al. (2010), the “risk of entanglement measure (REM)”. This index identifies areas with the greatest co-occurrence of the fishing/potting effort and whales and therefore represents the highest risk of a whale–pot interaction that may result in entanglement.
The risk of entanglement was calculated for vessels of ≥12 m utilizing the fishing effort calculated from the VMS data and the potting effort derived from the landings data for vessels of <12 m. To create an overlap at the same resolution with the sightings data, both the fishing effort of VMS carrying vessels and the whale distribution data were plotted at a resolution of 10 × 10 km² (100 km²). For the potting effort for the Irish fleet, the whale distribution data were plotted at the ICES rectangle level.
The whale density (W) and the pot fishing effort, fishing hours/year/km2, and number of pots/km2 for vessels of ≥12 m and <12 m, respectively (P), and their respective means (ŵ and Ṗ) were calculated for each grid cell using QGIS, version 3.28.2 as per Section 3.1 for whale data and Section 3.2 for fishing data. For each grid cell, the measure of difference relative to overall means was calculated as W/ŵ for whale sightings and P/Ṗ for fishing data. Ratios greater than 1 indicate higher-than-average whale densities or higher-than-average potting densities. The product of the two measures creates an index of the relative spatial risk of co-occurrence and entanglement.
The REM was calculated and represented spatially for each individual whale species and the fishing effort as well as with the potting effort. Furthermore, the sightings data were combined for all three species, and the REM was calculated for all whales combined for <12-m vessels. Areas of co-occurrence were also compared with the Areas of Interest (AoI) for future Marine Protected Areas. These were identified by Classen et al. (2022) by analyzing ecological data and assessing species of conservation importance (including large whales). Comparing the REM with potential future MPA helps inform stakeholders in management decisions surrounding the pot fisheries in important marine habitats. All maps were created QGIS, version 3.28.2 and in the projected coordinate system ETRS 1989 LAEA – EPSG: 3035.
3 Results
3.1 Spatial and temporal distribution of whale sightings and entanglements
A total of 1,354 sightings (2,906 individuals) of humpback whales, 4,573 sightings (15,236 individuals) of minke whales, and 2,215 sightings (6,403 individuals) of fin whales were recorded between 1 January 2005 and 31 December 2022 in Ireland’s EEZ (8,142 sightings/24,545 individuals total). Most (88%) sightings occurred within the 12 NM limit. Sightings were recorded off all coasts, with the highest densities recorded off the south and southwest coasts (Figure 2). Minke whales had the highest densities reported for the 2005–2022 period with 10.89 individuals per km², followed by the fin whale (4.69 individuals/km²) and the humpback whale (3.20 individuals/km²).
Figure 2
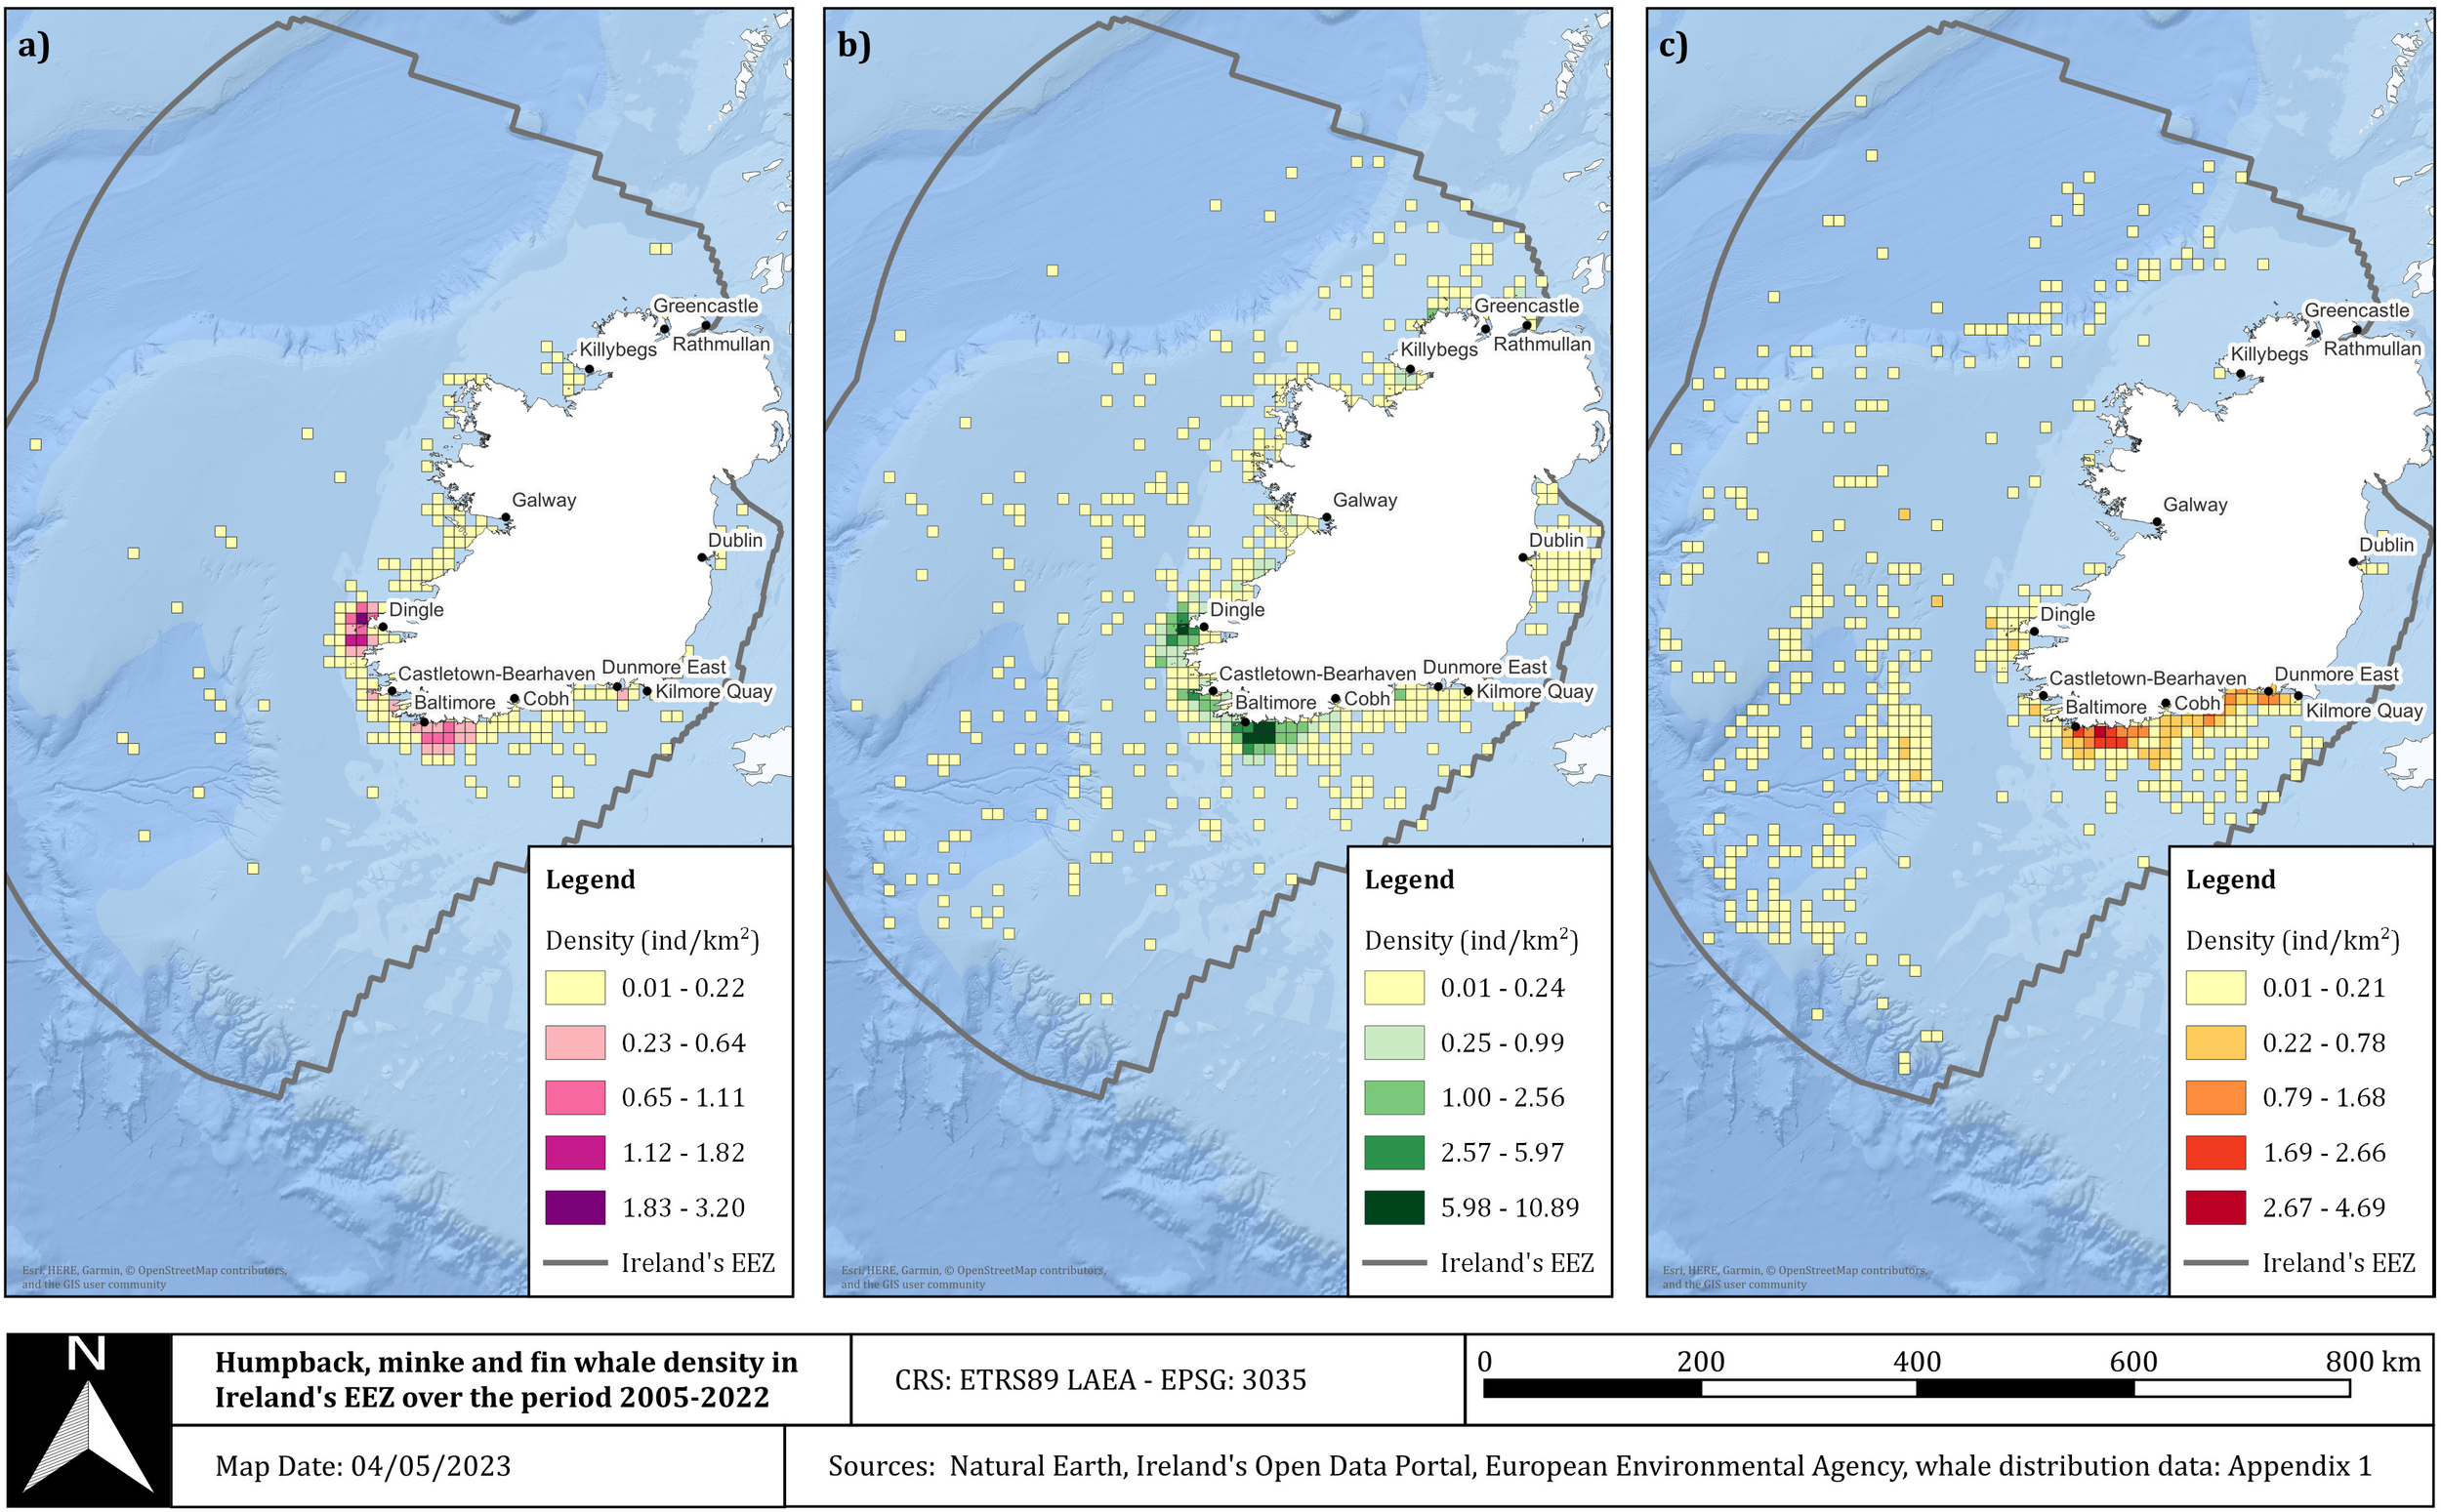
Spatial density of (a) humpback, (b) minke, and (c) fin whales in the Irish EEZ between 2005 and 2022, displayed on a 10 × 10 km² grid.
The south and southwest coasts, specifically the Dingle Peninsula in County Kerry and the Beára Peninsula in County Cork, were hotspots for humpback and minke whale sightings. Both species were more prevalent within the 12 NM limit where 96% of sightings occurred. Minke whales were sighted over a broader distribution range, occurring more frequently off the north, northwest, and east coasts of Ireland than humpback whale. While the majority of fin whale sightings (76%) were recorded within the 12 NM limit, they were also sighted at the Porcupine Seabight and continental slopes to the northwest of Ireland. Fin whales were rarely recorded off the east coast of Ireland with a few exceptions around Dublin. Humpback and minke whales were almost entirely absent from the northeast coast (Counties Down, Antrim and Derry) (Figure 2).
The sighting reports of the non-target species were concentrated in the south, with the southwest coast of Ireland in County Kerry and the south coast of County Cork having some of the highest densities at 10.98 sightings/km² and 4.99 sightings/km², respectively. Similarly, the coast near Dublin Port in County Dublin shows high sighting records with up to 8.52 sightings/km². The rest of the east coast along with the west and northwest coasts generally produced less sightings reports. While there were offshore sighting reports, these were generally scattered and at a lower density (Figure 3).
Figure 3
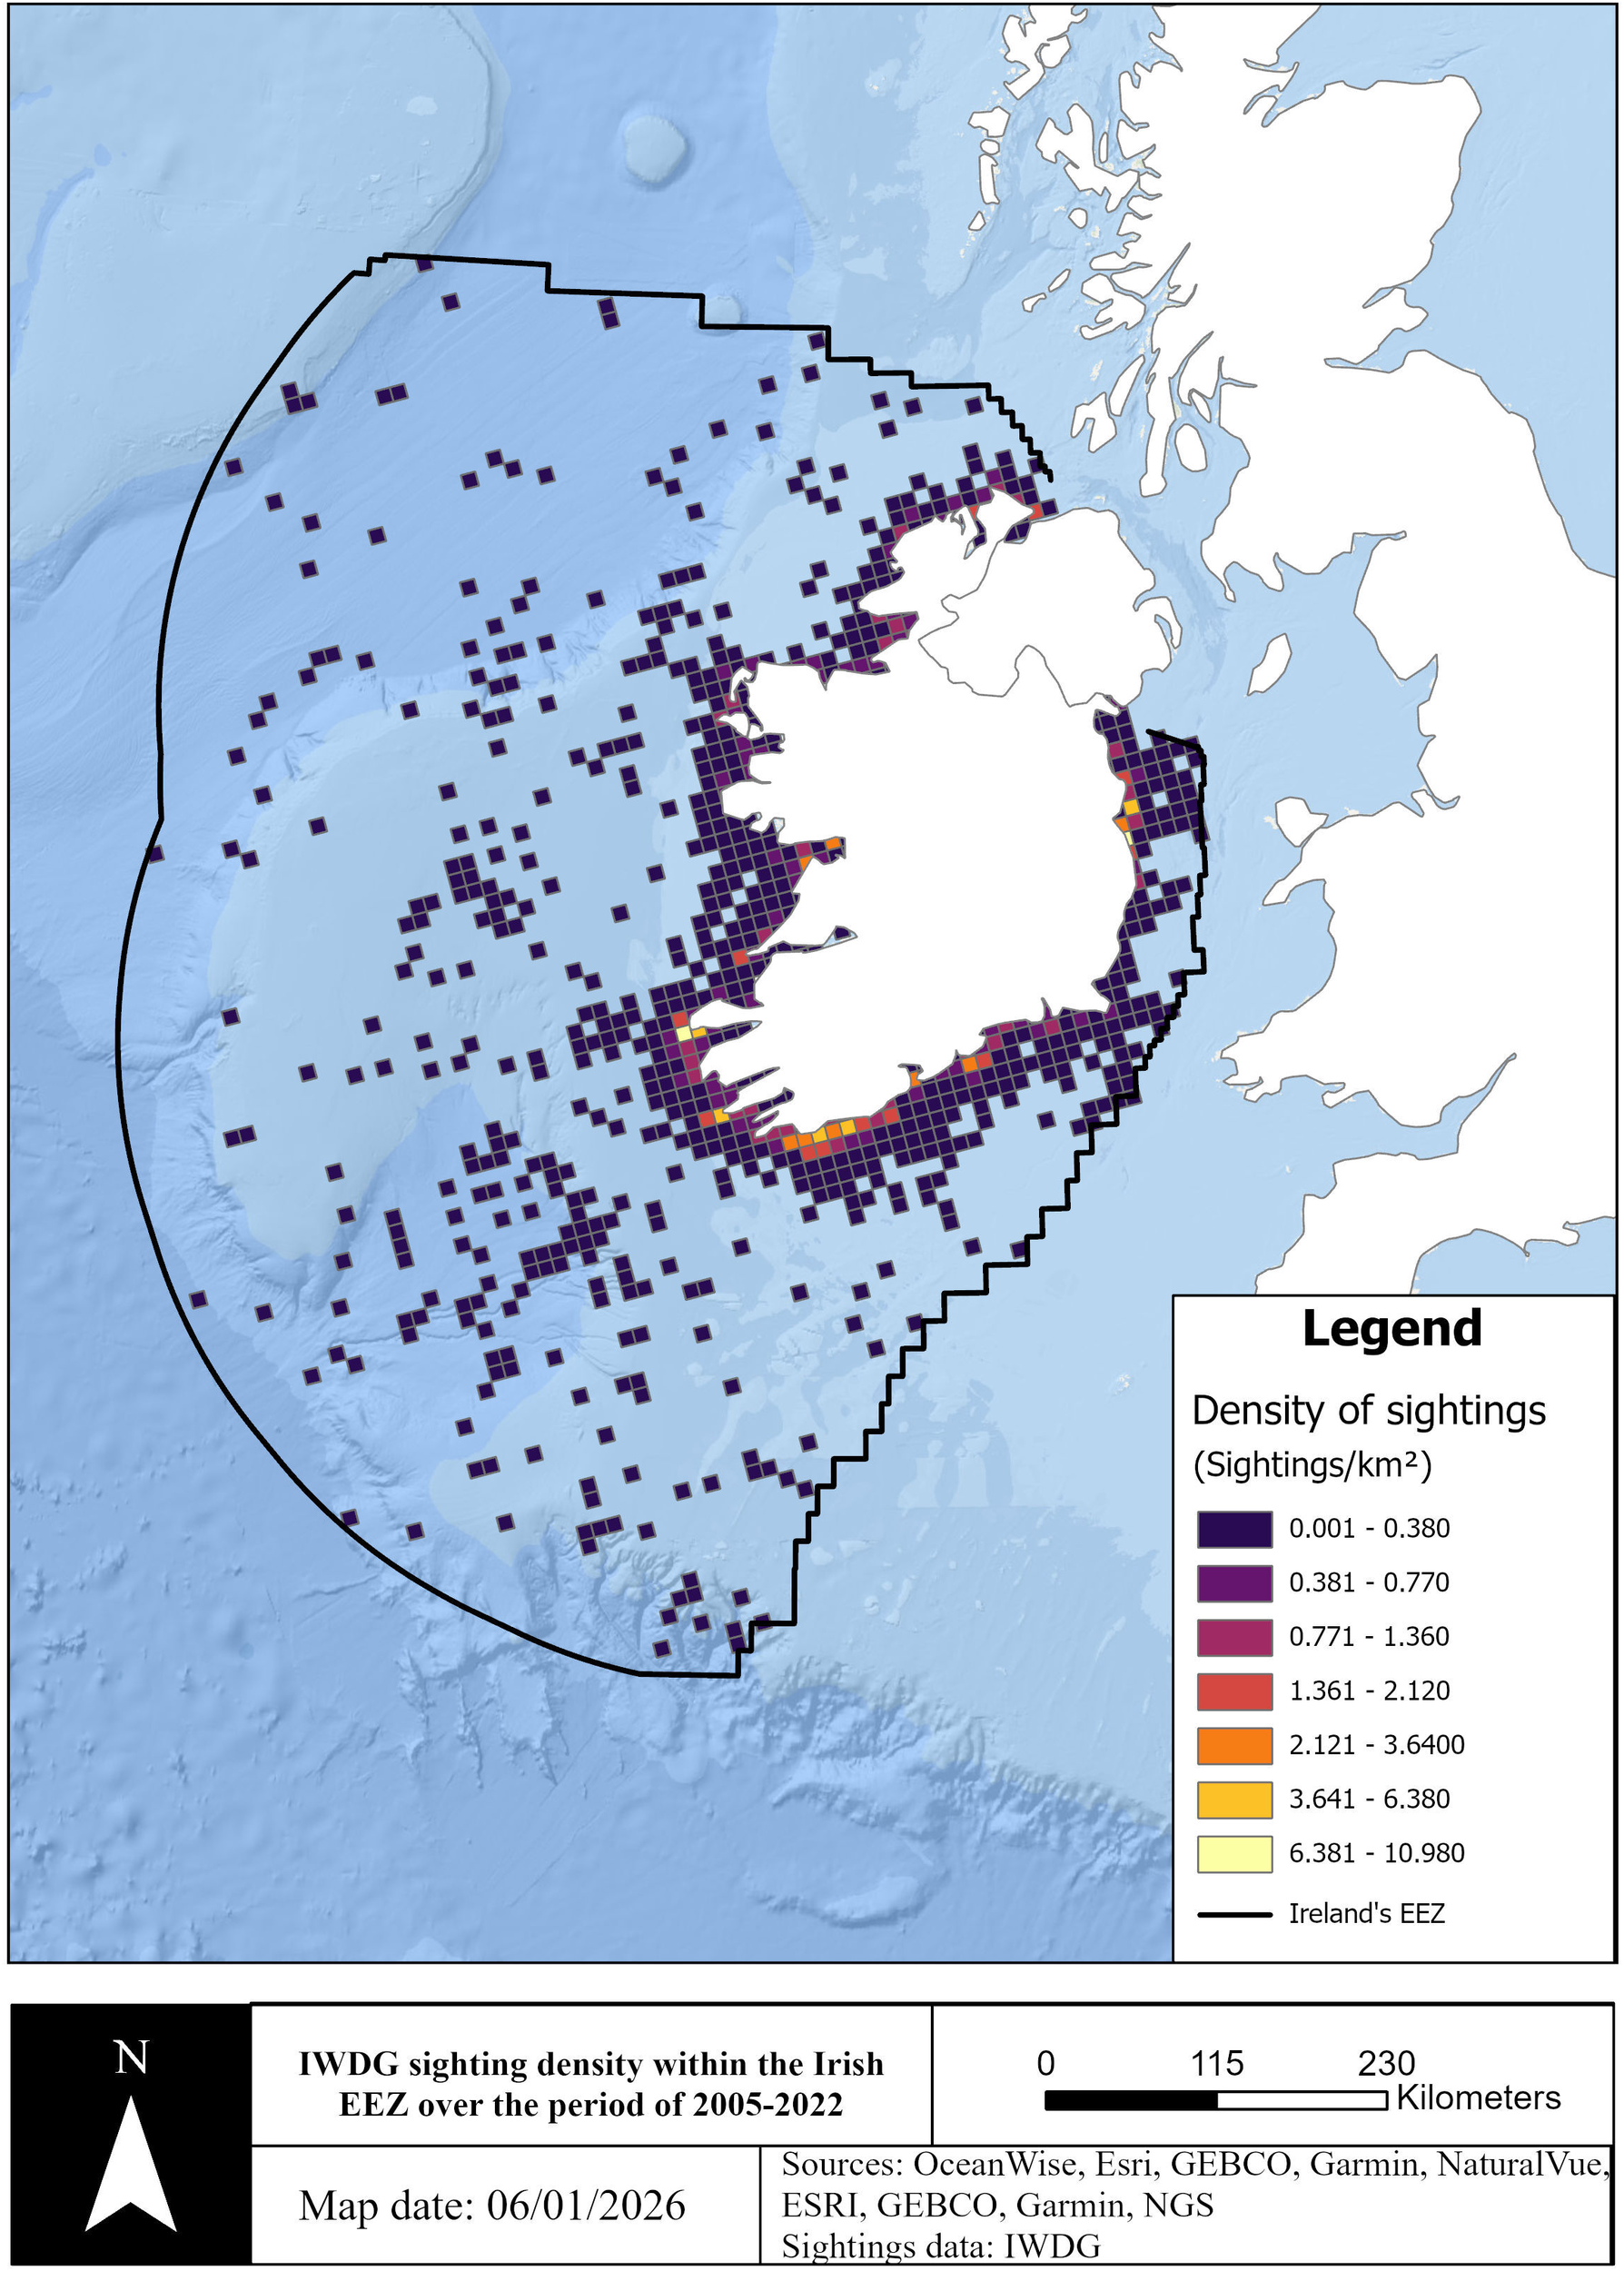
Spatial density of the IWDG sightings’ records of the non-target species between 2005 and 2022 within the Irish EEZ, displayed on a 10 × 10 km² grid. Densities are reported as the number of reported sightings per square kilometer.
The highest group size variation was recorded for minke whale (1 to 80 individuals), although 57% of sightings were of single individuals. Group sizes for humpback and fin whale were generally smaller and varied from 1 to 15 and 1 to 36 individuals, respectively. Because mean group size varied quite significantly for the different whale species, the total number of individuals was presented instead of the number of sightings.
All three whale species were reported throughout the year over the study period. Humpback whale “high season” was considered when numbers were above the overall study average of 13 individuals per month. This was the case from May to October, with peak months from July to September. The number of minke whales reported from April to August exceeded the overall study average of 71 individuals, with peak months from May to July. For fin whales, the high season was later in the year, with numbers above the average of 30 being reported from July to December, with peak months from September to November.
From the IWDG strandings records, WhaleTrack scheme, and media bank, a total of 27 entanglements of large whales were identified, of which 11 were possible entanglements and 16 were definite cases of entanglements. In only 6 of the 27 cases could the source of the entanglement be confirmed as coming from static fishing gear.
Of the 201 stranded large whales (160 minke whales, 32 fin whales, and 9 humpback whales), 2 possible and 12 definite entanglement-related strandings of minke whale were found. Therefore, an estimated 8.8% of all minke whale strandings were likely related to entanglements between 1991 and 2024. The year 2021 identified the most entanglements (n = 4) or 26.7% of all minke whale strandings that year. These strandings were recorded between May and October, with nearly half (n = 6) occurring in May. The strandings were found along predominantly along the west, southwest, and south coast (Figure 4). Only two of all the entanglement cases could be confirmed as entangled within static gear, with all others only having injuries consistent with entanglement, or with unidentified ropes found on the body (Table 1).
Figure 4
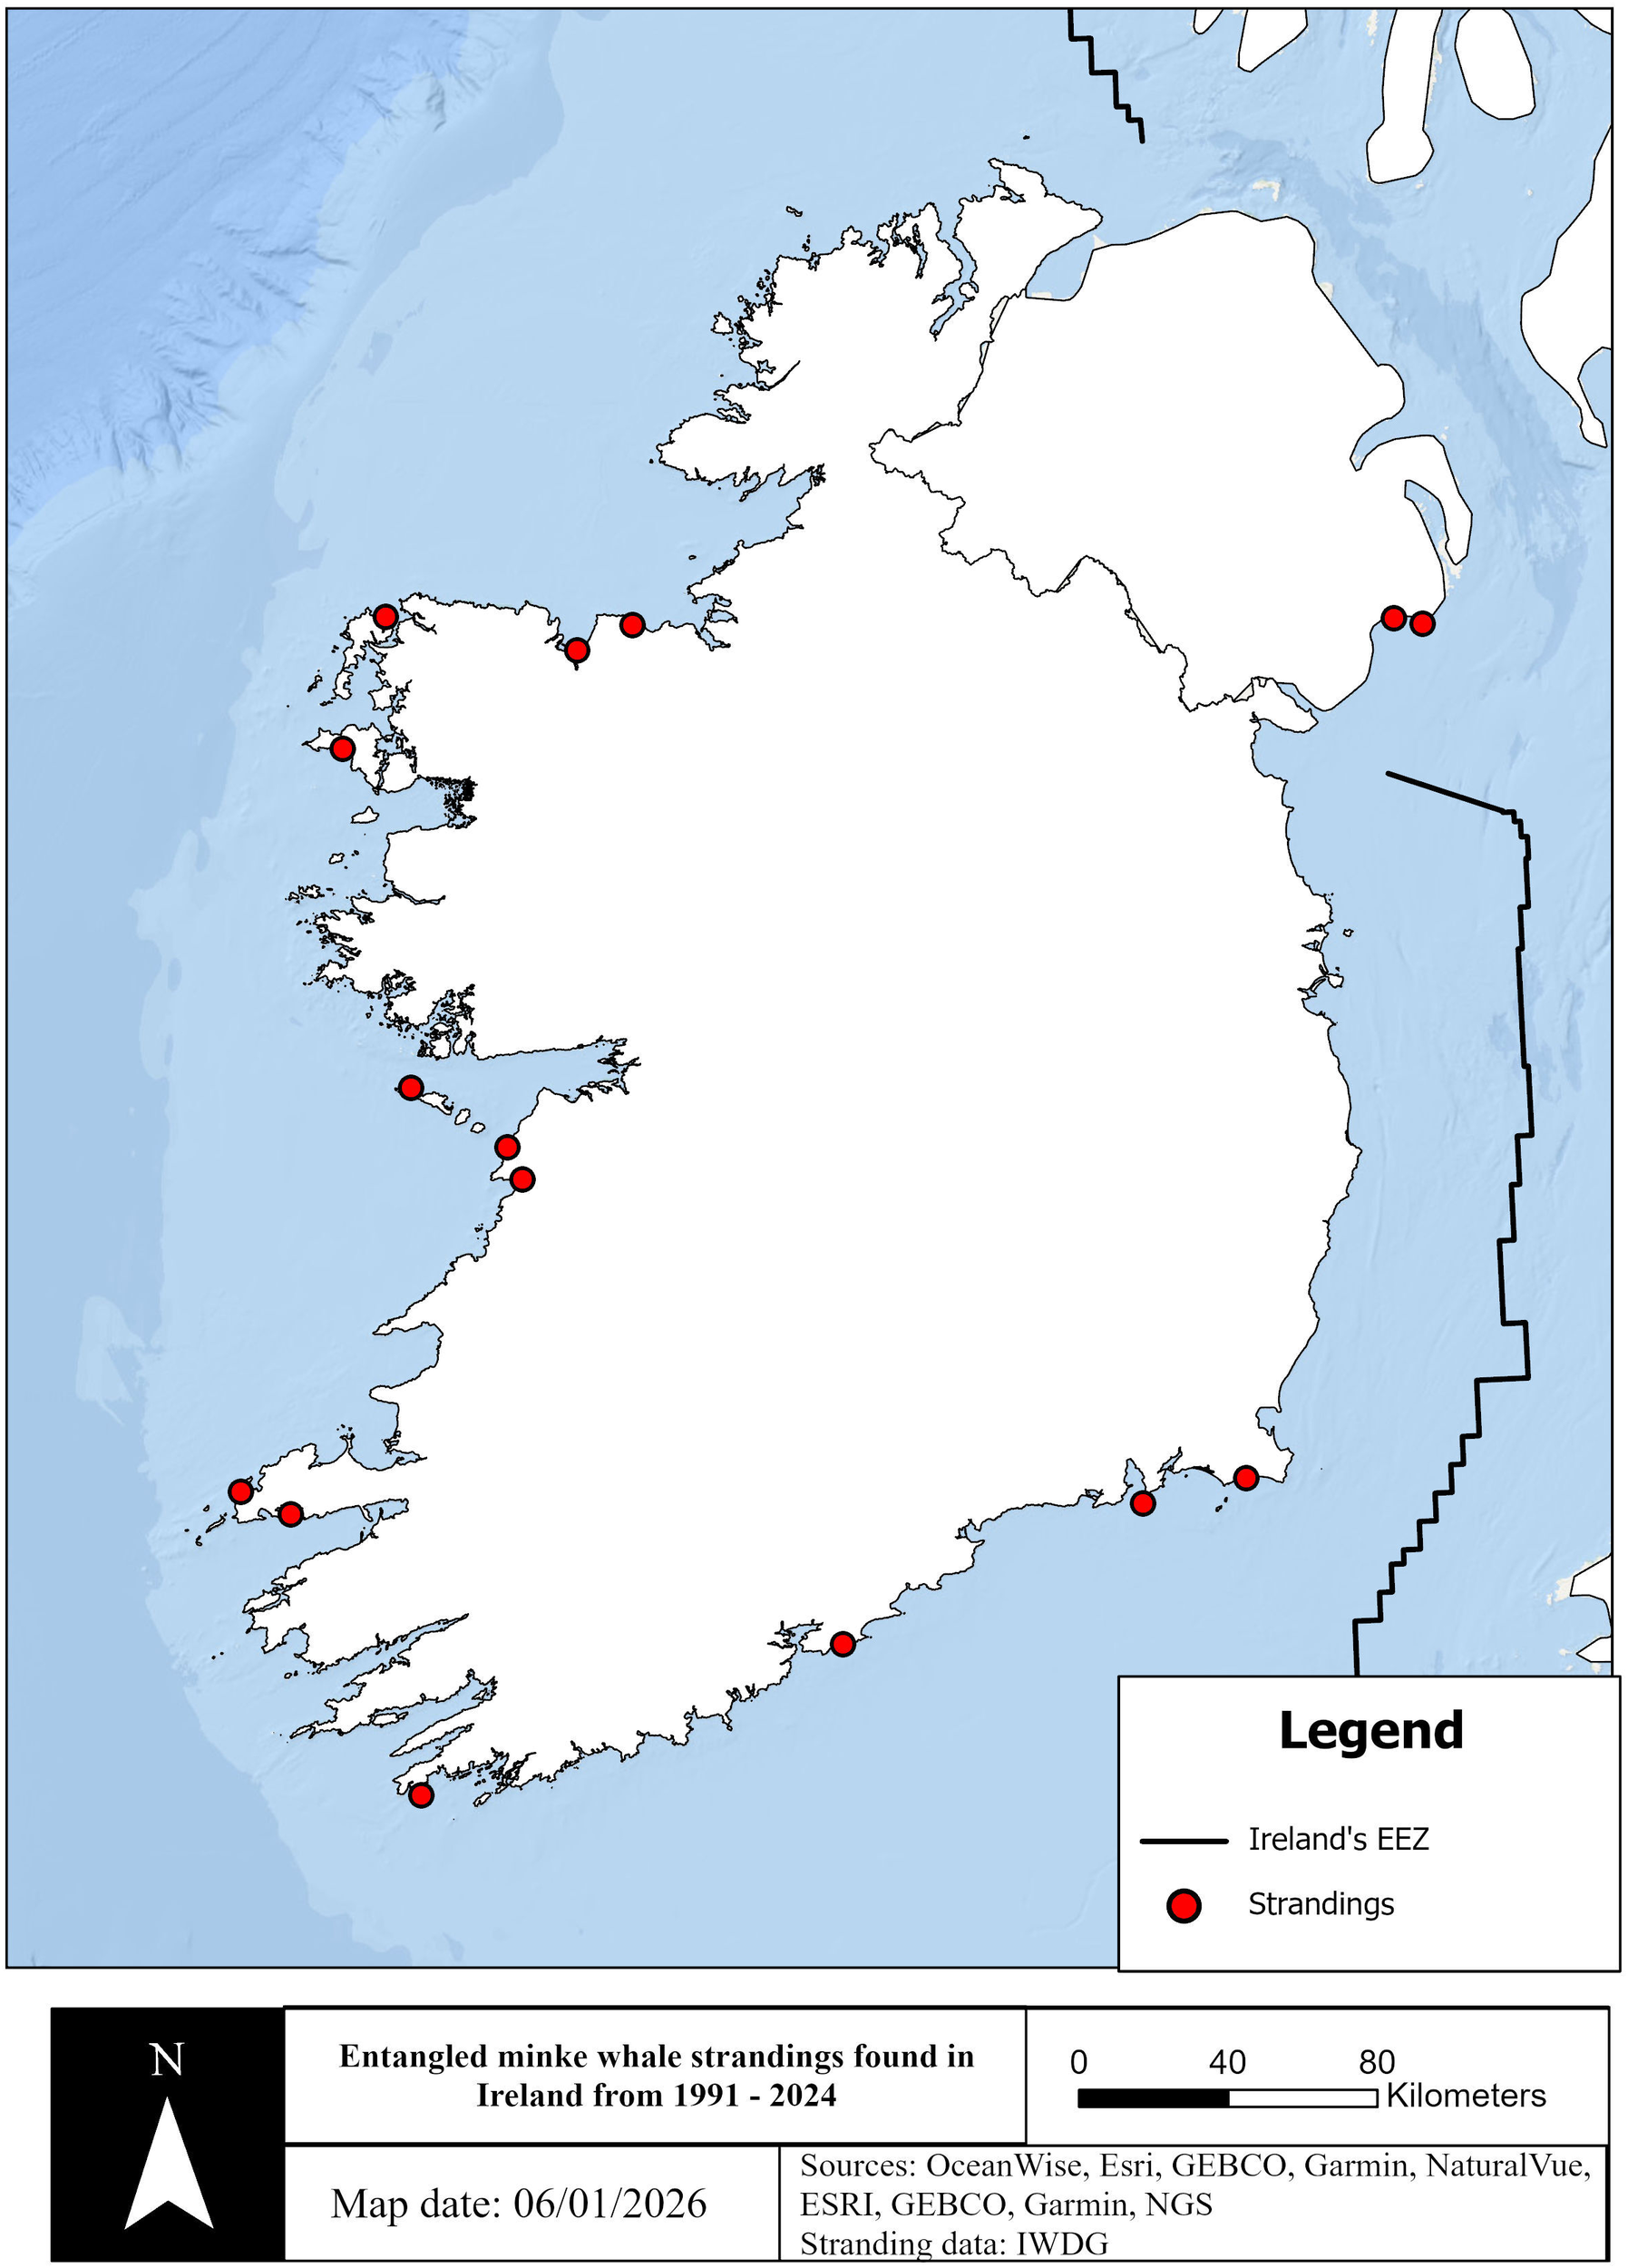
IWDG strandings from 1991 to 2024 with signs of possible or definite entanglement.
Table 1
| Species | Data origin | Date | Found in county | Entanglement | Details |
|---|---|---|---|---|---|
| Fin whale | WhaleTrack | 25/10/2007 | Cork | Possible | Old scars |
| Fin whale | WhaleTrack | 26/11/2008 | Cork | Possible | Old scars |
| Fin whale | WhaleTrack | 26/11/2008 | Cork | Possible | Old scars |
| Fin whale | WhaleTrack | 15/08/2014 | Cork | Possible | Rope wounds |
| Humpback whale | IWDG Media | 26/08/2004 | Donegal | Yes | Entangled in lobster pots from Donegal, drowned |
| Humpback whale | IWDG Media | 01/02/2005 | Donegal | Yes | Entangled in fishing gear from Donegal, fate unknown |
| Humpback whale | IWDG Media | 21/06/2009 | Wexford | Yes | Entangled in lobster pots from Wexford, cut free |
| Humpback whale | WhaleTrack | 25/06/2015 | Kerry | Possible | Old scar |
| Humpback whale | WhaleTrack | 25/09/2015 | Cork | Possible | Old scar |
| Humpback whale | WhaleTrack | 11/10/2020 | Cork | Possible | Wound on peduncle |
| Humpback whale | WhaleTrack | 08/06/2022 | Cork | Possible | Wounds |
| Humpback whale | WhaleTrack | 29/07/2022 | Kerry | Possible | Scars |
| Humpback whale | IWDG Media | 07/09/2023 | Donegal | Yes | Entangled in pot lines from Donegal, fate unknown |
| Minke whale | Stranding records | 10/07/1995 | Cork | Yes | Deceased |
| Minke whale | Stranding records | 02/05/2009 | Wexford | Yes | Rope marks on tail stock, deceased |
| Minke whale | Stranding records | 16/09/2009 | Sligo | Yes | Drowned post entanglement in lobster pots, deceased |
| Minke whale | Stranding records | 28/05/2010 | Clare | Yes | Drowned post entanglement in lobster pots, deceased |
| Minke whale | Stranding records | 21/07/2016 | Down | Yes | Entangled in ropes, deceased |
| Minke whale | Stranding records | 08/06/2017 | Kerry | Possible | Rope marks on tail stock, deceased |
| Minke whale | Stranding records | 22/06/2019 | Clare | Yes | Rope marks on tail stock, deceased |
| Minke whale | Stranding records | 09/09/2019 | Down | Yes | Rope marks on tail stock, deceased |
| Minke whale | Stranding records | 15/05/2021 | Kerry | Yes | Rope marks on tail stock, deceased |
| Minke whale | Stranding records | 19/05/2021 | Cork | Yes | Rope marks on tail stock, deceased |
| Minke whale | Stranding records | 23/05/2021 | Mayo | Yes | Rope marks on tail stock, deceased |
| Minke whale | Stranding records | 24/08/2021 | Galway | Yes | Rope marks on tail stock, deceased |
| Minke whale | Stranding records | 03/05/2023 | Wexford | Possible | Rope marks on tail stock, deceased |
| Minke whale | Stranding records | 25/07/2023 | Mayo | Yes | Entangled in ropes, deceased |
Table of all IWDG’s possible/definite entanglement records of fin whales, humpback whales, and minke whales in Ireland from 1991 to 2024.
The WhaleTrack catalogue contained 136 humpback whales and 53 fin whales. Evidence of possible previous entanglement was found for 5 humpback whales and 4 fin whales. These 9 whales all showed scarring or injury consistent with entanglement in ropes (Robbins, 2012; Mooney, 2003), although the origin of the ropes could not be defined (Table 1).
Additionally, four humpback whale entanglements were identified from the wider IWDG media bank. All four animals were seen with lobster pots and lines tangled on their body. The fate of two of the whales remains unknown. One individual was found drowned after initial reports of the entanglement while the other whale was disentangled by the local lifeboat crew. It could be confirmed, due to markers on the fishing gear, that two of the whales had gotten entangled in Donegal, with one of the others becoming entangled in Wexford. No cases of live entangled fin whales or minke whales were ever reported to the IWDG (Table 1).
3.2 Spatial and temporal fisheries distribution
Fishing effort by vessels ≥12 m during the period 2014–2018 was mostly confined to waters inside 12 NM, apart from off the northwest where it extended to the edge of the continental shelf. Fishing effort varied between 0.18 and 1,408 h per year per 100 km², with the highest fishing effort recorded south of Dublin (1,408 h/year/100 km2), off north Donegal (1,019 h/year/100 km2), and near Rathmullan, County Donegal (649 h/year/100 km2). No fishing effort by vessels ≥12 m was recorded off the south coast of Ireland, off the east coast (north of Dublin), or southwest/west of Killybegs, County Donegal. Fishing effort was generally higher off the north coast, off the east coast (south of Dublin), and off the southwest coast around Dingle Bay, County Kerry. Of the annual average 12,252 h per year spent fishing, 48% occurred inside 12 nm. The annual average fishing days per year was 118 days (Figure 5).
Figure 5
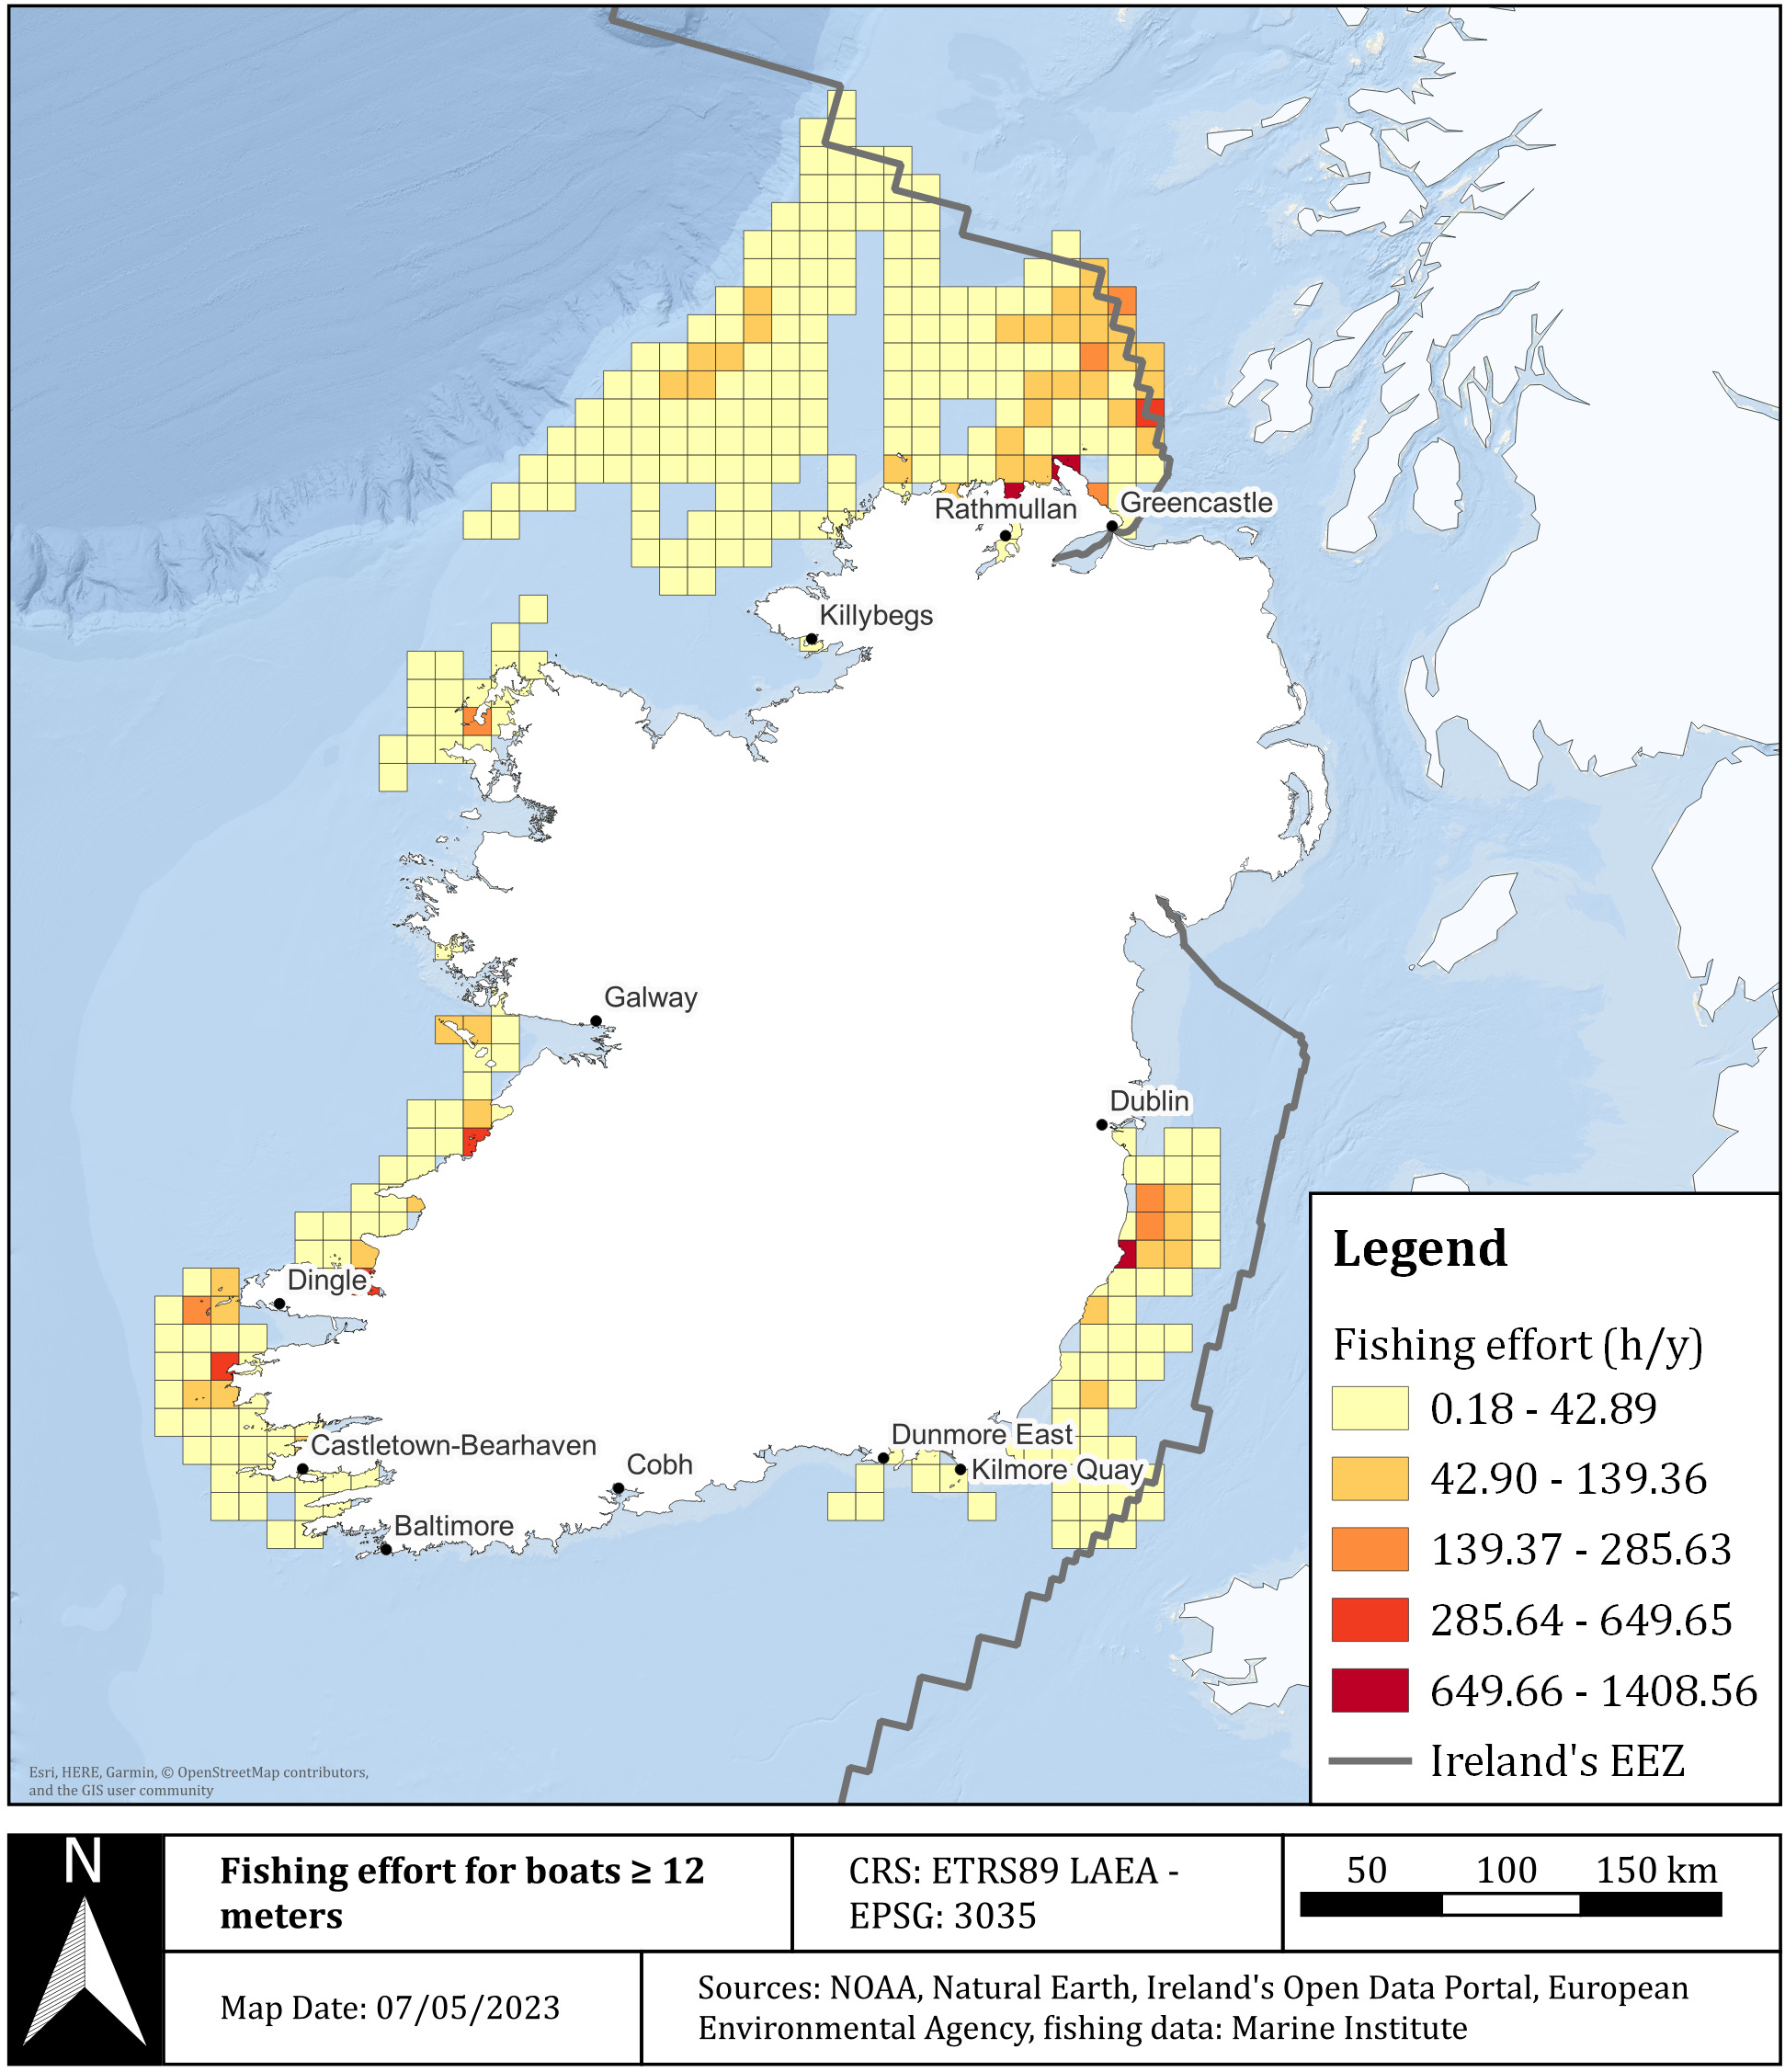
Spatial distribution of fishing effort by Irish vessels ≥12 m in length using pots in the Irish EEZ in 2014–2018, displayed on a 10 × 10 km² grid. Fishing effort is reported as average fishing hours per year.
Estimated pot densities (number of pots per km2) at the ICES rectangle level for the Irish potting fleet of >12 m are shown in Figure 6. Densities varied between 0.34 and 37.27 pots/km². Higher densities were reported in ICES rectangles adjacent to the coast, with the exception of ICES rectangles to the north, where high densities were also found on the continental shelf. The highest density (37.27 pots/km²) was recorded along the northeast border with Northern Ireland, which was due to a very high estimated number of pots (~2,800 pots) in a very small area (~75 km²). The second highest density was significantly lower (10.66 pots/km²) and was recorded off the southwest coast, in Dingle Bay, County Kerry. Based on the landings data, an estimated 120,000 pots were in use in the Irish fleet.
Figure 6
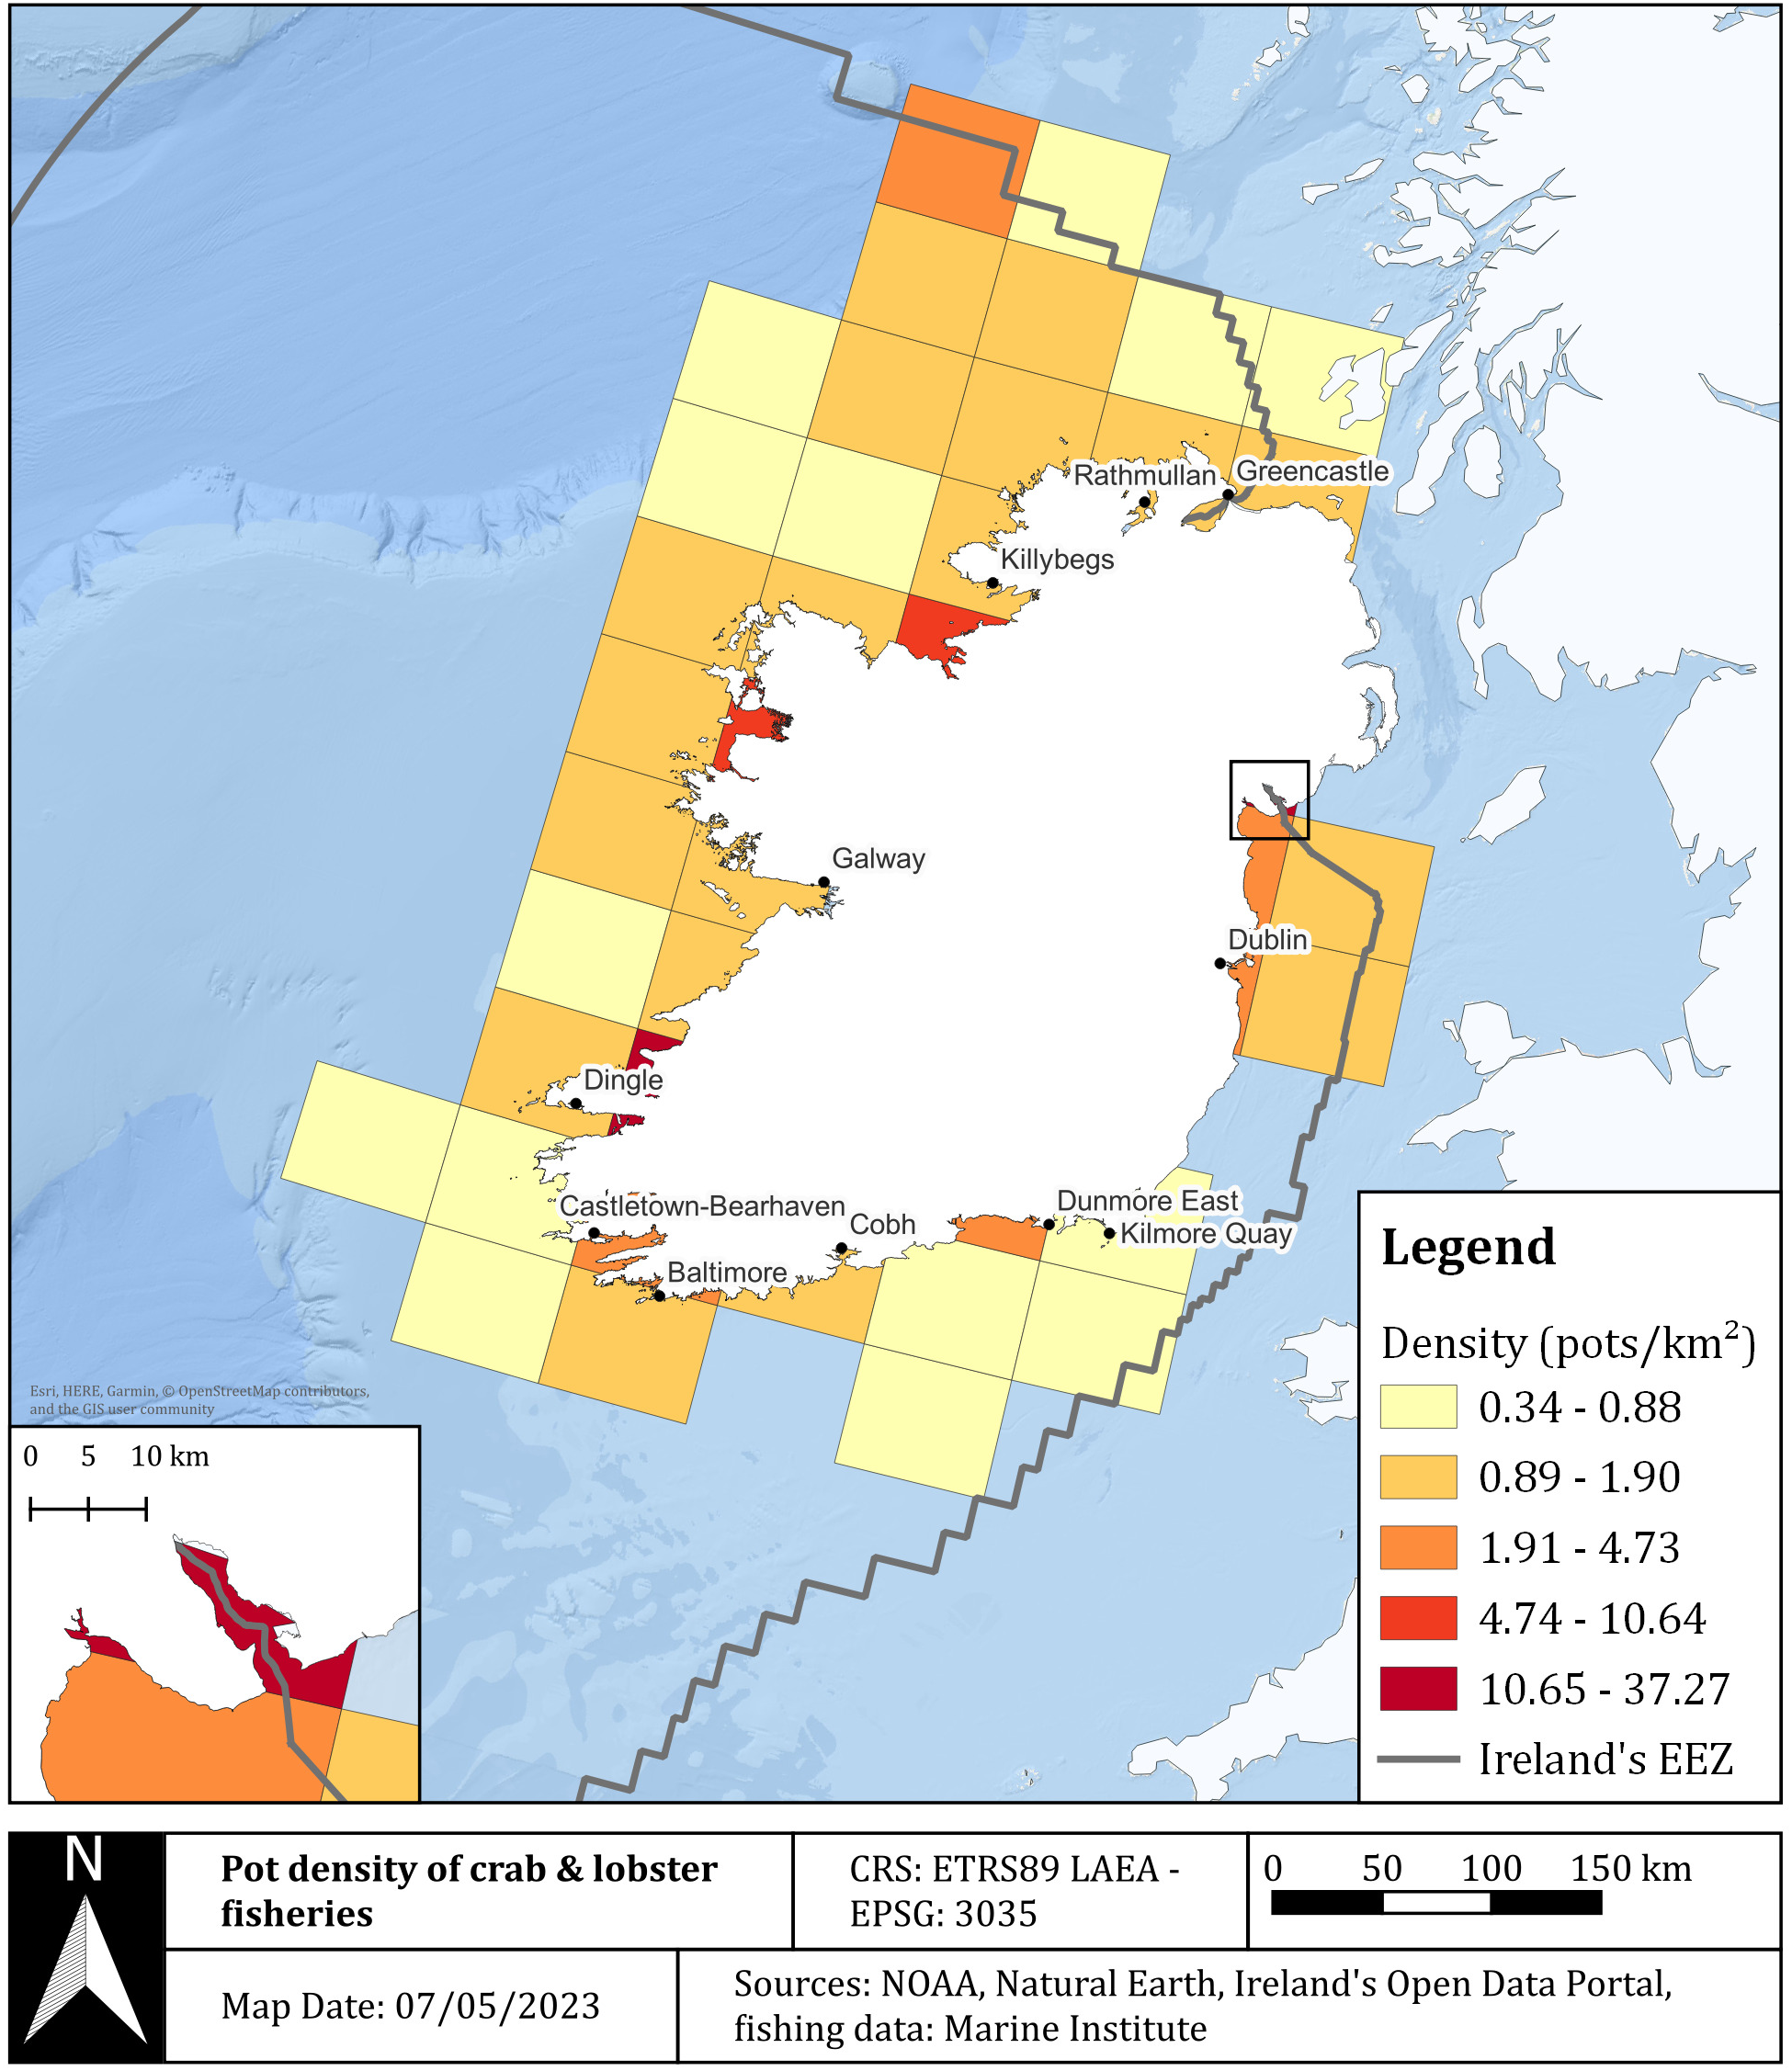
Spatial distribution of pot density for Irish fishing boats (>12 m) in the Irish EEZ, displayed by ICES rectangles.
3.3 Risk of entanglement
REM of pots from vessels ≥12 m and humpback whales were mostly located inside 12 NM waters, except for two areas located off the north coast (Figure 7a). The areas with the highest REM were located off the southwest coast between the Dingle (highest REM value of 190.74) and the Iveragh Peninsula (153.95) in County Kerry. Risk areas for minke whale were more widely distributed compared to humpback whale and included territorial waters of the north, east, and southeast coasts and locations close to the north edge of the EEZ (Figure 7b). Highest REM values for minke whale were also located off the southwest coast, with values of 146.46 reported off the Dingle Peninsula and 82.72 off the Iveragh Peninsula in County Kerry. There were fewer risk areas reported for fin whale, with most occurring off the southeast or southwest coast, in addition to a couple of risk areas found near the edge of the continental shelf (Figure 7c). Although a reduced risk for fin whale was reported compared to humpback and minke whale, the highest values were also reported off the Iveragh (68.12) and Dingle Peninsulas (30.65). Another location of higher risk (25.59) for fin whale was off the southeast coast.
Figure 7
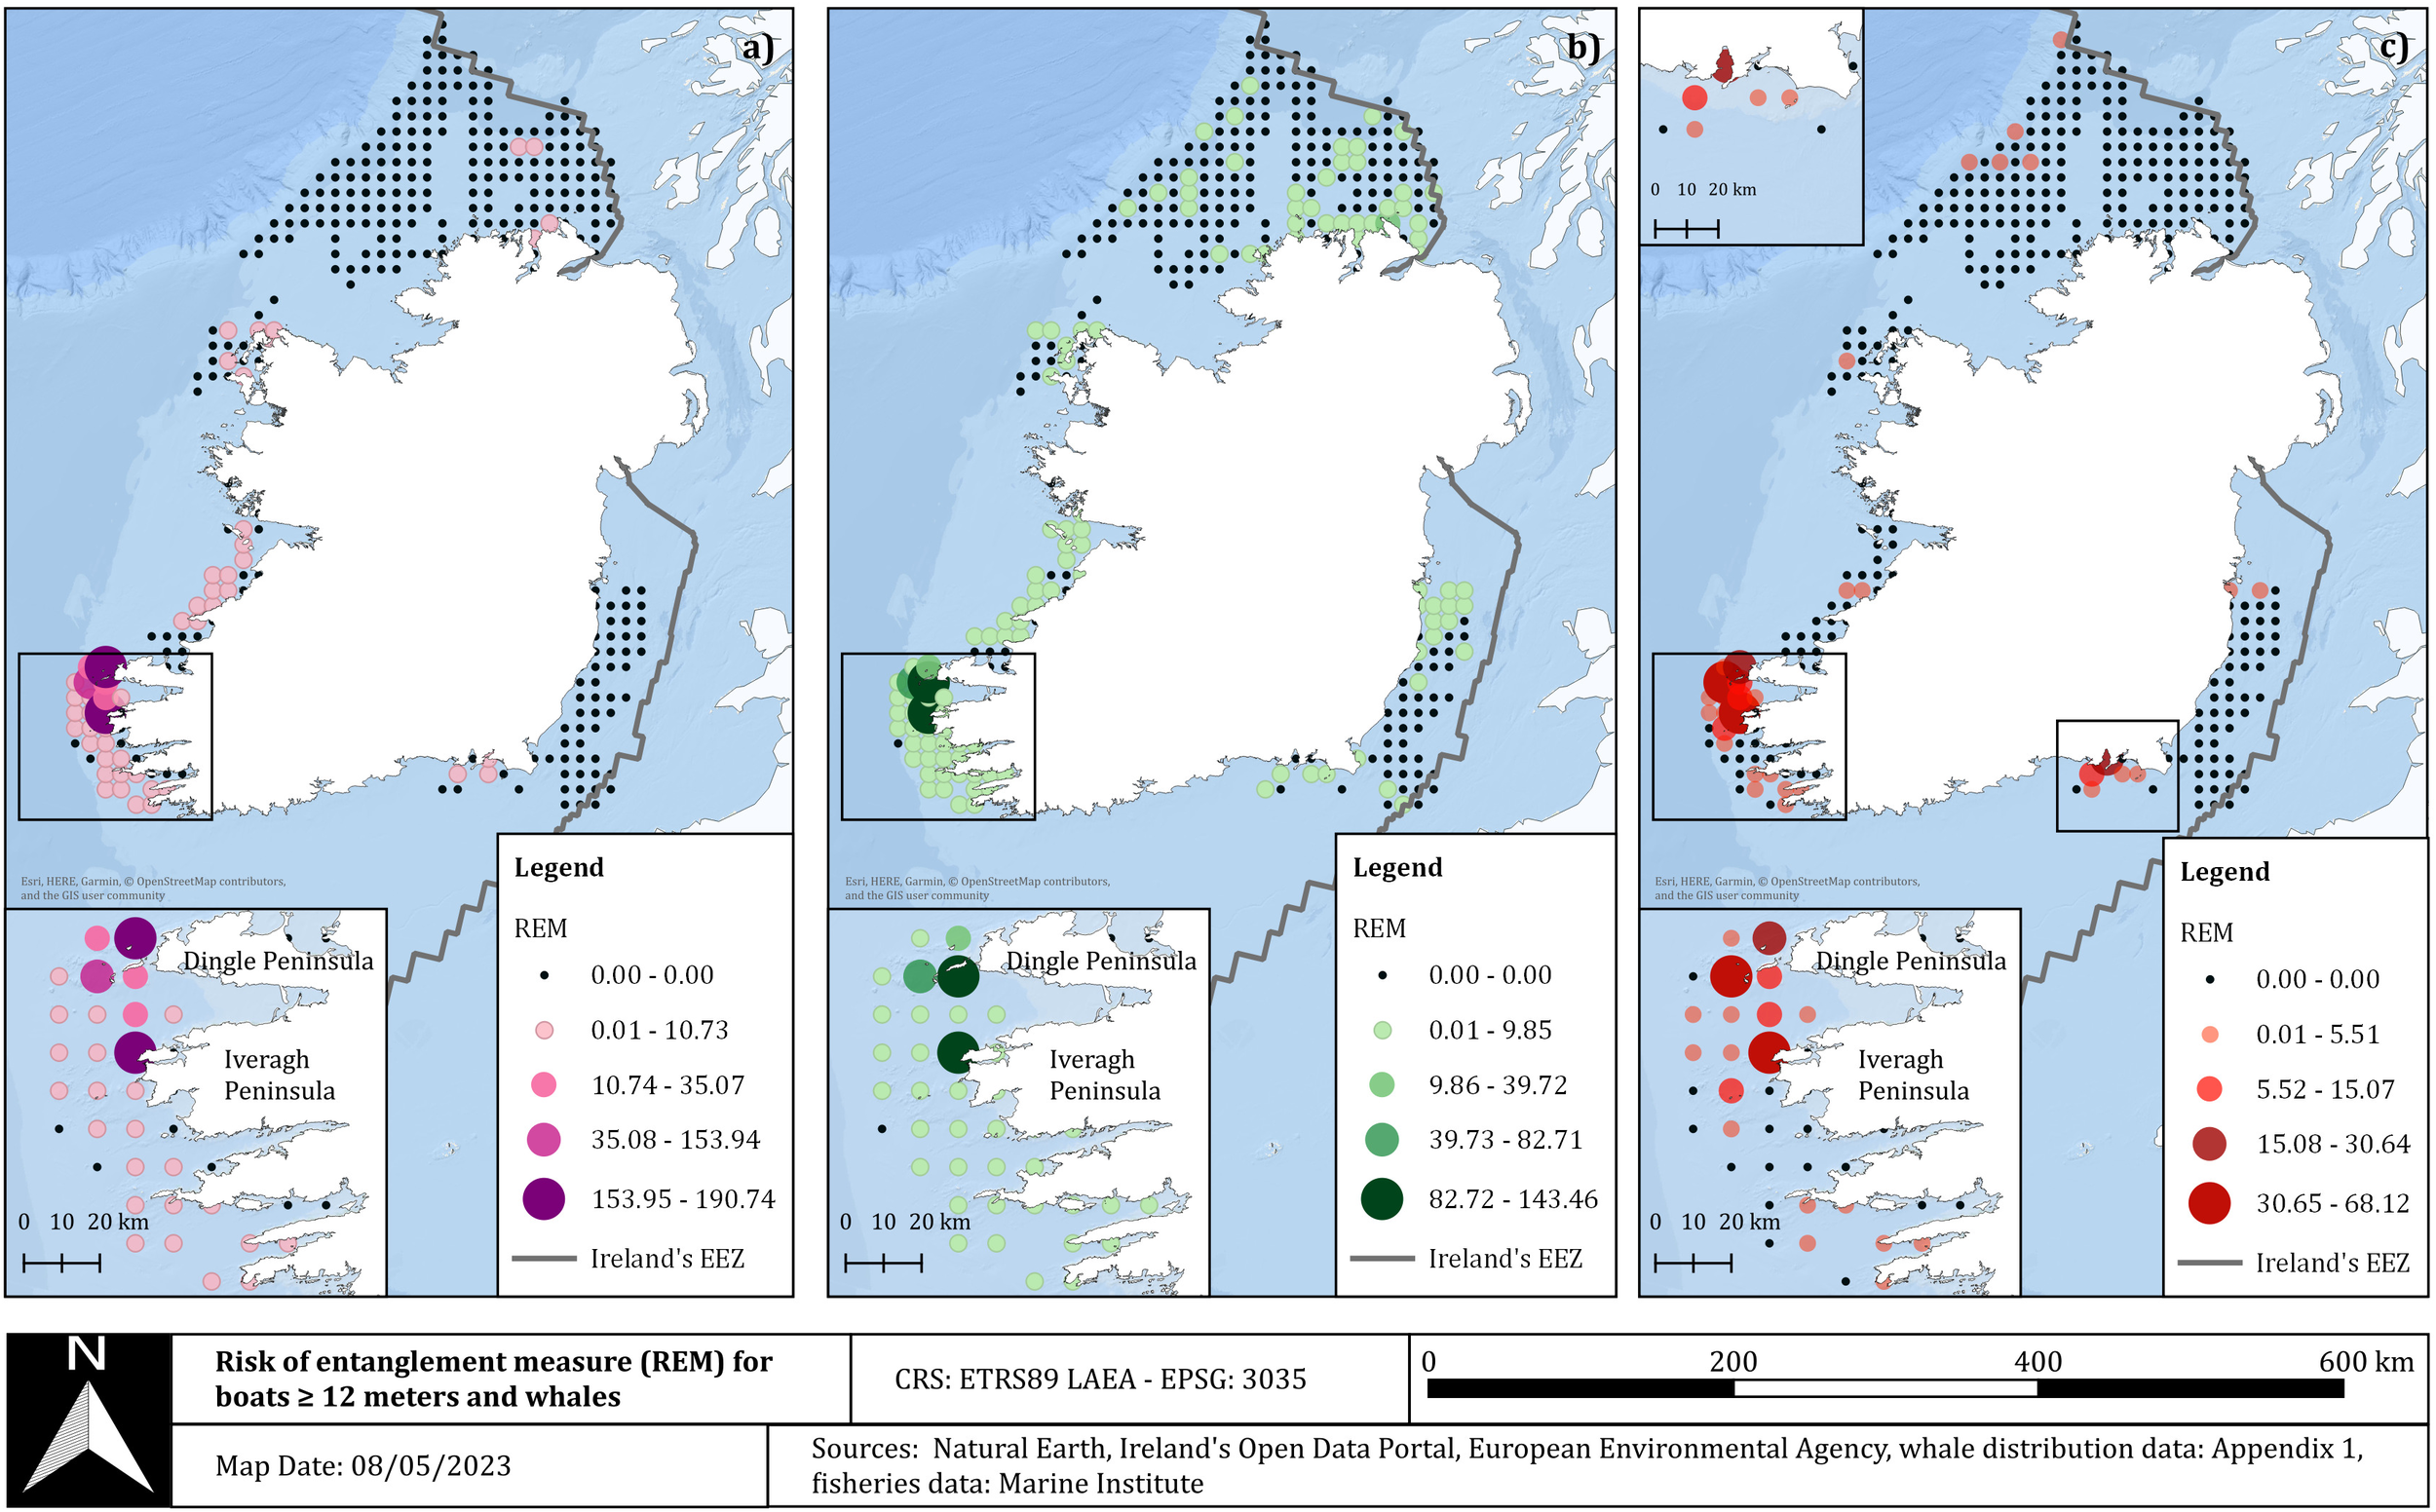
Risk of entanglement measure (REM) for boats ≥12 m in length and (a) humpback, (b) minke, and (c) fin whales in the Irish EEZ, displayed on a 10 × 10 km² grid. The black dots (= zero risk) indicate areas where fisheries are present, but no whales have been recorded during the study period (2005–2022).
The same assessment was carried out using the total number of pots for the Irish vessels of >12 m. The highest REM values for humpback, minke, and fin whales were located off the southwest and south coasts, with minke whale also having higher-risk areas off County Dublin and to the south of County Donegal. For humpback whales, the areas that showed the biggest risk were the ICES rectangle off Dingle in County Kerry (5.03), and in the southwest of County Cork (4.64). The highest risk area for minke whale was the ICES rectangle off the southwest coast of County Cork (8.78), followed by the southernmost tip of the county (4.42). For fin whale, the risk areas were more located along the south coast of Ireland, with the highest REM values recorded in County Waterford (19.81), with the second highest value located in the south of County Cork but was significantly lower (3.52) (Figure 8).
Figure 8
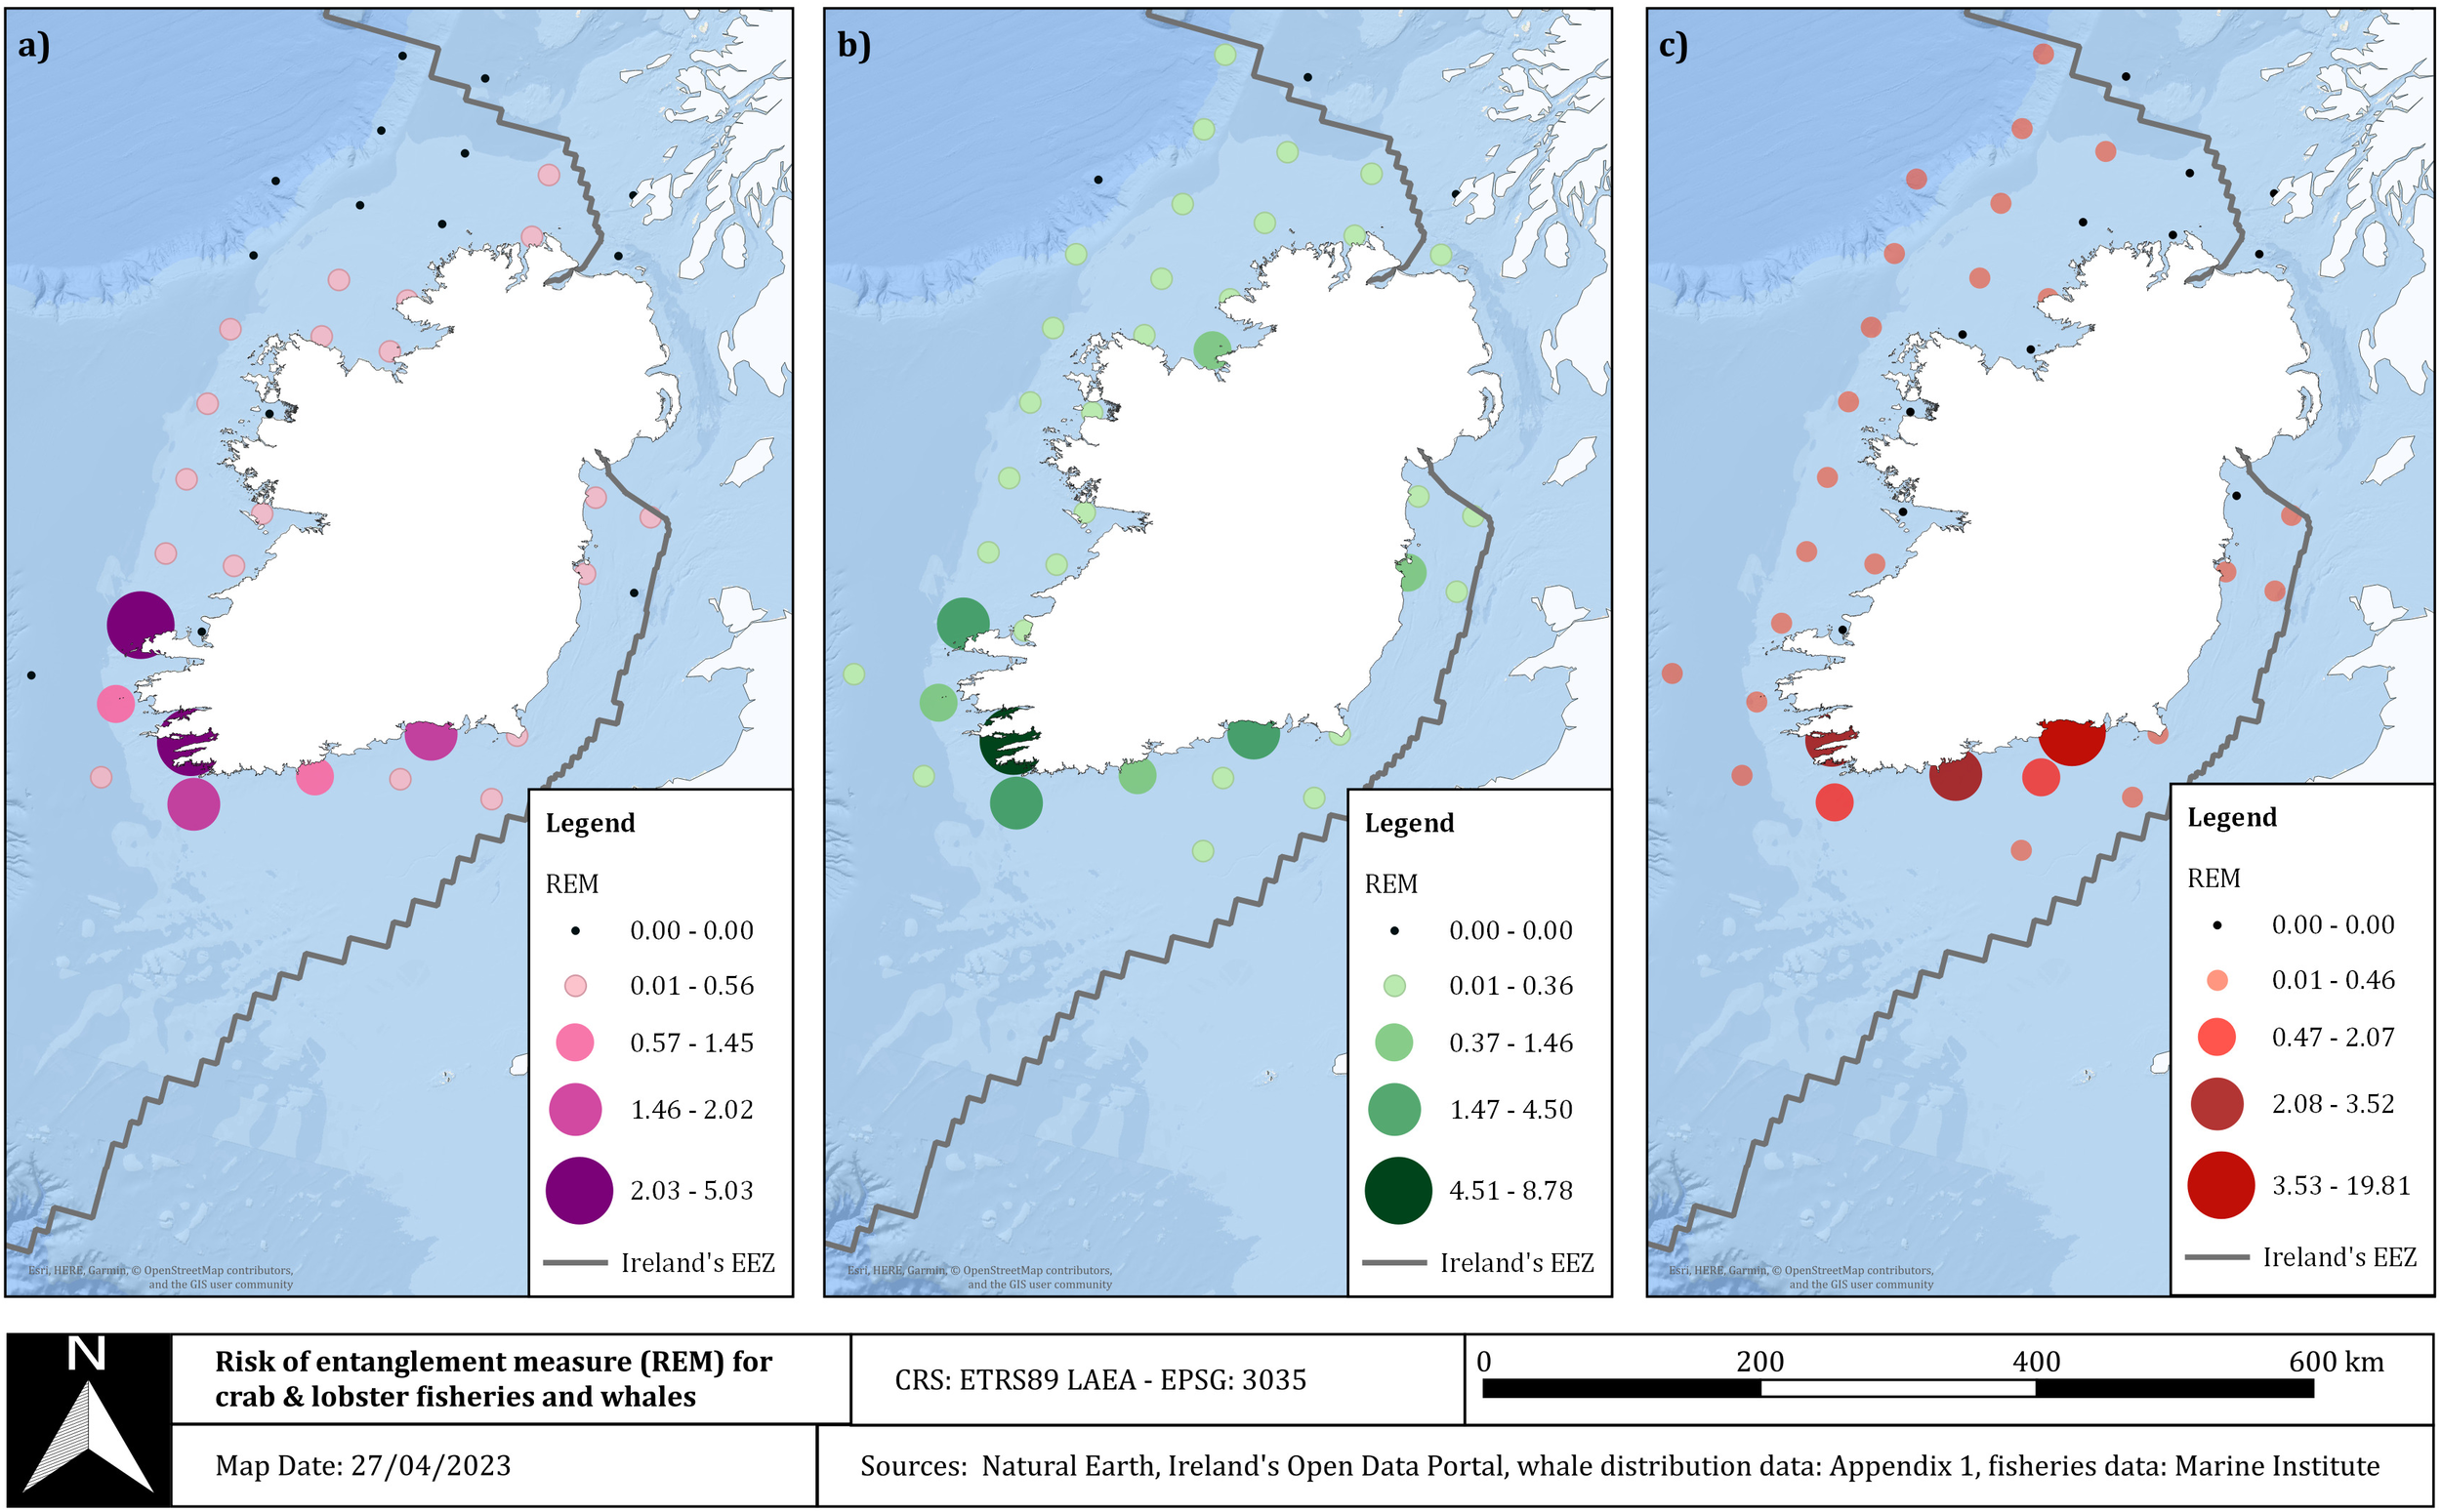
Risk of entanglement measure (REM) for crab and lobster fisheries for vessels under 12 m in length and (a) humpback, (b) minke, and (c) fin whales in the Irish EEZ, displayed at the ICES rectangle level. The black dots (= zero risk) indicate areas where fisheries are present, but no whales have been reported during the study period (2005–2022).
The REM in fisheries (based on the total number of pots) and the three baleen whale species combined is shown in Figure 9. The Beára and Mizen Head Peninsulas off County Cork to the south and southwest and Dunmore East in County Wexford to the southeast of Ireland held the highest REM. Areas with a high REM usually overlapped with the AoI for potential MPAs for cetaceans.
Figure 9
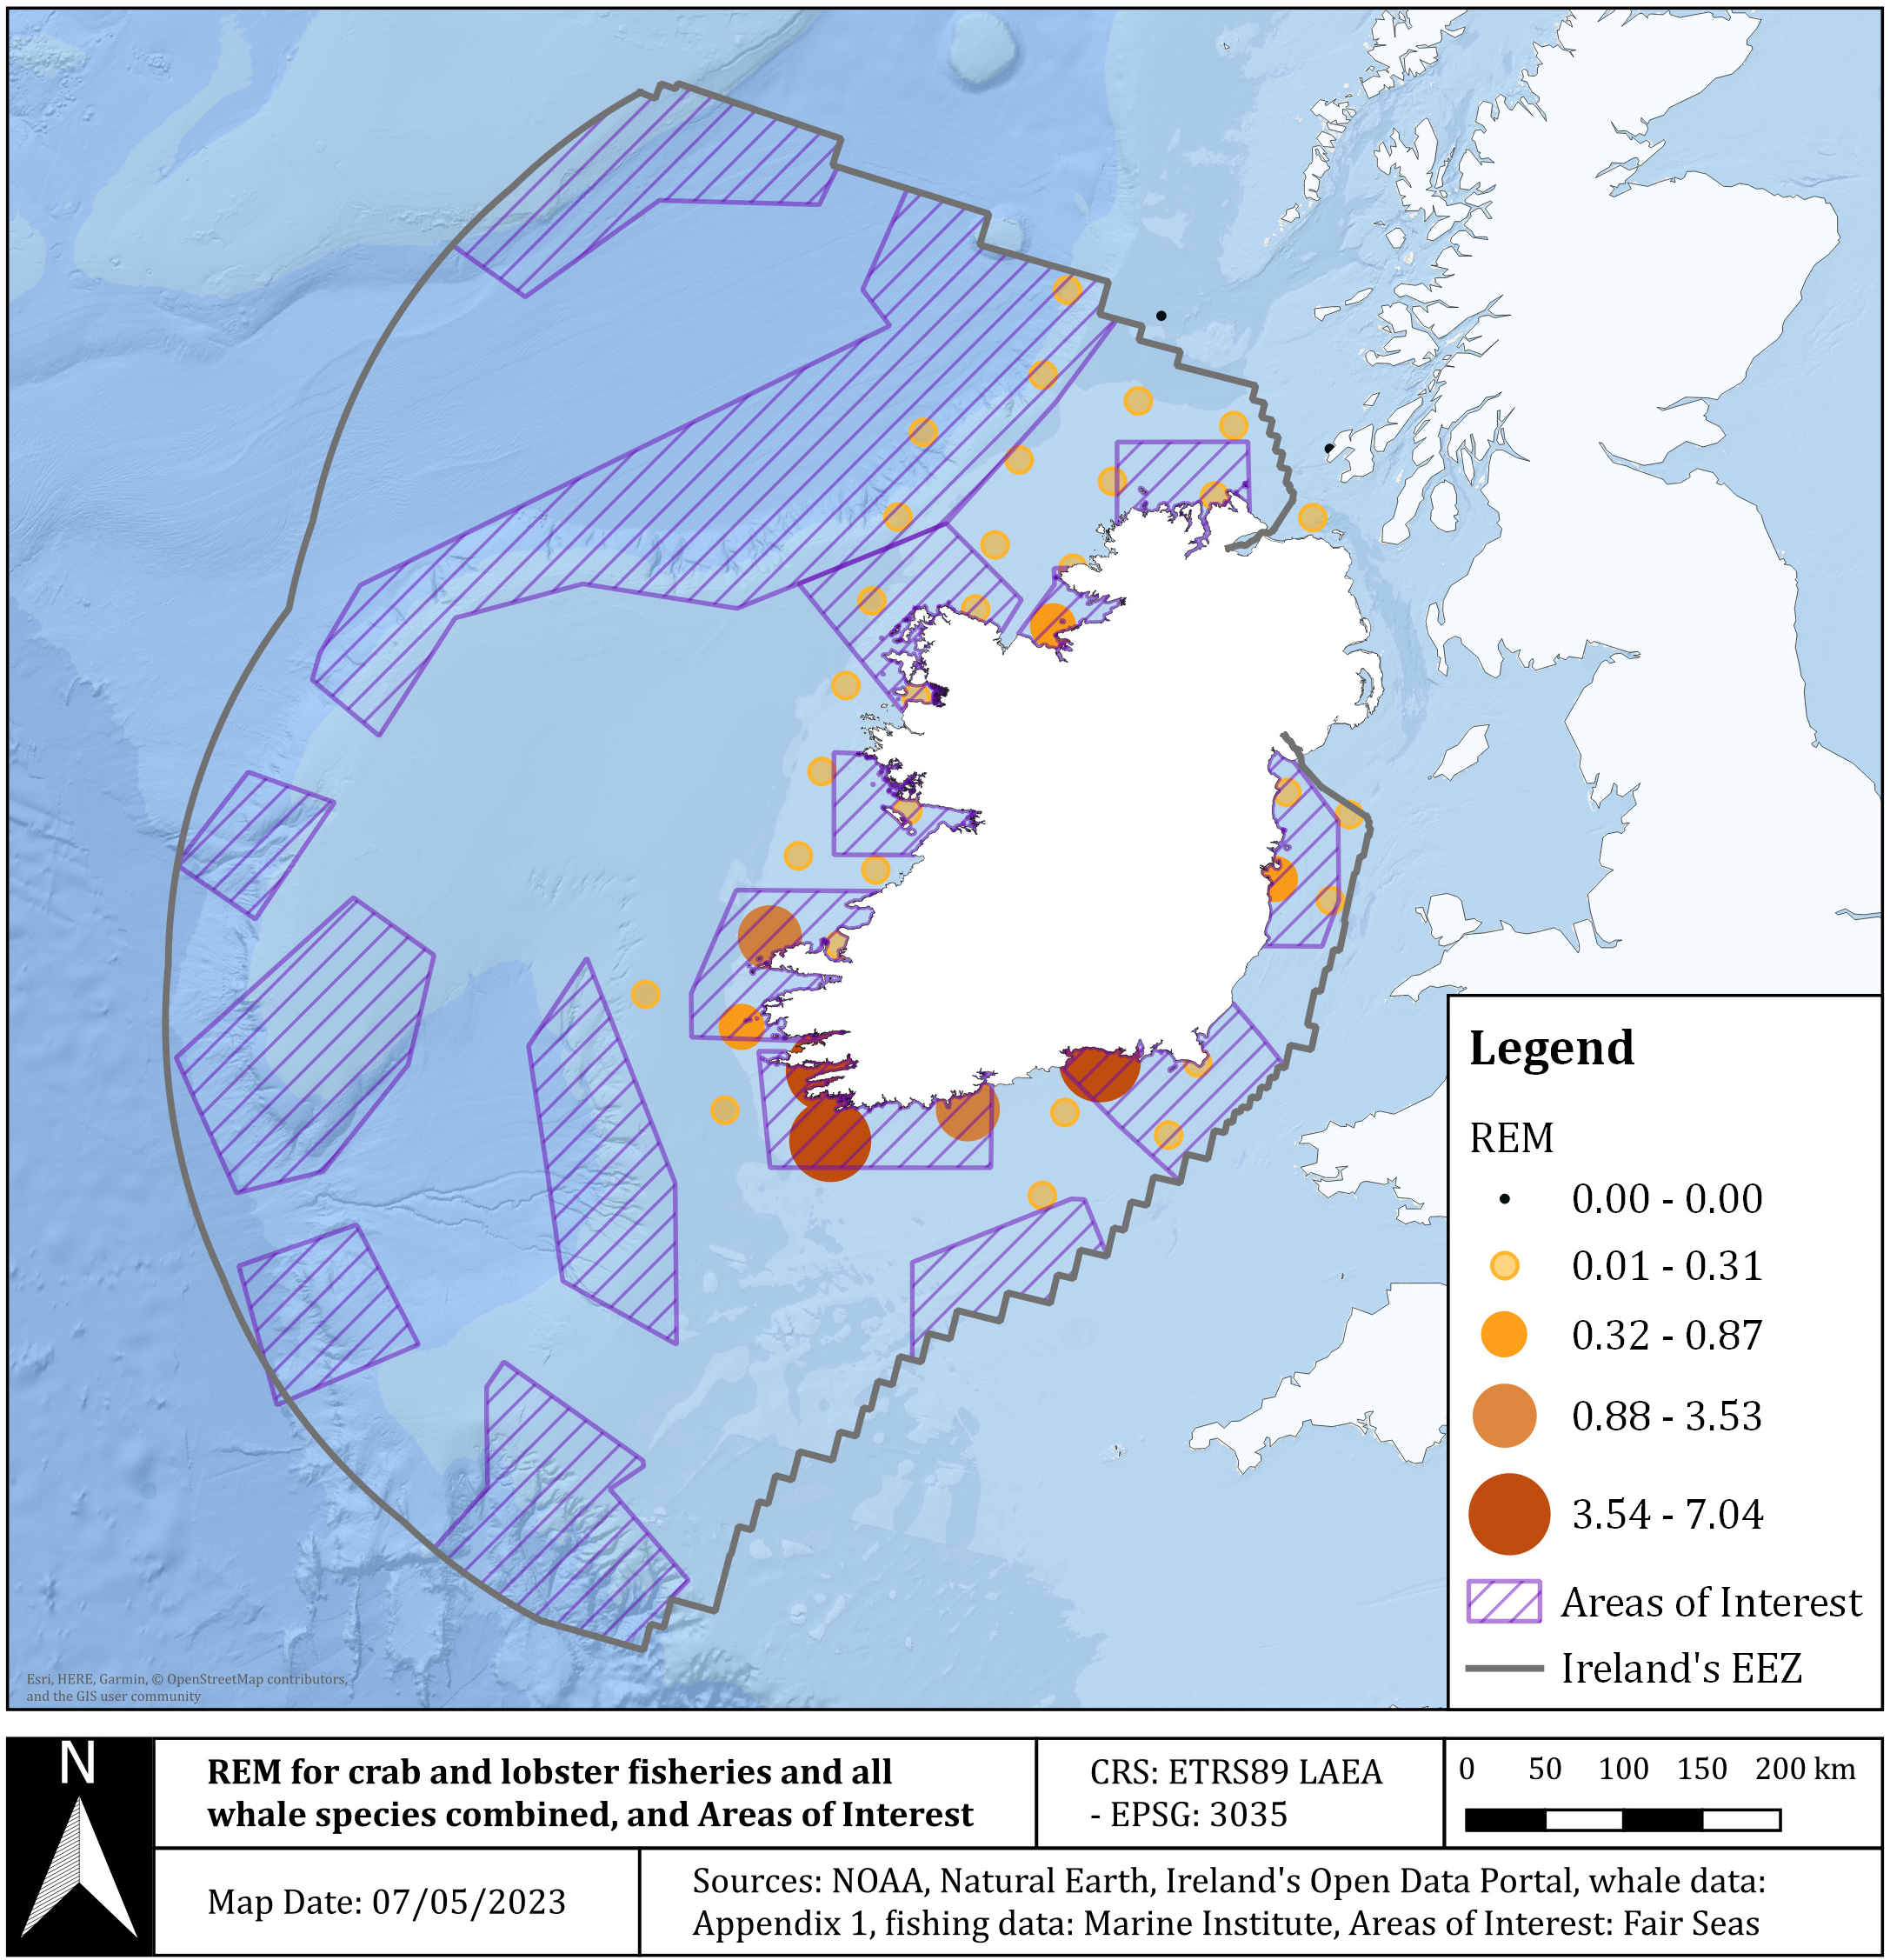
Risk of entanglement measure (REM) for crab and lobster fisheries (<12 m) and the three baleen whale species combined (humpback, minke, and fin whales) in the Irish EEZ, displayed at the ICES rectangle level. The black dots (= zero risk) indicate areas where fisheries are present, but no whales have been reported during the study period (2005–2022). The Areas of Interest as proposed by Classen et al. (2022) as potential marine protected areas for cetaceans in the Irish EEZ areas are shown.
4 Discussion
4.1 Identified risk areas
Previous studies have indicated that Irish waters are a potential high-risk area for entanglement of large cetaceans in ropes associated with pot fisheries (Brown et al., 2013, Brown et al., 2015) with others highlighting the risk in the neighboring countries (Rya et al., 2016; Leaper et al., 2022; Rayner et al., 2024). The results of this study clearly indicate that there are areas in the Irish EEZ where humpback, minke, and fin whales co-occur with pot fisheries and therefore there is a potential risk of entanglement. While the highest risk areas for humpback and minke whale were concentrated off the southwest and south coasts of Ireland, the highest risk areas for fin whale were located along the south coast. These areas coincide not only with the areas where the highest whale densities were reported (Figure 2), but also with the highest whale reporting effort (Figure 3).
The southwest and south coasts are well-known hotspots for which the public report cetacean sightings, but these areas also have a higher number of whales and higher whale densities than other areas (Figures 2, 3) (Berrow et al., 2010; Whooley et al., 2011; Rya et al., 2016; Berrow and Whooley, 2022; Blázquez et al., 2024). The data presented here are biased to certain coastal areas where opportunistic sightings data were more commonly collected. Offshore areas are undersampled by comparison (Rya et al., 2016; Berrow and Whooley, 2022).
While acknowledging potential bias in the opportunistic data, it remains valuable in understanding where cetacean species occur but not necessarily where they do not occur, and has allowed for more widespread and seasonal coverage than would otherwise be possible from dedicated surveys (Bruce et al., 2014; Lodi and Tardin, 2018; Lotriet, 2018; Rodriguez et al., 2021; Natoli et al., 2022; Blázquez et al., 2023, Blázquez et al., 2024). Since over 80% of the Irish fishing fleet is composed of boats under 12 m in length fishing in territorial waters (Tully, 2017), having sufficient data on the baleen whale distribution in these areas is crucial to assess potential risk of entanglement. Sampling effort was much higher in territorial waters than in offshore waters (Figure 3).
A large proportion of the high-risk areas fall within Classen et al.’s (2022) AoI for potential spatial protection (MPAs) for cetaceans. The high risk of entanglement would be an important issue to mitigate in the management of any future MPAs where large whales are the conservation interest (Bisack and Magnusson, 2021). Furthermore, the areas of high risk overlap with the International Union for Conservation of Natures (IUCN) Important Marine Mammal Areas (IMMA). The areas of high risk in Kerry overlap with the Dingle to Mizen Head IMMA, which was classed as an IMMA in part due to the area’s importance as a feeding and aggregation area for minke, humpback, and fin whales between April and November. Similarly, the southern Cork high-risk areas were found to overlap with the Celtic Sea IMMA, which focuses on fin, humpback, and minke whales, particularly in November.
The pot fishing season for lobster runs mainly from March to October each year, and landings, and presumably effort, peak in summer months. The fisheries responsible for the highest number of pots in Irish waters, the brown crab fishery, remains active until December. Based on this, the months from March to December would have the highest number of pots set in Irish waters and thus the highest risk of entanglement. However, none of the baleen whales in this study were present in high numbers in March, which was consistent with other studies (Whooley et al., 2010; Whooley et al., 2011; Rya et al., 2016; Rogan et al., 2018; Giralt Paradell et al., 2024). The highest recorded sightings per species were in May to October for humpback whales, April to August for minke whales, and July to December for fin whales. The cases of entanglement in Irish waters further suggest that particularly the late spring and summer months are periods of high risk.
Thus, April to December presents the months with the highest risks for entanglement of baleen whales in Irish waters, with at least one whale species in high abundance during these months.
4.2 Population-level effects of entanglement
The IWDG has recorded several cases of humpback and minke whale entanglements in static fishing gear in Irish waters but only found evidence of probable entanglements of fin whales through injuries and/or scars. There were clear differences in the outcome of entanglement events between minke and humpback whales. While there were several instances of humpback whales surviving entanglements, there were no such records for minke whales. Humpback whales are larger and may be more capable of handling the physical burden of dragging entangled fishing gear, increasing the chances of the gear naturally disentangling over time (Leaper et al., 2006; Cassoff et al., 2011).
Globally, the issue of minke whale entanglement in static gear has become so significant that Scotland has noted it as the number one non-natural cause of mortality for minke whales (Northridge et al., 2010; Leaper et al., 2022) and the J stock of minke whales in the Sea of Japan, Yellow Sea, and East China Sea is predicted to go extinct in the upcoming decades as a result of entanglement (International Whaling Commission (IWC), 2010; Song et al., 2010). The higher mortality of entangled minke whales due to their smaller stature (Lien, 1994; Northridge et al., 2010; Benjamins et al., 2012; Leaper et al., 2022; Rayner et al., 2024) also likely results in a significant underestimation of the entanglement cases as the whales sink after death.
While humpback whales seem to more readily survive entanglement, it occurs so frequently that 65% of the humpback whales in the Gulf of Main in the USA (Robbins, 2012), up to 71% of the whales in Southeast Alaska (Ramp et al., 2021), at least 25% of the Icelandic stock (Basran et al., 2019), and a minimum of two-thirds of the Arabian Sea population (Minton et al., 2022) show signs of previous entanglement. In Scotland, the rate of mortality is now considered unsustainable for the inshore humpback whale population (Rya et al., 2016). Even these may be underestimations as entanglement injuries may heal beyond recognition (Basran et al., 2019; Ramp et al., 2021).
The lack of known active or recent (or recent scarring) entanglement cases of fin whales around Ireland may be due to their lower sightings rate, lower numbers, and more offshore distribution (Berrow et al., 2010). Although fin whale entanglements are generally rarer than those of humpback and minke whales, they not absent or any less concerning (Benjamins et al., 2012; MacLennan et al., 2021; Saez et al., 2021). It is likely to be underestimated due to the species’ offshore distribution and the difficulty of capturing suitable photographs/footage of the species for entanglement identification. Drone imagery has been shown to capture a significantly higher rate of the entanglement scarring than traditional photography. Unlike humpback whales, fin whale behavior is less acrobatic, with a lower rate of breaching and fluking, which restricts the likelihood of scarring being captured from boat or land-based photography (Ramp et al., 2021). Expanding the WhaleTrack catalogue to include a wider variety of images to study the body condition and potential scarring may reveal additional entanglement in both Ireland’s humpback and fin whale populations.
Identifying areas of high entanglement risk based on the strandings and entanglement data is not possible due to the scarcity of the data and lack of dedicated schemes. There is clear evidence that entanglement occurs, however, off Counties Donegal, Wexford, and Cork with slightly higher entanglement-related strandings along the Dingle Peninsula, Rosslare Bay, and the waters north of Donegal.
While the IWDG has updated its strandings protocol in 2021 to improve the identification of bycatch and entanglement cases, no consistent post-mortem program exists in Ireland to identify the cause of death of stranded cetaceans. This may have resulted in an underestimation of entanglement-related deaths. Additionally, cryptic mortality is likely high due to the fact that most balaenopterid carcasses will sink after death rather than float (Moore et al., 2020), suggesting a large percentage never strand, which would further hinder the identification of entanglement as a cause of death. Finally, it is likely that entanglement and bycatch in fisheries are underreported and scientific observers cover less than 0.5% of fishing trips in static gear fisheries in Ireland.
However, it is clear that entanglement has clearly played a significant role in minke whale deaths in Ireland and that humpback whales also become entangled with potential lethal consequences. Unfortunately, without substantially higher observer coverage or other means to obtain accurate estimates of entanglements and the outcome of these estimates, the true impact of entanglement in Ireland remains difficult.
4.3 Fisheries data
The fisheries data used in this study had a number of shortcomings. The number of pots may have been underestimated. Tully (2017) reported ~342,000 pots in Irish waters between 2013 and 2014 after extensive questionnaires with fishermen. This is over double the estimated 120,000 pots calculated in this study. More recent estimates show that the number of pots in the inshore fleet is now substantially higher than reported by Tully (2017). Questionnaire data for 648 boats in 2023 by BIM (Bord Iascaigh Mhara, unpublished) resulted in an estimate of 492,000 pots. Scaling up to fleet level for probably 1,000 active inshore vessels would provide higher estimates. These include whelk and shrimp pots not considered in this study. International pot fisheries were also not included in this study as landings data were not available. Up to 12% of the international fleet fishing in Ireland are fishing with pots in the Irish EEZ, which will increase the risk of entanglement. This is particularly the case off the northwest coast where crab are fished by Irish, Northern Irish, and Scottish vessels. Furthermore, the lobster pot density was likely underestimated due to scaling up to ICES rectangles, which reduced overall density estimates and hotspots that are likely to be present closer to shore. As lobsters are predominantly fished within the 6 NM limit, pot density in this zone is likely to be higher than when estimated based on the ICES rectangle area.
Based on the insights gained during this study, there are several recommendations on how to improve this type of assessment in the future to create a better understanding of how pot fisheries are interacting with large baleen whales in Ireland.
-
Both effort- and non-effort-related whale distribution and abundance data should be used to assess entanglement risk.
-
Additional relevant data on pot fishing effort is required to improve our ability to assess entanglement risk. Although aerial surveys of buoys or participatory mapping approaches could be used, the best option is to deploy VMS on vessels under 12 m as is currently done for the razor clam dredging fleet in the Irish Sea and for all vessels over 12 m in the fleet.
-
Better insights should be gained by structured questionnaires with fishers detailing encounters of whales and incidences of entanglement (live entanglements or dead floating animals) or by creating a reporting scheme for fishers. Co-occurrence of pots and whales (exposure) is used here to estimate entanglement risk, but the likelihood of entanglement probably varies between species and perhaps due to other factors including fishing gear configuration such as the number of connected pots in a fleet and therefore the overall drag weight.
-
Better capture of evidence of potential entanglement of stranded whales, through more post-mortem evaluations, more resources, and additional training.
-
Better capture of evidence of entanglement marks in live animals using photographic data, including data collected by drones.
5 Conclusions
This study identified areas in the Irish EEZ where humpback, minke, and fin whales co-occur with pot fisheries and therefore where there is a higher risk of entanglement. Stranding records indicate that entanglement in static fishing gear is a threat to large whales in Ireland, particularly for minke whales and the humpback whales. The high-risk areas identified in this study should be considered as priority areas to implement conservation strategies. While there is not enough evidence at this point to assess the extent of the potential impact of entanglement on whale populations, this study was able to identify the constraints and gaps in the currently available data and make recommendations on how to improve the risk assessment in the future to ultimately have a better understanding on how pot fisheries are affecting large baleen whale populations in Irish waters. As the global pot fisheries continue to grow along with whale populations, so will the risk of negative interactions such as entanglement in static gear. Ongoing monitoring of whale distribution and the repeated assessment of entanglement risk are vital in protecting these vulnerable species.
Statements
Data availability statement
The original contributions presented in the study are included in the article/Supplementary Material. Further inquiries can be directed to the corresponding author.
Author contributions
JF: Conceptualization, Data curation, Formal analysis, Investigation, Methodology, Project administration, Resources, Software, Validation, Visualization, Writing – original draft. EL: Writing – original draft, Writing – review & editing. RD: Conceptualization, Data curation, Formal analysis, Investigation, Project administration, Resources, Supervision, Writing – original draft, Writing – review & editing. GM: Data curation, Investigation, Resources, Supervision, Writing – review & editing. OT: Data curation, Project administration, Supervision, Writing – review & editing. SB: Conceptualization, Data curation, Formal analysis, Funding acquisition, Investigation, Methodology, Project administration, Resources, Software, Supervision, Validation, Visualization, Writing – original draft, Writing – review & editing.
Funding
The author(s) declared that financial support was received for this work and/or its publication. We have been awarded the Marine Research Programme Networking & Marine Research Communication Awards by the Marine Institute to cover the costs of publication.
Acknowledgments
Hundreds of observers contributed data to create the sightings and strandings databases that were used in this paper. We would like to thank Pádraig Whooley for managing the IWDG Cetacean Sighting Scheme, Nick Massett for contributing to WhaleTrack Ireland, Hannah Keogh for providing a combined sightings database, the various organizations who contributed data to the sighting database [the Department of Communications, Climate Action and Environment (DCCAE), the Marine Institute, the National Parks and Wildlife Service (NPWS), and the University of St. Andrews], and the various organizations that allowed IWDG Marine Mammal Observers to join their surveys [the Agri-Food and Bioscience Institute (AFBI), Atlantic Technological University (ATU), Centre for Environment, Fisheries and Aquaculture Science (CEFAS), French Research Institute for Exploration of the Sea (IFREMER), the Irish Naval Service, the Marine Institute (MI), Nederland’s Instituut voor Zeeonderzoek (NIOZ), National Oceanography Centre (NOC), National University of Ireland (NUI), and University College Dublin (UCD)]. We would also like to thank Mick O’Connell and Stephanie Levesque for managing the IWDG Cetacean Stranding Scheme. A special thank you to Conor Hayes of the Marine Institute for his valuable insights. We extend our thanks to the independent reviewers who helped improve this paper through their thoughtful comments. This study was carried out as part of an International Master of Science in Marine Biological Resources (IMBRSea) by JF.
Conflict of interest
The author(s) declared that this work was conducted in the absence of any commercial or financial relationships that could be construed as a potential conflict of interest.
Generative AI statement
The author(s) declared that generative AI was not used in the creation of this manuscript.
Any alternative text (alt text) provided alongside figures in this article has been generated by Frontiers with the support of artificial intelligence and reasonable efforts have been made to ensure accuracy, including review by the authors wherever possible. If you identify any issues, please contact us.
Publisher’s note
All claims expressed in this article are solely those of the authors and do not necessarily represent those of their affiliated organizations, or those of the publisher, the editors and the reviewers. Any product that may be evaluated in this article, or claim that may be made by its manufacturer, is not guaranteed or endorsed by the publisher.
Supplementary material
The Supplementary Material for this article can be found online at: https://www.frontiersin.org/articles/10.3389/fmars.2026.1749710/full#supplementary-material
References
1
Anon (2009). Atlas of commercial fisheries around Ireland. 1st ed (Ireland: Marine Institute).
2
Anon (2020). Shellfish stocks and fisheries review: An assessment of selected stocks (Rinville: Marine Institute), ISBN: 978-1-902895-69-7.
3
Aranha L. Torres-Florez J. P. (2024). Legal perspectives on unintended and unsanctioned humpback whale entanglement in the South Atlantic trawl fishery. Ocean. Coast. Manage.258, 107412. doi: 10.1016/j.ocecoaman.2024.107412
4
Basran C. J. Bertulli C. G. Cecchetti A. Rasmussen M. H. Whittaker M. Robbins J. (2019). First estimates of entanglement rate of humpback whales Megaptera novaeangliae observed in coastal Icelandic waters. Endanger. Spec. Res.38, 67–77. doi: 10.3354/ESR00936
5
Benjamins S. Ledwell W. Huntington J. Davidson A. R. (2012). Assessing changes in numbers and distribution of large whale entanglements in Newfoundland and Labrador, Canada. Mar. Mamm. Sci.28, 579–601. doi: 10.1111/j.1748-7692.2011.00511.x
6
Berrow S. (2001). Biological diversity of cetaceans (whales, dolphins and porpoises) in Irish waters. In Marine biodiversity in Ireland and adjacent waters. Proceedings of a conference. 26–27. 115–119.
7
Berrow S. Whooley P. (2022). Managing a dynamic North Sea in the light of its ecological dynamics: Increasing occurrence of large baleen whales in the southern North Sea. J. Sea. Res.182, 102186. doi: 10.1016/j.seares.2022.102186
8
Berrow S. Whooley P. O’Connell M. Wall D. (2010). Irish cetacean review 2000–2009 (Merchants Quay, Kilrush, Co Clare, Ireland: Irish Whale and Dolphin Group), 60.
9
Bisack K. D. Magnusson G. M. (2021). Spatial management to reduce entanglement risk to North Atlantic right whales in fishing gear: A case study of U.S. northeast lobster fishery 2002–2009. Front. Mar. Sci.8. doi: 10.3389/fmars.2021.540966
10
Blázquez M. Massett N. Whooley P. O’Brien J. Wenzel F. W. O’Connor I. et al . (2023). Abundance estimates of humpback whales (Megaptera novaeangliae) in Irish coastal waters using mark–recapture and citizen science. J. Cetacean. Res. Manage.24, 209–225. doi: 10.47536/jcrm.v24i1.509
11
Blázquez M. Whooley P. Massett N. Keogh H. O’Brien J. M. Wenzel F. W. et al . (2024). Distribution models of baleen whale species in the Irish Exclusive Economic Zone to inform management and conservation. Mar. Environ. Res.199, 106569. doi: 10.1016/j.marenvres.2024.106569
12
Breen P. Brown S. Reid D. Rogan E. (2016). Modelling cetacean distribution and mapping overlap with fisheries in the northeast Atlantic. Ocean. Coast. Manage.134, 140–149. doi: 10.1016/j.ocecoaman.2016.09.004
13
Breen P. Brown S. Reid D. Rogan E. (2017). Where is the risk? Integrating a spatial distribution model and a risk assessment to identify areas of cetacean interaction with fisheries in the northeast Atlantic. Ocean. Coast. Manage.136, 148–155. doi: 10.1016/j.ocecoaman.2016.12.001
14
Brown S. L. Reid D. & Rogan E. (2015). Spatial and temporal assessment of potential risk to cetaceans from static fishing gears. Mar. Policy51, 267–280. doi: 10.1016/j.marpol.2014.09.009
15
Brown S. L. Reid D. Rogan E. (2013). A risk-based approach to rapidly screen vulnerability of cetaceans to impacts from fisheries bycatch. Biol. Conserv.168, 78–87. doi: 10.1016/j.biocon.2013.09.019
16
Bruce E. Albright L. Sheehan S. Blewitt M. (2014). Distribution patterns of migrating humpback whales (Megaptera novaeangliae) in Jervis Bay, Australia. Appl. Geogr.54, 83–95. doi: 10.1016/j.apgeog.2014.06.014
17
Cassoff R. M. Moore K. M. McLellan W. A. Barco S. G. Rotstein D. S. Moore M. J. (2011). Lethal entanglement in baleen whales. Dis. Aquat. Organ.96, 175–185. doi: 10.3354/dao02385
18
Cheeseman T. Barlow J. Acebes J. M. Audley K. Bejder L. Birdsall C. et al . (2024). Bellwethers of change: population modelling of North Pacific humpback whales from 2002 through 2021 reveals shift from recovery to climate response. R. Soc. Open Sci.11, 231462. doi: 10.1098/rsos.231462
19
Clapham P. J. (2016). Managing leviathan: Conservation challenges for the great whales in a post-whaling world. Oceanography29, 214–225. doi: 10.5670/oceanog.2016.70
20
Classen R. Hegarty S. Keogh H. Regan S. (2022). Revitalising Our Seas: Identifying areas of interest for marine protected area designation in Irish waters. Available online at: www.fairseas.ie (Accessed December 12, 2025).
21
Department of Agriculture, Food and the Marine (2022). Fisheries factsheet – may 2022. (Dublin, Ireland: Department of Agriculture, Food and the Marine).
22
Durfort A. Mariani G. Tulloch V. Savoca M. S. Troussellier M. Mouillot D. (2022). Recovery of carbon benefits by overharvested baleen whale populations is threatened by climate change. Proc. R. Soc. B.289, 20220375. doi: 10.1098/rspb.2022.0375
23
Gerritsen H. D. (2024). Atlas of commercial fisheries around Ireland. 4th ed ( Marine Institute).
24
Gerritsen H. D. Hans X. (2024). Fisheries around Ireland, fourth edition. ( Marine Institute, Ireland).
25
Gerritsen H. D. Kelly E. (2019). Atlas of Commercial Fisheries around Ireland, third edition. Marine Institute, Ireland. 72 pp.
26
Gerritsen H. D. Lordan C. (2014). Atlas of Commercial Fisheries Around Ireland, Marine Institute, Ireland. 59 pp.
27
Giralt Paradell O. Cañadas A. Bennison A. Todd N. Jessopp M. Rogan E. (2024). “ Aerial surveys of cetaceans and seabirds in Irish waters: Occurrence, distribution and abundance in 2021–2023,” in Department of the environment, climate & Communications and department of housing ( Local Government & Heritage, Ireland), 260.
28
Hamilton S. Baker G. B. (2019). Technical mitigation to reduce marine mammal bycatch and entanglement in commercial fishing gear: lessons learnt and future directions. Rev. Fish Biol. Fisheries29, 223–247.
29
He P. (2011). Behavior of marine fishes: Capture processes and conservation challenges (Ames, Iowa, USA: John Wiley & Sons).
30
International Council for the Exploration of the Sea (2023). ICES statistical rectangles. Available online at: https://www.ices.dk/data/maps/Pages/ICES-statistical-rectangles.aspx (Accessed November 11, 2025).
31
International Whaling Commission (IWC) (2010). Report of the workshop on welfare issues associated with the entanglement of large whales Vol. 62 (Impington, United Kingdom: IWC), 15.
32
Irish Whale and Dolphin Group (IWDG) (2023). The Irish Whale and Dolphin Group – Recording schemes. Available online at: https://iwdg.ie/recording-schemes/ (Accessed November 15, 2025).
33
Knowlton A. R. Robbins J. Landry S. McKenna H. A. Kraus S. D. Werner T. B. (2016). Effects of fishing rope strength on the severity of large whale entanglements. Conserv. Biol.30, 318–328. doi: 10.1111/cobi.12590
34
Leaper R. MacLennan E. Brownlow A. Calderan S. V. Dyke K. Evans P. G. et al . (2022). Estimates of humpback and minke whale entanglements in the Scottish static pot (creel) fishery. Endanger. Spec. Res.49, 217–232. doi: 10.3354/esr01214
35
Leaper R. Papastavrou V. Sadler L. (2006). Consideration of factors affecting time to death for whales following entanglement in fishing gear. Paper IWC/58/WKM&AWI. International Whaling Commision14.
36
Levesque S. Daly M. Dillane E. O’Donovan J. Gomez-Parada M. Berrow S. (2023). First confirmed record of a Dwarf Sperm Whale (Kogia sima (Owe)) in Ireland. Irish. Natural. J.40, 55–59.
37
Levesque S. O’Connor G. Berrow S. (2024). Records from the irish whale and dolphin group for 2023. Irish. Natural. J.41, 144–156.
38
Lien J. (1994). Entrapments of large cetaceans in passive inshore fishing gear in Newfoundland and Labrador, (1979–1990). Rep. Int. Whal. Comm.15, 149–157.
39
Lodi L. Tardin R. (2018). Citizen science contributes to the understanding of the occurrence and distribution of cetaceans in southeastern Brazil – A case study. Ocean. Coast. Manage.158, 45–55. doi: 10.1016/j.ocecoaman.2018.03.029
40
Lordan C. Gerritsen H. D. (2011). Integrating Vessel Monitoring Systems (VMS) data with daily catch data from logbooks to explore the spatial distribution of catch and effort at high resolution. (Galway, Ireland: Marine Institute).
41
Lotriet T. (2018). Mapping cetacean distribution using citizen science in the Western Cape (South Africa: University of Pretoria (South Africa).
42
Lusher A. L. Hernandez-Milian G. Berrow S. Rogan E. O’Connor I. (2018). ‘Incidence of marine debris in cetaceans stranded and bycaught in Ireland: Recent findings and a review of historical knowledge’. Environ. pollut.232, 232. doi: 10.1016/j.envpol.2017.09.070
43
MacLennan E. Leaper R. Brownlow A. Calderan S. Jarvis D. Hartny-Mills L. et al . (2020). Estimates of humpback and minke whale entangle-ments in Scotland. Report of the Scientific Committee of the International Whaling Commission, SC/68B/HIM01, p. 15.
44
MacLennan E. Hartny-Mills L. Read F. L. Dolman S. J. Philp A. Dearing K. E. et al . (2021). NatureScot Research Report 1268-Scottish Entanglement Alliance (SEA)-understanding the scale and impacts of marine animal entanglement in the Scottish creel fishery. NatureScot. 1268, 1–87.
45
Marine Institute . (2021). Shellfish stocks and fisheries review 2021: An assessment of selected stocks. Marine Institute.
46
Massett N. (2020). Evidence of entanglement of humpback whales in Irish waters. Available online at: https://iwdg.ie/evidence-of-entanglement-of-humpback-whale-in-irish-waters/ (Accessed October 20, 2025).
47
Minton G. Van Bressem M. F. Willson A. Collins T. Al Harthi S. Willson M. S. et al . (2022). Visual health assessment and evaluation of anthropogenic threats to Arabian Sea humpback whales in Oman. J. Cetacean. Res. Manage.23, 59–79. doi: 10.47536/jcrm.v23i1.336
48
Mooney M. S . (2003). Entanglement of humpback whales in fishing gear: description of injuries (Dublin, Ireland: Duke University).
49
Moore M. J. Mitchell G. H. Rowles T. K. Early G. (2020). Dead cetacean? Beach, bloat, float, sink. Front. Mar. Sci.7, 7. doi: 10.3389/fmars.2020.00333
50
Muscolino M. S. (2025). “ Fishing and whaling,” in A companion to global environmental history (New York, USA: John Wiley & Sons) 288–303.
51
Myers H. J. Moore M. J. Baumgartner M. F. Brillant S. W. Katona S. K. Knowlton A. R. et al . (2019). Ropeless fishing to prevent large whale entanglements: Ropeless Consortium report. Mar. Policy107, 103587. doi: 10.1016/j.marpol.2019.103587
52
Natoli A. Moura A. E. Sillero N. (2022). Citizen science data of cetaceans in the Arabian/Persian Gulf. Mar. Mamm. Sci.38, 235–255. doi: 10.1111/mms.12865
53
Northridge S. (2018). “ Fisheries,” in Encyclopedia of marine mammals (London, U.K.: Academic Press), 375–383.
54
Northridge S. Cargill A. Coram A. Mandleberg L. Calderan S. Reid R. (2010). Entanglement of minke whales in Scottish waters: an investigation into occurrence, causes and mitigation. Contr. Rep. Final. Rep. to. Scottish. Govern. CR/2007/49.1–57.
55
O’Connor S. Campbell R. Cortez H. Knowles T. (2009). Whale Watching Worldwide: tourism numbers, expenditures and expanding economic benefits, a special report from the International Fund for Animal Welfare Vol. 228 (Yarmouth MA, USA: prepared by Economists at Large).
56
Pace R. M. Williams R. Kraus S. D. Knowlton A. R. Pettis H. M. (2021). Cryptic mortality of North Atlantic right whales. Conserv. Sci. Pract.3, e346. doi: 10.1111/csp2.346
57
Pierre J. P. How J. R. Dunn A. (2022). Whale entanglements with New Zealand pot fisheries: Characterisation and opportunities for management. (Wellington, New Zealand: Department of Conservation, Conservation Services Programme Project).
58
Ramp C. Gaspard D. Gavrilchuk K. Unger M. Schleimer A. Delarue J. et al . (2021). Up in the air: drone images reveal underestimation of entanglement rates in large rorqual whales. Endanger. Spec. Res.44, 33–44. doi: 10.3354/esr01084
59
Rayner J. Embling C. B. Ryan C. Hartny-Mills L. (2024). Minke whale entanglement in static fishing gear: identifying consistent areas of high risk in Western Scotland. J. Mar. Biol. Assoc. U. K.104, e15.
60
Read A. J. (2008). The Looming Crisis: Interactions between Marine Mammals and Fisheries. J. Mammal.89, 541–548. doi: 10.1644/07-MAMM-S-315R1.1
61
Robbins J. (2012). Scar-based inference into Gulf of Maine humpback whale entanglement: 2010. (Massachusettes, USA: Northeast Fisheries Science Center National Marine Fisheries Service).
62
Rodriguez L. K. Fandel A. D. Colbert B. R. Testa J. C. Bailey H. (2021). Spatial and temporal variation in the occurrence of bottlenose dolphins in the Chesapeake Bay, USA, using citizen science sighting data. PLoS ONE16. doi: 10.1371/journal.pone.0251637
63
Rogan E. Breen P. Mackey M. Cañadas A. Scheidat M. Geelhoed S. C. V. et al . (2018). Aerial surveys of cetaceans and seabirds in Irish waters: Occurrence, distribution and abundance in 2015-2017. (Quebec, Canada: Food and Agriculture Organization).
64
Roman J. Estes J. A. Morissette L. Smith C. Costa D. McCarthy J. et al . (2014). Whales as marine ecosystem engineers. Front. Ecol. Environ.12, pp.377–pp.385. doi: 10.1890/130220
65
Rya C. Leaper R. Evans P. G. Dyke K. Robinson K. P. Haskins G. N. et al . (2016). Entanglement: an emerging threat to humpback whales in Scottish waters. (Portree, UK: University of the Highlands and Islands).
66
Saez L. Lawson D. DeAngelis M. (2021). Large whale entanglements off the U.S. West Coast, from 1982-2017. NOAA. Tech. Memo.50. doi: 10.25923/effx-kv36
67
Slack-Smith R. J. (2001). Fishing with Traps and Pots (26th ed.). ( Food & Agriculture Org). Available online at: https://books.google.ie/books?hl=en&lr&id=wdST3YhM1ZcC&oi=fnd&pg=PP7&dq=pot+fishing&ots=Gcp3V4wRF0&sig=B0p1rbSAOd3USX2ukBqhRzSPBuw&redir_esc=y#v=onepage&q=pot%20fishing&f=false.
68
Song K. J. Kim Z. G. Zhang C. I. Kim Y. H. (2010). Fishing gears involved in entanglements of minke whales (Balaenoptera acutorostrata) in the East Sea of Korea. Mar. Mamm. Sci.26, 282–295. doi: 10.1111/j.1748-7692.2009.00340.x
69
Tully O. (2017). Atlas of commercial fisheries for shellfish around Ireland (Galway, Ireland: Marine Institute), ISBN: 978-1-902895-61-1.
70
Whooley P. Berrow S. Wall D. (2010). Review of cetacean sightings scheme in Ireland, 2000–2009.
71
Whooley P. Berrow S. Barnes C. (2011). Photo-identification of fin whales (Balaenoptera physalus L.) off the south coast of Ireland. Mar. Biodivers. Record.4, e8. doi: 10.1017/S1755267210001119
Summary
Keywords
entanglement, fin whale, humpback whale, Ireland, minke whale, static fisheries
Citation
Fichefet J, De Loose E, Dudley R, Martin G, Tully O and Berrow S (2026) Assessing the risk of whale entanglement in pot fisheries in Irish waters. Front. Mar. Sci. 13:1749710. doi: 10.3389/fmars.2026.1749710
Received
19 November 2025
Revised
28 January 2026
Accepted
28 January 2026
Published
17 February 2026
Volume
13 - 2026
Edited by
Nadine Heck, East Carolina University, United States
Reviewed by
Juan Pablo Torres-Florez, National Center for Wildlife, Saudi Arabia
Dan Lawson, National Marine Fisheries Service (NOAA), United States
Updates
Copyright
© 2026 Fichefet, De Loose, Dudley, Martin, Tully and Berrow.
This is an open-access article distributed under the terms of the Creative Commons Attribution License (CC BY). The use, distribution or reproduction in other forums is permitted, provided the original author(s) and the copyright owner(s) are credited and that the original publication in this journal is cited, in accordance with accepted academic practice. No use, distribution or reproduction is permitted which does not comply with these terms.
*Correspondence: Emilie De Loose, emilie.deloose@iwdg.ie
Disclaimer
All claims expressed in this article are solely those of the authors and do not necessarily represent those of their affiliated organizations, or those of the publisher, the editors and the reviewers. Any product that may be evaluated in this article or claim that may be made by its manufacturer is not guaranteed or endorsed by the publisher.