Abstract
Under the restructuring of global industrial chains, enhancing the resilience and sustainability of aquatic products supply chains has become a critical priority for industrial upgrading. These supply chains face mounting challenges from environmental pressures, public health incidents, market volatility, and shifting policy landscapes. Adopting a synergistic perspective that integrates resilience and sustainability, this study develops a comprehensive evaluation indicator system encompassing seven dimensions: production, processing, circulation, sales, consumption, external environment, and services. Through the Delphi method, the Best–Worst Method (BWM), and fuzzy comprehensive evaluation, eight key indicators are identified, including Scientific Control of Aquatic Products Catching and Feeding (A2), Inventory Quality Assurance and Adjustment (D2), Policy and Regulations (F1), and Logistics Technology Level (C2). An empirical assessment of three representative enterprises—Company A (China Aquatic), Company B (ASIASEA Group), and Company C (Dalian Zhihui Fishery Group)—demonstrates that Company A achieves the highest comprehensive score (87.76, rated as strong), while Company B (81.23) and Company C (77.42) are both rated as relatively strong. Comparative analysis reveals differentiated weaknesses, such as logistics digitalization gaps and market negotiation limitations, leading to targeted recommendations in upstream production optimization, logistics technology investment, policy engagement, and market capability enhancement. This research contributes to the literature by establishing an empirically validated, multidimensional framework for assessing and guiding the coordinated upgrading of global aquatic products supply chains, offering actionable insights for both practitioners and policymakers.
1 Introduction
Aquatic product is rich in protein and various trace indicators, making it a beneficial supplement to a healthy diet. Based on the statistics from the Food and Agriculture Organization (FAO) 2024 report, the total production of aquatic animals reached a historic high of 223.2 million tons in 2022. Aquatic foods provide about 17% of global animal protein intake, a figure that rises to over 50% in several Asian and African countries. It is projected that total aquatic animal production will need to approach 202 million tons by 2030. In terms of consumption, it is expected that by 2030, the total consumption of aquatic products will increase by 15%, reaching 21.4 kilograms per capita (Golden et al., 2021). Aquatic product plays an increasingly important role in stabilizing global food supply and maintaining a healthy diet.
The global supply chain for aquatic products (GSCAP) refers to an integrated supply chain system formed through global procurement, production, processing, storage, transportation, sales, and other links involving aquatic products (Yu et al., 2022). GSCAP has the following characteristics: first, it crosses national borders and geographical boundaries, involving diverse participants worldwide. Its process includes international multimodal transport, customs declaration, inspection submission, etc.; second, there are many types of aquatic products, and different types of aquatic products have different requirements for the supply chain; third, with the increasing global awareness of environmental protection, the GSCAP is increasingly influenced by environmental factors, including reducing damage to aquatic habitats, improving the sustainability of aquatic products, etc (Yu et al., 2022). Additionally, cross-disciplinary technologies are constantly reshaping the structure of GSCAP, driving it towards standardization, intelligence, and greening. Figure 1 shows the framework of GSCAP (Yu et al., 2022).
Figure 1
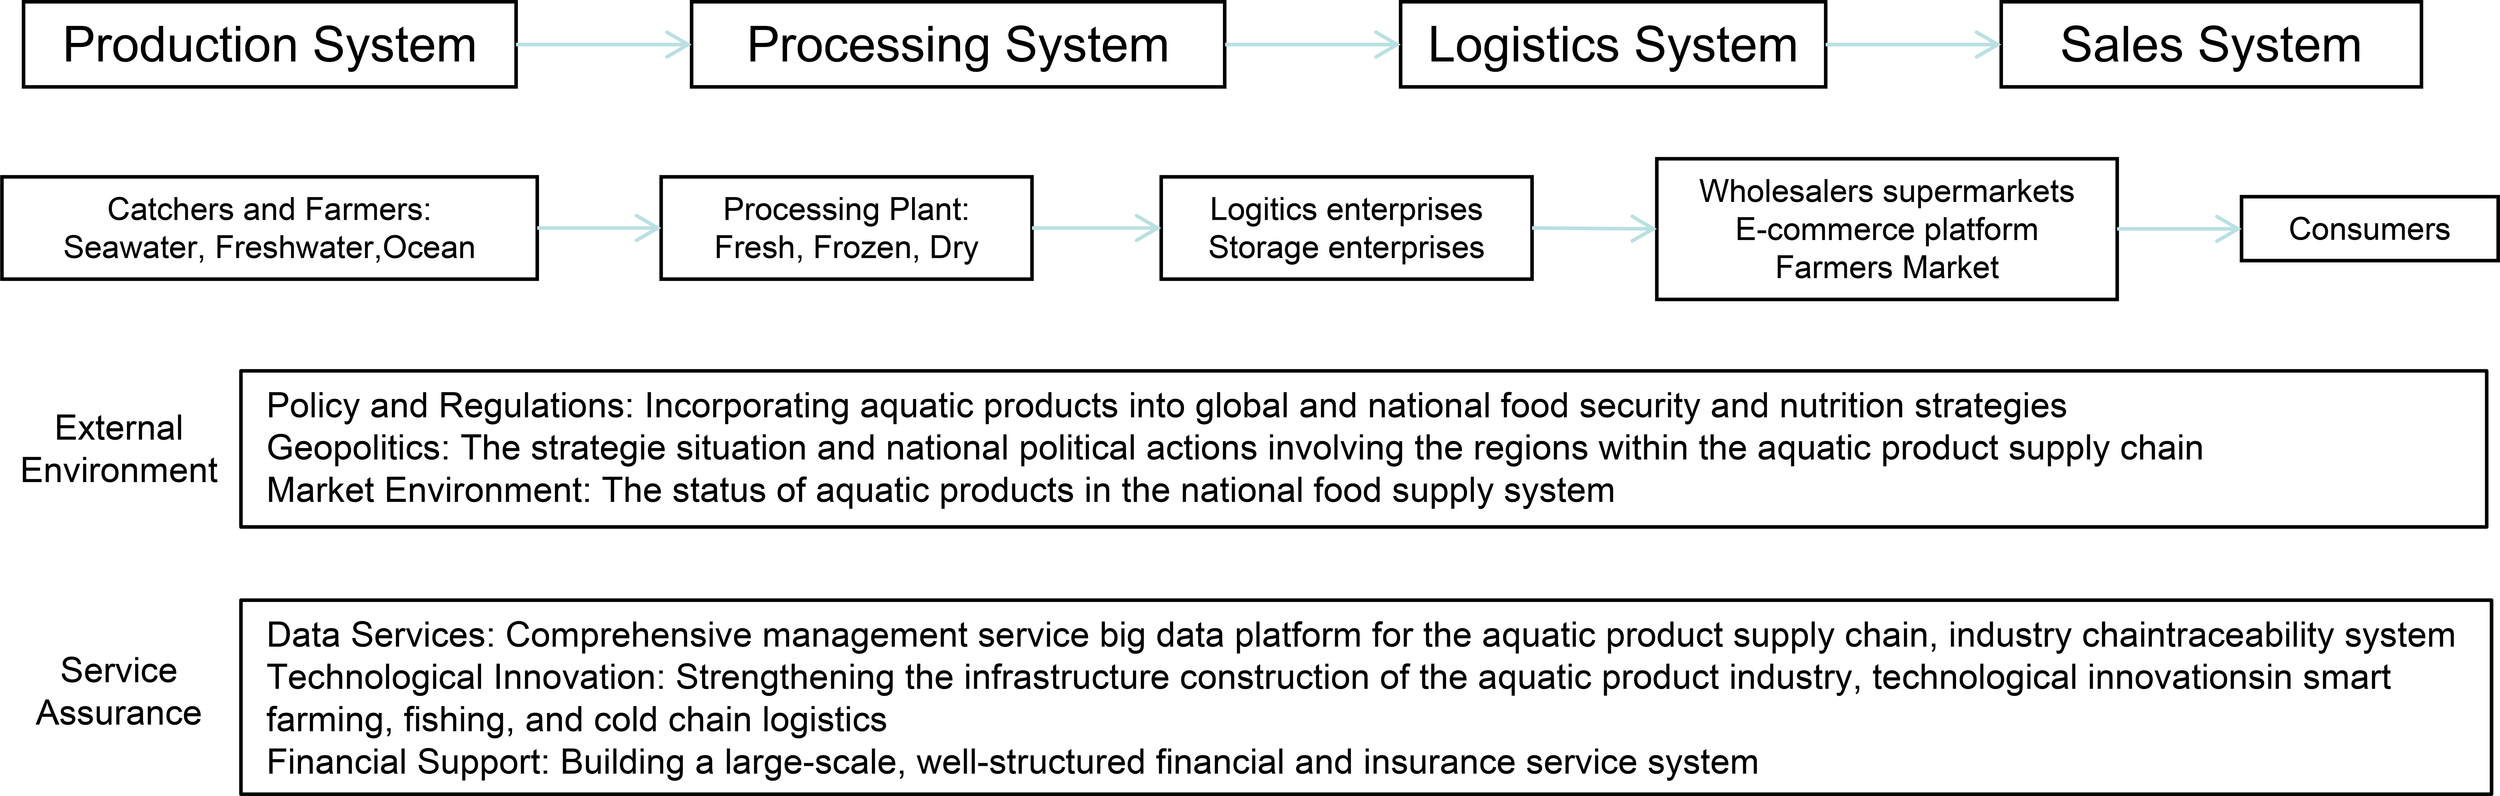
Framework of GSCAP.
Based on the structure and characteristics of GSCAP, factors affecting the global aquatic products supply chain include natural disasters, health and safety incidents, international environment, national policies, and logistics models. The vulnerability of GSCAP is markedly higher than that of general commodity supply chains (Iruku, 2025), a fact starkly highlighted by recent global disruptions. The COVID-19 pandemic caused severe labor shortages, port congestions, and logistical breakdowns, drastically reducing catch volumes and disrupting international trade flows for major exporters. Concurrently, geopolitical tensions, such as the Russia-Ukraine conflict, have exacerbated energy and input cost volatility, strained shipping routes, and triggered trade restrictions, further destabilizing supply chains. Moreover, the increasing frequency and intensity of climate-change-induced events have led to mass mortality in aquaculture and shifts in wild fish stocks, directly threatening production stability. These cascading and concurrent shocks underscore the acute and urgent need to enhance the resilience and sustainability of GSCAP (Vijay and Raju, 2024). Upgrading the resilience of GSCAP has become the primary task of supply chain management. On the other hand, GSCAP as an important carrier for the breeding, fishing, and circulation of aquatic products, its supply chain management must consider not only the economic sustainability of the system but also resource regeneration, ecosystem and biodiversity protection, and the enhancement of the greenness of aquatic products to increase social welfare and ensure social justice. Due to overfishing, environmental pollution, and mismanagement, aquatic environments are threatened. Fishery resources are continuously decreasing, thus, the sustainable development of the aquatic products supply chain is urgently needed.
In summary, upgrading GSCAP carries the dual goals of resilience and sustainable development. However, the factors influencing resilience and sustainability are both mutually inclusive and partly contradictory (Horning, 2022), which is a challenge for the academic community. This study attempts to address the following questions: How to construct an evaluation indicator system for GSCAP from the perspective of integrated supply chain management, ensuring the synergistic upgrading of resilience and sustainability? How to identify key indicators in the indicator system and design upgrading strategies for GSCAP based on these key indicators? The core innovations and contributions of this research are threefold. First, it establishes a novel, comprehensive evaluation framework that explicitly integrates both resilience and sustainability dimensions across the entire lifecycle of the aquatic products supply chain (from production to consumption and services), moving beyond the prevalent literature that often treats these goals in isolation. Second, it introduces a hybrid Multi-Criteria Decision-Making (MCDM) methodology that synergistically combines the Delphi method, the Best-Worst Method (BWM), and Fuzzy Comprehensive Evaluation (FCE). This approach robustly handles subjectivity in indicator selection, determines precise criterion weights, and effectively assesses the performance of complex, qualitative systems, offering a methodological advancement for supply chain evaluation. Third, beyond theoretical framework development, this study provides empirical validation and strategic insights by applying the framework to conduct a comparative analysis of three distinct representative enterprises. This yields differentiated, actionable recommendations, thereby bridging the gap between theoretical modeling and practical supply chain management. Through addressing these questions, the study can provide theoretical support for the upgrading strategies of GSCAP, fully evaluate supply chain operation performance, and promote the formation of dynamic capabilities in GSCAP, enabling more flexible responses to internal and external environmental changes in the collective behavior and daily strategies of supply chain operations, continuously updating resource allocation, and maintaining competitive advantages.
This study explores GSCAP under the dual goals of resilience and sustainability, requiring decision-making within limited resources, judging the relevance and importance of different influencing factors, and evaluating alternatives using existing information, which is a typical MCDM problem (Taherdoost and Madanchian, 2023). In this study, BWM is used for interaction and logical hierarchy analysis of indicators to identify key influencing indicators. Fuzzy Comprehensive Evaluation is used to conduct empirical analysis on three representative Chinese aquatic products enterprises covering the entire industrial chain to verify the effectiveness of the evaluation indicator system.
The remaining structure of this paper is as follows: The second part is a literature review, summarizing existing research results from three aspects: aquatic product supply chain, global supply chain management, and supply chain resilience and sustainability upgrading. The third part constructs the influencing indicators for the synergistic development of resilience and sustainability in the aquatic products supply chain. The fourth part uses BWM to calculate the weights of influencing indicators for the development of resilience and sustainability in the aquatic products supply chain and evaluates aquatic products enterprises. The fifth part is discussion and implication. The sixth part is the conclusion.
2 Literature review
2.1 Overview of the supply chain for aquatic products
Aquatic products, being perishable commodities, have complex supply chains that encompass multiple stages, including fishing, transportation, processing, packaging, storage, and retail. They exhibit high transportation requirements, significant storage challenges, and are highly vulnerable to external shocks (Denham et al., 2015; Gephart et al., 2017; Wei et al., 2024). To address these challenges, recent scholarly efforts have predominantly focused on overcoming operational obstacles, optimizing logistics system design, and mitigating disruption risks (Ren et al., 2024). Key areas of research interest include logistics network planning (Purnomo et al., 2022; Ren et al., 2024), multi-echelon inventory management and dynamic replenishment models incorporating time window constraints (Ganesh Kumar and Uthayakumar, 2019; Shin et al., 2019), and transportation route optimization that factors in carbon emissions and product freshness (Eggert and Hartmann, 2023). Concurrently, the globalization of supply chains has become an irreversible trend (Adeinat et al., 2022; Sako, 2022). The global supply chain, comprising multi-level and cross-regional organizations, is a critical focus of management research, encompassing areas such as strategic synergy, risk management, and sustainability (Manuj and Mentzer, 2008a; Manuj and Mentzer, 2008b; de Carvalho et al., 2016; Rezaee, 2018; Tannous and Yoon, 2018; Bird and Soundararajan, 2019; Chu et al., 2020; Cohen and Lee, 2020; Liu et al., 2021; Reich et al., 2021; Sun et al., 2022; Suvorova et al., 2022).
Aquatic products are a major part of the global food trade. As a result, research on their global supply chain has grown (Yin and Shi, 2023). Current studies focus on two main areas: product and region. Product-centered studies match supply chain types, such as efficient or responsive models, to product features. For example, they study the Vietnamese catfish industry (Nguyen TAT. et al., 2023) or analyze key factors behind global supply chain collaboration among companies (Nguyen TTT. et al., 2023). Region-centered studies manage risks by comparing market demand and regional specifics (Prompatanapak and Lopetcharat, 2020; Love et al., 2021). They also deal with safety and quality issues in the global supply chain for aquatic products (Al-Busaidi et al., 2016).
In summary, existing research offers insights for optimizing GSCAP operations and managing risks. However, a notable gap remains in theoretical frameworks that integrate core supply chain management theories with the unique traits of aquatic products and the complexities of global supply chains.
2.2 Review of research on the resilience of the aquatic products supply chain
Numerous studies have been conducted to examine and enhance the resilience of the aquatic products supply chain. Existing research has focused on developing targeted strategies to improve its ability to withstand and recover from disruptions.
Scholars have proposed various concrete approaches. Andrew et al. (2021) demonstrated that rerouting community-supported fishery networks effectively strengthened the resilience of the aquatic products supply chain during the COVID-19 pandemic (Carlson et al., 2021). In response to environmental threats, Smith et al., 2021 developed contingency plans for supply chain disruptions caused by short-term ocean warming, which significantly improved resilience (Smith et al., 2021). From a policy perspective, Ward et al., 2022 found that strategic subsidies could simultaneously enhance sustainability (e.g., by funding research and breeding programs) and improve resilience by phasing out subsidies that support non-resilient practices (Ward et al., 2022). Recent research, particularly following the pandemic, has expanded the discourse towards more holistic and systemic frameworks for building long-term resilience, especially in vulnerable regions. A key study focusing on the Asia–Pacific region in the post-pandemic era argues that resilience can be achieved by integrating sustainable environmental practices with robust supply chain management (John et al., 2025). This approach includes minimizing environmental impact through sustainable fishing practices (e.g., reducing bycatch, protecting habitats) and investing in aquaculture to reduce over-reliance on wild capture. Concurrently, improving supply chain efficiency in processing, distribution, and logistics is identified as crucial for minimizing waste and ensuring market access during disruptions, thereby underpinning economic stability for fishing communities (John et al., 2025).
The exploration of specific mechanisms and drivers of resilience has gained analytical depth through advanced methodologies. Empirical evidence from China illustrates how technological and systemic innovation contribute to resilience. Research employing a dual machine-learning model on provincial data (2012–2022) shows that the advancement of New Quality Productivity has a statistically significant positive effect on overall aquatic industry chain resilience (Wu et al., 2026). The impact, however, is dimensionally heterogeneous: it strongly enhances resistance and recovery capacity as well as innovation and transformation capacity, while its effect on adjustment and adaptive capacity is negative, and its influence on green ecological restoration capacity is positive but not statistically significant (Wu et al., 2026). This study further reveals that the resilience-enhancing effect is more pronounced in coastal provinces than in inland regions and identifies improved labor productivity as a key transmission channel (Wu et al., 2026).
In summary, the literature on aquatic products supply chain resilience has evolved from proposing specific mitigation strategies towards developing integrated frameworks that combine environmental sustainability with supply chain optimization, supported by increasingly sophisticated empirical analysis of underlying drivers and regional specificities.
2.3 Review of research on the sustainability of aquatic products supply chain
Research on enhancing the sustainability of the aquatic products supply chain has addressed multiple dimensions, from operational optimization to systemic transformation.
Scholars have developed practical models and strategies for sustainability integration. Behzad et al. (2023) proposed a novel supply chain network for fresh aquatic products designed to strengthen waste recycling and promote sustainability (Mosallanezhad et al., 2023). Focusing on specific industries, Anqi et al. (2024) adopted an ecological green production strategy to achieve the coordinated and sustainable development of both the business environment and economic performance in the sea cucumber industry (Ren et al., 2024). At a strategic management level, Tseng et al., 2022 demonstrated that incorporating sustainability principles into supply chain collaboration and lean management within the Vietnamese aquatic products sector can yield significant economic benefits (Tseng et al., 2022). Furthermore, foundational research by Lim et al. (2015) identified that addressing inherent vulnerabilities within the supply chain is a critical prerequisite for ensuring the long-term sustainability of the Global Supply Chain for Aquatic Products (Lim-Camacho et al., 2015). Recent studies highlight the role of certification schemes, stakeholder awareness, and policy in driving sustainable consumption and practices. Research in Japan reveals a gap in seafood sustainability awareness despite regulatory shifts. A study on Marine Stewardship Council (MSC) certified fishers and Chain-of-Custody holders found that while fishers are proactive, distributors often obtain certification passively due to client demand, and approximately half fail to communicate sustainability information to consumers. Both groups identified government-led campaigns and education as essential for progress (Iue et al., 2022). From a broader policy perspective, Kelling et al., 2023 advocate for a systemic transformation to build resilient seafood supply systems. They propose key strategies including promoting regenerative and circular production models, strengthening local sourcing to enhance food security and traceability, and encouraging supply chain diversification to reduce pressure on critical fish stocks while maintaining socio-ecological safeguards (Kelling et al., 2023). In summary, the pursuit of sustainability in aquatic products supply chains involves a multi-faceted approach that spans technological and network optimization, strategic management integration, the effective use of certification and information dissemination, supportive policy interventions, and the implementation of collaborative, lean operational frameworks.
2.4 Review of research on synergy between resilience and sustainability of aquatic products supply chain
Building upon the distinct research streams of resilience and sustainability, recent literature emphasizes their critical interdependence for the long-term viability of aquatic products supply chains. Studies analyzing disruptions, particularly the COVID-19 pandemic, have moved beyond treating these concepts in isolation to exploring their synergistic nexus.
Research by Roshni (2023) indicates that attributes which build resilience—such as supply chain diversity, robust connectivity, and strong stakeholder collaboration—also form a foundation for advancing social, economic, and environmental sustainability (Subramaniam et al., 2023). Empirical work in specific contexts, such as Benzily et al.’s (2025) study of the post-pandemic Indian seafood industry, confirms that strategic practices like digitalization, export market diversification, and investment in renewable energy simultaneously enhance both operational resilience and long-term sustainability commitments (A and Jain, 2025). Furthermore, Stoll et al., 2021 highlighted the role of Alternative Seafood Networks (ASNs) during the pandemic, noting that their localized and adaptable structures demonstrated notable resilience. This underscores the importance of functional diversity within broader supply systems, suggesting that incorporating such networks can strengthen overall resilience while promoting sustainability through shorter supply chains and enhanced local linkages (Stoll et al., 2021).
In summary, while current research establishes the conceptual and practical links between resilience and sustainability, a significant methodological gap remains. There is a lack of a comprehensive framework capable of systematically evaluating and quantifying their synergy and potential trade-offs. This study addresses this gap by employing hybrid Multi-Criteria Decision-Making (MCDM) techniques to develop an integrated assessment model. This approach aims to provide a balanced and actionable tool for guiding the strategic development of more robust and sustainable global aquatic products supply chains.
3 Methods
The evaluation of resilience and sustainability in GSCAP involves complex, interdependent, and often qualitative criteria characterized by uncertainty and expert judgment. To address this complexity rigorously, a hybrid MCDM approach integrating the Delphi method, BWM, and FCE method is adopted. This combination is strategically chosen for its synergistic advantages over using a single method or alternative pairings. First, the Delphi method systematically leverages expert knowledge to establish, screen, and reach consensus on the evaluation indicator system, ensuring content validity and practical relevance while mitigating individual bias. Second, BWM is then employed to determine the precise weights of these identified indicators. Compared to other pairwise comparison methods like the Analytic Hierarchy Process, BWM requires fewer, more consistent comparisons, leading to more reliable weight vectors and higher consensus among experts. Finally, FCE is applied to conduct the actual assessment. It is uniquely suited to convert qualitative expert judgments on enterprise performance across various indicators into quantitative scores, effectively handling the inherent fuzziness and ambiguity in such evaluations. We use Delphi for indicator formation, BWM for priority weighting, and FCE for integrated performance assessment. The sequential application creates a robust, transparent, and logically coherent framework. This hybrid approach comprehensively addresses the key challenges in GSCAP evaluation: establishing a valid indicator set, accurately reflecting the relative importance of different resilience and sustainability factors, and synthesizing multifaceted, imprecise performance data into a clear evaluative outcome.
3.1 Indicator system construction
Based on the above summary of the resilient and sustainable aquatic products supply chain system framework, seven primary indicators, including production, processing, circulation, sales, consumption, external environment, and services, are set as key indicators for upgrading the global aquatic products supply chain strategy. On the basis of existing research and research team discussions, the seven primary influencing indicators were further refined into 29 specific secondary indicators, as detailed in Table 1.
Table 1
| Primary indicators | Secondary indicators | Meanings of indicators | Upgrade goals |
|---|---|---|---|
| Production(A) | Aquatic Products Production and Sales Compliance Capability (A1) | Ensuring that aquatic products caught or farmed meet the required production quantity, and the sales volume and price meet the producer’s expectations | Resilience |
| Scientific Control of Aquatic Products Catching and Feeding (A2) | Scientifically controls the usage and frequency of feed and chemicals; Scientifically controls the catching efficiency | Sustainability | |
| Risk Response Capability to Climate Change and Disasters (A3) | Pre-incident prevention, control during the incident and post-incident handling of natural disasters, public incidents, and other emergencies. | Resilience | |
| Production Technology Level (A4) | Level of mechanization and digitization in production, such as mechanical catching, intelligent inspection, automated farming, etc. | Resilience and Sustainability | |
| Capability to Protect Aquatic Habitats(A5) | Reducing waste and pollution, preventing overfishing, invasive species, diseases; protecting biodiversity, also the health and productivity of aquatic ecosystems | Sustainability | |
| Processing(B) | Capability to Grade and Sort Aquatic Products (B1) | Preliminary screening of aquatic products, using intelligent grading and sorting technology | Sustainability |
| Communication Capability (B2) | Ensuring information flow between producers and wholesalers, ensuring timely connection of the two parties | Resilience | |
| Storage Capability (B3) | Preliminary preservation and storage of aquatic products | Resilience | |
| Quality Traceability Capability (B4) | Establishing and utilizing a traceability system to record and monitor key data throughout the processing stage, ensuring product origin transparency and accountability | Resilience and Sustainability | |
| Processing and Packaging (B5) | Processing, bundling, and packaging of aquatic products | Resilience | |
| Circulation(C) | Information Circulation Capability (C1) | Connecting all links, ensuring the efficient and accurate transmission of business flow, logistics, capital flow, and information flow, with real-time monitoring and sharing of information | Resilience and Sustainability |
| Logistics Technology Level (C2) | Ensuring the freshness and integrity of aquatic products during transportation by controlling transportation time and using relevant equipment for refrigeration | Resilience | |
| Transportation Planning Capability (C3) | Choosing the optimal route and transportation tools considering product freshness and arrival time, to reduce transportation time and cost | Resilience | |
| Loading and Unloading Capability (C4) | Volume of loading and unloading per unit time; integrity rate of goods | Resilience | |
| Response to Sudden Accidents (C5) | Taking various measures to reduce the risk of logistics interruption in the face of emergencies | Resilience | |
| International Multimodal Transport(C6) | Situation of international multimodal transport methods such as rail, road, sea, and air transport | Resilience | |
| Sales(D) | Precision Marketing Capability (D1) | Using user profiling and precision marketing technology to improve competitiveness | Resilience and Sustainability |
| Pricing and Bargaining Capability (D2) | Coordinating with buyers and retailers, promoting product transactions, and ensuring agreement on price for the two parties | Resilience and Sustainability | |
| Inventory Quality Assurance and Adjustment (D3) | Preserving and storing aquatic products relatively well; dynamically adjusting to ensure supply and demand balance at each inventory point under abnormal demand conditions | Resilience | |
| Quality Inspection of Aquatic Products (D4) | Testing aquatic products for drug residues, toxic and harmful substances, heavy metals, microorganisms, etc., and selecting products that meet requirements | Sustainability | |
| Delivery and After-Sales Capability (D5) | After-sales handling of customer doubts about the quality, quantity, or service of aquatic products; cooperating with third-party platforms for group buying and delivery services to ensure delivery efficiency and product quality | Resilience and Sustainability | |
| Consumption(E) | Residents’ Consumption Level(E1) | Residents’ consumption level, disposable income, and consumption structure | Resilience |
| Consumers’ Knowledge Level of Aquatic Products(E2) | Consumers’ knowledge of the nutritional value of aquatic products in providing protein and trace indicators affects their dietary structure | Sustainability | |
| External Environment(F) | Policy and Regulations(F1) | Incorporating aquatic products into global and national food security and nutrition strategies; formulating relevant laws and regulations for the aquatic products industry | Resilience and Sustainability |
| Geopolitics(F2) | The strategic situation and national political actions involving the regions within the aquatic products supply chain | Resilience and Sustainability | |
| Market Environment(F3) | Consumer recognition of aquatic products, status of aquatic products in the national food supply system | Sustainability | |
| Services(G) | Data Service Capability(G1) | Establishing an integrated aquatic products big data platform for production, supply, and sales; transparent and reliable traceability system for products and environmental protection | Resilience and Sustainability |
| Technological Innovations(G2) | Strengthening the infrastructure construction of the aquatic products industry, and technological innovations in smart farming, catching, and cold chain logistics | Resilience and Sustainability | |
| Financial Support(G3) | Building a large-scale, well-structured financial and insurance service system | Resilience and Sustainability |
Preliminary construction of key indicators for the aquatic products global supply chain upgrading.
3.2 Delphi method
The Delphi method, also known as the expert survey method, involves organizing several experts to provide opinions on a specific topic back to back. Each round of opinions from the experts are summarized and fed back to the experts for further analysis. The process is repeated until expert opinions converge (Olson, 2010; Beiderbeck et al., 2021). For the rationality of the key indicators for the GSCAP upgrade proposed earlier, the research team used the Delphi method for expert evaluation to revise and improve the indicators.
Step 1: Selection and determination of consulting experts.
Experts with practical work experience or theoretical research experience in the fields of aquatic products supply chain production, processing, circulation, and sales were selected for the survey. The inclusion criteria included having a bachelor’s degree or above and at least five years of relevant work experience. The selection was not random but rather a targeted recruitment based on expertise, aiming to form a panel representing diverse yet relevant perspectives from academia and industry. Regarding panel size, while a larger panel can be beneficial, seminal methodological literature on the Delphi technique indicates that a group of 10–15 homogeneously expert participants is sufficient to achieve reliable results and convergence, as the focus is on depth of expertise rather than statistical representativeness (Jane Waggoner et al., 2016). Following this guidance and the principle of informed consent, this study engaged a panel of 10 experts, which falls within the recommended range and is deemed adequate for the purpose of indicator refinement and validation.
Step 2: Implementation of expert survey.
This study collected expert opinions through questionnaires. Before the survey, the purpose of the study was explained to the consulting experts, obtaining their consent and ensuring confidentiality of their personal information. Experts were required to complete the questionnaire independently. In the first round, experts judged the suitability of the key indicators and influencing indicators in GSCAP upgrading indicator based on their experience and checked whether the indicators were clearly defined. Experts scored these indicators on a scale of 1-5, with 1 indicating very unimportant and 5 indicating very important. The concentration and coordination of expert opinions were calculated for each indicator. In the second round, indicators with differing opinions from the first round were surveyed again until consensus was reached.
Step 3: Statistical analysis.
Ambiguities or disagreements among experts on specific indicators were systematically resolved through the iterative Delphi process itself. In each round, the collected opinions were analyzed using statistical measure. Indicators exhibiting significant disagreement or low importance were flagged. These indicators, along with anonymous, aggregated feedback from the panel, were presented back to the experts in the subsequent round. This controlled feedback allowed experts to reconsider their views in light of the group’s response, steering the panel towards a consensus. The process continued until a predefined stopping criterion was met, indicating acceptable consensus, and no indicators met the deletion criteria. Thus, consensus was driven not by imposition but through structured reflection and statistical convergence.
SPSS software was used for descriptive statistical analysis of the importance scores, standard deviations, expert activity coefficients, and authority degrees; non-parametric tests were used to calculate the coordination coefficient of expert opinions. Expert authority was represented by the authority coefficient (Cr), determined by the judgment basis coefficient (Ca) and the familiarity coefficient (Cs) of the experts on the issue. These two indicators were self-assessed by the experts, and the authority degree was the arithmetic average of the judgment coefficient and familiarity degree. When the authority degree was ≥0.7, the expert survey results were considered reliable (Olson, 2010).
The concentration degree of expert opinions was mainly expressed by the mean value and full score ratio of the importance scores. The coordination degree was expressed by the coefficient of variation (CV) and Kendall’s coefficient of coordination (W). The coefficient of variation indicated the fluctuation degree of expert recognition of the importance of the indicators, with higher values indicating greater expert opinion differences, and the closer the coordination coefficient was to 1, P < 0.05, indicating good coordination of expert opinions and high consistency. Indicators with an importance score mean ≤3.5, a full score ratio ≤20%, and a coefficient of variation ≥0.25 were deleted.
3.3 Best-worst method
The Best-Worst Method (BWM) is a multi-criteria decision-making (MCDM) method developed by Jafar Rezaei (Delft University of Technology) in 2015. BWM has been used to solve many practical MCDM problems in fields such as business, economics, engineering, education, and agriculture. It can be used for weight determination and alternative selection. The main steps are as follows:
Step 1:Determine a set of decision criteria.
In this step, the decision-maker considers the criteria that should be used to arrive at a decision.
Step 2: Determine the best(e.g. the most important),and the worst(e.g. the least important)criteria.
In this step, the decision-maker identifies the best and the worst criteria. No comparisons made at this stage.
Step 3: Determine the preference of the best criterion over all the other criteria, using a number between 1 and 9. The resulting best-to-others (BO) vector would be:
where indicates the preference of the best criterion B over criterion j. It is clear that .
Step 4:Determine the preference of all the criteria over the worst criterion, using a number between 1 and 9. The resulting others-to-worst (OW) vector would be:
where indicates the preference of the criterion j over the worst criterion . It is clear that .
Step 5: Find the optimal relative weights The aim is to determine the optimal weights of the criteria, such that the maximum absolute differences and or all j is minimized, which is translated to the following minmax model (1):
Instead of minimizing the maximum value among the set of , we minimize the maximum among the set of Model (1) can be transferred to the following linear programming model (2):
For this model, can be directly considered as an indicator of the consistency of the comparisons (here we do not use Consistency Index). Values of close to zero show a high level of consistency.
Step 6:Find the composite weights When the relative weight of indicators has been determined, the calculation of the composite weight of criterion is relatively simple. The formula is:
refers to the composite weight of the criterion , refers to the relative weight of the criterion. refers to the relative weight of the criteria relative to the corresponding upper criteria j.
3.4 Fuzzy comprehensive evaluation
The fuzzy comprehensive evaluation method (FCE) is based on the membership degree theory of fuzzy mathematics. It considers various factors in the evaluation process, transforming qualitative evaluation into quantitative evaluation. It incorporates multiple factors and their associated indicators — many of which are influenced by hard-to-quantify variables—into the evaluation process, thereby producing a clearer overall assessment. Therefore, using the fuzzy comprehensive evaluation method to evaluate the resilience and sustainability of the aquatic products supply chain is quite reasonable. The main steps are as follows:
Step 1: Determine the factor set of the evaluation object.
Based on experience and related research data, establish the factor set U consisting of primary indicators and the sub-factor set Ui consisting of secondary indicators.
Step 2: Determine the comment set V.
The comment set is a collection of evaluation levels. Generally, the evaluation standards are determined and the comment levels are divided through expert consultation.
Step 3: Determine the weights of the evaluation indicators.
The weight set reflects the different positions and roles of various evaluation indicators in the “evaluated object.” Here, the weight results determined by the BWM method are used.
Step 4: Establish a fuzzy relationship matrix.
Membership degree is the fuzzy mapping between the factor set U and the comment set V. Each factor Ui (i = 1, 2, 3, 4, 5, 6, 7) is quantified, and its fuzzy relationship matrix is represented by R.
Step 5: Synthesize the fuzzy comprehensive evaluation result vector.
According to the fuzzy comprehensive evaluation model Hi=Wi*Ri (i = 1, 2, 3, 4, 5, 6, 7), perform single-factor fuzzy comprehensive evaluation and overall fuzzy comprehensive evaluation.
4 Results
4.1 Indicator system construction
4.1.1 Experts information
Experts participating in the Delphi research need to have in-depth knowledge of supply chain management and practical experience in the aquatic products industry. The expert team in this study consists of five practitioners involved in the production, processing, and sales of the aquatic products, three supply chain management researchers, and two cross-border business researchers. As elites in their respective fields, supply chain management and cross-border business research experts can accurately grasp the development trends of GSCAP. Consulting them can improve the scientificity of the evaluation indicators. Practitioners in the aquatic products industry understand the current situation of the global aquatic products supply chain, and consulting their opinions and suggestions can improve the practicality and operability of the evaluation. In this study, 10 questionnaires were sent out in each of the three rounds, with an effective recovery rate of 100%.
4.1.2 Expert authority degree
The authority degree (Cr) in this study was determined through experts’ self-evaluation. Based on the judgment basis coefficient (Ca) and the familiarity degree coefficient (Cs), the authority degree was the arithmetic average of the two coefficients. As shown in Table 2, the statistical results showed that the average authority degree of the experts was 0.84, greater than 0.7, which is within the acceptable range, indicating that the expert team in this study met the requirements of the Delphi research.
Table 2
| Expert number | Familiarity level (Cs) | Criterion for judgment | Authority coefficient (Cr) | ||||
|---|---|---|---|---|---|---|---|
| Practical experience | Theoretical analysis | Reference materials | Subjective intuition | Ca | |||
| 1 | 1.0 | 0.5 | 0.2 | 0.1 | 0.1 | 0.9 | 0.95 |
| 2 | 0.7 | 0.5 | 0.3 | 0.1 | 0.1 | 1.0 | 0.85 |
| 3 | 1.0 | 0.5 | 0.2 | 0.1 | 0.1 | 0.9 | 0.95 |
| 4 | 0.7 | 0.5 | 0.2 | 0.1 | 0.1 | 0.9 | 0.8 |
| 5 | 0.5 | 0.4 | 0.3 | 0.1 | 0.1 | 0.9 | 0.7 |
| 6 | 0.5 | 0.5 | 0.2 | 0.1 | 0.1 | 0.9 | 0.7 |
| 7 | 0.5 | 0.4 | 0.3 | 0.1 | 0.1 | 0.9 | 0.7 |
| 8 | 0.7 | 0.4 | 0.3 | 0.1 | 0.1 | 0.9 | 0.8 |
| 9 | 1.0 | 0.5 | 0.2 | 0.1 | 0.1 | 0.9 | 0.95 |
| 10 | 1.0 | 0.5 | 0.2 | 0.1 | 0.1 | 0.9 | 0.95 |
| Mean Value | 0.76 | 0.47 | 0.24 | 0.1 | 0.1 | 0.91 | 0.84 |
Authority degree of 10 experts.
4.1.3 Concentration and coordination of expert opinions
In the first round of consultation, experts scored the importance of the key indicators of GSCAP and provided revision suggestions. The mean score range for the indicators importance was 2.50-5.00, and the full score rate range was 0.00%-100.00%. In the second round of consultation, the revised indicators were reevaluated for importance, and further revision suggestions were made. The mean score range for the second round was 3.50-5.00, with a full score rate of 0.00%-100.00%. The coefficient of variation for the two rounds of the Delphi expert consultation was 0.00-0.33 and 0.00-0.19, respectively. As shown in Table 3, the Kendall’s coefficient of coordination was 0.498 and 0.541, with a P value <0.001, indicating that there is a general convergence of experts’ views.
Table 3
| Indicators | Kendall’s coordination coefficient(W) | Coefficient of variation(CV) | P-value |
|---|---|---|---|
| First Round Consultation | 0.498 | 0.16 | <0.001 |
| Second Round Consultation | 0.541 | 0.11 | <0.001 |
Coordination coefficient of expert opinions.
4.1.4 Revision and determination of indicators
Based on the experts’ suggestions from the first round, the research team reevaluated the indicators with a mean importance score ≤3.5, a full score rate ≤20%, and a coefficient of variation ≥0.25. Finally, four indicators (B2 Communication Ability, B4 Quality Traceability Capability, C4 Loading and Unloading Ability, and D2 Pricing and Bargaining Ability) were deleted, and two new indicators (C6 Customs Declaration and Inspection, E2 Aquatic Products Demand Forecasting and Sharing) were added, forming the second round expert consultation questionnaire. As shown in Table 4, after the second round consultation, 7 primary indicators and 27 secondary indicators were determined as the key indicators for GSCAP.
Table 4
| Primary indicators | Secondary indicators | Meanings of indicators | Upgrade goals |
|---|---|---|---|
| Production(A) | Aquatic Products Production and Sales Compliance Capability (A1) | 4.50 | 0.12 |
| Scientific Control of Aquatic Products Catching and Feeding (A2) | 5.00 | 0.00 | |
| Risk Response Capability to Climate Change and Disasters (A3) | 4.80 | 0.09 | |
| Production Technology Level (A4) | 4.40 | 0.12 | |
| Capability to Protect Aquatic Habitats(A5) | 4.80 | 0.09 | |
| Processing(B) | Capability to Grade and Sort Aquatic Products (B1) | 4.30 | 0.11 |
| Storage Capability (B2) | 3.90 | 0.11 | |
| Processing and Packaging (B3) | 3.80 | 0.12 | |
| Circulation(C) | Information Circulation Capability (C1) | 4.40 | 0.12 |
| Logistics Technology Level (C2) | 4.50 | 0.12 | |
| Transportation Planning Capability (C3) | 4.00 | 0.00 | |
| Response to Sudden Accidents (C4) | 4.40 | 0.12 | |
| International Multimodal Transport(C5) | 3.60 | 0.14 | |
| Customs Declaration and Inspection (C6) | 3.50 | 0.15 | |
| Sales(D) | Precision Marketing Capability (D1) | 4.70 | 0.08 |
| Inventory Quality Assurance and Adjustment (D2) | 4.50 | 0.11 | |
| Quality Inspection of Aquatic Products (D3) | 4.80 | 0.10 | |
| Delivery and After-Sales Capability (D4) | 4.40 | 0.10 | |
| Consumption(E) | Residents’ Consumption Level(E1) | 4.20 | 0.10 |
| Aquatic Products Demand Forecasting and Sharing(E2) | 4.50 | 0.12 | |
| Consumers’ Knowledge Level of Aquatic Products(E3) | 3.90 | 0.11 | |
| External Environment(F) | Policy and Regulations(F1) | 4.60 | 0.12 |
| Geopolitics(F2) | 4.80 | 0.09 | |
| Market Environment(F3) | 4.50 | 0.12 | |
| Services(G) | Data Service Capability(G1) | 4.30 | 0.11 |
| Technological Innovations(G2) | 4.00 | 0.12 | |
| Financial Support(G3) | 4.60 | 0.11 |
Second round of expert consultation results on key indicators for GSCAP upgrading.
4.2 Key indicator identification
First, we invited five experts from the expert group to calculate the absolute weights of each criterion according to the BWM method. Using Expert I as an example, the specific process is as follows:
Expert I selected the most important and least important factors among the seven major factors: Production (A), Processing (B), Circulation (C), Sales (D), Consumption (E), External Environment (F), and Services (G), and scored them on a scale of 1-9, as shown in Table 5.
Table 5
| BO | A | B | C | D | E | F | G |
|---|---|---|---|---|---|---|---|
| Best criterion:A | 1 | 6 | 3 | 4 | 7 | 2 | 5 |
| OW | Worst criterion:E | ||||||
| A | 7 | ||||||
| B | 2 | ||||||
| C | 5 | ||||||
| D | 4 | ||||||
| E | 1 | ||||||
| F | 6 | ||||||
| G | 3 | ||||||
Best-to-others (BO) and others-to-worst (OW) pairwise comparison vectors.
After scoring the primary indicators, the secondary indicators were evaluated by expertsaccording to the aforementioned criteria. Due to space limitations, the complete pairwise comparisonvectors from Expert I are shown in Appendix A (Supplementary Tables S1–S7). These tables demonstrate how the Best-to-Others (BO) and Others-to-Worst (OW) values were obtained for each set of secondary indicators.
Using the same procedure, with Equations 1 and2, the weight calculation results of experts II, III, and V can be collected and calculated. The geometric mean is used to summarize the final weight results, as shown in Table 6. Order represents the rank of indicators based on descending global weight values.
Table 6
| Primary indicators | Primary indicator weight | Secondary indicators | Secondary indicator weight | Global weight(Normalization) | Order |
|---|---|---|---|---|---|
| Production (A) |
0.3234 | A1 | 0.1010 | 0.0340 | 12 |
| A2 | 0.4843 | 0.1565 | 1 | ||
| A3 | 0.1613 | 0.0516 | 8 | ||
| A4 | 0.0691 | 0.0217 | 18 | ||
| A5 | 0.1843 | 0.0595 | 6 | ||
| Processing (B) |
0.0759 | B1 | 0.4716 | 0.0359 | 11 |
| B2 | 0.4220 | 0.0321 | 13 | ||
| B3 | 0.1065 | 0.0079 | 24 | ||
| Circulation (C) |
0.1757 | C1 | 0.1502 | 0.0252 | 15 |
| C2 | 0.3678 | 0.0666 | 4 | ||
| C3 | 0.0950 | 0.0168 | 21 | ||
| C4 | 0.1974 | 0.0365 | 10 | ||
| C5 | 0.1459 | 0.0229 | 16 | ||
| C6 | 0.0437 | 0.0077 | 25 | ||
| Sales (D) |
0.1267 | D1 | 0.1994 | 0.0220 | 17 |
| D2 | 0.5808 | 0.0720 | 2 | ||
| D3 | 0.1307 | 0.0202 | 19 | ||
| D4 | 0.0891 | 0.0126 | 23 | ||
| Consumption (E) |
0.0449 | E1 | 0.1713 | 0.0070 | 26 |
| E2 | 0.7080 | 0.0319 | 14 | ||
| E3 | 0.1206 | 0.0060 | 27 | ||
| External Environment (F) |
0.1825 | F1 | 0.3938 | 0.0696 | 3 |
| F2 | 0.2690 | 0.0521 | 7 | ||
| F3 | 0.3372 | 0.0608 | 5 | ||
| Services (G) |
0.0710 | G1 | 0.2587 | 0.0178 | 20 |
| G2 | 0.1982 | 0.0159 | 22 | ||
| G3 | 0.5430 | 0.0373 | 9 |
Weight and rank of indicator.
The average values in Table 6 represent the weights of key indicators for GSCAP upgrading. By sorting the weights in descending order, the importance order of each indicator can be obtained. According to the ranking list, the expert group suggested that the top eight standards should be identified as key indicators: A2 Scientific Control of Aquatic Products Catching and Feeding, D2 Inventory Quality Assurance and Adjustment, F1 Policy and Regulations, C2 Logistics Technology Level, F3 Market Environment, A5 Capability to Protect Aquatic Habitats, F2 Geopolitics, A3 Risk Response Capability for Climate and Disasters.
4.3 Case analysis
To verify the effectiveness of the evaluation indicator system and key indicator identification, this study selected three representative aquatic enterprises in China for case analysis. The selection was purposively designed to cover distinct, major business models within the GSCAP, ensuring the framework is tested across diverse operational foci. The three companies are Enterprise A (China Aquatic Products), Enterprise B (ASIASEA Group), and Enterprise C (Dalian Zhihui Fishery Group). Enterprise A represents a large, vertically integrated producer and harvester with a global ecosystem, focusing on upstream production control. Enterprise B represents a leading processor and distributor with extensive domestic and international sales networks, focusing on mid-stream processing and downstream market access. Enterprise C represents a technology-driven service provider within the industry, focusing on innovation and supply chain services.
The underlying rationale for selecting these case studies lies in the representativeness of their structures and strategies. The three enterprises occupy key nodes across the global aquatic products supply chain—upstream production, midstream processing, and downstream technical services—comprehensively covering core value chain segments from resource acquisition and production processing to market services. This configuration systematically reflects the operational characteristics and challenges faced by participants at different chain positions. All three are deeply engaged in global markets, possessing transnational supply chain networks that align closely with the research scope; simultaneously exhibiting significant differences in operational scale, ownership structure, market positioning, and technological approaches. This selection captures the heterogeneity in how firms participate in the GSCAP and allows for a comparative analysis of how resilience and sustainability capabilities manifest in different parts of the value chain.Overall, the selected cases exhibit complementary and representative characteristics in terms of value chain positioning, business models, and levels of globalization. They comprehensively reflect the primary participation patterns within the global seafood supply chain, providing a reliable empirical foundation for subsequent comparative analysis and strategic recommendations. Furthermore, all three are significant players with accessible public information and industry recognition, which facilitates reliable expert evaluation of their performance against the indicators.
4.3.1 Determine the factor set of the evaluation object
The factor set consists of the primary indicators and their corresponding secondary indicators: U = {Production, Processing, Circulation, Sales, Consumption, External Environment, Services}; U1 = {Aquatic products production and sales compliance capacity, Scientific control of aquatic products catching and feeding, Risk response capability for climate and disasters, Production technology level, Protection of aquatic habitats}; U2 = {Aquatic products grading and sorting capacity, Storage capacity, Processing and packaging}; U3 = {Information flow capacity, Logistics technology level, Transportation planning ability, Emergency response, International multimodal transport, Customs declaration and inspection}; U4 = {Precision marketing ability, Inventory quality assurance and adjustment, Aquatic products quality inspection, Distribution and after-sales capacity}; U5 = {Residents’ consumption level, Aquatic products demand forecasting and sharing, Residents’ awareness of aquatic products}; U6 = {Policy and regulations, Geopolitics, Market environment}; U7 = {Data service capability, Innovative technology capability, Financial support}.
4.3.2 Determine the comment set
The evaluation set is divided into five levels: V = {V1, V2, V3, V4, V5} = {Strong, Relatively Strong, Moderate, Relatively Weak, Weak}, with Strong {90-100}, Relatively Strong {80-89}, Moderate {70-79}, Relatively Weak {60-69}, Weak {0-59}. The evaluation set’s score vector is V = [95, 85, 75, 65, 30]T. Each indicator’s evaluation set needs a clear definition, with qualitative indicators described in clear language and quantitative indicators given corresponding reference values to determine their level, achieving the conversion of qualitative and quantitative evaluations.
4.3.3 Determine the weights of evaluation indicators
The weights of each level indicator were determined using the BWM method, and the weight set is as follows: , n represents the number of indicators, satisfying the normalization condition, thus, = 1.
4.3.4 Establish the fuzzy relationship matrix
Based on the feedback collection and evaluation criteria, this study expanded upon the initial Delphi method expert panel by additionally inviting five experts with over ten years of practical experience in multinational seafood supply chain operations and auditing. Together, they formed a comprehensive evaluation panel of 15 members. Guided by comment set and evaluation set, 15 questionnaires were distributed to the experts, and 15 valid questionnaires were returned. Through statistical summarization, the evaluation vectors of each indicator were obtained. Taking Enterprise A (China Aquatic Products) as an example, the evaluation summary is shown in Table 7.
Table 7
| Factor set Ui | Evaluation set Vi | |||||
|---|---|---|---|---|---|---|
| Strong(V1) | Relatively strong(V2) | Moderate(V3) | Relatively weak(V4) | Weak(V5) | ||
| Production(A) | Aquatic Products Production and Sales Compliance Capability (A1) | 11 | 1 | 3 | 0 | 0 |
| Scientific Control of Aquatic Products Catching and Feeding (A2) | 10 | 5 | 0 | 0 | 0 | |
| Risk Response Capability to Climate Change and Disasters (A3) | 10 | 3 | 2 | 0 | 0 | |
| Production Technology Level (A4) | 9 | 4 | 1 | 1 | 0 | |
| Capability to Protect Aquatic Habitats(A5) | 13 | 2 | 0 | 0 | 0 | |
| Processing(B) | Capability to Grade and Sort Aquatic Products (B1) | 2 | 12 | 1 | 0 | 0 |
| Storage Capability (B2) | 13 | 1 | 0 | 1 | 0 | |
| Processing and Packaging (B3) | 1 | 3 | 10 | 1 | 0 | |
| Circulation(C) | Information Circulation Capability (C1) | 14 | 1 | 0 | 0 | 0 |
| Logistics Technology Level (C2) | 1 | 3 | 10 | 1 | 0 | |
| Transportation Planning Capability (C3) | 4 | 5 | 3 | 2 | 1 | |
| Response to Sudden Accidents (C4) | 3 | 4 | 6 | 2 | 0 | |
| International Multimodal Transport(C5) | 12 | 2 | 1 | 0 | 0 | |
| Customs Declaration and Inspection (C6) | 13 | 1 | 1 | 0 | 0 | |
| Sales(D) | Precision Marketing Capability (D1) | 3 | 7 | 5 | 0 | 0 |
| Inventory Quality Assurance and Adjustment (D2) | 10 | 3 | 2 | 0 | 0 | |
| Quality Inspection of Aquatic Products (D3) | 11 | 3 | 1 | 0 | 0 | |
| Delivery and After-Sales Capability (D4) | 6 | 8 | 1 | 0 | 0 | |
| Consumption(E) | Residents’ Consumption Level(E1) | 1 | 7 | 6 | 1 | 0 |
| Aquatic Products Demand Forecasting and Sharing(E2) | 0 | 3 | 7 | 5 | 0 | |
| Consumers’ Knowledge Level of Aquatic Products(E3) | 5 | 8 | 2 | 0 | 0 | |
| External Environment(F) | Policy and Regulations(F1) | 8 | 6 | 1 | 0 | 0 |
| Geopolitics(F2) | 2 | 5 | 7 | 1 | 0 | |
| Market Environment(F3) | 5 | 9 | 1 | 0 | 0 | |
| Services(G) | Data Service Capability(G1) | 4 | 8 | 3 | 0 | 0 |
| Technological Innovations(G2) | 11 | 3 | 1 | 0 | 0 | |
| Financial Support(G3) | 9 | 5 | 1 | 0 | 0 | |
Evaluation summary of enterprise A’s GSCAP resilience and sustainability.
4.3.5 Fuzzy comprehensive evaluation of indicators
(1) Single-factor fuzzy comprehensive evaluation.
Single-factor fuzzy comprehensive evaluation reflects the impact of individual factors on the resilience and sustainability of GSCAP. The evaluation and assessment are conducted separately from production, processing, circulation, sales, consumption, external environment, and services. The fuzzy comprehensive evaluation matrix R1 for production is obtained through statistical analysis:
The weight vector W1 is used with the fuzzy comprehensive evaluation matrix R1 to calculate the fuzzy comprehensive evaluation vector H1 for production:
Similarly, the fuzzy comprehensive evaluation matrix , , , , , and can be obtained for other factors. The corresponding weight vectors , , , , and are used for fuzzy transformation to obtain the comprehensive evaluation vectors , , , , and for production, processing, circulation, sales, consumption, external environment, and services, respectively: (2) Overall Fuzzy Comprehensive Evaluation.
The overall fuzzy comprehensive evaluation combines all influencing factors to make an overall assessment of the resilience and sustainability of the aquatic products supply chain, providing a more comprehensive and integrated evaluation result. As mentioned above, the weight vector W of the primary indicators and the overall evaluation matrix H are used to calculate the fuzzy comprehensive evaluation vector N:
Combining the fuzzy comprehensive evaluation vector N with the score vector V of the evaluation set, the comprehensive evaluation score for Enterprise A is calculated as:
Similarly, the comprehensive evaluation score for Enterprise B is calculated as follows:
for Enterprise C is calculated as follows:
Based on relevant literature and prevailing industry standards, the final comprehensive evaluation score F is classified into supply chain resilience levels as follows: ,classified as Strong; , classified as Relatively Strong , classified as Moderate; , classified as Relatively Weak; , classified as Weak. Based on the above results, Enterprise A’s aquatic products supply chain is rated as Strong, Enterprise B as Relatively Strong, and Enterprise C as Relatively Strong. Regarding the alignment of the comprehensive evaluation results with reality, the ranking (Enterprise A > Enterprise B > Enterprise C) and their respective performance tiers are consistent with their publicly perceived market positions and strategic strengths. Enterprise A ‘s top score aligns with its reputation as a globally integrated leader with substantial control over sustainable production and robust logistics. Enterprise B ‘s strong score in processing and sales but relative weakness in logistics digitization matches its known profile as a processing and trade giant that has historically focused less on integrated digital logistics. Enterprise C ‘s lower score reflects its role as a specialized technology service provider, which naturally implies narrower operational scope and greater exposure to market volatility compared to fully integrated players. These contextual alignments support the practical validity and discriminative power of the proposed evaluation framework.
4.4 Sensitivity test
Following the establishment and empirical analysis of a global seafood supply chain resilience and sustainability evaluation system, this study conducted a systematic sensitivity analysis to test the robustness of the evaluation results. The analysis focused on whether variations in the weights of evaluation indicators would affect corporate rankings and grade determinations.
4.4.1 Sensitivity measure indicator
Sensitivity analysis employs a single-factor variation method, sequentially adjusting the weights of seven primary indicators across six magnitude levels (-30%, -20%, -10%, +10%, +20%, +30%). When adjusting the weight of a specific indicator, the remaining six indicators are scaled proportionally based on their initial weight ratios. The adjustment coefficient is determined by the following formula:
When the target indicator weight increases, When the target indicator weight decreases, represents the original weight of the indicator, while denotes the adjusted weight. The relative weights of secondary indicators within their respective primary indicators remain unchanged. Based on the adjusted weight set, the fuzzy comprehensive evaluation scores for the three enterprises are recalculated using the original evaluation model. To quantify the impact of indicator changes on evaluation outcomes, this study introduces the sensitivity coefficient S as a core metric, defined as:
This coefficient reflects the average change in a company’s composite score resulting from a one-unit absolute change in the indicator’s weight. It can be used to compare the relative influence of different indicators on evaluation outcomes.
This study systematically validated the reliability of the evaluation system through sensitivity analysis, focusing on model robustness. Results indicate that across all 42 weight variation scenarios, the relative ranking order of the three enterprises based on their original scores remained unchanged, demonstrating the strong robustness of the evaluation conclusions to parameter fluctuations. The sensitivity analysis revealed a significant nonlinear and heterogeneous relationship between indicator weights and their marginal influence on evaluation outcomes. The magnitude of weight does not directly equate to actual impact; the importance of evaluation indicators must be comprehensively assessed in conjunction with their sensitivity coefficients.
Based on the average sensitivity coefficients of the three enterprises, we categorize indicators into three influence zones: High Sensitivity Zone (|S| > 2.0), Medium Sensitivity Zone (0.5 < |S| ≤ 2.0), and Low Sensitivity Zone (|S| ≤ 0.5). The High Sensitivity Zone primarily includes indicators such as Scientific Control of Aquatic Products Catching and Feeding (A2) and Aquatic Products Demand Forecasting and Sharing (E2). Minor fluctuations in the weights of these indicators can lead to significant variations in evaluation results, making them crucial for monitoring and calibration in decision-making. The Medium Sensitivity Zone covers most operational indicators, such as Logistics Technology Level (C2) and Precision Marketing Capability (D1), which exhibit moderate influence. Changes in weights within the low-sensitivity zone have minimal impact on the overall score. Specific results are shown in Table 8.
Table 8
| Dimension | Criteria | Indicators | Sensitivity | Impact on the score (weight changes ±30%) | ||
|---|---|---|---|---|---|---|
| SA | SB | SC | ||||
| high-sensitivity zones | |S| > 2.0 | E2 | -12.76 | -5.9 | -2.51 | 0.18 |
| G3 | 5.21 | 3.11 | -1.5 | 0.11 | ||
| F1 | 2.11 | 2.11 | 2.11 | 0.07 | ||
| F3 | 1.81 | -0.91 | 1.81 | 0.06 | ||
| D2 | 3.31 | 1.17 | -1.5 | 0.12 | ||
| medium-sensitivity zones | 0.5 < |S| ≤ 2.0 | A2 | 3.07 | -2.31 | -1.45 | 0.3 |
| C2 | -1.56 | -1.56 | -1.36 | 0.1 | ||
| F2 | 1.24 | 1.24 | 1.24 | 0.04 | ||
| B1 | -0.86 | -1.16 | -1.16 | 0.03 | ||
| A3 | 1.02 | 0.34 | -0.45 | 0.1 | ||
| G1 | 1.24 | 0.5 | 2.73 | 0.05 | ||
| C4 | -0.84 | -0.84 | 1.26 | 0.06 | ||
| D3 | 0.74 | -0.28 | 1.11 | 0.03 | ||
| G2 | 0.95 | 0.61 | -0.95 | 0.04 | ||
| B2 | -0.76 | -1.53 | -1.53 | 0.03 | ||
| E1 | -0.52 | -0.77 | -1.03 | 0.01 | ||
| A5 | 1.17 | 0.58 | -0.72 | 0.11 | ||
| D1 | 0.57 | 0.57 | -1.13 | 0.04 | ||
| C5 | -0.62 | 0.93 | -0.93 | 0.05 | ||
| A1 | 0.64 | -0.32 | 0.19 | 0.06 | ||
| E3 | -0.37 | -0.56 | -0.93 | 0.01 | ||
| D4 | 0.51 | 0.19 | -0.96 | 0.02 | ||
| C3 | -0.4 | -0.4 | -0.4 | 0.03 | ||
| low-sensitivity zones | |S| ≤ 0.5 | C1 | 0.32 | -0.64 | -1.28 | 0.02 |
| A4 | 0.44 | -0.22 | 0.22 | 0.04 | ||
| C6 | -0.19 | -0.19 | 1.12 | 0.01 | ||
| B3 | -0.19 | -0.29 | -0.29 | 0.01 | ||
Sensitivity analysis results.
The sensitivity-response patterns at the enterprise level clearly reflect each company’s strategic positioning and capability structure characteristics. As a production-dominant enterprise, Company A exhibits strong positive sensitivity toward production metrics. Increasing the weight of production processes significantly boosts its score, confirming its core strengths in upstream operations. Conversely, negative sensitivity toward distribution and certain processing metrics reveals relative weaknesses in mid-to-downstream coordination and logistics. Company B’s sensitivity distribution highlights its “processing-distribution” business model, indicating high operational efficiency in mid-to-downstream segments. Its negative sensitivity to production metrics aligns with its asset-light model, reliant on external procurement. Company C demonstrates potential in technical services and market conversion, exhibiting high sensitivity to service indicators and external environment factors, indicating strong reliance on external partnerships, policy support, and technological innovation. However, its significant negative sensitivity in production and consumption segments suggests room for improvement in foundational operations and market demand alignment capabilities.
In summary, this evaluation system maintains good stability within a reasonable range of weight fluctuations. Sensitivity analysis not only validates the model’s robustness but also reveals differences in the influence of indicators and the heterogeneity of each company’s capability structure. This provides quantitative decision-making support for differentiated policy formulation, identifying corporate weaknesses, and enhancing supply chain resilience.
5 Discussion and implication
Based on a comprehensive multi-criteria decision-making approach, the previous analysis identified the key influencing indicators of aquatic products supply chains and assessed their relative importance, providing a new perspective on the theory of supply chain management synergies and upgrading mechanisms. The following discussion focuses on these critical indicators and their synergistic effects, and further proposes targeted industry-specific optimization recommendations through a comparative analysis of enterprise performance.
5.1 Identification of key indicators and implications for synergistic development
This study offers an integrated assessment of critical factors underpinning the resilience and sustainability of global aquatic products supply chains. Utilizing a robust methodological approach combining the Delphi method, Best-Worst Method (BWM), and fuzzy comprehensive evaluation, eight key indicators across four primary dimensions—Production, Circulation, Sales, and External Environment—were identified as essential drivers influencing supply chain upgrading.
Distinct from prior literature, which typically emphasized downstream technology advancements and management practices as primary drivers (Ganesh Kumar and Uthayakumar, 2019; Tseng et al., 2022), our results underscore the increasing significance of upstream scientific management practices. This shift aligns closely with the evolving landscape of environmental regulations, growing ecological pressures, and heightened consumer demand for sustainable, transparent aquatic products sourcing. From an upstream perspective, indicators such as Scientific Control of Aquatic Products Catching and Feeding (A2), Risk Response Capability for Climate and Disasters (A3), and Capability to Protect Aquatic Habitats (A5) collectively represent core drivers of both resilience and sustainability. Scientific control over feeding regimes, chemical use, and capture efficiency ensures optimal yields while minimizing ecological impact, directly aligning with market and regulatory expectations for sustainable sourcing. Proactive climate and disaster response—through early warning systems, adaptive farming practices, and comprehensive contingency planning—reduces operational disruptions caused by extreme weather events and ocean warming. Simultaneously, protecting aquatic habitats by reducing pollution, preventing overfishing, and conserving biodiversity safeguards the long-term availability of resources, enhances brand reputation, and strengthens compliance with environmental standards. Together, these upstream capabilities form a mutually reinforcing foundation that secures supply stability, supports ecosystem health, and positions enterprises competitively in a sustainability-driven global market. Hence, enterprises adopting advanced, environmentally-adaptive production methods at the source not only enhance ecological outcomes but also reinforce overall supply chain resilience.
Furthermore, our findings reveal the considerable strategic influence of external environmental factors, including regulatory frameworks, market environment, and geopolitical conditions. Regulatory frameworks shape the operational boundaries of aquatic products supply chains, influencing compliance costs, product standards, and access to specific markets. The market environment—encompassing consumer preferences, demand volatility, and competitive dynamics—directly affects pricing power, sales channels, and the ability to maintain stable revenues. Geopolitical conditions, such as trade agreements, diplomatic relations, and regional stability, determine cross-border logistics reliability and exposure to international risks. This study highlights that the combined stability of these three external factors is a key determinant shaping overall supply chain vulnerabilities and performance potential. The increasing uncertainty induced by international trade conflicts, regulatory shifts, market demand fluctuations, and global disruptions necessitates a proactive approach by enterprises. Specifically, strengthening regulatory compliance mechanisms, enhancing market intelligence and adaptability, engaging in policy dialogues, and diversifying supply chain networks can significantly mitigate risks and enhance sustainability, echoing the contemporary call for integrated resilience policy approaches.
Additionally, the analysis underscores logistics technology and emergency response capabilities as vital components of resilient and sustainable aquatic supply chains. Investment in advanced logistics infrastructure, including intelligent routing systems, real-time monitoring, and sophisticated cold chain technologies, provides dual benefits by improving operational efficiency and enhancing responsiveness to disruptions. Previous studies have acknowledged the importance of logistics management (Mehrabi et al., 2022; Mosallanezhad et al., 2023), but our empirical results further validate that such investments simultaneously enhance product quality, resilience, and overall supply chain sustainability.
Our findings show that ensuring high-quality inventory and dynamically adjusting stock under abnormal demand are crucial for mitigating disruptions. Effective quality control safeguards safety and freshness, meets regulatory standards, and enables rapid response to fluctuations, reducing waste and losses. This dual role enhances resilience and sustainability, serving as both a buffer against shocks and a driver of long-term environmental and economic goals, extending prior research on inventory flexibility and supply chain robustness.
Based on these key indicators, supply chain participants and policymakers should prioritize synergistic improvements rather than isolated interventions. Particularly, efforts to optimize production methods and logistics technology can have cascading benefits across other supply chain segments, effectively circumventing the “trade-off” effects commonly observed in isolated improvement initiatives. Strategic coordination across upstream practices, external policy engagement, logistics capabilities, and market negotiation mechanisms will collectively enhance the long-term resilience and sustainability of aquatic supply chains.
5.2 Comparative analysis of enterprise performance and targeted improvement strategies
Employing a fuzzy comprehensive evaluation approach, the performance of three representative aquatic enterprises—Company A (China Aquatic), Company B (ASIASEA Group), and Company C (Dalian Zhihui Fishery Group)—was systematically assessed. Company A obtained the highest overall score (87.76), reflecting its strength in integrating advanced production techniques, effective logistics management, robust inventory quality, and comprehensive regulatory compliance. This outcome aligns closely with Company A’s vertically integrated business model, demonstrating that balanced development across multiple supply chain dimensions yields substantial competitive advantages.
In comparison, Company B and Company C scored lower, receiving scores of 81.23 and 77.42, respectively, categorizing them as “relatively strong.” According to the detailed scoring data, Company B exhibited particular weaknesses in logistics digitalization and emergency response capacities, consistent with its strategic positioning primarily within downstream processing and sales segments. Given these identified vulnerabilities, Company B is advised to enhance investments in digital logistics infrastructure, upgrade real-time tracking capabilities, and improve contingency planning measures. Such targeted improvements are likely to significantly bolster overall operational resilience, enabling the company to respond more effectively to external disruptions.
Company C, predominantly oriented toward technology-driven services and innovations, encountered limitations in precision marketing abilities and responsiveness to external market volatility. These deficiencies constrained its overall performance, suggesting a misalignment between technological competencies and market-oriented capabilities. To leverage its technological strengths effectively, Company C should prioritize enhancing market responsiveness, refining inventory strategies, and building stronger partnerships within the supply chain network. Focusing improvements on these specific weak points would considerably elevate its overall resilience and sustainability performance.
These comparative analyses underscore the importance of addressing firm-specific weaknesses through targeted strategic improvements rather than solely relying on the general weighting of indicators. Enterprises utilizing this evaluation framework should focus on identifying and mitigating their distinct shortcomings to achieve balanced, synergistic development. Such an approach not only enhances their internal operational resilience but also positions them strategically for long-term sustainability in the increasingly competitive and complex global aquatic products industry.
While the case analysis provides insights for three specific, relatively large Chinese enterprises, the evaluation framework and the identified key indicators possess broader applicability. The strategic implications, however, must be adapted to the scale, resources, and regional context of an enterprise. For large, integrated enterprises (analogous to Company A), the focus should be on leading systemic upgrades across all dimensions, investing in proprietary technology, and engaging in global policy dialogues. Small and medium-sized enterprise (SMEs), often constrained by capital and expertise, should prioritize cost-effective, collaborative strategies. This includes forming consortia to share logistics infrastructure, adopting standardized but modular technologies, and focusing on niche markets or specific supply chain segments where they can excel. For enterprises in developing countries, where regulatory frameworks and infrastructure may be less mature, the initial priorities should align with Policy and Regulations (F1) and Logistics Technology Level (C2). Actions include advocating for and complying with foundational food safety and sustainability standards, leveraging mobile technology for supply chain visibility, and seeking partnerships or funding from international development agencies for cold chain investment. The relative weights of indicators, particularly those related to the External Environment (F), may also differ significantly based on regional geopolitical and market stability. Therefore, practitioners are advised to use the proposed framework as a flexible diagnostic tool, recalibrating the focus of their improvement strategies based on their specific operational scale, resource endowment, and regional socio-economic landscape.
6 Conclusions
This study systematically examines the key indicators influencing the synergistic upgrading of resilience and sustainability in global aquatic products supply chains. By integrating the Delphi method, Best-Worst Method (BWM), and fuzzy comprehensive evaluation, a comprehensive and empirically validated indicator framework was established, enabling the identification of key dimensions and drivers that underpin supply chain performance. Furthermore, an empirical comparative evaluation was conducted on three representative aquatic enterprises, providing insights into their differentiated capabilities and areas for improvement.
The findings highlight the fundamental importance of scientific control in fishing and feeding practices at the production stage. In contrast to earlier studies predominantly focused on downstream technologies and operational management, this research emphasizes the strategic significance of upstream scientific practices. This shift reflects the evolving trends of heightened environmental regulations, ecological pressures, and consumer preferences toward sustainable sourcing, underscoring the necessity of proactive upstream management to effectively enhance both resilience and sustainability simultaneously.
Additionally, the study provides empirical evidence of the critical role played by external environmental factors, particularly policy frameworks and geopolitical conditions. Contrary to traditional literature that prioritized firm-level innovations and localized market strategies, our results illustrate how external policy stability and geopolitical environments significantly shape the risk landscape and competitive opportunities in global supply chains. These findings indicate that enterprises must adopt proactive measures—including regulatory compliance, strategic diversification, and robust policy engagement—to effectively mitigate external disruptions and sustain long-term competitive advantage.
Moreover, logistics technology and emergency response capabilities emerged as indispensable indicators for reinforcing supply chain resilience. Investment in advanced logistics infrastructure and digital capabilities, such as real-time monitoring systems and cold-chain technologies, proves essential for maintaining operational stability, flexibility, and quality standards, particularly during periods of disruption. Inventory quality assurance and adjustment was also identified as a key strategic indicator. By maintaining robust inventory quality and dynamically reallocating stock across nodes, firms can absorb demand shocks and logistics disruptions, safeguard safety and freshness compliance, and curb waste and financial losses. Reliable inventory buffers stabilize service levels and cost-to-serve, supporting fair value distribution among supply-chain actors and strengthening long-term partnerships through predictable, traceable fulfillment. Thus, Inventory Quality Assurance and Adjustment advances both resilience—via responsiveness and continuity—and sustainability—via resource efficiency—reinforcing our evidence that upstream quality management is foundational to upgrading the GSCAP.
The comparative fuzzy evaluation of three representative enterprises further validates the multidimensional and synergistic nature of supply chain upgrading. Company A, benefiting from a vertically integrated model and balanced strengths across production, logistics, market negotiation, and regulatory compliance, achieved the highest score, confirming that coordinated improvement across multiple domains yields significant competitive advantages. Conversely, Companies B and C exhibited specific weaknesses in logistics management and sales management, respectively. This underscores the importance of targeted improvement strategies, emphasizing that enterprises should prioritize addressing their unique vulnerabilities rather than focusing solely on general indicator weightings.
This study acknowledges that there are certain limitations. First, the cross-sectional and static analytical approach does not fully capture the impact of long-term dynamic factors on supply chain resilience and sustainability. Second, the case enterprises are all from a single country, which may limit the generalizability of the findings to regions with different infrastructures, policy environments, and market structures, especially for small and SMEs in developing countries. Future research should actively test and refine this model by applying it to a more diverse sample, including SMEs and enterprises from different developing and developed economies. Such studies could investigate how the relative importance of key indicators, such as Financial Support (G3) or Geopolitics (F2), shifts across different scales and regions. Furthermore, exploring the specific barriers to implementing resilience and sustainability measures for resource-constrained enterprises would yield valuable, targeted policy and managerial insights, ultimately making the global aquatic products supply chain more inclusive and robust.
Overall, this research contributes to existing literature by providing a robust analytical framework that explicitly integrates resilience and sustainability considerations across multiple dimensions of the supply chain. Practically, the results offer strategic guidance for enterprises and policymakers seeking to enhance supply chain performance through coordinated upstream and downstream strategies, proactive external policy engagement, technological investments, and targeted market practices. Future research could further investigate dynamic interdependencies among identified factors and expand the applicability of this framework across different sectors or regional contexts, thus continuing to advance the theory and practice of resilient and sustainable supply chain management in the global aquatic products industry.
Statements
Data availability statement
The raw data supporting the conclusions of this article will be made available by the authors, without undue reservation.
Ethics statement
Ethical approval was not required for the study involving humans in accordance with the local legislation and institutional requirements. Written informed consent to participate in this study was not required from the participants or the participants’ legal guardians/next of kin in accordance with the national legislation and the institutional requirements. The research design received approval from the Ethics Committee of the School of Information and Business Management at Dalian Neusoft University of Information. In strict compliance with the Helsinki Declaration, our study was conducted following all pertinent guidelines and regulations. Informed consent was obtained from all subjects, who were all duly informed about the purpose of the study and assured of the survey's anonymity. The outcomes of this research will be exclusively utilized for scientific purposes, with a firm commitment to maintaining the confidentiality of personal information.
Author contributions
ZS: Data curation, Formal analysis, Writing – original draft. YS: Resources, Writing – review & editing. YZ: Supervision, Writing – original draft. FZ: Conceptualization, Writing – review & editing.
Funding
The author(s) declared that financial support was not received for this work and/or its publication.
Acknowledgments
The authors would like to thank the editor and reviewers for their valuable comments.
Conflict of interest
The author(s) declared that this work was conducted in the absence of any commercial or financial relationships that could be construed as a potential conflict of interest.
Generative AI statement
The author(s) declared that generative AI was not used in the creation of this manuscript.
Any alternative text (alt text) provided alongside figures in this article has been generated by Frontiers with the support of artificial intelligence and reasonable efforts have been made to ensure accuracy, including review by the authors wherever possible. If you identify any issues, please contact us.
Publisher’s note
All claims expressed in this article are solely those of the authors and do not necessarily represent those of their affiliated organizations, or those of the publisher, the editors and the reviewers. Any product that may be evaluated in this article, or claim that may be made by its manufacturer, is not guaranteed or endorsed by the publisher.
Supplementary material
The Supplementary Material for this article can be found online at: https://www.frontiersin.org/articles/10.3389/fmars.2026.1750254/full#supplementary-material
References
1
A B. Jain D. V. (2025). Resilient and sustainable supply chain management in the Indian seafood industry: Postpandemic strategies for global competitiveness. J. Neonatal Surg.14, 1754–1759. doi: 10.52152/800809
2
Adeinat H. Pazhani S. Mendoza A. Ventura J. A. (2022). Coordination of pricing and inventory replenishment decisions in a supply chain with multiple geographically dispersed retailers. Int. J. Production Econ248, 108461. doi: 10.1016/j.ijpe.2022.108461
3
Al-Busaidi M. A. Jukes D. J. Bose S. (2016). Seafood safety and quality: An analysis of the supply chain in the Sultanate of Oman. Food Control59, 651–662. doi: 10.1016/j.foodcont.2015.06.023
4
Beiderbeck D. Frevel N. von der Gracht H. A. Schmidt S. L. Schweitzer V. M. Carlson A. K. et al . (2021). Preparing, conducting, and analyzing Delphi surveys: Cross-disciplinary practices, new directions, and advancements. MethodsX8, 101401. doi: 10.1016/j.mex.2021.101401
5
Bird R. C. Soundararajan V. (2019). From suspicion to sustainability in global supply chains. Tex. A M L. Rev.7, 383. doi: 10.37419/LR.V7.I2.3
6
Carlson A. K. Young T. Centeno M. A. Levin S. A. Rubenstein D. I. (2021). Boat to bowl: resilience through network rewiring of a community-supported fishery amid the COVID-19 pandemic. Environ. Res. Lett.16, 034054. doi: 10.1088/1748-9326/abe4f6
7
Chu C.-Y. Park K. Kremer G. E. (2020). A global supply chain risk management framework: An application of text-mining to identify region-specific supply chain risks. Advanced Eng. Inf.45, 101053. doi: 10.1016/j.aei.2020.101053
8
Cohen M. A. Lee H. L. (2020). Designing the right global supply chain network. Manufacturing Service Operations Manage.22, 15–24. doi: 10.1287/msom.2019.0839
9
de Carvalho A. L. Rodrigues Ignácio L. Esposto K. F. Ometto A. R. (2016). Synergy between the Multiple Supply Chain and Green Supply Chain Management (GSCM) approaches: an initial analysis aimed at fostering supply chain sustainability. Eur. J. Sustain. Dev.5, 119–119. doi: 10.14207/ejsd.2016.v5n3p119
10
Denham F. C. Howieson J. R. Solah V. A. Biswas W. K. (2015). Environmental supply chain management in the seafood industry: past, present and future approaches. J. cleaner production90, 82–90. doi: 10.1016/j.jclepro.2014.11.07
11
Eggert J. Hartmann J. (2023). Sustainable supply chain management–a key to resilience in the global pandemic. Supply Chain Management: Int. J.28, 486–507. doi: 10.1108/SCM-10-2021-0463
12
Ganesh Kumar M. Uthayakumar R. (2019). Multi-item inventory model with variable backorder and price discount under trade credit policy in stochastic demand. Int. J. Production Res.57, 298–320. doi: 10.1080/00207543.2018.1480839
13
Gephart J. A. Deutsch L. Pace M. L. Troell M. Seekell D. A. (2017). Shocks to fish production: Identification, trends, and consequences. Global Environ. Change42, 24–32. doi: 10.1016/j.gloenvcha.2016.11.003
14
Golden C. D. Koehn J. Z. Shepon A. Passarelli S. Free C. M. Viana D. F. (2021). Aquatic foods to nourish nations. Nature598, 315–320. doi: 10.1038/s41586-021-03917-1
15
Horning A. S. (2022). RESILIENCE FOR SUSTAINABILITY EVERYWHERE. The city is an ecosystem: sustainable education, policy, practice ( Routledge). doi: 10.4324/9781003217442-24
16
Iruku V. M. (2025). Multi-dimensional XAI framework revealing critical supply chain vulnerability drivers. World J. Advanced Eng. Technol. Sci.15, 2141–2152. doi: 10.30574/wjaets.2025.15.3.1154
17
Iue M. Makino M. Asari M. (2022). Seafood sustainability supply chain trends and challenges in Japan: marine stewardship council fisheries and chain of custody certificates. Sustainability14, 13523. doi: 10.3390/su142013523
18
Jane Waggoner M. Carline J. D. Durning S. J. (2016). Is there a consensus on consensus methodology? Descriptions and recommendations for future consensus research. Acad. Med.91, 663–8. doi: 10.1097/ACM.0000000000001092
19
John A. Khan Chowdhury A. J. Munir M. B. Abdullah R. Zainal Abidin Z. A. Nordin N. F. H. (2025). Fishery resilience in covid-19 post-pandemic era: sustainable environmental approach for potential challenges in asia. Environ. Sci. Eng. doi: 10.1007/978-3-031-47757-7_9
20
Kelling I. Carrigan M. Johnson A. F. (2023). Transforming the seafood supply system: challenges and strategies for resilience. Food Secur.15, 1585–1591. doi: 10.1007/s12571-023-01400-5
21
Lim-Camacho L. Hobday L. Bustamante A. Farmery R. Fleming A. Frusher A. (2015). Facing the wave of change: stakeholder perspectives on climate adaptation for Australian seafood supply chains. Regional Environ. Change15, 595–606. doi: 10.1007/s10113-014-0670-4
22
Liu A. Zhu Q. Xu L. Lu Q. Fan Y. (2021). Sustainable supply chain management for perishable products in emerging markets: An integrated location-inventory-routing model. Transportation Res. Part E: Logistics Transportation Rev.150, 102319. doi: 10.1016/j.tre.2021.102319
23
Love D. C. Nussbaumer E. M. Harding J. Gephart J. A. Anderson J. L. Asche F. (2021). Risks shift along seafood supply chains. Global Food Secur.28, 100476. doi: 10.1016/j.gfs.2020.100476
24
Manuj I. Mentzer J. T. (2008a). Global supply chain risk management. J. business logistics29, 133–155. doi: 10.1002/j.2158-1592.2008.tb00072.x
25
Manuj I. Mentzer J. T. (2008b). Global supply chain risk management strategies. Int. J. Phys. distribution logistics Manage.38, 192–223. doi: 10.1108/09600030810866986
26
Mehrabi Z. Delzeit R. Ignaciuk A. Levers C. Braich G. Bajaj K. (2022). Research priorities for global food security under extreme events. One Earth5, 756–766. doi: 10.1016/j.oneear.2022.06.008
27
Mosallanezhad B. Arjomandi M. A. Hashemi-Amiri O. Gholian-Jouybari F. Dibaj M. Akrami M. (2023). Metaheuristic optimizers to solve multi-echelon sustainable fresh seafood supply chain network design problem: a case of shrimp products. Alexandria Eng. J.68, 491–515. doi: 10.1016/j.aej.2023.01.022
28
Nguyen T. A. T. Nguyen Q. T. T. Tran T. C. Nguyen K. A. T. Jolly C. M. (2023). Balancing the aquatic export supply chain strategy-A case study of the Vietnam pangasius industry. Aquaculture566, 739139. doi: 10.1016/j.aquaculture.2022.739139
29
Nguyen T. T. T. Nguyen X. H. Nguyen H. D. Mai T. X. L. Bui T. T. (2023). Factors affecting cooperation in the international supply chain of seafood enterprises: the case of Vietnamese. Int. J. Prof. Business Review: Int. J. Prof. Bus. Rev.8, 1. doi: 10.26668/businessreview/2023.v8i5.699
30
Olson K. (2010). An examination of questionnaire evaluation by expert reviewers. Field Methods22, 295–318. doi: 10.1177/1525822X10379795
31
Prompatanapak A. Lopetcharat K. (2020). Managing changes and risk in seafood supply chain: A case study from Thailand. Aquaculture525, 735318. doi: 10.1016/j.aquaculture.2020.735318
32
Purnomo M. R. A. Wangsa I. D. Rizky N. Jauhari W. A. Zahria I. (2022). A multi-echelon fish closed-loop supply chain network problem with carbon emission and traceability. Expert Syst. Appl.210, 118416. doi: 10.1016/j.eswa.2022.118416
33
Reich J. Kinra J. Kotzab A. Brusset H. Xavier B . (2021). Strategic global supply chain network design–how decision analysis combining MILP and AHP on a Pareto front can improve decision-making. Int. J. Production Res.59, 1557–1572. doi: 10.1080/00207543.2020.1847341
34
Ren A. Yu L. Zhao X. Jia F. Han F. Hou H. (2024). A multi-objective optimization approach for green supply chain network design for the sea cucumber (Apostichopus japonicus) industry. Sci. Total Environ.927, 172050. doi: 10.1016/j.scitotenv.2024.172050
35
Rezaee Z. (2018). Supply chain management and business sustainability synergy: A theoretical and integrated perspective. Sustainability10, 275. doi: 10.3390/su10010275
36
Sako M. (2022). Global supply chain disruption and resilience. Commun. ACM65, 18–21. doi: 10.1145/3517216
37
Shin M. Lee H. Ryu K. Cho Y. Son Y. J. (2019). A two-phased perishable inventory model for production planning in a food industry. Comput. Ind. Eng.133, 175–185. doi: 10.1016/j.cie.2019.05.010
38
Smith K. E. Burrows K. Hobday M. Sen Gupta A. Moore A. Thomsen P. et al . (2021). Socioeconomic impacts of marine heatwaves: Global issues and opportunities. Sci. total Environ.374, eabj3593. doi: 10.1126/science.abj3593
39
Stoll J. H. De Sousa H. Callaway E. Collier D. Harrell M. et al . (2021). Alternative seafood networks during COVID-19: implications for resilience and sustainability. Front. Sustain. Food Syst.5. doi: 10.3389/fsufs.2021.614368
40
Subramaniam R. C. Ruwet M. Boschetti F. Fielke S. Fleming A. Dominguez-Martinez R. M. (2023). The socio−ecological resilience and sustainability implications of seafood supply chain disruption. Rev. Fish Biol. Fisheries33, 1129–1154. doi: 10.1007/s11160-023-09788-1
41
Sun J. Sarfraz M. Khawaja K. F. Abdullah M. I. (2022). Sustainable supply chain strategy and sustainable competitive advantage: A mediated and moderated model. Front. Public Health10. doi: 10.3389/fpubh.2022.895482
42
Suvorova S. Kulikova O. Kirillova T. Fedotova G. Melikova E. (2022). “ Formation a sustainable supply chain strategy,” in International school on neural networks, initiated by IIASS and EMFCSC ( Springer), 1131–1141.
43
Taherdoost H. Madanchian M. (2023). Multi-criteria decision making (MCDM) methods and concepts. Encyclopedia Sustain. Technol.3, 77–87. doi: 10.3390/encyclopedia3010006
44
Tannous K. Yoon S. (2018). Summarizing risk, sustainability and collaboration in global supply chain management. Int. J. Supply Operations Manage.5, 192–196. doi: 10.22034/2018.2.7
45
Tseng M.-L. Tran T. P. T. Wu K. J. Tan R. R. Bui T. D. (2022). Exploring sustainable seafood supply chain management based on linguistic preferences: collaboration in the supply chain and lean management drive economic benefits. Int. J. Logistics Res. Appl.25, 410–432. doi: 10.1080/13675567.2020.1800608
46
Vijay T. A. Raju M. (2024). Supply chain vulnerability and resilience: a case of harvested shrimp from Kerala, India. Int. J. Rural Manage.20, 45–64. doi: 10.1177/09730052221140699
47
Ward D. Melbourne-Thomas J. Pecl G. T. Evans K. Green M. McCormack P. C. (2022). Safeguarding marine life: conservation of biodiversity and ecosystems. Rev. fish Biol. fisheries32, 65–100. doi: 10.1007/s11160-022-09700-3
48
Wei X. Zhang M. Chen K. Huang M. Mujumdar A. S. Yang C. (2024). Intelligent detection and control of quality deterioration of fresh aquatic products in the supply chain: A review. Comput. Electron. Agric.218, 108720. doi: 10.1016/j.compag.2024.108720
49
Wu D. Ma Y. Cai S. (2026). The impact of new quality productivity on fishery industrial chain resilience: evidence from a dual machine learning model. Fishes11, 25. doi: 10.3390/fishes11010025
50
Yin T. Shi L. (2023). Processing and preservation of aquatic products. Foods12, 2061. doi: 10.3390/foods12102061
51
Yu L. Liu D. Xu N. (2022). Special aquatic products supply chain coordination considering bilateral green input in the context of high-quality development. Int. J. Foundations Comput. Sci.33, 819–844. doi: 10.1142/S0129054122420175
Summary
Keywords
best-worst method, fuzzy comprehensive evaluation, global supply chain for aquatic products, MCDM (multi criteria decision making), resilience and sustainability synergy
Citation
Sun Z, Song Y, Zhao Y and Zhang F (2026) Using hybrid MCDM techniques to evaluate the resilience and sustainability of aquatic products global supply chain. Front. Mar. Sci. 13:1750254. doi: 10.3389/fmars.2026.1750254
Received
20 November 2025
Revised
21 January 2026
Accepted
22 January 2026
Published
16 February 2026
Volume
13 - 2026
Edited by
Peng Jiang, Shandong University, China
Reviewed by
Hang Jiang, Jimei University, China
Guangxue Wan, Shandong University, China
Updates
Copyright
© 2026 Sun, Song, Zhao and Zhang.
This is an open-access article distributed under the terms of the Creative Commons Attribution License (CC BY). The use, distribution or reproduction in other forums is permitted, provided the original author(s) and the copyright owner(s) are credited and that the original publication in this journal is cited, in accordance with accepted academic practice. No use, distribution or reproduction is permitted which does not comply with these terms.
*Correspondence: Yadan Zhao, vickyzhao123456@163.com
Disclaimer
All claims expressed in this article are solely those of the authors and do not necessarily represent those of their affiliated organizations, or those of the publisher, the editors and the reviewers. Any product that may be evaluated in this article or claim that may be made by its manufacturer is not guaranteed or endorsed by the publisher.