Abstract
High-resolution multibeam bathymetric enables detailed morphological investigation of the area of Manila Trench on the northeastern South China Sea margin, where twenty-three cyclic steps are observed. The identified cyclic steps can be further divided into two groups (Types A and B), namely, thirteen net-erosional and ten net-depositional cyclic steps, based on their sizes and relative locations. Type A cyclic steps occur downstream of the South Taiwan Shoal Canyon and Penghu Canyon, whereas Type B cyclic steps distribute outside the South Taiwan Shoal Canyon levees adjacent to the canyon bend. Principal component analysis (PCA) distinctly identifies the two cyclic step clusters (Types A and B), with cyclic steps length (Lstep) and height (Hstep) are key explanatory variables. The significant differences in flow properties between confined and unconfined turbidity currents crossing cyclic steps are considered to control the formation of Types A and B cyclic steps. Furthermore, net- erosional (Type A) cyclic steps will likely evolve into new submarine canyon-channel systems under continued turbidity currents erosion, altering material transport and deposition patterns to the deep sea in the Manila Trench. Our results improve understanding of the origin and formation of cyclic steps in global submarine canyons.
1 Introduction
Deep-water sedimentary processes, which encompass those regulated by gravity-driven downslope currents and alongslope currents, exert a pivotal control on the geomorphical evolution and morphological shaping of continental margins (Mosher et al., 2017). Turbidity currents, a type of gravity-driven downslope flow, are capable of transporting substantial volumes of sediment and plastic litter from continental shelf margins to the deep sea (Talling et al., 2013; Xu et al., 2014; Yang et al., 2024). A single turbidity current can transport over 100 km³ of sediment, which more than ten times the annual sediment load of all the world’s rivers combined (Talling et al., 2007) and such currents are capable of modifying the morphology of continental margins, thereby facilitating the formation of submarine canyons, channels, sediment waves and scours (Cartigny et al., 2014; Covault et al., 2014). Turbidity currents, together with their associated seafloor morphological features, are regarded as fundamental factors in the formation of submarine channels (Covault et al., 2014, 2016).
Cyclic steps are long-wavelength, upstream-migrating, step-like upper-flow-regime bedforms in turbidity currents that are bounded by internal hydraulic jumps, and they exhibit Froude-supercritical flow conditions (densimetric Froude number > 1) over their lee sides and Froude-subcritical flow conditions (densimetric Froude number< 1) over their stoss sides (Zhong et al., 2015; Covault et al., 2016; Li and Gong, 2018; Li et al., 2020; Slootman and Cartigny, 2020). Cyclic steps are generally classified as net-erosional or net-depositional, with the distinction determined by whether erosion or deposition acts as the dominant process across the entire bedform (Fildani et al., 2006; Covault et al., 2014; Zhong et al., 2015; Li and Gong, 2018; Cerrillo-Escoriza et al., 2024). Net-depositional cyclic steps manifest as upstream-migrating sediment waves (Fildani et al., 2006; Kostic and Parker, 2006; Zhong et al., 2015), while net-erosional cyclic steps develop as trains of upstream-migrating scours, scarps, or headcuts (Kostic, 2011; Zhong et al., 2015). Based on their geometric characteristics, cyclic steps can be further categorized as downstream-asymmetric (steep lee side and gentle stoss side), symmetric (equal slopes of the lee and stoss sides), or upstream-asymmetric (gentle lee side and steep stoss side) (Covault et al., 2014; Slootman and Cartigny, 2020).
Cyclic steps are ubiquitous in natural settings, ranging from high mountain rivers to deep-water basins (Kostic et al., 2010). They have been documented along the thalwegs and overbank areas of numerous submarine canyons and channels, such as the Monterey East Channel System in California (Fildani et al., 2006), the submarine distributary channel in the Rio Muni Basin (Li and Gong, 2018), Carchuna Canyon in the Alboran Sea (Cerrillo-Escoriza et al., 2024), the Foix Canyon System in the northwestern Mediterranean Sea (Tubau et al., 2013), Pearl River Mouth Canyon Group (Sun et al., 2024) and the West Penghu Submarine Canyons in the South China Sea (Kuang et al., 2014; Zhong et al., 2015; Li et al., 2020).
Some cyclic steps distributed in the South Taiwan Shoal Canyon and the West Penghu Canyon in the South China Sea have been reported and investigated (Kuang et al., 2014; Zhong et al., 2015). However, the detailed morphological characteristics of the cyclic steps downstream of these canyons remain enigmatic, and the flow properties of the turbidity currents that generate the cyclic steps downstream of the canyon mouths are still poorly understood.
In this study, two types of cyclic steps were identified downstream of the South Taiwan Shoal Canyon and the adjacent Penghu Canyon near the Manila Trench. These were designated as Types A and B cyclic steps, and their characteristics were quantified using high-resolution multibeam bathymetry to address three key objectives: (1) investigating the morphological and geometric parameters of cyclic steps in the vicinity of the Manila Trench; (2) determining the flow properties of turbidity currents traversing these cyclic steps; and (3) identifying the formation processes of different cyclic step types and the factors controlling their morphology.
2 Geological background
The Manila Trench is situated in the northeastern South China Sea and tectonically belongs to a subduction system, where the Sunda Plate (part of the Eurasian Plate) is subducted beneath the Luzon Volcanic Island Arc (Lallemand, 2016; Qiu et al., 2019; Fan et al., 2025; Tian et al., 2026). The Manila Trench lies downstream of the confluence of a submarine canyon system, including the Gaoping, Penghu, and South Taiwan Shoal Canyons (Figure 1). As the northern extension of the Manila Trench, the Penghu Canyon is interpreted as a geomorphological expression of the transition zone between the northwestward-thrusting Taiwan orogenic wedge and the southeastward-subducting South China Sea Plate margin (Yu and Hong, 2006). The South Taiwan Shoal Canyon extends in a northwest–southeast (NW-SE) direction in its upper-middle reaches, but bends eastward in its lower segment, where is blocked by a seamount (Ding et al., 2010; Kuang et al., 2014). Within the South Taiwan Shoal Canyon, approximately 51 cyclic steps have been identified, while around 19 cyclic steps are distributed in the West Penghu Canyon (Zhong et al., 2015). Additionally, roughly 25,000 km² of sediment waves have been documented on the western wall of the north-south (N-S) trending Manila Trench, which is located in the northeastern South China Sea basin (Damuth, 1979).
Figure 1
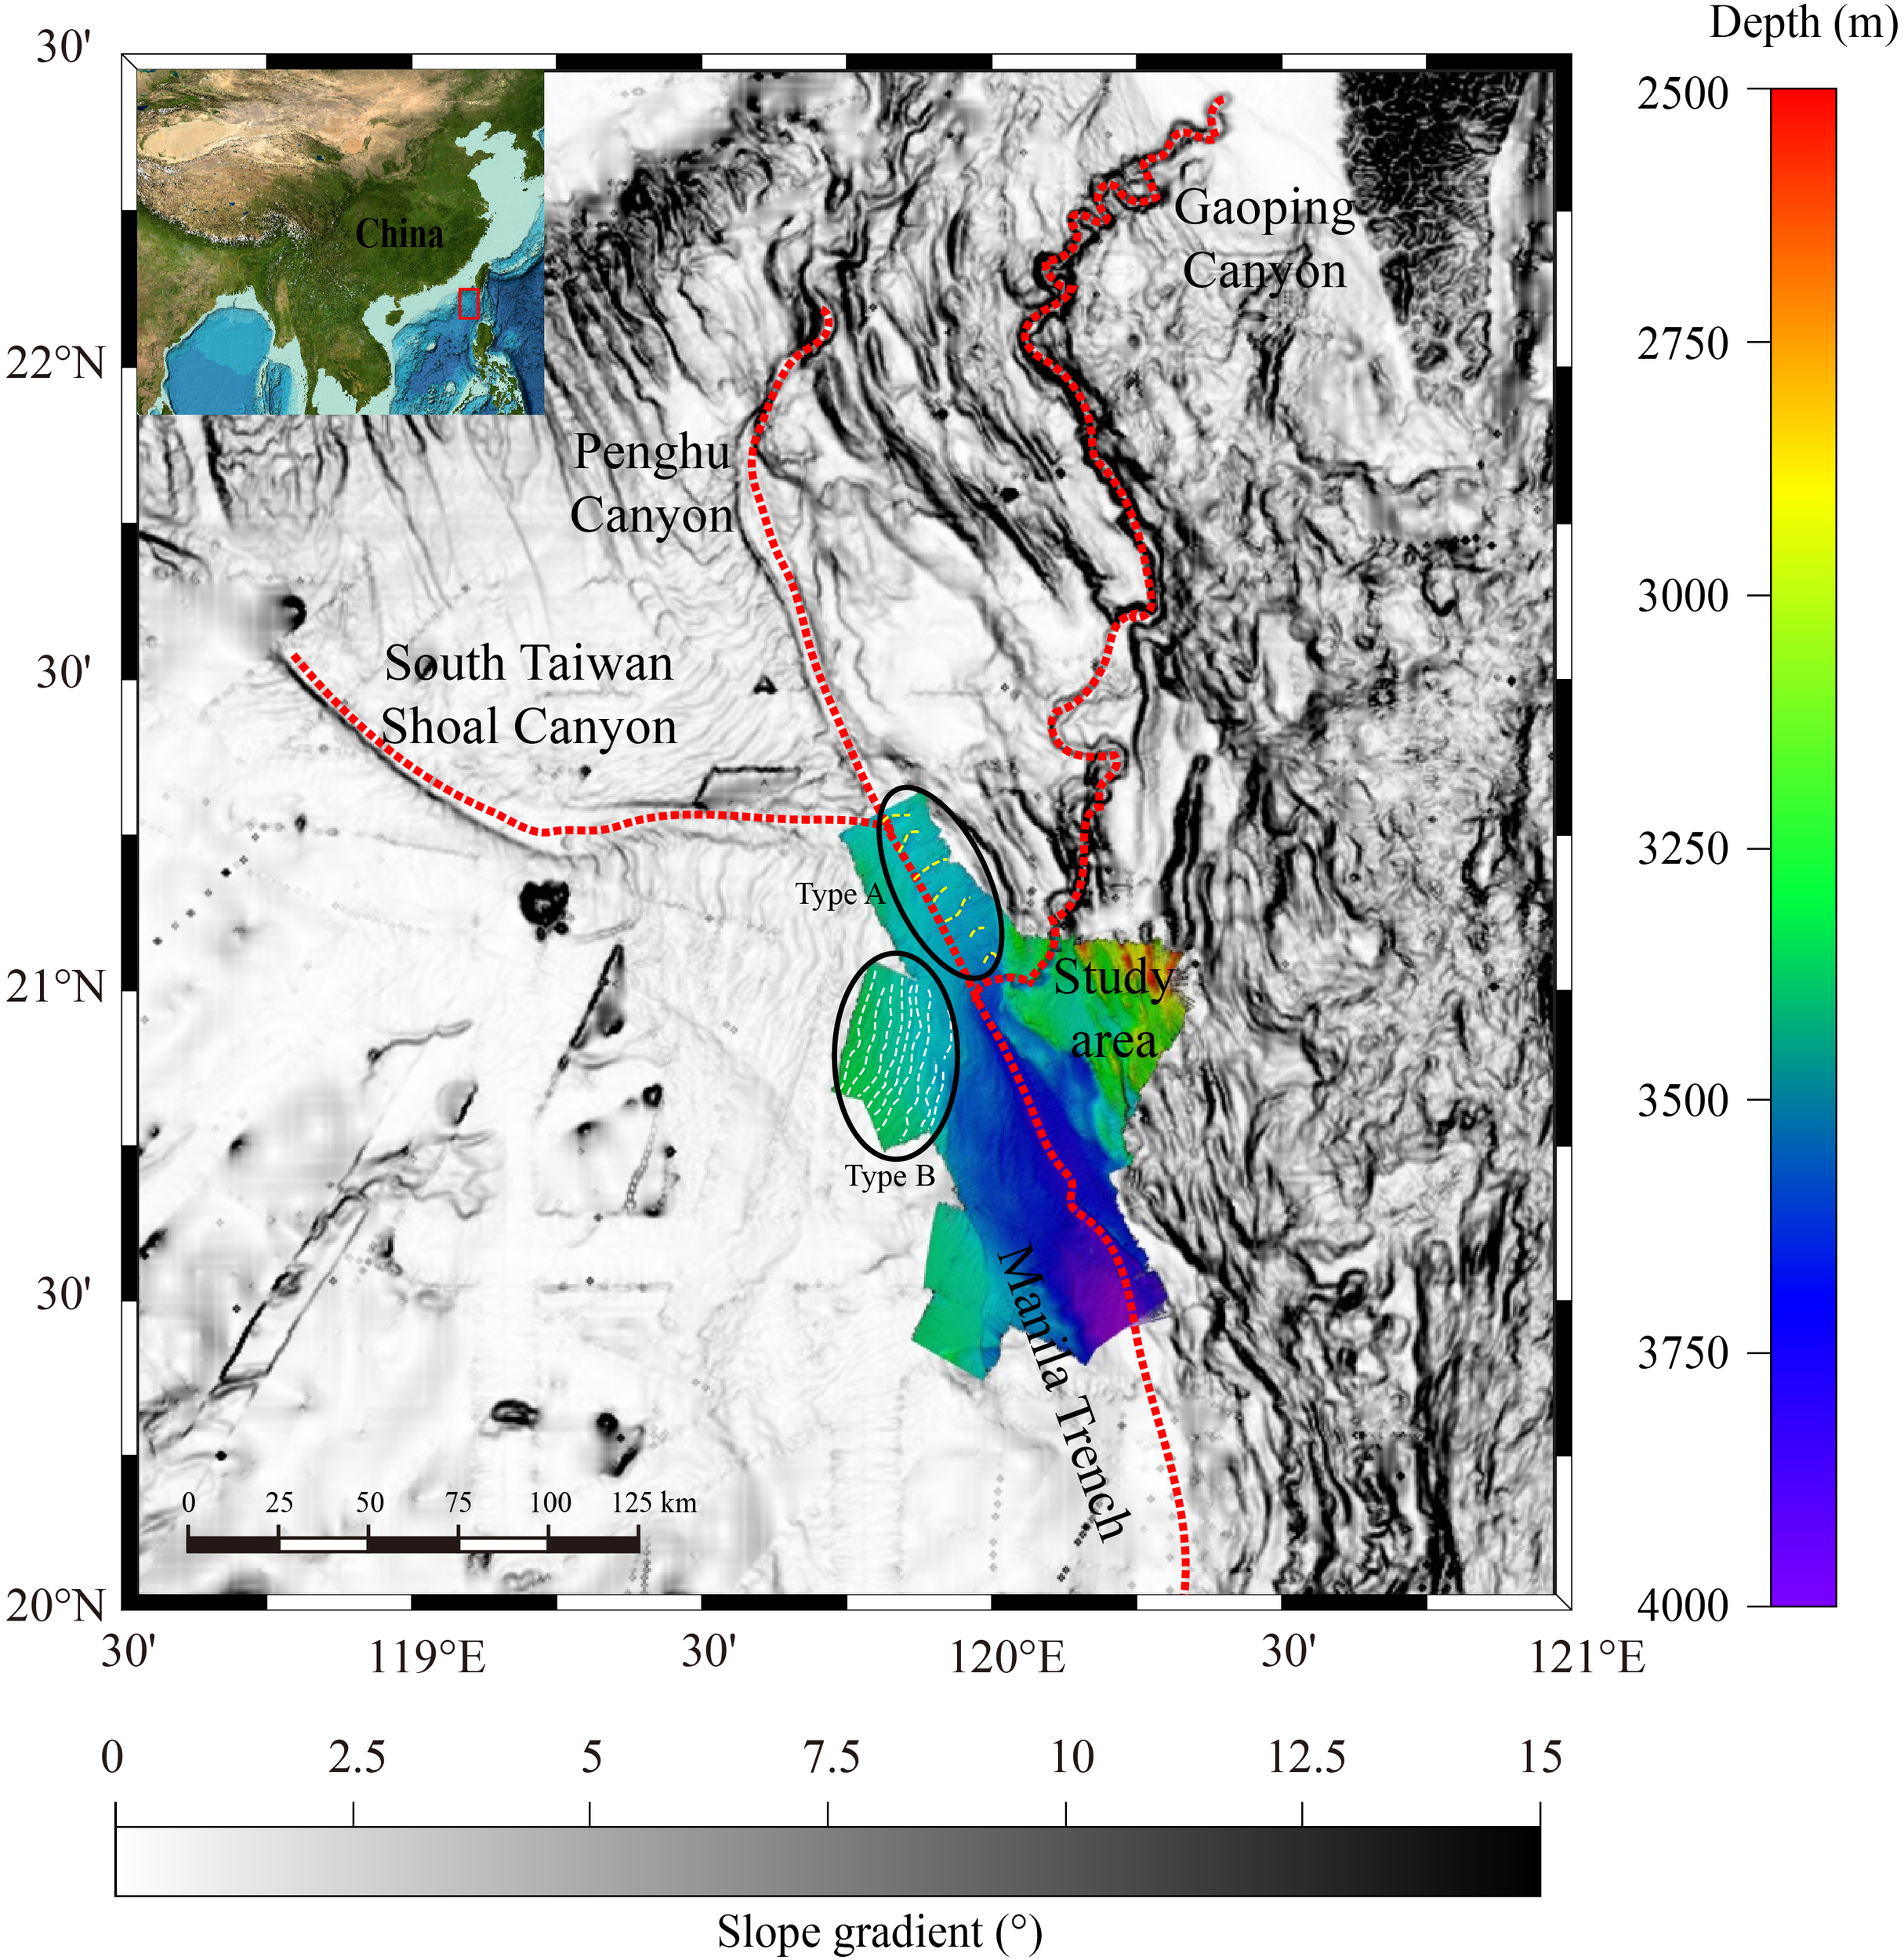
High-resolution multibeam bathymetric map of the study area. The bottom map is slope gradient of the study area within the northeast South China Sea (https://download.gebco.net/) and the red dotted lines represent the canyons and trench axis. The two black oval areas represent the location of the Types A and B cyclic steps (Figure 3).
The study area is situated at the confluence of the South Taiwan Shoal Canyon and the Penghu Canyon, near the Manila Trench, where water depths range from 2500 m to 4000 m.
3 Data and methods
3.1 Data collection
The high-resolution multibeam data used in this study, covering a total area of approximately 3950 km², was collected in 2022 by the research vessel “Dongfanghong 3” in the South China Sea. This multibeam bathymetric data was acquired via an EM 122 multibeam echo sounder, which operates at a frequency of 12 kHz with a beamwidth of 0.5°×1°. The maximum swath width of the system is six times the water depth (up to ~30 km), and the vertical sounding accuracy is 3‰ of the water depth. The multibeam bathymetric data were imported into and analyzed using Global Mapper® software.
3.2 Statistical analysis
Principal component analysis (PCA) is one of the statistical analysis methods used to identify the variables that best explain the variance in a dataset (Jolliffe, 2014). In this study, we applied the PCA method to determine the key controlling parameters for the dimensional characteristics of the two cyclic step types (Types A and B). Additionally, we analyzed the correlations between the variables and the principal components, with the aim of clarifying which variables should be prioritized for subsequent in-depth analysis.
3.3 Estimating turbidity currents conditions from hydraulic geometries
Multibeam bathymetry was used to investigate the morphological and architectural characteristics of the studied cyclic steps. As graphically illustrated in Figure 2, individual cyclic steps consist of three discrete, geometrically defined zones: steep headcuts (corresponding to their lee sides), flat or gently sloping stoss sides, and a topographic depression (or trough) between these two zones (Cartigny et al., 2011; Zhong et al., 2015; Li and Gong, 2018). Individual cyclic steps have been quantitatively documented in terms of (1) length, height, and slope of the cyclic step (Lstep, H, and θ, respectively); (2) length of stoss and lee sides (Lstoss and Llee, respectively); (3) slope of stoss and lee sides (а and β, respectively); (4) cross-sectional asymmetry (Ay, computed as Lstoss/Llee); and (5) aspect ratio (calculated as Lstep/H).
Figure 2
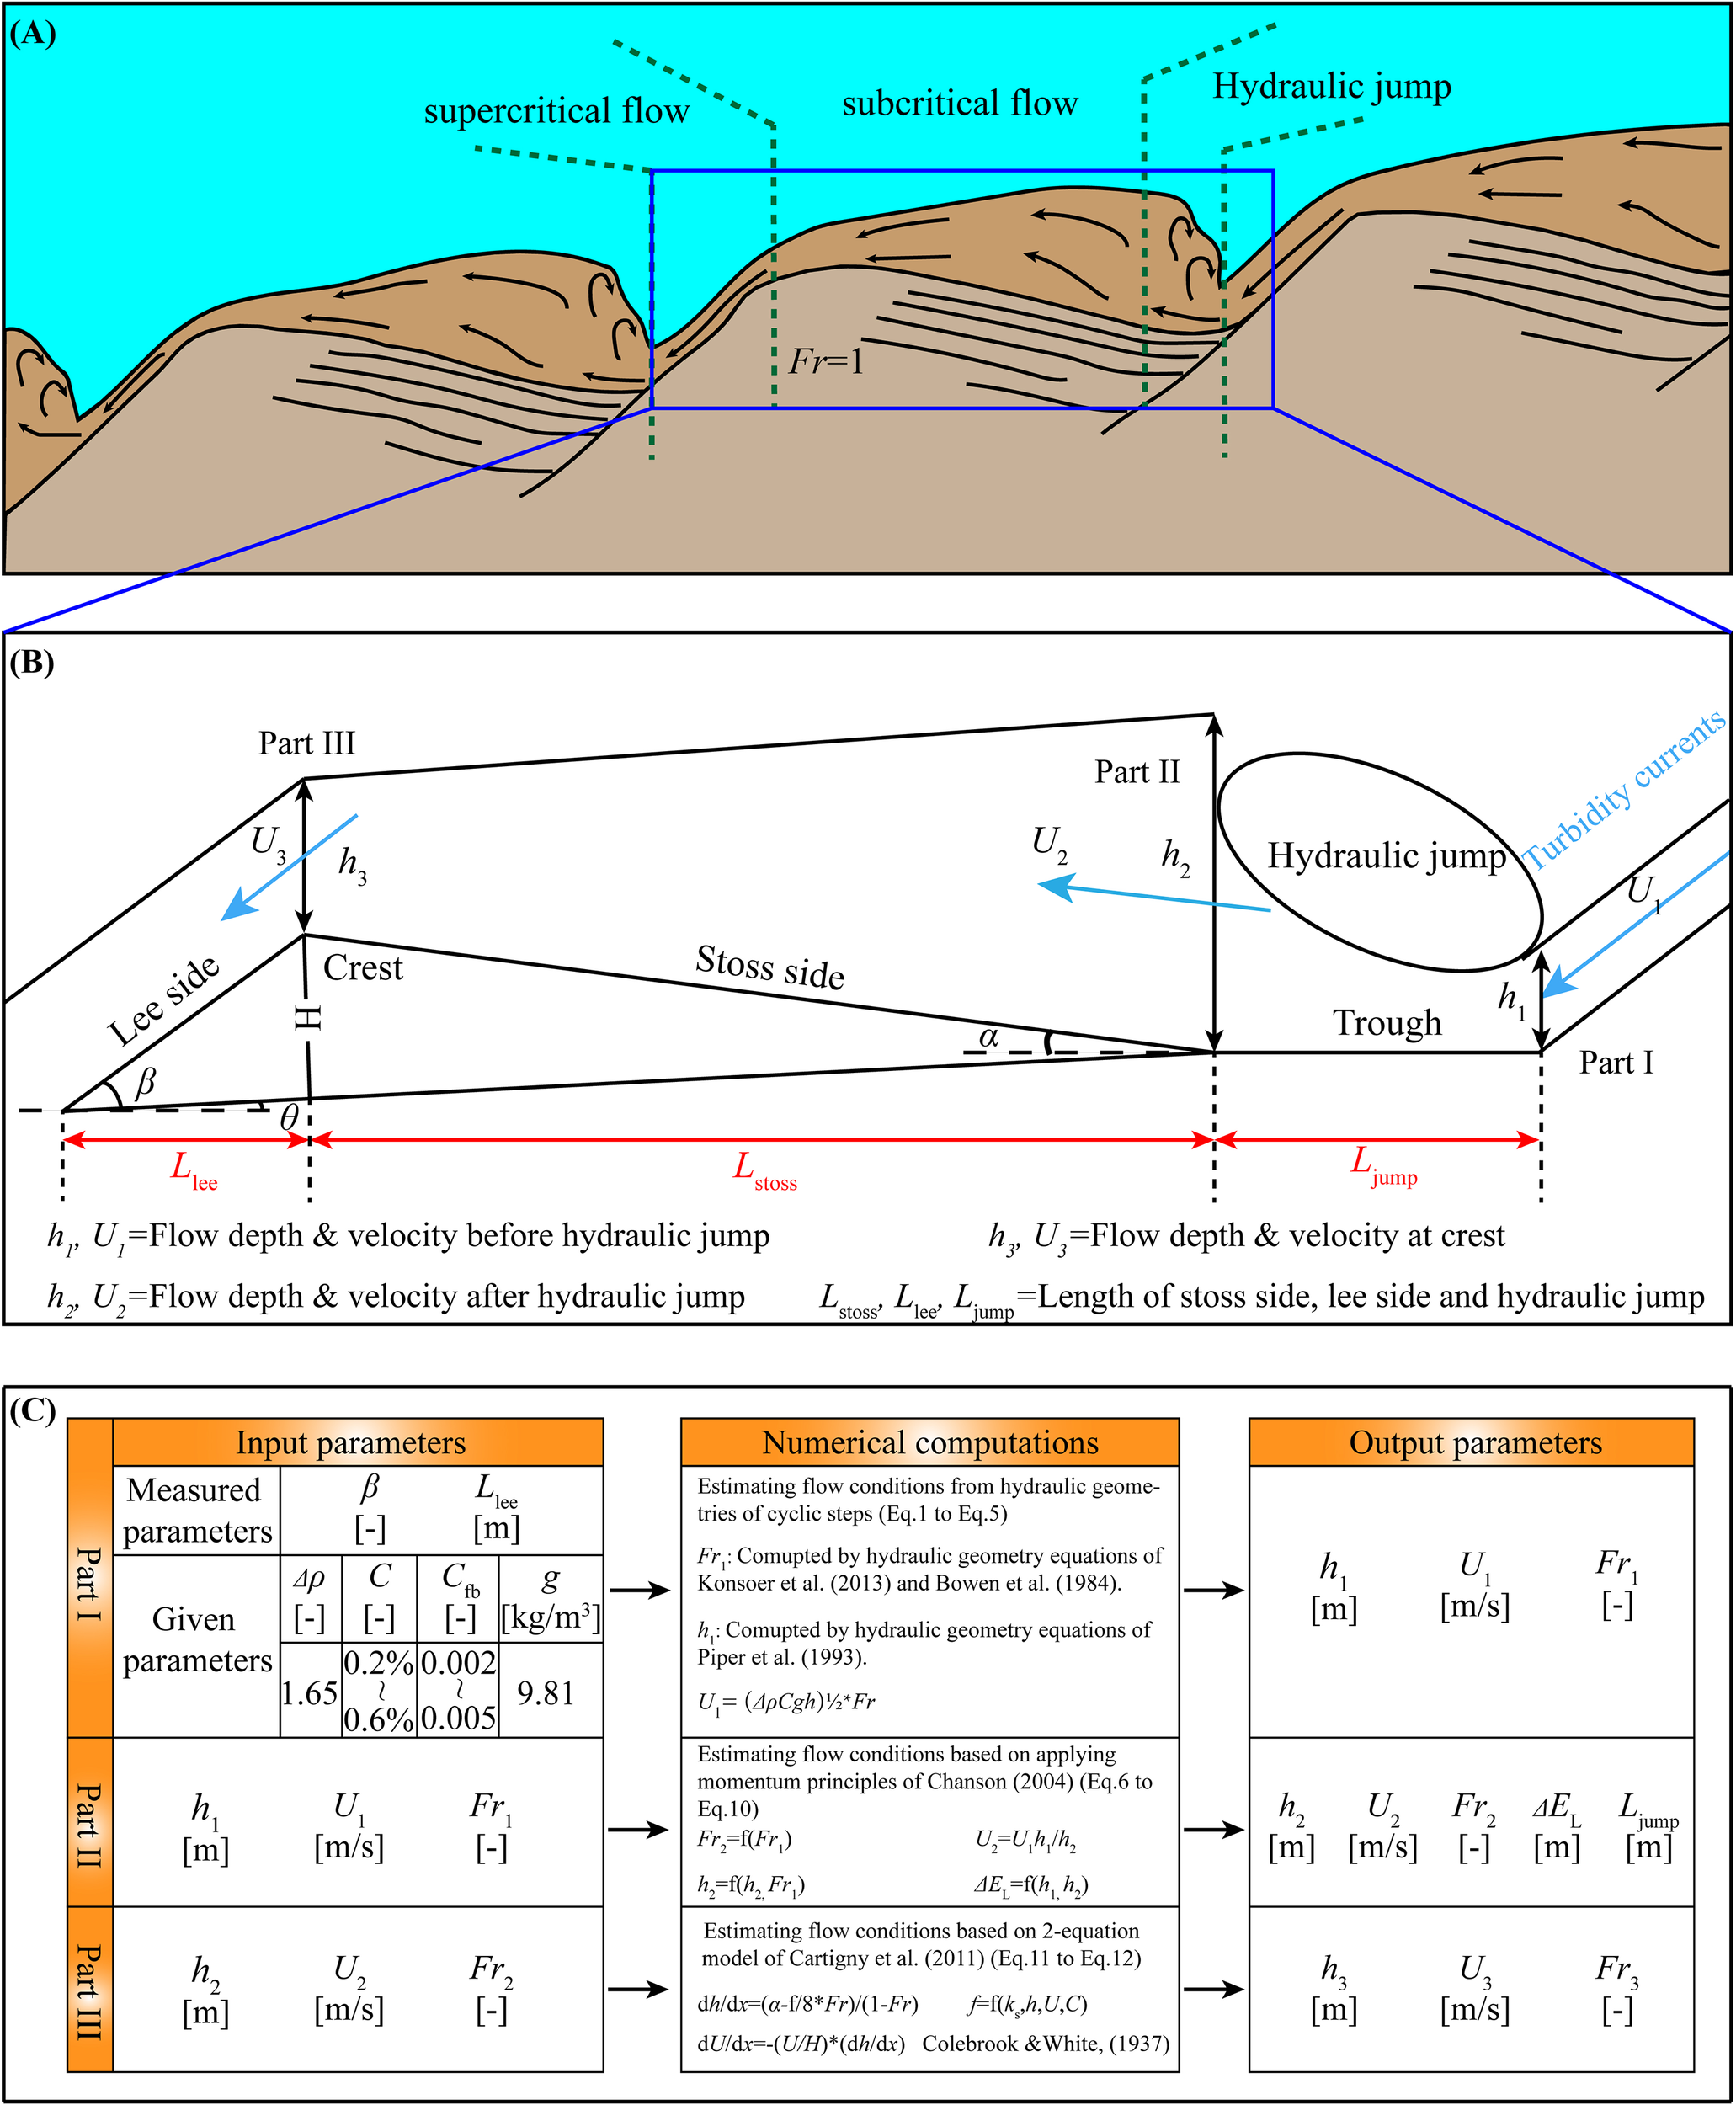
(A) Schematic illustration of cyclic step longitudinal profiles (modified from Cartigny et al., 2011) (B) Schematic illustration of a single cyclic step showing morphologic parameters (modified from Cartigny et al., 2011; Li and Gong, 2018; Li et al., 2020). (C) Flow chart showing the calculations of cyclic step forming turbidity currents conditions (modified from Li and Gong, 2018).
Flow properties of turbidity currents moving along the seabed near the Manila Trench were calculated based on the morphological parameters of the cyclic steps. These parameters include the channel bed slope (S), as well as the length and slope gradient of the lee and stoss sides of the cyclic steps. In Part I of the analysis, morphological parameters of the cyclic steps were used to compute the turbidity current conditions upstream of hydraulic jumps, following Equations 1–5.
where is the dimensionless coefficient of the entrainment of ambient water into turbidity currents; is the coefficient of friction at channel bed (ranging from 0.002 to 0.005, as suggested by (Konsoer et al., 2013)); S denotes the slope of the channel bed; Fr is the densimetric Froude number; is the slope gradient of the stoss side or lee side of cyclic steps (); L is the length of stoss (Lstoss) and lee sides (Llee); h is the thickness of turbidity currents; C is the volume sediment concentration (ranging from 0.2% to 0.6%, as suggested by Konsoer et al., 2013); is the density difference between the sediment and the ambient water, usually taken as 1650 kg/m3 (Piper and Savoye, 1993); g is gravitational acceleration (9.8 m/s2).
In part II, the Froude number, flow depth, and velocity of formative turbidity currents downstream of hydraulic jumps (Fr2, h2, and U2) were computed, respectively, by the momentum principles of Chanson (2004) (Equations 6–8).
where h1, U1 and Fr1 are the flow depth, the velocity and Froude number of turbidity currents before hydraulic jumps, respectively.
The energy loss () and the length of the hydraulic jump () can be calculated by the approach of Chanson (2004) (Equations 9, 10).
In Part III of the analysis, a two-equation model-derived from mass and momentum balance considerations was used to calculate the flow depth and velocity at the crests of the cyclic steps. This model incorporates gravitational forces, frictional forces, and pressure forces induced by variations in flow thickness (Cartigny et al., 2011) (Equations 11, 12).
where is the slope gradient of the stoss side and f is the friction coefficient. The friction coefficient seems to be far less important by sensitivity analysis. The accuracy of the model depends mainly on and is almost proportional to the accuracy of the slope measurements used (Cartigny et al., 2011).
4 Results
4.1 Two types of cyclic steps
A total of twenty-three (23) long-wavelength, upstream-migrating, crescentic bedforms have been identified near the Manila Trench. Based on their locations and dimensions, these bedforms-recognized as cyclic steps-can be categorized into two types: (1) Lines 1 and 2, with lengths of 27 km and 36 km respectively, exhibit profiles of Type A cyclic steps. These Type A cyclic steps are developed at the downstream confluence between the South Taiwan Shoal Canyon and the West Penghu Canyon (Figures 3A, C, D); (2) Line 3, which is 22.4 km long, shows profiles of cyclic steps developed in the overbank areas of the South Taiwan Channel, these are herein designated as Type B cyclic steps (Figures 3B, E). In this section, the morphological and geometric parameters of the two cyclic step types are compared and discussed.
Figure 3
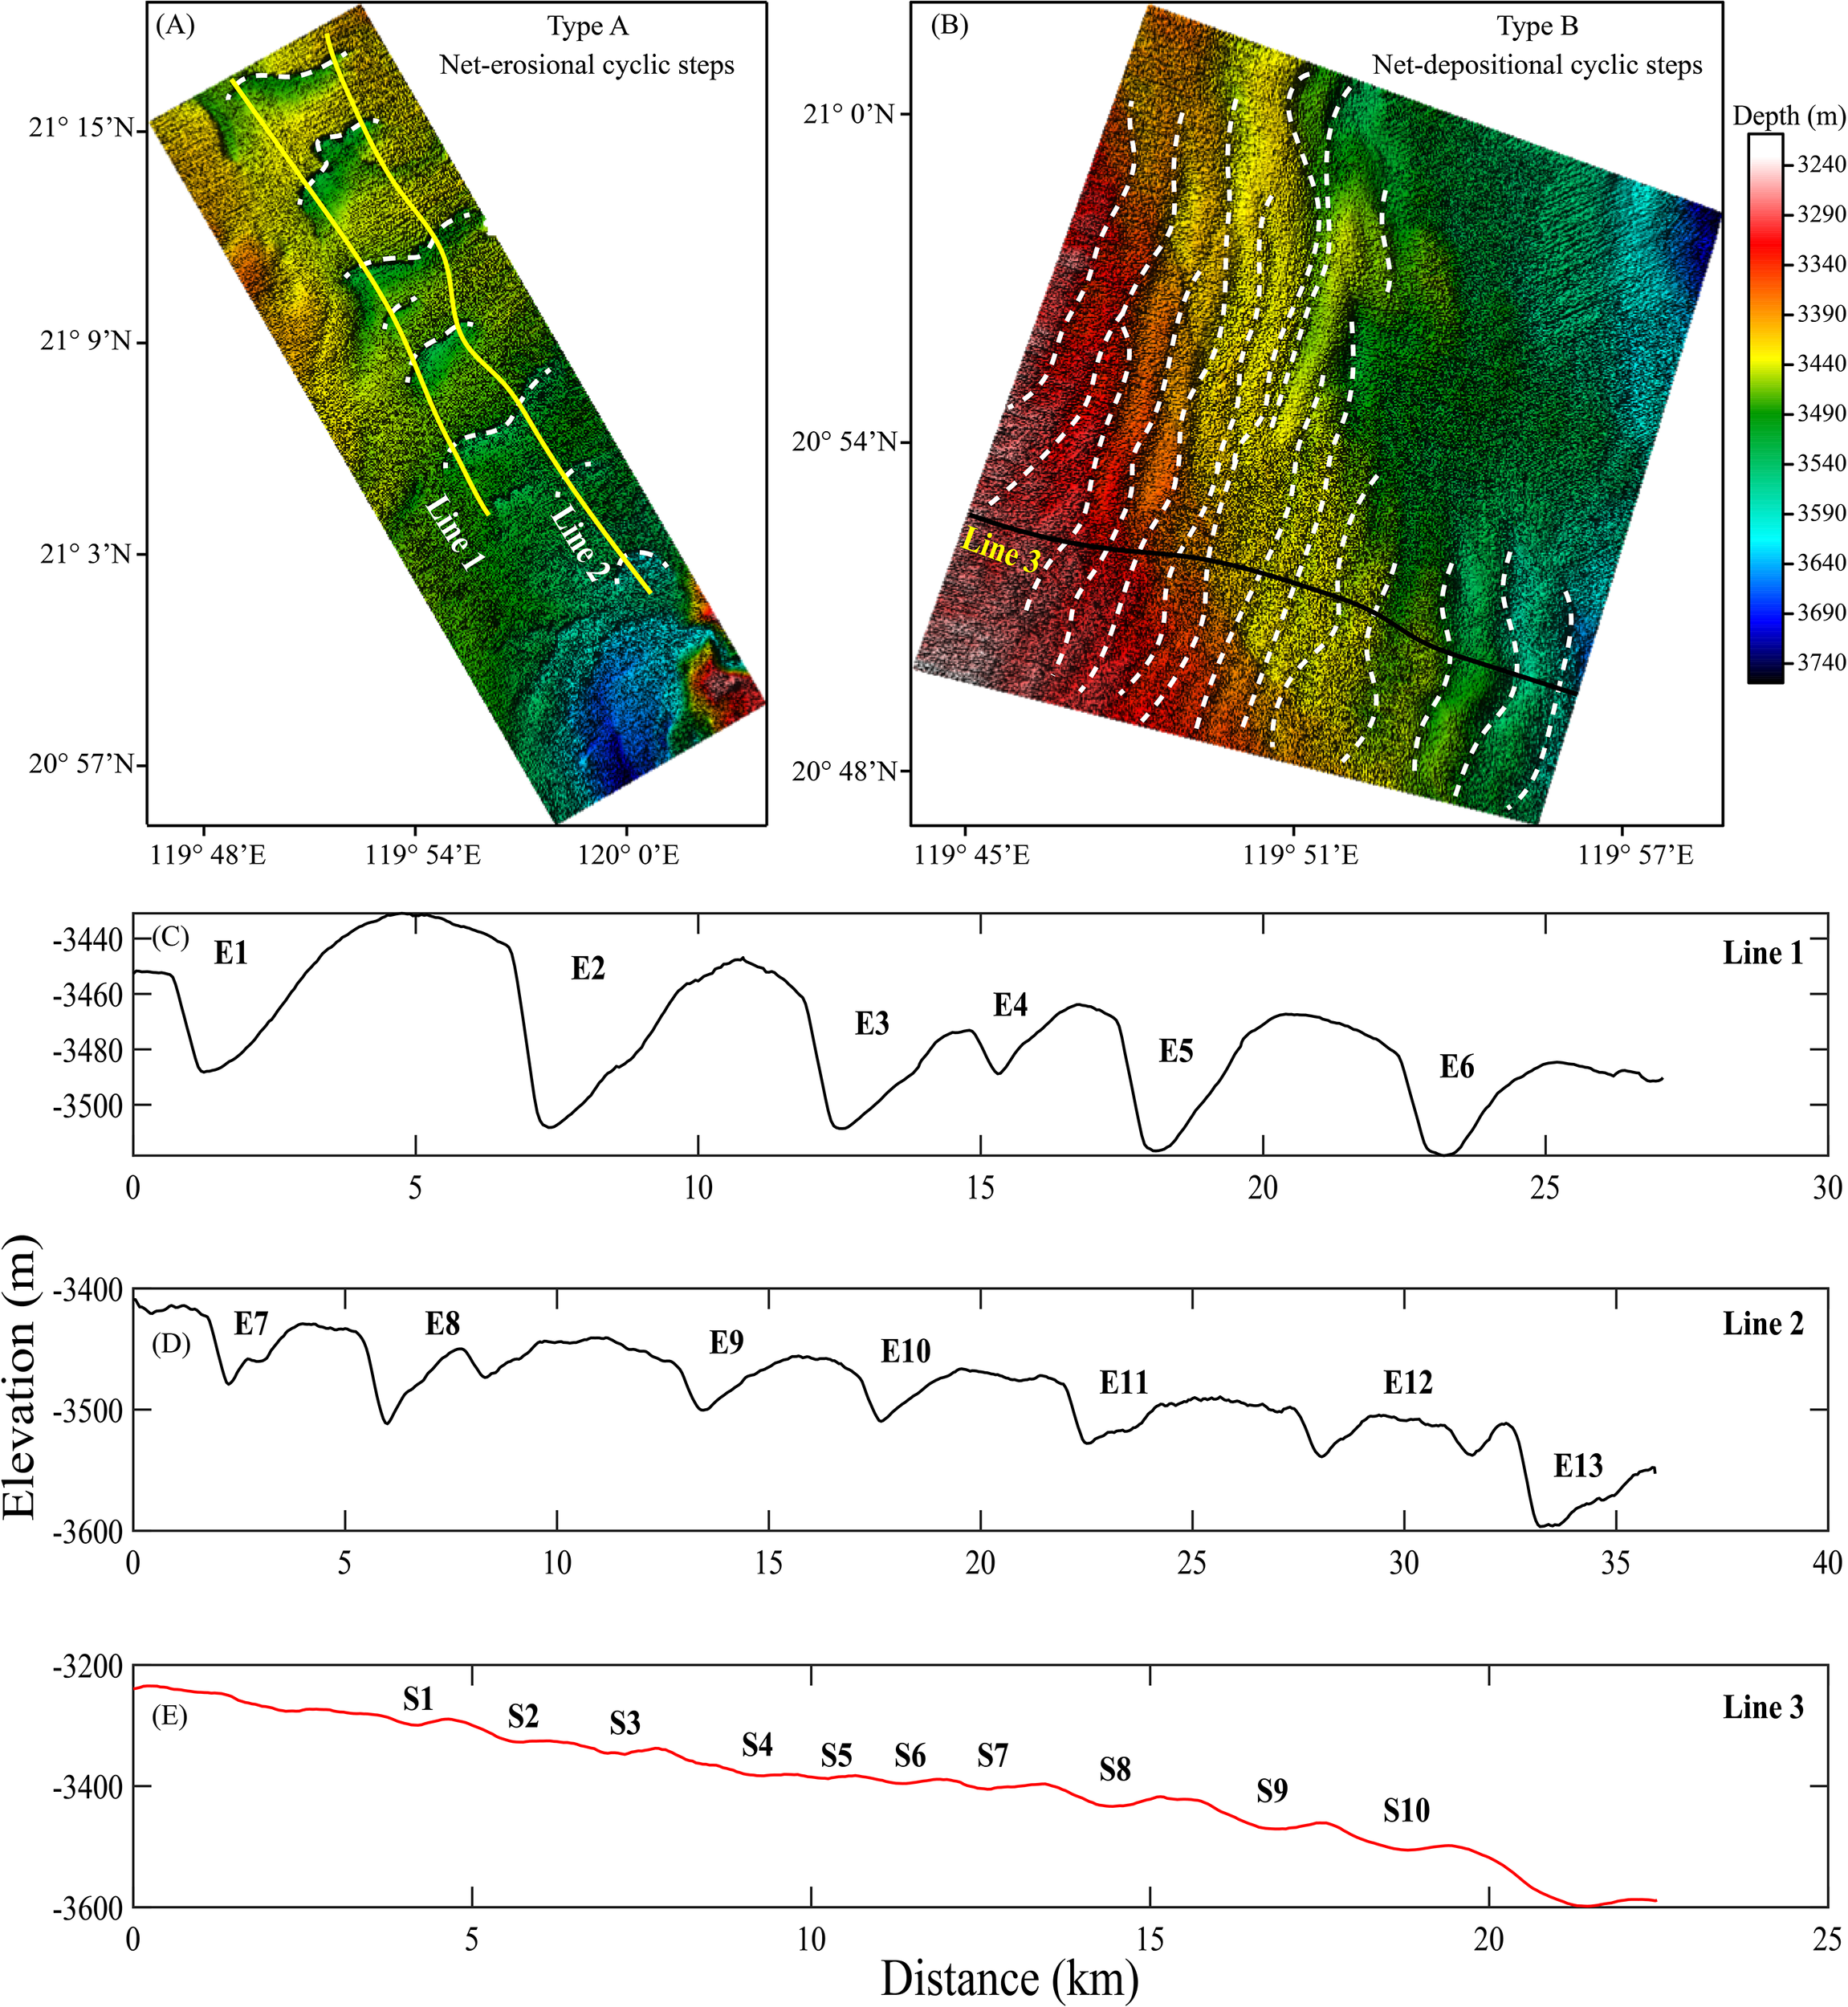
(A, B) Multibeam bathymetric map illustrating the morphology and distribution of cyclic steps. Two yellow lines (Line 1 and Line 2) are the depth profiles of Type A cyclic steps (E1-E6 and E7-E13) in (C, D), which almost parallel in distribution. Black line (Line 3) is the profile of Type B cyclic steps (S1-S10).
4.1.1 Morphological and architectural characteristics of type A cyclic steps
Type A cyclic steps occur at the downstream confluence of the South Taiwan Shoal Canyon and the West Penghu Canyon, in water depths ranging from 3430 m to 3596 m. The average slope gradient in this area is 0.27°. These cyclic steps have a wavelength of 2.7-6.1 km and a height of 20.1-68.1 m (Table 1). For the dimensional parameters of their sides: the length of the stoss side (Lstoss) ranges from 1350 m to 4800 m, with a mean of 2495 m; the length of the lee side (Llee) ranges from 700 m to 3850 m, with an average of 2139 m (Table 1). In terms of slope gradients: the stoss side slope (α) varies from 0.72° to 1.44°, with a mean value of 1.10°. By contrast, the lee side slope (β) ranges from 1.06° to 2.88°, with an average of 1.65° (Table 1, Figure 4). Additionally, Type A cyclic steps have an asymmetry index (Ay) ranging from 0.35 to 2.93 (mean = 1.34) and an aspect ratio ranging from 57.34 to 136.88 (mean = 94.73) (Table 1, Figure 4).
Table 1
| Type A | α | β | θ | L stoss | L lee | L step | H step | A y | Aspect ratio |
|---|---|---|---|---|---|---|---|---|---|
| No. | (°) | (°) | (°) | (m) | (m) | (m) | (m) | (-) | (-) |
| E1 | 0.87 | 1.81 | 0.19 | 3700 | 2400 | 6100 | 68.13 | 1.54 | 89.53 |
| E2 | 1.03 | 2.02 | 0.01 | 3390 | 1760 | 5150 | 61.66 | 1.93 | 83.52 |
| E3 | 0.98 | 1.23 | 0.42 | 2050 | 700 | 2750 | 20.09 | 2.93 | 136.88 |
| E4 | 1.02 | 2.17 | 0.57 | 1400 | 1400 | 2800 | 39.00 | 1.00 | 71.79 |
| E5 | 1.21 | 1.06 | 0.01 | 2350 | 2750 | 5100 | 50.46 | 0.85 | 101.07 |
| E6 | 0.99 | 1.42 | 0.09 | 1800 | 1450 | 3250 | 33.77 | 1.24 | 96.24 |
| E7 | 1.64 | 2.38 | 0.5 | 1750 | 2000 | 3750 | 65.40 | 0.88 | 57.34 |
| E8 | 0.82 | 1.23 | 0.09 | 4800 | 2650 | 7450 | 61.27 | 1.81 | 121.59 |
| E9 | 1.15 | 1.55 | 0.14 | 2200 | 2000 | 4200 | 49.24 | 1.10 | 85.30 |
| E10 | 1.33 | 1.18 | 0.21 | 1900 | 3000 | 4900 | 50.98 | 0.63 | 96.12 |
| E11 | 0.72 | 1.19 | 0.11 | 3100 | 2400 | 5500 | 45.20 | 1.29 | 121.68 |
| E12 | 1.44 | 1.35 | 0.63 | 1350 | 3850 | 5200 | 48.80 | 0.35 | 106.56 |
| E13 | 1.04 | 2.88 | 0.35 | 2650 | 1450 | 4100 | 64.16 | 1.83 | 63.90 |
Morphological characteristics of thirteen Type A cyclic steps.
Figure 4
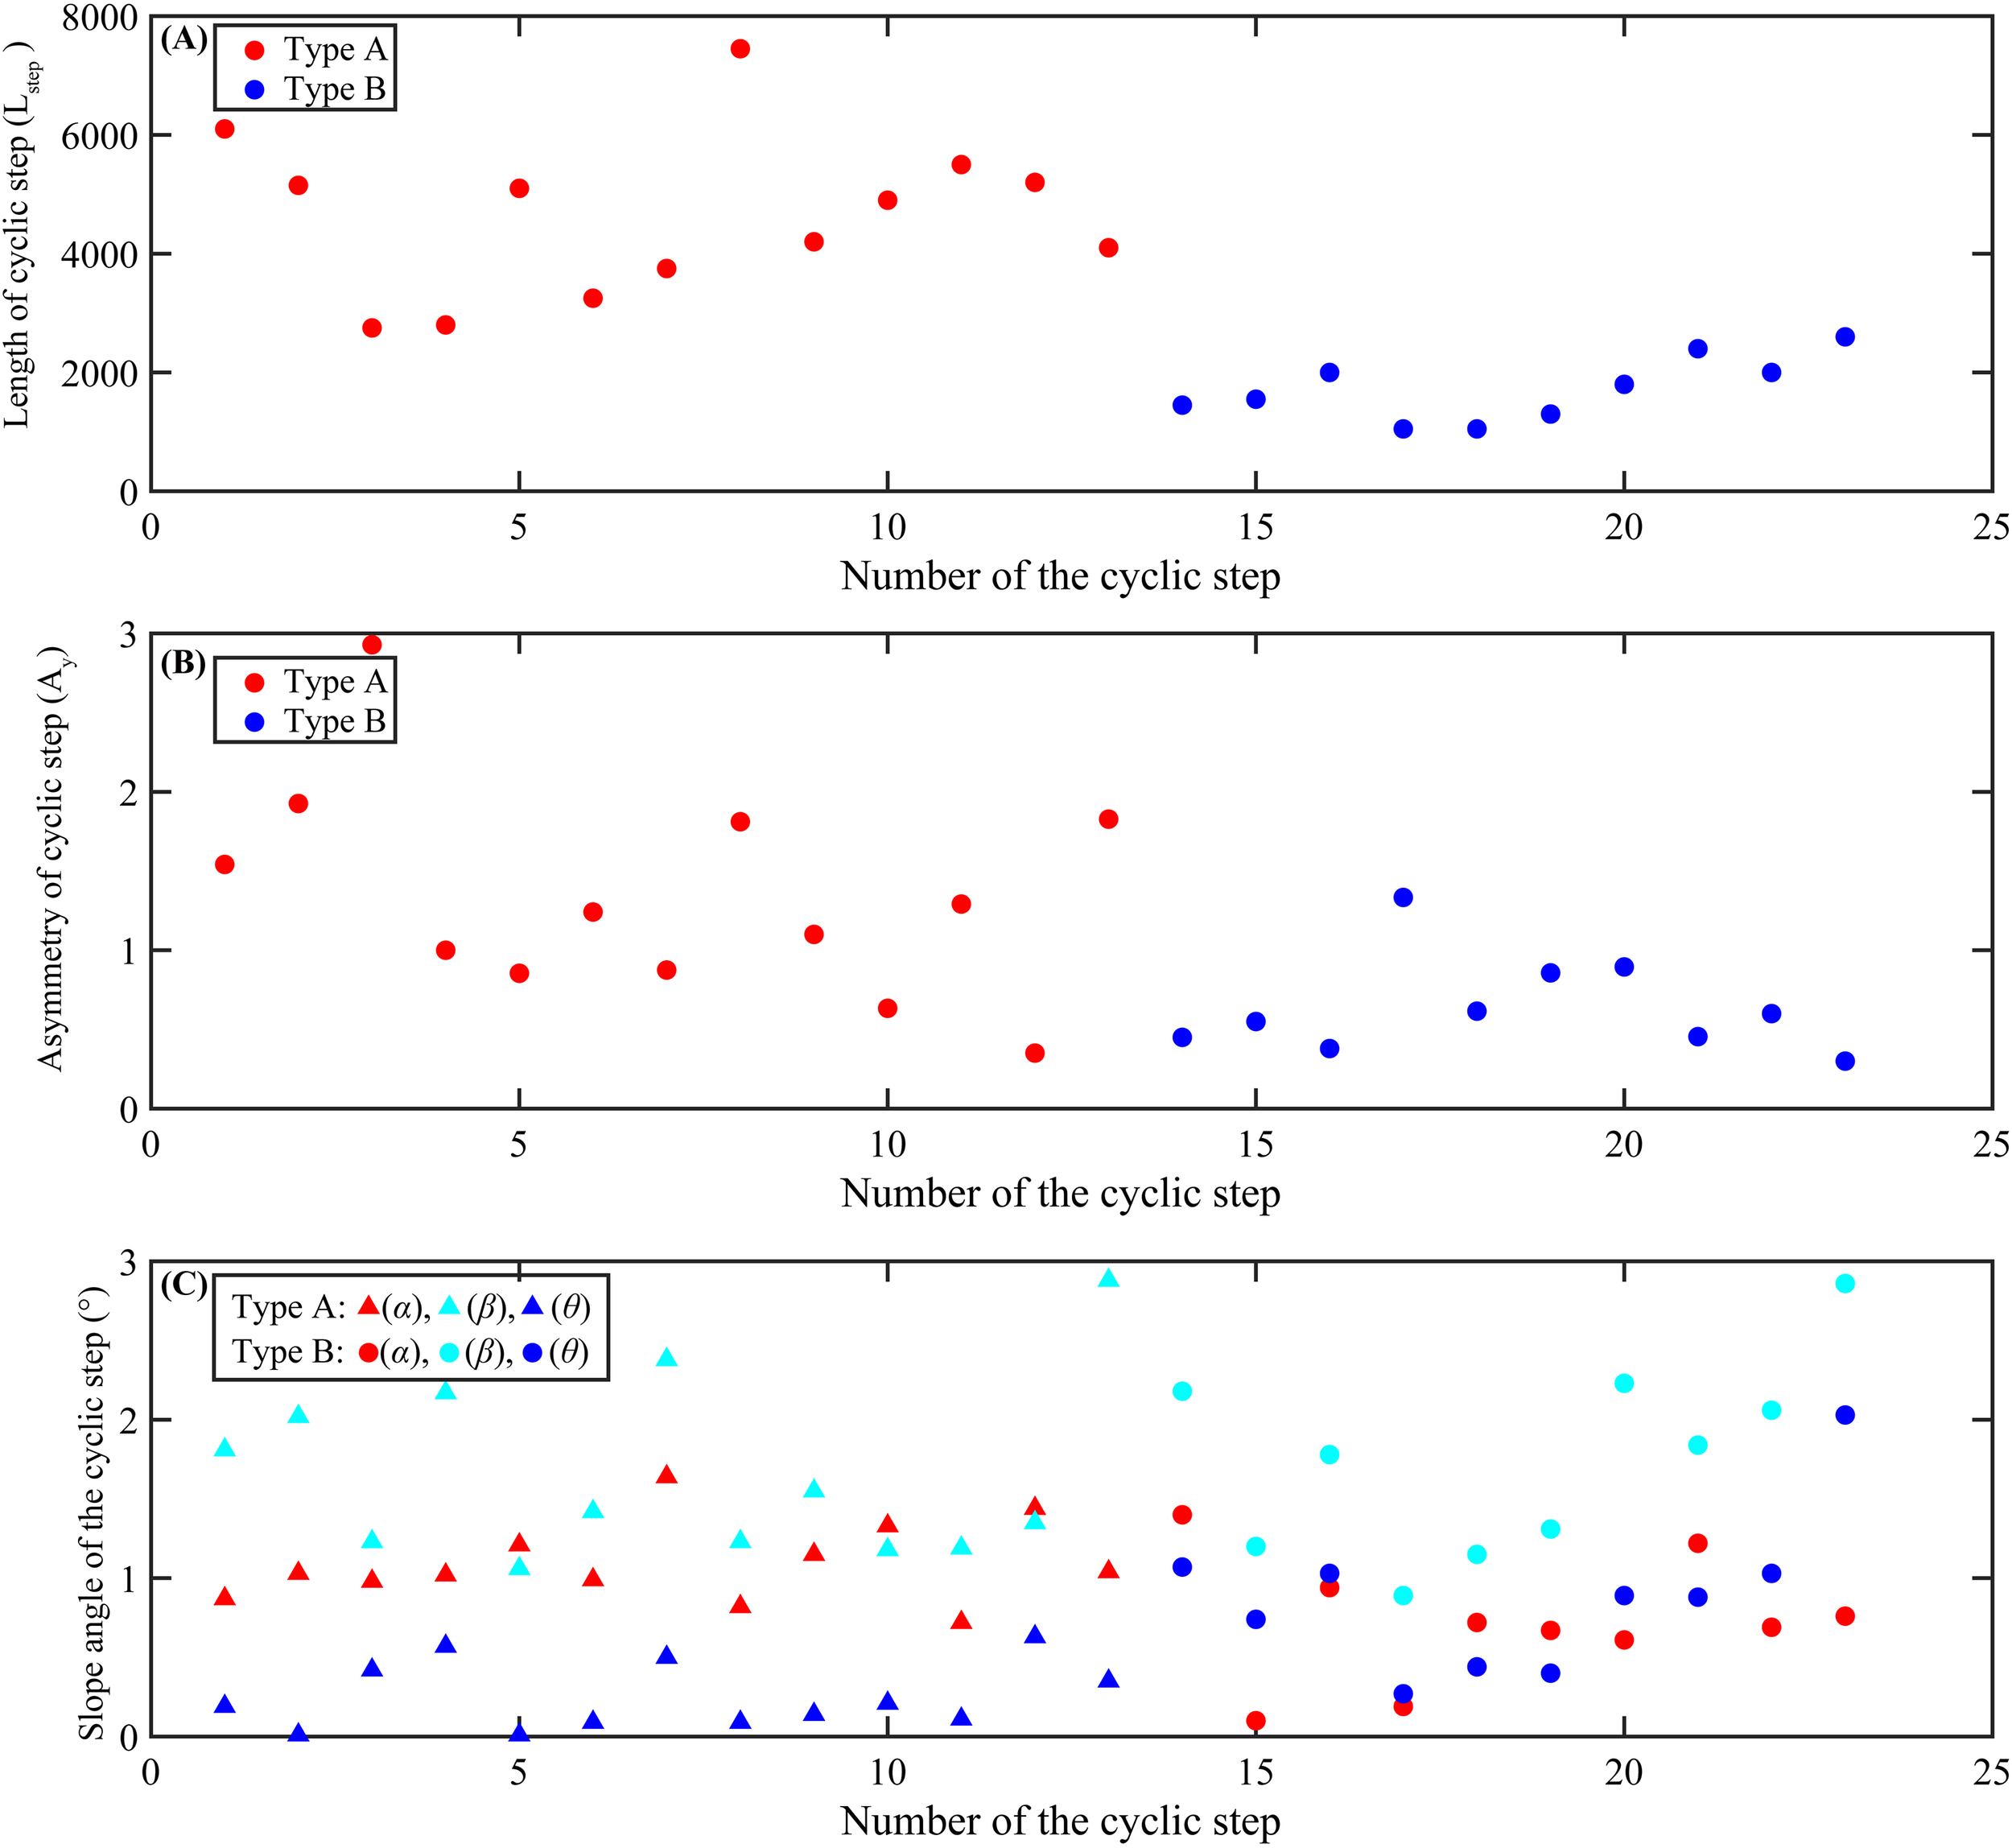
Graphical plots of the morphological characteristics of cyclic steps. (A) Length of cyclic steps comparison between Type A (marked in red) and Type B (marked in blue). (B) Asymmetry of cyclic steps comparison between Type A (marked in red) and Type B (marked in blue). (C) Slope angle of cyclic steps comparison between Type A and Type B. Slope gradients of the stoss side (α), the lee side (β) and the scour (θ) are marked in red, azure and blue, respectively. Note that the triangles represent Type A cyclic steps and the circles indicate Type B cyclic steps in Figure 4C.
4.1.2 Morphological and architectural characteristics of Type B cyclic steps
Type B cyclic steps are located in the overbank areas of the South Taiwan Channel, in water depths ranging from 3235 m to 3598 m. The average slope gradient of this region is 0.90°. These cyclic steps have a wavelength of 1.0-2.6 km and a height of 4.86-29.21 m (Table 2). For their side-specific parameters: the length of the stoss side (Lstoss) ranges from 450 m to 850 m, with a mean of 610 m; the length of the lee side (Llee) ranges from 450 m to 2000 m, with an average of 1110 m (Table 2). In terms of slope gradients: the stoss side slope (α) varies from 0.10° to 1.40°, with a mean value of 0.73°. In contrast, the lee side slope (β) ranges from 0.89° to 2.86°, with an average of 1.75° (Table 2; Figure 4). Additionally, Type B cyclic steps have an asymmetry index (Ay) ranging from 0.30 to 1.33 (mean = 0.64) and an aspect ratio ranging from 74.82 to 216.05 (mean = 118.11) (Table 2; Figure 4).
Table 2
| Type B | α | β | θ | L stoss | L lee | L step | H step | A y | Aspect ratio |
|---|---|---|---|---|---|---|---|---|---|
| No. | (°) | (°) | (°) | (m) | (m) | (m) | (m) | (-) | (-) |
| S1 | 1.40 | 2.18 | 1.07 | 450 | 1000 | 1450 | 19.38 | 0.45 | 74.82 |
| S2 | 0.10 | 1.20 | 0.74 | 550 | 1000 | 1550 | 8.10 | 0.55 | 191.36 |
| S3 | 0.94 | 1.78 | 1.03 | 550 | 1450 | 2000 | 18.90 | 0.38 | 105.82 |
| S4 | 0.19 | 0.89 | 0.27 | 600 | 450 | 1050 | 4.86 | 1.33 | 216.05 |
| S5 | 0.72 | 1.15 | 0.44 | 400 | 650 | 1050 | 8.05 | 0.62 | 130.43 |
| S6 | 0.67 | 1.31 | 0.4 | 600 | 700 | 1300 | 11.15 | 0.86 | 116.59 |
| S7 | 0.61 | 2.23 | 0.89 | 850 | 950 | 1800 | 22.22 | 0.89 | 81.01 |
| S8 | 1.22 | 1.84 | 0.88 | 750 | 1650 | 2400 | 27.56 | 0.45 | 87.08 |
| S9 | 0.69 | 2.06 | 1.03 | 750 | 1250 | 2000 | 22.50 | 0.60 | 88.89 |
| S10 | 0.76 | 2.86 | 2.03 | 600 | 2000 | 2600 | 29.21 | 0.30 | 89.01 |
Morphological characteristics of ten Type B cyclic steps.
4.1.3 Morphological properties comparison between Types A and B cyclic steps
The average wavelength of Type A cyclic steps is 2.7 times that of Type B cyclic steps, and their average wave height is 2.9 times greater (Tables 1, 2). In terms of side lengths: the average stoss side length (Lstoss) of Type A is 4.1 times that of Type B, while the average lee side length (Llee) of Type A is 1.9 times that of Type B (Tables 1, 2). Regarding slope gradients: the average stoss side slope (α) of Type A is 1.5 times that of Type B. In contrast, the average lee side slope (β) and the overall slope (θ) of Type A are 0.94 times and 0.29 times those of Type B, respectively (Tables 1, 2). In terms of morphological indices: the average asymmetry index (Ay) of Type A is 2.1 times that of Type B, whereas the average aspect ratio of Type A is 0.8 times that of Type B (Tables 1, 2).
4.2 Flow properties of turbidity currents generating the cyclic steps
4.2.1 Flow properties of turbidity currents of Type A cyclic steps
Prior to hydraulic jumps, the velocity of turbidity currents passing over Type A cyclic steps (U1) ranges from 2.60 m/s to 6.08 m/s, with an average of 4.47 m/s (Table 3; Figure 5A). For these turbidity currents, the flow thickness (h1) ranges from 36.73 m to 124.64 m (average: 66.27 m), and the Froude number (Fr1) ranges from 2.01 to 3.01 (average: 2.41) (Table 3).
Table 3
| Type A | Values | U 1 | h 1 | Fr 1 | U 2 | h 2 | Fr 2 | ΔEL | L jump | U 3 | h 3 | Fr 3 |
|---|---|---|---|---|---|---|---|---|---|---|---|---|
| No. | (m/s) | (m) | (-) | (m/s) | (m) | (-) | (m) | (m) | (m/s) | (m) | (-) | |
| E1 | Range | 2.96-5.13 | 36.62-59.87 | 2.13-2.72 | 0.88-2.01 | 123.65-152.53 | 0.44-0.52 | 21.78-36.39 | 295.94-352.00 | 1.58-3.53 | 24.38-37.34 | 1.78-1.85 |
| Mean | 4.05 | 48.25 | 2.43 | 1.39 | 138.09 | 0.48 | 29.09 | 323.97 | 2.47 | 30.86 | 1.82 | |
| E2 | Range | 3.52-6.09 | 43.99-71.92 | 2.30-2.95 | 0.95-2.18 | 162.64-201.18 | 0.41-0.49 | 37.32-58.36 | 457.10-501.69 | 1.56-3.45 | 59.15-83.13 | 1.12-1.22 |
| Mean | 4.81 | 57.96 | 2.63 | 1.51 | 181.91 | 0.45 | 47.84 | 457.10 | 2.43 | 71.14 | 1.17 | |
| E3 | Range | 3.01-5.22 | 28.91-47.26 | 2.43-3.11 | 0.77-1.75 | 113.62-140.79 | 0.40-0.47 | 30.75-46.28 | 348.82-367.24 | 1.16-2.56 | 55.58-75.35 | 0.86-0.95 |
| Mean | 4.12 | 38.09 | 2.77 | 1.22 | 127.21 | 0.44 | 38.52 | 358.03 | 1.80 | 65.47 | 0.91 | |
| E4 | Range | 1.90-3.29 | 18.88-30.86 | 1.9-2.43 | 0.64-1.47 | 56.10-68.92 | 0.47-0.57 | 6.48-12.17 | 97.34-138.55 | 1.18-2.69 | 9.02-12.2 | 2.18-2.47 |
| Mean | 2.60 | 24.87 | 2.17 | 1.02 | 62.51 | 0.52 | 9.33 | 117.95 | 1.87 | 10.61 | 2.33 | |
| E5 | Range | 2.69-4.65 | 21.41-34.99 | 2.52-3.23 | 0.66-1.5 | 87.55-108.60 | 0.39-0.46 | 26.23-38.60 | 282.76-290.88 | 1.26-2.75 | 6.56-17.69 | 2.1-2.74 |
| Mean | 3.67 | 28.20 | 2.88 | 1.04 | 98.08 | 0.43 | 32.42 | 286.82 | 1.95 | 12.13 | 2.42 | |
| E6 | Range | 3.76-6.52 | 86.06-140.69 | 1.76-2.26 | 1.38-3.19 | 234.79-287.57 | 0.50-0.60 | 19.58-40.70 | 291.75-513.35 | 1.74-4.04 | 172.98-210.83 | 0.74-0.89 |
| Mean | 5.14 | 113.38 | 2.01 | 2.20 | 261.18 | 0.55 | 30.14 | 402.55 | 2.78 | 191.91 | 0.82 | |
| E7 | Range | 2.64-4.57 | 30.06-49.14 | 2.09-2.67 | 0.8-1.83 | 99.61-122.80 | 0.44-0.53 | 16.56-28.09 | 229.37-278.41 | 1.51-3.39 | 10-17.63 | 2.59-2.66 |
| Mean | 3.61 | 39.60 | 2.38 | 1.27 | 111.21 | 0.49 | 22.33 | 253.89 | 2.37 | 13.82 | 2.63 | |
| E8 | Range | 3.21-5.56 | 27.88-45.58 | 2.64-3.38 | 0.75-1.7 | 120.02-149.08 | 0.38-0.45 | 40.78-58.43 | 411.08-411.99 | 1.43-3.09 | 10.24-27.32 | 1.90-2.48 |
| Mean | 4.39 | 36.73 | 3.01 | 1.18 | 134.55 | 0.42 | 49.61 | 411.54 | 2.19 | 18.78 | 2.19 | |
| E9 | Range | 3.7-6.4 | 71.47-116.84 | 1.90-2.43 | 1.24-2.87 | 212.39-260.91 | 0.47-0.57 | 24.52-46.08 | 368.50-524.51 | 1.73-3.97 | 128.90-160.19 | 0.85-1.01 |
| Mean | 5.05 | 94.16 | 2.17 | 1.98 | 236.65 | 0.52 | 35.30 | 446.51 | 2.75 | 144.55 | 0.93 | |
| E10 | Range | 3.21-5.56 | 42.81-69.98 | 2.13-2.73 | 0.95-2.17 | 145.06-178.96 | 0.44-0.52 | 25.84-43.04 | 349.73-414.41 | 1.46-3.28 | 67.07-88.08 | 0.99-1.12 |
| Mean | 4.39 | 56.40 | 2.43 | 1.51 | 162.01 | 0.48 | 34.44 | 382.07 | 2.29 | 77.58 | 1.06 | |
| E11 | Range | 3.93-6.81 | 84.34-137.88 | 1.86-2.38 | 1.35-3.13 | 244.74-300.40 | 0.48-0.58 | 25.91-49.98 | 392.19-585.77 | 1.77-4.06 | 170.35-210.62 | 0.75-0.90 |
| Mean | 5.37 | 111.11 | 2.12 | 2.16 | 272.57 | 0.53 | 37.95 | 488.98 | 2.81 | 190.49 | 0.83 | |
| E12 | Range | 3.52-6.09 | 66.9-109.37 | 1.87-2.39 | 1.21-2.78 | 195.09-239.50 | 0.48-0.58 | 21.03-40.34 | 317.94-469.99 | 1.61-3.70 | 130.17-160.49 | 0.78-0.94 |
| Mean | 4.81 | 88.14 | 2.13 | 1.92 | 217.30 | 0.53 | 30.69 | 393.97 | 2.56 | 145.33 | 0.86 | |
| E13 | Range | 4.45-7.71 | 94.61-154.66 | 1.99-2.54 | 1.42-3.27 | 296.47-364.84 | 0.46-0.55 | 41.14-73.31 | 598.72-780.54 | 1.84-4.21 | 208.15-260.12 | 0.71-0.84 |
| Mean | 6.08 | 124.64 | 2.27 | 2.26 | 330.66 | 0.51 | 57.23 | 689.63 | 2.92 | 234.14 | 0.78 |
Estimated hydraulic properties of turbidity currents flowing through the thirteen Type A cyclic steps.
Figure 5
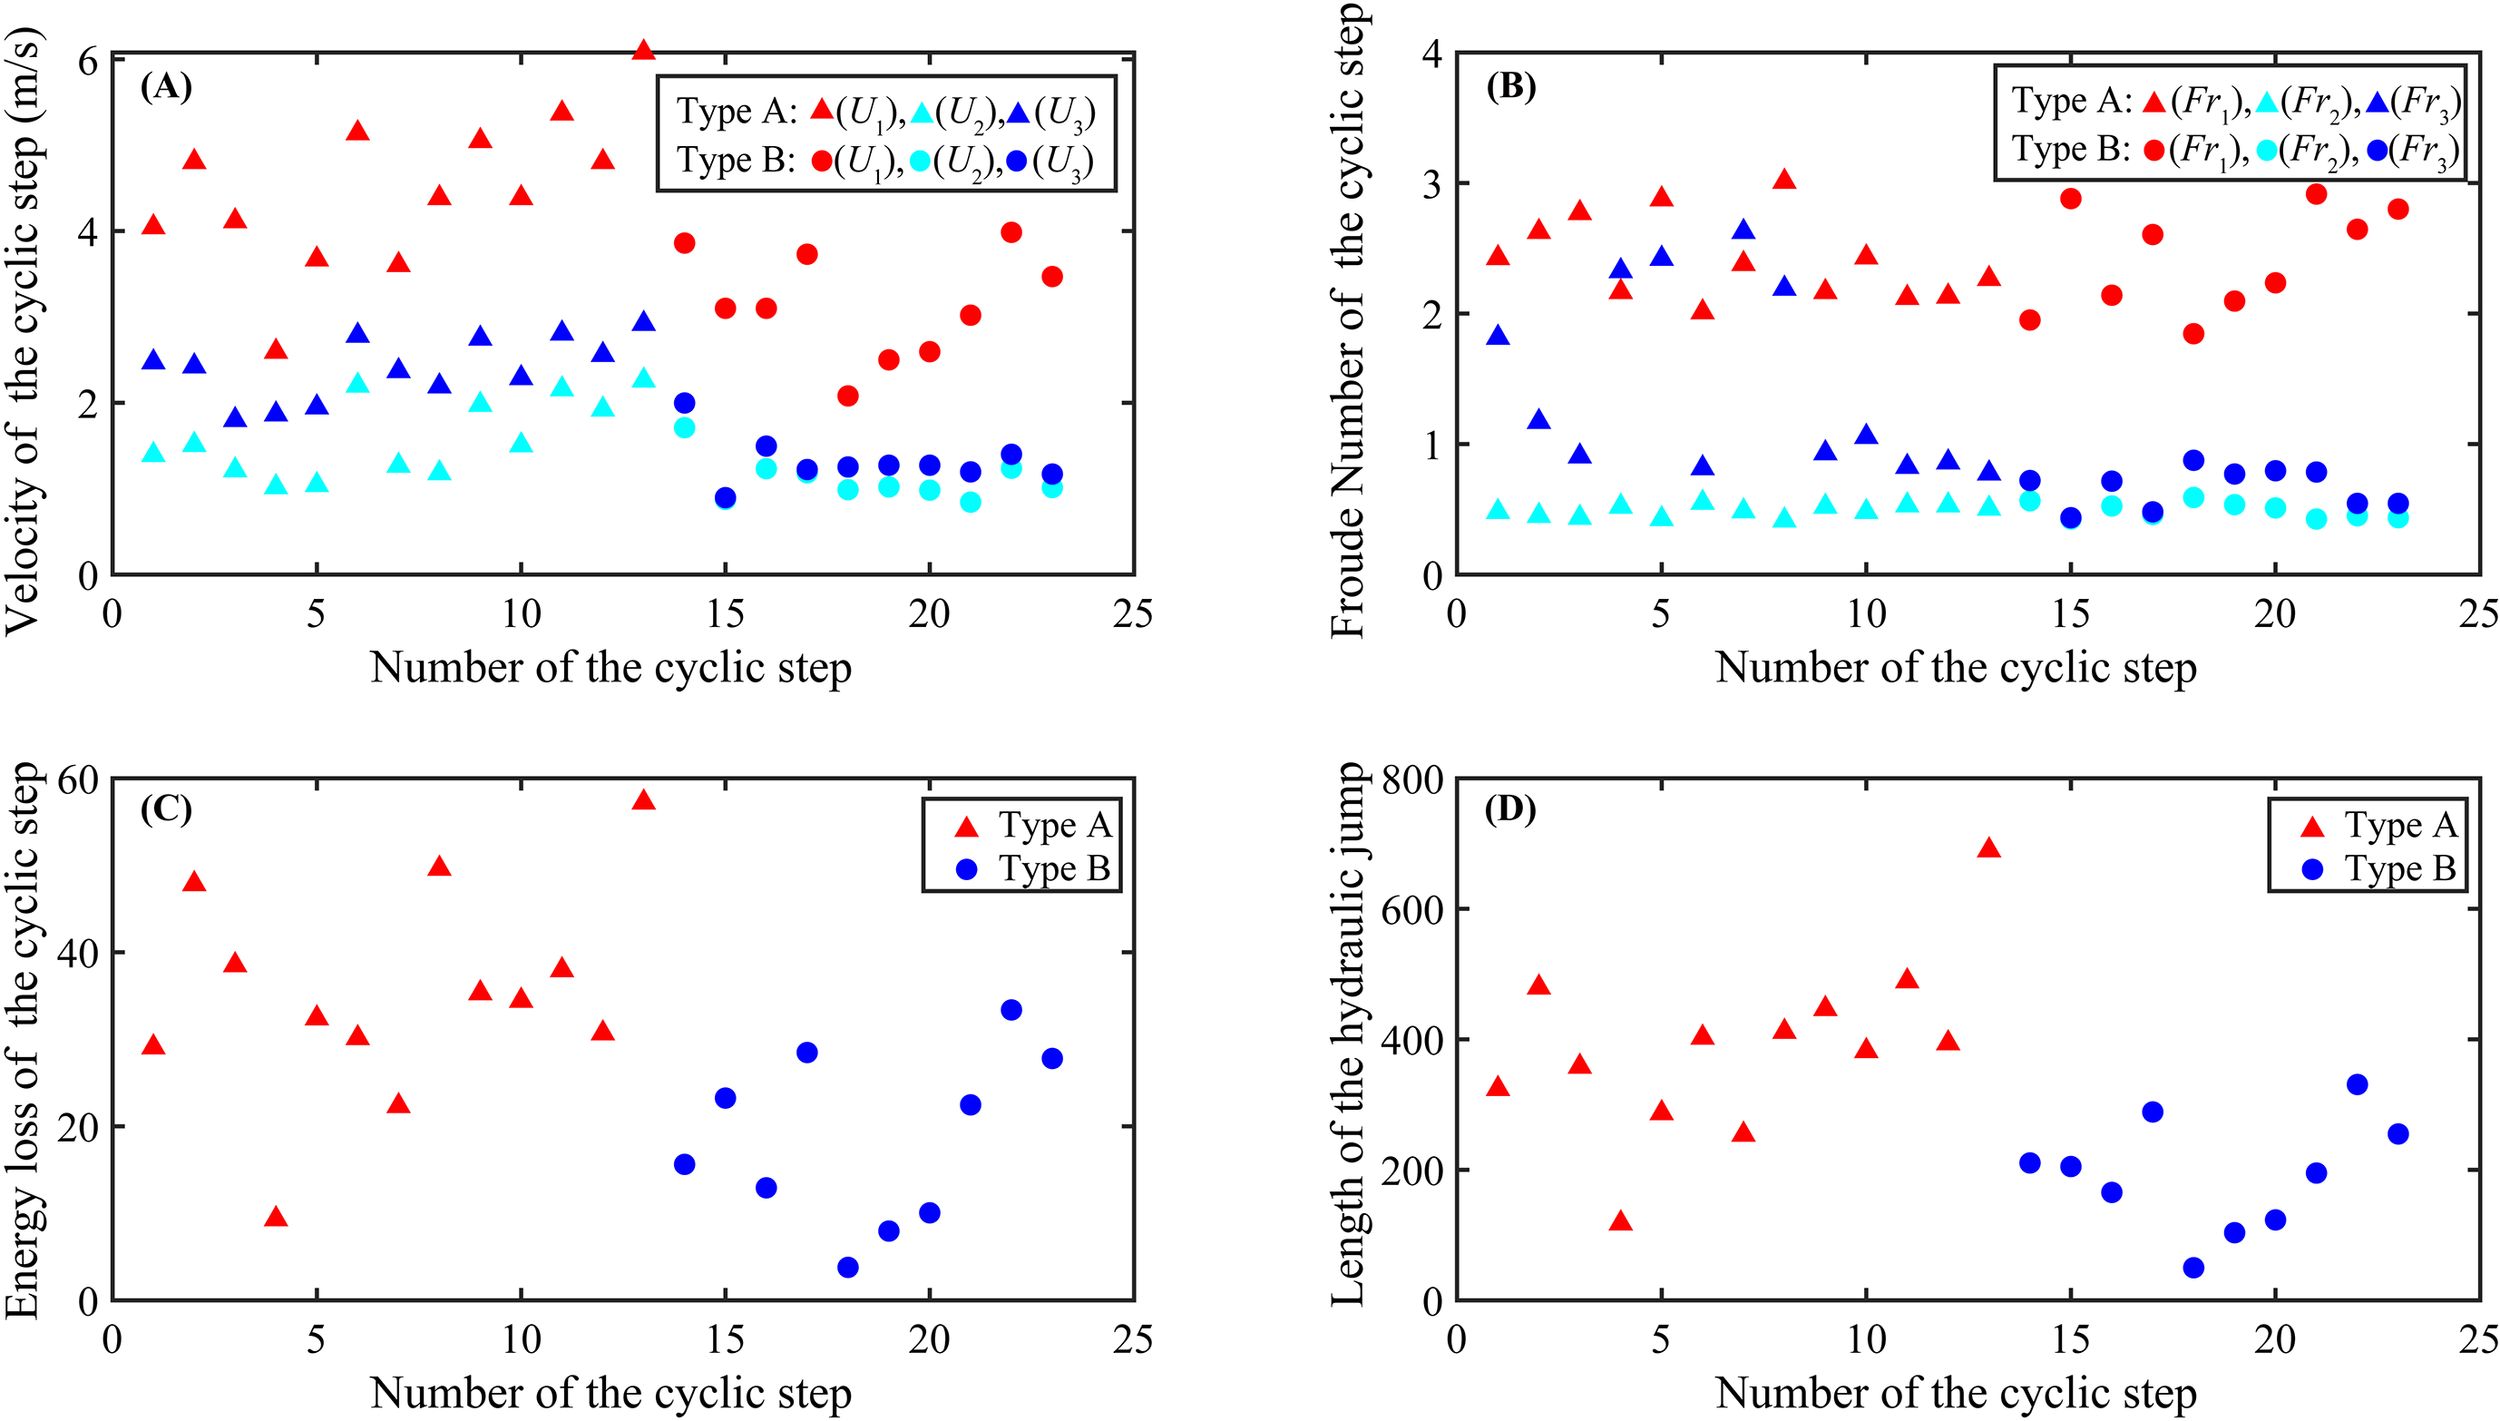
Graphical plots of the hydraulic characteristics of cyclic steps. (A) Velocity of cyclic steps comparison between Type A and Type B. The red represents U1 (velocity at the trough), the azure represents U2 (velocity after the hydraulic jumps) and the blue represents U3 (velocity at the crest). (B) Froude number of cyclic steps comparison between Type A and Type B. The red, azure and blue represent Fr1 (Froude number at the trough), Fr2 (Froude number after the hydraulic jumps) and Fr3 (Froude number at the crest). (C) Energy loss of cyclic steps comparison between Type A (marked in red) and Type B (marked in blue). (D) Length of the hydraulic jump of cyclic steps comparison between Type A (marked in red) and Type B (marked in blue).
Downstream of hydraulic jumps, the velocity of turbidity currents decreases significantly. For Type A cyclic steps, the post-jump velocity (U2) ranges from 1.02 m/s to 2.26 m/s (average: 1.59 m/s) (Table 3; Figure 5A). Corresponding changes in other flow properties are observed: the post-jump flow thickness (h2) ranges from 62.51 m to 330.66 m (average: 179.53 m), and the post-jump Froude number (Fr2) ranges from 0.42 to 0.55 (average: 0.49) (Table 3; Figure 5B). During hydraulic jumps, the energy loss (ΔEL) of turbidity currents over Type A cyclic steps ranges from 9.33 m to 57.23 m, with a mean of 34.99 m (Table 3; Figure 5C). Additionally, the length of these hydraulic jumps (Ljump) ranges from 117.95 m to 689.63 m, with an average of 387.33 m (Table 3; Figure 5D).
In Stage III of the flow process, the turbidity current properties at the crests of Type A cyclic steps (U3, h3, Fr3) are as follows: velocity (U3) ranges from 1.80 m/s to 2.92 m/s (average: 2.40 m/s), flow thickness (h3) ranges from 10.61 m to 234.14 m (average: 92.83 m), and Froude number (Fr3) ranges from 0.78 to 2.42 (average: 1.44) (Table 3).
4.2.2 Flow properties of turbidity currents of Type B cyclic steps
Prior to hydraulic jumps, the velocity of turbidity currents passing over Type B cyclic steps (U1) ranges from 2.08 m/s to 3.99 m/s, with an average of 3.14 m/s (Table 4; Figure 5A). For these currents, the flow thickness (h1) ranges from 18.62 m to 67.74 m (average: 31.43 m), and the Froude number (Fr1) ranges from 1.85 to 2.92 (average: 2.41) (Table 4).
Table 4
| Type B | Values | U 1 | h 1 | Fr 1 | U 2 | h 2 | Fr 2 | ΔEL | L jump | U 3 | h 3 | Fr 3 |
|---|---|---|---|---|---|---|---|---|---|---|---|---|
| No. | (m/s) | (m) | (-) | (m/s) | (m) | (-) | (m) | (m) | (m/s) | (m) | (-) | |
| S1 | Range | 2.83-4.89 | 51.42-84.06 | 1.71-2.19 | 1.07-2.48 | 135.63-165.91 | 0.51-0.62 | 9.83-21.41 | 140.51-280.4 | 1.25-2.9 | 113.25-137.60 | 0.65-0.79 |
| Mean | 3.86 | 67.74 | 1.95 | 1.71 | 150.77 | 0.57 | 15.62 | 210.46 | 2.00 | 125.43 | 0.72 | |
| S2 | Range | 2.27-3.93 | 15.22-24.88 | 2.53-3.23 | 0.55-1.26 | 62.41-77.42 | 0.39-0.46 | 18.82-27.66 | 202.19-207.7 | 0.57-1.29 | 60.92-75.93 | 0.40-0.47 |
| Mean | 3.10 | 20.05 | 2.88 | 0.88 | 69.92 | 0.43 | 23.24 | 204.95 | 0.90 | 68.43 | 0.44 | |
| S3 | Range | 2.27-3.93 | 27.64-45.19 | 1.88-2.4 | 0.77-1.79 | 81.00-99.45 | 0.48-0.57 | 8.89-16.96 | 134.18-196.38 | 0.94-2.16 | 63.82-78.69 | 0.65-0.78 |
| Mean | 3.10 | 36.42 | 2.14 | 1.23 | 90.23 | 0.53 | 12.93 | 165.28 | 1.50 | 71.26 | 0.72 | |
| S4 | Range | 2.73-4.73 | 27.03-44.18 | 2.29-2.92 | 0.75-1.71 | 98.99-122.41 | 0.42-0.50 | 22.13-34.82 | 274.13-303.02 | 0.77-1.76 | 95.68-118.83 | 0.44-0.52 |
| Mean | 3.73 | 35.61 | 2.61 | 1.19 | 110.70 | 0.46 | 28.48 | 288.58 | 1.22 | 107.26 | 0.48 | |
| S5 | Range | 1.52-2.64 | 16.77-27.42 | 1.62-2.07 | 0.62-1.43 | 41.34-50.44 | 0.53-0.65 | 2.21-5.35 | 24.71-75.02 | 0.78-1.83 | 30.67-36.63 | 0.78-0.97 |
| Mean | 2.08 | 22.10 | 1.85 | 0.99 | 45.89 | 0.59 | 3.78 | 49.87 | 1.25 | 33.65 | 0.88 | |
| S6 | Range | 1.83-3.17 | 18.75-30.65 | 1.84-2.35 | 0.64-1.48 | 53.61-65.77 | 0.49-0.58 | 5.73-10.54 | 81.40-125.72 | 0.80-1.84 | 40.11-49.41 | 0.70-0.84 |
| Mean | 2.50 | 24.70 | 2.10 | 1.02 | 59.69 | 0.54 | 7.96 | 103.56 | 1.27 | 44.76 | 0.77 | |
| S7 | Range | 1.90-3.29 | 17.73-28.98 | 1.96-2.51 | 0.62-1.42 | 54.61-67.16 | 0.46-0.56 | 7.15-12.95 | 105.36-140.95 | 0.80-1.84 | 37.92-47.46 | 0.73-0.86 |
| Mean | 2.60 | 23.36 | 2.24 | 0.98 | 60.89 | 0.51 | 10.05 | 123.16 | 1.27 | 42.69 | 0.80 | |
| S8 | Range | 2.21-3.83 | 14.13-23.11 | 2.56-3.27 | 0.53-1.22 | 58.69-72.83 | 0.39-0.46 | 18.26-26.66 | 193.02-196.95 | 0.77-1.70 | 32.78-43.81 | 0.75-0.82 |
| Mean | 3.02 | 18.62 | 2.92 | 0.84 | 65.76 | 0.43 | 22.46 | 194.99 | 1.20 | 38.30 | 0.79 | |
| S9 | Range | 2.92-5.05 | 29.75-48.64 | 2.32-2.97 | 0.78-1.79 | 111.01-137.35 | 0.41-0.49 | 26.13-40.61 | 316.43-344.95 | 0.89-2.01 | 95.77-120.10 | 0.50-0.59 |
| Mean | 3.99 | 39.20 | 2.65 | 1.24 | 124.18 | 0.45 | 33.73 | 330.69 | 1.40 | 107.94 | 0.55 | |
| S10 | Range | 2.54-4.40 | 20.13-32.91 | 2.46-3.14 | 0.64-1.46 | 80.00-99.16 | 0.40-0.47 | 22.27-33.31 | 249.15-260.58 | 0.74-1.68 | 66.90-84.47 | 0.51-0.58 |
| Mean | 3.47 | 26.52 | 2.80 | 1.01 | 89.58 | 0.44 | 27.79 | 254.87 | 1.17 | 75.69 | 0.55 |
Estimated hydraulic properties of turbidity currents flowing through the ten Type B cyclic steps.
After hydraulic jumps, the velocity of turbidity currents decreases significantly. For Type B cyclic steps, the post-jump velocity (U2) ranges from 0.84 m/s to 1.71 m/s (average: 1.11 m/s) (Table 4; Figure 5A). Corresponding changes in other flow properties include: post-jump flow thickness (h2) ranging from 45.89 m to 150.77 m (average: 86.76 m) and post-jump Froude number (Fr2) ranging from 0.43 to 0.57 (average: 0.49) (Table 4; Figure 5B). During hydraulic jumps, the energy loss (ΔEL) of turbidity currents over Type B cyclic steps ranges from 3.78 m to 33.37 m, with a mean of 18.57 m (Table 4; Figure 5C). Additionally, the length of these hydraulic jumps (Ljump) ranges from 49.87 m to 330.69 m, with an average of 192.64 m (Table 4; Figure 5D).
In Stage III of the flow process, the turbidity current properties at the crests of Type B cyclic steps (U3, h3, Fr3) are as follows: velocity (U3) ranges from 0.90 m/s to 2.00 m/s (average: 1.32 m/s), flow thickness (h3) ranges from 33.65 m to 125.43 m (average: 71.54 m), and Froude number (Fr3) ranges from 0.44 to 0.88 (average: 0.67) (Table 4).
4.2.3 Hydraulic properties comparison between Types A and B cyclic steps
In terms of the hydraulic characteristics of cyclic steps, the average values of pre-jump velocity (U1) and pre-jump flow thickness (h1) for turbidity currents forming Type A cyclic steps (E1 to E13) are 1.4 times and 2.1 times those of the currents forming Type B cyclic steps (S1 to S10), respectively (Tables 3, 4). After hydraulic jumps, the average post-jump velocity (U2) of turbidity currents over Type A cyclic steps is 1.4 times that of those over Type B, and the average post-jump flow thickness (h2) of Type A is 2.1 times that of Type B. Additionally, the average energy loss (ΔEL) of turbidity currents during hydraulic jumps for Type A is 1.9 times that of Type B, and the average hydraulic jump length (Ljump) for Type A is 2.0 times that of Type B. In Stage III, the average values of flow velocity (U3) and flow thickness (h3) of turbidity currents at the crests of Type A cyclic steps are 1.8 times and 1.3 times those of Type B, respectively (Table 3).
Notably, the average pre-jump (Fr1) and post-jump (Fr2) Froude numbers of turbidity currents are nearly identical between Type A and Type B cyclic steps. However, the average Froude number at the crests (Fr3) of Type A is 2.1 times that of Type B. From a flow regime perspective: in Stage I (prior to hydraulic jumps), turbidity currents over both Types A and B cyclic steps are supercritical (Fr1>1); after hydraulic jumps (Stage II), the flow transitions to subcritical (Fr2<1) for both types. In Stage III, however, a distinct difference emerges: turbidity currents at the crests of Type A cyclic steps remain supercritical (Fr3>1), whereas those at the crests of Type B are subcritical (Fr3<1).
5 Discussion
5.1 Origin and formation process of cyclic steps
Thirteen (13) Type A cyclic steps and ten (10) Type B cyclic steps were identified near the Manila Trench. Their morphological features, as well as the flow properties of the inferred turbidity currents that could generate them were compared in Section 4. Symons et al. (2016) conducted a statistical analysis of numerous sediment waves and scours across a broad range of water depths and environmental settings (Figure 6). In the study area, despite the morphological differences between Types A and B cyclic steps, their wavelengths and wave heights are comparable to those of large-scale bedforms with mixed relief documented in Symons et al. (2016) and Clare et al. (2023). In this section, the origin and formation processes of these cyclic steps are discussed.
Figure 6
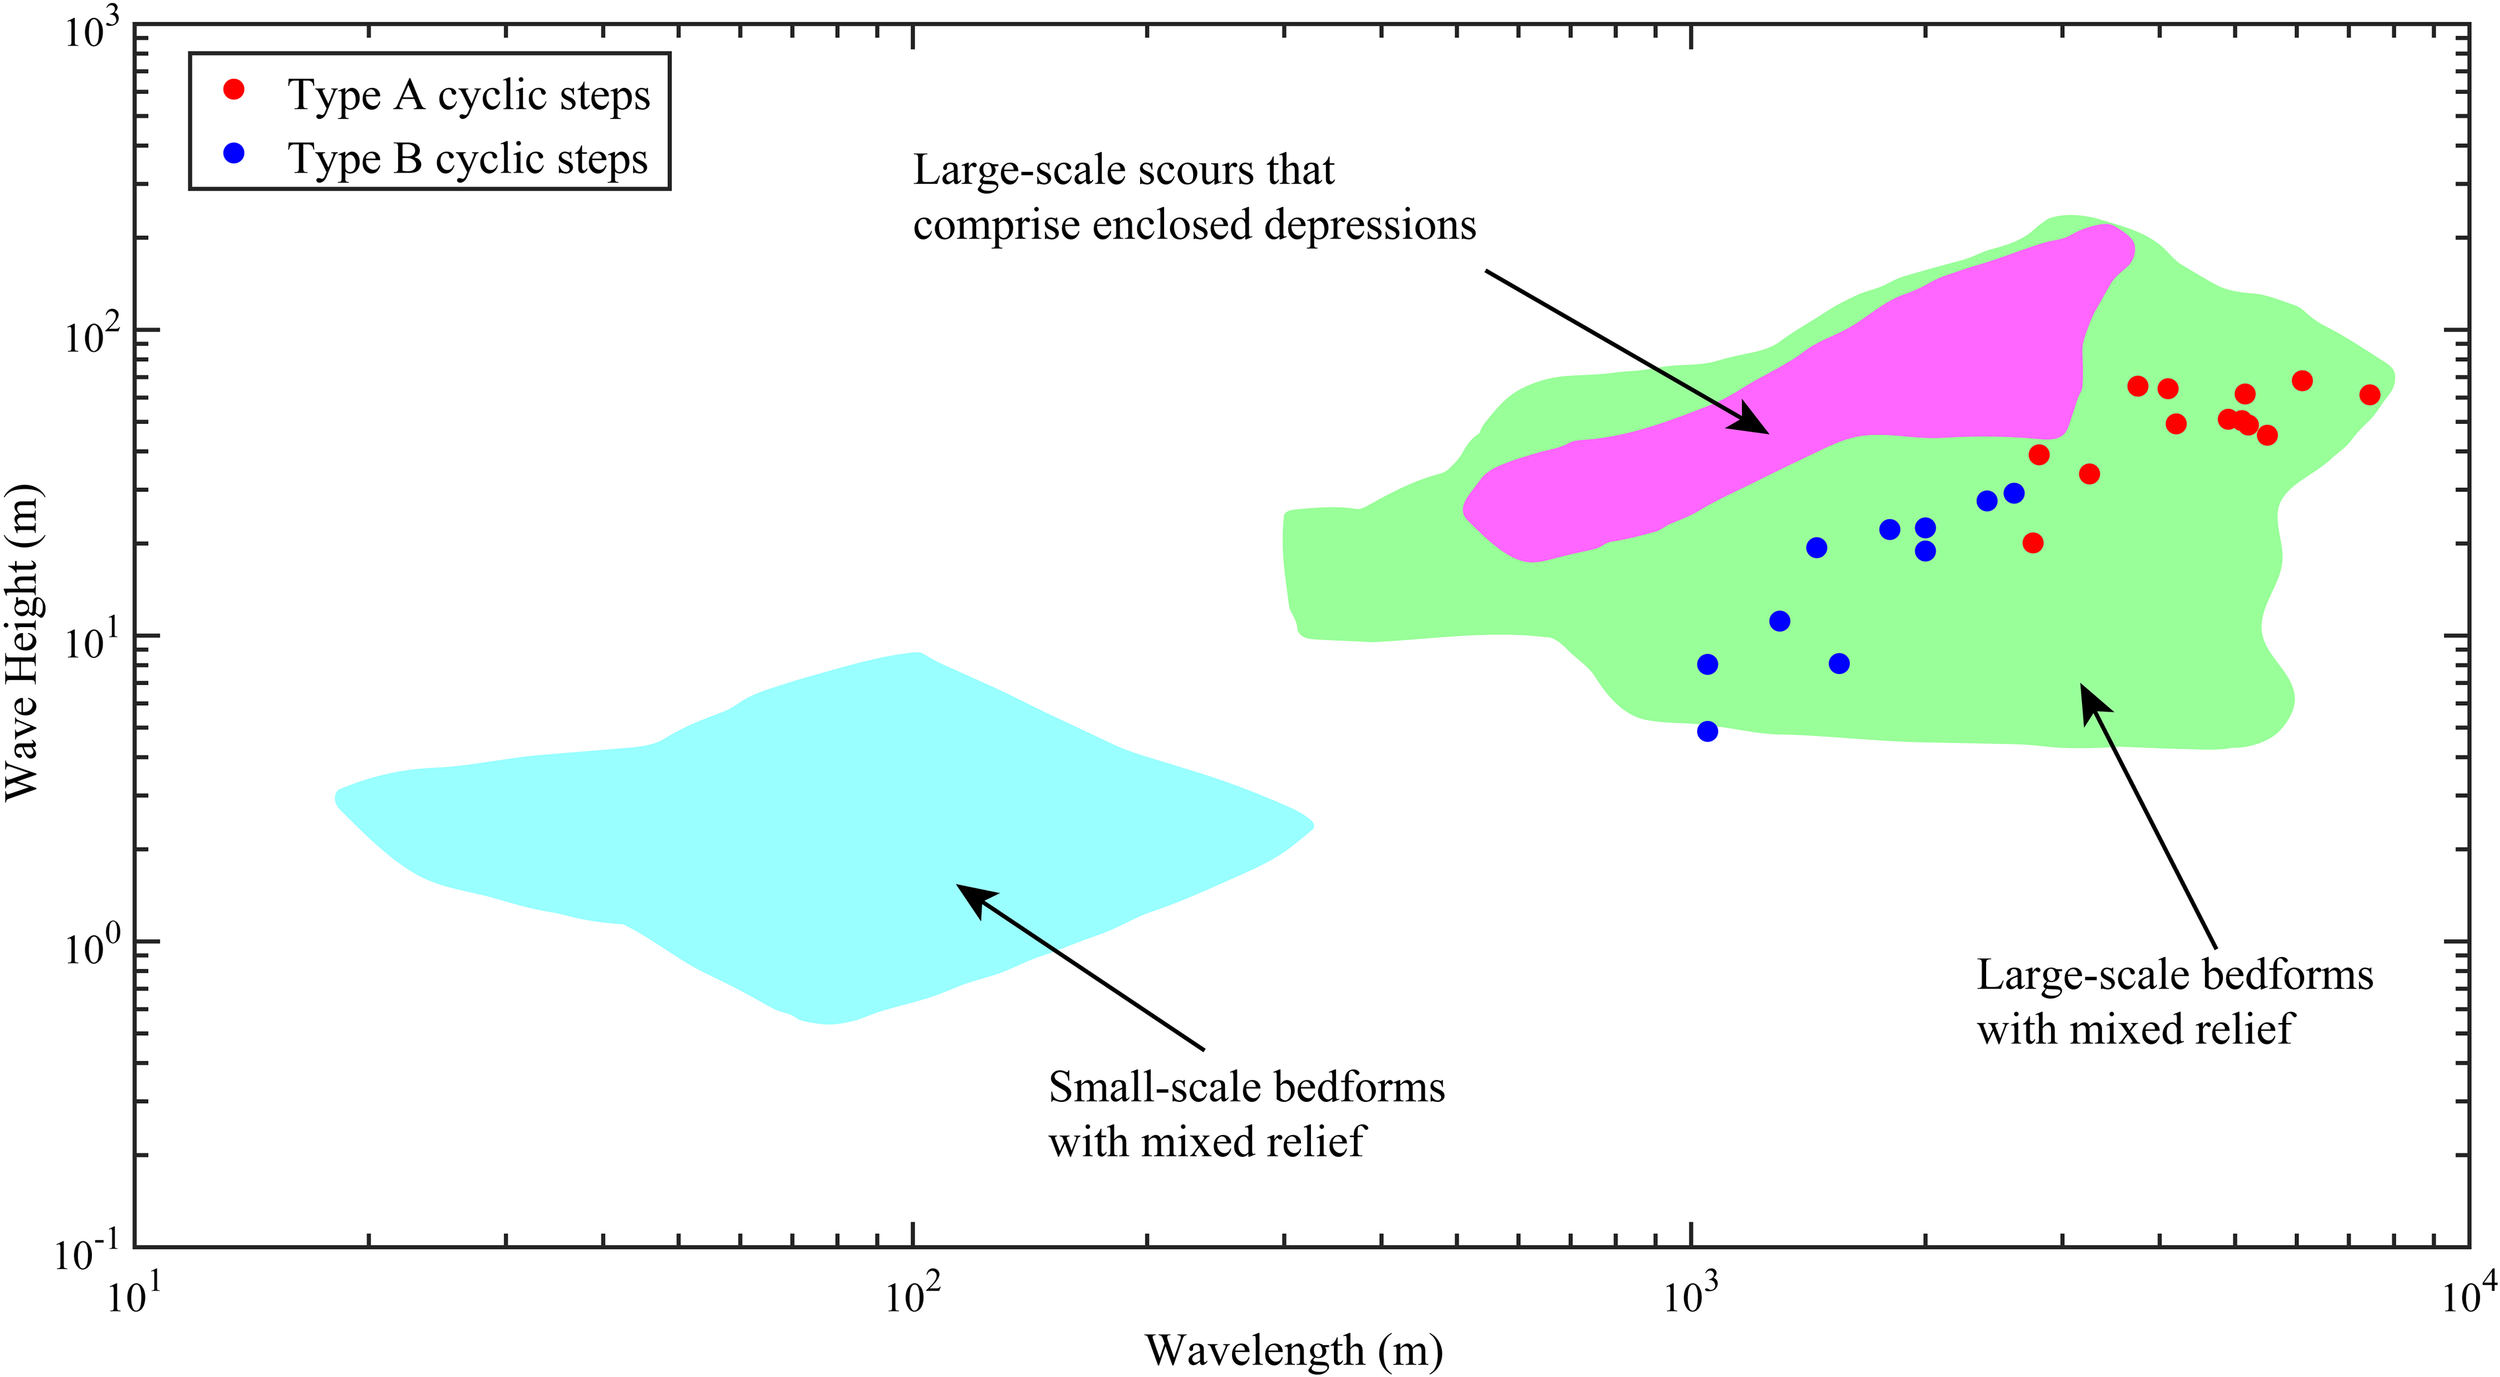
Log-Log plots of aspect ratios (wavelength versus wave height) for thirteen (13) Type A and ten (10) Type B cyclic steps, compared to those described in Symons et al. (2016) and Clare et al. (2023).
In previous studies, the formation of cyclic steps along submarine canyons has been attributed to hydraulic jumps in turbidity currents (Cerrillo-Escoriza et al., 2024; Dorrell et al., 2016; Slootman and Cartigny, 2020). In the present study area, the formation of both Type A and Type B cyclic steps is linked to the transition of turbidity currents from supercritical flow (Fr1>1) to subcritical flow (Fr2<1) (Tables 3, 4). Cyclic steps along the Penghu Canyon and South Taiwan Shoal Canyon have been classified as net-erosional cyclic steps, based on their columnar arrangement, upstream migration direction, and crescentic morphology (Li et al., 2020; Zhang et al., 2022). Given these characteristics, we infer that Type A cyclic steps are net-erosional cyclic steps, associated with confined turbidity currents that propagate along the submarine canyons-specifically, the South Taiwan Shoal Canyon and the Penghu Canyon (Figure 7).
Figure 7
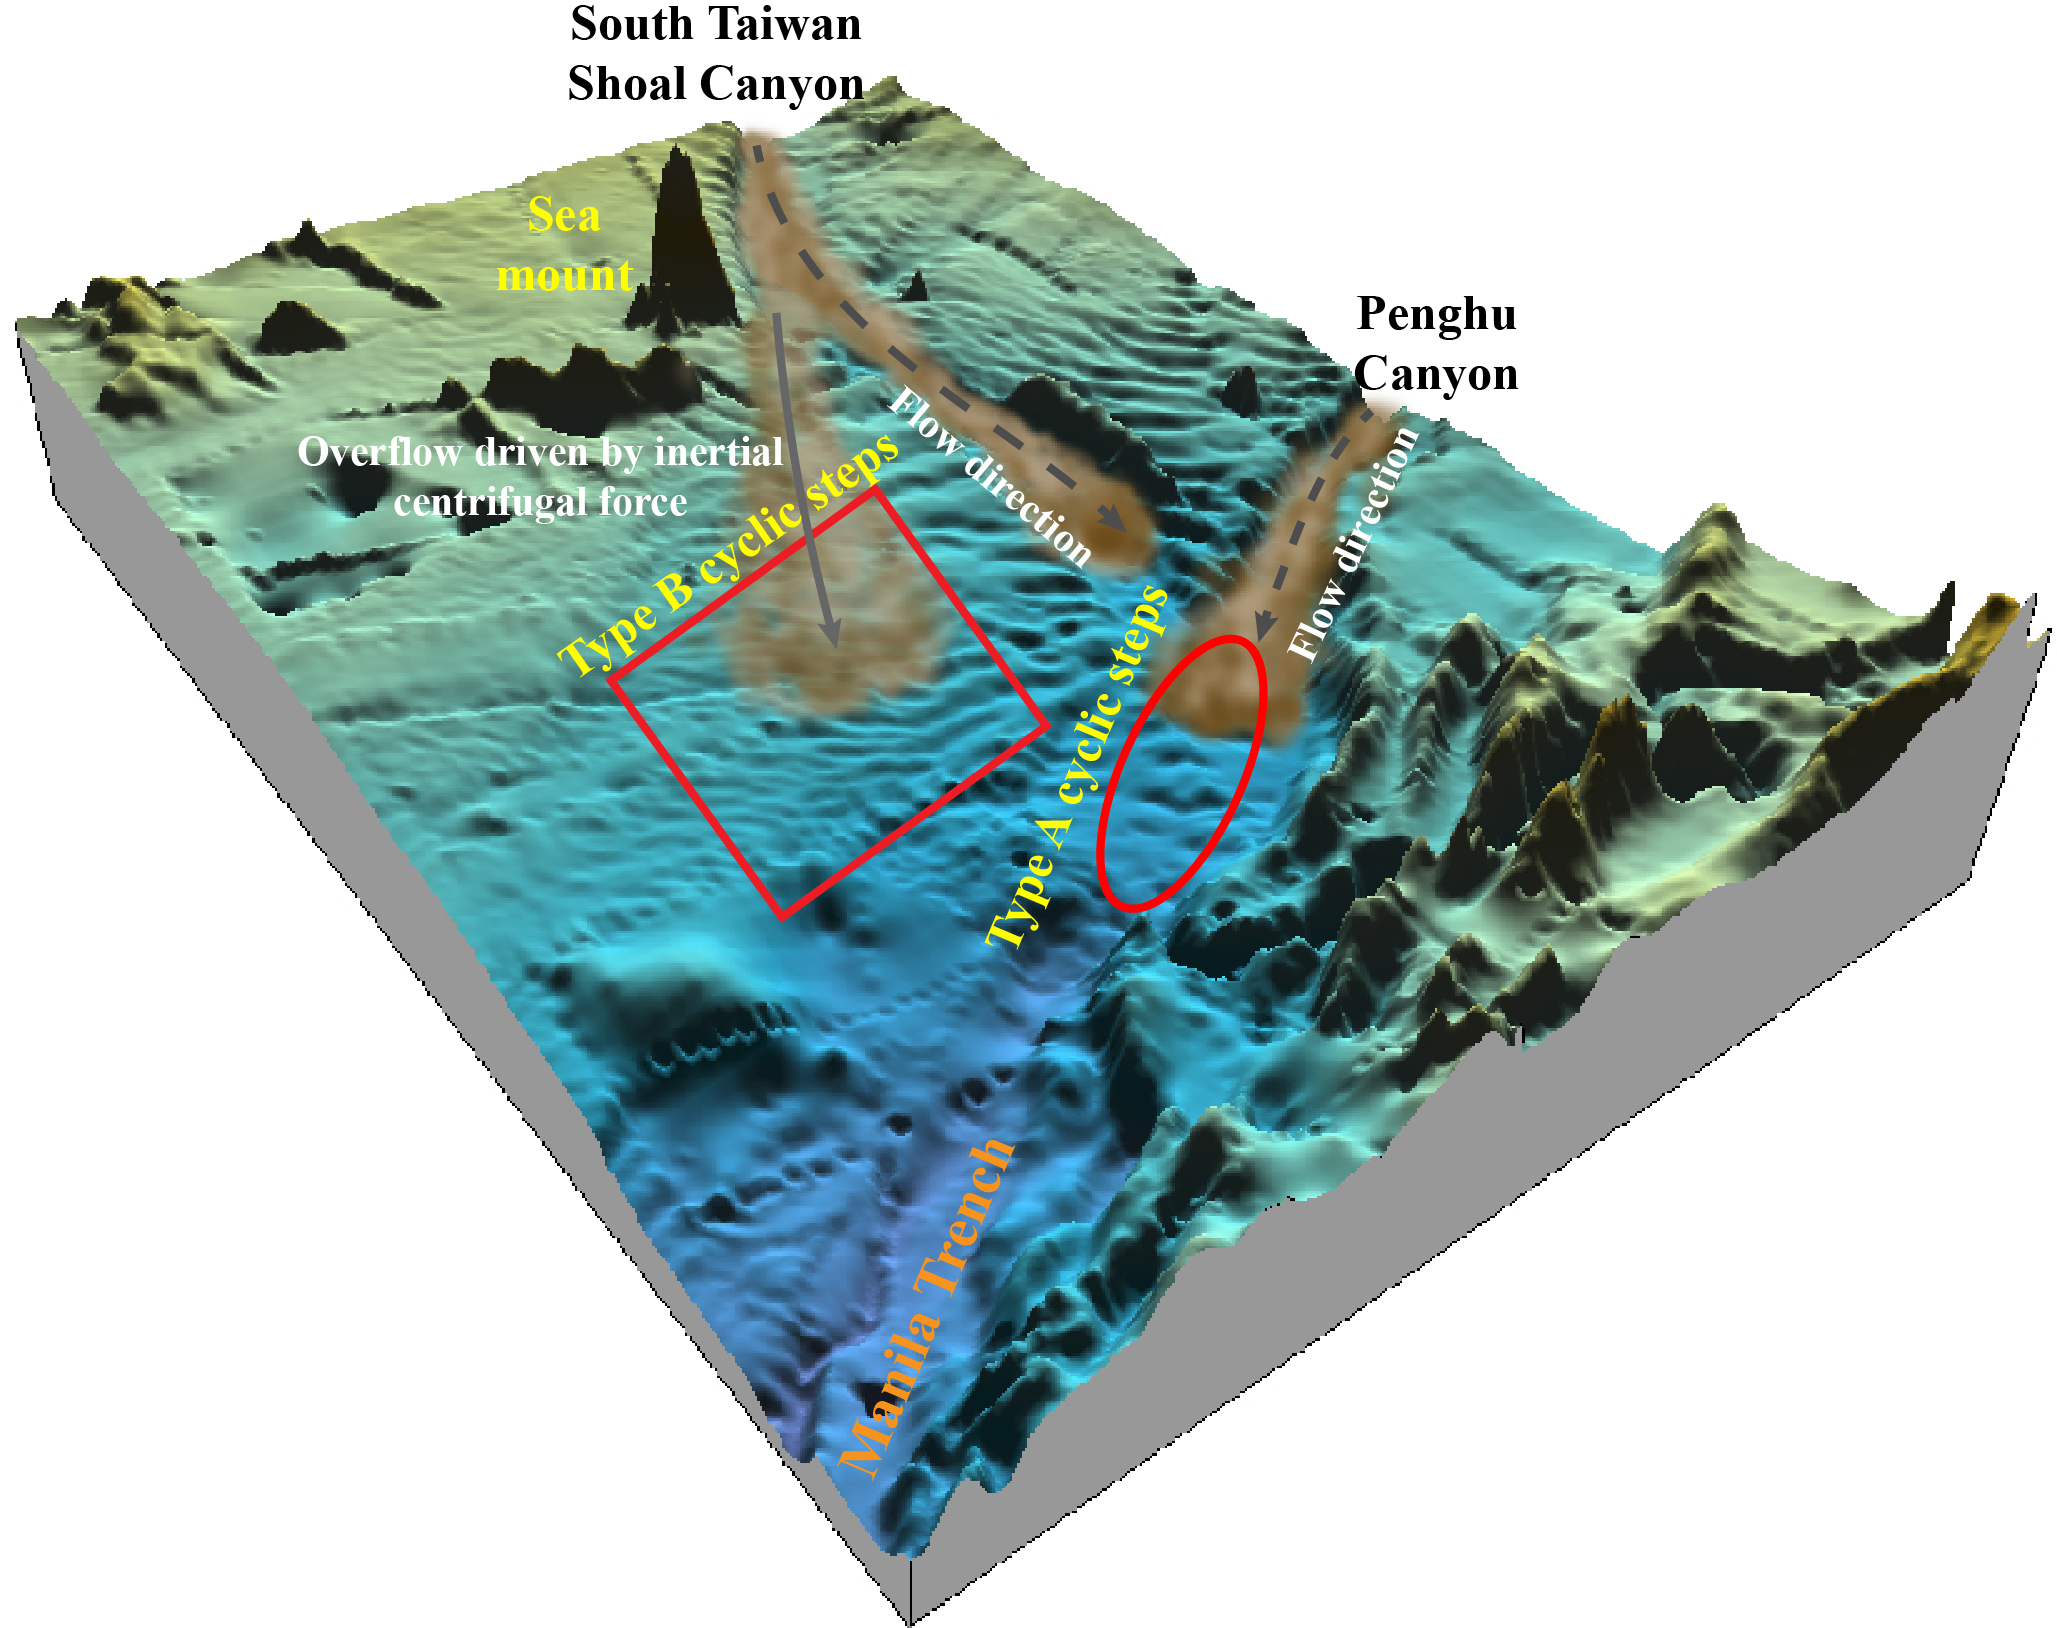
Illustration of the origin and formation mechanism of Types A and B cyclic steps.
Type B cyclic steps in this study are distributed outside the levees of the South Taiwan Shoal Canyon, adjacent to canyon bends (Figures 1, 7). At these bends, turbidity currents overflow due to superelevation (Lamb et al., 2008) and inertial centrifugal force (Kuang et al., 2014), these overspilling currents exhibit supercritical flow and typically undergo successive downslope hydraulic jumps (Cerrillo-Escoriza et al., 2024; Fildani et al., 2006). A process that generates sheet-shaped, net-depositional cyclic steps on canyon levees, as documented in the Shepard Bend of Monterey Canyon, Eel Canyon, and West Mariana Ridge (Cerrillo-Escoriza et al., 2024; Fildani et al., 2006; Lamb et al., 2008; Zhang et al., 2023). Type B cyclic steps show downslope-decreasing dimensions (Figure 3E), consistent with the traits of sediment waves formed by unconfined turbidity currents (Symons et al., 2016).
5.2 Factors controlling the Types A and B cyclic steps
Based on their location and dimensions, the cyclic steps in the study area can be categorized into two main types (Types A and B): Type A occurs downstream of canyon mouths, while Type B is distributed outside the levees of the South Taiwan Shoal Canyon, adjacent to canyon bends. In plan view, Type B cyclic steps are significantly smaller than Type A (Figure 3). Results from principal component analysis (PCA) indicate that the first three principal components (PC1, PC2, PC3) capture 98.33% of the total variance (Table 5), so these three components are the focus of subsequent analysis. PC1, explaining 85.4% of total variance, is strongly negatively correlated with step length (Lstep) (correlation coefficient: -0.86) and step height (Hstep) (-0.60; Table 5). PC2 accounts for an additional 8.1% of variance and shows strong positive correlations with water depth (0.84) and stoss side length (Lstoss) (-0.56; Table 5). PC3 explains a further 4.8% of variance, with a strong positive correlation with Hstep (0.80) and a negative correlation with Lstoss (-0.60; Table 5). The strongest correlations are observed for Lstep (-0.86 with PC1, 0.46 with PC2) and Hstep (-0.60 with PC1, 0.80 with PC3). Thus, these two parameters are prioritized for further discussion.
Table 5
| Principal component | Proportion of variance | Correlation coefficient determined from principal component analysis | |||
|---|---|---|---|---|---|
| L stoss | L step | H step | Water Depth | ||
| PC1 | 0.8536 | -0.5755 | -0.8633 | -0.6031 | 0.3982 |
| PC2 | 0.0814 | 0.5591 | 0.4589 | -0.0580 | 0.8387 |
| PC3 | 0.0483 | -0.5968 | -0.2101 | 0.7956 | 0.3714 |
Correlation coefficients determined from principal component analysis.
The two cyclic step types (Type A and Type B) are distinctly distinguishable in cross-plots of PC1 vs. PC2, PC1 vs. PC3, and PC2 vs. PC3 (Figure 8). For PC1, the absolute correlation coefficient is largest for step length (Lstep), followed by step height (Hstep). For PC2, the largest absolute correlation coefficient corresponds to water depth (Table 5). Both Types A and B cyclic steps exhibit wide variance in PC1 but relatively narrow variance in PC2, indicating a broad range of Lstep and Hstep values yet minimal variation in water depth (Table 5; Figure 8). Thus, Lstep and Hstep are the key variables driving the clustering of the two types, whereas water depth is less influential. Therefore, subsequent discussion will focus on the factors contributing to morphological differences (i.e., variations in Lstep and Hstep) between the two cyclic step types.
Figure 8
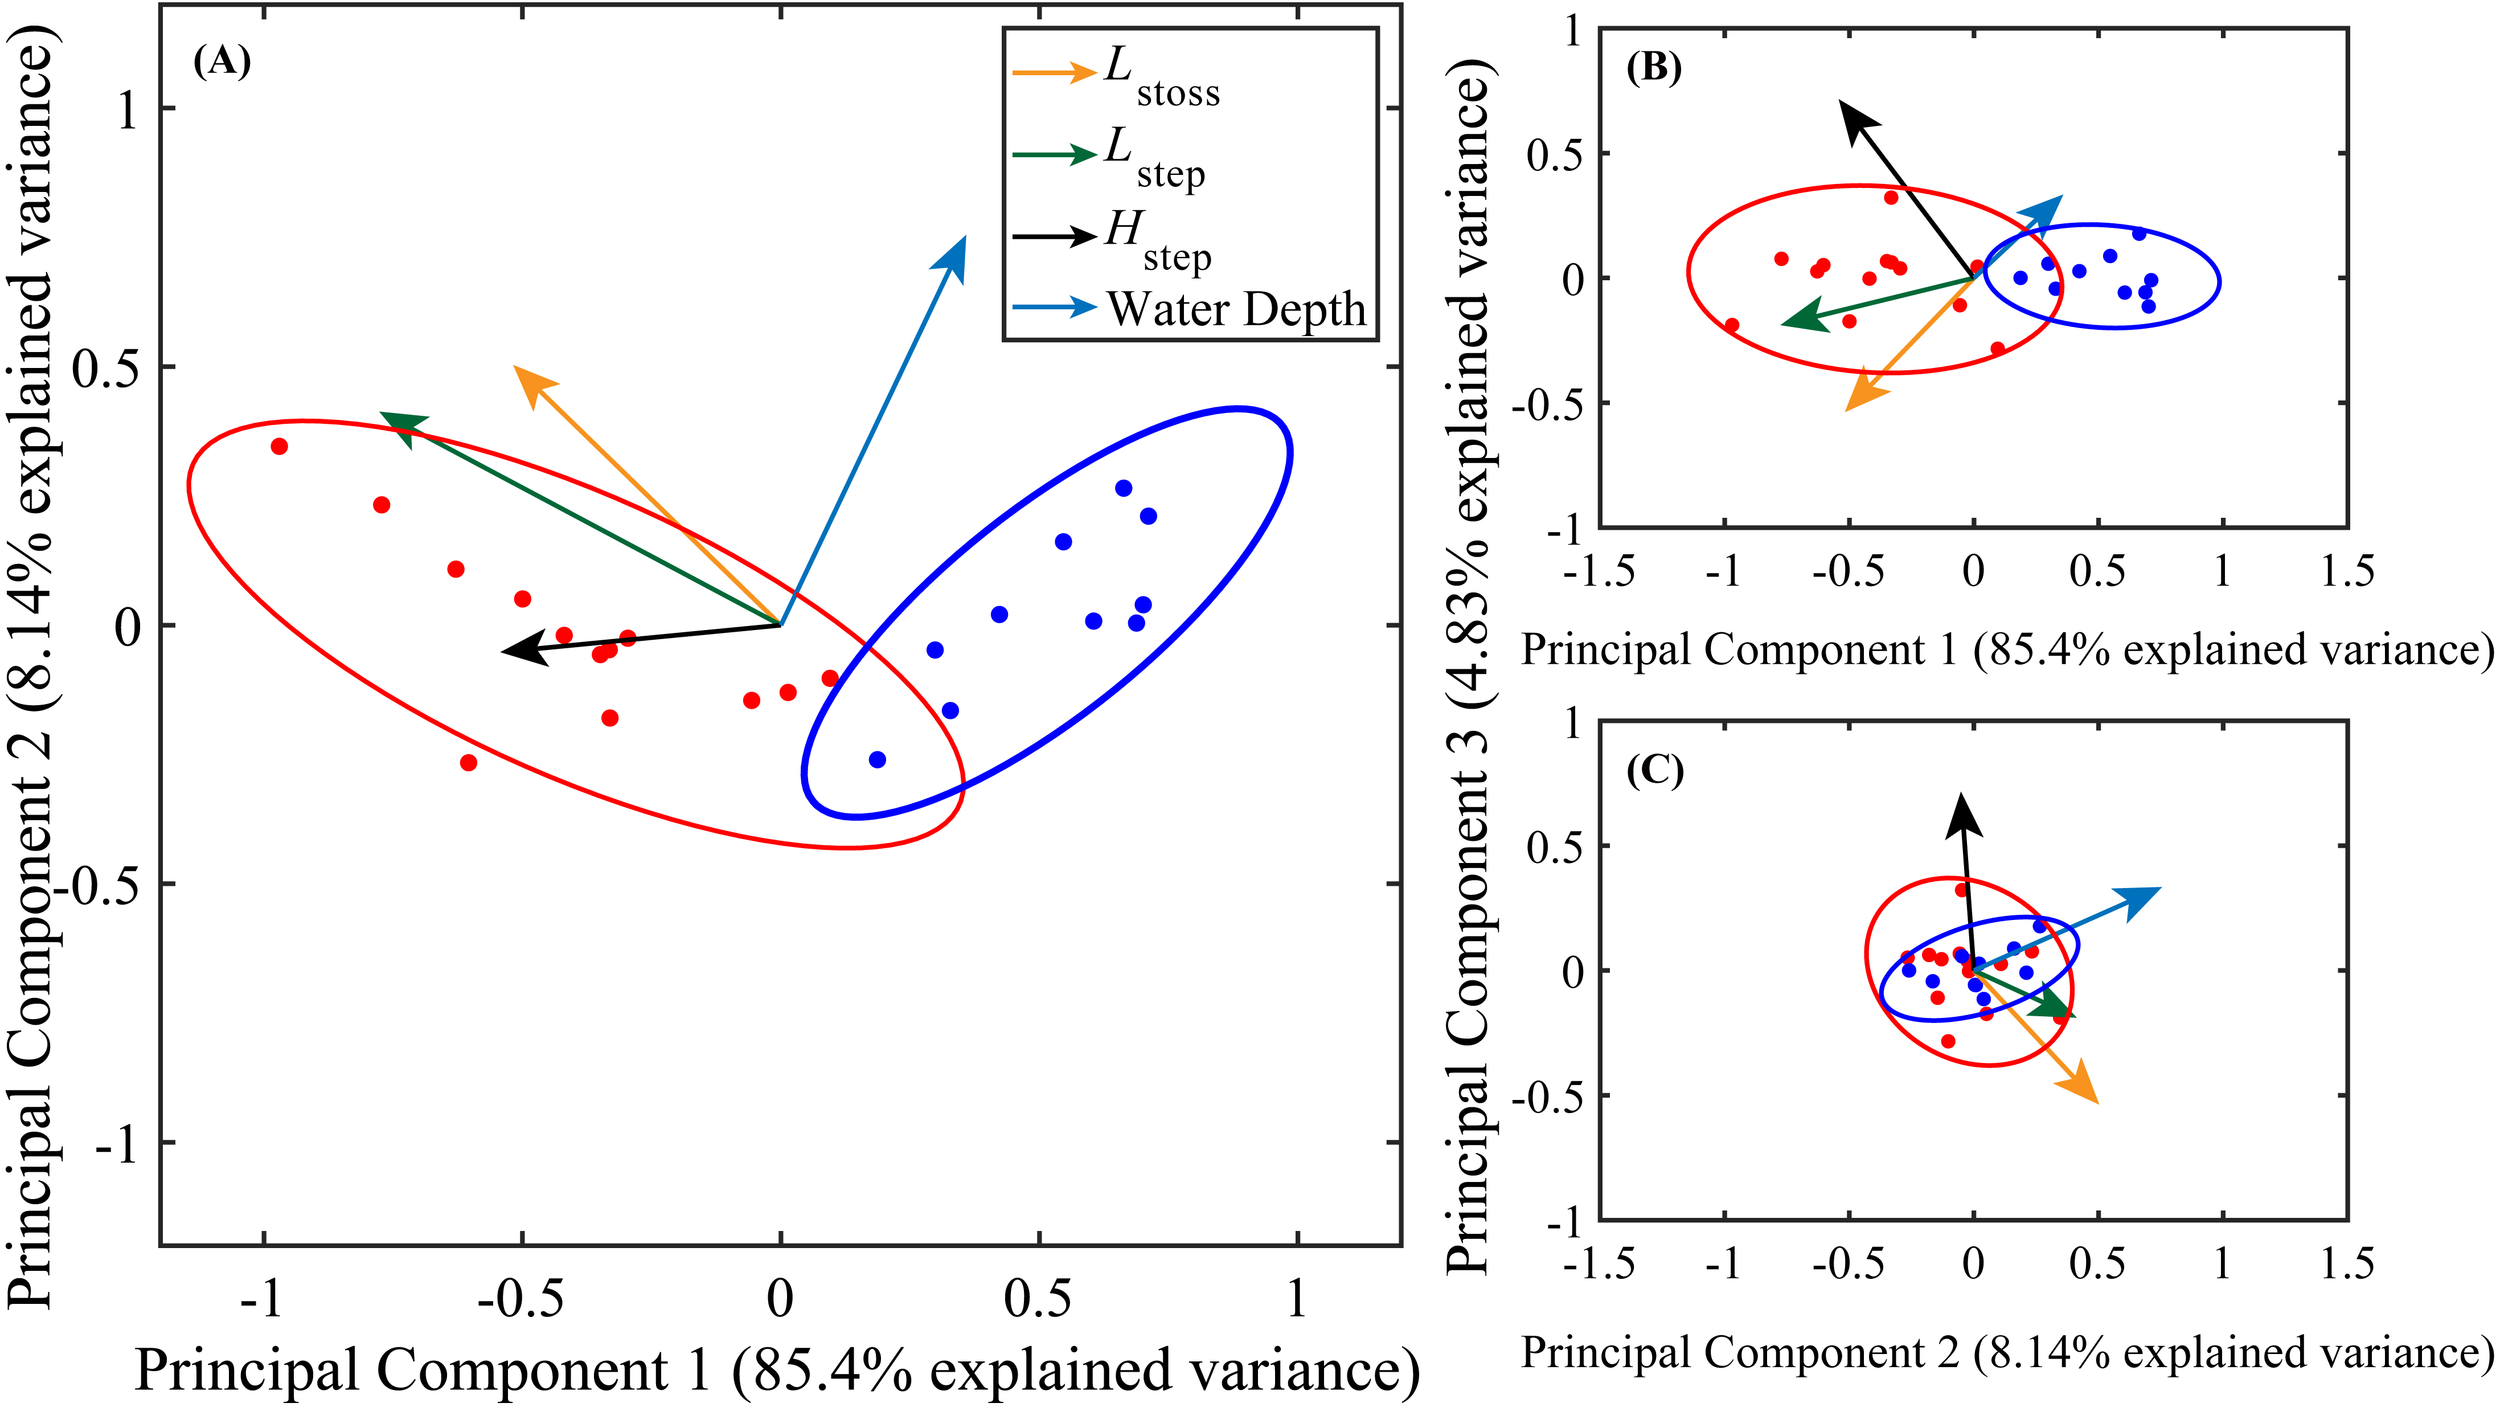
Biplots of principal component analysis. Correlation coefficients for variables are highlighted in Table 5. The two clusters (Types A and B) cyclic steps distinctly identified, marked in red and blue circle dots, respectively. The length of the arrow represents the importance of the component in the principal component. A correlation coefficient of 1 indicates perfect correlation, -1 indicates perfect negative correlation, and 0 indicates no correlation.
Figure 9 illustrates the relationship between the morphological parameters of cyclic steps (Lstep and Hstep) and the properties of turbidity currents (U1 and ΔEL). Specifically, turbidity currents crossing Type B cyclic steps exhibit significantly lower U1 (1.86 m/s vs. 2.82 m/s) and ΔEL (18.57 m vs. 34.99 m) compared to those crossing Type A. These differences in flow characteristics likely drive the distinct morphological traits of the two cyclic step types, including variations in Lstep and Hstep.
Figure 9
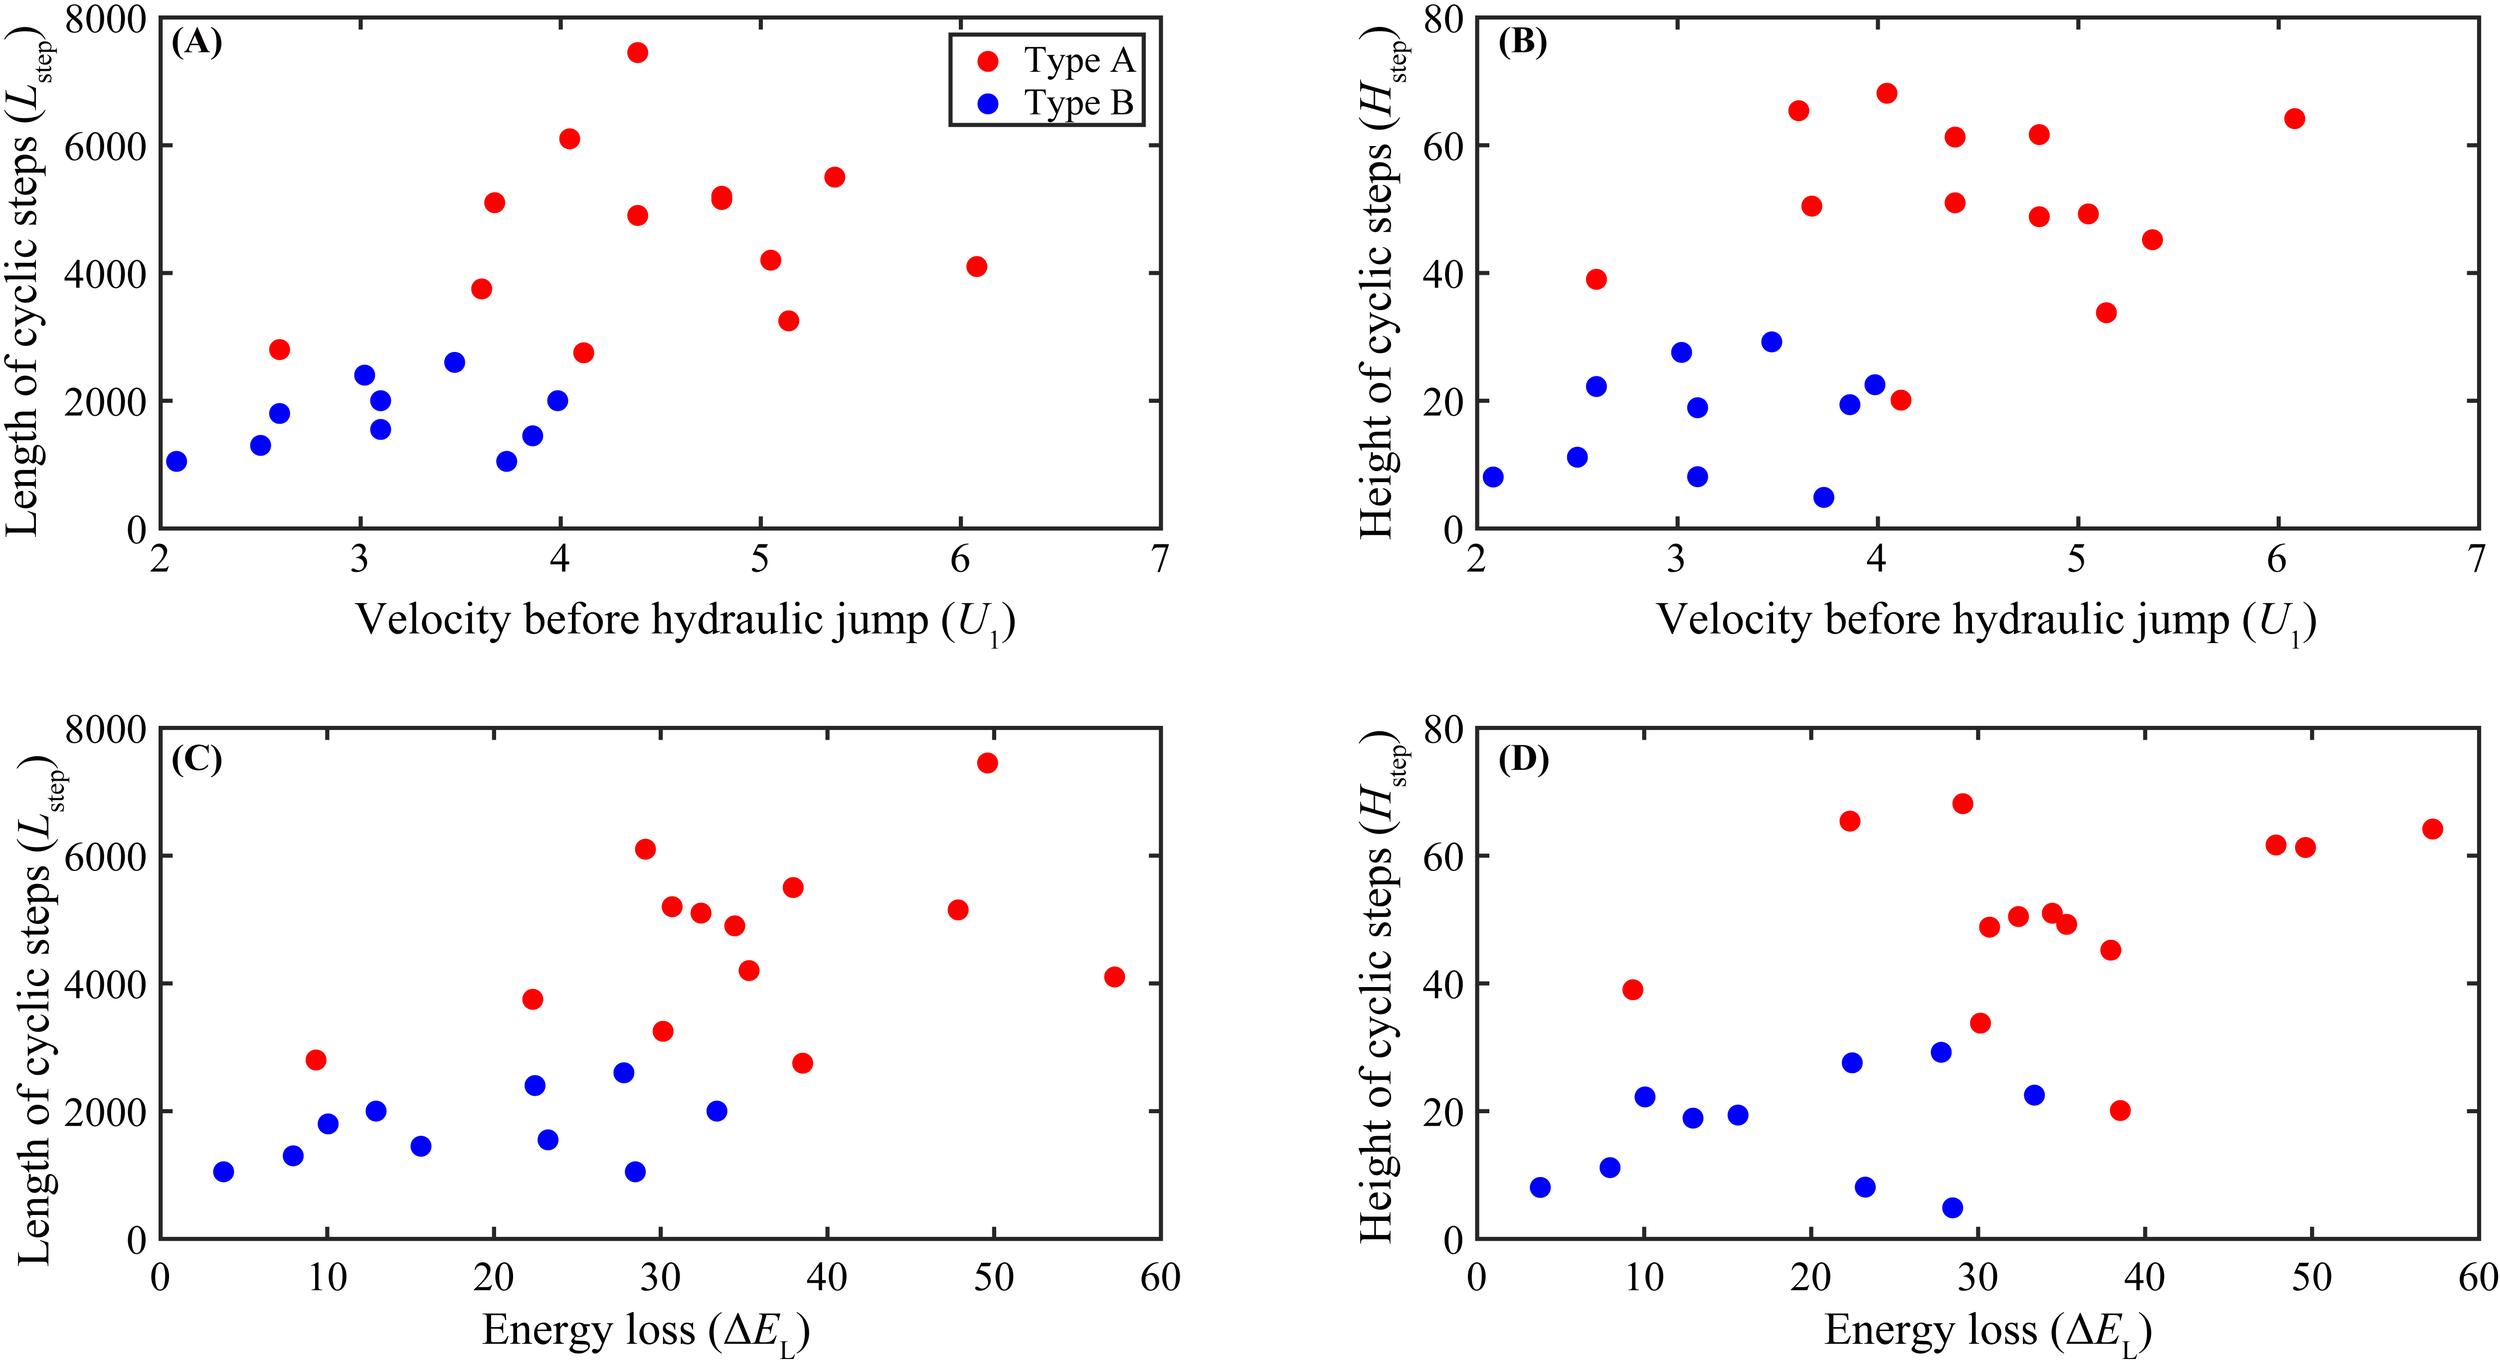
Graphical plots highlighting the morphological characteristics and properties of turbidity currents in the study area. (A, B) showing relationships of length of cyclic steps (Lstep) and height of cyclic steps (Hstep) versus velocity of turbidity currents (U1). (C, D) showing relationships of length of cyclic steps (Lstep) and height of cyclic steps (Hstep) versus loss of energy in turbidity currents (ΔEL). Red and blue circle dots denote Types A and B cyclic steps, respectively.
The flow regime of turbidity currents is strongly influenced by slope gradient, sediment concentration, bed roughness, and sediment grain size (Kostic, 2011). Recent physical experiments have shown that the abrupt loss of lateral confinement in a canyon triggers turbidity current relaxation manifested as a velocity decrease, marking the transition from confined to unconfined flow (de Leeuw et al., 2016; Pohl et al., 2019). Additionally, spatiotemporal variations in flow velocity regulate the sediment transport and deposition capacity of turbidity currents (Yang et al., 2024). In this study, Type A cyclic steps are net-erosional features associated with confined turbidity currents flowing along submarine canyons, whereas Type B cyclic steps are net-depositional and form in open settings under unconfined turbidity currents. This distinction corresponds to a dramatic difference in the flow regime of turbidity currents interacting with the two cyclic step types. We hypothesize that the significant disparities in the flow characteristics of turbidity currents across Types A and B cyclic steps are linked to their respective confined and unconfined seafloor environments.
In summary, the difference in flow properties between confined and unconfined turbidity currents is the primary control on the morphological differences between Types A and B cyclic steps.
5.3 New submarine canyon-channel systems are being formed
Submarine canyon-channels act as critical conduits for transporting large volumes of sediment and particulate matter across continental margins to the deep ocean (Allen, 2008), numerous experiments and numerical simulations have investigated the development and formation of such channels (e.g., Hall et al., 2008; Cantelli et al., 2011; Yu, 2011). A key hypothesis is that incipient channels originate from net-erosional cyclic steps, which signal the initiation of a fully developed conduit (Fildani et al., 2006; Kostic and Parker, 2006; Kostic, 2011) and Fildani et al. (2013) used seismic data to document channel evolution, demonstrating that channels form during an initial erosive phase, driven by continuous turbidity current erosion (e.g., via net-erosional cyclic steps) and accompanied by levee aggradation, as observed in the Lucia Chica channel system. Building on this framework, we propose a three-stage model for the progressive development of mature canyon-channels in the Manila Trench: Stage I (Incipient Erosion), where turbidity currents undergo hydraulic jumps to generate a series of net-erosional cyclic steps (i.e., Type A cyclic steps) (Figure 10A); Stage II (Channel Incision and Levee Construction), in which turbidity currents continue eroding the seabed (deepening the incipient channel) while promoting levee aggradation (widening and stabilizing channel margins) (Figure 10B); and Stage III (Mature Conduit Formation), where fully developed canyon-channel systems evolve and connect to the Manila Trench (Figure 10C). This formation process is expected to alter the pattern of material transport and deposition to the deep sea within the Manila Trench.
Figure 10
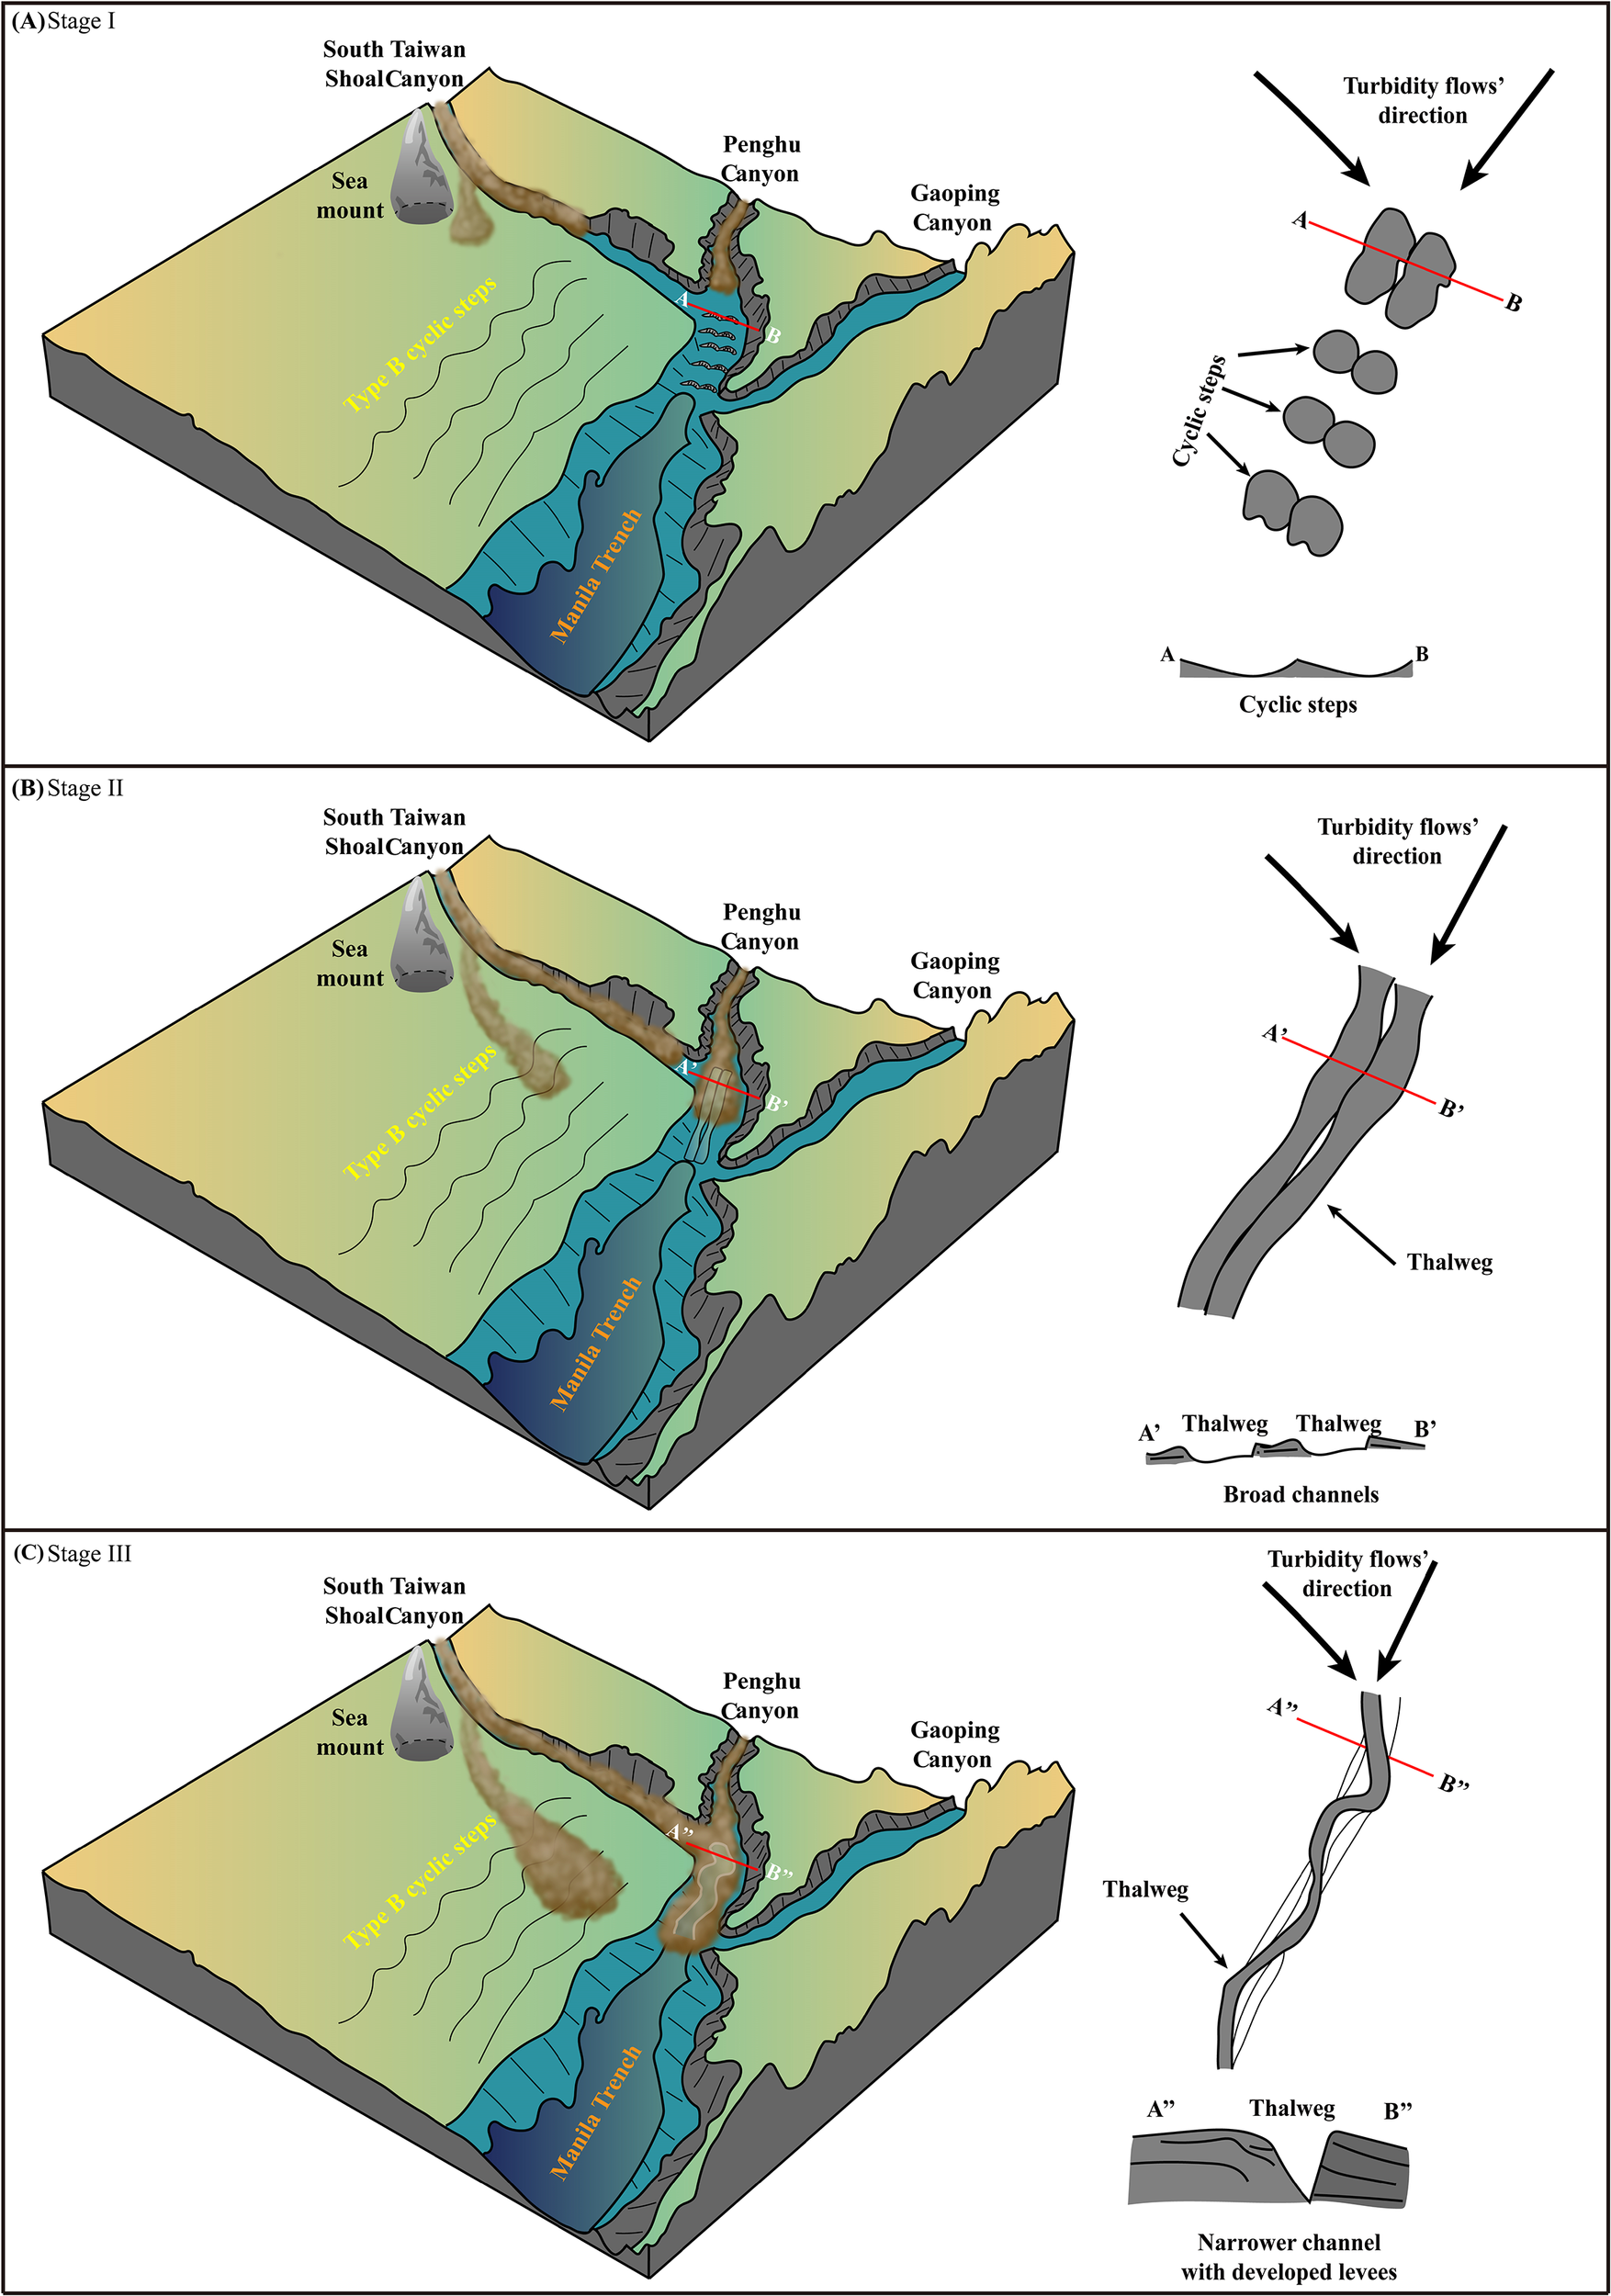
Illustration of the formation mechanism of new submarine canyon-channel systems at the head of the Manila Trench. The diagram of time-step channel evolution of slope channels is modified from (Fildani et al., 2013).
6 Conclusions
High-resolution multibeam bathymetry data allowed us to characterize the morphology and geometric parameters of two cyclic step types near the Manila Trench, quantify the flow properties of turbidity currents traversing these cyclic steps, and focus on their formation mechanisms and morphological controlling factors, with additional predictions of their future evolution. The main conclusions of this study are as follows:
-
Based on location and dimensions, two cyclic step types (13 net-erosional Type A and 10 net-depositional Type B) were identified near the Manila Trench, specifically downstream of the South Taiwan Shoal Canyon and Penghu Canyon.
-
Principal component analysis (PCA) revealed distinct clustering of Types A and B cyclic steps, and correlation coefficients with principal components indicated that cyclic step length (Lstep) and height (Hstep) are the key variables driving this clustering.
-
Type A cyclic steps form under the control of submarine confined turbidity currents, whereas Type B cyclic steps are governed by unconfined turbidity currents that overflow canyon bends due to superelevation. The primary factor driving morphological differences between the two types is the significant disparity in flow properties of the confined versus unconfined turbidity currents traversing them.
-
Under sustained erosion by turbidity currents, Type A (net-erosional) cyclic steps are expected to evolve into new submarine canyon-channel systems, which will alter the pattern of material transport and deposition to the deep sea within the Manila Trench.
Statements
Data availability statement
The original contributions presented in the study are included in the article/supplementary material. Further inquiries can be directed to the corresponding author.
Author contributions
YY: Conceptualization, Data curation, Formal Analysis, Funding acquisition, Investigation, Methodology, Validation, Visualization, Writing – original draft, Writing – review & editing. SZ: Methodology, Writing – review & editing, Formal Analysis, Investigation. SL: Conceptualization, Formal Analysis, Methodology, Writing – review & editing, Investigation. KY: Conceptualization, Formal Analysis, Validation, Writing – review & editing, Data curation, Investigation. XQ: Resources, Formal Analysis, Project administration, Writing – review & editing, Funding acquisition, Validation, Conceptualization, Methodology, Investigation. CW: Formal Analysis, Methodology, Writing – review & editing, Conceptualization, Data curation. JX: Conceptualization, Data curation, Funding acquisition, Methodology, Project administration, Resources, Supervision, Visualization, Writing – review & editing, Writing – original draft.
Funding
The author(s) declared that financial support was received for this work and/or its publication. This study was supported by the Research Innovation Fund of Tianjin Research Institute for Water Transport Engineering, Ministry of Transport, China (Grant No. TKS20250704), the National Natural Science Foundation of China (Grant Nos. 42106198, 42350710199) and the Guangdong Provincial Key Discipline Research Capacity Enhancement Initiative (Grant Nos. 2024ZDJS060, 2024ZDJS053).
Acknowledgments
This study was supported by the Research Innovation Fund of Tianjin Research Institute for Water Transport Engineering, Ministry of Transport, China (Grant No. TKS20250704), the National Natural Science Foundation of China (Grant Nos. 42106198, 42350710199) and the Guangdong Provincial Key Discipline Research Capacity Enhancement Initiative (Grant Nos. 2024ZDJS060, 2024ZDJS053). We would like to thank everyone of the R/V “Dongfanghong 3” who contributed to the bathymetric survey in the Manila Trench.
Conflict of interest
The author(s) declared that this work was conducted in the absence of any commercial or financial relationships that could be construed as a potential conflict of interest.
The reviewer YL declared a past collaboration with the authors YY to the handling editor.
Generative AI statement
The author(s) declared that generative AI was not used in the creation of this manuscript.
Any alternative text (alt text) provided alongside figures in this article has been generated by Frontiers with the support of artificial intelligence and reasonable efforts have been made to ensure accuracy, including review by the authors wherever possible. If you identify any issues, please contact us.
Publisher’s note
All claims expressed in this article are solely those of the authors and do not necessarily represent those of their affiliated organizations, or those of the publisher, the editors and the reviewers. Any product that may be evaluated in this article, or claim that may be made by its manufacturer, is not guaranteed or endorsed by the publisher.
References
1
Allen P. A. (2008). From landscapes into geological history. Nature451, 274–276. doi: 10.1038/nature06586
2
Cantelli A. Pirmez C. Johnson S. Parker G. (2011). Morphodynamic and stratigraphic evolution of self-channelized subaqueous fans emplaced by turbidity currents. J. Sedimentary Res.81, 233–247. doi: 10.2110/jsr.2011.20
3
Cartigny M. J. B. Postma G. van den Berg J. H. Mastbergen D. R. (2011). A comparative study of sediment waves and cyclic steps based on geometries, internal structures and numerical modeling. Mar. Geology.280, 40–56. doi: 10.1016/j.margeo.2010.11.006
4
Cartigny M. J. B. Ventra D. Postma G. van Den Berg J. H. Venditti J. (2014). Morphodynamics and sedimentary structures of bedforms under supercritical-flow conditions: New insights from flume experiments. Sedimentology61, 712–748. doi: 10.1111/sed.12076
5
Cerrillo-Escoriza J. Lobo F. J. Puga-Bernabéu Á. Bárcenas P. Mendes I. Pérez-Asensio J. N. et al . (2024). Variable downcanyon morphology controlling the recent activity of shelf-incised submarine canyons (Alboran Sea, western Mediterranean). Geomorphology453, 109127. doi: 10.1016/j.geomorph.2024.109127
6
Chanson H. . (2024). Hydraulics of open channel flow, an introduction basic principles, sediment motion. Hydraulic modelling. (Oxford, UK: Design of Hydraulic Structure, ButterworthHeinemann). pp. 53–63.
7
Clare M. A. Yeo I. A. Watson S. Wysoczanski R. Seabrook S. Mackay K. et al . (2023). Fast and destructive density currents created by ocean-entering volcanic eruptions. Science. 381, 1085–1092. doi: 10.1126/science.adi3038
8
Covault J. A. Kostic S. Paull C. K. Ryan H. F. Fildani A. Talling P. (2014). Submarine channel initiation, filling and maintenance from sea-floor geomorphology and morphodynamic modelling of cyclic steps. Sedimentology61, 1031–1054. doi: 10.1111/sed.12084
9
Covault J. A. Kostic S. Paull C. K. Sylvester Z. Fildani A. (2016). Cyclic steps and related supercritical bedforms: Building blocks of deep-water depositional systems, western North America. Marine Geology393, 4–20. doi: 10.1016/j.margeo.2016.12.009
10
Damuth J. E. (1979). Migrating sediment waves created by turbidity currents in the northern South China Basin. Geology. 7, 520–523. doi: 10.1130/0091-7613(1979)7<520:MSWCBT>2.0.CO;2
11
de Leeuw J. Eggenhuisen J. T. Cartigny M. J. (2016). Morphodynamics of submarine channel inception revealed by new experimental approach. Nat. Commun.7, 10886. doi: 10.1038/ncomms10886
12
Ding W. Li J. Han X. Suess E. Li M. (2010). Morphotectonics and formation of the Taiwan Bank Canyon, Southwest offshore Taiwan Island. J. Oceanogr. Mar. Sci.14, 65–78. doi: 10.5897/JOMS.9000015
13
Dorrell R. M. Peakall J. Sumner E. J. Parsons D. R. Darby S. E. Wynn R. B. et al . (2016). Flow dynamics and mixing processes in hydraulic jump arrays: Implications for channel-lobe transition zones. Mar. Geology381, 181–193. doi: 10.1016/j.margeo.2016.09.009
14
Fan C. Tian Z. Cui K. Huang J. Bian S. Yang L. et al . (2025). A new discovery of source contribution and transport mechanism of clay minerals in Taiwan Canyon-Manila Trench. Deep-Sea Research I224, 104571. doi: 10.1016/j.dsr.2025.104571
15
Fildani A. Hubbard S. M. Covault J. A. Maier K. L. Romans B. W. Traer M. et al . (2013). Erosion at inception of deep-sea channels. Mar. Petroleum Geology.41, 48–61. doi: 10.1016/j.marpetgeo.2012.03.006
16
Fildani A. Normark W. R. Kostic S. Parker G. (2006). Channel formation by flow stripping: large-scale scour features along the Monterey East Channel and their relation to sediment waves. Sedimentology53, 1265–1287. doi: 10.1111/j.1365-3091.2006.00812.x
17
Hall B. Meiburg E. Kneller B. (2008). Channel formation by turbidity currents: Navier–Stokes-based linear stability analysis. J. Fluid Mechanics.615, 185–210. doi: 10.1017/s0022112008003467
18
Jolliffe I. (2014). “ Principal component analysis,” in Wiley StatsRef: Statistics Reference Online. eds BalakrishnanN.ColtonT.EverittB.PiegorschW.RuggeriF.TeugelsJ. L.. doi: 10.1002/9781118445112.stat06472
19
Konsoer K. Zinger J. Parker G. (2013). Bankfull hydraulic geometry of submarine channels created by turbidity currents: Relations between bankfull channel characteristics and formative flow discharge. J. Geophysical Research: Earth Surface.118, 216–228. doi: 10.1029/2012jf002422
20
Kostic S. (2011). Modeling of submarine cyclic steps: Controls on their formation, migration, and architecture. Geosphere7, 294–304. doi: 10.1130/ges00601.1
21
Kostic S. Parker G. (2006). The response of turbidity currents to a canyon–fan transition: internal hydraulic jumps and depositional signatures. J. Hydraulic Res.44, 631–653. doi: 10.1080/00221686.2006.9521713
22
Kostic S. Sequeiros O. Spinewine B. Parker G. (2010). Cyclic steps: A phenomenon of supercritical shallow flow from the high mountains to the bottom of the ocean. J. Hydro-environment Res.3, 167–172. doi: 10.1016/j.jher.2009.10.002
23
Kuang Z. Zhong G. Wang L. Guo Y. (2014). Channel-related sediment waves on the eastern slope offshore Dongsha Islands, northern South China Sea. J. Asian Earth Sci.79, 540–551. doi: 10.1016/j.jseaes.2012.09.025
24
Lallemand S. (2016). Philippine Sea Plate inception, evolution, and consumption with special emphasis on the early stages of Izu-Bonin-Mariana subduction. Prog. Earth Planetary Science.3, 15. doi: 10.1186/s40645-016-0085-6
25
Lamb M. P. Parsons J. D. Mullenbach B. L. Finlayson D. P. Orange D. L. Nittrouer C. A. (2008). Evidence for superelevation, channel incision, and formation of cyclic steps by turbidity currents in Eel Canyon, California. Geological Soc. America Bulletin.120, 463–475. doi: 10.1130/b26184.1
26
Li L. Gong C. (2018). Gradual transition from net erosional to net depositional cyclic steps along the submarine distributary channel Thalweg in the Rio Muni Basin: A joint 3-D seismic and numerical approach. J. Geophysical Research: Earth Surface.123, 2087–2106. doi: 10.1029/2017jf004513
27
Li S. Li W. Alves T. M. Wang J. Feng Y. Sun J. et al . (2020). Large-scale scours formed by supercritical turbidity currents along the full length of a submarine canyon, northeast South China Sea. Mar. Geology424. doi: 10.1016/j.margeo.2020.106158
28
Mosher D. C. Campbell D. C. Gardner J. V. Piper D. J. W. Chaytor J. D. Rebesco M. (2017). The role of deep-water sedimentary processes in shaping a continental margin: The Northwest Atlantic. Mar. Geology.393, 245–259. doi: 10.1016/j.margeo.2017.08.018
29
Piper D. J. W. Savoye B. (1993). Processes of late Quaternary turbidity current flow and deposition on the Var deep-sea fan, north-west Mediterranean Sea. Sedimentology40, 557–582. doi: 10.1111/j.1365-3091.1993.tb01350.x
30
Pohl F. Eggenhuisen J. T. Tilston M. Cartigny M. J. B. (2019). New flow relaxation mechanism explains scour fields at the end of submarine channels. Nat. Commun.10, 4425. doi: 10.1038/s41467-019-12389-x
31
Qiu Q. Li L. Hsu Y.-J. Wang Y. Chan C.-H. Switzer A. D. (2019). Revised earthquake sources along Manila trench for tsunami hazard assessment in the South China Sea. Natural Hazards Earth System Sci.19, 1565–1583. doi: 10.5194/nhess-19-1565-2019
32
Slootman A. Cartigny M. J. B. (2020). Cyclic steps: Review and aggradation-based classification. Earth-Science Rev.201, 102949. doi: 10.1016/j.earscirev.2019.102949
33
Sun Y. Wang D. Canals M. Alves T. M. Wang W. Zhu Y. et al . (2024). Bedform evolution along a submarine canyon in the South China Sea: New insights from an autonomous underwater vehicle survey. Sedimentology71, 793–826. doi: 10.1111/sed.13152
34
Symons W. O. Sumner E. J. Talling P. J. Cartigny M. J. B. Clare M. A. (2016). Large-scale sediment waves and scours on the modern seafloor and their implications for the prevalence of supercritical flows. Mar. Geology.371, 130–148. doi: 10.1016/j.margeo.2015.11.009
35
Talling P. J. Paull C. K. Piper D. J. W. (2013). How are subaqueous sediment density flows triggered, what is their internal structure and how does it evolve? Direct observations from monitoring of active flows. Earth-Science Rev.125, 244–287. doi: 10.1016/j.earscirev.2013.07.005
36
Talling P. J. Wynn R. B. Masson D. G. Frenz M. Cronin B. T. Schiebel R. et al . (2007). Onset of submarine debris flow deposition far from original giant landslide. Nature450, 541–544. doi: 10.1038/nature06313
37
Tian Z. Guo X. Huang J. Xu C. Song L. Yue J. (2026). Seasonal and spatial variability of marine nepheloid layers in the deep South China Sea. Deep Sea Research Part II. 105600. doi: 10.1016/j.dsr2.2026.105600
38
Tubau X. Lastras G. Canals M. Micallef A. Amblas D. (2013). Significance of the fine drainage pattern for submarine canyon evolution: The Foix Canyon System, Northwestern Mediterranean Sea. Geomorphology184, 20–37. doi: 10.1016/j.geomorph.2012.11.007
39
Xu J. P. Sequeiros O. E. Noble M. A. (2014). Sediment concentrations, flow conditions, and downstream evolution of two turbidity currents, Monterey Canyon, USA. Deep Sea Res. Part I: Oceanographic Res. Papers.89, 11–34. doi: 10.1016/j.dsr.2014.04.001
40
Yang Y. Wang D. Kneller B. Zhong G. Yu K. Wang M. et al . (2024). How does plastic litter accumulate in submarine canyons? Geophysical Res. Lett.51, e2024GL110767. doi: 10.1029/2024GL110767
41
Yu B. (2011). Experimental study on the forming conditions of subaqueous depositional channels by turbidity currents. J. Sedimentary Res.81, 376–391. doi: 10.2110/jsr.2011.16
42
Yu H.-S. Hong E. (2006). Shifting submarine canyons and development of a foreland basin in SW Taiwan: controls of foreland sedimentation and longitudinal sediment transport. J. Asian Earth Sci.27, 922–932. doi: 10.1016/j.jseaes.2005.09.007
43
Zhang G. Li S. Li W. Wang X. Chen D. Dong D. et al . (2023). Origin of submarine canyon-channel systems along the middle segment of West Mariana Ridge, Philippine Sea. J. Oceanology Limnology.41, 881–896. doi: 10.1007/s00343-022-1384-y
44
Zhang S. Zhu J. Jia Y. Li S. Chen R. Chen X. et al . (2022). Submarine small-scale features of cyclic steps in the Penghu Canyon: implications for the migration of canyon. J. Mar. Sci. Eng.10, 1301. doi: 10.3390/jmse10091301
45
Zhong G. Cartigny M. J. B. Kuang Z. Wang L. (2015). Cyclic steps along the South Taiwan Shoal and West Penghu submarine canyons on the northeastern continental slope of the South China Sea. Geological Soc. America Bulletin.127, 804–824. doi: 10.1130/b31003.1
Summary
Keywords
cyclic steps, Manila trench, northern South China Sea, submarine canyons, turbidity currents
Citation
Yang Y, Zhang S, Li S, Yu K, Qian X, Wang C and Xu J (2026) Different types of cyclic steps nearby Manila Trench of northern South China Sea and analysis of forming mechanism. Front. Mar. Sci. 13:1756034. doi: 10.3389/fmars.2026.1756034
Received
28 November 2025
Revised
13 January 2026
Accepted
13 January 2026
Published
28 January 2026
Volume
13 - 2026
Edited by
Zhuangcai Tian, China University of Mining and Technology, China
Reviewed by
Yang Lu, Ocean University of China, China
Dongrui Han, Zhejiang University, China
Updates
Copyright
© 2026 Yang, Zhang, Li, Yu, Qian, Wang and Xu.
This is an open-access article distributed under the terms of the Creative Commons Attribution License (CC BY). The use, distribution or reproduction in other forums is permitted, provided the original author(s) and the copyright owner(s) are credited and that the original publication in this journal is cited, in accordance with accepted academic practice. No use, distribution or reproduction is permitted which does not comply with these terms.
*Correspondence: Xuesheng Qian, qianxuesheng@gzmtu.edu.cn
Disclaimer
All claims expressed in this article are solely those of the authors and do not necessarily represent those of their affiliated organizations, or those of the publisher, the editors and the reviewers. Any product that may be evaluated in this article or claim that may be made by its manufacturer is not guaranteed or endorsed by the publisher.