Abstract
Marine fisheries play a dual role in global warming as both a “carbon source” and “carbon sink.” This study analyzed carbon emissions from marine fisheries in Shandong Province from 2010 to 2022 by integrating carbon accounting, extended Kaya-LMDI decomposition, and System Dynamics (SD) modeling. The results reveal a distinct temporal trend characterized by an initial increase followed by a gradual decline in net carbon emissions, while marine carbon sinks increased steadily over the study period. Marine capture fisheries consistently remained the dominant source of total carbon emissions. Decomposition analysis reveals that economic scale and population were the primary drivers of carbon emission growth, while carbon intensity exerted a smaller but positive effect, whereas improvements in energy intensity and industrial structure contribute to emission reduction, highlighting the importance of energy efficiency improvement and industrial structural adjustment. Using a validated SD model to project trends from 2023 to 2035, we simulated three scenarios: Baseline (BS), High-Growth (HG), and Low-Carbon Development (LD) scenarios. The results show that the low-carbon development scenario achieves the most pronounced reduction in net carbon emissions, driven by simultaneous declines in capture emissions and a strong enhancement of carbon sink capacity from shellfish and algae aquaculture. In contrast, the baseline and high-growth scenarios exhibit relatively weaker mitigation effects. Overall, this study provides quantitative evidence and a strategic roadmap for advancing the green, sustainable transition of marine fisheries in Shandong Province, China.
1 Introduction
The AR6 Synthesis Report of the Intergovernmental Panel on Climate Change highlights that global warming is intensifying. Between 2011 and 2020, the global average surface temperature increased by approximately 1.1°C compared to the pre-industrial period (1850-1900), accompanied by a significant rise in the frequency and intensity of extreme weather and climate events. These changes have caused widespread adverse impacts and losses to natural systems and human society. The report also identifies carbon dioxide as the main driver of climate change, primarily emitted from fossil fuel combustion and industrial activities (IPCC, 2023).
In response, many countries have introduced carbon emission reduction policies and announced carbon neutrality targets (Lin, 2022). In September 2020, China declared at the 75th United Nations General Assembly its aim to reach peak carbon emissions before 2030 and achieve carbon neutrality by 2060. As a major agricultural country, China’s agricultural activities contribute significantly to its greenhouse gas emissions. Fisheries (including aquaculture), as an important agricultural sector, are particularly energy-intensive, primarily due to fuel consumption in marine vessel operations and energy use in aquatic product processing (Li et al., 2023a). Numerous studies have shown that fisheries account for a considerable share of agricultural carbon emissions in China (Yan, 2023; Li et al., 2018; Ye, 2024), making them a critical source of carbon emissions within the agricultural sector. Meanwhile, recent studies indicate that digitalization has become an important driver of high-quality marine economic development (Shen et al., 2025). In this context, examining the carbon emission characteristics of marine fisheries and promoting their low-carbon transformation is essential for achieving China’s dual carbon goals. Moreover, marine fisheries exhibit dual characteristics as both carbon sources and carbon sinks: they generate carbon emissions during production while simultaneously absorbing and storing CO2 through aquatic organisms such as shellfish and algae (Jin et al., 2024). Therefore, assessing the carbon emission characteristics of marine fisheries and promoting their low-carbon transformation is essential for achieving China’s dual carbon goals.
Recent systematic studies on marine fishery carbon emissions at the national and regional levels have primarily focused on three aspects: carbon emission simulation, identification and decomposition of driving factors, and carbon emission reduction path simulation under different scenarios.
First, concerning carbon emission simulation, existing studies primarily focus on quantifying energy consumption in the fishery sector. For example, Xu et al. (2007) analyzed the energy consumption of fisheries and found that the capture fishery is the main energy-consuming sector, representing a significant portion of total agricultural energy. Zhang et al. (2010) estimated CO2 emissions from fishing vessels and found that marine capture vessels account for 81% of total emissions from Chinese fishing vessels, underscoring their critical role in fishery carbon emission control. Tang et al. (2010) conducted an in-depth study on energy use in China’s marine capture fisheries, revealing that this sector accounts for over 70% of total fishery energy consumption, with an average energy efficiency of 0.63, further confirming its centrality to carbon emission reduction efforts. In terms of carbon sink in mariculture, Tang (2011) first proposed the concept of “carbon sink fisheries”, which broadly refers to aquaculture activities that function as carbon sinks and directly or indirectly reduce CO2 concentrations. That is, fishery production activities that do not require feed input, such as shellfish and seaweed farming in mariculture. Xu et al. (2018) conducted a review of carbon sink fisheries from four aspects: its connotation, carbon fixation mechanisms, carbon sequestration equcapacity, and industrial development pathways, concluding that research on carbon sink fisheries in China is still in its early stage, with a weak industrial foundation, and that relevant policies are urgently needed to promote its development. Sun et al. (2020) estimated the economic value of carbon sink in mariculture using the carbon tax law and artificial afforestation method, finding that carbon sink mariculture can promote high-quality development of marine fisheries and provide a scientific basis for establishing a carbon trading market in marine fisheries. Shao et al. (2019) taking nine coastal provinces in China as studies, measured the carbon sink capacity of shellfish and seaweed products in mariculture and analyzed the main influencing factors using the LMDI model. The study indicated that carbon sink aquaculture should prioritize improving carbon sink farming techniques, stabilizing production, and optimizing the aquaculture structure, with particular attention to shellfish and seaweed production, which have high carbon sestration potential. Tang et al. (2011) analyzed carbon content data of shellfish and seaweeds in China from 1999 to 2008, showing that cultivated shellfish and seaweeds can directly and indirectly absorb and remove significant amounts of carbon from coastal ecosystems, contributing substantially to carbon sink. Given that marine fisheries possess dual characteristics such as both carbon sources and carbon sinks, achieving a carbon balance is of critical importance for promoting the green transformation and sustainable development of marine fisheries.
Second, regarding the analysis of driving factors for carbon emissions, scholars commonly apply decomposition methods, such as the Logarithmic Mean Divisia Index (LMDI), to identify key influencing variables. Song et al. (2024), using the LMDI model, analyzed the driving factors of fishery carbon emissions in 11 coastal provinces of China and found that energy intensity and technological advancement helped curb carbon emissions, while fishery economic output value and energy structure promoted carbon emission increases. Similarly, Wu and Liu (2025) research on freshwater aquaculture showed that production efficiency and labor intensity can effectively control carbon emissions increase, whereas economic growth and industrial structure contribute to carbon emission increases. Dai and Guo (2022) decomposed the factors influencing the intensity of marine fishery resource use in China and found that technological progress enhanced resource utilization efficiency, industrial structure had a minor inhibitory effect, and economic scale first suppressed and later promoted resource use efficiency. Xu et al. (2025a) used the LMDI method with the Kaya identity to analyze the historical trend and future projections in carbon emissions of international shipping from 2010 to 2050, focusing on main driving factors.
Finally, regarding carbon reduction pathways and policy simulations under different development scenarios, the System Dynamics (SD) model is widely applied. Wang and Feng (2023) developed an SD model based on the fishery sector in Liaoning Province in China and found that carbon emissions would rise significantly under a rapid economic growth scenario. However, controlling energy consumption or increasing shellfish and algae aquaculture could, respectively, reduce carbon emissions or enhance carbon sinks. Liu et al. (2022) used an SD model to simulate marine fishery systems and demonstrated that socioeconomic development significantly impacts carbon emission trends, with employment and industrial scale identified as key variables. Structural adjustments, particularly reducing the share of capture fisheries, were found to be effective in curbing carbon emissions. Chen et al. (2022) simulated five different scenario combinations and found that optimizing industrial and energy structures plays a positive role in achieving low-carbon development, whereas rapid economic development scenarios require additional policy interventions to achieve carbon emission reduction targets. In summary, current research has established a solid foundation in estimating carbon emissions, identifying driving factors, and predicting future scenarios of fisheries, offering theoretical support for the low-carbon transition of regional fisheries.
Shandong Province, located on China’s eastern coast, is rich in marine resources and possesses a favorable geographical position. It is one of the country’s leading centers for fishery output and aquatic product processing, with both fishery output value and total aquatic product yield consistently ranking among the highest nationwide (Yang et al., 2016; Su and Yang, 2018). Marine fisheries have gradually become a key pillar industry in Shandong Province. According to the 14th Five-Year Plan for Marine Economic Development of Shandong Province, by 2035, the province aims to become a global leader in marine economy, science and technology, ecological quality, marine culture, and governance efficiency. The plan envisions Shandong Province as a top-tier global marine economic power, featuring world-class ports and maritime infrastructure (Shandong Provincial Government, 20211). However, alongside rapid industry development, Shandong Province faces challenges, such as continuous degradation of its marine ecosystem (Shao et al., 2018). Liang (2016) pointed out that Shandong’s marine fishery resources are severely depleted and aquatic product processing technology remains underdeveloped, rendering ecological issues increasingly urgent. Song et al. (2014) conducted examination based on energy and economic data from the Shandong Peninsula Blue Economic Zone between 2005 to 2010 and found that CO2 emissions increased by more than 10% annually amid rapid economic growth. Shao and Chen (2012), using data from 1999 to 2010, further noted that the overall carbon emission reduction level in Shandong Province was relatively low, with economic growth providing limited support for carbon mitigation. Moreover, traditional production methods and outdated technologies have exacerbated the negative impact on the marine ecological environment. Therefore, accelerating the green and low-carbon transformation of marine fisheries in Shandong Province is imperative for achieving high-quality regional marine economic development.
In this context, this study aims to provide a theoretical and practical foundation for achieving dual carbon targets in Shandong Province and across China’s marine fisheries sector. It firstly establishes an improved net carbon emission accounting framework that integrates both carbon emissions and carbon sink and quantifies the carbon emissions dynamics of Shandong’s marine fisheries based on data from 2010 to 2022. Subsequently, the Logarithmic Mean Divisia Index (LMDI) model is employed to identify the principal driving factors of these emissions. Finally, a System Dynamics (SD) model is constructed to simulate and forecast the trajectory of marine fishery carbon emissions in Shandong Province under various development scenarios from 2023 to 2035, leading to the proposal of targeted policy recommendations.
2 Methods
2.1 Data sources
In this study, data on marine fishery activities in Shandong Province, including fishing, aquaculture, aquatic product processing, as well as fishery output values, were collected from the China Fishery Statistical Yearbook (2010-2022). Other data, such as total population, GDP, and technological investment, were obtained from the Shandong Statistical Yearbook (2010-2022). Additionally, standard coal conversion coefficients for various energy types and carbon emission factors were derived from publications by the National Bureau of Statistics of China (2020) and the Ministry of Ecology and Environment of China (2024). The summary table of carbon emission and carbon sink accounting is provided in Table 1.
Table 1
| Component | Key variables | Data sources | Time coverage | Units/Conventions |
|---|---|---|---|---|
| Marine capture fisheries | Vessel power | China Fishery Statistical Yearbook | 2010-2022 | kW |
| fuel consumption coefficient | Ministry of Agriculture and Rural Affairs of China (MARA), 2010 | 2010 | t/kw | |
| Carbon emissions factor for diesel | The Provincial Greenhouse Gas Inventory Guidelines (2025 Edition) | 2025 | kg CO2/kg | |
| Marine aquaculture | Vessel power, Area of pond-based and industrial mariculture | China Fishery Statistical Yearbook | 2010-2022 | kW/ha/m3 |
| Electricity consumption of water pumps and aerators | Xu et al. (2007) | 2007 | kWh | |
| Carbon emissions factor for electricity | Ministry of Ecology and Environment of the People’s Republic of China | 2024 | kgCO2/kWh | |
| Marine aquatic processing product | aquatic processing product | China Fishery Statistical Yearbook | 2010-2022 | t |
| Electricity consumption of frozen products, surimi products, dried products, and fishmeal | Xu et al. (2007) | 2007 | kWh | |
| Carbon emissions factor for electricity | Ministry of Ecology and Environment of the People’s Republic of China | 2024 | kgCO2/kWh | |
| Marine fisheries carbon sink |
Shellfish and Algae production | China Fishery Statistical Yearbook | 2010-2022 | t |
| The conversion coefficient between wet weight and dry weight | The Ministry of Natural Resources of China (HY/T, 0305-2021; HY/T 0349-2022) | 2021/2022 | Dimensionless ratio |
Summary of carbon emission and carbon sink accounting.
Shandong Province is selected due to its representative role in China’s marine fisheries and the availability of long-term statistical data, while the period 2010–2022 is chosen to ensure data continuity and consistency across all accounting components. Marine fisheries carbon emissions in Shandong Province are estimated by distinguishing among capture fisheries, mariculture, and aquatic product processing. Carbon emissions from capture fisheries are calculated based on fishing vessel operation types and vessel power. Mariculture related emissions mainly arise from energy consumption by aquaculture vessels and electricity use of key equipment, such as aerators and water pumps, in marine pond-based and industrial-scale aquaculture systems. Carbon emissions from aquatic product processing are estimated based on energy consumption associated with major marine products, including frozen products, surimi products, dried products, and fishmeal. Carbon sinks are estimated for shellfish and algae aquaculture using production data and relevant conversion coefficients. Inland fisheries and freshwater aquaculture are, however, excluded from the system boundary.
2.1.1 Carbon emissions calculation
This study systematically estimates carbon emissions from three main components of marine fisheries in Shandong Province: marine fishing, marine aquaculture, and marine aquatic product processing. Specifically, carbon emissions from marine fishing are estimated based on the engine power of fishing vessels, categorized by operational type (Zhang et al., 2010). Marine aquaculture in Shandong Province is predominantly composed of shellfish and algae, accounting for over 90% of total production. Carbon emissions from marine aquaculture are calculated based on the power of aquaculture vessels and the energy consumption of water pumps and aerators used during aquaculture operations. Carbon emissions from marine aquatic product processing are estimated based on the processing volumes of energy-intensive products, including frozen products, surimi, dried products, and fishmeal. The calculation method for this component refers to Xu et al. (2007) study on energy consumption in aquaculture and aquatic product processing. This study adopts the calculation framework recommended by the IPCC Guidelines and the Provincial Greenhouse Gas Inventory Guidelines (2025 Edition)2. The corresponding calculation formula is shown below:
Where represents the carbon emissions of the marine captures; represents the carbon emissions from mariculture; denotes the carbon emissions from marine aquatic product processing; is the power of fishing vessels, subscript i indicates different operation types in capture fisheries (Table 2), while subscript j represents aquaculture vessels; is the fuel consumption coefficient for different fishing operation type i; indicates the fuel consumption coefficient of aquaculture vessels; and are the carbon emission factor for diesel and electricity; denote the farming area of mariculture ponds and industrialized aquaculture; denotes the energy consumption conversion coefficient for energy-consuming equipment (aerators and pumps) used in mariculture ponds and industrialized aquaculture; is the output of marine aquatic product processing of category l, including frozen products, surimi products, dried products, and fishmeal; is the corresponding energy consumption conversion factor.
Table 2
| Operation type | Trawl | Seine | Gill net | Trap net/Fishing tackle | Others | Aquaculture vessel |
|---|---|---|---|---|---|---|
| Fuel consumption coefficient(t/kw) | 0.48 | 0.492 | 0.451 | 0.328 | 0.312 | 0.225 |
Fuel consumption coefficient for different fishing operation types.
Data source: Standards for the calculation of fuel price subsidies for domestic motorized fishing vessels (MARA, 2010).
Where is the carbon emission factor for diesel; denotes the net calorific value of diesel fuel; CC denotes the carbon content per unit of energy, and OF is the oxidation factor; 44/12 the conversion factor based on the molecular weight ratio of CO2 to carbon, and is commonly used to convert carbon emissions to carbon dioxide emissions.
With regard to the selection of the electricity CO2 emission factor, a continuous and officially published series of provincial-level electricity CO2 emission factors is currently unavailable for the entire study period. Given that the study covers the period from 2011 to 2022, and in order to maintain consistency in temporal scope and calculation methodology, the average CO2 emission factor of the Shandong provincial power grid in 2022 is adopted as the electricity emission factor and applied uniformly to estimate electricity-related carbon emissions throughout the study period.
2.1.2 Carbon sink calculation
Bivalves consist of two main components: shells and soft tissues, both of which store fixed carbon. Algae, as soft-bodied organisms, store carbon within their own biomass. Referring to the method by (Tan et al., 2024), this study adopts the biomass assessment method. Based on the relationship among the carbon sink coefficient, yield, and carbon sink amount, the marine fishery carbon sink is calculated using the following formula:
Where, , , represent total amount of carbon sink, the total carbon stock of the mariculture shellfish and algae, respectively; P represent the yield; β represent the conversion coefficient between wet weight and dry weight; w represents mass-specific gravity; δ represent the carbon content coefficient; r represents the conversion factor between carbon and carbon dioxide, 12/44, as shown in Table 3.
Table 3
| Category | Species | Conversion coefficient between wet and dry weight (%) | Mass ratio (%) | Carbon content ratio (%) | ||
|---|---|---|---|---|---|---|
| Soft tissue | Shell | Soft tissue | Shell | |||
| Shell fish | Mactridae | 52.55 | 1.98 | 98.02 | 44.9 | 11.52 |
| Pectinidae | 63.89 | 14.35 | 85.65 | 42.84 | 11.40 | |
| Ostreidae | 65.10 | 6.14 | 93.86 | 45.98 | 12.68 | |
| Mytilidae | 75.28 | 8.47 | 91.53 | 44.40 | 11.76 | |
| Other shellfish | 64.21 | 11.41 | 88.59 | 42.82 | 11.45 | |
| Algae | Saccharina japonica | 20 | 31.2 | |||
| Undaria pinnatifida | 20 | 28.81 | ||||
| Porphyra yezoensis | 20 | 41.96 | ||||
| Gracilaria tikvahiae | 20 | 28.4 | ||||
| Other algae | 20 | 30.36 | ||||
Reference values of correlation coefficients for assessing the carbon sequestration capacity of algae and shellfish.
The concept of net carbon emissions is introduced to comprehensively assess the carbon balance of marine fisheries by integrating both carbon sources and carbon sinks within the system. It is defined as the difference between total carbon emissions and total carbon sinks, that is, Net carbon emission is calculated as carbon emissions minus carbon sink.
When the net carbon emission is greater than zero, carbon emissions exceed the carbon sink, indicating that marine fishery are facing a resource and environmental crisis. When net carbon emission equals zero, the system achieves a carbon balance, reflecting a harmonious relationship between marine fishery development and the marine ecological environment. Conversely, when net carbon emission is less than zero, the carbon sink surpasses carbon emissions, signifying a carbon surplus and representing a sustainable and eco-friendly stage of marine fishery development. Therefore, analyzing net carbon emissions provides an integrated and dynamic framework to evaluate the low-carbon transformation of marine fisheries and their contribution to marine carbon neutrality (Yue et al., 2016).
2.2 Logarithmic mean divisia index decomposition method
Based on a review of relevant literature concerning the decomposition of carbon emissions influencing factors in the fisheries industries (Table 4), this study employs the extended Kaya identity (Kaya, 1989; Shao et al., 2018) to analyze the decomposition factors of carbon emissions in Shandong’s marine fisheries. The equation is as follows:
Table 4
| Author (year) | Fishery social system (energy, economy, society, technology) | Methods | Areas | Factors (remove the four basic factors) |
|---|---|---|---|---|
| Wang and Feng (2023) | Energy and Society | LMDI | Liaoning Province | Share of energy consumption and Marine fishery employment |
| Song et al. (2024) | Economic | LMDI-PDA | China coastal provinces | Output value of marine fishery production |
| Chen et al. (2024) | Technology and Marin policy | Panel data model | 11China coastal areas | Marine fishery science and technology level and government influence |
| Shao et al. (2015) | Society and Economy | LMDI | Marine fisheries in China | The industrial structure of Marine fisheries and Scale of the Marine fishery industry |
| Zhu et al. (2023) | Society and Economy | LMDI | Marine fishery in Zhejiang province | The industrial structure of Marine fisheries and Scale of the Marine fishery industry |
| Cao and Fan (2022) | Economy, Technology | STIRPAT | Fiscal decentralization and Technology | |
| Dai and Guo (2022) | Economy | Kaya-LMDI | Marine fisheries in China | Resource utilization intensity, industrial structure and Economics of scale |
| Wu and Liu (2025) | Technology and Society | Kaya-LMDI | China’s freshwater aquaculture industry | Production efficiency of freshwater aquaculture and population intensity |
Statistics relevant views of the literatures in fisheries carbon emissions influencing factors.
Where C is total carbon emissions; P is the total population engaged in marine fisheries, Y is the total output value of the representative marine fishery industries; is the output value of the marine fishery sector ith; is the energy consumption of marine fishery sector ith; is the carbon emissions of the marine fishery sector ith; / denotes the gross output value per capita who engaged in marine fisheries; / denotes the share of output from sector i in total marine fisheries output; / denotes the energy consumption of marine fishery sector ith to the output value of the marine fishery sector ith; / denotes the proportional carbon emissions of the marine fisheries in sector i to the energy consumption of marine fisheries in sector i.
Mark P =, the equation can be expressed as:
The LMDI model is advantageous due to its zero residual term and the ability to convert multiplicative decomposition into additive decomposition (Zhu, 2022). Therefore, the equation for decomposition of factors influencing carbon emissions in Shandong’s marine fisheries can be expressed as follows:
Where represents the total effects of carbon emissions in Shandong’s marine fisheries; represents the amount of people engaged in marine fisheries, also known as population effect; represents the scale effect of marine fisheries economy; represents the industrial structure effect of marine fisheries; denotes energy intensity effect in marine fisheries; represents the carbon emission coefficient effect of the marine fishery production sector.
Interannual effect is calculated by comparing each year’s value with that of the previous year, reflecting the dynamic trends between adjacent years and capturing short-term fluctuations. Cumulative effect uses a specific year as the base period (2010 in this study) to calculate the ratio or difference of each subsequent year relative to the base year, reflecting long-term accumulated changes and being suitable for evaluating overall long-term trends.
Using summation decomposition, the equations for the decomposition factors influencing carbon emissions in Shandong’s marine fisheries can be expressed as follows:
In these equations, , it is the logarithmic mean, used to measure the weighted average change in carbon emission levels between two time points (period 0 to target period t). The contribution values of carbon emission influencing factors in Shandong’s marine fisheries are presented in Table 5.
Table 5
| Population | Economic scale | Industrial structure | Energy intensity | Carbon intensity | Total effects | |||||||
|---|---|---|---|---|---|---|---|---|---|---|---|---|
| Interannual effect | Cumulative effect | Interannual effect | Cumulative effect | Interannual effect | Cumulative effect | Interannual effect | Cumulative effect | Interannual effect | Cumulative effect | Interannual effects | Cumulative effects | |
| 2011 | 49.35 | 49.35 | -55.87 | -55.87 | -33.19 | -33.19 | 68.08 | 68.08 | 1.33 | 1.33 | 29.70 | 29.70 |
| 2012 | 57.13 | 104.55 | 74.87 | 15.44 | 39.32 | 6.95 | -167.94 | -95.06 | 3.47 | 4.66 | 6.84 | 36.54 |
| 2013 | 0.92 | 108.78 | 30.05 | 44.50 | -4.40 | 2.91 | -1.44 | -99.41 | -0.90 | 3.99 | 24.24 | 60.78 |
| 2014 | -4.33 | 109.66 | 30.35 | 74.49 | -13.96 | -10.78 | 22.00 | -82.52 | 2.06 | 6.04 | 36.12 | 96.89 |
| 2015 | -0.61 | 110.83 | 21.65 | 94.80 | -9.49 | -20.07 | 1.46 | -81.74 | 0.12 | 6.22 | 13.14 | 110.03 |
| 2016 | 13.76 | 122.83 | -5.53 | 89.98 | 16.94 | -5.26 | -24.01 | -102.55 | -1.37 | 4.81 | -0.21 | 109.82 |
| 2017 | -2.23 | 121.72 | 5.20 | 95.12 | -74.47 | -73.32 | 77.21 | -32.87 | 1.93 | 6.80 | 7.63 | 117.45 |
| 2018 | -2.92 | 117.08 | 17.90 | 108.90 | 19.07 | -52.37 | -48.33 | -77.53 | -0.58 | 6.51 | -14.86 | 102.59 |
| 2019 | -17.17 | 100.42 | 6.57 | 113.15 | -27.24 | -78.71 | 24.69 | -51.45 | 1.55 | 7.60 | -11.59 | 91.00 |
| 2020 | -38.33 | 66.06 | 51.81 | 158.70 | 26.96 | -49.16 | -45.61 | -97.28 | 3.01 | 10.51 | -2.17 | 88.83 |
| 2021 | -3.77 | 62.08 | 12.40 | 168.16 | -13.84 | -61.24 | 0.20 | -96.32 | -1.98 | 9.17 | -6.99 | 81.84 |
| 2022 | 6.39 | 67.68 | 19.31 | 185.14 | -6.53 | -69.04 | -17.90 | -110.33 | -3.13 | 6.53 | -1.86 | 79.99 |
| Contribution rate | 84.62% | 231.46% | -86.31% | -137.94% | 8.17% | 100% | ||||||
The results of decomposition of factors influencing carbon emissions from marine fishery in Shandong Province, 2011 - 2022 (unit: ten thousand tons).
2.3 System dynamics model
The System Dynamics (SD) model emphasizes computer-based simulation for analyzing complex systems with feedback loops and time delays (Liu, 2007). Early work by Forrester et al. (2012) demonstrated how dynamic behaviors in a supply chain affect inventory and scheduling, guiding improved management decisions. The SD model is widely applied in socioeconomic, energy, environmental, and policy evaluation systems (Chen et al., 2022). In this study, we identify the main variables based on the LMDI decomposition results and develop an SD model for carbon emissions in Shandong’s marine fishery. The model utilizes historical data to simulate and forecast carbon emissions under different scenarios, providing insights and references for energy conservation and emission reduction strategies in Shandong’s fishery industry. The marine fishery carbon emission system is divided into three subsystems: socioeconomic, energy, and environmental subsystem, as shown in Figure 1. The socioeconomic subsystem captures changes in economic development (Liu et al., 2022), including variables such as total population, GDP, total fishery output value, and investment in new and innovative technologies. The energy subsystem focuses on carbon emissions resulting from energy consumption in marine fishery operations. It includes variables such as fuel consumption by fishing vessels and mariculture, and power consumption in aquatic product processing. The environmental subsystem highlights the carbon sink function of farmed shellfish and algae, which absorb CO2 and help mitigate emissions, reflecting the ecological value of sustainable aquaculture.
Figure 1
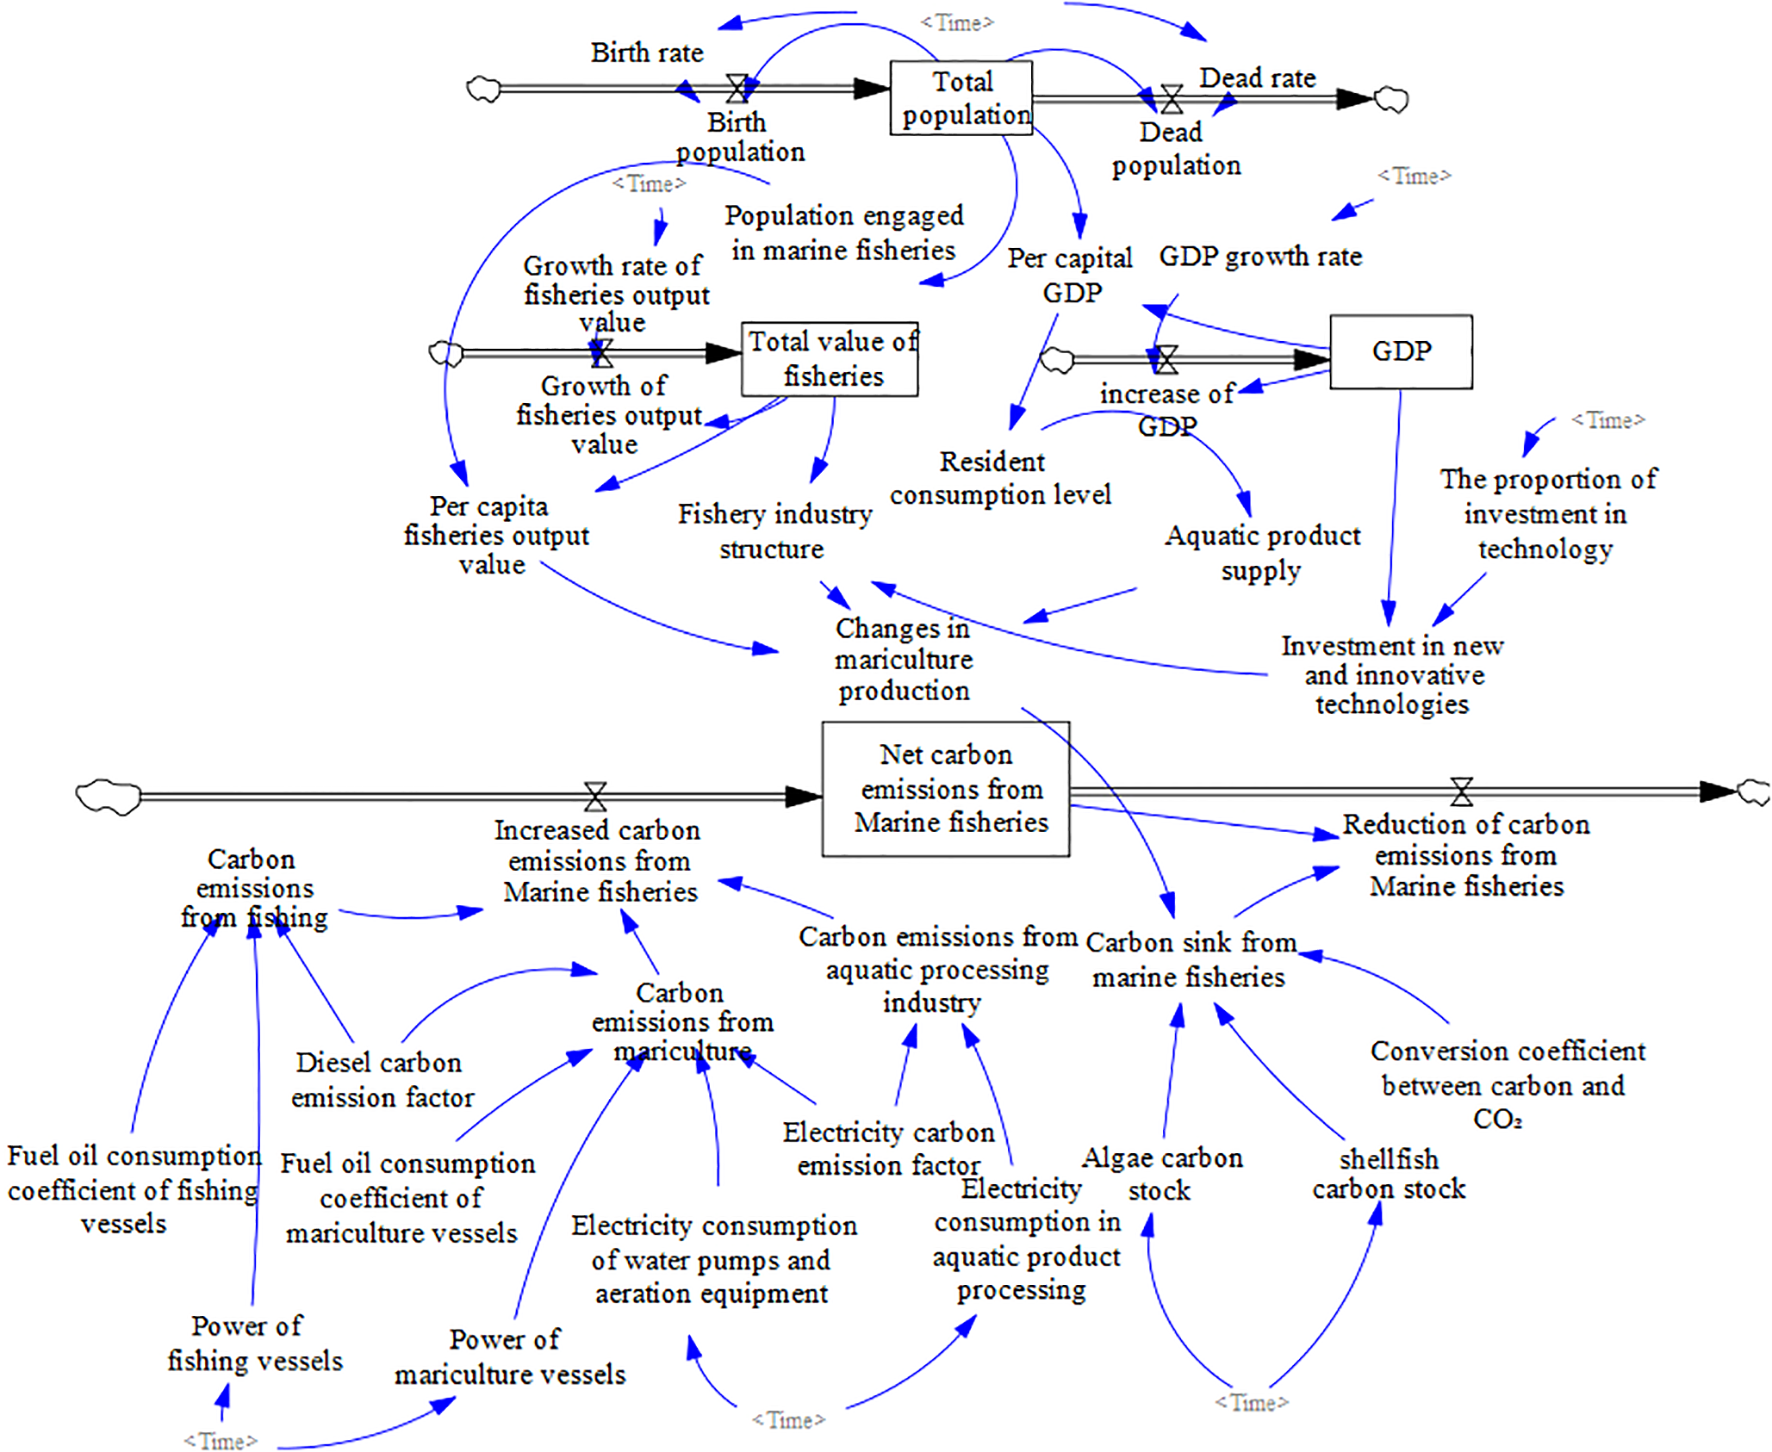
Stock-flow diagram of carbon emissions in Shandong marine fisheries.
The model focuses on marine fisheries in Shandong Province, China. The temporal span extends from 2010 to 2035, with 2010 serving as the baseline and a one-year interval. Historical data from 2010 to 2022 are used for validation, while 2023–2035 constitutes the forecast period. The model is developed and refined using Vensim software (Tian et al., 2023).
2.3.1 Validation of the SD model
To validate and verify the system dynamics (SD) model, a backcasting approach was employed to reproduce the historical evolution of key variables during the period 2010-2022. The selected validation variables include net carbon emissions from marine fisheries, carbon emissions from marine fishing, total population, and total value of fisheries. Historical statistical data were collected from official sources and used as actual data, while the corresponding simulated values were generated by the SD model. The predictive performance and robustness of the model were evaluated by comparing the simulated results with the historical observations. The mean absolute percentage error (MAPE) was adopted as the primary error metric to quantify the deviation between simulated and observed values, following previous system dynamics studies (Rokhmawati et al., 2024). The MAPE is defined as follows:
Where and represent the actual and simulated values in year t. According to (Lewis, 1982) and (De Myttenaere et al., 2016). The predictive power based on MAPE can be defined in Table 6.
Table 6
| No. | MAPE range | Predictive power |
|---|---|---|
| 1. | Highly accurate forecasting | |
| 2. | Good forecasting | |
| 3. | Reasonable | |
| 4. | Inaccurate forecasting |
The predictive power of mean absolute percentage of the error (MAPE).
The validation results show (Table 7) that the MAPE values of all selected variables during 2010–2022 are within acceptable thresholds. Specifically, the MAPE values for net carbon emissions from marine fisheries and carbon emissions from marine fishing are 12.94% and 12.48%, respectively, indicating good forecasting performance. Meanwhile, the MAPE values for total population (0.43%) and total value of fisheries (6.11%) are substantially lower, reflecting highly accurate forecasting ability.
Table 7
| No. | Variables | MAPE (%) | Predictive power |
|---|---|---|---|
| 1. | Net carbon emissions from marine fisheries | 12.94 | Good forecasting |
| 2. | Carbon emissions from marine fishing | 12.48 | Good forecasting |
| 3. | Population | 0.43 | Highly accurate forecasting |
| 4. | Total value of fisheries | 6.11 | Highly accurate forecasting |
Mean absolute percentage error (MAPE) of selected variables (2010-2022).
Overall, these results suggest that the proposed system dynamics (SD) model can effectively reproduce the historical behavior of key variables in the marine fishery system, thereby providing a reliable basis for subsequent scenario simulation and sensitivity analysis.
3 Results
3.1 Carbon emissions of marine fisheries in Shandong Province, China
The carbon emission results of marine fisheries in Shandong Province from 2010 to 2022 are presented in Figure 2; Tables 8, 9. These results are derived from the calculations based on (Equations 1-8). Net carbon emissions peaked in 2015 at 2.53 × 10⁶ tons, representing a 36.33% increase compared to 2010. Thereafter, they declined overall after 2015, reaching the lowest level of 2.03 × 10⁶ tons in 2022, with a reduction rate of 19.72%. The total carbon emissions reached their maximum in 2017 at 4.61 × 10⁶ tons, increasing by 34.22%, and then gradually decreased to 4.23 × 10⁶ tons in 2022, showing an 8.1% decline. In contrast, carbon sequestration continued to grow steadily, from 1.58 × 10⁶ tons in 2010 to 2.20 × 10⁶ tons in 2022, an overall increase of 39.61%. Carbon emissions from marine capture fisheries peaked at 2.67 × 10⁶ t in 2016 and subsequently declined on a year-by-year basis. This reduction can be indirectly linked to the effectiveness of quota-based management measures implemented in the province’s marine capture fisheries, as evidenced by a reduction of 3,710 motorized marine fishing vessels and a drop of 79,723 kW in total engine power by the end of 2017 compared to 2016, according to the China Fishery Statistical Yearbook (2018). Moreover, the steady increase in shellfish and algae mariculture production has further enhanced the carbon sink capacity, contributing to the continuous decline in net carbon emissions from Shandong’s marine fisheries. Analyzing the composition of carbon emissions in 2017, the year of the maximum total carbon emissions, marine fishing accounted for 2,524,877.83 tons, representing a substantial 54.81%. Emissions from aquatic product processing amounted to 1,218,086.74 tons, approximately 26.44%, while aquaculture emissions were 863,846.63 tons for about 18.75%. In 2010, the year with the minimum total emission (3,432,291.72 tons), marine fishing still contributed 2,187,597.6 tons, approximately 63.74%, mariculture contributed 583,898.54 tons, about 17.01%, and aquatic product processing contributed 660,795.58 tons, which is around 19.25%. From the perspective of carbon sink, Shandong Province experienced a continuous increase from 2010 to 2022, primarily due to the steady expansion of shellfish and algae mariculture. The shellfish carbon sink increased from 267,855.72 tons in 2010 to 392,674.49 tons in 2022, marking a 46.6% growth rate. Meanwhile, algae carbon sink also rose steadily, from 162,210.45 tons in 2010 to 207,772.03 tons in 2022, with an overall growth rate of 28.09%.
Figure 2
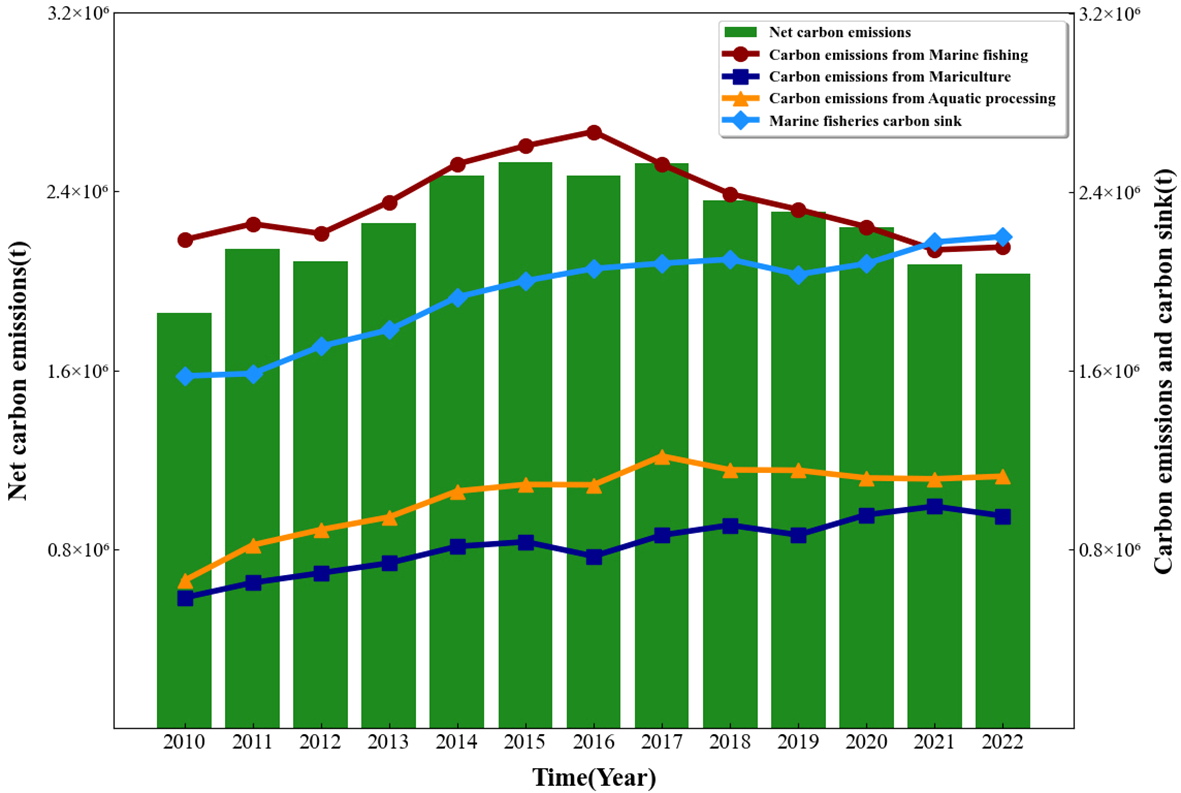
Carbon emissions from marine fisheries in Shandong province, 2010 - 2022.
Table 8
| Variables | Symbol | Mean | Std. dev. | Min | Max | Units |
|---|---|---|---|---|---|---|
| Carbon emission | CE | 420.57 | 35.69 | 343.23 | 460.68 | 104t |
| Carbon sink | CS | 194.78 | 21.38 | 157.69 | 220.16 | 104t |
| Net carbon emission | NCE | 225.79 | 21.21 | 185.54 | 252.94 | 104t |
Descriptive statistics of carbon emission and carbon sink variables in Shandong’s marine fishery (2010-2022, 104t).
Table 9
| Year | Fishing carbon emissions | Mariculture carbon emission | Aquatic product processing carbon emissions | Total carbon sink | Net carbon emissions |
|---|---|---|---|---|---|
| 2010 | 218.76 | 58.39 | 66.08 | 157.69 | 185.54 |
| 2011 | 225.86 | 65.08 | 81.98 | 158.80 | 214.12 |
| 2012 | 221.49 | 69.43 | 88.85 | 171.02 | 208.75 |
| 2013 | 235.65 | 73.87 | 94.48 | 178.34 | 225.67 |
| 2014 | 252.69 | 81.33 | 106.11 | 193.04 | 247.08 |
| 2015 | 260.78 | 83.40 | 109.08 | 200.32 | 252.94 |
| 2016 | 267.16 | 76.96 | 108.93 | 205.81 | 247.24 |
| 2017 | 252.49 | 86.38 | 121.81 | 208.16 | 252.53 |
| 2018 | 239.30 | 90.88 | 115.64 | 209.95 | 235.88 |
| 2019 | 232.30 | 86.48 | 115.45 | 203.21 | 231.02 |
| 2020 | 224.56 | 95.50 | 112.00 | 208.02 | 224.04 |
| 2021 | 214.20 | 99.28 | 111.59 | 217.67 | 207.40 |
| 2022 | 215.44 | 95.02 | 112.75 | 220.16 | 203.05 |
Characteristics of change in carbon emission and carbon sink in Shandong’s marine fishery (2010-2022), 104t.
Overall, the results indicate that carbon emissions from marine fisheries in Shandong Province during 2010–2022 exhibited a distinct temporal evolution characterized by an initial increase followed by a gradual decline, while marine carbon sinks showed a persistent upward trend. Throughout the study period, marine fishing remained the dominant source of carbon emissions, although its relative contribution declined over time, accompanied by a gradual increase in the shares of aquaculture and aquatic product processing. The combined effects of changes in emission intensity, production structure, and the continuous expansion of carbon sink fisheries led to a noticeable moderation in net carbon emissions in the later years of the study period.
3.2 Decomposition analysis of carbon emission driving factors
Based on (Equations 9-16), the LMDI model was applied to decompose the driving factors of marine fisheries carbon emissions in Shandong Province. Table 5 presents the interannual and cumulative effect values, along with the contribution rates of five key driving factors: Population, Economic scale, industrial structure, Energy intensity, and Carbon intensity (Li et al., 2021).
From the perspective of cumulative effects, carbon emissions increased by 0.8 million tons between 2011 and 2022, with a peak observed in 2017, followed by a subsequent decline. This indicates that although carbon emissions increased overall during the study period, emission growth was gradually curbed in the later years.
Regarding interannual effects, carbon emissions experienced noticeable year-to-year fluctuations. Positive effects were observed in several years, while negative effects occurred in others, reflecting the combined influence of multiple driving and inhibiting factors. Notably, after 2017, the total interannual effects were predominantly negative, suggesting that emission-reduction forces increasingly outweighed emission-driving forces during the later stage of the study period.
In terms of contribution rates, economic scale was the primary driver of carbon emission growth, with a cumulative contribution rate of 231.46%, followed by population, contributing 84.62%, while carbon intensity showed a relatively small positive contribution of 8.17%. In contrast, energy intensity and industrial structure exerted significant inhibitory effects on carbon emissions, with cumulative contribution rates of -137.94% and -86.31%, respectively. These results indicate that reductions in energy intensity and adjustments in industrial structure played a crucial role in offsetting the emission increases associated with economic expansion (Lin and Li, 2024).
Figure 3A illustrates the interannual effects of different driving factors on carbon emissions from marine fisheries in Shandong Province. The total interannual effect fluctuated markedly over the study period, indicating strong year-to-year variability in carbon emissions. Among the driving factors, economic scale and population generally exhibited positive interannual contributions in most years, whereas energy intensity and industrial structure frequently showed negative effects, offsetting part of the emission growth. Notably, after around 2017, the total interannual effect tended to shift toward negative values, suggesting that emission-reducing forces gradually became more prominent in the later stage.
Figure 3
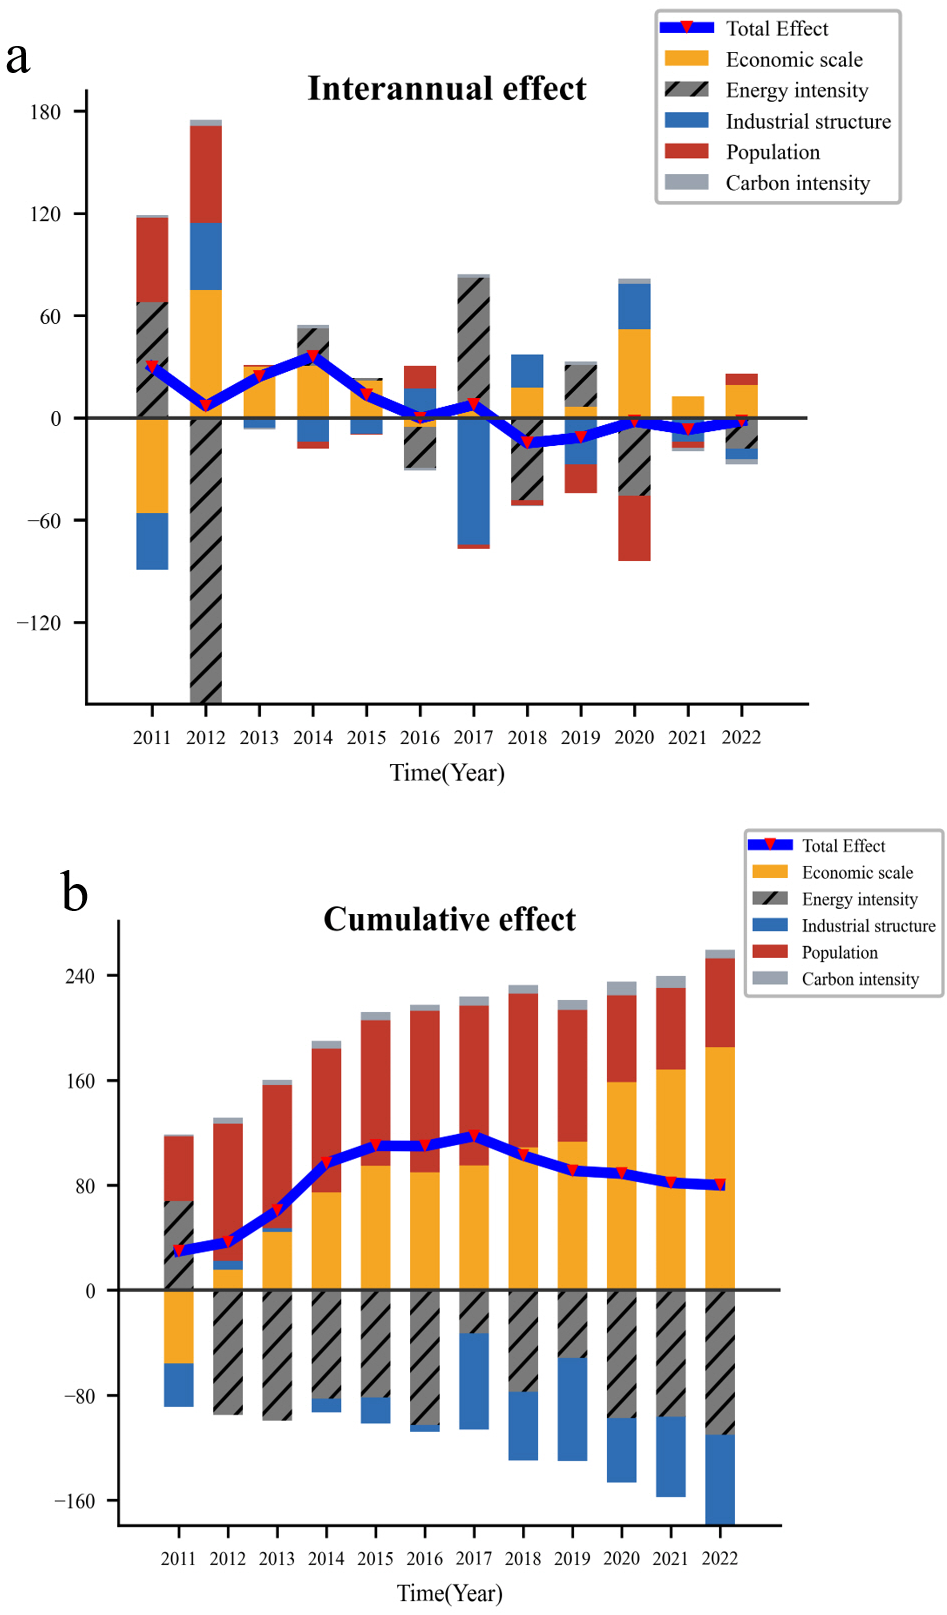
Interannual and cumulative effects of decomposition results from marine fisheries carbon emissions in Shandong Province.
Figure 3B presents the cumulative effects of each factor. The cumulative total effect shows an overall increase followed by a gradual decline, reflecting a peak-decline pattern in carbon emissions over time. Economic scale emerged as the dominant contributor to cumulative emission growth, with a steadily increasing positive effect. Population also contributed positively, though its magnitude was relatively smaller. In contrast, energy intensity and industrial structure displayed persistent negative cumulative effects, indicating their long-term inhibitory roles in carbon emissions. The carbon intensity effect remained relatively minor throughout the study period.
The decomposition results reveal a clear contrast between emission driving and emission inhibiting factors. Economic scale and population consistently acted as positive drivers of carbon emission growth, indicating that the expansion of production activities and labor input remained the primary sources of upward emission pressure. Carbon intensity also contributed positively, although its effect was relatively small. In contrast, energy intensity and industrial structure exerted persistent negative effects on carbon emissions, demonstrating their significant roles in offsetting emission increases driven by economic expansion. The combined inhibitory impacts of improved energy efficiency and industrial structural adjustment substantially moderated the overall growth of carbon emissions. These results suggest that, despite continued economic expansion, emission reduction effect became increasingly prominent in the later stage of the study period, indicating a gradual transition of Shandong’s marine fishery sector toward a more moderated emission trajectory.
3.3 Carbon emissions prediction of marine fishery in Shandong Province under different scenarios
3.3.1 Construction of the different scenarios for prediction
In this study, the scenario construction is closely aligned with the 14th Five-Year Plan for the Development of the Marine Economy in Shandong Province and the 14th Five-Year Plan for National Economic and Social Development of Shandong Province, while actively responding to China’s national Dual Carbon strategy (Xu and Zhao, 2024). During the 14th Five-Year period, the central government set the overarching goal of promoting green development and achieving carbon peaking and carbon neutrality (Xu, 2024). In response, Shandong Province has implemented relevant regional policies aimed at constructing a green, efficient, and technology-driven marine ecological economy, preserving the natural regenerative capacity of the ocean, and promoting the sustainable development of the marine economy. Based on Equation (17), the results indicate that the proposed system dynamics (SD) model can effectively reproduce the historical behavior of key variables in the marine fishery system, providing a reliable basis for subsequent scenario simulation.
To ensure that the scenario setting is both policy-oriented and scientifically informed, this study adjusts key variables based on the results of carbon emission factor decomposition and validity check using a System Dynamics (SD) model. These key variables include: GDP growth rate, growth rate of fisheries output, total power of marine production fishing vessels, proportion of shellfish and algae production, and proportion of investment in technology. Building upon this, the study adopts a scenario simulation approach, drawing on relevant literature and previous research findings (Zhang, 2014; Li et al., 2023b). Selecting 2023 to 2035 as the prediction period, this study systematically analyzes the carbon emission trends of Shandong’s marine fisheries and constructs three representative development scenarios, as detailed in Table 10.
Table 10
| Scenario setting | Features | GDP growth rate | Growth rate of fisheries output | Total power of marine production fishing vessels | The proportion of shell and algal production | The proportion of investment in technology | ||||||||||
|---|---|---|---|---|---|---|---|---|---|---|---|---|---|---|---|---|
| 2025 | 2030 | 2035 | 2025 | 2030 | 2035 | 2025 | 2030 | 2035 | 2025 | 2030 | 2035 | 2025 | 2030 | 2035 | ||
| Scenario 1 | Baseline scenario | 5.5% | 6.0% | 5.3% | 8.0% | 8.3% | 8.0% | 1.82 kw | 1.93 kw | 2.29 kw | 5.80 t | 7.10 t | 8.10 t | 0.2% | 0.25% | 0.3% |
| Scenario 2 | High-growth Economic | 6.0% | 6.5% | 5.8% | 8.3% | 8.5% | 8.7% | 1.90 kw | 2.10 kw | 2.48 kw | 5.82 t | 7.13 t | 8.74 t | 0.3% | 0.35% | 0.4% |
| Scenario 3 | Low-carbon development scenario | 5.0% | 5.0% | 4.5% | 7.5% | 7.3% | 7.0% | 1.75 kw | 1.66 kw | 1.64 kw | 6.10 t | 7.50 t | 9.10 t | 0.35% | 0.45% | 0.6% |
The key variable settings for scenario predictions from 2023 - 2035.
Scenario 1: Baseline Scenario (BS) is established based on the actual development status of Shandong’s marine fisheries in 2022 and reflects the continuation of recent trends under existing policy and institutional settings. In this scenario, key variables are projected forward using 2022 values as reference points, representing a “business-as-usual” development pathway without additional policy intensification. With respect to economic growth, the GDP growth rate under the baseline scenario is derived from the Outline of the 14th-Five-Year Plan and the 2035 Long-Range Objectives of Shandong Province, which specifies medium-term economic growth targets. Accordingly, the GDP growth rate is set at 5.5% in 2025, increases moderately to 6.0% in 2030 in line with industrial upgrading and demand expansion, and then slows to 5.3% in 2035 as the economy enters a stage of high-quality development. In terms of technological investment, technology input related to marine fisheries is proxied by the expenditure share of the scientific research and technical services sector within total R&D spending, based on the Shandong Statistical Yearbook. Historical data indicate a gradual upward trend in this indicator, reaching approximately 0.18% in 2022. On this basis, the baseline scenario adopts a conservative extrapolation path, with the technology investment share set at 0.2% in 2025, rising gradually to 0.25% in 2030 and 0.3% in 2035, reflecting steady technological accumulation without additional policy intervention. Regarding the total power of marine production fishing vessels, the baseline scenario follows historical trends observed during 2010–2022 while being explicitly constrained by existing fisheries management policies, such as the “dual-control” system on vessel numbers and engine power. Although capture vessel power has declined and mariculture vessel power has increased, capture fisheries still dominate total vessel power. Therefore, a moderate and regulated adjustment path is assumed, with total vessel power set at 1.82 × 10⁶ kW in 2025, 1.93 × 10⁶ kW in 2030, and 2.29 × 10⁶ kW in 2035. The growth rate of fisheries output is determined through historical trend extrapolation of the gross output value of marine fisheries during 2010-2022. Based on this trend, a medium-term growth rate of 8.0% in 2025 is adopted, with moderate adjustments to 8.3% in 2030 and 8.0% in 2035, reflecting a gradual transition from rapid expansion to more stable development. From the perspective of carbon sinks, the proportion of shellfish and algal production is assumed to increase gradually from 5.80 × 10⁶ t in 2025 to 7.10 × 10⁶ t in 2030 and 8.10 × 10⁶ t in 2035, consistent with the steady expansion of low-carbon mariculture in Shandong Province.
Scenario 2: High-Growth Economic Development Scenario (HG) is designed with the objective of high-growth economic development. According to the 14th Five-Year Plan for Marine Economic Development of Shandong Province and the 14th Five-Year Plan for National Economic and Social Development of Shandong Province. GDP growth rates are assumed to be 0.5 percentage points higher than those in the baseline scenario, reflecting enhanced economic vitality. Considering that 2030 is the critical point for China to reach its carbon emission peak, economic growth during 2026–2030 is assumed to accelerate to 6.5% to support strong economic development. After reaching the carbon peak in 2030, the economic growth rate will slightly moderate, set at 5.8% by 2035, reflecting shift toward carbon neutrality.
Driven by this high-growth economic development, the growth rate of fisheries output is also expected to increase. Based on the 2022 benchmark and combined with the rapid economic development trend, the fisheries output growth rates are set at 8.3% in 2025, 8.5% in 2030, and 8.7% in 2035. Although overall economic growth slightly slows after 2030, the large-scale expansion of shellfish and algae aquaculture in Shandong Province sustains strong momentum in fisheries output. The total power of marine production fishing vessels increases steadily in response to economic growth, reaching 1.90×10⁶ kW in 2025, 2.10×10⁶ kW in 2030, and 2.48×10⁶ kW in 2035. However, the structure of vessel power is shifting, with the power of fishing vessels decreasing while that of aquaculture vessels increases, reflecting a transition toward more environmentally friendly production modes. Shellfish and algae aquaculture, due to their significant carbon sink effect, play a crucial role in low-carbon fishery development. Especially in the post-carbon-peak period after 2030, aquaculture output continues to grow rapidly, increasing from 5.82×10⁶ tons in 2025 to 7.13×10⁶ tons in 2030, and reaching 8.74×10⁶ tons by 2035. In terms of technological investment, faster economic growth is generally accompanied by stronger innovation capacity and productivity improvement, the proportion of investment in marine fishery technology is also on the rise, from 0.3% in 2025 to 0.35% in 2030, and reaching 0.4% in 2035. This trend not only enhances resource use efficiency but also provides critical technological support for promoting low-carbon and intelligent fisheries.
Scenario 3: Low-Carbon Development Scenario (LD) aims to explore the potential development trend of Shandong’s marine fisheries under a low-carbon economic strategy. In alignment with China’s dual carbon goals. Compared with the high-growth scenario, this pathway emphasizes emission reduction through efficiency improvement and technological progress rather than through rapid economic expansion. Specifically, the GDP growth rate is set at 5.0% in 2025, which is 0.5 percentage points lower than the average of the high-growth scenario, reflecting the expected moderation in economic expansion. After reaching peak carbon emissions in 2030, the growth rate continues to decline, reaching 4.5% by 2035, indicating a strategic shift toward a more sustainable and low-carbon development model. The growth rate of fisheries output also slows accordingly, set at 7.5%, 7.3%, and 7.0% for 2025, 2030, and 2035, respectively, maintaining consistency with the overall economic development trend.
Meanwhile, the total power of marine fishing vessels shows a gradual downward trend, from 1.75×10⁶ kW in 2025, to 1.66×10⁶ kW in 2030, and further to 1.64×10⁶ kW in 2035. This decline reflects a reduction in energy-intensive traditional fishing activities and a transition toward more energy-efficient practices. However, despite the reduction in total vessel power, the production of shellfish and algae aquaculture continues to grow steadily, reaching 6.10×10⁶ tons in 2025, 7.50×10⁶tons in 2030, and 9.10×10⁶ tons in 2035. The cultivation of shellfish and algae not only entails relatively low carbon emissions but also functions as a marine carbon sink by absorbing CO2 from seawater. This highlights the broad development potential of ecological marine aquaculture under a low-carbon framework. Moreover, under this scenario, the proportion of investment in technology is significantly higher than in the baseline and high-growth scenarios. As the low-carbon economic transition progresses, the share of technological investment in the marine fishery sector rises from 0.35% in 2025 to 0.45% in 2030, and eventually reaches 0.6% in 2035. This underscores the critical role of innovation and technological upgrading in driving the sustainable development of low-carbon marine fisheries in Shandong Province.
3.3.2 Analysis of the scenarios for prediction
Based on the configuration of key variables and parameters in the SD model, we conducted scenario simulations to predict the changes in carbon emissions from Shandong’s marine fisheries from 2023 to 2035. The simulation includes three typical scenarios: the Baseline Scenario (BS), the High-Growth Economic Scenario (HG), and the Low-Carbon Development Scenario (LD). Under each scenario, we projected the overall carbon emissions of the marine fisheries and further analyzed key variables, including carbon emissions from fishing, mariculture, and aquatic product processing, as well as the carbon sink and net carbon emissions of marine fisheries. The prediction results based on these scenarios are presented in Figure 4.
Figure 4
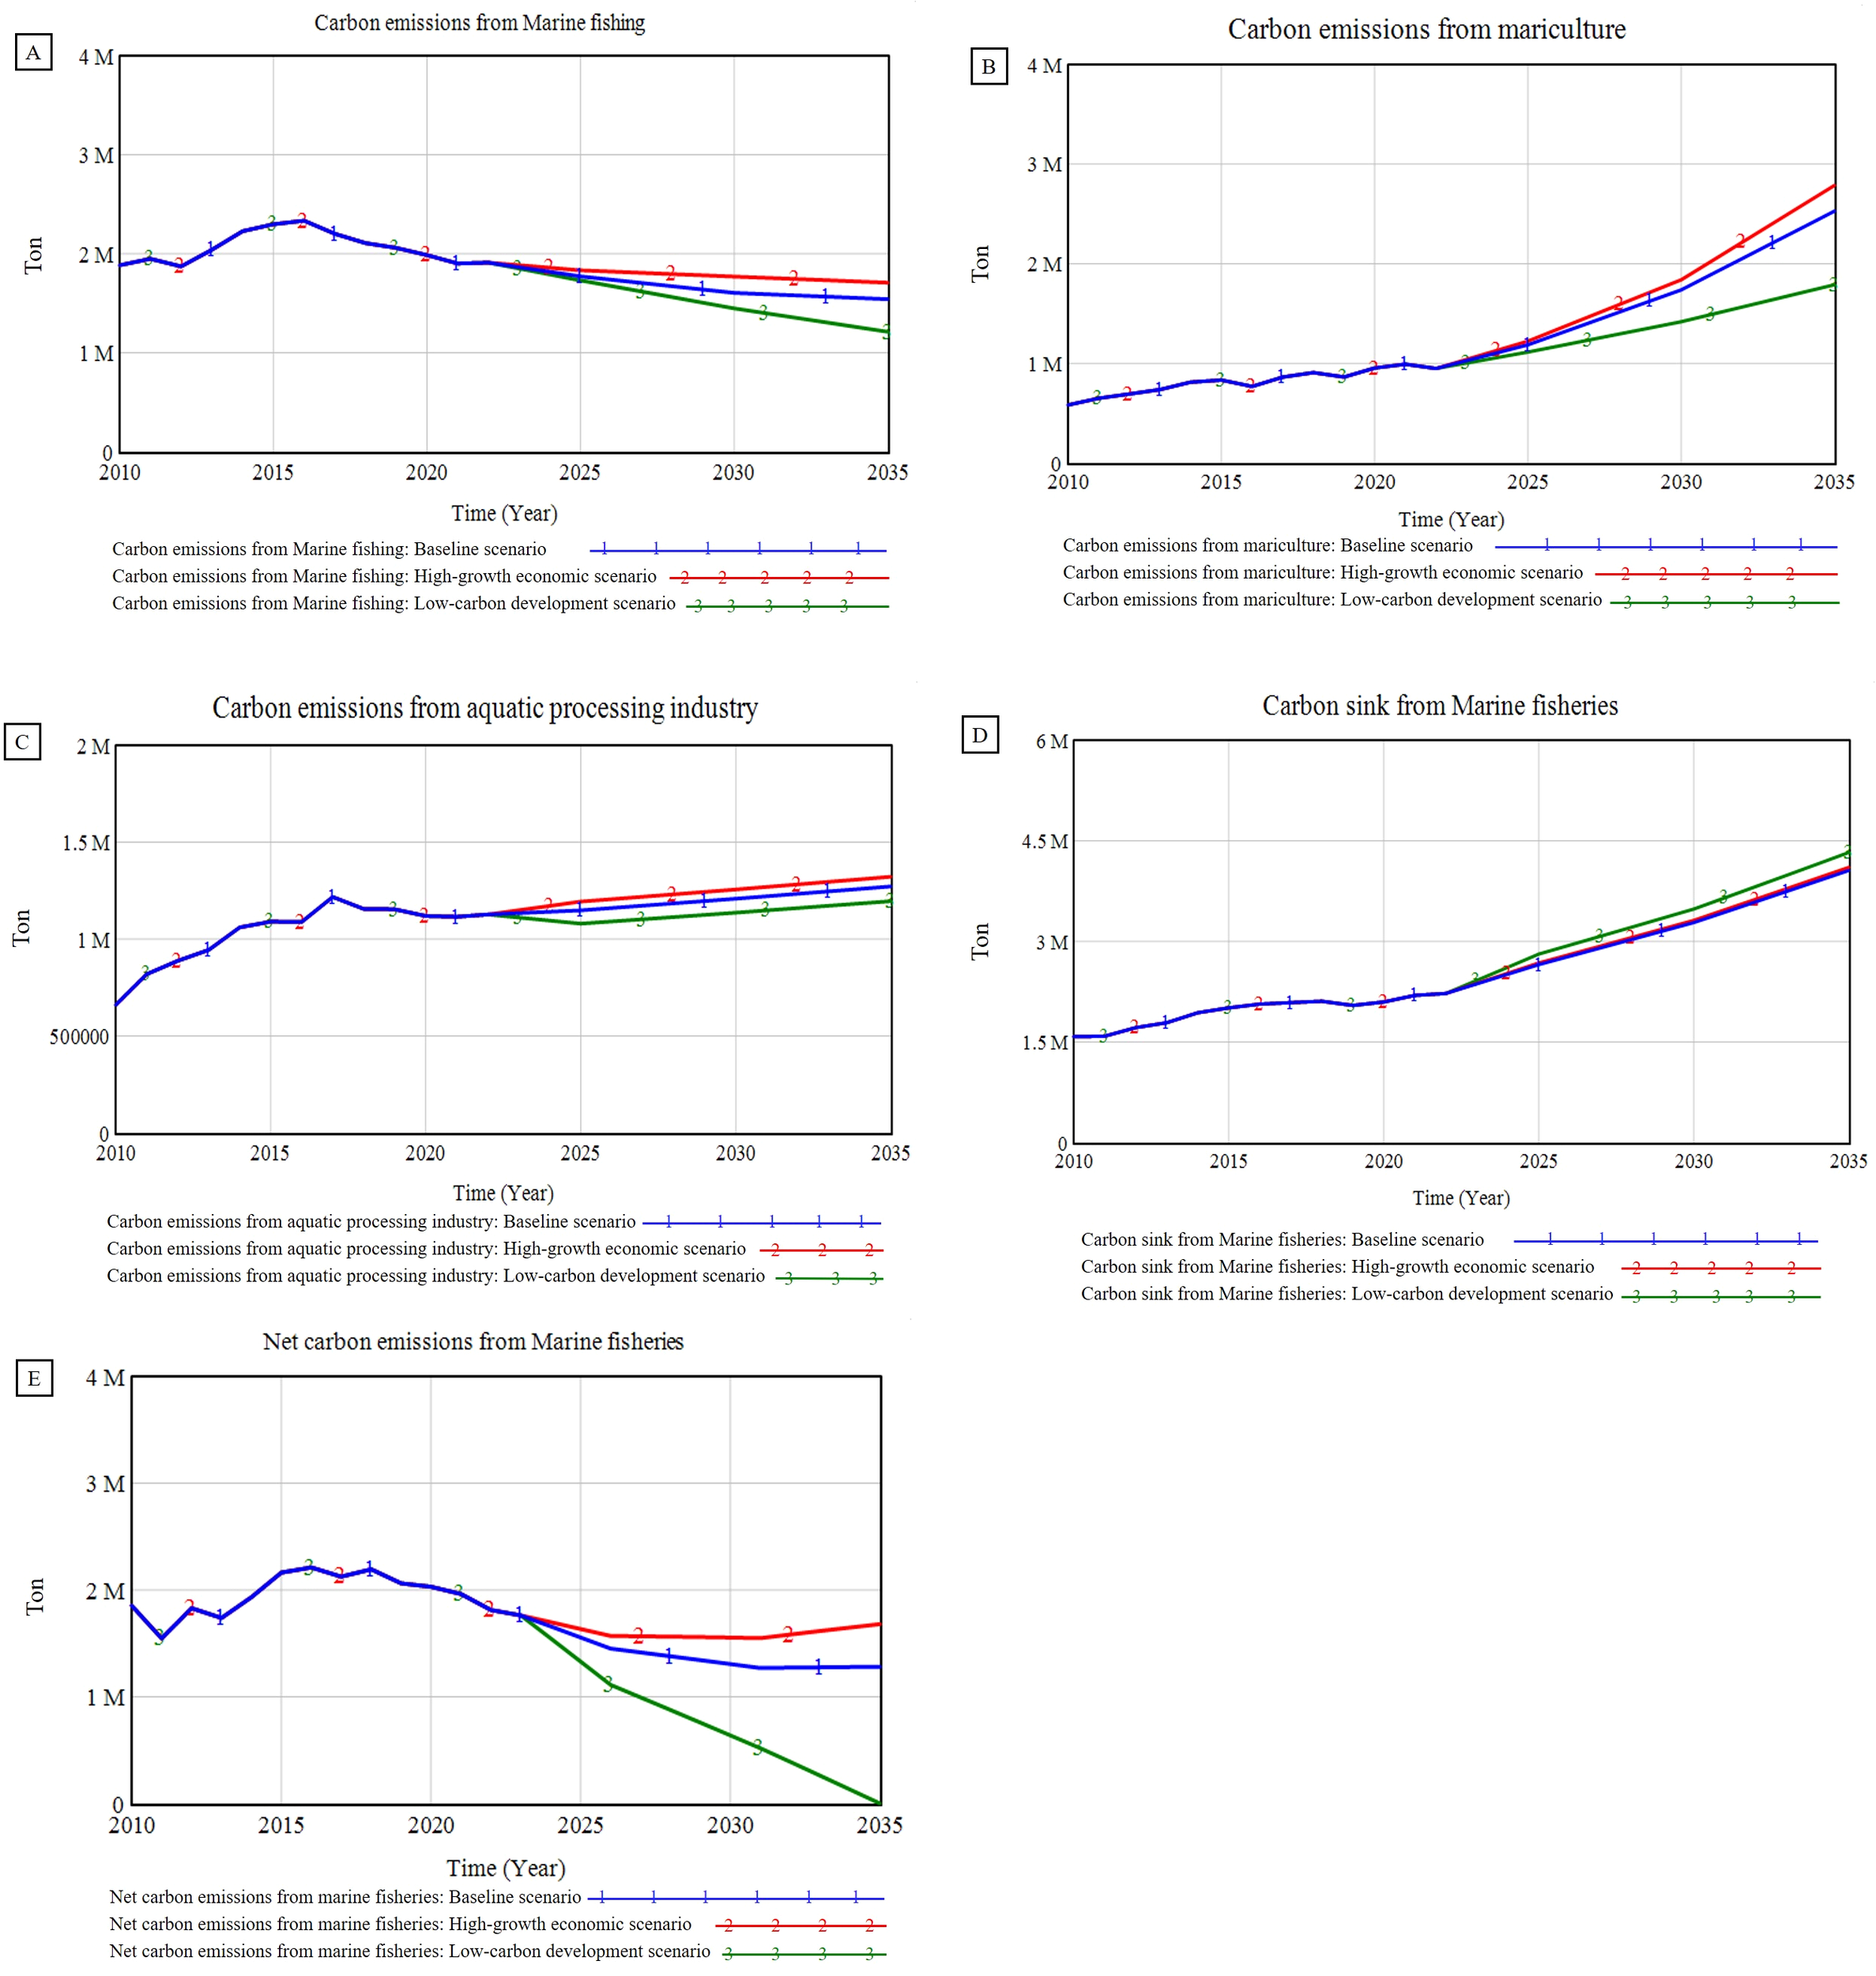
Carbon emissions prediction results for Shandong’s marine fisheries under different scenarios during 2023–2035: (A) carbon emissions from marine fishing; (B) carbon emissions from mariculture; (C) carbon emissions from the aquatic processing industry; (D) carbon sink from marine fisheries; (E) net carbon emissions from marine fisheries.
Figure 4E reveals significant differences in the net carbon emission trends of Shandong’s marine fisheries across the three scenarios, and we can see that the net carbon emissions from marine fisheries increased initially and then declined during 2010-2022, while scenario projections for 2023–2035 indicate a sharp reduction under the low-carbon development scenario, a gradual decline under the baseline scenario, and relatively high emission levels under the high-growth economic scenario.
As shown in Figures 4A–C, carbon emissions from marine capture exhibit a consistent declining trend across all scenarios, reflecting the effects of fleet restructuring and efficiency improvements. In contrast, carbon emissions from mariculture and aquatic product processing continue to increase, with the most pronounced growth occurring under the high-growth economic scenario, driven by accelerated expansion of production scale and processing capacity. Figure 4D shows that carbon sinks from shellfish and algae aquaculture increase steadily over time in all scenarios, with the fastest growth observed under the low-carbon development scenario, highlighting the strengthening role of carbon sink fisheries.
Under the baseline scenario (BS), net carbon emissions continue to decrease steadily after 2022, falling from 1.81×10⁶ tons to approximately 1.28×10⁶ tons by 2035. This trend indicates that, following the existing development trajectory, the gradual decline in capture-related emissions and the sustained growth of carbon sinks partially offset the increase in emissions from mariculture and aquatic product processing, resulting in a moderate reduction in net emissions.
Under the high-growth economic scenario (HG), net carbon emissions initially decline from 1.81×10⁶ tons in 2022 to around 1.55×10⁶ tons around 2030, but subsequently show a slight rebound, reaching about 1.68×10⁶ tons by 2035. This pattern suggests that although improvements in fishing efficiency help reduce capture-related emissions, the rapid expansion of mariculture and aquatic product processing driven by strong economic growth exerts upward pressure on total emissions, thereby slowing the overall decline in net carbon emissions.
In contrast, under the low-carbon development scenario (LD), net carbon emissions decrease sharply after 2022, dropping from 1.81×10⁶ tons to 2971.19 tons by 2035. The rapid decline is mainly attributed to substantial reductions in capture emissions combined with a significant enhancement of carbon sink capacity from shellfish and algae aquaculture. This scenario demonstrates that active implementation of low-carbon policies, energy efficiency improvements, and industrial structure optimization can effectively drive the marine fisheries system toward carbon neutrality within the projection period.
Overall, the comparison across scenarios indicates that low-carbon development pathways are substantially more effective than the baseline and high-growth economic scenarios in reducing net carbon emissions. This finding highlights the critical role of carbon sink fisheries and industrial structure optimization in promoting the long-term emission mitigation and sustainable transformation of Shandong’s marine fisheries.
3.3.3 Sensitivity analysis
On this basis, a single-factor sensitivity analysis was conducted to examine the influence of key parameters on net carbon emissions from marine fisheries in the SD model (Xu et al., 2025b). Each parameter was independently perturbed by ±10%, ± 20%, and ±30% from its baseline value, while all other parameters were held constant. To improve clarity and avoid redundancy, only the sensitivity indices under the ±30% variation scenario is reported in Table 11, as this range sufficiently reflects the relative importance of different parameters.
Table 11
| Rank | Parameter (± 30%) | Sensitivity index (2035) | Classification |
|---|---|---|---|
| 1 | Fuel oil consumption coefficient of marine fishing vessels | 1.2126 | Highly sensitive |
| 2 | Fuel oil consumption coefficient of mariculture vessels | 0.5450 | Moderately sensitive |
| 3 | Algae carbon sink coefficient | 0.0329 | Low sensitive |
| 4 | Shellfish carbon sink coefficient | 0.0206 | Low sensitive |
Sensitivity analysis of projected net carbon emissions in 2035.
The sensitivity of each parameter was measured using the sensitivity analysis factor (), The calculation formula is defined as follows:
Where represents the sensitivity index of the th parameter. denotes the value of the output variable (net carbon emissions) in the baseline scenario for the 2035 year. and represent the simulated output values when the parameter is increased or decreased by a fixed percentage, respectively. and denotes the relative change rate of the input parameter, corresponding to ±10%, ± 20%, and ±30% perturbations applied in the sensitivity analysis.
Based on the Equation 18, the results indicate that net carbon emissions are most sensitive to the fuel oil consumption coefficient of marine fishing vessels, followed by the fuel oil consumption coefficient of mariculture vessels. In contrast, the carbon sink coefficients of algae and shellfish exhibit relatively low sensitivity, suggesting a weaker short-term influence on overall net carbon emissions. Overall, the sensitivity analysis confirms that energy-related parameters play a dominant role in driving net carbon emissions in the marine fishery system, while biological carbon sink parameters contribute more moderately.
4 Conclusion and discussion
4.1 Conclusion
This study comprehensively analyzed net carbon emissions from marine fisheries in Shandong Province, China, from 2010 to 2022, revealed a clear temporal evolution characterized by an initial increase followed by a gradual decline, while marine carbon sinks showed a persistent and steady upward trend. A key finding is that marine capture fisheries consistently represented the largest share of emissions, identifying them as a primary target for mitigating efforts.
Through an extended Kaya identity and LMDI decomposition, we determined that population, economic scale, and carbon intensity were significant drivers of increased emissions, while improvements in energy intensity and industrial structure played crucial roles in their reduction. Notably, the reduction in energy intensity exerted the most substantial mitigation effect, underscoring the critical importance of technological progress.
Furthermore, leveraging System Dynamics (SD) theory, an SD model of marine fisheries’ carbon emissions in Shandong Province was developed. The model integrates socioeconomic, energy, and environmental subsystems. Model validity was examined using the Mean Absolute Percentage Error (MAPE) method by comparing simulated and observed values during 2010–2022 for multiple key variables, including net carbon emissions, carbon emissions from marine capture fisheries, population, and total value of marine fisheries. The validation results indicate that the model can reasonably reproduce the historical behavior of key variables in the marine fishery system. In addition, a sensitivity analysis focusing on projected net carbon emissions was conducted to assess the robustness of model responses to variations in key parameters. Overall, the results demonstrate that the proposed SD model provides a reliable and robust framework for simulating the long-term dynamics of carbon emissions in Shandong’s marine fisheries and for evaluating the impacts of alternative development pathways.
In summary, the key conclusions drawn from this research are as follows:
First, from 2010 to 2022, carbon emissions from Shandong’s marine fisheries exhibited a clear temporal evolution characterized by an initial increase followed by a gradual decline, while marine carbon sinks increased steadily over the same period. Net carbon emissions peaked in 2015 and then decreased continuously to 2022, reflecting the combined effects of declining capture-related emissions and the sustained expansion of carbon sinks. Marine fishing consistently remained the dominant source of carbon emissions, although its relative contribution declined over time, accompanied by a gradual increase in the shares of mariculture and aquatic product processing. The continuous growth of shellfish and algae mariculture significantly enhanced carbon sink capacity, playing an increasingly important role in moderating net carbon emissions in the later stage of the study period. These findings indicate that Shandong’s marine fisheries are progressing toward low-carbon development, with capture-dominated emissions increasingly offset by mariculture-driven carbon sinks.
Second, the LMDI decomposition analysis indicates that economic scale (231.46%) and population (84.62%) were the primary driving forces behind carbon emission growth in Shandong’s marine fisheries, while carbon intensity (8.17%) also exerted a positive but relatively limited effect. In contrast, energy intensity (-137.94%) and industrial structure (-86.31%) consistently acted as major inhibitory factors, offsetting a substantial proportion of emission increases associated with economic expansion. Interannual decomposition results further show that, after around 2017, emission-reduction forces increasingly outweighed emission-driving forces, leading to a moderation of overall emission growth. These findings suggest that improvements in energy efficiency and industrial structural adjustment have been critical in curbing carbon emissions despite continued economic development.
Finally, Scenario simulations for 2023–2035 reveal distinct net carbon emission trajectories under different development pathways. Under the baseline scenario (BS), net carbon emissions decline steadily as reductions in capture-related emissions and growing carbon sinks partially offset increases from mariculture and aquatic product processing. Under the high-growth economic scenario (HG), rapid expansion of mariculture and processing activities weakens the overall emission reduction effect, resulting in relatively higher net emissions in the long run. In contrast, the low-carbon development scenario (LD) achieves the most pronounced reduction in net carbon emissions, driven by simultaneous declines in capture emissions and a strong enhancement of carbon sink capacity from shellfish and algae aquaculture. The scenarios demonstrate that accelerating low-carbon policy implementation, optimizing industrial and energy structures, and strengthening carbon sink fisheries are therefore essential for advancing an earlier transition from carbon peaking to carbon neutrality, underscoring the effectiveness of targeted policy guidance and structural optimization in promoting green, sustainable, and high-quality development of marine fisheries.
4.2 Policy implications
Based on the calculation of net carbon emissions, decomposition of driving factors, and future system dynamics simulations for Shandong’s marine fisheries, this study provides the following insights to promote energy conservation, carbon emission reduction, enhanced carbon sequestration capacity, and high-quality development in the province’s marine fisheries.
-
Carbon emissions from Shandong’s marine fisheries are mainly driven by fuel consumption from fishing vessels, particularly in capture fisheries dominated coastal areas. Currently, a major proportion of vessels are small-scale and outdated, and fishing activities rely heavily on energy intensive technologies such as trawling and gillnetting, resulting in high fuel consumption and environmental stress. To reduce emissions, more than just replacing vessels is required, and regional fisheries characteristics within the province should be taken into account. In fishing-oriented regions, priority should be given to phasing out high energy consuming and obsolete vessels, upgrading existing vessels with energy saving technologies, and improving fishing methods to reduce fuel intensity. At the same time, part of the fishing capacity should be gradually guided toward alternative, lower-carbon activities, such as aquaculture and marine-ranching related operations, in suitable areas. This can help alleviate pressure on capture fisheries while supporting a structural shift toward low-carbon development. Similarly, strengthening the relationship between capture fisheries, marine ranching, and carbon sink fisheries can further enhance emission reduction effects. By coordinating fishing capacity adjustments with the expansion of marine ranching and shellfish and algae aquaculture, emission reduction from capture fisheries can be combined with carbon sequestration enhancement. Such an integrated, region-specific approach is more consistent with the development conditions of Shandong Province and provides a practical pathway for reducing emissions while protecting marine ecosystems.
-
The LMDI decomposition results indicate that population, economic scale, and carbon intensity are the main drivers of carbon emissions in Shandong’s marine fisheries, while improvements in energy intensity and industrial structure significantly suppress carbon emissions. This suggests that the current marine fisheries development still relies on high input, exacerbating carbon emissions. Therefore, it is essential to optimize the industrial structure by promoting the transition from primary to tertiary fisheries industries, developing emerging low-carbon sectors such as recreational, tourism, and sightseeing fisheries, and marine ranching. At the same time, strict enforcement of local fishing management policies is needed to control the proportion of high-carbon capture fisheries, thereby enhancing the overall low-carbon performance of the sector and coordinating economic growth with emission reduction.
-
System dynamics simulation results highlight the importance of marine carbon sinks in mitigating carbon emissions. Shandong Province has a natural advantage for carbon sink fisheries, as shellfish and algae aquaculture account for over 90% of total marine aquaculture. Expanding the scale and improving the efficiency of shellfish and algae farming, along with optimized spatial layout and management, can enhance carbon sequestration capacity. Developing carbon sink aquaculture not only offsets carbon emissions generated from production activities but can also help achieve negative net carbon emissions ahead of schedule, providing an effective pathway for promoting green, low-carbon, and high-quality development in Shandong’s marine fisheries.
4.3 Limitations
Despite efforts to comprehensively incorporate multiple types of energy consumption in constructing the carbon emission accounting framework for marine fisheries, this study is inevitably influenced by methodological heterogeneity in carbon accounting approaches and the selection of emission factors. Existing studies do not adopt a unified standard for carbon emission accounting: some rely on standard coal conversion coefficients, while others directly apply energy-specific carbon emission factors recommended by the IPCC. Such methodological differences may lead to quantitative discrepancies in estimated emission levels.
In addition, carbon emission estimation related to electricity consumption is subject to uncertainty due to the pronounced temporal variability of power grid emission factors. Owing to the limited availability of continuous province-level data across all years, this study relies on officially published grid emission factors for key benchmark years. This treatment may result in the underestimation or overestimation of carbon emissions in specific years, thereby affecting the accuracy of interannual comparisons.
With respect to carbon sink estimation, this study primarily estimates shellfish aquaculture carbon sinks based on shellfish production, dry-weight conversion ratios, and carbon content parameters, while distinguishing between CaCO3 shell carbon and soft tissue carbon. This approach is consistent with existing domestic technical guidelines and is widely applicable in regional-scale analyses. However, different carbon forms exhibit heterogeneous functional roles and ultimate fates within the marine carbon cycle. In particular, particulate organic carbon (POC) and dissolved organic carbon (DOC) released during shellfish and algae growth through respiration and metabolic processes may re-enter marine biogeochemical cycling over relatively short time scales, thereby introducing uncertainty in the accurate characterization of carbon sink effects. Accordingly, the carbon sink estimates in this study should be interpreted as potential carbon sequestration based on biomass carbon stock accounting, rather than as permanent carbon sequestration in a strict sense.
Furthermore, several key parameters in the system dynamics (SD) model remain dependent on historical statistical data and parameter settings adopted from existing literature. In the absence of long-term and continuous experimental observations, uncertainties persist with respect to parameter stability and scenario simulation outcomes. Future research could build upon the present framework by incorporating high-precision chemical measurements, for example, applying improved ultraviolet oxidation-isotope measurement techniques (Xu et al., 2021), to quantitatively assess POC and DOC released during shellfish and algae aquaculture. Introducing explicit carbon fate or retention coefficients would allow for a more refined representation of different carbon pathways, thereby enhancing parameter reliability and more realistically capturing the dynamic evolution and long-term potential of carbon emissions and carbon sinks in marine fishery systems.
From a methodological perspective, future studies may further draw on the EBM-GML modeling framework proposed by Shen et al. (2023). By incorporating undesirable outputs into the measurement of fisheries total factor productivity, this framework systematically reveals the spatiotemporal evolution and driving mechanisms of green productivity in China’s fisheries sector under environmental constraints. It offers a mature and highly transferable analytical approach for research on green fisheries development, in which green development is no longer reflected solely by output expansion, but instead emphasizes the integrated trade-offs among resource consumption, economic performance, and environmental impacts.
Statements
Data availability statement
The original contributions presented in the study are included in the article/supplementary material. Further inquiries can be directed to Erchun He, hec8755@pukyong.ac.kr.
Author contributions
EH: Formal analysis, Writing – review & editing, Data curation, Writing – original draft, Visualization, Software. HJ: Funding acquisition, Writing – review & editing, Methodology, Formal analysis, Conceptualization, Supervision. CZ: Conceptualization, Writing – review & editing, Supervision.
Funding
The author(s) declared that financial support was received for this work and/or its publication. This work was supported by a Research Grant of Pukyong National University (202308840001).
Conflict of interest
The author(s) declared that this work was conducted in the absence of any commercial or financial relationships that could be construed as a potential conflict of interest.
Generative AI statement
The author(s) declared that generative AI was not used in the creation of this manuscript.
Any alternative text (alt text) provided alongside figures in this article has been generated by Frontiers with the support of artificial intelligence and reasonable efforts have been made to ensure accuracy, including review by the authors wherever possible. If you identify any issues, please contact us.
Publisher’s note
All claims expressed in this article are solely those of the authors and do not necessarily represent those of their affiliated organizations, or those of the publisher, the editors and the reviewers. Any product that may be evaluated in this article, or claim that may be made by its manufacturer, is not guaranteed or endorsed by the publisher.
Footnotes
1.^ Shandong Provincial People's Government (2021). 14th Five-Year Plan for Marine Economic Development of Shandong Province. Available at: https://gb.shandong.gov.cn/jpaas-jpolicy-web-server/front/info/detail?iid=9d7f1b959d724f358ea8f759576b9ce9.
2.^Ministry of Ecology and Environment of the People's Republic of China, https://www.mee.gov.cn/xxgk2018/xxgk/xxgk06/202508/W020250805356955461420.pdf
3.^Ministry of Natural Resources of the People’s Republic of China (2021). HY/T 0305–2021: Estimation method of maricultural seaweed and bivalve carbon sink- Carbon stock variation method.
4.^Ministry of Natural Resources of the People’s Republic of China (2022). HY/T 0349–2022: Accounting methods for economic value of ocean carbon sink.
References
1
Cao L. Fan L. M. (2022). Research on driving factors of China’s marine fisheries carbon emissions based on STIRPAT model. Ocean Dev. Manage., 39, 39–46. doi: 10.20016/j.cnki.hykfygl.20220609.003
2
Chen X. Di Q. Hou Z. Yu Z. (2022). Measurement of carbon emissions from marine fisheries and system dynamics simulation analysis: China’s northern marine economic zone case. Mar. Policy145, 105279. doi: 10.1016/j.marpol.2022.105279
3
Chen X. Sun Z. Di Q. Liang C. (2024). Marine fishery carbon emission reduction and changing factors behind marine fishery eco-efficiency growth in China. Ecol. Inf.80, 102478. doi: 10.1016/j.ecoinf.2024.102478
4
Dai G. L. Guo E. X. (2022). Spatiotemporal evolution and factor decomposition of marine fishery resource utilization intensity in China. China Fisheries Economy, 40, 38–45. doi: 10.3969/j.issn.1009-590X.2022.03.005
5
De Myttenaere A. Golden B. Le Grand B. Rossi F. (2016). Mean Absolute Percentage Error for regression models. Neurocomputing192, 38–48. doi: 10.1016/j.neucom.2015.12.114
6
Forrester J. W. Klaus P. Müller S. (2012). “ Industrial Dynamics: A major breakthrough for decision makers,” in The roots of logistics ( Springer, Berlin, Heidelberg). doi: 10.1007/978-3-642-27922-5_13
7
IPCC (2023). Contribution of working groups I, II and III to the sixth assessment report of the intergovernmental panel on climate change. doi: 10.59327/IPCC/AR6-9789291691647.001
8
Jin Y. Ma J. Li C. Hu Q. (2024). Assessment and spatio-temporal evolution of marine fisheries’ carbon sink capacity in China’s three marine economic circles. Fishes9, 318. doi: 10.3390/fishes9080318
9
Kaya Y. (1989). Impact of carbon dioxide emission control on GNP growth: interpretation of proposed scenarios (Geneva, Switzerland: Intergovernmental panel on climate change/response strategies working group).
10
Lewis C. D. (1982). Industrial and business forecasting methods: A practical guide to exponential smoothing and curve fitting (London: Butterworths).
11
Li C. Feng W. Shao G. L. (2018). Spatio-temporal difference of total carbon emission efficiency of fishery in China. Economic Geogr., 38, 179–187. doi: 10.15957/j.cnki.jjdl.2018.05.022
12
Li C. Li H. Y. Kong H. Z. Feng W. (2021). Structural characteristics and driving factors of embodied carbon emissions from fishery production system in China. Resour. Sci., 43, 1166–1177. doi: 10.18402/resci.2021.06.09
13
Li X. Lin C. Lin M. Jim C. (2023). Drivers, scenario prediction and policy simulation of the carbon emission system in Fujian Province (China). J. Cleaner Production434, 140375. doi: 10.1016/j.jclepro.2023.140375
14
Li G. Tan C. Zhang W. Zheng W. Liu Y. (2023). Carbon emission efficiency, technological progress, and fishery scale expansion: Evidence from marine fishery in China. Sustainability15, 6331. doi: 10.3390/su15086331
15
Liang R. J. (2016). Analysis of marine fishery resource issues in Shandong Province. China Agric. Inf., 38–39.
16
Lin B. Q. (2022). China’s high-quality economic growth in the process of carbon neutrality. Economic Res. J., 57, 56–71.
17
Lin C. Li X. (2024). Carbon peak prediction and emission reduction pathways exploration for provincial residential buildings: Evidence from Fujian Province. Sustain. Cities Soc.102, 105239. doi: 10.1016/j.scs.2024.105239
18
Liu L. L. (2007). Preliminary study on the development status and SD simulation of marine fishery resource enhancement and release in Shandong Province. Qingdao, China: Ocean University of China. doi: 10.7666/d.y1112114
19
Liu G. Xu Y. Ge W. Yang X. Su X. Shen B. et al . (2022). How can marine fishery enable low carbon development in China? Based on system dynamics simulation analysis. Ocean Coast. Manage.231, 106382. doi: 10.1016/j.ocecoaman.2022.106382
20
Ministry of Agriculture and Rural Affairs of China (MARA) (2010). Available online at: https://www.gov.cn/gongbao/content/2010/content_1629134.htm
21
Rokhmawati A. Sarasi V. Berampu L. T. (2024). Scenario analysis of the Indonesia carbon tax impact on carbon emissions using system dynamics modeling and STIRPAT model. Geogr. Sustainability5, 577–587. doi: 10.1016/j.geosus.2024.07.003
22
Shandong Provincial People’s Government (2021). The 14th Five-Year Plan for Marine Economic Development of Shandong Province. Available online at: http://www.shandong.gov.cn/art/2021/11/12/art_97898_512097.html
23
Shao G. L. Chen L. J. (2012). An empirical study of carbon emissions and economic growth based on decoupling analysis-A case study of Shandong Province. J. Ocean Univ. China (Social Sciences), 73–79. doi: 10.3969/j.issn.1672-335X.2012.04.013
24
Shao G. L. Chu R. Li C. (2018). Research on carbon balance of marine fishery in Shandong Province using the calculation results of carbon emission and carbon sink. China Fisheries Economy, 36, 4–13. doi: 10.3969/j.issn.1009-590X.2018.04.001
25
Shao G. Kong H. Yu J. Li C. (2015). A study on the decomposition of driving factors of carbon emissions in China’s marine fisheries based on the LMDI method. J. Agrotechnical Econ, 119–128. doi: 10.13246/j.cnki.jae.2015.06.013
26
Shao G. L. Liu B. Li C. (2019). Evaluation of carbon dioxide capacity and the effects of decomposition and spatio-temporal differentiation of seawater in China’s main sea area based on panel data from 9 coastal provinces in China. Acta ecologica Sin.39, 2614–2625. doi: 10.5846/stxb20180108004
27
Shen W. Ge H. Bao J. (2023). Green total factor productivity growth and its driving forces in China’s fisheries sector. Front. Sustain. Food Syst.7. doi: 10.3389/fsufs.2023.1281366
28
Shen W. Zhong S. Yang X. (2025). The effects of digitalization on the quality of marine economic development: Evidence from a micro-level perspective. Front. Mar. Sci.12. doi: 10.3389/fmars.2025.1587019
29
Song T. S. Guo S. L. Diao Y. H. (2014). Spatiotemporal characteristics and disparity analysis of carbon emissions in the Shandong Peninsula Blue Economic Zone. Stat Decision, 109–111. doi: 10.13546/j.cnki.tjyjc.000086
30
Song J. Liu Z. Huang K. Leng X. Xiao H. (2024). Decomposition of driving factors of carbon emissions and carbon sinks from marine fishery production in China. Ocean Coast. Manage.259, 107476. doi: 10.1016/j.ocecoaman.2024.107476
31
Su M. Yang Y. (2018). Evolution of district marine policies in China: The case of Shandong Province. Mar. Policy89, 124–131. doi: 10.1016/j.marpol.2017.12.028
32
Sun K. Cui Q. Su Z. Wang Y. (2020). Spatio-temporal evolution and influencing factors of the economic value for mariculture carbon sinks in China. Geographical Res., 39, 2508–2520. doi: 10.11821/dlyj020190731
33
Tan K. Liu X. Yan X. Huang L. Luo C. Kwan K. Y. (2024). Performance of fishery carbon sink of oyster aquaculture (mainly Crassostrea hongkongensis) in Guangxi, China: a long-term, (2003–2022) analysis. Estuarine Coast. Shelf Sci.300, 108707. doi: 10.1016/j.ecss.2024.108707
34
Tang Q. (2011). Carbon sink fisheries and the sound and rapid development of modern fisheries. Jiangxi Fishery Sci. Technol., 5–7. doi: 10.3969/j.issn.1006-3188.2011.02.002
35
Tang Q. Zhang J. Fang J. (2011). Shellfish and seaweed mariculture increase atmospheric CO2 absorption by coastal ecosystems. Mar. Ecol. Prog. Ser.424, 97–104. doi: 10.3354/meps08979
36
Tang Z. M. Zhang X. Huang H. L. Chen X. X. Chai X. F. (2010). Analysis of the causes of high energy consumption in China’s marine capture fisheries and countermeasure suggestions. China Fisheries24–25. doi: 10.3969/j.issn.1002-6681.2010.06.010
37
Tian P. Wang H. H. Li J. L. Liu Y. C. Zhang H. T. Zhong J. et al . (2023). Spatiotemporal variation characteristics and system dynamic simulation of China’s marine fishery carbon emissions. Resour. Sci., 45, 1074–1090. doi: 10.18402/resci.2023.05.15
38
Wang G. Feng Y. (2023). Assessment and prediction of net carbon emission from fishery in Liaoning Province based on eco-economic system simulation. J. Cleaner Production419, 138080. doi: 10.1016/j.jclepro.2023.138080
39
Wu D. Q. Liu L. C. (2025). Decoupling relationship and driving factors between carbon emissions and economic growth in China’s freshwater aquaculture industry: based on Tapio decoupling and LMDI model. J. Fisheries China, 49, 211–223. doi: 10.11964/jfc.20231114242
40
Xu X. Q. (2024). Simulation of fishery energy consumption and carbon emission reduction in Zhoushan City based on the long-range energy alternatives planning system model. 2, 45–50. doi: 10.27747/d.cnki.gzjhy.2024.000214
41
Xu L. Huang J. Fu S. Chen J. (2025b). Evaluation of navigation capacity in the Northeast Arctic passage: Evidence from multiple factors. Maritime Policy Manage.52, 497–513. doi: 10.1080/03088839.2024.2376126
42
Xu H. Liu H. Zhang J. H. Ni Q. Shen J. Jiang L. (2007). Estimation of energy consumption in China’s fisheries. China Fisheries74-76, 78. doi: 10.3969/j.issn.1002-6681.2007.11.048
43
Xu J. Qin T. Han L. (2018). A review of research on marine carbon sink fisheries. Resour. Sci.40, 161–172. doi: 10.18402/resci.2018.01.15
44
Xu L. Roberts M. L. Elder K. L. Kurz M. D. McNichol A. P. Reddy C. M. et al . (2021). Radiocarbon in dissolved organic carbon by UV oxidation: procedures and blank characterization at NOSAMS. Radiocarbon63, 357–374. doi: 10.1017/RDC.2020.102
45
Xu L. Wu J. Yan R. Chen J. (2025a). Is international shipping in right direction towards carbon emissions control? Transport Policy166, 189–201. doi: 10.1016/j.tranpol.2025.03.009
46
Xu X. Q. Zhao S. (2024). Study of aquaculture carbon emissions in Zhejiang Province based on the long-range energy alternatives planning system model. Anhui Agric. Sci., 45–50. doi: 10.3969/j.issn.0517-6611.2024.09.011
47
Yan J. M. (2023). Simulation study on agricultural carbon emissions and its influencing factors based on system dynamics. Zhengzhou, China: Henan Agricultural University.
48
Yang L. Wang X. Nie H. Shao L. Wang G. Liu Y. (2016). Residual levels of rare earth elements in freshwater and marine fish and their health risk assessment from Shandong, China. Mar. pollut. Bull.107, 393–397. doi: 10.1016/j.marpolbul.2016.03.034
49
Ye S. (2024). Analysis of influencing factors of carbon emissions from China’s marine fishery energy consumption under different development scenarios. Front. Mar. Sci.11. doi: 10.3389/fmars.2024.1377215
50
Yue D. Wang L. Fang H. Geng R. Zhao P. Xiong M. et al . (2016). Development strategy of marine fisheries in China based on the carbon balance. J. Agric. Sci. Technol., 18, 1–8. doi: 10.13304/j.nykjdb.2015.695
51
Zhang L. (2014). Carbon emissions prediction research based on system dynamics. Beijing, China: North China Electric Power University. doi: 10.7666/d.D529232
52
Zhang Z. L. Wang W. He Y. P. (2010). The calculation of emissions of carbon during the process of fishing boats operations in China. J. Shanghai Ocean Univ., 19, 848–852.
53
Zhu X. K. (2022). Research on the relationship between net carbon emissions and economic growth: Taking the marine fishery of Zhejiang Province as an example. Shanghai Ocean University, Shanghai, China.
54
Zhu X. K. Tan C. L. Zhang Y. (2023). Research on decomposition of factors affecting net carbon emissions from marine fisheries in Zhejiang Province. Mar. Economy, 13, 25–33. doi: 10.19426/j.cnki.cn12-1424/p.20211027.001
Summary
Keywords
carbon emissions, extended Kaya-LMDI method, marine fisheries, sustainable transition, systemic dynamics
Citation
He E, Jang H and Zhang C (2026) Integrated carbon emissions modelling and scenario analysis of marine fisheries in Shandong Province, China. Front. Mar. Sci. 13:1765685. doi: 10.3389/fmars.2026.1765685
Received
11 December 2025
Revised
13 January 2026
Accepted
13 January 2026
Published
06 February 2026
Volume
13 - 2026
Edited by
Yi-Che Shih, National Cheng Kung University, Taiwan
Reviewed by
Shen Weiteng, Zhejiang Wanli University, China
Yassine Charabi, Kuwait University, Kuwait
Updates
Copyright
© 2026 He, Jang and Zhang.
This is an open-access article distributed under the terms of the Creative Commons Attribution License (CC BY). The use, distribution or reproduction in other forums is permitted, provided the original author(s) and the copyright owner(s) are credited and that the original publication in this journal is cited, in accordance with accepted academic practice. No use, distribution or reproduction is permitted which does not comply with these terms.
*Correspondence: HoGeun Jang, hogeun.jang@pknu.ac.kr
Disclaimer
All claims expressed in this article are solely those of the authors and do not necessarily represent those of their affiliated organizations, or those of the publisher, the editors and the reviewers. Any product that may be evaluated in this article or claim that may be made by its manufacturer is not guaranteed or endorsed by the publisher.