Abstract
Endogenous phosphorus (P) release and its complex biogeochemical transformation pose ongoing challenges for effective P management in estuarine ecosystems. However, the understanding of how these processes respond to runoff regulations remains rarely constrained. This study investigated the spatiotemporal distribution of P forms in bottom water and sediment of the Liao River Estuary under anthropogenic runoff regulations characterized by low runoff in summer and normal runoff in winter. The sediment P adsorption capacity and release potential were studied through adsorption kinetics and thermodynamic experiments. Soluble reactive P (SRP) and total dissolved P (TDP) concentrations in bottom water were low in summer but increased markedly in winter (p<0.01). The average sediment total P (TP) concentrations were 495.26 mg/kg in summer and 399.62 mg/kg in winter, with higher TP levels mainly observed in the nearshore muddy areas, likely attributable to the high proportion of fine particles. Equilibrium P concentration generally exceeded the SRP concentration in bottom water under both conditions, indicating that the sediment served as a P source. The sediment P eutrophication risk index (ERI) further showed that release risk was predominantly moderate in summer, whereas it was low in winter. Both PLS-PM and correlation analysis showed that the concentrations of Fe, Al, organic matter, and the proportion of fine particles served as key determinants influencing the content of aluminum-bound P (NaOH-rP), organic P (NaOH-nrP), and calcium-bound P (HCl-P). Furthermore, elevated SRP levels combined with reduced salt in winter likely constrain P accumulation in the sediment. This study offers novel insight into the migration and transformation of P in the estuarine environment under anthropogenic runoff regulations.
1 Introduction
Phosphorus (P) is a key limiting nutrient for marine primary productivity. Excessive P loading stemming from both external inputs and endogenous release can trigger severe ecological degradation, such as harmful algal blooms and estuarine eutrophication (Conley et al., 2009; Cloern et al., 2016; Cui et al., 2021). Despite long-term efforts to reduce terrestrial P loading, P in sediment remains a persistent challenge, with studies demonstrating that endogenous P accounts for approximately 60%~80% of total P loads in estuaries (Pan et al., 2019; Chen et al., 2022). Therefore, understanding the mechanisms governing endogenous P release and retention is crucial for effective P control in estuarine ecosystems.
Under the joint impacts of runoff input and tidal action, estuarine environments exhibit highly dynamic and complex water environmental conditions, characterized by salt gradients, hydrodynamic exchanges, redox state, organic matter content, sediment properties, and biological activity (Kraal et al., 2015; Labry et al., 2016; Roy et al., 2017; Lenstra et al., 2018; Walve et al., 2018). Salt gradient in estuaries alters ionic composition, where elevated concentrations of Cl-, HCO3-, and SO42- compete with phosphate for adsorption sites, thereby reducing the P adsorption from sediment (Flower et al., 2017; Wang et al., 2022). Hypoxia during summer and autumn in the Baltic Sea estuary promoted sediment P release, while spring phytoplankton blooms facilitated the P deposition (Walve et al., 2018). The increasing proportion of fine-grained sediments from the delta to the inner estuary in the Yellow River estuary enhanced P adsorption capacity (Wang et al., 2021).
P in sediment is typically present in various geochemical fractions. Inorganic P is often bound to calcium, iron, manganese, or aluminum compounds, while organic P exists in humic substances and biogenic debris (Liu et al., 2015; Bai et al., 2020a). The labile P (NH4Cl-P), redox-sensitive P (BD-P), aluminum-bound P (NaOH-rP), and organic P (NaOH-nrP) are more likely to release soluble reactive P (SRP), thereby contributing to P recirculation in bottom water (Rydin, 2000; Younis et al., 2022). In contrast, inert inorganic P (Res-P), calcium-bound P (HCl-P), and other insoluble organic P are regarded as permanently bound forms stored in sediment (Kaiserli et al., 2002; Lukkari et al., 2008). The transformation and mobility of these P forms are susceptible to environmental changes. For example, water diversion from the Mississippi River to the Lake Pontchartrain estuary was found to increase the concentrations of readily available inorganic P, Fe/Al-bound inorganic P, and labile organic P in the inflow zone, resulting in endogenous P releases of up to 0.3 g/m2 (Roy et al., 2017). Summer hypoxia in the Yangtze River estuary has been shown to reduce BD-P and NaOH-nrP concentrations, thereby promoting SRP fluxes from sediment to the overlying water (Liu et al., 2020).
P adsorption-desorption is a crucial process that determines the exchange flux of SRP between bottom water and sediment (Jensen et al., 1995; Delaney, 1998; Paytan and McLaughlin, 2007). Functional groups on the surface of sediment particles adsorb both cations and anions (such as Fe3+, Al3+, and PO43-), thereby participating in the adsorption and immobilization of P, with sediment acting as a P sink. However, changes in environmental conditions can lead to competition between PO43- and other anions for adsorption sites, reversing the role of sediment from a P sink to a P source, and promoting the release of SRP into the overlying water (Sundby et al., 1992; Zhou et al., 2005; Huang et al., 2012). SRP concentration and equilibrium P concentration (EPC0) are key determinants of the P adsorption-desorption process in sediment (Kuo, 1988; Smith et al., 2006). In Jiaozhou Bay, China, EPC0 was reported to be significantly higher than SRP concentrations, indicating that the sediment served as a P source (Zhang et al., 2022b), while a reverse trend was observed in the Beiyun River, China, where the sediment functioned as a P sink (Liao et al., 2020).
Despite previous studies that have explored the P transformation behaviors in estuarine environments, the spatiotemporal distribution of P forms and adsorption behaviors under the combined influences of anthropogenic runoff regulation, tidal forces, and seasonal environmental variations remain inadequately understood. The Liao River Estuary (LRE), China, has long been in a P-limited state, while the SRP concentration has increased more than tenfold over the past 15 years (Statham, 2012; He et al., 2022). Anthropogenic regulation of the incoming runoff has significantly altered P flux inputs and the estuarine environment (Wu et al., 2019; Wang et al., 2020). The LRE thus represents an exemplary case for investigating endogenous P mechanisms under the combined influence of anthropogenic runoff regulation and natural factors. In this study, the spatiotemporal distribution of various P forms in the bottom water and sediment was examined based on two field surveys in summer and winter under different runoff regulation regimes. Thermodynamic and adsorption kinetic experiments were then performed to characterize P adsorption characteristics on sediment and assess the P release potential. Overall, this study advances our understanding of P biogeochemical behavior in estuarine systems under the impacts of terrestrial anthropogenic regulation and seasonal environmental changes.
2 Materials and methods
2.1 Study area and field sampling
The LRE is located in the Liaodong Bay, and is the northernmost estuary in China (Figure 1). The region is characterized by a semi-humid temperate monsoon climate, with an average annual precipitation of 611.6 mm, approximately 70~80% of which occurs between July and September. The LRE features a distinctive funnel-shaped bay formed by the combined influence of tidal action and river runoff. The river runoff into the LRE is greatly regulated by the Panshan gate, situated approximately 45 km upstream. The gate is typically closed from January to July to store water for agricultural and industrial purposes, resulting in low runoff into the estuary. In contrast, it opens during the remaining time and allows normal to high runoff discharge (Supplementary Text S1) (Ye et al., 2013; Hu et al., 2023).
Figure 1
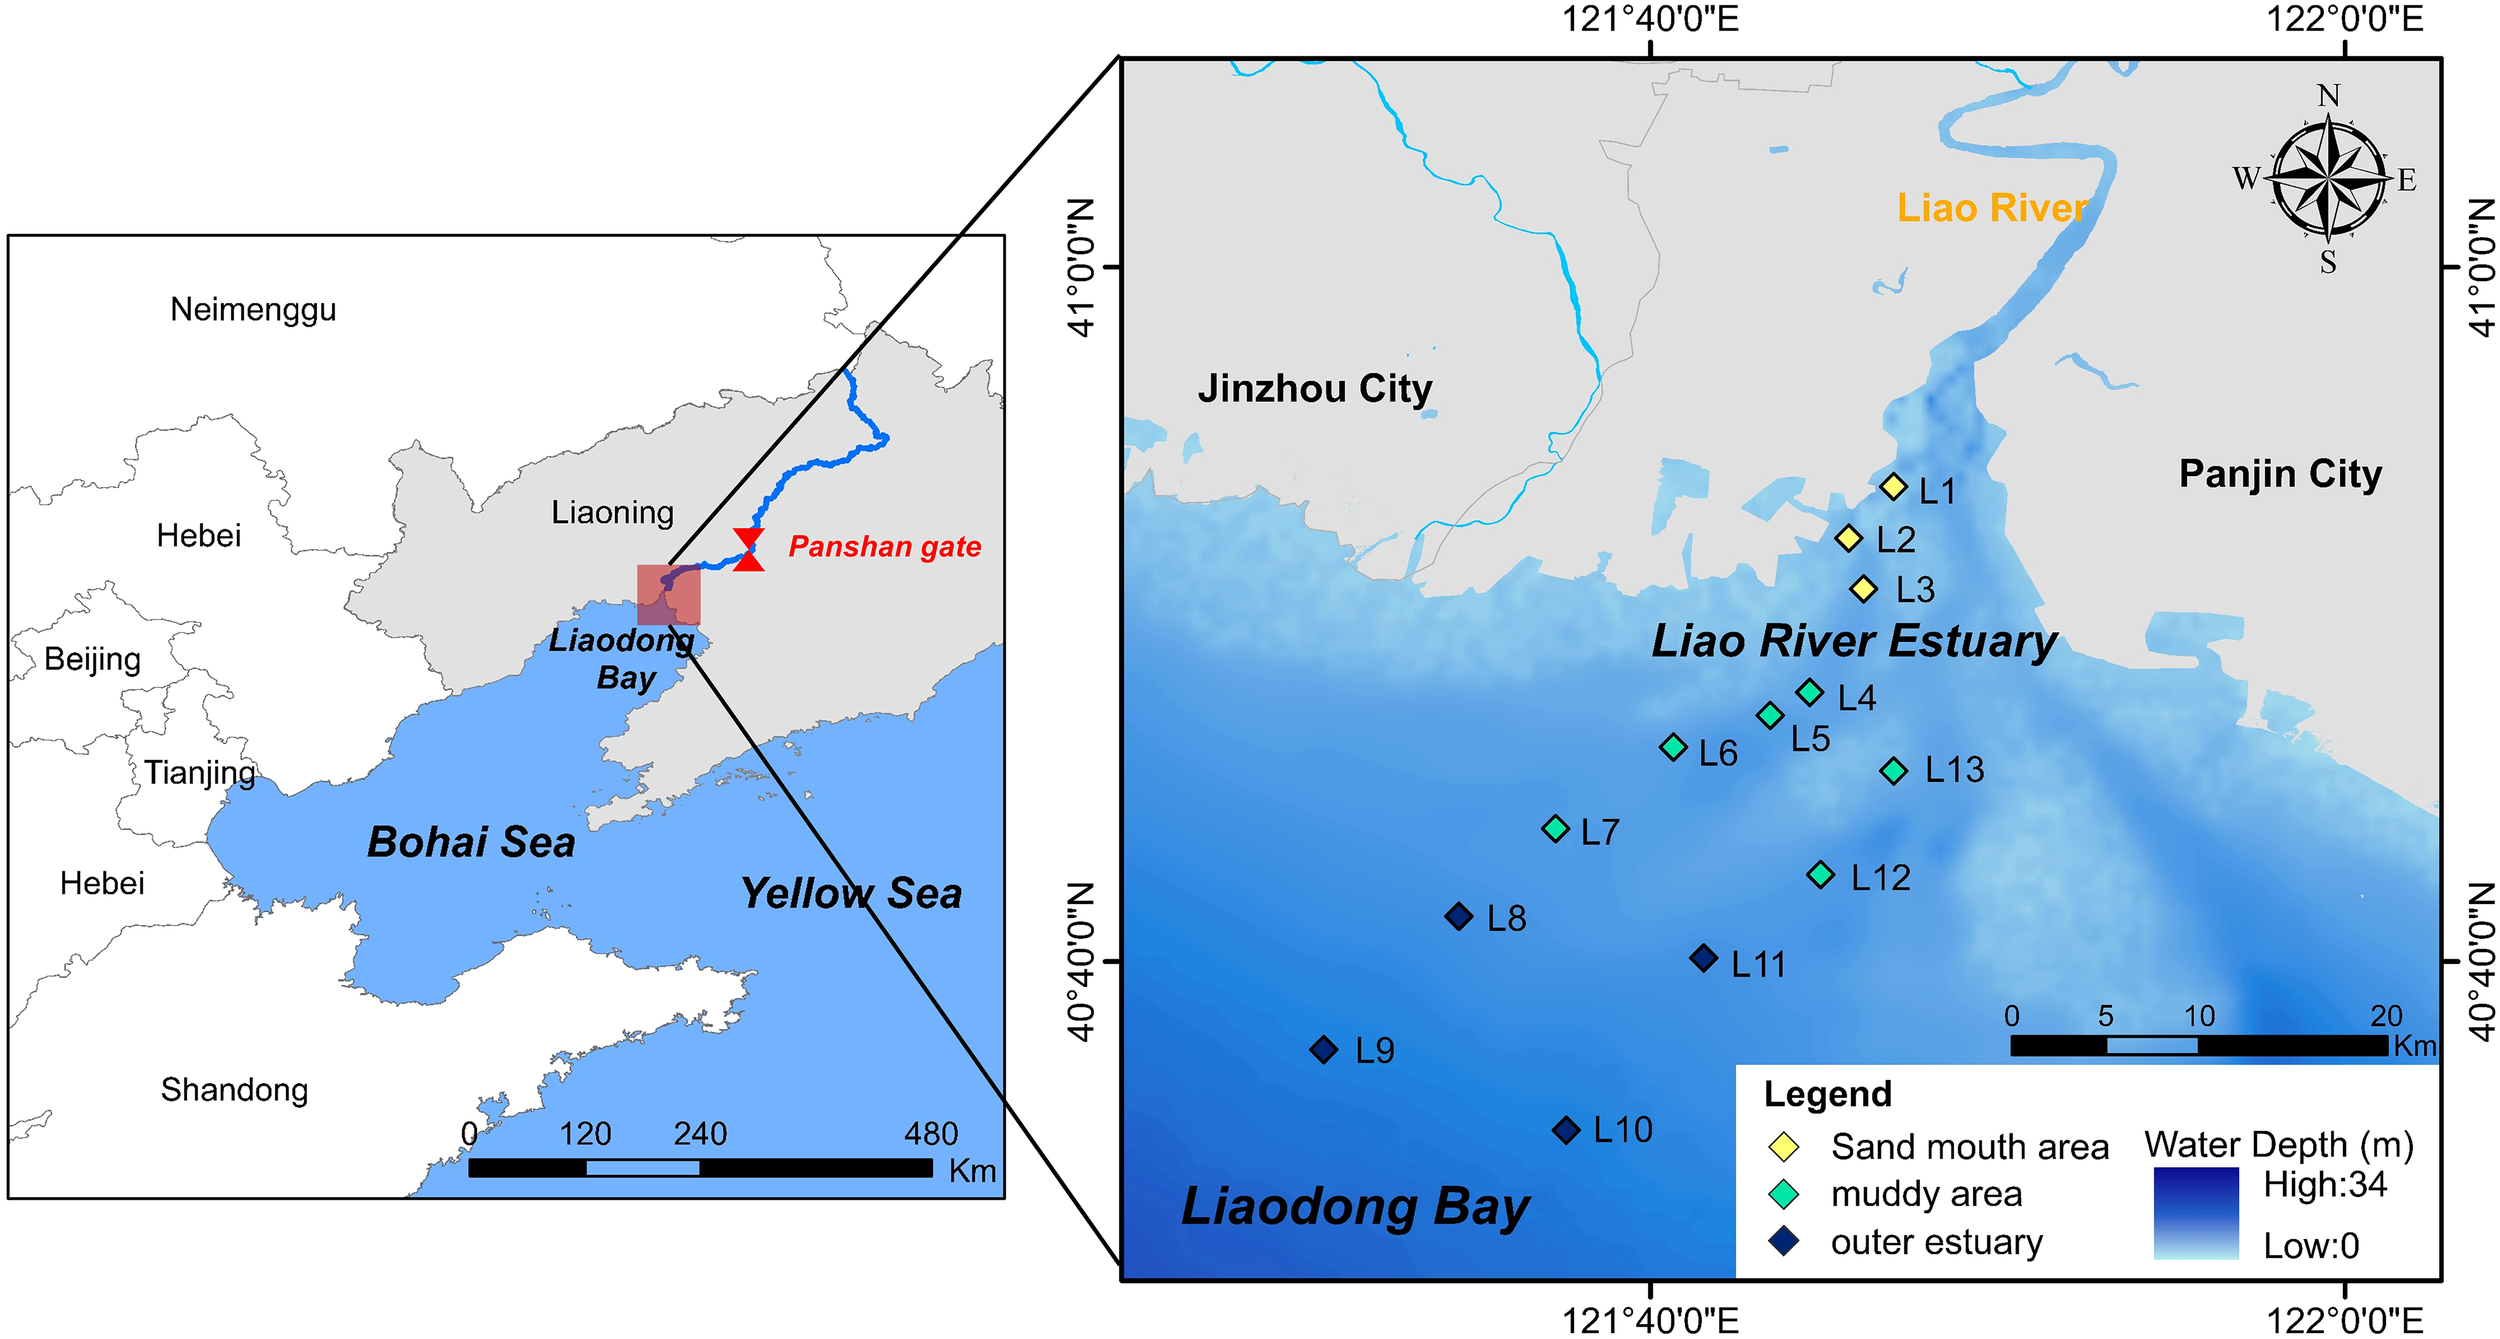
Study area and sampling sites.
Two cruise surveys were conducted in June and November 2022, both during neap-tide periods, but with marked differences in inflowing runoffs due to gate operation. June experienced low runoff and represented the summer season, whereas November exhibited normal runoff conditions and characterized a near-winter environment before the onset of ice formation. Runoff regulation and seasonal variation jointly led to distinct environmental differences between the two observation periods, including water temperature (T), dissolved oxygen (DO), and salt. Thirteen sampling sites were deployed along the river-to-marine salt gradient (Figure 1), representing three hydro-sedimentary environments as informed by previous studies (Zhou et al., 2022; Douglas et al., 2025) and our laboratory physicochemical analyses (detailed sampling conditions are provided in Supplementary Text S1). Specifically, the estuarine sandy mouth area (L1, L2, L3) was chosen to capture the impact of intense terrestrial sediment input and relatively low salt levels. The muddy area (L4, L5, L6, L7, L12, L13) was identified by its fine-grained sediments and enrichment of organic carbon. Finally, the outer estuary area (L8, L9, L10, L11) represented a marine-dominated environment with higher primary productivity and salt levels. These areas can adequately capture the spatial heterogeneity of sediment properties, the salt gradient, and the varying influence of terrestrial P input. Bottom water was collected approximately 0.5 m above the sediment using a Niskin bottle (Hydro-Bios Apparatebau GmbH, Germany). Upon arrival at the laboratory, the samples were filtered through a 0.45μm Teflon membrane. The filtrates were then stored at 4 °C for subsequent analysis of SRP, total dissolved P (TDP), dissolved inorganic carbon (DIC), and dissolved organic carbon (DOC) concentrations. T, pH, oxidation-reduction potential (ORP), DO, and salt of the bottom water were measured in situ using a multi-parameter water quality analyzer (Multi 3630 IDS, WTW, Weilheim, Germany). Surface sediment (approximately the top 0~20 cm) was collected at each sampling site using a grab sampler (Hydro-Bios Apparatebau GmbH, Germany) and immediately transported to the laboratory on ice. The sediment samples were freeze-dried, passed through a 2-mm sieve in the laboratory to remove gravel, plant materials, and other debris, and stored in a desiccator for subsequent analyses of metal concentrations, grain‐size distributions, and P fractionations, and for adsorption experiments.
2.2 Chemical analysis
The concentration of SRP in the filtered water samples was measured by the molybdenum blue method (Murphy and Riley, 1962). TDP was converted to SRP through high-temperature digestion with potassium persulfate and then measured using a UV spectrophotometer (Shimadzu UV-3900 UV-VIS Spectrophotometer, Tokyo, Japan). The concentrations of DIC and DOC in the filtered water were measured using a total organic carbon (TOC) analyzer (TOC-L, Shimadzu, Japan). The pretreated sediment samples were digested by HNO3-HF-HClO4 at 180 °C, and the Na (sodium), Mg (magnesium), Ca (calcium), Al (aluminum), and Fe (iron) concentrations of the digested samples were determined using an inductively coupled plasma optical emission spectrometer (ICP-OES, Agilent 5110, Santa Clara, USA) (Liu et al., 2017). The organic matter (OM) was measured using the loss on ignition (LOI) method after calcination in a muffle furnace at 550 °C for 5 h (Dias et al., 2010). The particle size of the sediment samples was determined using a laser diffraction particle size analyzer (S3500, micro trac MRB, Montgomery, USA), and the percentages of clay (<2 µm), silt (2-50 µm), and sand (>50 µm) particles were calculated. The concentrations of different P forms in sediment were determined using the five-step method (Rydin, 2000) (Supplementary Figure S1), which involved the sequential extraction of NH4Cl-P, BD-P, NaOH-rP, NaOH-nrP, and HCl-P. TP in the sediment was determined using the Standards, Measurements, and Testing (SMT) protocol(European Commission), and Res-P was calculated as the difference between TP and the sum of other extracted P forms (Ruban et al., 2001; Pardo et al., 2004; Shan et al., 2016; Zhao et al., 2019; Zhuo et al., 2023). All experiments were performed in triplicate to ensure analytical precision, with an average coefficient of variance (CV) consistently below 10%. The accuracy of P forms in water was verified using nationally certified phosphate reference materials (GSB04-2835-2011), while the accuracy of TP and metal concentrations in sediment was verified using marine sediment reference materials (GBW-07333). Recoveries of analyzed elements were within the range of 85–107%, and relative standard deviations were below 10% (Supplementary Table S1). Procedural blanks were analyzed in parallel and were consistently below the detection limits.
2.3 P adsorption experiment
Thermodynamic adsorption experiments of the sediments were carried out to elucidate the P adsorption capacity in LRE sediments. A series of KH2PO4 solutions with varying P concentrations of 0, 0.02, 0.04, 0.05, 0.1, 0.5, 1, 3, 5, 10, and 30 mg/L were prepared using deionized water. The pH of all solutions was adjusted to 8, and the salt was modified to match field conditions (Supplementary Text S1). Salt was adjusted using artificial seawater, prepared by dissolving commercial sea salt in deionized water at a concentration of 1 g/L to obtain a salt of 1‰. 0.5 g of pre-treated surface sediment samples (L1~L12) were mixed with 30 mL of respective KH2PO4 solutions and incubated in a thermostatic shaker at 25 °C for 24 hours. Following incubation, the suspensions were centrifuged and filtered through a 0.45 µm membrane. The SRP concentration of supernatants was determined using a Skalar Continuous-Flow Analyzer (SKALAR San++, Skalar Co., Netherlands).
The amount of P adsorbed by the sediment at time t (Qt-abs) was calculated with Equation 1 (Liao et al., 2020):
where Qt-abs is the amount of P adsorbed by sediment at time t in the adsorption kinetics experiments, or the equilibrium adsorption amount of P at 24h in the adsorption isotherm experiment, mg/kg; C0 is the initial P concentration in the supernatant, mg/L; Ct-abs is the P concentration in the supernatant at time t in the adsorption kinetics experiments, or the equilibrium concentration of P in the supernatant at 24h in the adsorption isotherm experiment, mg/L; V is the volume of supernatant added, mL; and W is the weight of the added sediment, g.
Adsorption isotherms were plotted with Ct-abs (x-variable) and Qt-abs (y-variable) data and fitted using the modified Langmuir model and the Freundlich crossover-type model.
The modified Langmuir equation is expressed as Equations 2, 3:
Where Qmax is the theoretical maximum P adsorption capacity of sediment at equilibrium, mg/kg; Kf is the equilibrium constant of P adsorption between the sediment and the water body, L/mg; NAP is the original P content adsorbed on the particles of the sediment, mg/kg; EPC0 is the equilibrium concentration of P in the water body at Q = 0, mg/L.
The Freundlich crossover-type equation is expressed as Equations 4–7 (Pan et al., 2013):
Where Kd is the adsorption coefficient associated with the adsorption capacity of particles; β are empirical constants; C is the SRP concentration in the bottom water, mg/L; λ, EPCsat, and δ are all coefficients of determination.
The equilibrium concentration of P was determined as the X-axis intercept of the adsorption isotherm, and the coefficients of determination were calculated by the Levenberg-Marquardt nonlinear least squares algorithm. The sediment was identified as a P source when EPC0 > SRP or δ< 0, and as a P sink when EPC0< SRP or δ > 0 (Wang et al., 2009; Pan et al., 2013). The Qmax obtained from the Langmuir model was used in Equation 8 to calculate the degree of P saturation (DPS), which serves as a quantitative indicator of the P adsorption capacity of sediment (Pöthig et al., 2010):
Where TP is the total P content in sediment, mg/kg.
In addition, adsorption kinetics experiments were conducted to investigate the P adsorption rate in sediments. 0.5 g of pretreated surface sediment samples (L1~L12) were mixed with 30 ml of a 10 mg/L KH2PO4 solution and incubated in a thermostatic shaker. Supernatants were collected at sequential intervals (0 min, 5 min, 10 min, 30 min, 1h, 2h, 8h, 16h, and 24h) to record the concentration of SRP. The P adsorption kinetics curves were then plotted with t (x-variable) and Qt-abs (y-variable) data and fitted using the Lagergren, Elovich, and ExpAssoc kinetic equations, as detailed in Supplementary Text S2. Meanwhile, the supernatant samples that reached adsorption equilibrium after 24h satisfy the criteria for single-point equilibrium adsorption data. The equilibrium P concentration in the supernatant after 24 h (C24h-abs) was therefore substituted into Equation 9 to calculate the P sorption index (PSI) (Bache and Williams, 1971; Bolster et al., 2020):
Where X is the amount of P adsorbed by 100 g of sediment, converted from Q24h-abs, mg P/100 g sediment.
The P eutrophication risk index (ERI) is calculated using Equation 10 to quantitatively assess the risk posed by P in sediment (Xu et al., 2020):
2.4 Statistical analysis
Data analysis and visualization were performed using Origin Pro 2021, SPSS 26.0, and ArcGIS 10.2. The relationships among sediment properties, sediment P forms, and P adsorption parameters were analyzed using the Spearman correlation coefficient, with significances labelled at p< 0.05 and p< 0.01 levels. The adsorption experimental data were model-fitted using MATLAB. Seasonal variations (summer versus winter) in bottom water and sediment properties were tested via non-parametric Kruskal–Wallis.
To identify the key drivers of sediment P forms and P adsorption, a partial least squares path modelling (PLS-PM) was employed. Based on previous research and the results of correlation analysis in this study, observed variables associated with P adsorption capacity were selected and grouped into four latent variables for the model: bottom water properties (salt and SRP), sediment properties (Fe, Al, OM, and the proportion of fine particles), P forms (NaOH-rP, NaOH-nrP, and HCl-P), and P adsorption capacity (Qmax, the equilibrium adsorption capacity a2, and adsorption rate a3) (Zhang and Huang, 2011; Li et al., 2016). The following hypothetical paths were established: (1) bottom water properties, sediment properties, and P forms directly affect the P adsorption capacity; (2) bottom water and sediment properties directly influence P forms; and (3) bottom water properties directly affect sediment properties. The Goodness of fit (GOF) index (0.647 in summer and 0.675 in winter, section 3.5) confirmed the adequate explanatory power for both measurement and structural model (Wetzels et al., 2009). Path coefficients were calculated after 1000 bootstraps, with significance levels indicated by p< 0.05, p< 0.01, and p< 0.001. The construction and validation of the PLS-PM model were conducted using the “plspm” package in R software.
3 Results
3.1 Physical-chemical properties of bottom water and sediment
The physicochemical properties of the bottom water in the LRE showed distinct spatial and temporal variations under different runoff input conditions (Table 1). During the summer (June) and winter (November) observations, the average DO concentrations across all sites were 8.06 ± 0.68 mg/L and 11.92 ± 0.45 mg/L, respectively. The average ORP was 117.21 ± 34.33 mV in summer and 201.99 ± 32.31 mV in winter, indicating that oxidizing capacity was relatively lower in summer than in winter. Under low runoff input conditions in summer, the salt of the bottom water maintained consistently high values (19.8 to 25.2‰) with minimal spatial variation; while the winter higher runoff resulted in a marked salt gradient from the sandy mouth area (0.7‰) to the outer estuary (22.6‰), demonstrating pronounced terrestrial runoff influence on estuary salt distribution. The DIC concentrations in summer and winter observations were 33.14 ± 2.34mg/L and 50.70 ± 11.87mg/L, respectively.
Table 1
| Indicator | Bottom water | Sediment | |||
|---|---|---|---|---|---|
| Summer | Winter | Summer | Winter | ||
| T (°C) | 20.95 ± 1.04 | 8.01 ± 0.15 | Al (mg/kg) | 25876 ± 4367 | 23397 ± 3043 |
| DO (mg/L) | 8.06 ± 0.68 | 11.92 ± 0.45 | Fe (mg/kg) | 25406 ± 5197 | 24637 ± 2273 |
| salt (‰) | 23.64 ± 1.39 | 13.42 ± 6.85 | Ca (mg/kg) | 20453 ± 3620 | 10746 ± 1404 |
| ORP (mV) | 117.21 ± 34.33 | 201.99 ± 32.31 | Mg (mg/kg) | 36957 ± 8623 | 41059 ± 4752 |
| DIC (mg/L) | 33.14 ± 2.34 | 50.70 ± 11.87 | Na (mg/kg) | 72041 ± 9921 | 74472 ± 14799 |
| DOC (mg/L) | 5.67 ± 2.07 | 6.65 ± 2.56 | OM (%) | 3.60 ± 0.01 | 3.32 ± 0.01 |
| pH | 7.90 ± 0.13 | 8.01 ± 0.16 | |||
Physical and chemical properties of bottom water and sediment.
T, water temperature; DO, dissolved oxygen; ORP, oxidation-reduction potential; DIC, dissolved inorganic carbon; DOC, dissolved organic carbon; Al, aluminum; Fe, iron; Ca, calcium; Mg, magnesium; Na, sodium; OM, organic matter. The mean values are shown with standard deviations.
The sediment OM concentrations averaged 3.46 ± 0.01%, with the highest values observed in the muddy areas. The average concentrations of Fe, Al, Ca, and Mg across all sediment samples during the two surveys were 25022 ± 3949mg/kg, 24637 ± 3899 mg/kg, 15600 ± 5633 mg/kg, and 39008 ± 7135mg/kg, respectively. The outer estuarine sediments exhibited the highest Ca concentration (Supplementary Table S2), indicating a greater propensity for Ca precipitation and accumulation in this zone (Zhang et al., 2022b). Sediment composition analysis (Supplementary Figure S2) revealed that the sediments in LRE were predominantly composed of silt, with fine-grained particles (silt and clay) comprising 75.45% of the total sediment.
3.2 Spatial and temporal distribution of P forms in the bottom water
Figure 2 presents the concentrations of SRP and TDP in the bottom water. The average concentrations in summer were 0.053 ± 0.01 mg/L for SRP and 0.111 ± 0.02 mg/L for TDP, while those in winter were 0.128 ± 0.05 mg/L and 0.152 ± 0.05 mg/L, respectively. Accordingly, dissolved organic P (DOP), calculated as the difference between TDP and SRP, averaged 0.058 ± 0.02 mg/L in summer and 0.025 ± 0.01 mg/L in winter. Notably, approximately 70% of our sampling sites in summer and all sites in winter exceeded the Class IV standard for seawater quality in China (SRP: 0.045 mg/L) (GB 3097-1997).
Figure 2
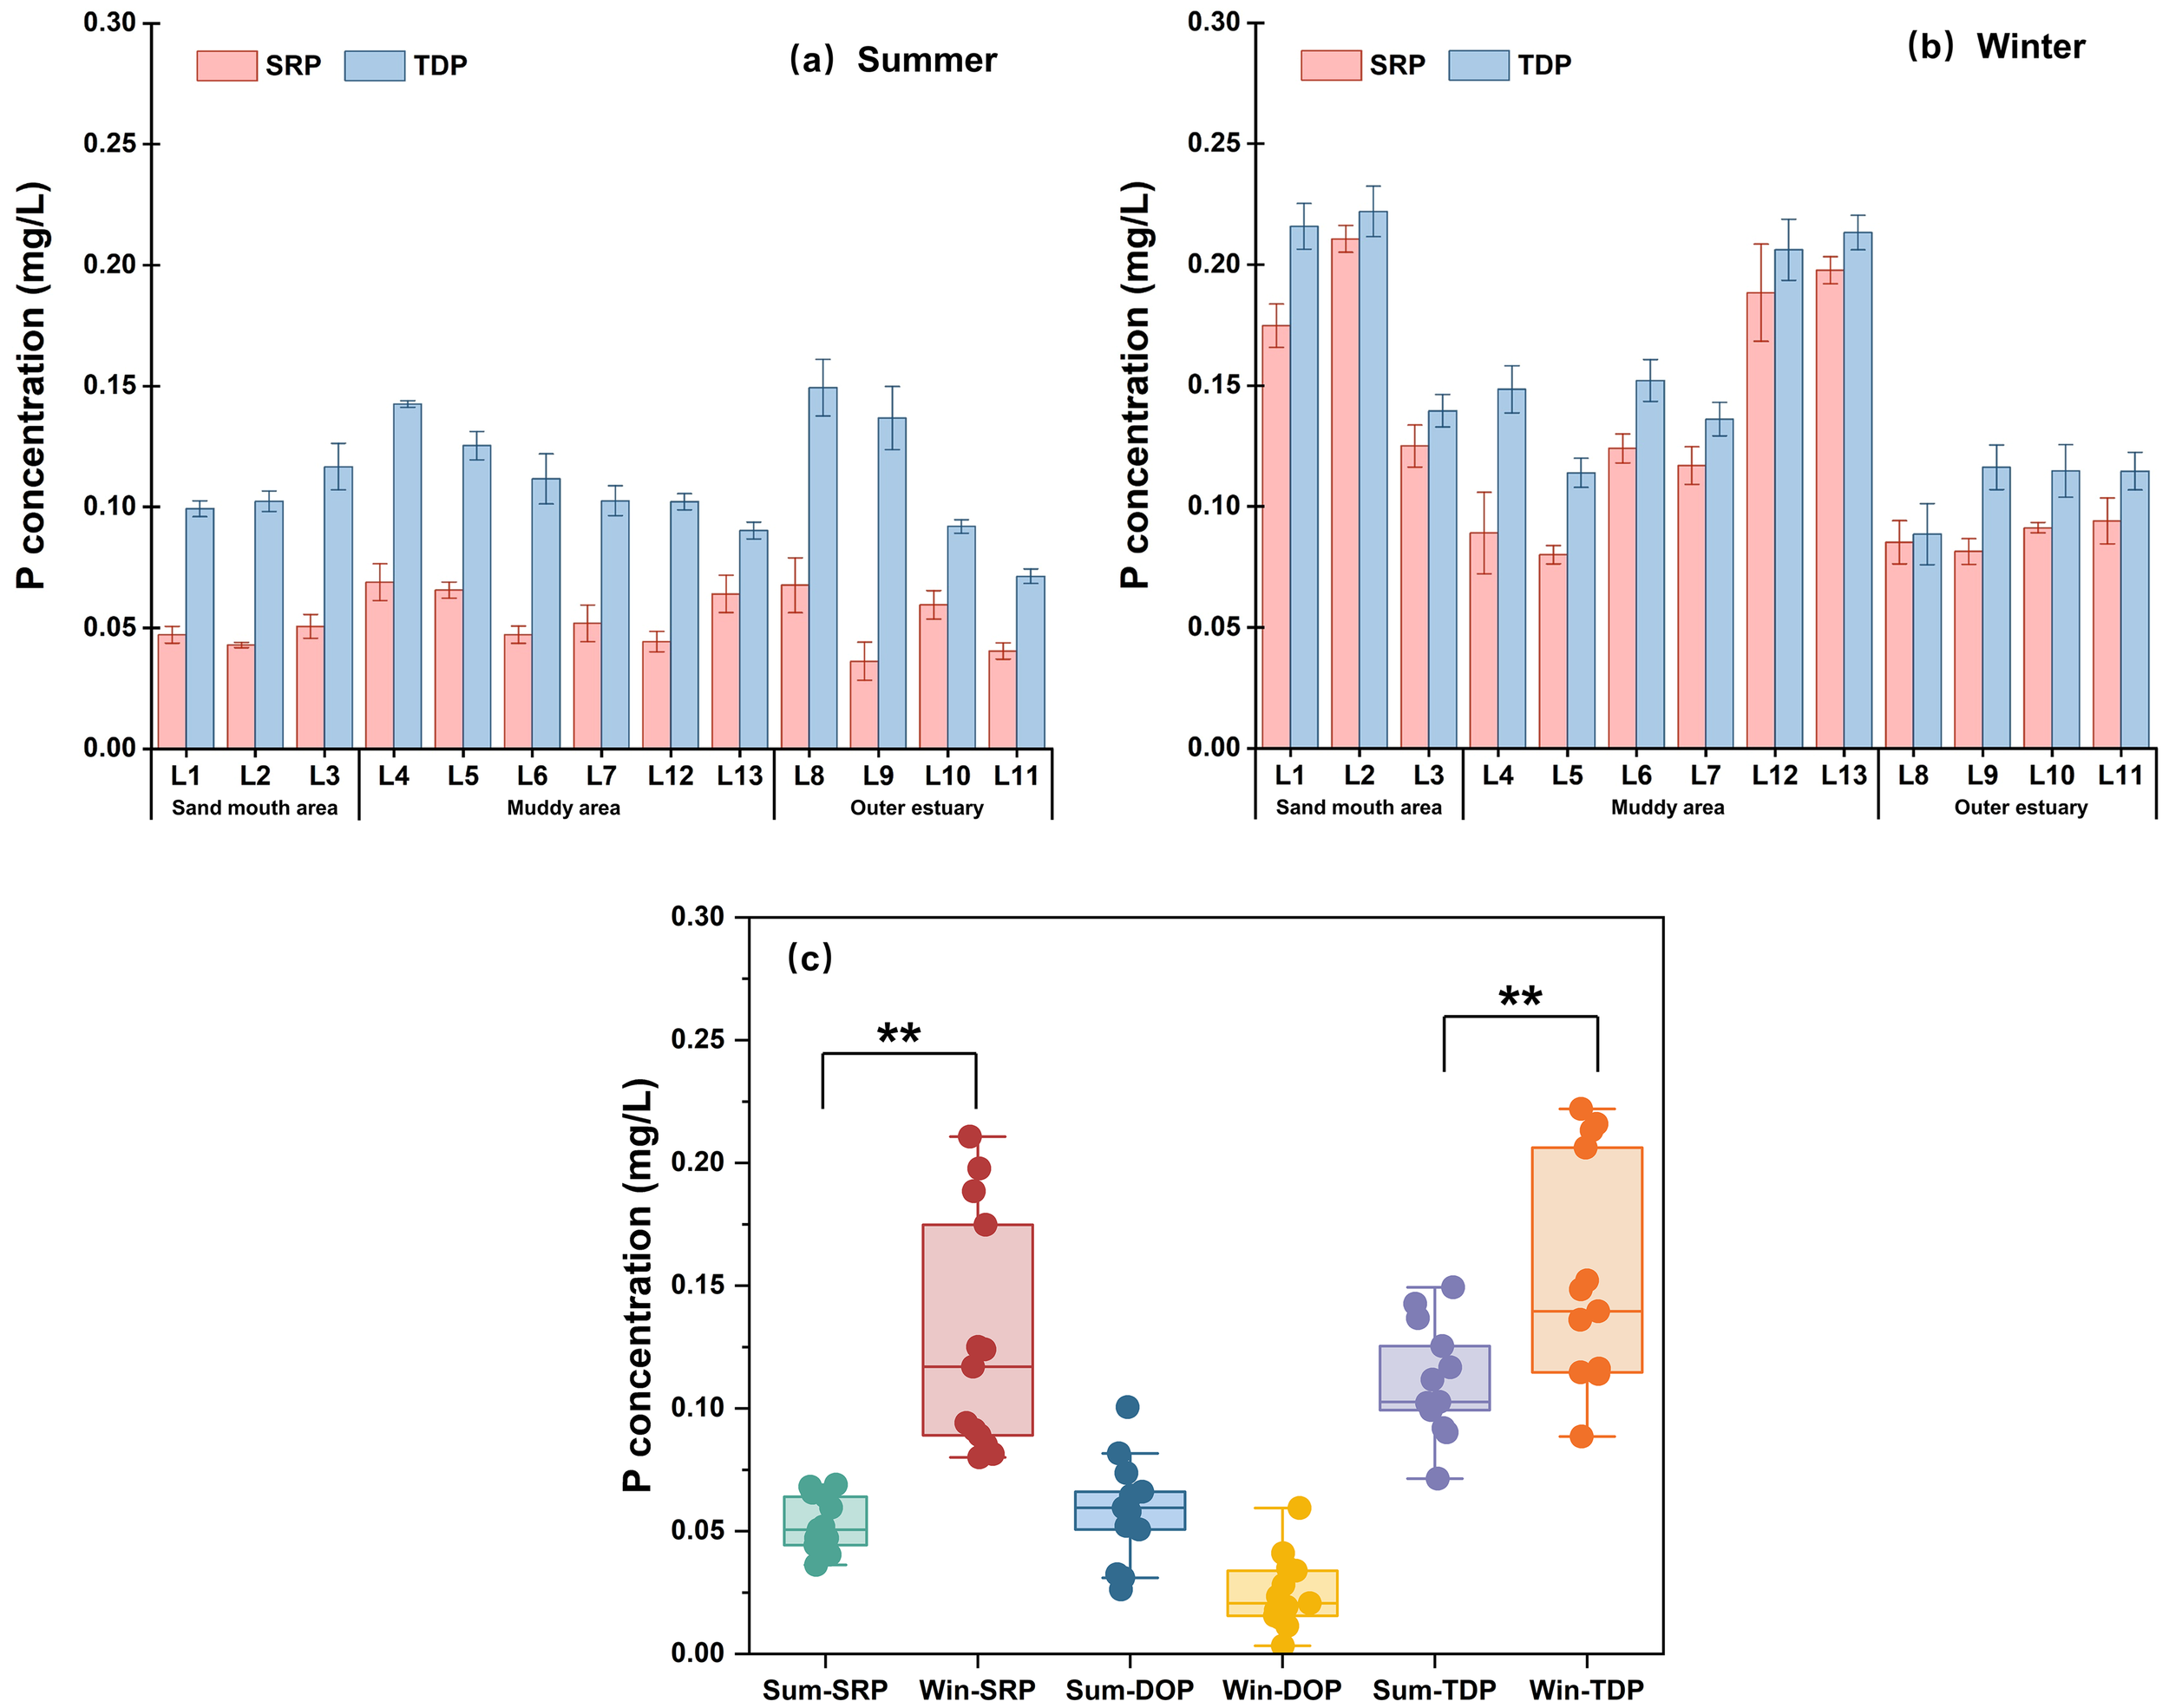
The concentrations of soluble reactive phosphorus (SRP), dissolved organic P (DOP), and total dissolved P (TDP) during (A) summer and (B) winter observations, and (C) seasonal variations. ** denote the significance level at p< 0.01. Error bars denote mean ± SD.
Both SRP and TDP showed significantly higher levels in winter than in summer (p<0.01, Figure 2C), likely due to greater P inflowing fluxes and intensified sediment resuspension in winter. This is consistent with previous studies indicating that riverine input maintains relatively high SRP concentrations, and sediment resuspension promotes P release into the bottom water (Walve et al., 2018; Zhang et al., 2022b; Bi et al., 2011; Yang et al., 2024). The DOP concentrations exhibited reverse trends with higher values in summer than in winter. This may be explained by the enhanced P utilization by algae in summer (Bronk and Ward, 2005; Lin et al., 2024), while in winter, DOP mineralization by alkaline phosphatase under a P-limited environment likely leads to its depletion (Deborde et al., 2007; Liu et al., 2009; Li et al., 2017). Spatially, significant variations in SRP and TDP concentrations were observed among sampling sites in winter observations (p<0.05), with concentrations decreasing from the sandy mouth to the outer estuary zone.
Furthermore, the Redfield ratio (C:P = 106:1) is widely used in marine systems as a benchmark for assessing nutrient limitation status. A DOC: DOP ratio exceeding 250 is generally indicative of DOM with a predominantly terrestrial origin (Moore et al., 2013; Karl and Björkman, 2015; Letscher and Moore, 2015). In the LRE, DOC: DOP ratios ranged from 45~314 in summer and from 113~1325 in winter. More than 85% of winter sampling sites exceeded the threshold value of 250, suggesting a predominant role of terrestrial DOM input and a higher likelihood of P-limited conditions during this period.
3.3 Spatial and temporal distribution of P in the sediment
The TP concentrations of all sediment samples are displayed in Figure 3. The average TP concentrations were 495.26 ± 69.33 mg/kg in summer and 399.62 ± 39.29 mg/kg in winter, respectively, exhibiting a significant difference (p<0.01) between the two observations (Figure 3C). The lower TP concentrations observed in winter may be attributed to enhanced sediment resuspension, which facilitates the release of labile P fractions from the sediment into the bottom water (Søndergaard et al., 2003). No significant spatial variation in TP was detected during summer (p > 0.05), while statistically significant spatial differences were observed during winter observation (p<0.05). In both seasons, the highest TP concentrations occurred in the muddy area, likely due to the high proportion of fine particles, with silt and clay composing on average 79.54%, which provided greater capacity for P adsorption and retention (Wang et al., 2021).
Figure 3
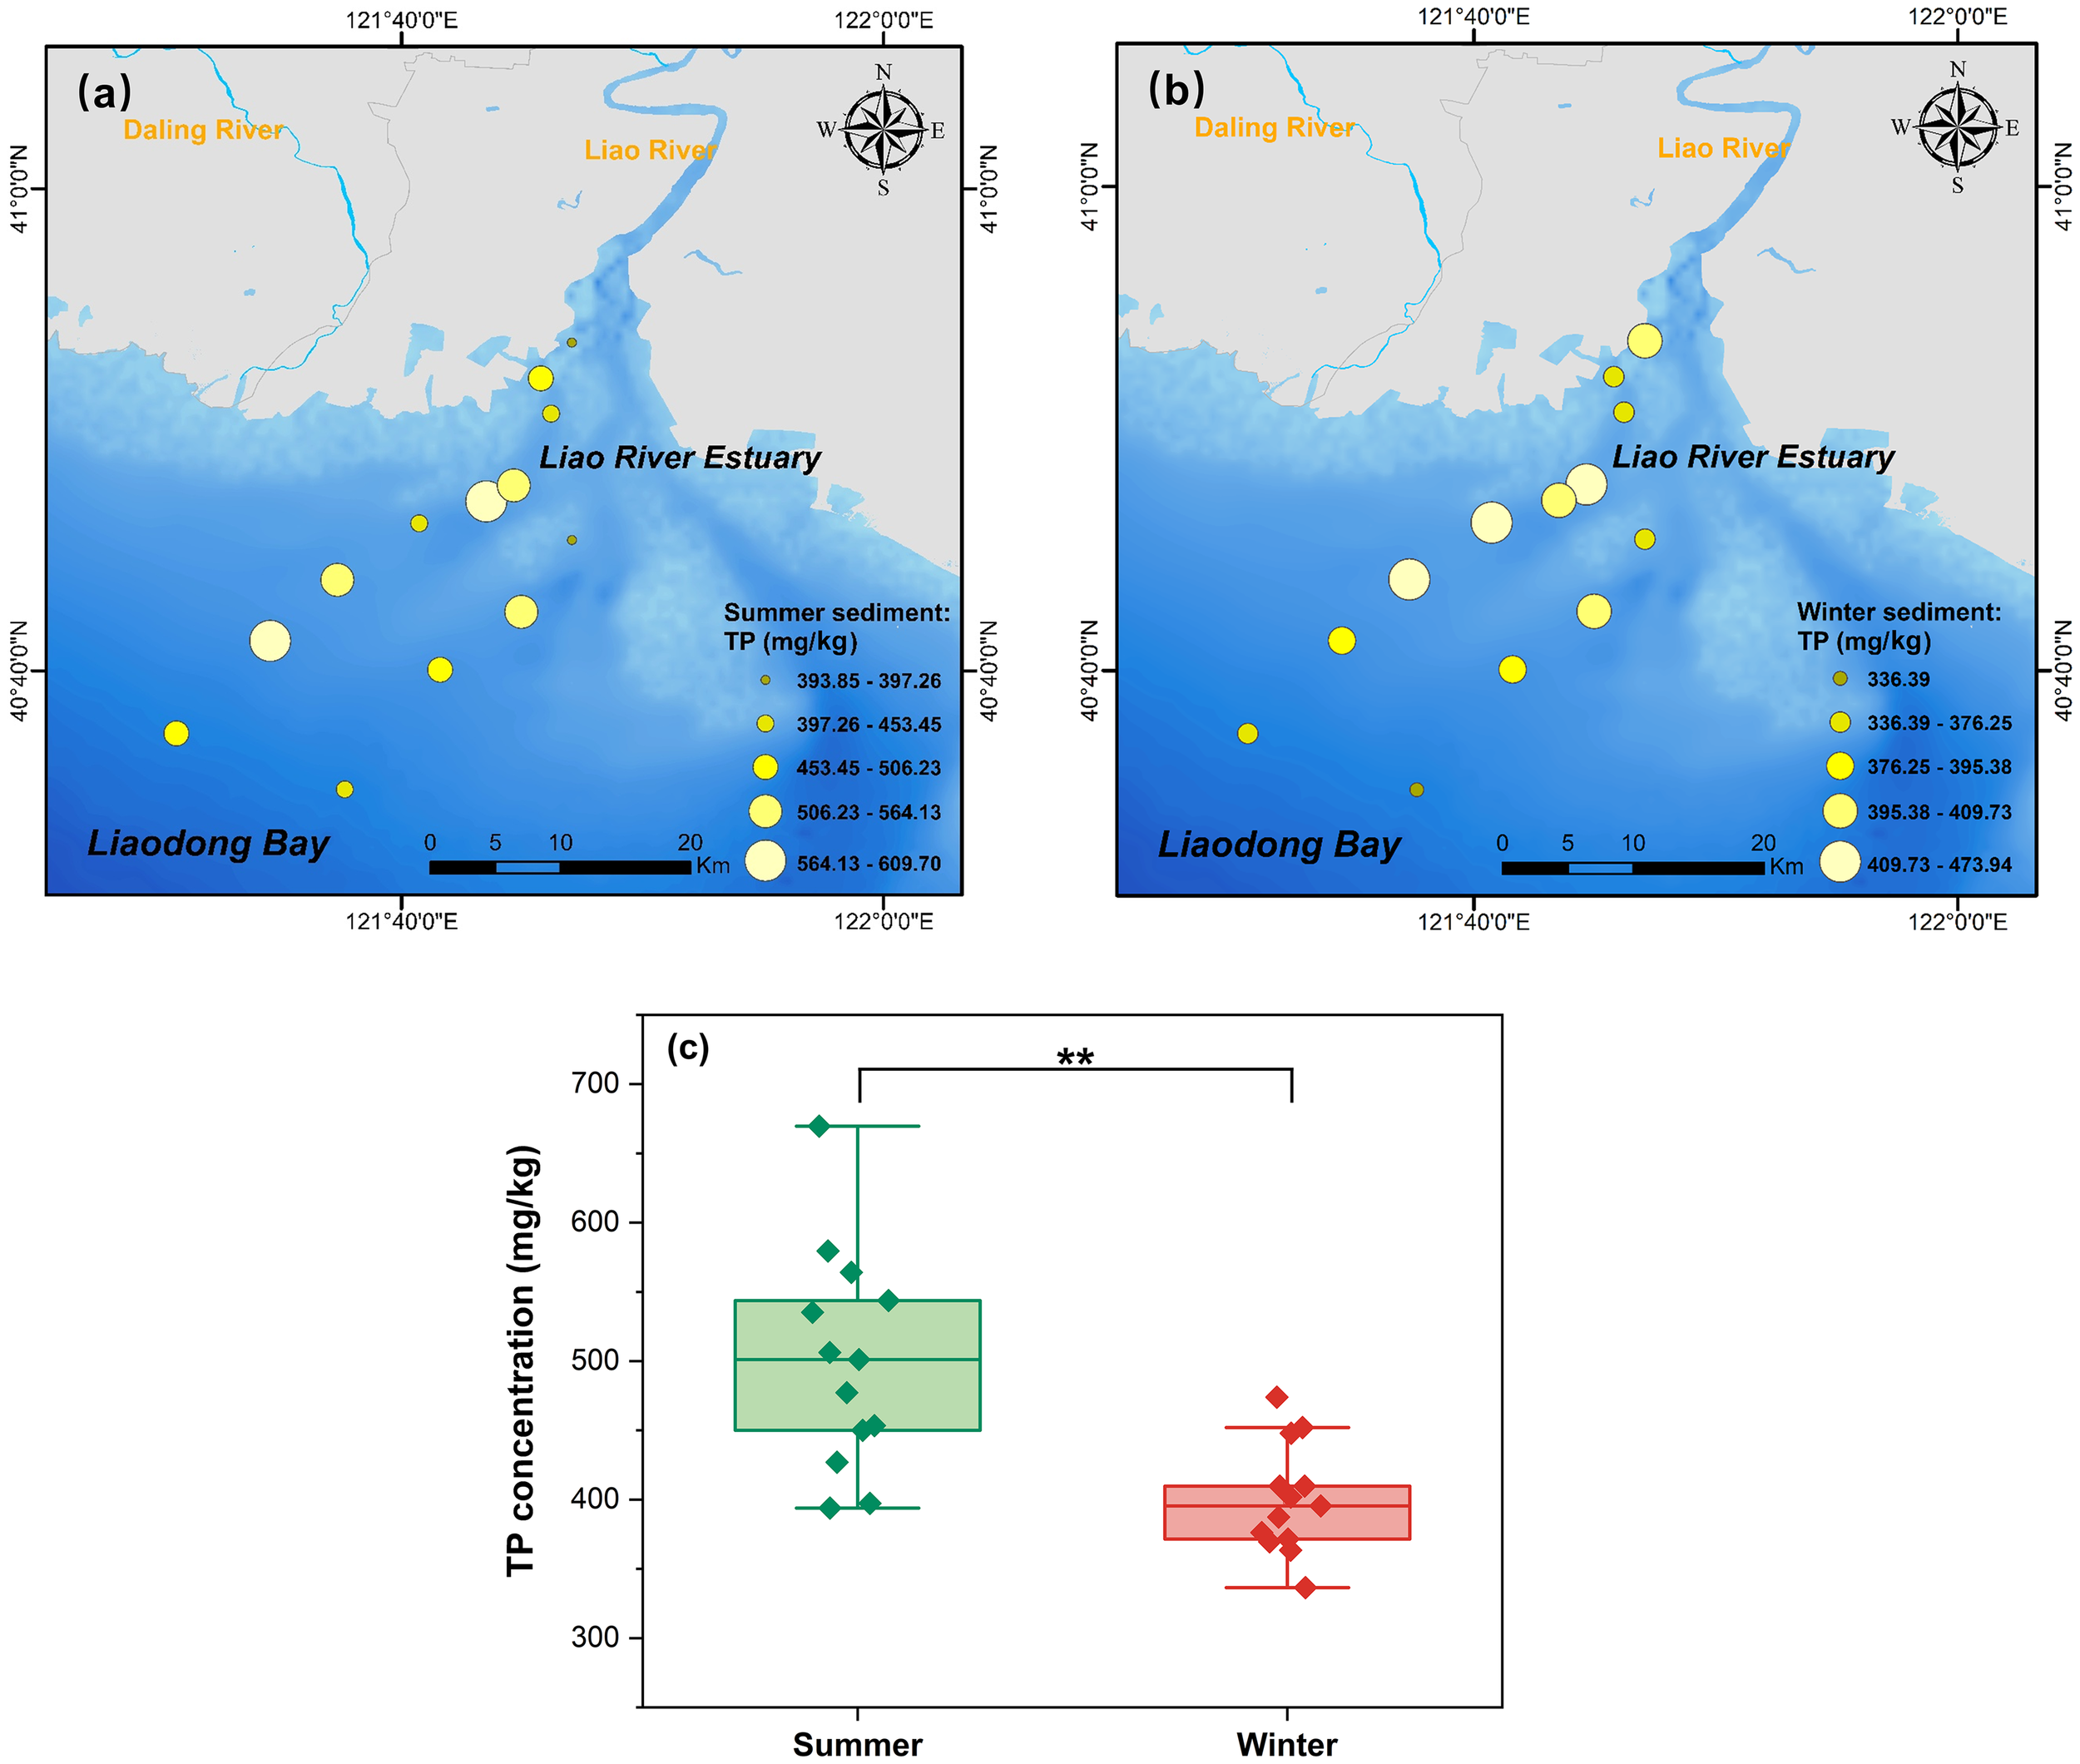
The concentrations of the total P (TP) in LRE sediment during (a) summer and (b) winter observations, and (c) seasonal variations. ** denote the significance level at p< 0.01.
Figure 4 further shows the concentrations of various P forms in sediments. In summer, the average proportions of P were HCl-P (38.19%), Res-P (27.36%), NaOH-rP (16.54%), NaOH-nrP (15.71%), BD-P (1.82%), and NH4Cl-P (0.38%). In winter, the proportions were HCl-P (50.40%), NaOH-nrP (21.75%), NaOH-rP (18.90%), Res-P (5.33%), BD-P (3.25%), and NH4Cl-P (0.37%). HCl-P was the dominant form of P in both seasons, which aligned with the findings in Jiaozhou Bay, the Yangtze River estuary, and the Yellow River estuary (Cao et al., 2017; Bai et al., 2020b; Zhang et al., 2022b). It is generally believed that debris and biological material transported by runoff erosion and weathering are the primary sources of HCl-P; therefore, higher terrestrial inputs in winter likely contributed to the elevated HCl-P proportions (Ni et al., 2020).
Figure 4
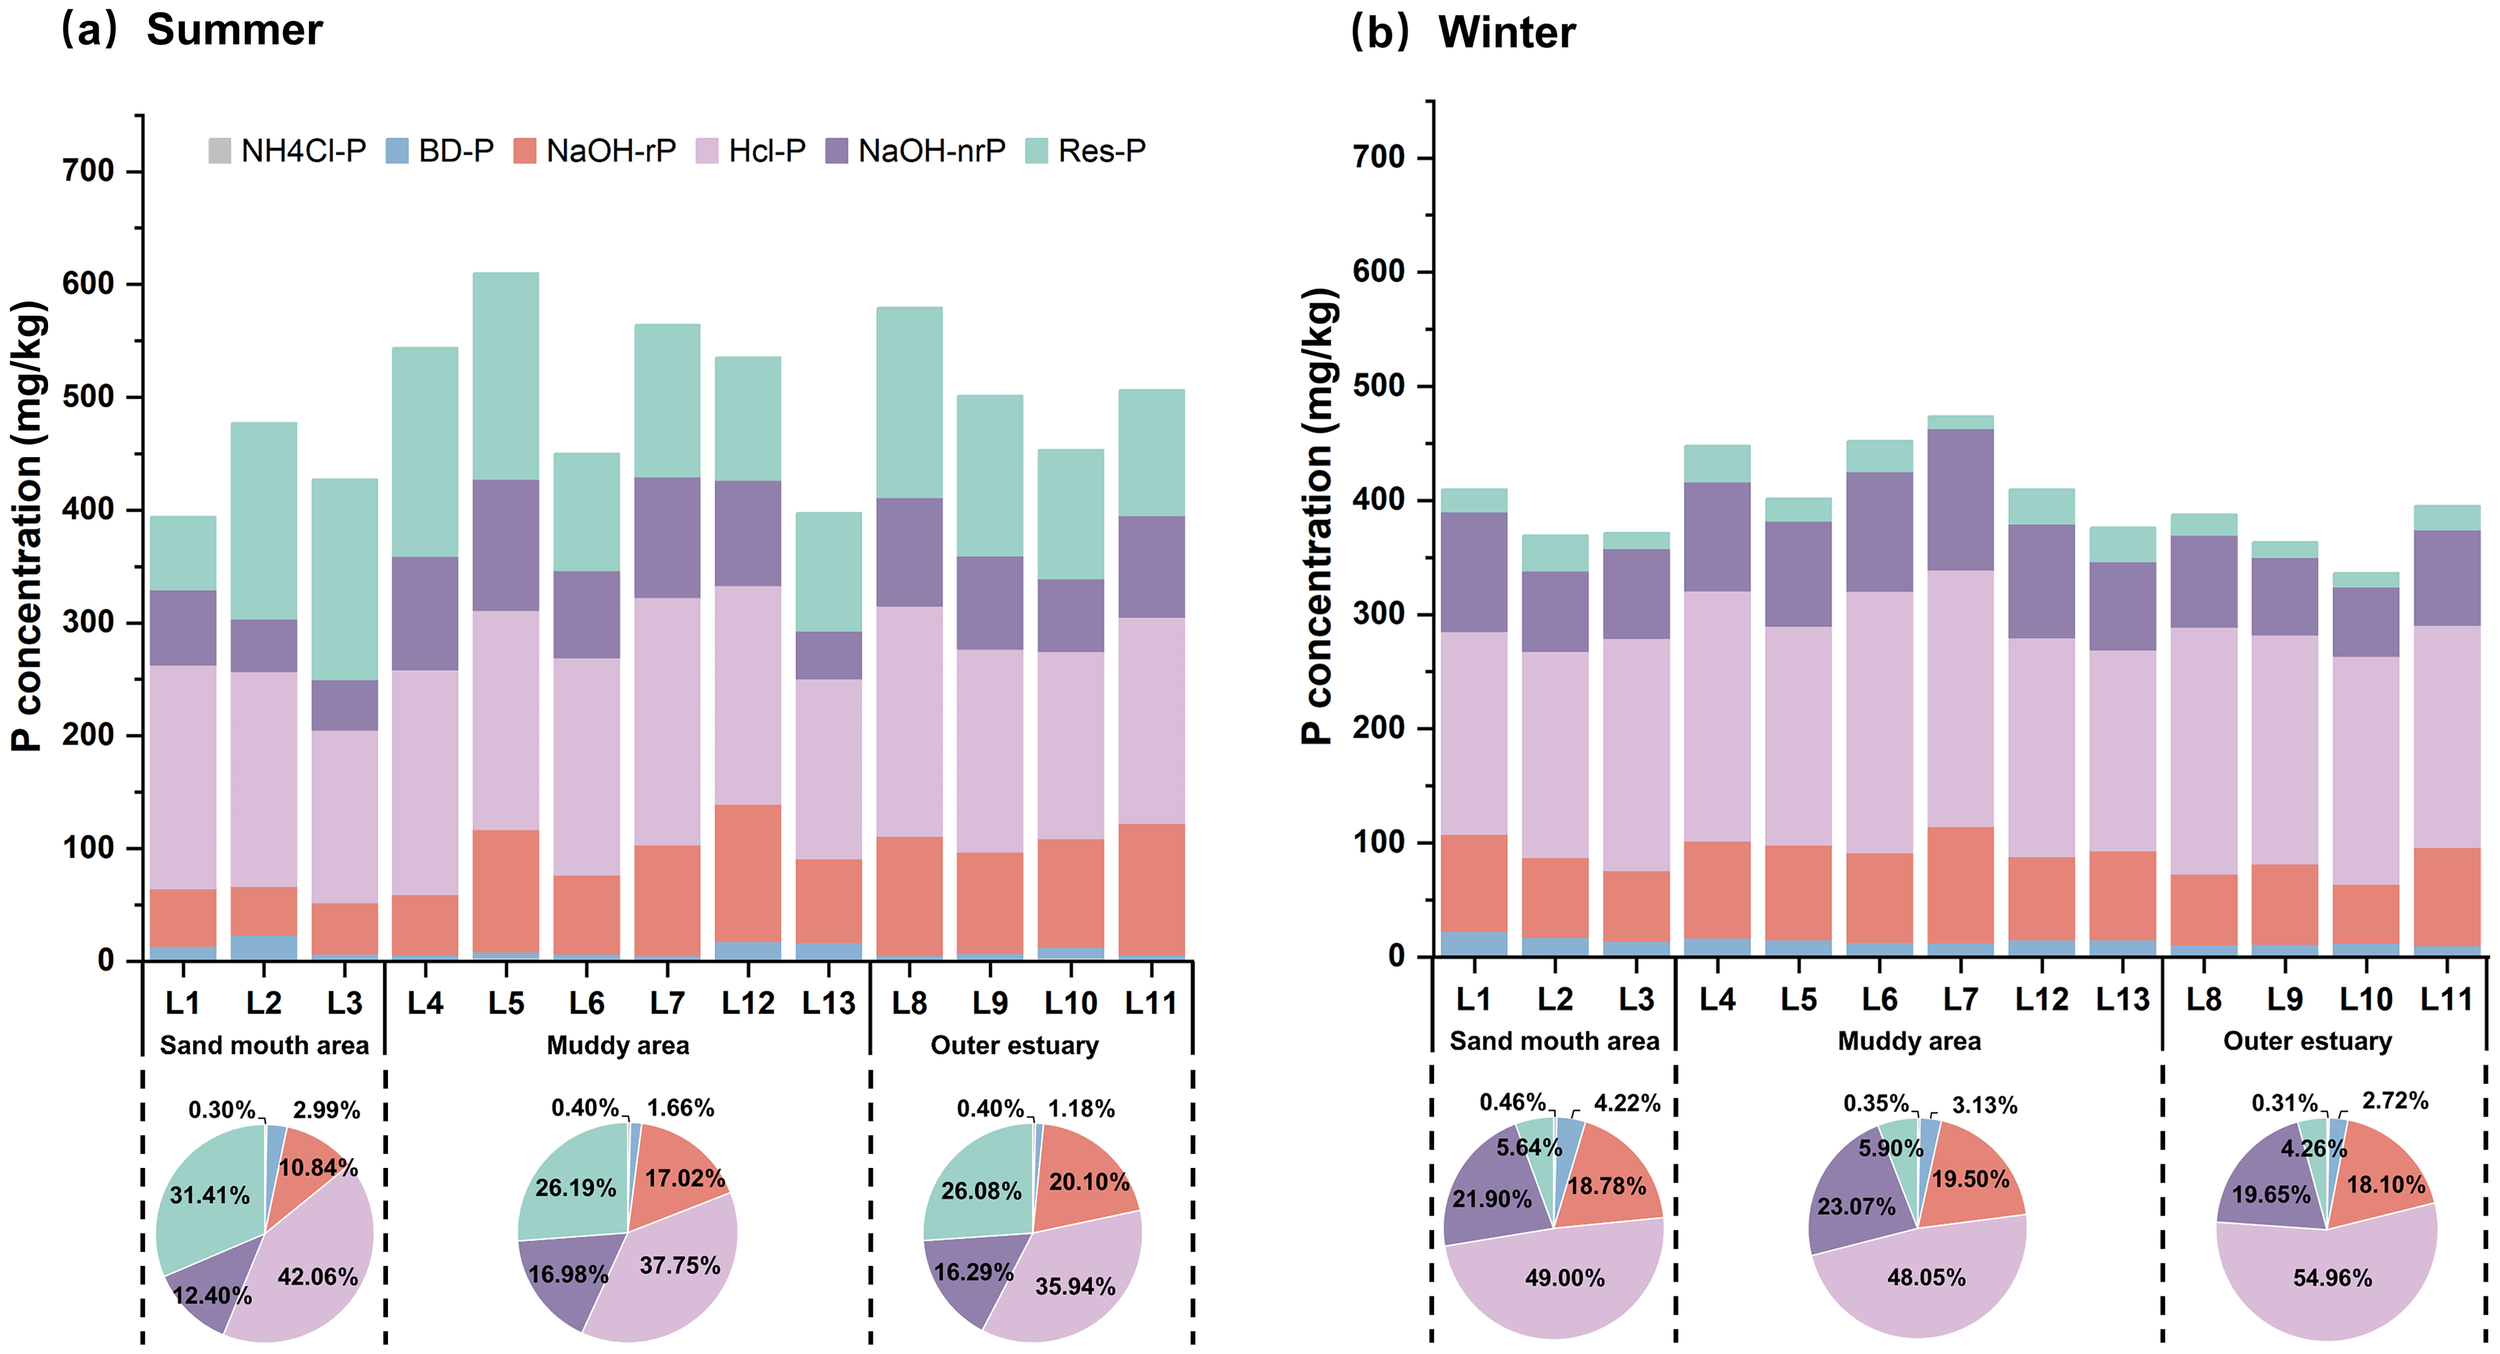
Concentrations of different P forms during (a) summer and (b) winter observations in LRE sediment. NH4Cl-P, labile P; BD-P, redox-sensitive P; NaOH-rP, aluminum-bound P; NaOH-nrP, organic P; NaOH-TP, NaOH total P; HCl-P, calcium-bound.
BD-P and NaOH-nrP are regarded as active P forms and potential sources for algal growth. The average concentrations were 8.53 ± 5.89mg/kg for BD-P, 79.15 ± 24.51mg/kg for NaOH-nrP in summer, and 12.94 ± 3.21mg/kg and 87.63 ± 17.83mg/kg in winter. Previous studies have reported that under anoxic conditions in summer, iron-reducing bacteria converted BD-P to Fe2+ and soluble P, leading to a decline in BD-P level (Kraal et al., 2015). Meanwhile, intensified biological activity in summer would enhance the mineralization of NaOH-nrP, whereas decomposition of plant and animal remains in winter resulted in elevated NaOH-nrP concentrations (Knudsen-Leerbeck et al., 2017; Pan et al., 2017). Spatially, significant spatial variation of NaOH-rP was observed in summer (p< 0.01), while other P fractions showed no significant spatial differences in either season (p> 0.05). The highest NaOH-rP concentrations were observed in the outer estuary zone during summer (average 102.08 mg/kg), likely resulting from elevated salt that promoted the formation of metal oxides (Al–O–Si complexes) and thereby enhanced P adsorption capacity (Zhao et al., 2019).
Bioavailable P (BAP) serves as an indicator of P release potential from sediment, as it can be transformed into SRP, which is readily available to aquatic organisms and potentially contributes to eutrophication. BAP is generally recognized as the sum of NH4Cl-P, BD-P, NaOH-rP, and 60% of NaOH-nrP (Rydin, 2000), which averaged 140.48 ± 37.22 mg/kg in summer and 142.80 ± 23.63 mg/kg in winter. BAP exhibited significant spatial variation in summer (p< 0.01) (Supplementary Figure S3), with the highest concentration (159.90 mg/kg) observed in the outer estuary, suggesting a strong potential for P release in this region. In contrast, no significant spatial differences of BAP were observed during winter observation (p > 0.05).
3.4 P adsorption on sediment and release potential
The fitting parameters of P adsorption thermodynamics from the Langmuir model and the Freundlich crossover-type model are presented in Supplementary Table S3 and Supplementary Table S4, respectively. The adsorption isotherms for P in sediment are shown in Supplementary Figure S4. The thermodynamic process of P adsorption was well described by both the modified Langmuir model and the Freundlich crossover-type model, as evidenced by high correlation coefficients (R2 > 0.9). The maximum adsorption capacity (Qmax) and native adsorbed P (NAP) are key indicators of sediment P adsorption capacity and nutrient status (Cao et al., 2017). Across all sampling sites, Qmax averaged 327.13 ± 118.21 mg/kg and 472.15 ± 182.66 mg/kg in summer and winter, while NAP were 3.42 ± 1.73mg/kg and 3.79 ± 1.96 mg/kg, respectively. The higher NAP and Qmax observed in winter indicated enhanced P adsorption capacity and P accumulation, likely driven by increased terrestrial runoff during this period that transported greater loads of P, sediment particles, and Fe-Al reactants into the estuary. Additionally, intense sediment resuspension during winter can promote the disaggregation of aggregates and expose more mineral surfaces, thereby increasing the availability of binding sites and enhancing the Qmax (Wang et al., 2013). The EPC0, representing the equilibrium exchange capacity between sediment and bottom water, averaged 0.22 ± 0.10 in summer and 0.24 ± 0.11 mg/L in winter. Approximately 90% of sediment samples (21 out of 24) exhibited δ< 0 and EPC0 > SRP (Supplementary Tables S3, S4), indicating that the sediments in the LRE were predominantly in a state of P release. This finding is consistent with those reported for Jiaozhou Bay and Laizhou Bay (Zhang et al., 2022a, b). Spatially, EPC0 decreased from the muddy area to the outer estuary (Figure 5B) in winter, implying a stronger external P buffering capacity and lower release potential in the outer estuary (Zhang and Huang, 2011).
Figure 5
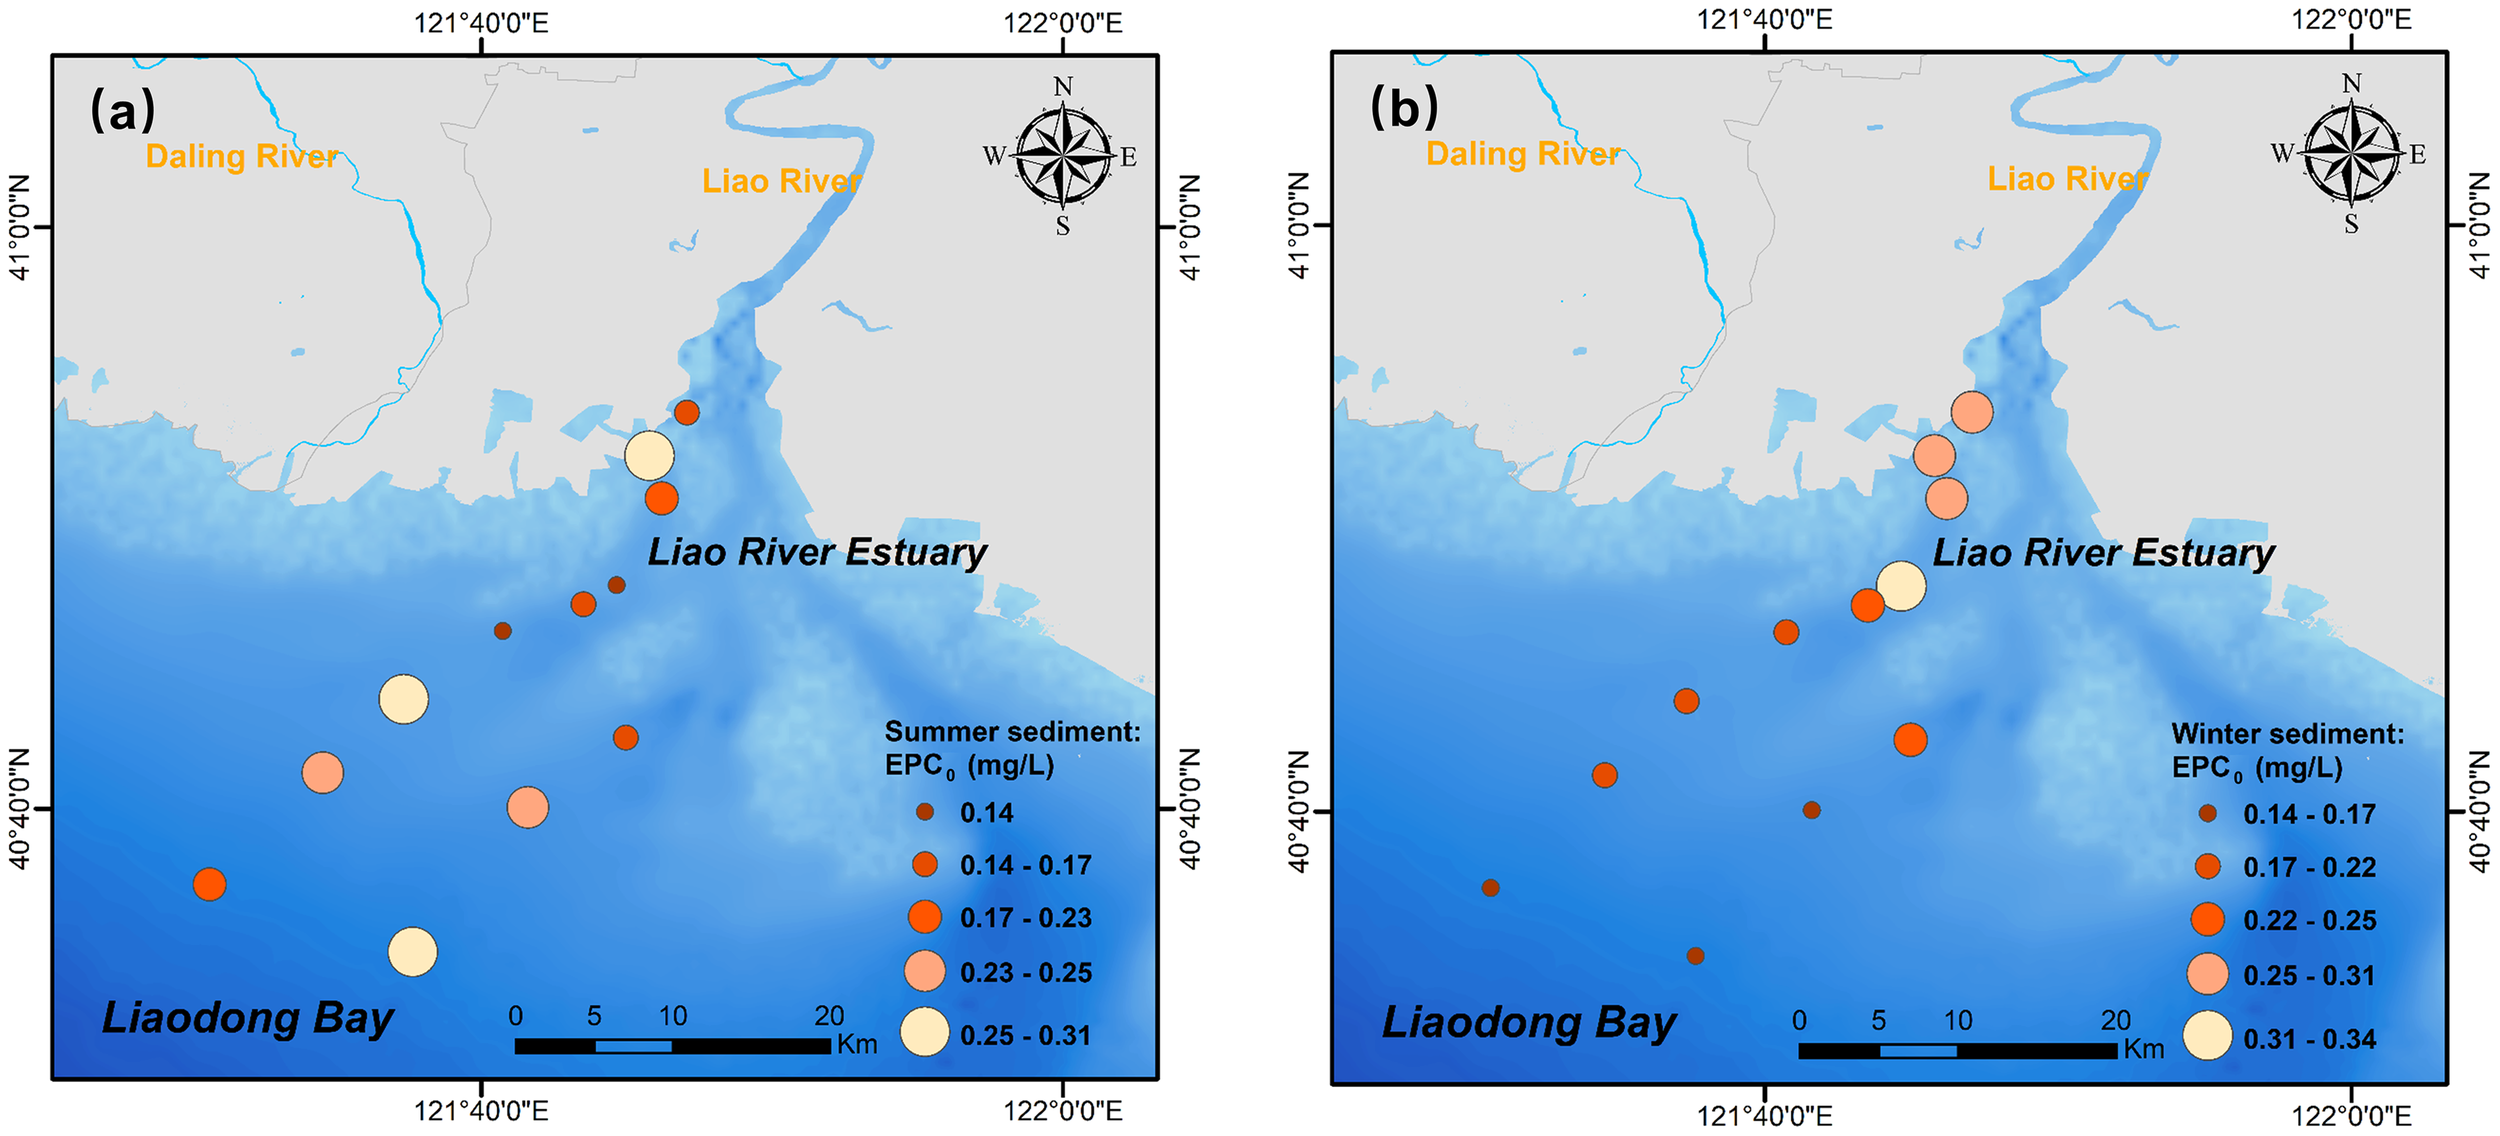
Spatial distribution of the equilibrium P concentration (EPC0) in LRE during (A) summer and (B) winter observations.
The amount of P adsorbed by the sediment at time t (Qt-abs in Equation 1) was determined based on the sediment adsorption kinetics experiments (section 2.3), as shown in Figure 6. The Qt-abs trend revealed a rapid adsorption stage within the first 2 hours, achieving approximately 75%~95% of the total adsorption capacity. This was followed by a slower adsorption stage, and the system gradually approached equilibrium over the period from 8 to 24 hours. The fitting parameters derived from the Lagergren first-order and second-order, Elovich, and ExpAssoc models are shown in Supplementary Tables S5 and S6. Among these, the Elovich and second-order kinetics models provided the best fit to the experimental data (R2 > 0.9). Both models have been previously reported as more suitable for describing chemical adsorption where adsorption dominates over desorption (Xia et al., 2020). The equilibrium adsorption capacity (a2 in the second-order kinetics model, Supplementary Text S2) and adsorption rate (a3 in the Elovich model, Supplementary Text S2) averaged 105.01 ± 17.36mg/kg and 93.52 ± 16.83mg/(kg·h) in summer, and 112.64 ± 24.19mg/kg and 100.55 ± 20.58mg/(kg·h) in winter, respectively. These results indicated a higher adsorption capacity in winter, favoring P fixation in sediment.
Figure 6
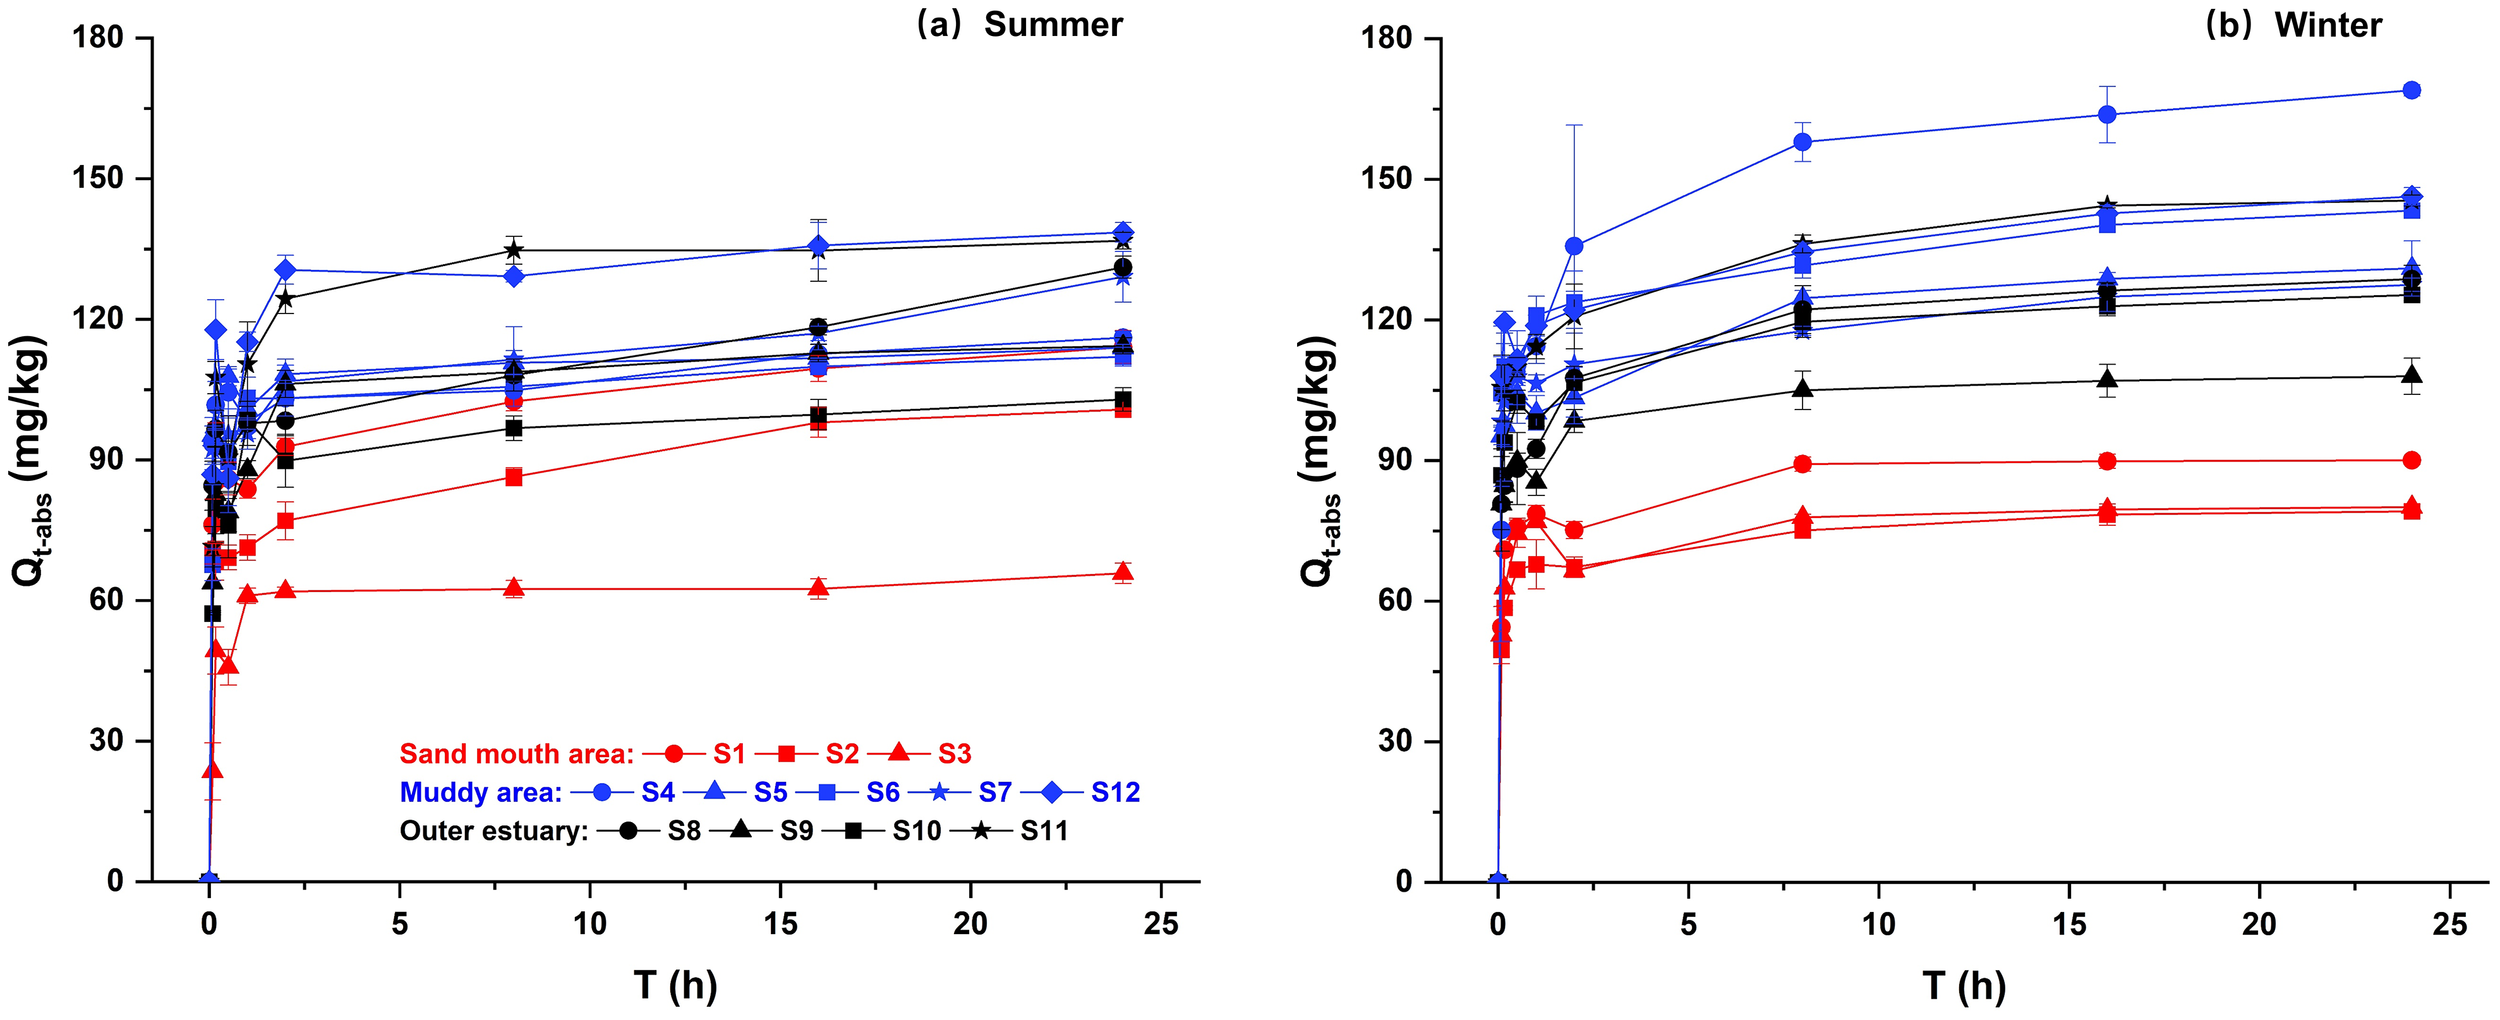
P adsorption kinetic curves for sediments in (A) summer and (B) winter observations. Qt-abs is the amount of P adsorbed by the sediment at time t. Error bars denote mean ± SD.
The degree of P saturation (DPS in Equation 8) is a key parameter for evaluating the P adsorption state in sediments, with higher values indicating adsorption closer to saturation. The DPS averaged 61.81% ± 0.08 in summer and 48.18% ± 0.11 in winter, indicating greater P adsorption saturation in summer sediment. The P sorption index (PSI in Equation 9), reflecting sediment P adsorption capacity, was 4.74 ± 0.84 in summer and 5.11 ± 1.22 in winter. Following previous studies, the ratio of DPS to PSI was used to calculate the P eutrophication risk index (ERI), where ERI< 10% indicates low P potential release risk, 10–20% moderate risk, and 20–25% high risk (Jiang et al., 2023). Summer ERI values ranged from 9.30% to 23.60%, with 83.33% of samples classified as moderate risk. In contrast, winter ERI values ranged from 5.90% to 19.95%, with 66.67% of samples classified as low risk. Overall, sediments exhibited a higher potential for P release in summer. Elevated salt during summer may increase the concentration of electrolyte anions (such as Cl-), which compete for active adsorption sites and weaken electrostatic outer-sphere interactions between phosphate and sediment (Wang et al., 2022). To illustrate the underlying processes, a schematic diagram was developed to summarize the mechanisms governing P adsorption and desorption in the LRE during summer and winter (Figure 7).
Figure 7
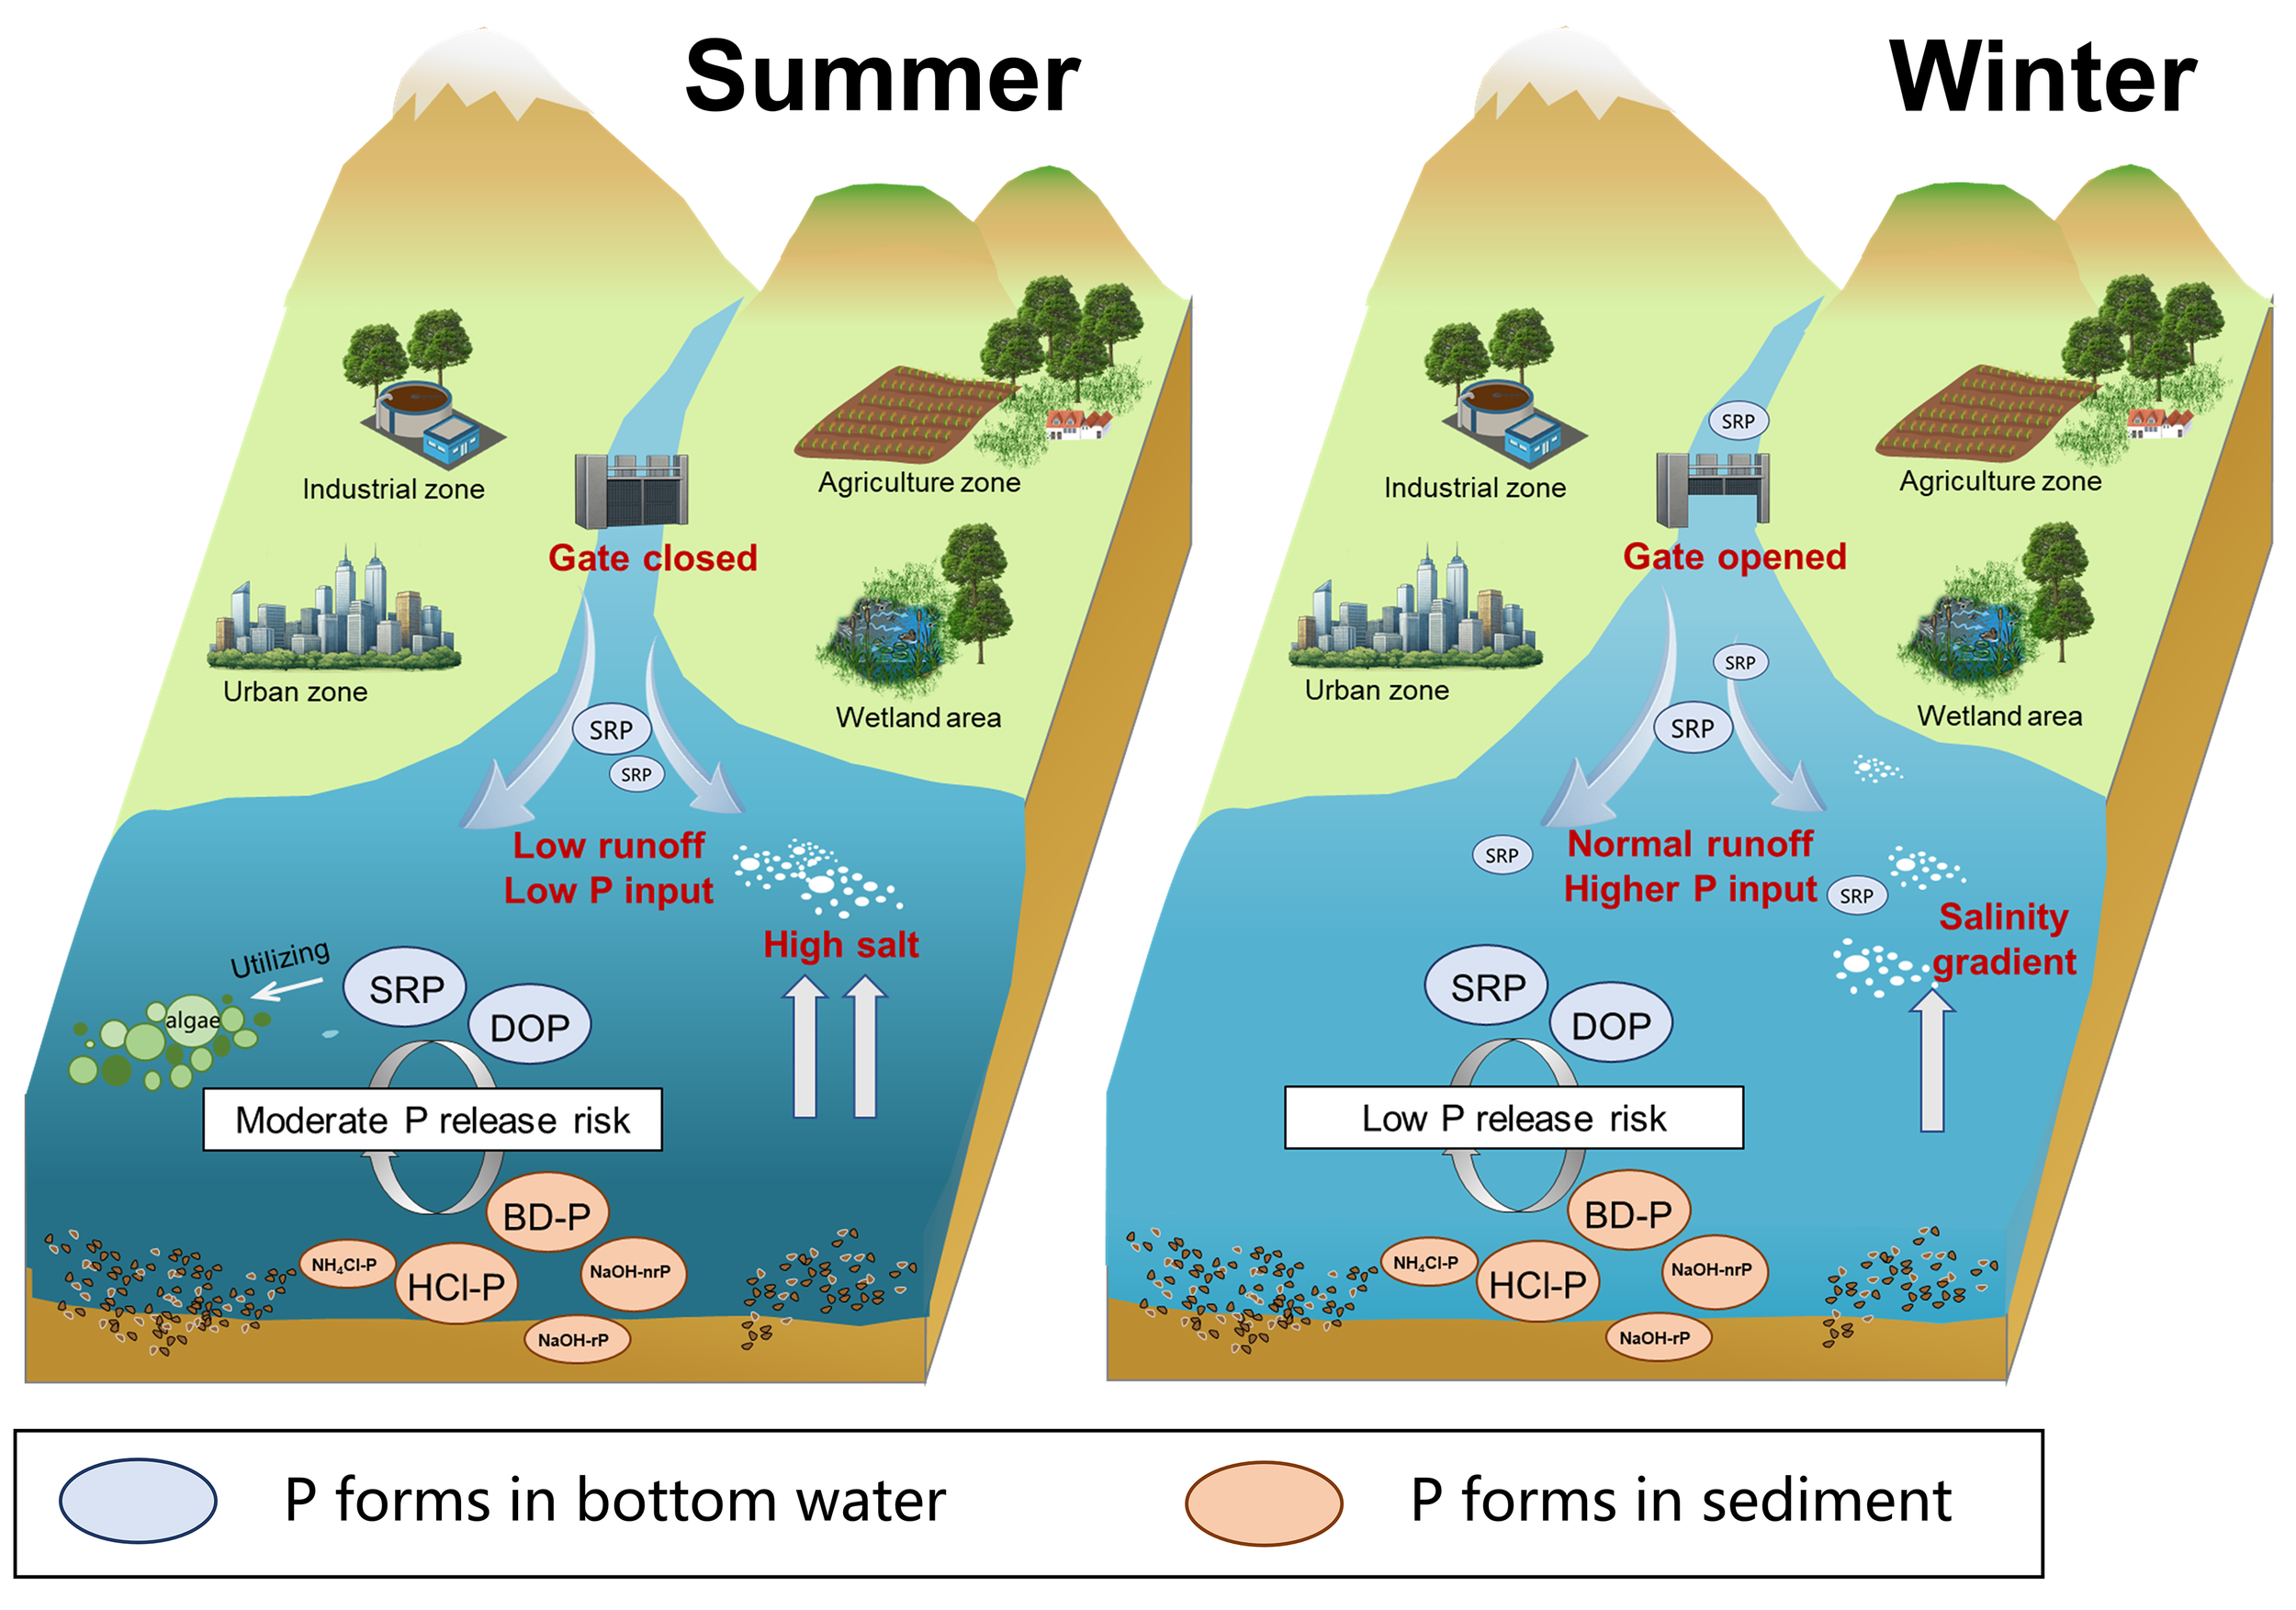
Conceptual diagram of P adsorption and desorption mechanisms in estuarine sediment.
3.5 Key drivers of P forms transformation and adsorption in sediments
To identify the key factors influencing P adsorption behaviors in sediment, correlation analyses were conducted among sediment physicochemical properties, P forms, and adsorption parameters (Figure 8). In summer, the concentrations of Al, Fe, and OM showed significant negative correlations with BD-P (p< 0.01), while showing significant positive correlations with NaOH-nrP (p< 0.01). BD-P represents a redox-sensitive and more reactive P form associated with amorphous Fe (III) oxides (Jensen and Thamdrup, 1993). Under anaerobic conditions in summer, the reduction and dissolution of Fe (III) oxides reduce the availability of binding sites for P, thereby increasing the negative surface charge of solid phases and reactivating BD-P (Jensen et al., 1992; Rozan et al., 2002; Kraal et al., 2015). Moreover, high OM concentrations in sediment compete for binding sites on Fe/Al oxides, promoting the formation of OM-oxide aggregates. This weakened the adsorption strength between P and Fe/Al oxides, and ultimately led to a reduction in BD-P concentrations (Kaiserli et al., 2002; Zhang et al., 2022b). Additionally, OM acts as an important carrier of NaOH-nrP, which is released upon OM mineralization (Zhang et al., 2008). In winter, Fe exhibits a significant positive correlation with NaOH-rP (p< 0.01). Unlike BD-P, NaOH-rP predominantly represents P bound to Al oxides and crystalline Fe oxides, and reflects a more stable P form (Hupfer et al., 1995; Lukkari et al., 2007). The low-temperature oxidizing environment in winter favors the stability and accumulation of the crystallization of Fe and Al oxides, providing abundant adsorption sites for phosphates and thereby facilitating the formation of NaOH-rP in sediment (Jensen et al., 1992; Roden and Zachara, 1996; Hyacinthe and Van Cappellen, 2004).
Figure 8
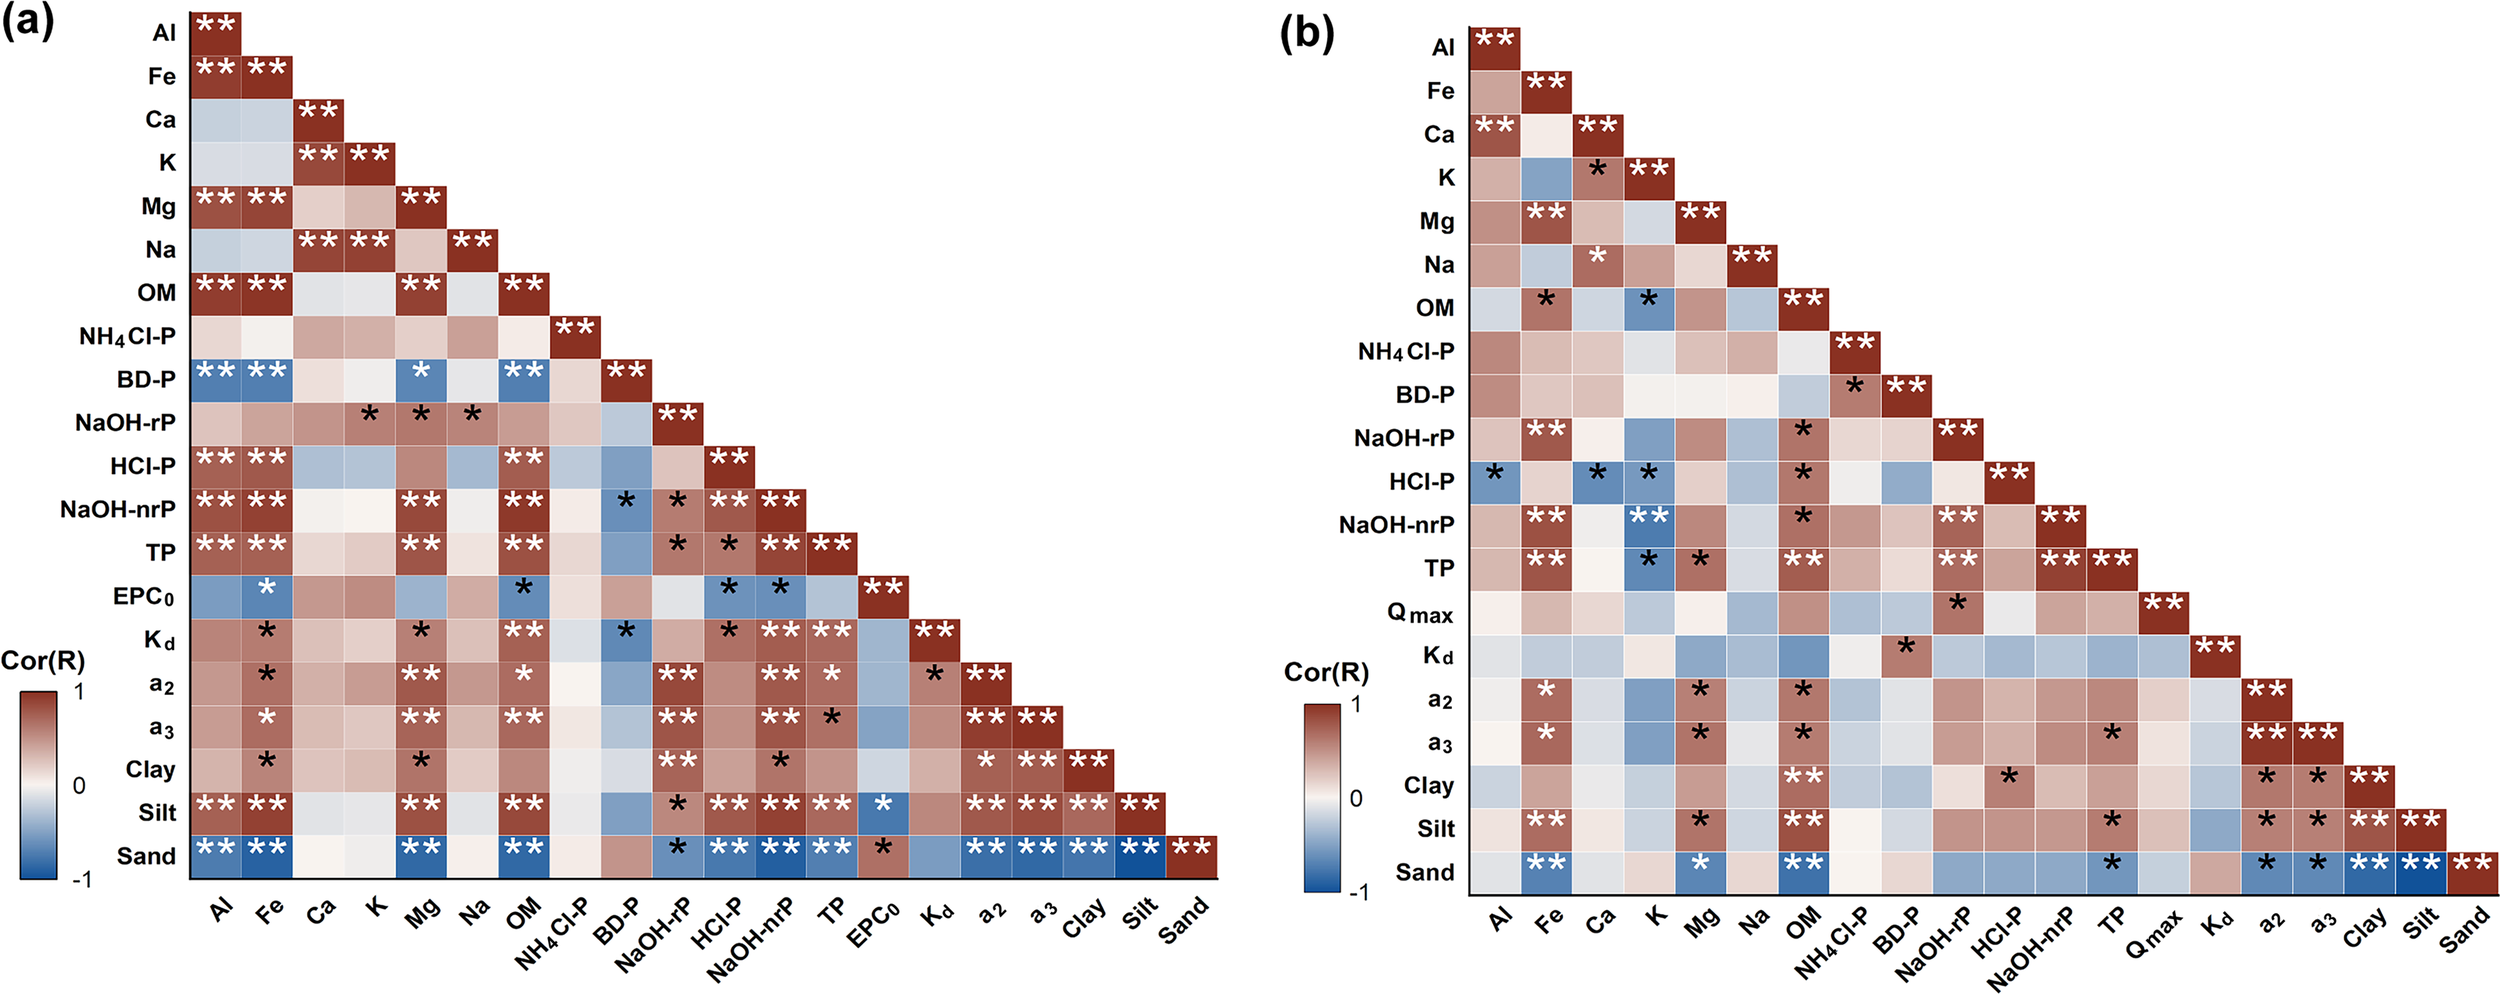
Hot correlation map between sediment physicochemical properties, P forms, and P adsorption parameters in (A) summer, and (B) winter observations. * and ** denote the significance level at p< 0.05 and p< 0.01, respectively. Qmax, the maximum adsorption capacity; Kd, the adsorption coefficient associated with the adsorption capacity of particles; a2, the P equilibrium adsorption; a3, the P initial rate of adsorption.
In summer, the concentrations of HCl-P and NaOH-nrP showed significant positive correlations with silt proportion (p< 0.01), but significant negative correlations with sand proportion (p< 0.01). Silt has a larger specific surface area and a higher proportion of clay minerals and organic matter, which provide more adsorption sites and stronger P fixation capacity (Ruttenberg, 1992; Kaiser and Guggenberger, 2003). Moreover, complexes formed between organic matter and clay minerals can inhibit P release, thereby enhancing the stability of HCl-P and NaOH-nrP. In contrast, sand has a smaller specific surface area and fewer adsorption sites, leading to a diminished P fixation capacity (Froelich, 1988). EPC0, a2, and a3 (Supplementary Text S2) are key adsorption parameters representing the P release potential, adsorption capacity, and adsorption rate of P, respectively. In summer, EPC0 showed a significantly negative correlation with the concentrations of HCl-P and NaOH-nrP in sediments (p< 0.05), whereas a2 and a3 exhibited significant positive correlations with NaOH-nP and NaOH-nrP (p< 0.01) (Figure 8A). These P forms were considered to have an important influence on the P adsorption capacity and adsorption rate in the LRE sediments.
The PLS-PM results further reveal the directional causal pathways among various latent variables during summer and winter, including bottom water properties (salt and SRP), sediment properties (Fe, Al, OM, the proportion of clay and silt), sediment P forms (NaOH-rP, NaOH-nrP, and HCl-P), and P adsorption capacity (Qmax, a2, and a3) (Figure 9). During summer observation (Figure 9A), sediment properties showed a significant positive effect on P forms in sediment with a path coefficient of 0.894 (p< 0.001). None of the variables showed a significant effect on P adsorption capacity during summer, while sediment properties and sediment P forms exhibited relatively larger positive direct and total effects. This finding, aligned with correlation analysis, suggested that sediment properties and sediment P forms served as key regulatory factors of P adsorption.
Figure 9
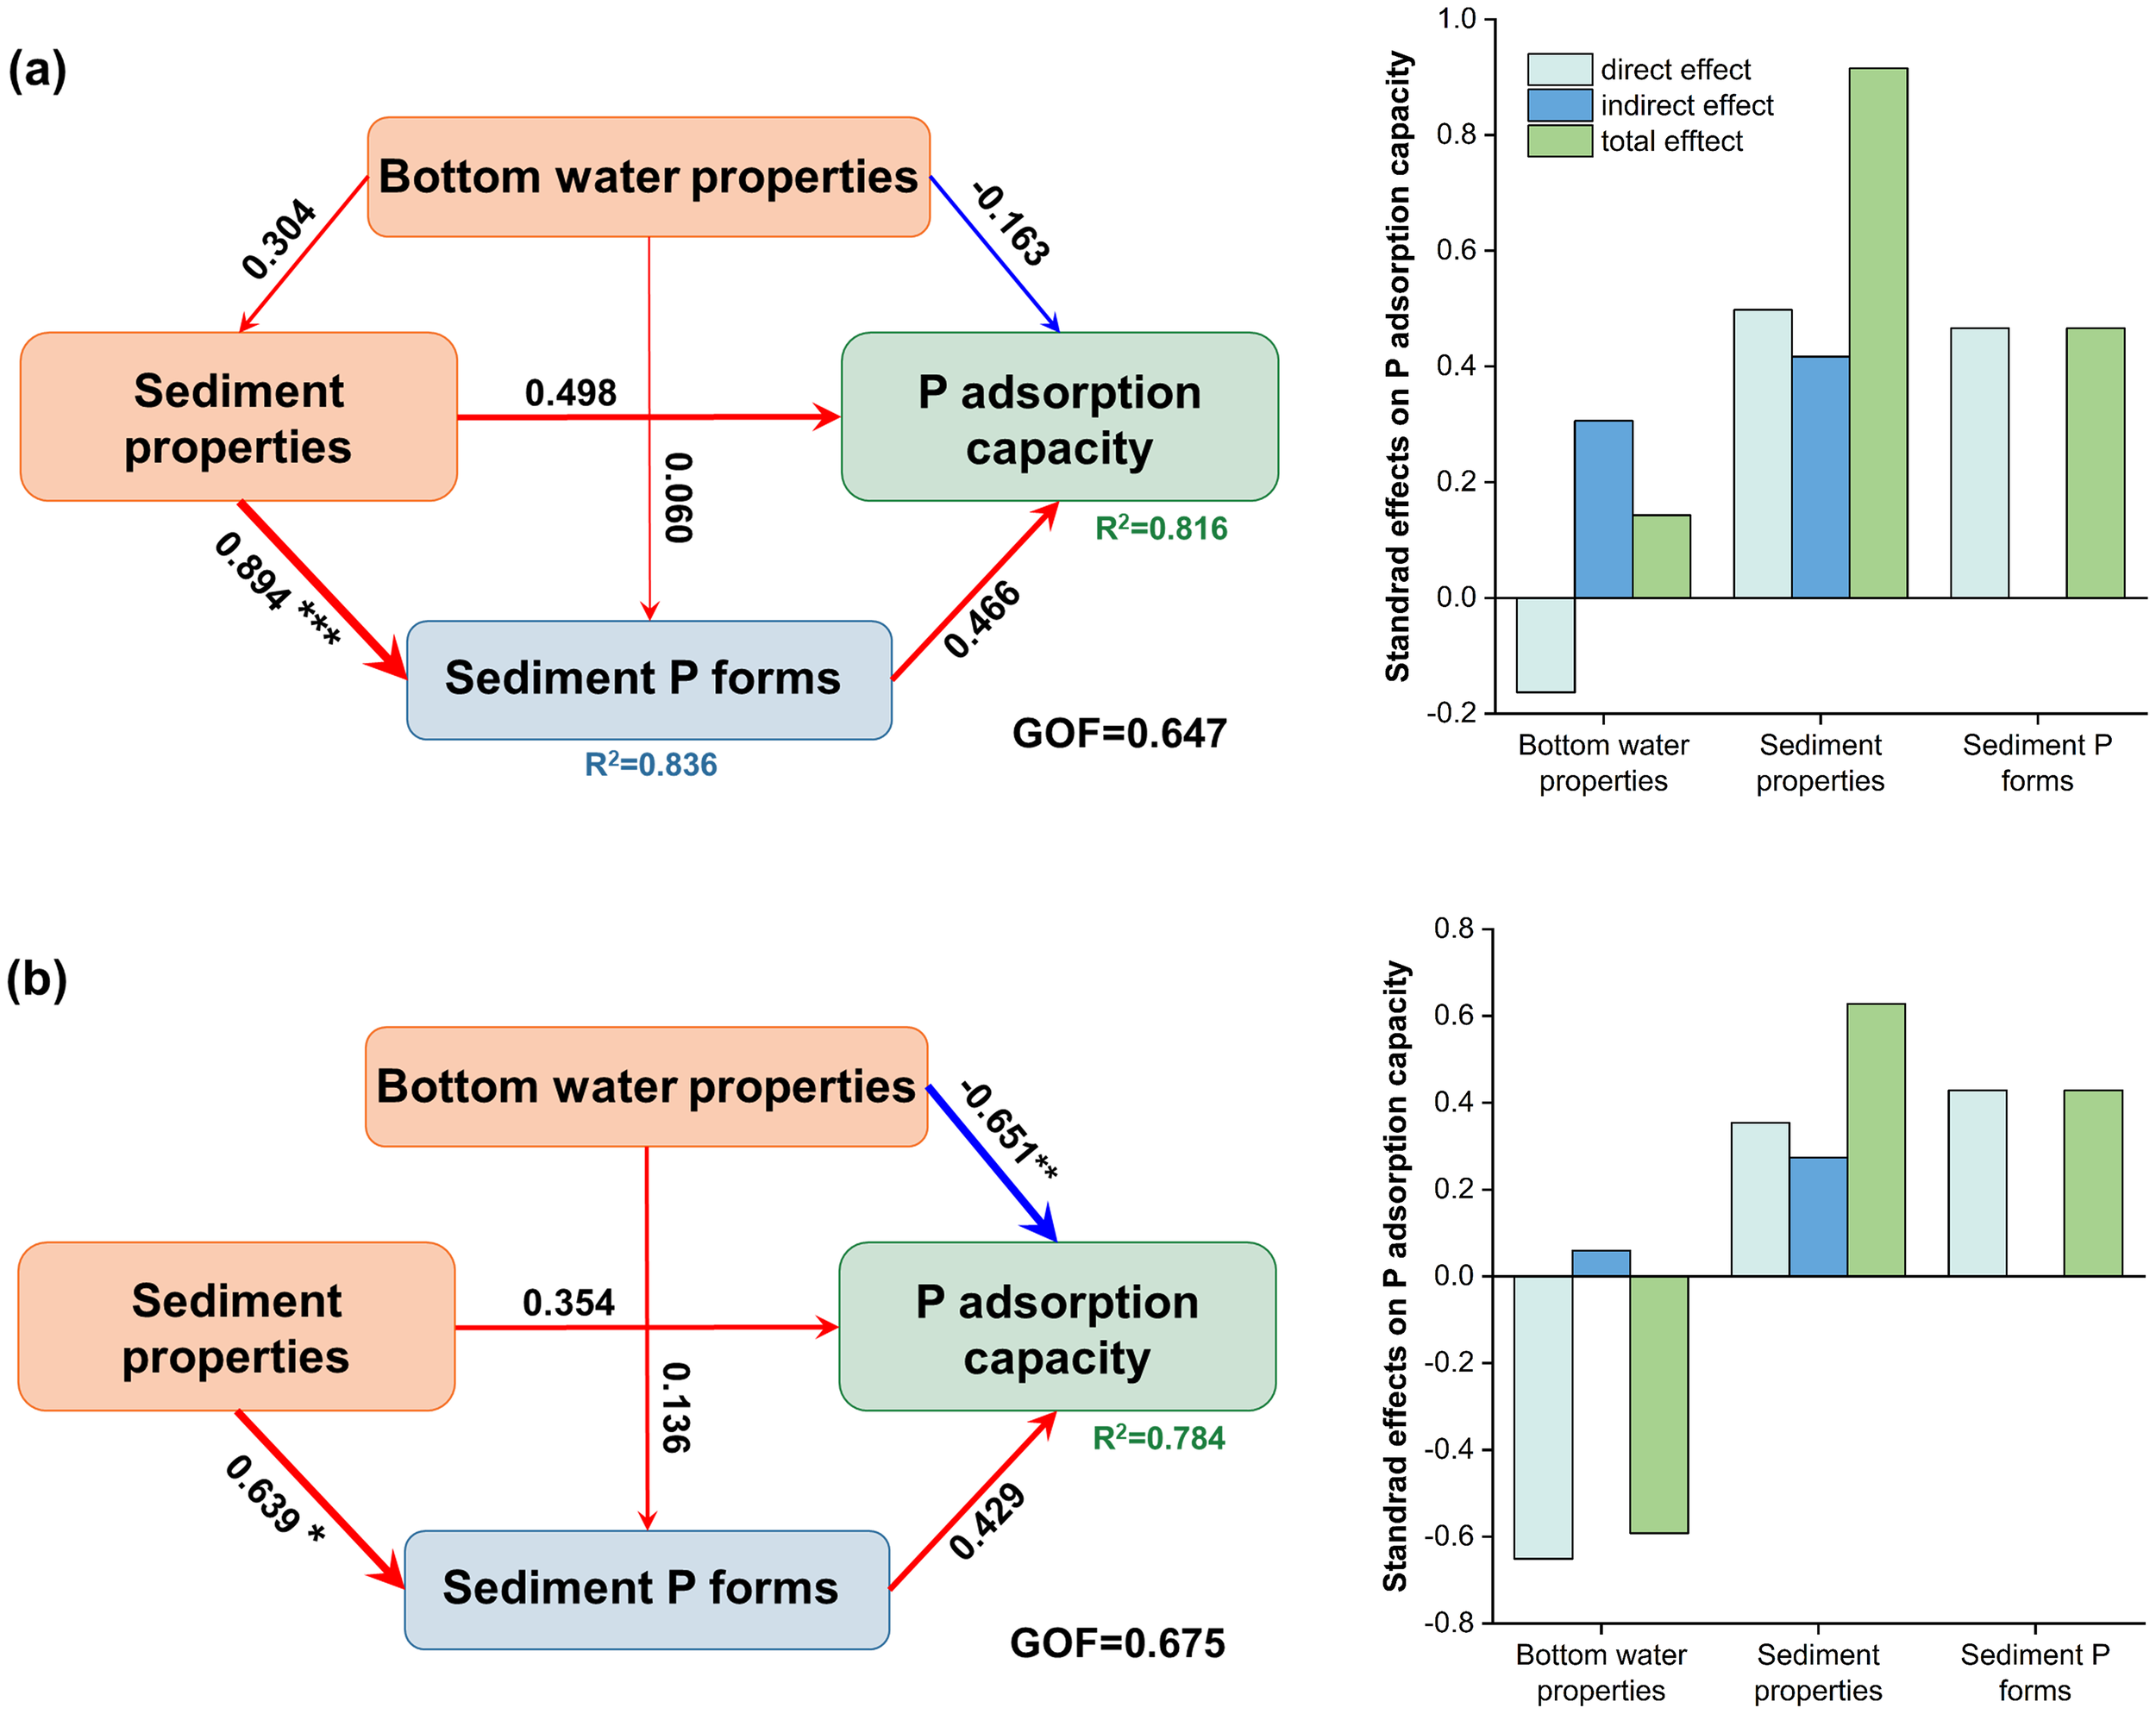
Partial least squares path model (PLS-PM) results for (A) summer and (B) winter observations. Filled boxes denote latent variables. The numbers between latent variables represent path coefficients, with line widths scaled proportionally. The red and blue lines indicate positive and negative effects, respectively. R2 represents the explanatory power of the latent variables. The right panels show the direct, indirect, and total effects derived from the PLS-PM model. *, **, and *** denote significance levels at p< 0.05, p< 0.01, and p<0.001, respectively.
In winter, bottom water properties exerted an overall significant negative influence on P adsorption capacity (path coefficient = -0.651, p< 0.01) (Figure 9B). Within this construct, salt showed a strong negative loading (-0.917) (Supplementary Figure S5), resulting in a positive indirect influence on P adsorption capacity. Specifically, reduced salt levels lead to a decrease in divalent cations(Ca2+ and Mg2+), which weakens the cation bridging effect and thereby reduces P adsorption capacity (Liu et al., 2002; Wang et al., 2024). Conversely, SRP exerted a negative indirect effect on P adsorption, as elevated SRP concentrations in winter lead to the saturation of adsorption sites (Flower et al., 2016), further inhibiting the P accumulation.
4 Discussion
4.1 Comparison with other estuaries
P is widely recognized as a key limiting nutrient in estuarine systems, prompting extensive research dedicated to elucidating its biogeochemical dynamics. Comparative analyses across diverse estuarine systems offer valuable insights into the specific water environmental conditions, sediment properties, and terrestrial inputs of study areas. The DIC content in the bottom water of LRE (41.92 ± 12.26mg/L) was higher than that reported for the Yellow River estuary (25.86 ~ 40.61mg/L) and the Yangtze River estuary (24.79mg/L) (Yan et al., 2011; Liu et al., 2014), suggesting more pronounced terrestrial inputs and carbon accumulation in the LER. Moreover, the average SRP concentration in the LRE (0.090 ± 0.051mg/L) was substantially elevated compared to the Jiaozhou Bay (0.002mg/L) and the Yellow River estuary (0.003mg/L), while remained comparable to levels observed in the Pearl River estuary (0.029mg/L), Green Bay (0.045mg/L), and the Jiujiang River estuary (0.075mg/L) (Xu et al., 2016; Yang et al., 2021; Ke et al., 2022; Zhang et al., 2022b, c). In terms of sediment geochemistry, Fe, Al, and Ca concentrations in the LRE were lower compared with those reported for other estuaries worldwide (Supplementary Table S7), while Mg concentration was relatively higher in the LRE. This pattern may be attributed to the variations in sediment loads and transport dynamics. Elements such as Fe and Al are typically enriched in fine-grained sediment. The annual sediment load of the LRE (6.94 × 10⁶ t yr-¹) is substantially lower than that of other estuarine systems, such as the Yellow River estuary (3.9 × 10⁸ t yr-¹), potentially limiting the accumulation of Fe and Al (Yu et al., 2019; Zhang et al., 2024). In addition, the proportion of fine-grained material in the LRE (75.45%) exceeds that of the Yellow River estuary (73.21%) and the Yangtze River estuary (58.74%) (Yan et al., 2011; Wang et al., 2021). While the higher proportion of fine particles provides a larger specific surface area conducive to phosphate adsorption in sediment, the TP levels in sediment are collectively affected by sediment composition, the degree of chemical weathering, and the magnitude of terrestrial P inputs (Hupfer et al., 1995; Hartmann et al., 2014). Consequently, TP levels in the LRE sediment remained generally lower than those reported for estuaries in southern China and the global sediment average (Supplementary Table S8).
4.2 Implications for runoff regulation and estuarine P management
The results of this study provide practical implications for P management in estuaries under runoff regulation. Integrated statistical analyses, including PLS-PM model and correlation analysis, indicate that sediment P adsorption processes are jointly governed by aquatic environmental conditions (salt and SRP) and sediment properties (Fe, Al, OM, and the proportion of clay and silt).
With respect to hydrological regulation, the PLS-PM results reveal that elevated SRP levels combined with reduced salt in winter likely constrain P accumulation in the sediment. This suggests that freshwater discharge during winter may enhance the risk of internal P loading. Accordingly, optimizing the timing and magnitude of runoff release (such as avoiding large-volume runoff inputs within short periods and maintaining moderate salt levels) may help alleviate the risk of internal P loading. In contrast, sediment in the summer exhibited a moderate P release risk, representing a critical period for controlling P pollution. Appropriately increasing runoff through gate regulation can shorten water residence time, thereby diluting P concentrations and reducing eutrophication risk. From the perspective of sediment management, Fe, Al, OM, and fine-grained particles were identified as the primary controls on NaOH-rP, NaOH-nrP, and HCl-P. This finding highlights the critical role of sediment transport processes in regulating the estuarine P reservoir. Accordingly, measures such as soil conservation practices can effectively reduce the transport of fine-grained and organic-rich sediment to the estuary. Such measures would limit the accumulation of reactive P fractions (such as NaOH-rP and NaOH-nrP) in estuarine sediment, thereby lowering the risk of internal P release. Overall, these results provide a mechanistic basis for mitigating internal P loading and managing P pollution in gate-controlled estuarine systems.
5 Conclusions
This study revealed the spatiotemporal variations in P concentration in both bottom water and sediment during summer (low runoff) and winter (normal runoff) in the LRE. SRP concentrations were evidently higher in winter than in summer, and showed significant spatial variation (p<0.05) in winter, decreasing from the sand mouth toward the outer estuary primarily as a result of runoff inputs. In sediment, the mean TP concentration was higher in summer (495 mg/kg) than in winter (399 mg/kg). The muddy area, characterized by a higher proportion of fine particles and elevated organic matter content, exhibited the highest TP levels due to the increased availability of adsorption sites. The EPC0 consistently exceeded the SRP in the bottom water, indicating that sediments generally acted as P sources to the bottom water. Additionally, the ERI of sediment was higher in summer, whereas the P release potential was greater in summer. Correlation analysis and PLS-PM results both demonstrated that the content of Fe, Al, OM, and the proportion of fine particles were key determinants influencing the concentrations of NaOH-rP, NaOH-nrP, and HCl-P. Elevated SRP levels combined with reduced salt in winter likely constrain the P accumulation in the sediment. Overall, this study provides novel insights into P adsorption behavior and release potential under combined impacts of anthropogenic runoff regulation and seasonal environmental variations, emphasizing the crucial role of internal P in managing estuarine eutrophication.
Statements
Data availability statement
The original contributions presented in the study are included in the article/Supplementary Material. Further inquiries can be directed to the corresponding author.
Author contributions
JL: Data curation, Methodology, Formal analysis, Conceptualization, Writing – original draft, Visualization, Investigation, Writing – review & editing. ZX: Funding acquisition, Methodology, Supervision, Writing – review & editing, Conceptualization. CS: Project administration, Writing – review & editing, Supervision. LD: Data curation, Visualization, Investigation, Writing – review & editing. CZ: Conceptualization, Project administration, Writing – review & editing.
Funding
The author(s) declared that financial support was received for this work and/or its publication. This study was funded by the National Key Research and Development Program of China (grant number 2023YFC3208402) and the National Natural Science Foundation of China (grant numbers 52422904, 52279007).
Conflict of interest
The author(s) declared that this work was conducted in the absence of any commercial or financial relationships that could be construed as a potential conflict of interest.
Generative AI statement
The author(s) declared that generative AI was not used in the creation of this manuscript.
Any alternative text (alt text) provided alongside figures in this article has been generated by Frontiers with the support of artificial intelligence and reasonable efforts have been made to ensure accuracy, including review by the authors wherever possible. If you identify any issues, please contact us.
Publisher’s note
All claims expressed in this article are solely those of the authors and do not necessarily represent those of their affiliated organizations, or those of the publisher, the editors and the reviewers. Any product that may be evaluated in this article, or claim that may be made by its manufacturer, is not guaranteed or endorsed by the publisher.
Supplementary material
The Supplementary Material for this article can be found online at: https://www.frontiersin.org/articles/10.3389/fmars.2026.1765870/full#supplementary-material
References
1
Bache B. W. Williams E. G. (1971). A phosphate sorption index for soils. J. Soil Sci.22, 289–301. doi: 10.1111/j.1365-2389.1971.tb01617.x
2
Bai J. Yu L. Ye X. Yu Z. Guan Y. Li X. et al . (2020a). Organic phosphorus mineralization characteristics in sediments from the coastal salt marshes of a Chinese delta under simulated tidal cycles. J. Soils Sediments20, 513–523. doi: 10.1007/s11368-019-02404-5
3
Bai J. Yu L. Ye X. Yu Z. Wang D. Guan Y. et al . (2020b). Dynamics of phosphorus fractions in surface soils of different flooding wetlands before and after flow-sediment regulation in the Yellow River Estuary, China. J. Hydrol.580, 124256. doi: 10.1016/j.jhydrol.2019.124256
4
Bi N. Yang Z. Wang H. Fan D. Sun X. Lei K. (2011). Seasonal variation of suspended-sediment transport through the southern Bohai Strait. Estuar. Coast. Shelf Sci.93, 239–247. doi: 10.1016/j.ecss.2011.03.007
5
Bolster C. H. McGrath J. M. Rosso E. Blombäck K. (2020). Evaluating the effectiveness of the phosphorus sorption index for estimating maximum phosphorus sorption capacity. Soil Sci. Soc Am. J.84, 994–1005. doi: 10.1002/saj2.20078
6
Bronk D. A. Ward B. B. (2005). Inorganic and organic nitrogen cycling in the Southern California Bight. Deep Sea Res. Part Oceanogr. Res. Pap.52, 2285–2300. doi: 10.1016/j.dsr.2005.08.002
7
Cao X. Liu X. Zhu J. Wang L. Liu S. Yang G. (2017). Characterization of phosphorus sorption on the sediments of Yangtze River Estuary and its adjacent areas. Mar. pollut. Bull.114, 277–284. doi: 10.1016/j.marpolbul.2016.09.026
8
Chen Y. Chen Q. Zhang D. Tang L. (2022). Variation in sediment available-phosphorus in Dianchi Lake and its impacts on algal growth. Int. J. Environ. Res. Public. Health19, 14689. doi: 10.3390/ijerph192214689
9
Cloern J. E. Abreu P. C. Carstensen J. Chauvaud L. Elmgren R. Grall J. et al . (2016). Human activities and climate variability drive fast-paced change across the world’s estuarine–coastal ecosystems. Glob. Change Biol.22, 513–529. doi: 10.1111/gcb.13059
10
Conley D. J. Paerl H. W. Howarth R. W. Boesch D. F. Seitzinger S. P. Havens K. E. et al . (2009). Controlling eutrophication: nitrogen and phosphorus. Science323, 1014–1015. doi: 10.1126/science.1167755
11
Cui M. Guo Q. Wei R. Wei Y. (2021). Anthropogenic nitrogen and phosphorus inputs in a new perspective: Environmental loads from the mega economic zone and city clusters. J. Clean. Prod.283, 124589. doi: 10.1016/j.jclepro.2020.124589
12
Deborde J. Anschutz P. Chaillou G. Etcheber H. Commarieu M.-V. Lecroart P. et al . (2007). The dynamics of phosphorus in turbid estuarine systems: Example of the Gironde estuary (France). Limnol. Oceanogr.52, 862–872. doi: 10.4319/lo.2007.52.2.0862
13
Delaney M. L. (1998). Phosphorus accumulation in marine sediments and the oceanic phosphorus cycle. Glob. Biogeochem. Cycles12, 563–572. doi: 10.1029/98GB02263
14
Dias B. O. Silva C. A. Higashikawa F. S. Roig A. Sánchez-Monedero M. A. (2010). Use of biochar as bulking agent for the composting of poultry manure: Effect on organic matter degradation and humification. Bioresour. Technol.101, 1239–1246. doi: 10.1016/j.biortech.2009.09.024
15
Douglas A. R. Montagna P. A. Dellapenna T. (2025). “ Influence of inflows on estuary sediments,” in Freshwater Inflows to Texas Bays and Estuaries: A Regional-Scale Review, Synthesis, and Recommendations. Eds. MontagnaP. A.DouglasA. R. ( Springer Nature Switzerland, Cham), 173–190. doi: 10.1007/978-3-031-70882-4_6
16
Flower H. Rains M. Lewis D. Zhang J.-Z. Price R. (2016). Control of phosphorus concentration through adsorption and desorption in shallow groundwater of subtropical carbonate estuary. Estuar. Coast. Shelf Sci.169, 238–247. doi: 10.1016/j.ecss.2015.10.024
17
Flower H. Rains M. Lewis D. Zhang J.-Z. Price R. (2017). Saltwater intrusion as potential driver of phosphorus release from limestone bedrock in a coastal aquifer. Estuar. Coast. Shelf Sci.184, 166–176. doi: 10.1016/j.ecss.2016.11.013
18
Froelich P. N. (1988). Kinetic control of dissolved phosphate in natural rivers and estuaries: A primer on the phosphate buffer mechanism. Limnol. Oceanogr.33, 649–668. doi: 10.4319/lo.1988.33.4part2.0649
19
Hartmann J. Moosdorf N. Lauerwald R. Hinderer M. West A. J. (2014). Global chemical weathering and associated P-release — The role of lithology, temperature and soil properties. Chem. Geol.363, 145–163. doi: 10.1016/j.chemgeo.2013.10.025
20
He D. Li P. He C. Wang Y. Shi Q. (2022). Eutrophication and watershed characteristics shape changes in dissolved organic matter chemistry along two river-estuarine transects. Water Res.214, 118196. doi: 10.1016/j.watres.2022.118196
21
Hu Z. Guo K. Yang Y. Zhang M. (2023). Field survey and analysis of water flux and salinity gradients considering the effects of sea ice coverage and rubber dam: a case study of the Liao River Estuary, China. Front. Mar. Sci.10. Available online at: https://www.frontiersin.org/articles/10.3389/fmars.2023.1154150 (January 19, 2024).
22
Huang L. Li L. Huang L. Gielen G. Zhang Y. Wang H. (2012). Influence of incubation time on phosphorus sorption dynamics in lake sediments. J. Soils Sediments12, 443–455. doi: 10.1007/s11368-011-0455-z
23
Hupfer M. Gächter R. Giovanoli R. (1995). Transformation of phosphorus species in settling seston and during early sediment diagenesis. Aquat. Sci.57, 305–324. doi: 10.1007/BF00878395
24
Hyacinthe C. Van Cappellen P. (2004). An authigenic iron phosphate phase in estuarine sediments: composition, formation and chemical reactivity. Mar. Chem.91, 227–251. doi: 10.1016/j.marchem.2004.04.006
25
Jensen H. S. Kristensen P. Jeppesen E. Skytthe A. (1992). Iron: phosphorus ratio in surface sediment as an indicator of phosphate release from aerobic sediments in shallow lakes. Hydrobiologia235, 731–743. doi: 10.1007/BF00026261
26
Jensen H. S. Mortensen P. B. Andersen F. Rasmussen E. Jensen A. (1995). Phosphorus cycling in a coastal marine sediment, Aarhus Bay, Denmark. Limnol. Oceanogr.40, 908–917. doi: 10.4319/lo.1995.40.5.0908
27
Jensen H. S. Thamdrup B. (1993). Iron-bound phosphorus in marine sediments as measured by bicarbonate-dithionite extraction. Hydrobiologia253, 47–59. doi: 10.1007/BF00050721
28
Jiang Y. Yan Q. Liu T. Xu Y. Han X. Ma X. et al . (2023). Phosphorus adsorption characteristics and release risk in saline soils: a case study of Songnen Plain, China. Front. Plant Sci.14. doi: 10.3389/fpls.2023.1302763
29
Kaiser K. Guggenberger G. (2003). Mineral surfaces and soil organic matter. Eur. J. Soil Sci.54, 219–236. doi: 10.1046/j.1365-2389.2003.00544.x
30
Kaiserli A. Voutsa D. Samara C. (2002). Phosphorus fractionation in lake sediments – Lakes Volvi and Koronia, N. Greece. Chemosphere46, 1147–1155. doi: 10.1016/S0045-6535(01)00242-9
31
Karl D. M. Björkman K. M. (2015). “ Chapter 5 - dynamics of dissolved organic phosphorus,” in Biogeochemistry of Marine Dissolved Organic Matter, 2nd ed. Eds. HansellD. A.CarlsonC. A. ( Academic Press, Boston), 233–334. doi: 10.1016/B978-0-12-405940-5.00005-4
32
Ke S. Zhang P. Ou S. Zhang J. Chen J. Zhang J. (2022). Spatiotemporal nutrient patterns, composition, and implications for eutrophication mitigation in the Pearl River Estuary, China. Estuar. Coast. Shelf Sci.266, 107749. doi: 10.1016/j.ecss.2022.107749
33
Knudsen-Leerbeck H. Mantikci M. Bentzon-Tilia M. Traving S. J. Riemann L. Hansen J. L. S. et al . (2017). Seasonal dynamics and bioavailability of dissolved organic matter in two contrasting temperate estuaries. Biogeochemistry134, 217–236. doi: 10.1007/s10533-017-0357-2
34
Kraal P. Burton E. D. Rose A. L. Kocar B. D. Lockhart R. S. Grice K. et al . (2015). Sedimentary iron–phosphorus cycling under contrasting redox conditions in a eutrophic estuary. Chem. Geol.392, 19–31. doi: 10.1016/j.chemgeo.2014.11.006
35
Kuo S. (1988). Application of a modified langmuir isotherm to phosphate sorption by some acid soils. Soil Sci. Soc Am. J.52, 97–102. doi: 10.2136/sssaj1988.03615995005200010017x
36
Labry C. Delmas D. Youenou A. Quere J. Leynaert A. Fraisse S. et al . (2016). High alkaline phosphatase activity in phosphate replete waters: The case of two macrotidal estuaries. Limnol. Oceanogr.61, 1513–1529. doi: 10.1002/lno.10315
37
Lenstra W. K. Egger M. Van Helmond N. A. G. M. Kritzberg E. Conley D. J. Slomp C. P. (2018). Large variations in iron input to an oligotrophic Baltic Sea estuary: impact on sedimentary phosphorus burial. Biogeosciences15, 6979–6996. doi: 10.5194/bg-15-6979-2018
38
Letscher R. T. Moore J. K. (2015). Preferential remineralization of dissolved organic phosphorus and non-Redfield DOM dynamics in the global ocean: Impacts on marine productivity, nitrogen fixation, and carbon export. Glob. Biogeochem. Cycles29, 325–340. doi: 10.1002/2014GB004904
39
Li Z. Tang H. Xiao Y. Zhao H. Li Q. Ji F. (2016). Factors influencing phosphorus adsorption onto sediment in a dynamic environment. J. Hydro-Environ. Res.10, 1–11. doi: 10.1016/j.jher.2015.06.002
40
Li R. Xu J. Li X. Shi Z. Harrison P. J. (2017). Spatiotemporal variability in phosphorus species in the Pearl River estuary: influence of the river discharge. Sci. Rep.7, 13649. doi: 10.1038/s41598-017-13924-w
41
Liao R. Hu J. Li Y. Li S. (2020). Phosphorus transport in riverbed sediments and related adsorption and desorption characteristics in the Beiyun River, China. Environ. pollut.266, 115153. doi: 10.1016/j.envpol.2020.115153
42
Lin L. Xiong J. Liu L. Wang F. Cao W. Xu W. (2024). Microbial interactions strengthen deterministic processes during community assembly in a subtropical estuary. Sci. Total Environ.906, 167499. doi: 10.1016/j.scitotenv.2023.167499
43
Liu S. M. Hong G.-H. Zhang J. Ye X. W. Jiang X. L. (2009). Nutrient budgets for large Chinese estuaries. Biogeosciences6, 2245–2263. doi: 10.5194/bg-6-2245-2009
44
Liu M. Hou L. Xu S. Ou D. Yang Y. Zhang B. et al . (2002). Adsorption of phosphate on tidal flat surface sediments from the Yangtze Estuary. Environ. Geol.42, 657–665. doi: 10.1007/s00254-002-0574-3
45
Liu J. Krom M. D. Ran X. Zang J. Liu J. Yao Q. et al . (2020). Sedimentary phosphorus cycling and budget in the seasonally hypoxic coastal area of Changjiang Estuary. Sci. Total Environ.713, 136389. doi: 10.1016/j.scitotenv.2019.136389
46
Liu Q. Liu S. Zhao H. Deng L. Wang C. Zhao Q. et al . (2015). The phosphorus speciations in the sediments up- and down-stream of cascade dams along the middle Lancang River. Chemosphere120, 653–659. doi: 10.1016/j.chemosphere.2014.10.012
47
Liu Z. Zhang L. Cai W.-J. Wang L. Xue M. Zhang X. (2014). Removal of dissolved inorganic carbon in the Yellow River Estuary. Limnol. Oceanogr.59, 413–426. doi: 10.4319/lo.2014.59.2.0413
48
Liu Z. Zong Y. Li H. Jia D. Zhao Z. (2017). Selectively recovering scandium from high alkali Bayer red mud without impurities of iron, titanium and gallium. J. Rare Earths35, 896–905. doi: 10.1016/S1002-0721(17)60992-X
49
Lukkari K. Hartikainen H. Leivuori M. (2007). Fractionation of sediment phosphorus revisited. I: Fractionation steps and their biogeochemical basis. Limnol. Oceanogr. Methods5, 433–444. doi: 10.4319/lom.2007.5.433
50
Lukkari K. Leivuori M. Hartikainen H. (2008). Vertical distribution and chemical character of sediment phosphorus in two shallow estuaries in the Baltic Sea. Biogeochemistry90, 171–191. doi: 10.1007/s10533-008-9243-2
51
Moore C. M. Mills M. M. Arrigo K. R. Berman-Frank I. Bopp L. Boyd P. W. et al . (2013). Processes and patterns of oceanic nutrient limitation. Nat. Geosci.6, 701–710. doi: 10.1038/ngeo1765
52
Murphy J. Riley J. P. (1962). A modified single solution method for the determination of phosphate in natural waters. Anal. Chim. Acta27, 31–36. doi: 10.1016/S0003-2670(00)88444-5
53
Ni Z. Wang S. Wu Y. Pu J. (2020). Response of phosphorus fractionation in lake sediments to anthropogenic activities in China. Sci. Total Environ.699, 134242. doi: 10.1016/j.scitotenv.2019.134242
54
Pan F. Guo Z. Cai Y. Liu H. Wu J. Fu Y. et al . (2019). Kinetic exchange of remobilized phosphorus related to phosphorus-iron-sulfur biogeochemical coupling in coastal sediment. Water Resour. Res.55, 10494–10517. doi: 10.1029/2019WR025941
55
Pan G. Krom M. D. Zhang M. Zhang X. Wang L. Dai L. et al . (2013). Impact of suspended inorganic particles on phosphorus cycling in the yellow river (China). Environ. Sci. Technol.47, 9685–9692. doi: 10.1021/es4005619
56
Pan F. Liu H. Guo Z. Li Z. Wang B. Gao A. (2017). Geochemical behavior of phosphorus and iron in porewater in a mangrove tidal flat and associated phosphorus input into the ocean. Cont. Shelf Res.150, 65–75. doi: 10.1016/j.csr.2017.09.012
57
Pardo P. Rauret G. López-Sánchez J. F. (2004). Shortened screening method for phosphorus fractionation in sediments: A complementary approach to the standards, measurements and testing harmonized protocol. Anal. Chim. Acta508, 201–206. doi: 10.1016/j.aca.2003.11.005
58
Paytan A. McLaughlin K. (2007). The oceanic phosphorus cycle. Chem. Rev.107, 563–576. doi: 10.1021/cr0503613
59
Pöthig R. Behrendt H. Opitz D. Furrer G. (2010). A universal method to assess the potential of phosphorus loss from soil to aquatic ecosystems. Environ. Sci. pollut. Res.17, 497–504. doi: 10.1007/s11356-009-0230-5
60
Roden E. E. Zachara J. M. (1996). Microbial reduction of crystalline iron(III) oxides: Influence of oxide surface area and potential for cell growth. Environ. Sci. Technol.30, 1618–1628. doi: 10.1021/es9506216
61
Roy E. D. Nguyen N. T. White J. R. (2017). Changes in estuarine sediment phosphorus fractions during a large-scale Mississippi River diversion. Sci. Total Environ.609, 1248–1257. doi: 10.1016/j.scitotenv.2017.07.224
62
Rozan T. F. Taillefert M. Trouwborst R. E. Glazer B. T. Ma S. Herszage J. et al . (2002). Iron-sulfur-phosphorus cycling in the sediments of a shallow coastal bay: Implications for sediment nutrient release and benthic macroalgal blooms. Limnol. Oceanogr.47, 1346–1354. doi: 10.4319/lo.2002.47.5.1346
63
Ruban V. López-Sánchez J. F. Pardo P. Rauret G. Muntau H. Quevauviller Ph. (2001). Harmonized protocol and certified reference material for the determination of extractable contents of phosphorus in freshwater sediments - A synthesis of recent works. Fresenius J. Anal. Chem.370, 224–228. doi: 10.1007/s002160100753
64
Ruttenberg K. C. (1992). Development of a sequential extraction method for different forms of phosphorus in marine sediments. Limnol. Oceanogr.37, 1460–1482. doi: 10.4319/lo.1992.37.7.1460
65
Rydin E. (2000). Potentially mobile phosphorus in Lake Erken sediment. Water Res.34, 2037–2042. doi: 10.1016/S0043-1354(99)00375-9
66
Shan B. Li J. Zhang W. Di Z. Jin X. (2016). Characteristics of phosphorus components in the sediments of main rivers into the Bohai Sea. Ecol. Eng.97, 426–433. doi: 10.1016/j.ecoleng.2016.10.042
67
Smith D. R. Warnemuende E. A. Haggard B. E. Huang C. (2006). Changes in sediment–water column phosphorus interactions following sediment disturbance. Ecol. Eng.27, 71–78. doi: 10.1016/j.ecoleng.2005.10.013
68
Søndergaard M. Jensen J. P. Jeppesen E. (2003). Role of sediment and internal loading of phosphorus in shallow lakes. Hydrobiologia506, 135–145. doi: 10.1023/B:HYDR.0000008611.12704.dd
69
Statham P. J. (2012). Nutrients in estuaries — An overview and the potential impacts of climate change. Clim. Change Macronutr. Cycl. Atmospheric Terr. Freshw. Estuar. Contin. - Spec. Issue Dedic. Profr. Colin Neal434, 213–227. doi: 10.1016/j.scitotenv.2011.09.088
70
Sundby B. Gobeil C. Silverberg N. Alfonso M. (1992). The phosphorus cycle in coastal marine sediments. Limnol. Oceanogr.37, 1129–1145. doi: 10.4319/lo.1992.37.6.1129
71
Walve J. Sandberg M. Larsson U. Lännergren C. (2018). A Baltic Sea estuary as a phosphorus source and sink after drastic load reduction: seasonal and long-term mass balances for the Stockholm inner archipelago for 1968–2015. Biogeosciences15, 3003–3025. doi: 10.5194/bg-15-3003-2018
72
Wang P. He M. Lin C. Men B. Liu R. Quan X. et al . (2009). Phosphorus distribution in the estuarine sediments of the Daliao river, China. Estuar. Coast. Shelf Sci.84, 246–252. doi: 10.1016/j.ecss.2009.06.020
73
Wang Y. Ouyang W. Lin C. Zhu W. Critto A. Tysklind M. et al . (2021). Higher fine particle fraction in sediment increased phosphorus flux to estuary in restored yellow river basin. Environ. Sci. Technol.55, 6783–6790. doi: 10.1021/acs.est.1c00135
74
Wang S. Vogt R. D. Carstensen J. Lin Y. Feng J. Lu X. (2022). Riverine flux of dissolved phosphorus to the coastal sea may be overestimated, especially in estuaries of gated rivers: Implications of phosphorus adsorption/desorption on suspended sediments. Chemosphere287, 132206. doi: 10.1016/j.chemosphere.2021.132206
75
Wang S. Vogt R. D. Wang Q. Mei P. Lu X. (2024). How do major ions and fulvic acid affect dissolved inorganic phosphorus adsorption onto suspended particulate matter in estuarine environment? Estuar. Coast. Shelf Sci.297, 108625. doi: 10.1016/j.ecss.2024.108625
76
Wang Y. P. Voulgaris G. Li Y. Yang Y. Gao J. Chen J. et al . (2013). Sediment resuspension, flocculation, and settling in a macrotidal estuary. J. Geophys. Res. Oceans118, 5591–5608. doi: 10.1002/jgrc.20340
77
Wang Y. Xie X. Liu C. Wang Y. Li M. (2020). Variation of net anthropogenic phosphorus inputs (NAPI) and riverine phosphorus fluxes in seven major river basins in China. Sci. Total Environ.742, 140514. doi: 10.1016/j.scitotenv.2020.140514
78
Wetzels Odekerken-Schröder Van Oppen (2009). Using PLS path modeling for assessing hierarchical construct models: guidelines and empirical illustration. MIS Q.33, 177. doi: 10.2307/20650284
79
Wu G. Cao W. Wang F. Su X. Yan Y. Guan Q. (2019). Riverine nutrient fluxes and environmental effects on China’s estuaries. Sci. Total Environ.661, 130–137. doi: 10.1016/j.scitotenv.2019.01.120
80
Xia W.-J. Xu L.-Z.-J. Yu L.-Q. Zhang Q. Zhao Y.-H. Xiong J.-R. et al . (2020). Conversion of municipal wastewater-derived waste to an adsorbent for phosphorus recovery from secondary effluent. Sci. Total Environ.705, 135959. doi: 10.1016/j.scitotenv.2019.135959
81
Xu G. Song J. Zhang Y. Lv Y. Han G. (2020). Enhancement of phosphorus storage capacity of sediments by coastal wetland restoration, Yellow River Delta, China. Mar. pollut. Bull.150, 110666. doi: 10.1016/j.marpolbul.2019.110666
82
Xu B. Yang D. Burnett W. C. Ran X. Yu Z. Gao M. et al . (2016). Artificial water sediment regulation scheme influences morphology, hydrodynamics and nutrient behavior in the Yellow River estuary. J. Hydrol.539, 102–112. doi: 10.1016/j.jhydrol.2016.05.024
83
Yan H. Dai Z. Li J. Zhao J. Zhang X. Zhao J. (2011). Distributions of sediments of the tidal flats in response to dynamic actions, Yangtze (Changjiang) Estuary. J. Geogr. Sci.21, 719–732. doi: 10.1007/s11442-011-0875-0
84
Yang H. Chang Y. Dong X. Wang S. Che F. Huang W. (2024). The coupled effect of sediment resuspension and microbiota on phosphorus release and transformation in a simulated aquatic ecosystem. J. Water Process Eng.57, 104653. doi: 10.1016/j.jwpe.2023.104653
85
Yang B. Lin H. Bartlett S. L. Houghton E. M. Robertson D. M. Guo L. (2021). Partitioning and transformation of organic and inorganic phosphorus among dissolved, colloidal and particulate phases in a hypereutrophic freshwater estuary. Water Res.196, 117025. doi: 10.1016/j.watres.2021.117025
86
Ye H. Guo S. Li F. Li G. (2013). Water quality evaluation in Tidal River reaches of Liaohe River Estuary, China using a revised QUAL2K model. Chin. Geogr. Sci.23, 301–311. doi: 10.1007/s11769-013-0586-9
87
Younis A. M. Soliman N. F. Elkady E. M. Mohamedein L. I. (2022). Distribution and ecological risk evaluation of bioavailable phosphorus in sediments of El Temsah Lake, Suez Canal. Oceanologia64, 287–298. doi: 10.1016/j.oceano.2021.12.001
88
Yu X. Fan H. Liu L. Chen J. (2019). Calculation of water volume for sediment transport in the sediment-laden river of the main stream of Liaohe River, northern China. Nat. Environ. pollut. Technol.18, 1143–1145.
89
Zhang J.-Z. Huang X.-L. (2011). Effect of temperature and salinity on phosphate sorption on marine sediments. Environ. Sci. Technol.45, 6831–6837. doi: 10.1021/es200867p
90
Zhang M. Krom M. D. Lin J. Cheng P. Chen N. (2022c). Effects of a storm on the transformation and export of phosphorus through a subtropical river-turbid estuary continuum revealed by continuous observation. J. Geophys. Res. Biogeosciences127, e2022JG006786. doi: 10.1029/2022JG006786
91
Zhang P. Li P. Du J. Fan Y. Yan W. (2024). Variations of water and sediment flux from the Yellow River estuary over decades and estuarine dynamic erosion and accumulation shifts. Reg. Stud. Mar. Sci.77, 103605. doi: 10.1016/j.rsma.2024.103605
92
Zhang R. Wu F. Liu C. Fu P. Li W. Wang L. et al . (2008). Characteristics of organic phosphorus fractions in different trophic sediments of lakes from the middle and lower reaches of Yangtze River region and Southwestern Plateau, China. Environ. pollut.152, 366–372. doi: 10.1016/j.envpol.2007.06.024
93
Zhang H. Xin M. Lin C. Wang B. Ouyang W. Liu X. et al . (2022a). Phosphorus distribution in the water and sediment of Laizhou Bay and sediment phosphorus release potential. Sci. Total Environ.846, 157483. doi: 10.1016/j.scitotenv.2022.157483
94
Zhang H. Xin M. Wang B. Wang J. Lin C. Gu X. et al . (2022b). Spatiotemporal variations in phosphorus concentrations in the water and sediment of Jiaozhou Bay and sediment phosphorus release potential. Sci. Total Environ.806, 150540. doi: 10.1016/j.scitotenv.2021.150540
95
Zhao G. Sheng Y. Jiang M. Zhou H. Zhang H. (2019). The biogeochemical characteristics of phosphorus in coastal sediments under high salinity and dredging conditions. Chemosphere215, 681–692. doi: 10.1016/j.chemosphere.2018.10.015
96
Zhou A. Tang H. Wang D. (2005). Phosphorus adsorption on natural sediments: Modeling and effects of pH and sediment composition. Water Res.39, 1245–1254. doi: 10.1016/j.watres.2005.01.026
97
Zhou Y. Zhao C. He C. Li P. Wang Y. Pang Y. et al . (2022). Characterization of dissolved organic matter processing between surface sediment porewater and overlying bottom water in the Yangtze River Estuary. Water Res.215, 118260. doi: 10.1016/j.watres.2022.118260
98
Zhuo T. Wan Q. Chai B. Lei X. He L. Chen B. (2023). Microbial pathways in the coupling of iron, sulfur, and phosphorus cycles at the sediment–water interface of a river system: An in situ study involving the DGT technique. Sci. Total Environ.863, 160855. doi: 10.1016/j.scitotenv.2022.160855
Summary
Keywords
adsorption characteristics, estuary, phosphorus distribution, release potential, runoff regulation
Citation
Li J, Xin Z, Song C, Dong L and Zhang C (2026) Unravelling phosphorus adsorption characteristics and release potential in estuarine sediment under runoff regulation. Front. Mar. Sci. 13:1765870. doi: 10.3389/fmars.2026.1765870
Received
11 December 2025
Revised
23 January 2026
Accepted
26 January 2026
Published
11 February 2026
Volume
13 - 2026
Edited by
Huamao Yuan, Chinese Academy of Sciences (CAS), China
Reviewed by
Lingxin Chen, Chinese Academy of Sciences (CAS), China
Yu Yu, Qingdao Agricultural University, China
Updates
Copyright
© 2026 Li, Xin, Song, Dong and Zhang.
This is an open-access article distributed under the terms of the Creative Commons Attribution License (CC BY). The use, distribution or reproduction in other forums is permitted, provided the original author(s) and the copyright owner(s) are credited and that the original publication in this journal is cited, in accordance with accepted academic practice. No use, distribution or reproduction is permitted which does not comply with these terms.
*Correspondence: Zhuohang Xin, xinzh@dlut.edu.cn
Disclaimer
All claims expressed in this article are solely those of the authors and do not necessarily represent those of their affiliated organizations, or those of the publisher, the editors and the reviewers. Any product that may be evaluated in this article or claim that may be made by its manufacturer is not guaranteed or endorsed by the publisher.