Abstract
Introduction:
Coastal zones in bay cities are characterized by high population density, concentrated economic activities, and integrated socio-ecological systems. The dynamic interaction between industrial structural evolution and coastal development in such areas exerts profound impacts on both regional economic growth and ecological sustainability, making it critical to clarify their correlation.
Methods:
By integrating historical marine maps (1958–2020) and remote sensing images (1986–2020) of Xiamen Bay, we extracted the coastline length and utilization data of Xiamen (a typical bay city). Artificial coastlines were categorized into four types based on their functional attributes. The Spearman rank correlation coefficient was then applied to analyze the relationships between coastline length, utilization type, and urbanization indicators, linking these variables to the structure of the primary, secondary, and tertiary industries.
Results and Discussion:
The results indicate that: 1) From 1958 to 2020, the natural coastline length of Xiamen Bay decreased by 283.57 km, accompanied by continuous expansion of artificial coastlines. Specifically, First-type artificial coastline increased by 152.73 km (1958–2002) but decreased by 134.48 km (2002–2020); Second and third type coastlines expanded by 117.07 km and 154.61 km respectively; Fourth-type coastline emerged after 2002 and reached 23.23 km in 2020. 2) At the regional scale, First-type coastline expansion showed a phased positive correlation with the primary industry; Second and third type coastline development was positively correlated with the secondary and tertiary industries (but negatively correlated with the primary industry). 3) The evolution of Xiamen’s coastal zone has shifted from a single economic benefit orientation to a synergistic “economic–ecological–social” model, corresponding to four stages: agricultural reclamation-dominated, initial export-oriented economy, bay-type city construction, and high-quality development transition. Notably, this shift is closely tied to industrial structure adjustments, providing a reference for bay cities to balance economic growth and coastal ecological protection.
1 Introduction
Influenced by various factors, such as the natural environment, historical culture, and climatic conditions, coastal zones, including bay areas, often attract large populations, capital, technology, and other resources, making them potential hotspots for human settlement and economic activity (Xing et al., 2025). According to the Intergovernmental Panel on Climate Change, the global population is projected to reach 10 billion by 2050, with approximately 1 billion people living in coastal areas ( (Intergovernmental Panel on Climate, 2021)). As unique geographical units formed at the confluence of land and sea, bay areas are characterized by high population density, developed socioeconomic structures, and high levels of urbanization (Xiu et al., 2020). A World Bank study shows that over 60% of global economic activity occurs in port bay areas, and 70% of major cities, with populations exceeding 10 million, are located in these regions (Miao et al., 2025). Over the past century, bay area economies, such as Tokyo Bay, San Francisco Bay, and New York Bay, have gradually emerged. These regions have become global leaders in economic development and technological innovation and have shaped leading bay-type cities around them. As globalization continues to advance, coastal bay areas connect to the world externally and drive national and regional development internally. Consequently, the strategic development position of bay-type cities is becoming increasingly prominent (Xu et al., 2025).
However, severe challenges lie beneath this veneer of economic prosperity. Throughout their development, these bay regions have experienced significant ecological degradation. The 2020 Ocean Science Report highlights that global ocean health is under multiple pressures, including ocean acidification, deoxygenation, eutrophication, and degradation of blue carbon ecosystems (Intergovernmental Oceanographic, 2020). The deterioration of bay environments severely constrains sustainable socioeconomic development, forcing bay region managers and policymakers to adopt adaptive strategies and invest heavily in environmental governance to balance socioeconomic development with the sustainable use of coastal resources (Kong et al., 2024). For example, Chiba City, Yokohama City, and Kawasaki City in Tokyo Bay invest over 3 billion yen annually in coastal and coastline ecological restoration. Similarly, New York Bay and San Francisco Bay have implemented the New York Bay Conservation Plan and the San Francisco Bay Plan, respectively, to improve water quality, restore wetlands, and protect ecosystems (Girgenti, 2020; Lubell et al., 2021). In China, the Ministry of Finance introduced the “Management Measures for Marine Ecological and Environmental Protection and Restoration Funds,” establishing special transfer payments to support projects such as mangrove restoration and estuary regulation. Annual investments in marine ecological restoration by bay cities continue to show an increasing trend. However, due to conflicts between economic development and environmental protection, the challenges in the governance of bay ecological environments remain. With continued socioeconomic development, ocean utilization patterns in urban bay areas are mutually influenced and constrained by these developments (Xiao et al., 2022). For example, the rapid expansion of artificial coastlines into the ocean, driven by economic development, has brought irreversible changes to natural coastlines, and human activities have gradually become a core factor influencing coastline evolution (Chen et al., 2017). As of 2020, artificial coastlines accounted for over half of the total coastline in the Guangdong-Hong Kong-Macao Greater Bay Area, Tokyo Bay, and San Francisco Bay, reaching 57.62%, 95.87%, and 55.36%, respectively (Su and Li, 2021). In this context, exploring the inherent linkages between economic development and coastal land-use patterns in urban bay areas under the influence of human activities is essential. Such analysis not only helps understand the historical context and current challenges of urban bay development and utilization but also provides a scientific basis for achieving a coordinated approach to sustainable coastal resource utilization, ecological and environmental protection, and high-quality economic development.
Research indicates that human activity, urbanization, and socioeconomic development are the primary drivers of land conversion in coastal zones (Siddik and Islam, 2024). These factors exhibit complex interactions and dynamic coupling at different stages of urban bay development. Coastal development is the spatial starting point for economic growth in bay areas. In the initial stages, bay cities relied on natural harbors, prioritizing port and trade industries, which made the coastal zone a hub for ports, warehousing, and industry (Xiao et al., 2022). Urbanization proceeded slowly in the coastal zone, with limited human intervention and a relatively stable bay environment. However, with the acceleration of industrialization, human activity intensified, and reclamation and coastline modification activities increased, significantly changing the morphology of bays. Heavy and chemical industries began to concentrate along the coast, and bay cities gradually became important growth poles for the regional economy. During this period, large-scale land reclamation resulted in the loss of important biological habitats and weakened the hydrodynamic environment within the bays. Large quantities of untreated sewage and industrial wastewater were discharged into the ocean, directly impacting nearshore ecosystems (Sun et al., 2022). City managers had to allocate substantial annual funds to remediating the bay’s environment. As environmental degradation increasingly constrained urbanization and economic development, the development of bay cities entered a stage of industrial restructuring. Coastal land development began shifting from single-use to diversified and coordinated models (Balsas, 2024). Heavy industries relocated from coastal areas, while the coastal zones shifted toward tertiary industries, such as technology and finance, to restore the ecological environment of the bays. Currently, the functional role of bay coastlines is gradually shifting from “production coastlines” to “ecological and public living coastlines.” The economic benefits of coastal land use are gradually decreasing, while the environmental and social benefits are gradually increasing (Yu et al., 2025). How to adapt the industrial structure changes caused by this shift to coastal functions and achieve high-quality development in bay cities has become a key issue for policymakers and researchers.
Although coastal development, urbanization, and human activities are widely recognized as closely interrelated processes, existing studies have largely examined these elements is isolation, with limited attention to their coupled mechanisms, particularly in bay type cities. Moreover, few studies have conducted long-term, stage-based analyses integrating coastline utilization types and industrial transformation. As a result, the dynamic interactions among coastal development, urbanization, and human activities remain insufficiently understood.
Currently, some bay cities with late development or lagging urbanization still face challenges such as underdeveloped coastlines, a monotonous economic and industrial structure, and fragile ecological environments (Marty-Gastaldi et al., 2025). Using Xiamen as a typical case of rapidly urbanizing bay city, this study aims to clarify the coupling mechanisms and evolutionary patterns among coastline development, industrial structure transformation, and human activities by integrating historical nautical charts, remote sensing data, and long-term socioeconomic statistics. This study not only provides new empirical evidence for understanding the coordinated development of coastal zones and urbanization but also offers a transferable analytical framework for other bat-type and rapidly developing coastal regions worldwide. The findings are expected to support more adaptive coastal planning and management strategies and contribute to the implementation of the 2030 Agenda for Sustainable Development Goals (SDGs).
This paper presents a long-term spatiotemporal analysis of coastline utilization evolution and its coupling mechanisms with industrial structure transformation in Xiamen, a typical bay city in China. It is organized as follows: Section 2 provides the background of the study area, including a brief introduction to Xiamen, its coastal development history, and major international coastline. Section 3 describes the data sources and methods, including multi-temporal coastline data processing, coastline utilization classification, and the Spearman rank correlation analysis. Section 4 analyzes the spatiotemporal evolution of Xiamen’s coastline between 1958 and 2020, focusing on changes in total coastline length, structure shifts among different coastline utilization types, and their corresponding change rates. Section 5 applies the Spearman rank correlation coefficient is employed to quantitatively examine the relationship between coastline utilization evolution and industrial structure transformation, and to explore their coupling mechanisms across different development stages. Finally, Section 6 summarizes the main conclusions. This study provides references for the coordinated development of coastal zones, industrial transformation, and sustainable urbanization in bay cities.
2 Background
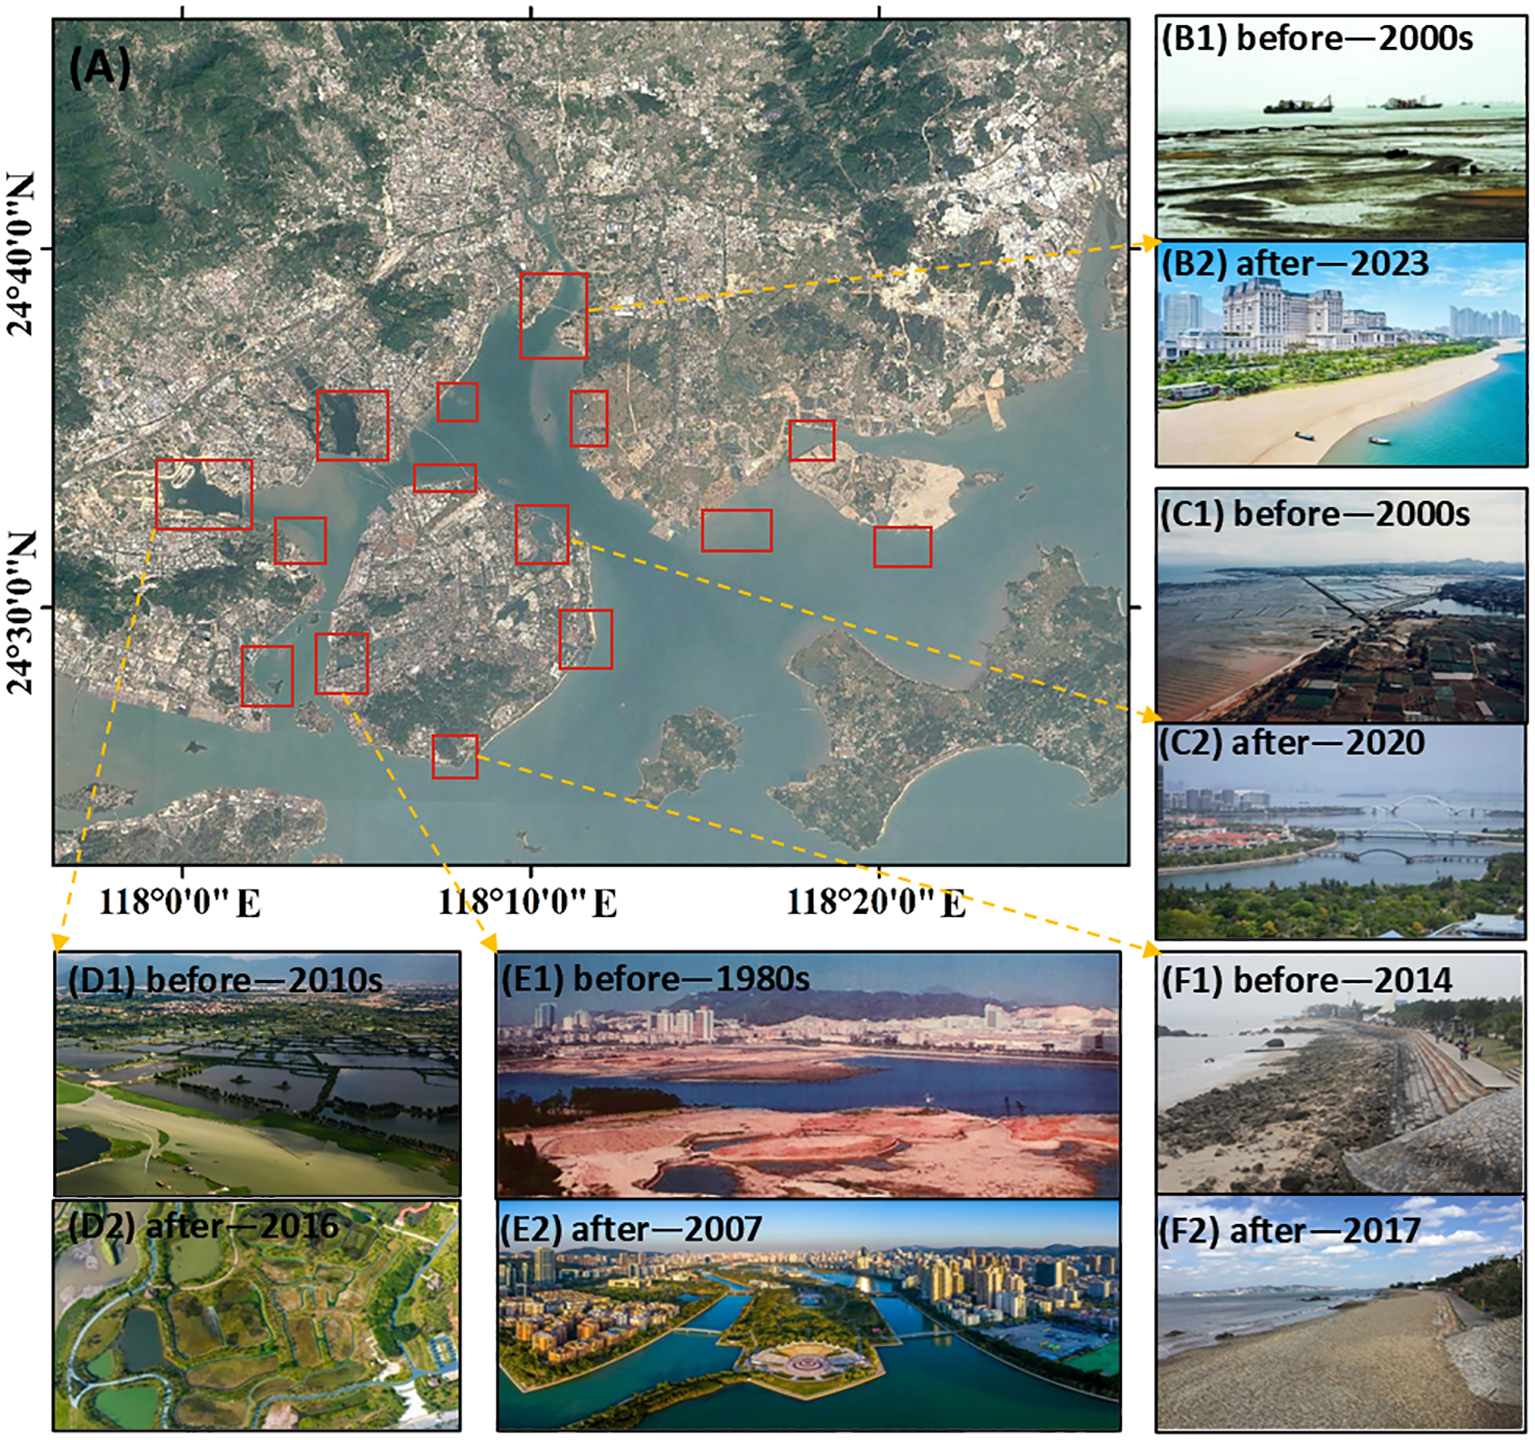
Xiamen is located within Xiamen Bay in southeastern Fujian Province (Figure 1). It administers six districts and covers an urban area of approximately 1,700 km2. The terrain slopes downward from the higher hills in the northwest toward the southeast (Zhang, 2023). Xiamen is among China’s earliest established special economic zones. It is a sub-provincial city and a separately planned municipality under the jurisdiction of Fujian Province. Its per capita GDP is 160,888 CNY (2024), ranking 23rd among cities nationwide. The city plays a key role in the development plan of the Xiamen–Zhangzhou–Quanzhou Metropolitan Area. As a typical bay city, Xiamen exemplifies the characteristics of “a city on the sea, a sea within the city. “The ocean is the lifeblood of Xiamen’s economy, and human activities act as the key driving force behind the evolution of its marine economy and coastal development. From 2020 to 2024, the marine GDP achieved an average annual growth rate of over 7%, and the marine sector contributed 30.1% to the regional GDP in 2024. The exploitation and utilization of marine resources are deeply embedded in the economic development of the city. Looking at the history of coastal zone development, large-scale reclamation activities in Xiamen began in the 1950s, marking the systematic initiation of coastal land-use development. Over the course of urban development, this development model has undergone significant changes: from early, large-scale reclamation focused on economic benefits and spatial expansion to the current stage of coastal zone development that balances social and environmental benefits. Today, Xiamen strictly controls the scale of coastal zone development, establishes marine protected areas, and actively restores damaged coastal ecosystems. This represents a typical stage in the development of coastal zones in bay cities. Currently, Xiamen’s coastal zone development features a diverse industrial structure, encompassing both well-established traditional sectors, such as port and shipping industries, and high-value-added emerging industries, such as marine engineering equipment manufacturing and next-generation information technology. The city has also achieved remarkable success in ecological and environmental protection. Through comprehensive measures, such as seawall demolition, coastal wetland restoration, marine ecological protection and restoration projects, and increased awareness of nature conservation, Xiamen has promoted ecological protection and sustainable development in coastal areas (Yang et al., 2020). Its coastal governance capabilities and sustainable development practices have been recognized internationally. Xiamen received the “Outstanding Achievement Award for Integrated Coastal Management in Southeast Asia” in 2006 and the “Outstanding Achievement Award for Sustainable Coastal Development in Southeast Asia” in 2009 from the Partnership for Sustainable Coastal Development in Southeast Asia (PEMSEA).
Figure 1
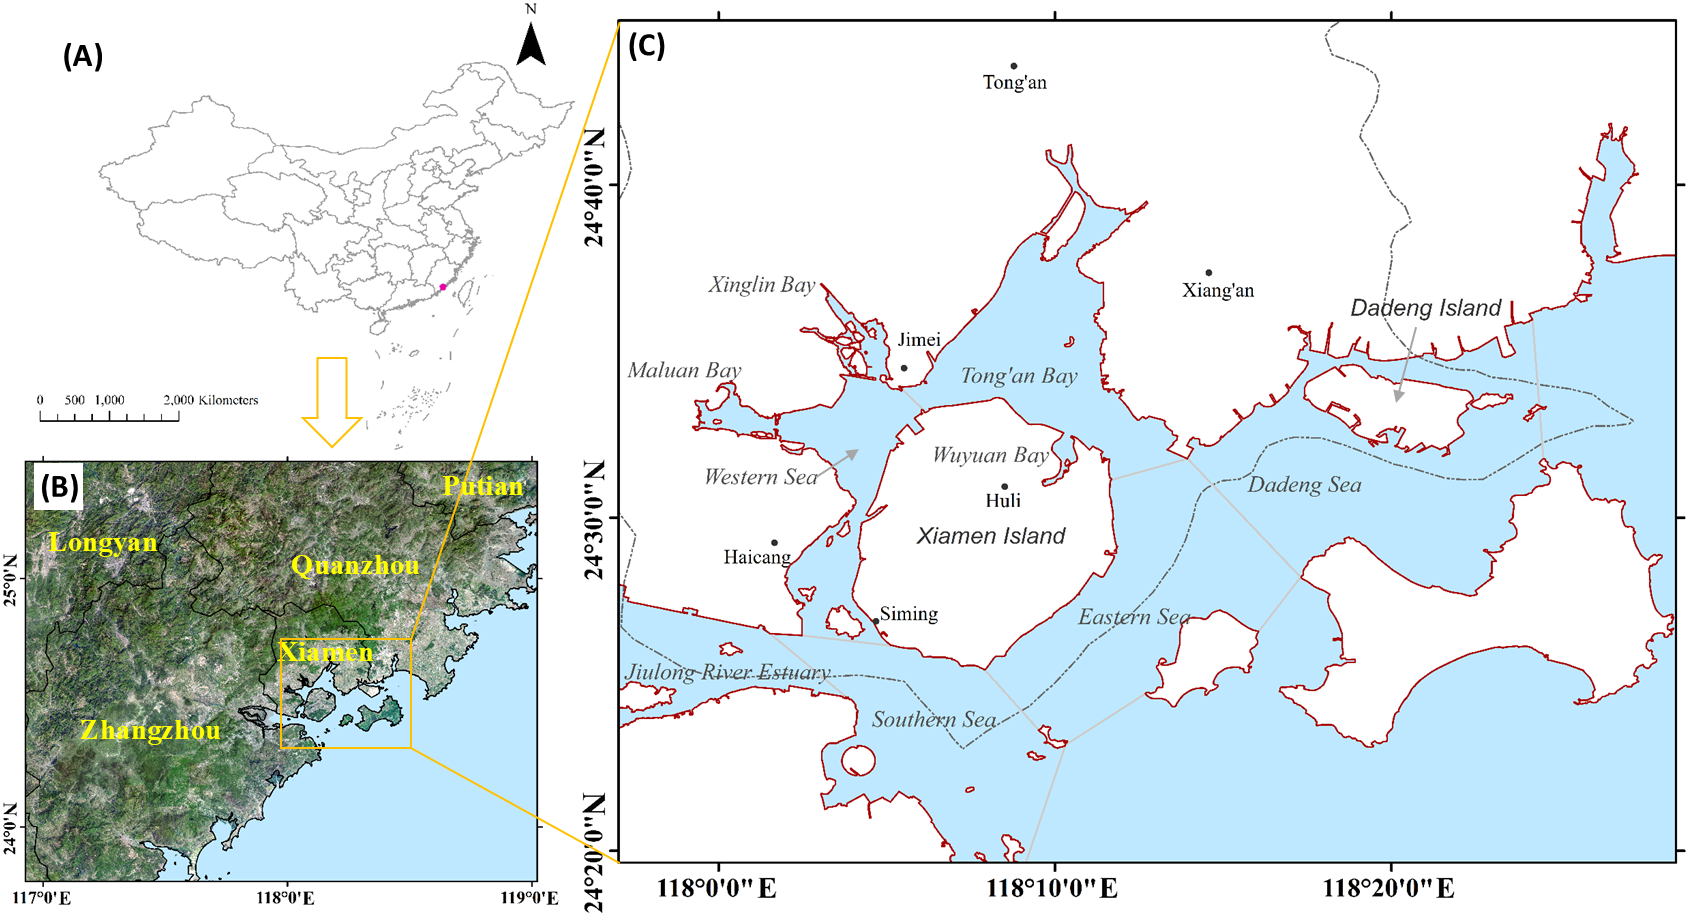
Overview of the study area. (A) Geographic location of Xiamen; (B) Spatial distribution of Xiamen and its surrounding cities and the scope of the research (data source: https://fujian.tianditu.gov.cn/map/ accessed Jan. 30 2026); (C) Basic information of Xiamen, including administrative divisions and marine area distribution.
As a global leader in high-quality development among bay-based cities, Xiamen has integrated the green development concept of harmonious coexistence between humans and nature into every aspect and stage of its economic and social development. Changes in coastal land-use types and urbanization are closely linked to human activities. An in-depth analysis of the history and mechanisms of coastal development in Xiamen, and understanding the interactive relationship between human activities and coastal development and utilization at different stages of economic development, offers valuable insights for other bay-based cities exploring pathways to integrate nature conservation with urban development.
3 Data and methods
3.1 Coastline data acquisition and processing
Multi-source spatial data for Xiamen Bay were collected for five key years between 1958 and 2020. These included three large-scale nautical charts of Xiamen Bay (1958, 1986, and 2002) and Google Earth Pro remote sensing images covering the administrative area of Xiamen City (2010 and 2020). Geometric precision correction was performed on the three charts using ArcGis10.8 (ESRI, Redlands, CA, USA), with at least 12 high-precision control points selected for each chart. The coastlines for each period were digitally extracted using a human-computer interactive visual interpretation method, combining chart contour lines, coastline symbols, and remote sensing imagery. As a straightforward approach for coastline extraction, this method integrates remote sensing image analysis with field reconnaissance, and relies on manual interpretation to complete the extraction of coastline boundaries; generally speaking, the coastline results obtained thereby are of high precision and strong persuasiveness (Liang et al., 2018). However, it should be noted that historical nautical charts and remote sensing imagery inevitably involve uncertainties related to map scale, cartographic generalization, and image spatial resolution. Although multi-source data cross-validation and visual interpretation were employed to improve reliability, small-scale reclamation activities and temporary coastal engineering projects may not be fully captured in the available datasets. To unify the spatial datum, all extracted coastline data were converted to the WGS84 geographic coordinate system and transformed using the Mercator projection to eliminate spatial errors caused by differences in geographic coordinate systems and projection methods. This standardization enabled seamless integration and comparative analysis of coastline data from different periods (Xiao et al., 2022).
According to previous studies, 56 reclamation projects were implemented in Xiamen’s waters between 1950 and 2005, totaling 104.75 km2 of land. Reclamation activities were primarily concentrated in the Western Sea and Tong’an Bay, where 62.76 km2 and 33.65 km2 of land were reclaimed, accounting for 60% and 32% of the total reclaimed area, respectively (Liu et al., 2009). Large and medium-sized reclamation projects were mainly conducted between the 1950s and 1980s, while small and medium-sized projects became the focus after the 1980s (Tang et al., 2020).
In distinguishing coastline utilization types, the extraction of coastlines from nautical charts followed the specifications of the Chinese nautical chart patterns (GB12319-1998, GB12319-2022) and the “Study on Coastline Classification and Delineation Methods.” (Wang et al., 2021) Coastline classification derived from satellite images was primarily accomplished through visual interpretation. Both approaches incorporated data on historical land reclamation activities in the Xiamen area, and information from the Xiamen Industrial Spatial Layout (2024) published by the Xiamen Municipal Bureau of Industrialization and Information Technology.
The coastline utilization in Xiamen’s coastal areas can be categorized into 10 types: natural, agricultural, salt pan, aquaculture, port and terminal, industrial, transportation, urban, tourism, and ecological restoration. The first nine types are classified based on the land-use type of the coastal zone in which the coastline is located. Ecological restoration coastlines refer to the coastlines formed after the restoration of a previously polluted or damaged coastline under policy guidance. Based on the comprehensive classification of coastal utilization types above, we divide these coastline utilizations into four categories: 1) agricultural, salt pan, and aquaculture coastlines; 2) port and terminal, industrial, and transportation coastlines; 3) urban and tourism coastlines; 4) ecological restoration coastlines. Combining with practical factors such as the intensity of human activities and the degree of coastal changes (Xiao et al., 2022; Xing et al., 2025), concerning “Industrial Classification for Ocean Industries and Their Related Activities (GB/T 20794-2021)”. Based on this classification, this study explores the characteristics of coastal line utilization in Xiamen and the historical development of reclamation activities in its coastal areas.
3.2 Economic data acquisition
The data of GDP and output values of various industries in Xiamen from 1958 to 2020 was sourced from the official Statistical Yearbook of the Xiamen Municipal Bureau of Statistics and publicly available statistical data sources (Xiamen Municipal Bureau of, 2023). GDP, as a key economic indicator, was used to quantify Xiamen’s regional economic development level. The GDP data of the primary, secondary, and tertiary industries were used to analyze the evolution of Xiamen’s dominant industries at different stages of development. The primary industry refers to sectors that directly obtain primary products from nature without further processing, such as agriculture, forestry, animal husbandry, sideline products, and fisheries, and serves as the foundation of human production. The secondary industry converts natural resources from the primary industry into industrial products through processing and manufacturing. It is one of the core drivers of economic growth and mainly encompasses industry and construction. The tertiary industry, also known as the “service industry,” does not directly produce physical products but provides services to the primary and secondary industries and social life. It represents the largest proportion of industries in the modern economy and primarily encompasses distribution, production, lifestyle, and public services (Kenessey, 1987). During the urbanization process of Xiamen, its three-sector structure evolved significantly. In the 1950s, the economy exhibited a balanced three-sector structure. With accelerated industrialization, the secondary industry became dominant in subsequent periods. Around 2010, Xiamen transitioned toward a tertiary industry-dominated economic structure.
In this study, coastline data were extracted from three large-scale nautical charts (1958, 1986, and 2002) and high-resolution satellite images from Google Earth (2010 and 2020). These years were selected based on data availability, data quality, and their representativeness of key stages in Xiamen’s coastal development. Due to historical limitations, reliable nautical charts and high-resolution remote sensing images are only available for specific benchmark years rather than on an annual basis. In contrast, socioeconomic data are reported annually, and thus industrial statistics from 1958 to 2020 were collected. This study focuses on long-term and stage-based evolution of coastline utilization and industrial structure, rather than year-to-year fluctuations; therefore, slight temporal mismatches between coastline and economic data are unlikely to substantially affect the overall conclusions.
3.3 Coastline data acquisition and processing
3.3.1 Artificial index of coastline
The coastline artificial index (AI) indicates the degree of transformation from natural coastlines to artificial coastlines, reflecting the degree of human intervention (Wang et al., 2021; Zhang & Hou, 2020). It is calculated as follows:
where represent the lengths (km) of the artificial coastline and total coastline, respectively, with The closer the value of is to 1, the higher the degree of artificialization of the coastline; the closer the value of is to 0, the lower the degree of artificialization of the coastline.
3.3.2 Coastline and industrial change rate
Xiamen’s total coastline length is constantly changing, and its economic output is also growing. Therefore, the data for different coastline types and the three types of industries were expressed as percentages of their respective totals. Owing to the large span of years, the intervals between the five observation years vary, as do the degrees of coastline change and economic development. Therefore, the average annual change rates of the three industrial sectors and coastline types were calculated for each period using the following formulas:
where represents the average annual change rate of a certain type of industry between years i and j (i, j = 1958, 1986, 2002, 2010, 2020). A larger value indicates a greater change in the output value of the industry during the period; a positive value indicates an increase in output value, while a negative value indicates a decrease. Similarly, represents the average annual change rate in the length of a certain coastline type between years i and j. The larger the value of , the greater the change in the length of the coastline type during that period; a positive value indicates an increase in the length of the coastline type, while a negative value indicates a decrease.
3.3.3 The Spearman rank correlation coefficient
Correlation analysis has been widely used to study the relationship between human activities and coastal change (Huang et al., 2024; Zhang, 2023). Compared with the Pearson correlation coefficient, the Spearman rank correlation coefficient is a nonparametric method that does not require the data to follow a specific distribution. It is particularly suitable for processing ordered data with small sample sizes and is more robust in describing temporal correlations (Tu et al., 2025). Therefore, this study used the Spearman rank correlation coefficient to examine the relationship between different types of coastlines and economic development in Xiamen.
The Spearman rank correlation coefficient is used to measure the strength of a monotonic relationship between two variables. It is based on data ranking and does not rely on specific numerical values. Therefore, it can handle non-normally distributed data and data containing outliers, reducing their impact (Bocianowski et al., 2024). The Spearman rank correlation coefficient is widely used in economics to analyze the relationship between the development status of a specific industry and macroeconomic indicators, offering a more robust method to determine the relationship between the two (Sampaio et al., 2024; Stellian et al., 2024). The calculation formulas are as follows:
where X and Y represent coastline data and economic development data, respectively. The values of X and Y are sorted to obtain their ranks R(X) and R(Y), respectively. denotes the rank difference of the i-th pair of data of X and Y, where n is the number of samples, and Rs is the Spearman rank correlation coefficient, with ranging from 0 to 1. When Rs > 0, it indicates a positive correlation between the two variables, while when Rs < 0, it indicates a negative correlation. The strength of the correlation between the variables is determined by the magnitude of . When equals 1 or -1, it indicates that the variation trends of X and Y values were completely consistent or opposite during the period from 1958 to 2020. Following Mukaka (2012) (Mukaka, 2012), when is between 0.8 and 1, the two groups of variables have an extremely strong correlation; between 0.6 and 0.8, strong correlation; between 0.4 and 0.6, moderate correlation; between 0.2 and 0.4, weak correlation; below 0.2, extremely weak correlation or no correlation.
4 Results
4.1 Changes in the spatiotemporal distribution of the coastline (1958–2020)
Based on historical data and spatial evolution analysis, Xiamen’s coastline underwent significant morphological and spatial changes between 1958 and 2020 (Figure 2), driven by large-scale coastal development activities.
Figure 2
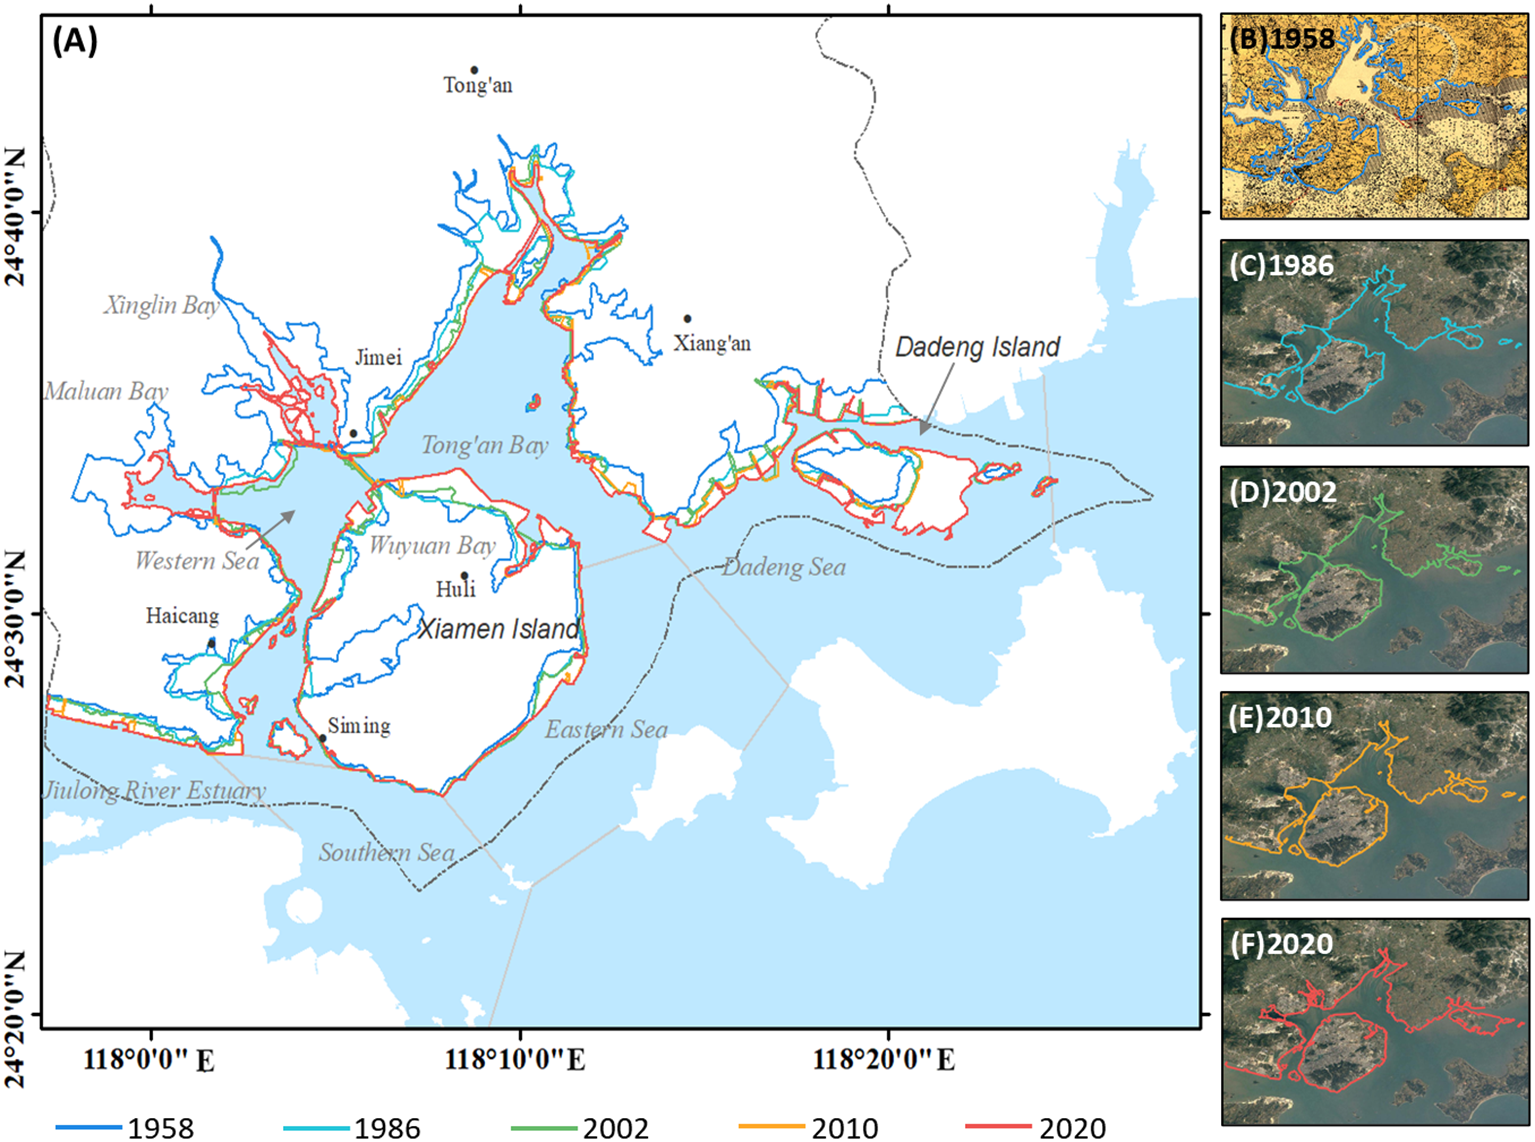
(A) Spatiotemporal changes in the coastlines of Xiamen in 1958, 1986, 2002, 2010, and 2020; (B) historical marine map of Xiamen in 1958; (C–F) remote sensing images of Xiamen from different years obtained via Google Earth Pro. The colored lines represent coastlines corresponding to different years.
As shown in Figure 2B, in 1958, Xiamen’s coastline exhibited a naturally sinuous character. In 1986, with the completion of several seawall projects, Xiamen’s coastline underwent a dramatic shift, shifting from sinuous to straight. During this period, the mainland coastlines of the Haicang, Tong’an Bay, and Dadeng areas of the Western Sea experienced varying degrees of seaward advancement. Simultaneously, the coastlines of islands such as Xiamen Island and Dadeng Island also expanded significantly (Figure 2C). Between 1986 and 2002, the intensity of coastline change decreased compared to the previous period. However, reclamation activities continued to cause the coastline to advance seaward along the northern Western Sea, the Haicang coast, the western and northern margins of Tong’an Bay, the Dadeng coast, and the western and northern Xiamen Island. During this period, the coastlines along the eastern and southern Xiamen Island and the entrance of Tong’an Bay remained relatively stable, exhibiting an overall spatial pattern of “local advancement and dominant stability.” Compared to 1986, in 2002, the coastline appeared more sinuous due to the differentiated evolution of local coastlines (Figure 2D). Between 2002 and 2010, the overall coastline changes were relatively minor. Apart from the seaward advance along the Haicang coast in the Western Sea and the eastern Tong’an Bay, additional coastline extensions occurred along the north and east of Xiamen Island, further increasing coastline sinuosity. From 2010 to 2020, a series of seawall opening reconstruction projects reconnected Tong’an Bay with the Western Sea, reopening Maluan Bay and Wuyuan Bay (Ding et al., 2021; Zheng et al., 2018). During this period, coastline changes were mainly concentrated near the entrance of Tong’an Bay and in the Dadeng Sea. In particular, the construction of Xiamen Xiang’an International Airport on Dadeng Island led to a significant seaward expansion of the island’s coastline.
4.2 Changes in the coastline
Figure 3 illustrates the dynamic changes in Xiamen’s coastline length from 1958 to 2020, showing an overall trend of first decreasing and then increasing. Between 1958 and 1986, large-scale land reclamation and seawall construction projects were undertaken across Xiamen. Therefore, the total coastline length decreased significantly, with a cumulative loss of 106.52 km, indicating an average annual decrease of 3.8 km. From 1986 to 2002, the scale of land reclamation activities decreased, with medium- and small-scale projects becoming predominant. During this period, Xiamen’s coastline length increased slightly, extending by 23.36 km, equivalent to an average annual increase of 1.3 km. From 2002 to 2010, the upward trend continued, with the coastline length increasing by 12.65 km, or an average annual increase of 1.58 km. From 2010 to 2020, Xiamen City implemented a series of seawall opening renovation projects, reopening bays such as Maluan Bay and Wuyuan Bay, resulting in substantial changes in the coastline morphology (Lin et al., 2020). During this decade, the coastline length increased significantly by 100.09 km.
Figure 3
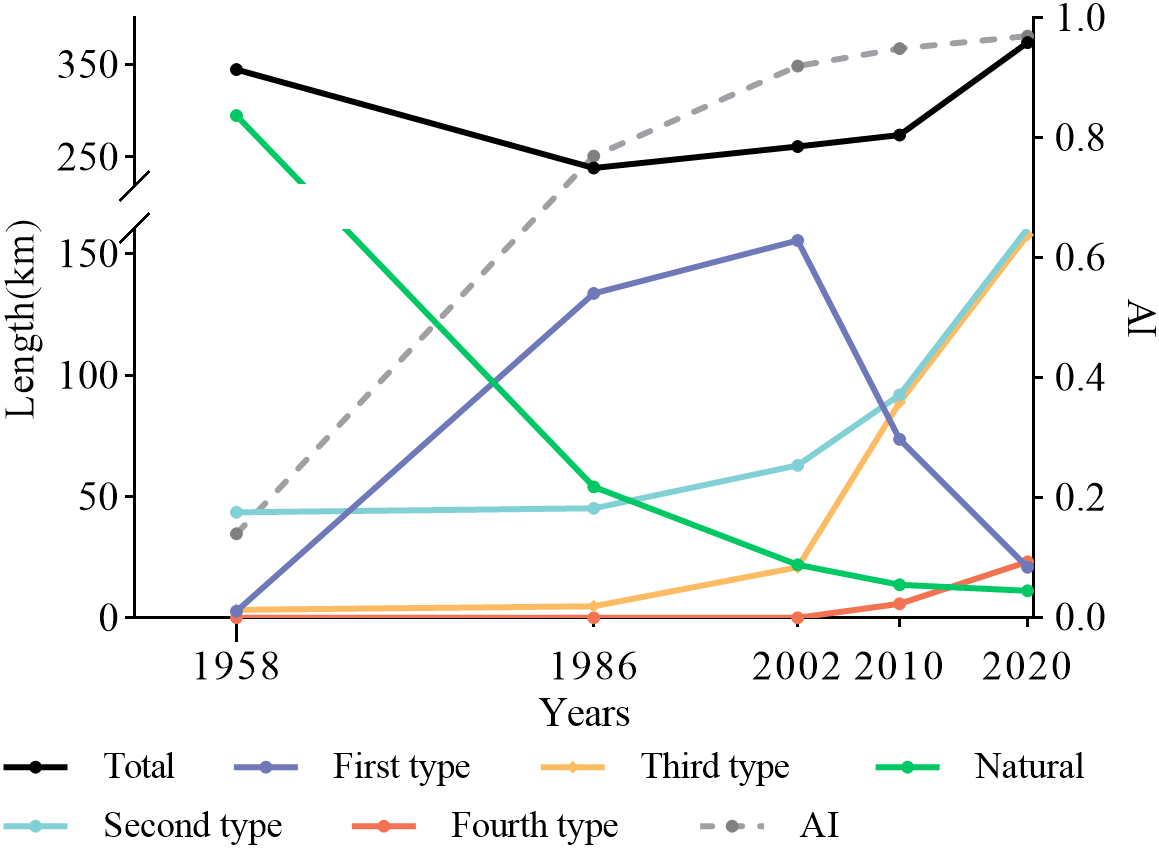
Changes in coastline types and the artificial coastline index (AI). The solid lines represent changes in the total coastline length and the lengths of different coastline types across different years, while the dashed line indicates changes in AI over time. The left Y-axis shows the coastline length (km), and the right Y-axis shows AI, which is a dimensionless number.
Xiamen’s coastline was subdivided into natural coastlines and four types of artificial coastlines based on their functional uses, and their length changes were analyzed over time. As shown in Figure 3 and Figure 4, the natural coastline showed a continuous decline from 1958 to 2020, decreasing sharply from 294.84 km in 1958 to 11.27 km in 2020. The average annual rates of change (LI) during the four periods, 1958–1986, 1986–2002, 2002–2010, and 2010–2020, were -2.92%, -3.71%, -4.76%, and -1.72%, respectively. The specific coastline lengths for the five benchmark years were 294.84 km, 54.14 km, 21.96 km, 13.60 km, and 11.27 km, respectively. The four types of artificial coastlines showed different evolutionary characteristics. The length of the first coastline type (agricultural, salt field, and aquaculture coastlines) showed a trend of first increasing and then decreasing. The length increased rapidly from 2.74 km to 155.47 km between 1958 and 2002, mainly distributed in the Western Sea area and Tong’an Bay, and then decreased significantly between 2002 and 2020, finally dropping to 20.99 km. The LIs of the four periods were 170.59%, 1.02%, -6.58%, and 7.15% respectively. The second type of coastline (port terminal, industrial, and transportation coastlines) showed steady growth, expanding from 44.69 km in 1958 to 160.54 km in 2020. The most significant increase occurred during 2010–2020, concentrated around the mouth of Tong’an Bay and the Xiang’an coast in Dadeng Sea, with an increase of 68.54 km. The LIs for the four periods were 0.15%, 2.44%, 5.77%, and 7.45% respectively. The third type of coastline (urban and tourist coastlines) had a length of 3.31 km in 1958 and expanded rapidly between 2002 and 2020, particularly around Xiamen Island, the northern Western Sea area, and the western Tong’an Bay. The length increased from 20.85 km to 157.92 km, with a net increase of 137.07 km. The LIs for the four periods were 1.60%, 20.92%, 40.78%, and 7.77%, respectively. The fourth type of coastline (ecological restoration coastline) first appeared between 2002 and 2010, and its length increased from 5.81 km to 23.23 km between 2010 and 2020, primarily distributed at the entrances of Maluan Bay, Wuyuan Bay, and Xinglin Bay. The LI during this period was 30.00%.
Figure 4
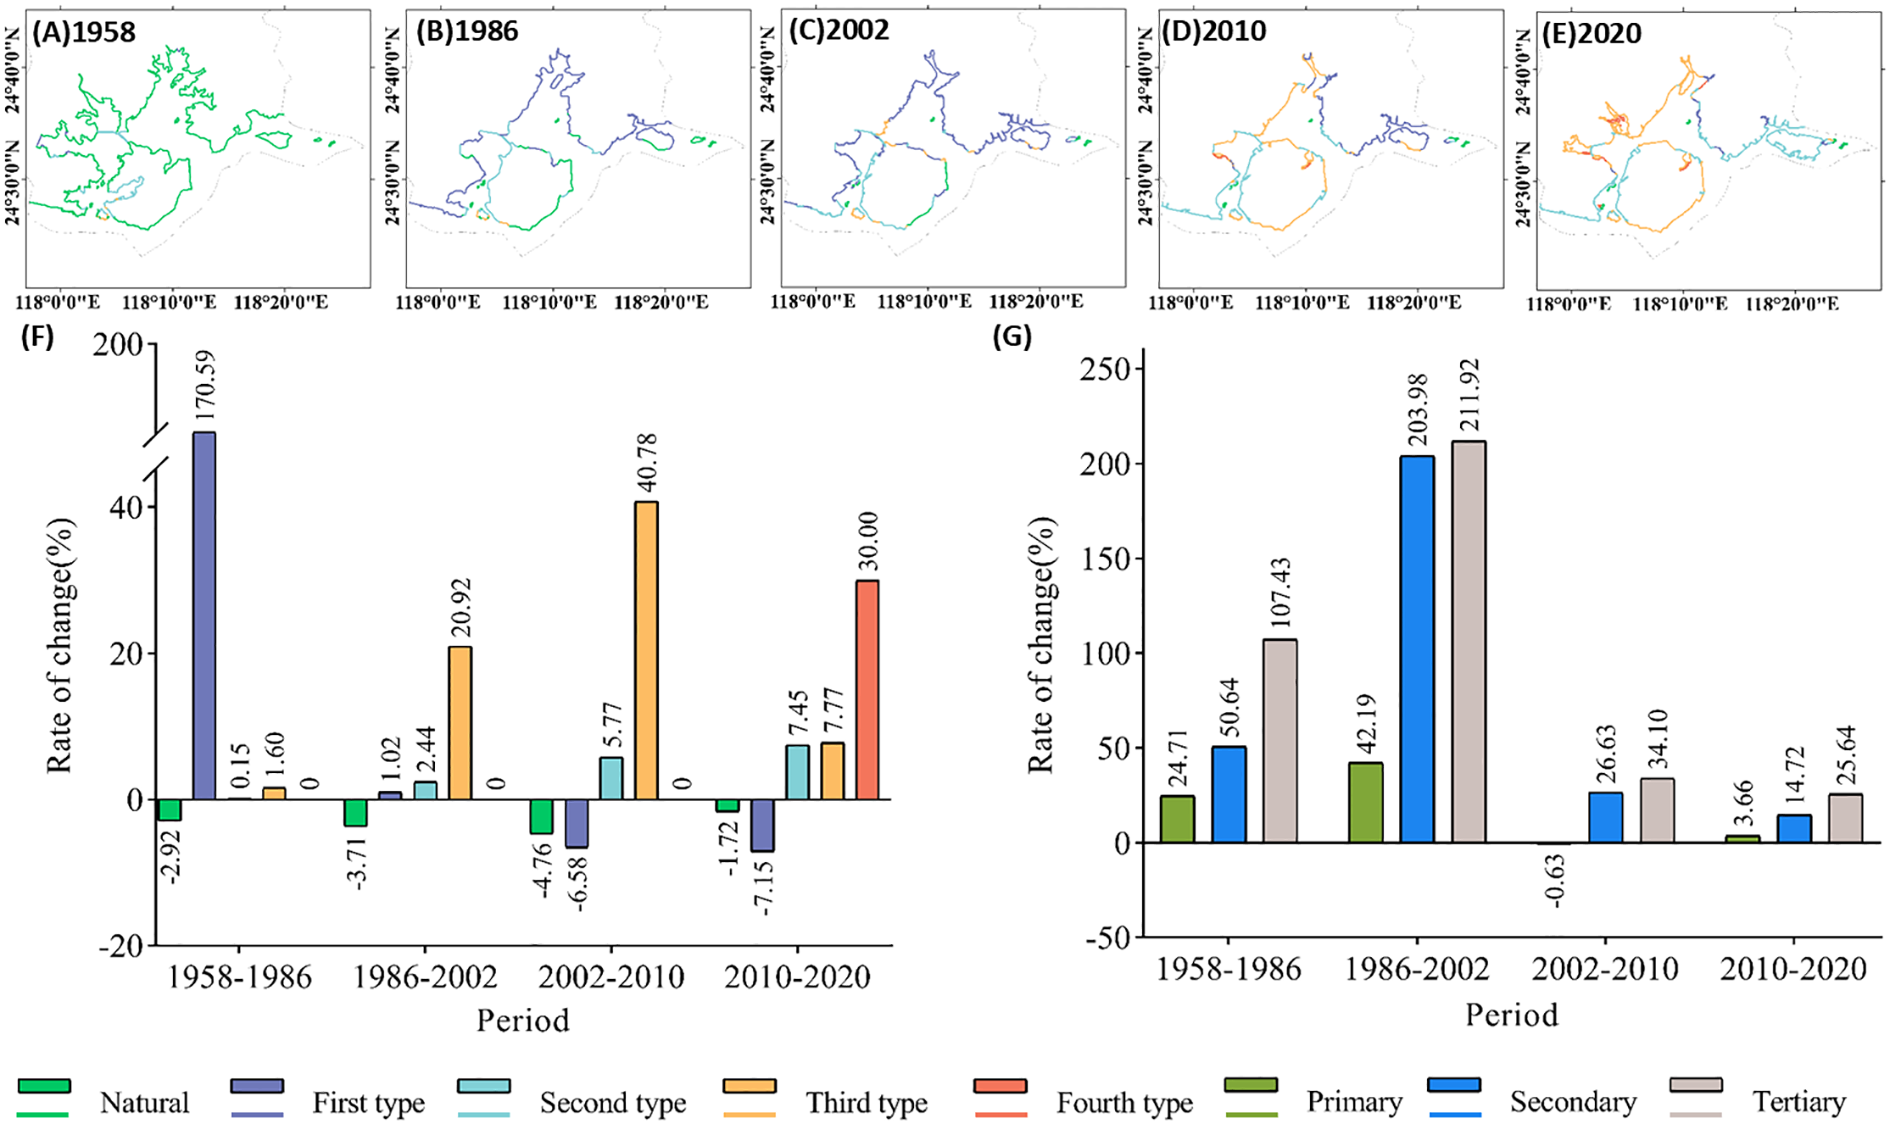
Temporal and spatial distribution of different types of coastlines (indicated by colored lines): (A) 1958; (B) 1986; (C) 2002; (D) 2010; (E) 2020. Average annual change rates for different periods: (F) different types of coastlines; (G) different industries.
The continuous expansion of artificial coastlines has led to a steady increase in Xiamen’s coastline AI. Between 1958 and 1986, the AI increased rapidly from 0.14 to 0.77, with an average annual growth rate of 16.1%. From 1986 to 2020, however, the annual growth rate gradually slowed to 1.2% during 1986–2002, 0.4% during 2002–2010, and 0.2% during 2010–2020. In 2020, Xiamen’s AI reached 0.97, indicating that coastal development in Xiamen had entered a highly artificial stage and that the exploitation and utilization of its natural coastline resources were nearing saturation.
To further analyze the spatiotemporal evolution of Xiamen’s coastline, this study systematically analyzed the dynamic changes in its composition by calculating the proportion of different coastline types in the total coastline length for each study year (Figure 5A). In 1958, Xiamen’s coastline was dominated by natural and first-type coastlines, accounting for 85.62% and 12.62% of the total coastline length, respectively. Second and third-type coastlines, however, represented only 0.80% and 0.96%, respectively, indicating a low level of coastal development during this period, with natural attributes dominating. By 1986, the coastline composition had changed significantly: the proportion of first-type coastline had increased to 56.20%, replacing natural coastline as the dominant type. Natural, second-, and third-type coastlines accounted for 22.76%, 19.02%, and 2.02%, respectively. The sharp increase in the proportion of artificial coastlines indicates a significant increase in coastal development. Between 1986 and 2002, artificial coastline development continued to advance, with the proportions of first-, second-, and third-type coastlines all increasing, while natural coastlines continued to decline. By 2002, the proportion of first-type coastline peaked at 59.52%, third-type coastline accounted for 7.98%, and the proportion of natural coastline further declined to 9.64%. By 2010, another significant shift had occurred. The proportions of second- and third-type coastlines increased significantly, surpassing the first type to become the dominant type. The proportion of natural coastline fell to 4.97%, while the fourth-type coastline began to emerge, accounting for 2.12%. By 2020, second- and third-type coastlines accounted for 42.93% and 42.63%, respectively, becoming nearly equal and dominant. Natural coastline declined to 3.01%, marking a historic low. Overall, from 1958 to 2020, Xiamen’s coastline structure evolved from a single model dominated by natural coastlines to a diversified structure characterized by artificial coastlines. The current structure, dominated by second- and third-type coastlines, reflects, to a certain extent, a trend toward functional diversification and an optimized spatial layout in coastal development and utilization.
Figure 5
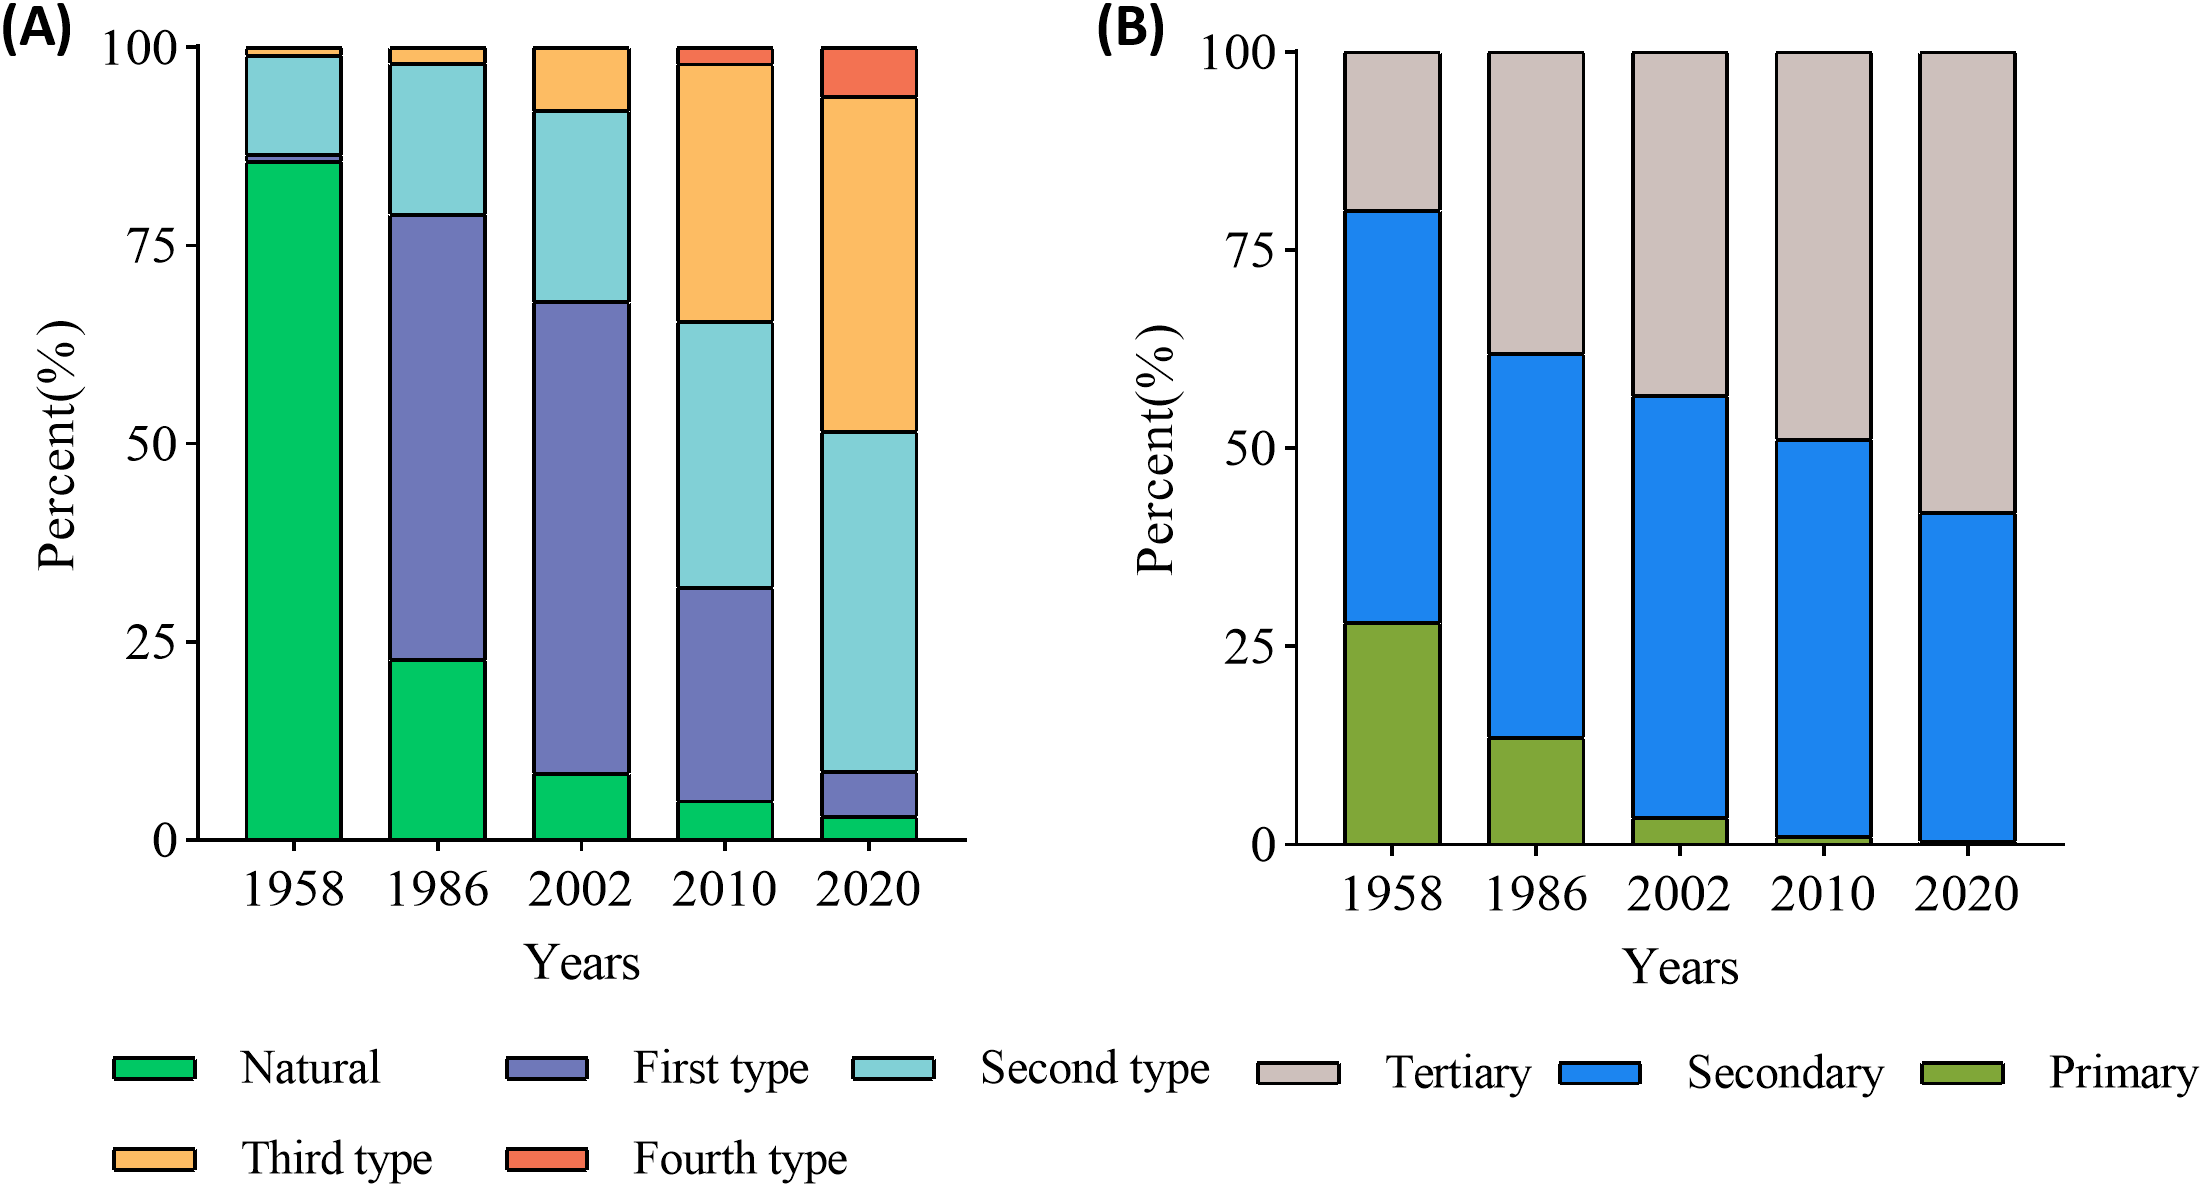
Changes in proportions across different years, 1958, 1986, 2002, 2010, and 2020: (A) different coastline types; (B) different industries.
5 Discussion
5.1 The relationship between human activities and coastline changes
5.1.1 Correlation between industrial structure changes and coastline composition changes
To reveal the intrinsic relationship between coastal development and the evolution of Xiamen’s industrial structure, this study analyzed data from 1958 to 2020 on coastline utilization types and the proportions of the three industries (Figure 5B) using the Spearman rank correlation coefficient (Rs1). The results (Figure 6A) show that different coastline types exhibit distinct correlations with changes in industrial structure. The second- and third-type artificial coastlines exhibit an extremely strong negative correlation with the primary industry, an extremely strong positive correlation with the tertiary industry, and a moderately negative correlation with the secondary industry. Natural coastlines, on the other hand, exhibit an extremely strong positive correlation with the primary industry, an extremely strong negative correlation with the tertiary industry, and a moderately positive correlation with the secondary industry. The correlation between the first-type coastline and changes in the tertiary industry structure failed to pass the significance test (p > 0.1), indicating a weak correlation between its evolution and industrial restructuring. Over the study period, Xiamen’s industrial structure underwent significant transformation, characterized by a continuous decline in the proportion of the primary industry, an initial increase followed by a decrease in the secondary industry, and a steady increase in the tertiary industry. Combining these results with the Rs1 analysis reveals that, as the coastline structure evolved, the proportion of natural coastlines continued to decrease, while the proportions of second- and third-type artificial coastlines increased significantly. Specifically, a periodic correlation was observed between the development of the secondary industry and the evolution of coastline types. From 1958 to 1986 and from 2002 to 2020, the decline in the proportion of the secondary industry coincided with the shrinking trend of the natural coastline, in contrast to the expansion of the second- and third-type coastlines. Conversely, the rise in the proportion of the secondary industry from 1986 to 2002 coincided with the increase in the second- and third-type coastlines, in contrast to the changes in the natural coastline. This periodic difference results in a moderate correlation.
Figure 6
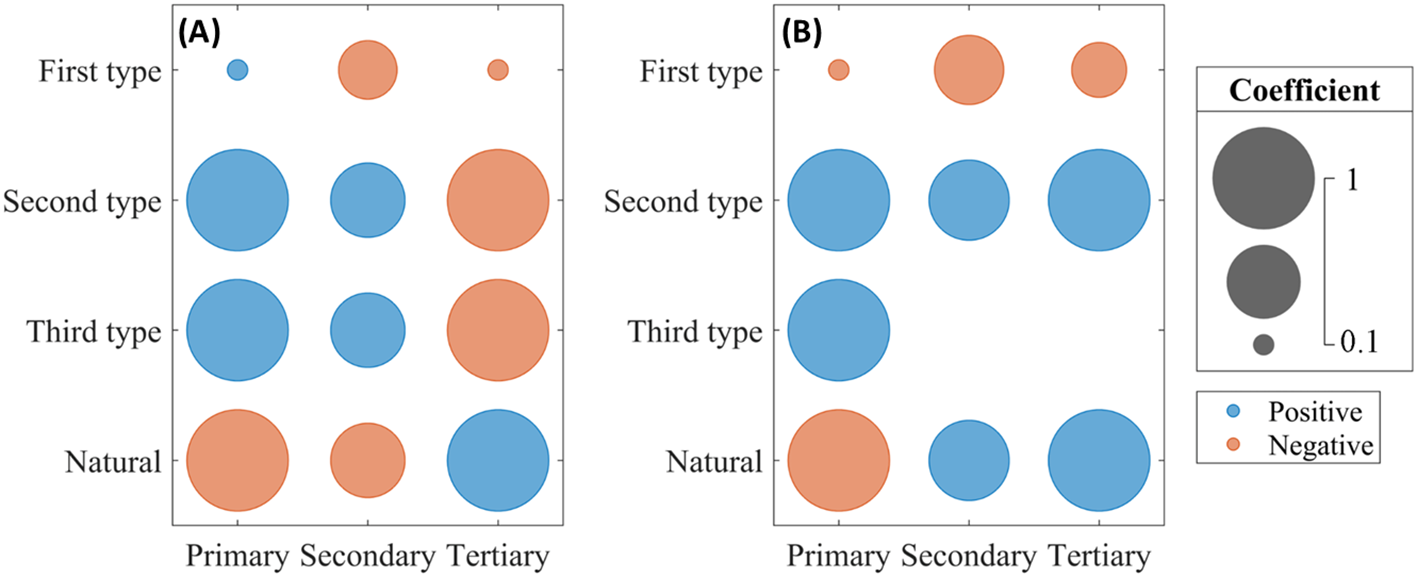
Bubble chart showing correlation coefficients between industrial structure and coastline composition: (A) Rs1; (B) Rs2.
A segmented analysis of the first-type coastline, starting in 1958, revealed the following trends: Between 1958 and 2002, its proportion steadily increased, showing an extremely strong negative correlation with changes in the primary industry, a moderately positive correlation with the secondary industry, and an extremely strong positive correlation with the tertiary industry. Between 2002 and 2020, however, its proportion declined continuously, showing a strong positive correlation with the primary and secondary industries and a strong negative correlation with the tertiary industry. These results indicate that during the coastal zone development in Xiamen, the evolution of different coastline types has shown a complex correlation with industrial restructuring.
5.1.2 Correlation between industrial change rate and coastline change rates of different types
To quantitatively explore the dynamic relationship between coastal zone development and industrial economic growth in Xiamen, this study systematically analyzed the coupling relationship between the rate of coastline change and the rate of change in industrial output value. The Spearman rank correlation coefficient (Rs2) was calculated based on data on the lengths of different coastline types and the output values of the three industries during the same periods (1958, 1986, 2002, 2010, and 2020). The results showed significant differences in the driving effects of different coastline types on the growth of the three industries (Figure 6B). First-type coastlines exhibited a moderate positive correlation with the primary industry and a strong positive correlation with both the secondary and tertiary industries, indicating that their expansion had a significant positive impact on industrial economic growth. Second-type coastlines exhibited a moderate negative correlation with the primary industry and a strong negative correlation with both the secondary and tertiary industries, suggesting that their development had a suppressive effect on industrial economic growth. The correlations between the rates of change in natural and third-type coastlines and the rates of change in the output values of the three industries did not pass the significance test (p > 0.1), indicating that their direct impacts on the industrial economy are not statistically significant. Combining these findings with the trends in the output values of Xiamen’s three industries shown in Figure 7, it can be observed that Xiamen’s industrial economy exhibited sustained growth during the corresponding periods, though the growth rates varied significantly across different periods. The output value of the primary industry increased from 1958 to 2002 and from 2010 to 2020, but declined from 2002 to 2010, with the peak growth occurring between 1986 and 2002. The output value of the secondary industry grew rapidly from 1958 to 2002 but slowed significantly after 2002, reaching its peak growth from 1986 to 2002. Similarly, the growth rate of the tertiary industry increased steadily from 1958 to 2002 but slowed after 2002, with the peak occurring during 1986–2002.
Figure 7
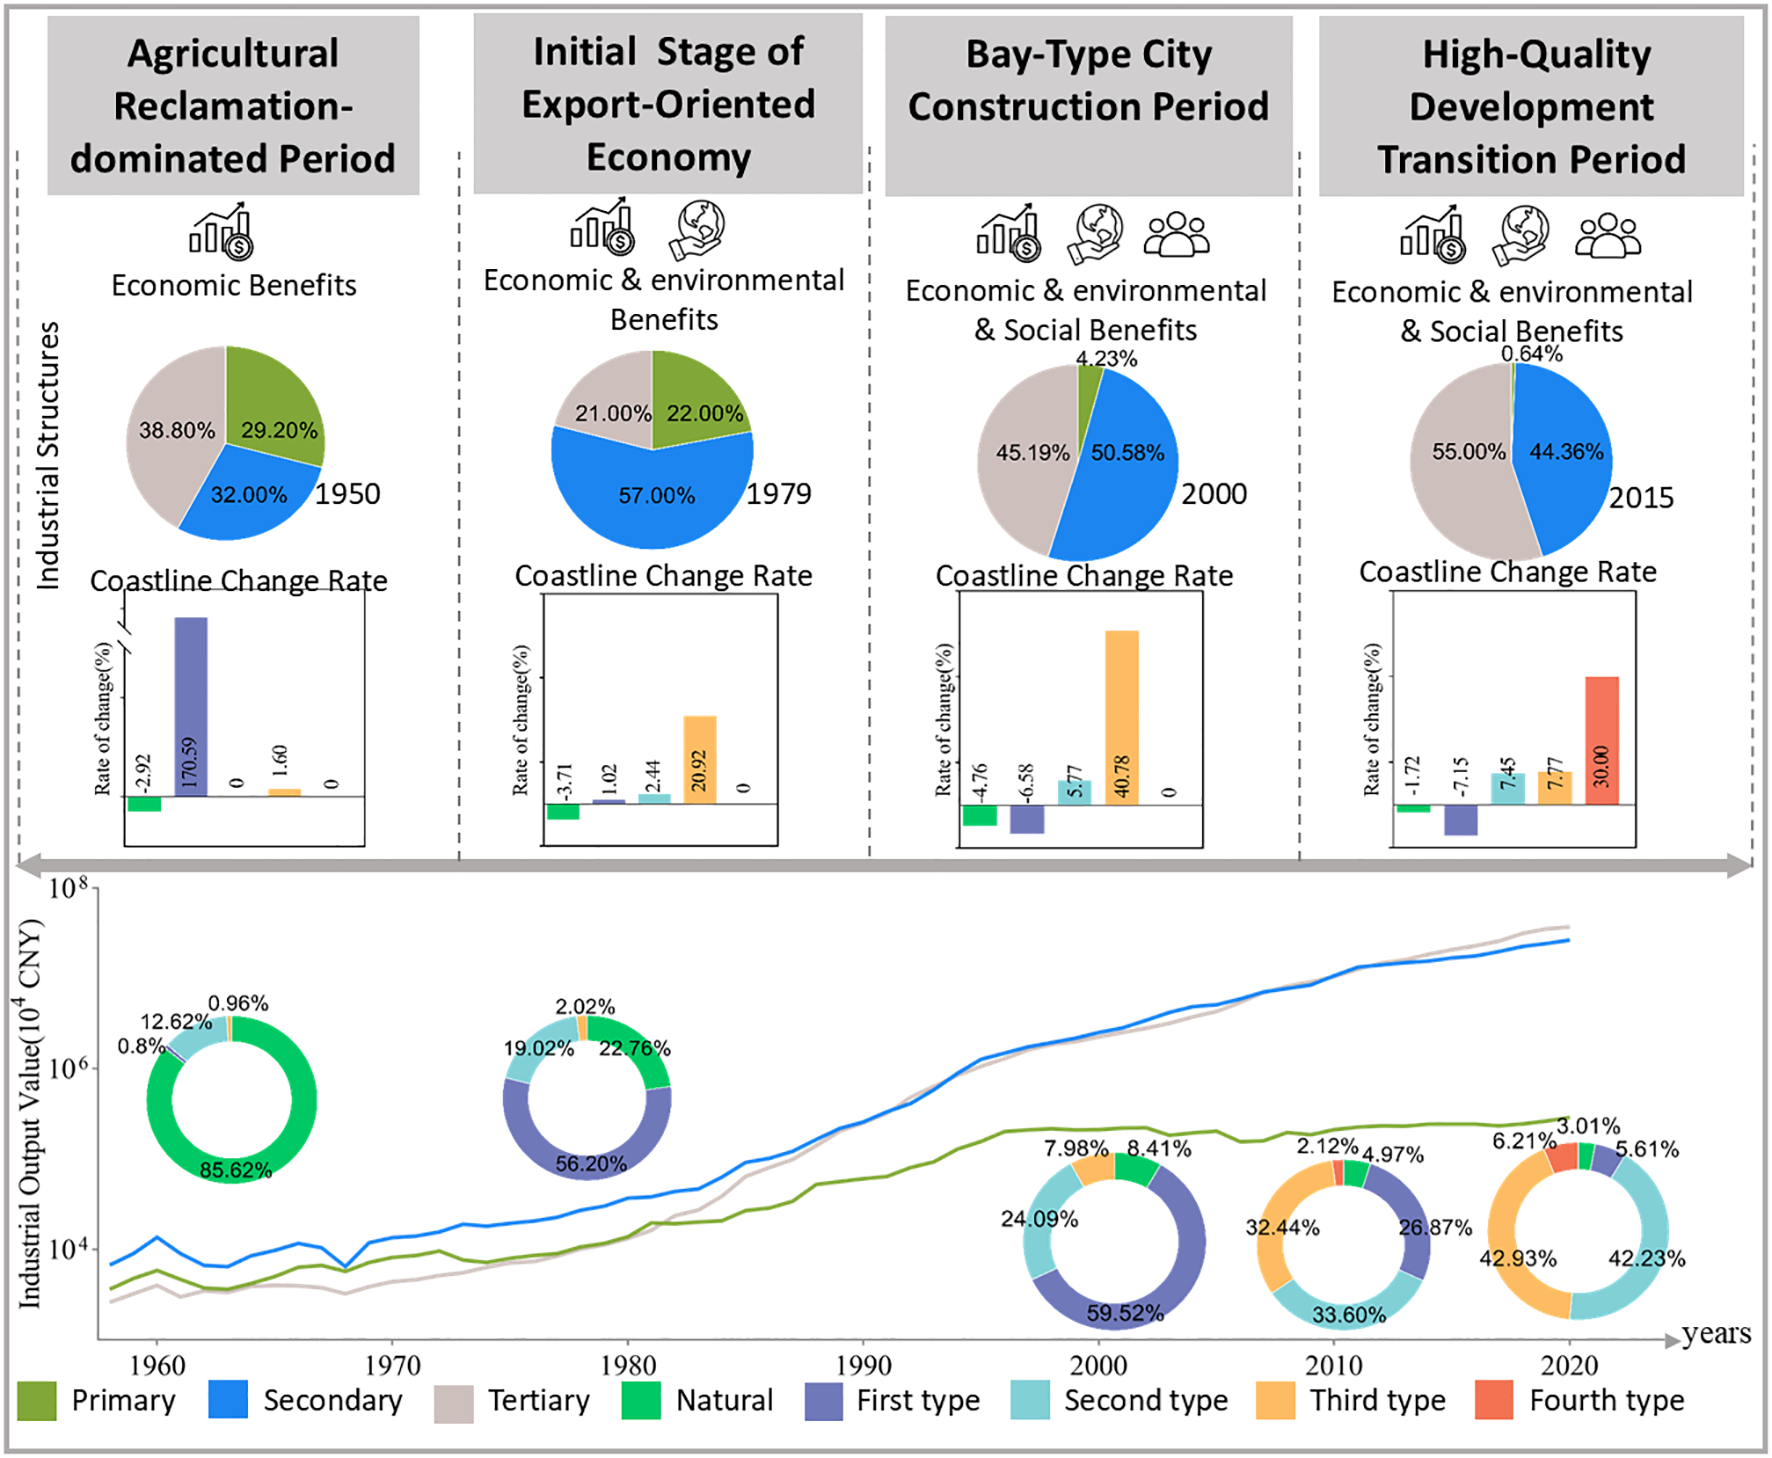
Changes in the coastal zone development stages of Xiamen. The pie chart shows the proportions of different industries; the bar chart shows the coastline change rates across different periods; the circular diagram shows the proportions of different coastline types in different years; the line chart shows changes in the output values of Xiamen’s three industrial sectors. Data for the three-sector structure were sourced from https://tjj.xm.gov.cn/tjnj/publish/2023/2023.htm.
A spatiotemporal analysis of the coupling between coastline change and industrial growth reveals that the rate of growth in the primary industry shifted from positive to negative between 1986 and 2010, closely aligning with the same trend in the first-type coastline change rate during that period. Its growth during 1958–2002 and 2010–2020 correlated positively with the upward trend in the first-type coastline change rate, indicating that the development of the first-type coastline periodically boosted the agricultural economy. The secondary and tertiary industries exhibited slower growth during 1986–2020. Their decreasing rates of change are consistent with the evolutionary trends of the first-type coastline change rate during the same period but show an inverse relationship with the second-type coastline change rate. This suggests that the expansion of the first-type coastline may promote industrialization and the service industry, whereas the development of the second-type coastline may restrain the growth of non-agricultural industries.
Analysis based on the Spearman rank correlation coefficient (Rs1) between the proportions of coastline types and the proportions of the three industrial structures indicates that natural coastlines have undergone a structural transformation in their function under human intervention, gradually being transformed into artificial coastlines. The decline in the proportion of the primary industry and the rise in the tertiary industry is accompanied by increases in the proportions of the second- and third-type coastlines and a decrease in the proportion of natural coastline. This suggests that the expansion of the second- and third-type coastlines significantly promotes the development of the tertiary industry, while inhibiting the development of the primary industry. The interrelationships between the primary and secondary industries and between different coastline types are complex and require further investigation across temporal and spatial scales. The Spearman rank correlation coefficient (Rs2) between the rate of coastline change and the rate of change in the output values of the primary, secondary, and tertiary industries indicates a synergistic relationship between the rate of change in the first-type coastline and that of the tertiary industry during specific periods. From 1958 to 2002, the growth rate of the first-type coastline slowed, while that of the second- and third-type coastlines accelerated. During the same period, the growth rates of all three industries increased significantly, indicating that the accelerated development of the second and third-type coastlines had a direct driving effect on the growth of the secondary and tertiary industries. The divergence between the growth rate of the primary industry and the slowdown in the first-type coastline during this period may be related to the closure of the bay due to seawall construction. Although the reclaimed land was used for agricultural production and aquaculture, activities that boosted the output of the primary industry, the internal coastline changes were not included in the total coastline statistics, resulting in periodic discrepancies in the data representation. The rate of change in the second-type coastline shows a certain degree of inverse correlation with the evolution of the three-tier industrial structure. From 1958 to 2002, during the period of significant increases in the second-type coastline, the output values of all three industries increased simultaneously. However, after 2002, although the second-type coastline continued to expand, the output value of the primary industry first decreased and then increased, while the growth rates of the secondary and tertiary industries slowed significantly. This phenomenon may be attributed to two factors. First, after 2002, the increase in second-type coastline was primarily associated with infrastructure construction, such as transportation roads and ports. Consequently, the proportion of coastline directly serving industrial development decreased, thereby weakening its driving effect on the industrial economy. Second, after the previous period of rapid growth, the output values of the secondary and tertiary industries had already reached high baseline levels. Therefore, the observed slowdown in growth does not indicate an actual reduction in output values but rather reflects an inevitable manifestation of economic development entering a period of structural adjustment. Furthermore, the correlation between the rate of change in the third-type coastline and the rate of change in the output values of the three industries (Rs2) did not pass the significance test, indicating that the relationship lacks statistical support and is currently not of reference value.
5.2 Development stages of the Xiamen coastal zone under economic development
Between 1958 and 2020, Xiamen’s coastline AI increased from 0.14 to 0.97, indicating a substantial intensification of coastal development. Human activity had become the dominant factor driving coastline evolution. Based on a coupled analysis of the dynamic changes in coastline types and the shifts in the structure of the three industries (Figure 7), combined with the development histories of other bay cities (Briggs, 2016; Burt and Bartholomew, 2019; Zhu et al., 2016), the coastal development process of Xiamen can be divided into four stages:
Stage 1: Agricultural reclamation-dominated period (1950s–1970s).
During this stage, the industrial structure was characterized by an initial rise followed by a decline in the primary industry, continuous expansion of the secondary industry, and a decrease in the tertiary industry. Under the “Grain as the key link” policy, large-scale land reclamation projects were implemented in Tong’an Bay and the Western Sea area. The completion of six seawalls, including the Gaoji and Jixing Seawalls, reshaped the spatial configuration of the coastal zone. The closure of bays such as Xinglin Bay, Maluan Bay, and Wuyuan Bay created favorable conditions for land reclamation. The newly added land was mainly used for crop production and salt pan development, leading to the large-scale conversion of the natural coastline into the first-type coastline, with its growth rate peaking during this period. However, due to constraints on natural land conditions and the low added value of agriculture, the output value of the primary industry, although it increased, was significantly lower than that of the secondary and tertiary industries. Coastal development during this period exhibited the characteristics of “centralized extensive development.” (Wu et al., 2022) A small portion of industrial land was designated for the industrial zone south of the Yundang Fishing Port, initiating the development of secondary industry. The tertiary industry, mainly comprising port trade and retail, was less linked to the coastline development during this period. Overall, the economic benefits of coastal development were dominated by primary production, while the ecological impacts received little attention.
Stage 2: Initial stage of export-oriented economy (1980s–1990s).
With the establishment of the Xiamen Special Economic Zone in 1980, the industrial structure shifted, showing declines in the proportions of the primary and secondary industries, while the tertiary industry expanded rapidly. Coastal development transitioned toward an export-oriented economy centered on Xiamen Island. The Dongdu Port wharf project in Huli District, along with the establishment of the Xinglin and Haicang Industrial Development Zones, promoted the transformation of small-scale land reclamation activities into land development for port, shipping, and processing and manufacturing. New agricultural reclamation projects were relatively limited during this period, mainly concentrated in the Tong’an Bay and Dadeng Sea, resulting in a slowdown in the growth of first-type coastline and a rapid increase in the proportion of second-type coastline. The concentrated development of export-oriented industries, such as electronics and machinery, as well as the rise of tourism and commerce, strengthened the relationship between coastline development and the tertiary industry. Xiamen experienced a development trajectory similar to that of other bay cities, such as Tokyo and Hong Kong, at the cost of environmental degradation (Cheung and Tang, 2015; Kawabe, 1998). Reclamation-induced changes in hydrodynamic conditions, combined with land-based pollution emissions, caused ecological degradation in parts of the sea (Figure 8). In response, Xiamen launched initiatives such as the comprehensive management of Yundang Lake and the ecological restoration of the Western Sea. This marks a shift in coastal development from a purely economic orientation to a dual “economic–ecological” approach.
Figure 8
Completed and ongoing marine ecological restoration projects in selected sea areas of Xiamen. (A) Distribution of projects (indicated by red boxes). Some project data were sourced from https://zygh.xm.gov.cn/zfxxgk/zfxxgkml/zhxx/tzgg/202110/t20211014_2591070.htm, and the base map data were derived from Google Earth Pro. (B) Images of Tong’an Bay before (B1) and after (B2) comprehensive marine improvement (https://zrzyt.fujian.gov.cn/ztzl/ztzlfjmp/202402/t20240226_6399195.htm). (C), (D), and (E) Images of Wuyuan Bay, Maluan Bay, and Yundang Lake respectively (Luo et al., 2024), before and after their comprehensive improvement (“before” as (C1), (D1), (E1) and “after” as (C2), (D2), (E2)). (F) Images of beach restoration in the Eastern Sea areas before (F1) and after (F2) (Shu et al., 2019). The red boxes indicate the project locations only and do not represent specific scopes.
Stage 3: Bay-type city construction period (2000-2010).
During this period, the proportion of the secondary industry reached its peak, while the gap between the secondary and tertiary industries narrowed significantly. Guided by the “transforming from an island-type city to a bay-type city” development strategy, the Haicang Port Area and the eastern Tong’an Bay area became focal points of coastal development. Newly reclaimed land was allocated for the construction of deep-water docks, port-side petrochemical complexes, shipbuilding bases, and other industrial parks, as well as new urban areas. This led to a rapid increase in the proportion of the second- and third-type coastlines, while the length of the natural coastline further decreased to 13.60 km by 2010. During this stage, the coastline underwent a structural shift in its function. On the one hand, portions of previously reclaimed agricultural land were converted into residential and public service areas, accompanied by a functional transformation of the first-type coastline into third-type coastline. This structural shift reflects the transition from production-oriented coastal use to service-oriented development, and explains the strong negative correlation observed between the decline of first-type coastline and the expansion of the tertiary industry. On the other hand, projects such as the Wuyuan Bay Comprehensive Renovation, the Eastern Tong’an Bay Ecological Restoration (Figures 8B, C), and the Guanyinshan Beach Restoration promoted the closure of aquaculture ponds, beach restoration, and the construction of coastal wetlands (Shu et al., 2019). In this process, first-type coastlines, represented by aquaculture ponds, continued to decline, while a fourth-type coastline aimed at ecological restoration, emerged for the first time, initiating a process of functional integration and reconstruction along the coastline. The development of public coastal spaces during this stage reflects a shift in coastline development objectives from pursuing solely economic benefits to balancing ecological and social benefits.
Stage 4: High-quality development transition period (2010s–present).
For the first time, the tertiary industry has become the dominant sector in Xiamen’s industrial structure. Coastal zone development during this stage is centered on major projects, such as the Xiang’an Southern New City, the Eastern Sea area, and the Xiamen Xiang’an International Airport. Through continuous reclamation, new industrial spaces have been created, driving the continued transformation of the first-type coastline into second- and third-type coastlines. Port facilities have been significantly upgraded, with 12 new berths of 100,000 tons or more constructed. Port-based advanced manufacturing and modern service industries have emerged as key drivers of growth. Coastal tourism revenue is expected to exceed 200 billion yuan by 2023, demonstrating the strong driving effect of coastal zone redevelopment on the tertiary industry (Yang et al., 2021). In terms of development models, Xiamen is pursuing both artificial and natural restoration. Ecological restoration efforts in Tong’an Bay have restored over 300 hectares of coastal wetlands and 12 hectares of mangrove wetlands in the Dadeng Sea, creating a complex “ecological buffer zone + landscape belt” functional zone. Additionally, 15 km of pristine coastline have been preserved along the eastern coast of Tong’an Bay, pioneering a new model of “balancing development and protection” (Luo et al., 2024). These restoration practice have not only improved coastline morphology but also led to measurable ecological benefits. For example, the ecosystem service value of Xinglin Bay increased from 63.13 million CNY in 2005 to 104.16 million CNY in 2018, indicating a substantial enhancement in ecosystem functions following comprehensive coastal restoration (Zhuang et al., 2021). The coastline changes during this stage are characterized by a pattern of “port upgrading–urban sea expansion–high-end industry development,” representing a sustainable development path of high-quality development and high-quality protection.
5.3 Coupling relationship between coastal zone development and economic development concepts
Coastal development is the spatial foundation for the economic development of bay cities. The coordinated evolution of coastal development and economic development concepts in Xiamen reflects the transformation of development models in such cities. Before the 1990s, under the dominance of the “extensive economic development” philosophy, large-scale agricultural reclamation, salt pan development, and other human activities led to the rapid conversion of natural coastlines into first-type coastlines. Although this development model boosted short-term regional economic growth and urbanization, it also resulted in the degradation of marine ecosystems, reduced tidal volume, and a decline in biodiversity (Boulos, 2016). Intensified ecological and environmental pressures prompted industrial restructuring, positioning coastal zones as crucial platforms for supporting industrial upgrading (Ling and Jin, 2025). Guided by both policy interventions and market regulations, the proportion of first-type coastline gradually decreased, while second- and third-type coastlines began to dominate. Similar developmental transitions occurred in other bay cities, such as Tokyo Bay, where heavy industries were gradually relocated from their coastlines, and coastal areas underwent complex developments, shifting toward high-value-added manufacturing and service industries (Kumaki et al., 2013). Entering the 21st century, the deepening adoption of the green development concept has driven coastal development toward a new model of synergistic “economic, ecological, and social” benefits. The construction of public coastal spaces represents a functional shift from “productive coastlines” to “livable and ecological coastlines.” Xiamen’s robust economy provided the technical and financial support for integrated coastal management, facilitating the refinement and diversification of coastline use. During this period, cities such as Tokyo and Hong Kong also began promoting coastal redevelopment, focusing on waterfront public spaces and ecological restoration. Through large-scale ecological restoration projects (Figure 8), Xiamen has achieved a significant expansion of fourth-type coastlines (ecologically restored coastlines). The length of ecologically restored coastlines increased from 0 km to 23.23 km, accounting for 6.21% of the total coastline in 2020. The Marine Ecological Landscape Belt Project has effectively integrated ecological restoration with tourism development, improving public accessibility and enhancing the integrated ecological and socio-economic benefits of the coastal zone. Taking the Xiatanwei Mangrove Park as an example, the park has received more than 2.4 million visitors since its opening and hosted 422 environmental education activities. In addition, the total number of fish, shellfish, and crustacean species in the Xiatanwei mangrove restoration area increased by 2.4 times, while their biomass increased by 2.99, 4.76, and 1.19 times, respectively. This shift marks a transformation in marine ecological governance from passive responses to pollution to active ecological restoration. These evolutionary processes observed in Xiamen Bay not only reflect a localized governance transformation, but also provide an important reference for understanding the development trajectories of other bay cities under different socio-economic and institutional contexts.
Beyond the local context of Xiamen Bay, the evolutionary patterns identified in this study can also be understood within a broader international perspective. Although the place-based and differentiated development strategies discussed above are rooted in Xiamen’s unique bay morphology and governance context, similar trajectories have been observed in other major bay cities worldwide. For example, Tokyo Bay and the Guangdong–Hong Kong–Macao Greater Bay Area experienced rapid industrialization and large-scale reclamation during periods of accelerated economic growth, followed by a growing emphasis on environmental regulation, industrial upgrading, and ecological restoration. In contrast, San Francisco Bay adopted stricter reclamation controls at an earlier stage and prioritized wetland conservation and ecological rehabilitation. Despite these differences in timing and policy orientation, a common pathway of “development–intensification–regulation–restoration” can be identified, suggesting that the coupling framework proposed in this study may be transferable to bay cities at different stages of development. This cross-regional comparison further reinforces the general relevance of the dynamic interactions between economic development concepts and coastal utilization modes identified in Xiamen Bay.
Taken together, the development practices across the four stages demonstrate a coupling mechanism between shifts in economic development concepts and the evolution of coastal development and utilization. Innovative development concepts have driven the upgrading of coastline functions and the optimization of industrial structures, while ecological feedback from coastal development has, in turn, necessitated adjustments to the economic development model. This dynamic coupling relationship provides important insights for the sustainable development of bay cities. Through the synergy of institutional innovation, technological progress, and spatial planning, a new model for coastal development that promotes harmonious coexistence between humans and nature can be realized. This represents a vivid example of the “Xiamen Practice” in coastal development. With the continuous improvement of ocean observation systems and the development of digital twin oceans, the sustainable development of bay cities in the future can be driven by scientific innovation, providing more refined and dynamic support for coastal management. This will help balance development and protection, facilitate the scientific optimization of development plans, and ultimately improve the quality and efficiency of coastal redevelopment, transforming the current ocean from “the ocean we have” to “the ocean we want.”
6 Conclusion
This study reveals a clear stage-specific coupling relationship between coastline utilization evolution and industrial structure transformation in Xiamen from 1958 to 2020. The coastline experienced an initial decline followed by expansion, accompanied by a continuous increase in artificialization intensity under the dominance to human activities. The Spearman rank correlation analysis demonstrates that the expansion of second- and third-type coastlines is closely associated with the growth of the secondary and tertiary industries, while the primary industry shows a contrasting trend. Xiamen’s coastal development has undergone four typical stages, reflecting a transition from agricultural reclamation to export-oriented industrialization, bay city construction, and high-quality development. These findings indicate that the evolution of coastal development in Xiamen exhibits a two-way feedback mechanism, whereby changes in development concepts and industrial structure not only drive but also shaped by transformations in coastline utilization.
Given the distinct functional orientations and development trajectories of different coastline types, a uniform management approach is neither appropriate nor effective. For first-type coastlines dominated by aquaculture and agricultural uses, management strategies should be differentiated according to bay characteristics, with stricter regulation and functional optimization prioritized in inner-bay areas, and closer coordination with industrial restructuring and environmental management. For second-type coastlines dominated by ports and industrial uses, priority should be given to improving land-use efficiency and promoting the upgrading of traditional manufacturing toward high-end manufacturing, marine high-tech industries, and port-related modern services. For third-type coastlines oriented toward urban living and tourism, and fostering high-quality coastal tourism and cultural industries. For fourth-type coastlines characterized by ecological restoration, continuous ecological monitoring, habitat restoration, and the integration of ecological conservation with environmental education and eco-tourism should be strengthened. For natural coastlines with remaining natural attributes, strict protection and ecological redline control are necessary to prevent further degradation.
Considering Xiamen’s specific bay characteristics, including its narrow land area, deeply indented coastline, and high intensity of human activities, future coastal development should strictly control further reclamation in inner bats while prioritizing functional upgrading and ecological restoration in existing developed areas. From an industrial perspective, policies should encourage the coordinated development of the marine economy, high-tech industries, and modern services, while gradually reducing reliance on land-intensive and pollution-prone coastal industries. These place-based and differentiated strategies provide valuable insights for other bay cities seeking coordinated and sustainable coastal development in support of the SDGs.
Statements
Data availability statement
The original contributions presented in the study are included in the article/supplementary material, further inquiries can be directed to the corresponding author/s.
Author contributions
WL: Conceptualization, Data curation, Formal analysis, Methodology, Writing – original draft, Writing – review & editing. FS: Resources, Supervision, Writing – review & editing. FL: Methodology, Supervision, Writing – review & editing. YPL: Validation, Writing – review & editing. YTL: Investigation, Software, Visualization, Writing – review & editing. ZC: Methodology, Supervision, Writing – review & editing. YHL: Conceptualization, Funding acquisition, Project administration, Writing – review & editing.
Funding
The author(s) declared that financial support was received for this work and/or its publication. This research was jointly funded by the Natural Science Foundation of Xiamen, China (3502Z202573090), the Natural Science Foundation of Fujian Province, China (2025J01240) and the National Natural Science Foundation of China (42176220).
Acknowledgments
The authors thank the reviewers who gave you their time, expertise, and feedback to improve the article more precise, clear, accurate, and relevant.
Conflict of interest
The author(s) declared that this work was conducted in the absence of any commercial or financial relationships that could be construed as a potential conflict of interest.
Generative AI statement
The author(s) declared that generative AI was not used in the creation of this manuscript.
Any alternative text (alt text) provided alongside figures in this article has been generated by Frontiers with the support of artificial intelligence and reasonable efforts have been made to ensure accuracy, including review by the authors wherever possible. If you identify any issues, please contact us.
Publisher’s note
All claims expressed in this article are solely those of the authors and do not necessarily represent those of their affiliated organizations, or those of the publisher, the editors and the reviewers. Any product that may be evaluated in this article, or claim that may be made by its manufacturer, is not guaranteed or endorsed by the publisher.
References
1
Balsas C. J. (2024). Coastal waterfront transformations, fishing structures, and sustainable tourism. Sustainability16, 6313. doi: 10.3390/su16156313
2
Bocianowski J. Wrońska-Pilarek D. Krysztofiak-Kaniewska A. Matusiak K. Wiatrowska B. (2024). Comparison of Pearson’s and Spearman’s correlation coefficients for selected traits of Pinus sylvestris L. Biometrical Lett.61, 115–135. doi: 10.2478/bile-2024-0008
3
Boulos J. (2016). Sustainable development of coastal cities-proposal of a modelling framework to achieve sustainable city-port connectivity. Procedia-Social Behav. Sci.216, 974–985. doi: 10.1016/j.sbspro.2015.12.094
4
Briggs J. C. (2016). San francisco bay: restoration progress. Regional Stud. Mar. Sci.3, 101–106. doi: 10.1016/j.rsma.2015.06.002
5
Burt J. A. Bartholomew A. (2019). Towards more sustainable coastal development in the Arabian Gulf: Opportunities for ecological engineering in an urbanized seascape. Mar. pollut. Bull.142, 93–102. doi: 10.1016/j.marpolbul.2019.03.024
6
Chen W. Wang D. Huang Y. Chen L. Zhang L. Wei X. et al . (2017). Monitoring and analysis of coastal reclamation from 1995–2015 in Tianjin Binhai New Area, China. Sci. Rep.7, 3850. doi: 10.1038/s41598-017-04155-0
7
Cheung D.M.-w. Tang B.-s. (2015). Social order, leisure, or tourist attraction? The changing planning missions for waterfront space in Hong Kong. Habitat Int.47, 231–240. doi: 10.1016/j.habitatint.2015.01.006
8
Ding S. Cui S. Xu L. Tang J. Yang M. (2021). Spatial-temporal evolution and interaction of shoreline and sea reclamation around Maluan Bay of Xiamen from 1957 to 2019. J. Appl. Oceanogr.40, 260–270. doi: 10.3969/J.ISSN,2095-4972.2021.02.009
9
Girgenti C. (2020). Collaborative Watershed Governance: A Case Study of The New York-New Jersey Harbor and Estuary Program. New York City: Duke University.
10
Huang Q. Li Y. Ai S. Chen Y. Liu Y. (2024). Impact of regional economic development on the spatiotemporal changes of coastlines: a case study of Ningbo-Taizhou-Wenzhou region. Front. Earth Sci.12, 1428097. doi: 10.3389/feart.2024.1428097
11
Intergovernmental Oceanographic, C (2020). Global ocean science report 2020: Charting capacity for ocean sustainability, executive summary. IOC Policy Ser.1. Available online at: https://unesdoc.unesco.org/ark:/48223/pf0000375148_chi (Accessed October 15, 2025).
12
Intergovernmental Panel on Climate, C (2021). Sixth assessment report (AR6): Climate change 2021: The physical science basis. Available online at: https://www.ipcc.ch/report/ar6/wg1/ (Accessed January 30, 2026).
13
Kawabe M. (1998). To enhance the environmental values of Tokyo Bay–a proposition for integrated coastal zone management. Ocean Coast. Manage.41, 19–39. doi: 10.1016/S0964-5691(98)00075-1
14
Kenessey Z. (1987). ). THE PRIMARY, SECONDARY, TERTIARY AND QUATERNARY SECTORS OF THE ECONOMY. Rev. Income Wealth33, 359–385. doi: 10.1111/j.1475-4991.1987.tb00680.x
15
Kong H. Zhang Y. Zhang Y. Xu Y. Zhou G. Wang S. (2024). Exploring integrated ocean management policy in China: evolution, challenges, and prospects. Water16, 1673. doi: 10.3390/w16121673
16
Kumaki Y. Koarai M. Nakano T. (2013). Land transformation in Tokyo and its surrounding regions. J. Geogr. (Chigaku Zasshi)122, 992–1009. doi: 10.5026/jgeography.122.992
17
Liang L. Liu Q. Liu G. Li X. Huang C. (2018). Review of coastline extraction methods based on remote sensing images. J. Geo-information Sci.20, 1745–1755. doi: 10.12082/dqxxkx.2018.180152
18
Lin Y. Pan W. Xiao Z. Liu D. Dong J. Ji H. (2020). Analysis of tidal current characteristics of Xiamen Bay after the opening of Gaoji Seawall. Trans. Oceanol. Limnol.6, 9–17. doi: 10.13984/j.cnki.cn37-1141.2020.06.002
19
Ling J. Jin Y. (2025). Balancing industrialization with pollution: evidence from the marine ecological civilization demonstration zone program in China. Sustainability17, 6352. doi: 10.3390/su17146352
20
Liu X. Zhang L. Jiang Y. Chen W. Wan Z. Hu j. (2009). “ Chapter 3: Retrospective Assessment of Bay Reclamation Activities,” in Fujian Province bay numerical model and environmental studies: Xiamen Bay (Beijing: Ocean Press), 52–53.
21
Lubell M. Stacey M. Hummel M. A. (2021). Collective action problems and governance barriers to sea-level rise adaptation in San Francisco Bay. Climatic Change167, 46. doi: 10.1007/s10584-021-03162-5
22
Luo M. Zhang Y. Hu J. Gao Y. (2024). Xiamen practice - A case study of integrating Nature-based Solutions in coastal city development (Beijing: G. IUCN, Switzerland in collaboration with the Ministry of Natural Resources, Beijing, the People’s Republic of China). Available online at: https://iucn.org/resources/jointly-published/xiamen-practice-case-study-integrating-nature-based-solutions-coastal (Accessed January 30, 2026).
23
Marty-Gastaldi J. Lazaric N. Dérijard B. (2025). Urban Marine Protected Areas (MPAs): A systematic review of governance, management and human impact. Ocean Coast. Manage.269, 107811. doi: 10.1016/j.ocecoaman.2025.107811
24
Miao J. Zhai N. Zhao B. (2025). Reducing harm to the ocean: From environmental governance to the development of marine ecological civilization. Ocean Coast. Manage.267, 107754. doi: 10.1016/j.ocecoaman.2025.107754
25
Mukaka M. M. (2012). A guide to appropriate use of correlation coefficient in medical research. Malawi Med. J.24, 69–71.
26
Sampaio N. A. S. Mazza F. C. de Siqueira S. S. S. Junior J. E. M. de Souza Moutinho J. V. de Oliveira Pacífico L. (2024). Applications of correlation analysis in environmental problems. Rev. Gestão Soc. e Ambiental18, 1–16. doi: 10.24857/rgsa.v18n3-085
27
Shu F. Cai F. Qi H. Liu J. Lei G. Zheng J. (2019). Morphodynamics of an artificial cobble beach in Tianquan Bay, Xiamen, China. J. Ocean Univ. China18, 868–882. doi: 10.1007/s11802-019-3860-3
28
Siddik M. A. Islam A. R. M. T. (2024). Review of coastal land transformation: Factors, impacts, adaptation strategies, and future scopes. Geogr. Sustainability5, 167–178. doi: 10.1016/j.geosus.2024.01.010
29
Stellian R. Ojeda-Joya J. N. Danna-Buitrago J. P. (2024). Time stationarity, shape and ordinal ranking bias of RCA indexes: a new set of measures. Rev. World Econ160, 675–711. doi: 10.1007/s10290-023-00512-6
30
Su Q. Li Z. (2021). Coastline datasets cover the Guangdong-Hong Kong-Macao,Tokyo and San Francisco bays(1980–2020). J. Global Change Data Discov.5, 148–155. doi: 10.3974/geodp.2021.02.06
31
Sun J. Miao J. Mu H. Xu J. Zhai N. (2022). Sustainable development in marine economy: Assessing carrying capacity of Shandong province in China. Ocean Coast. Manage.216, 105981. doi: 10.1016/j.ocecoaman.2021.105981
32
Tang J. Li T. Li G. Xue Q. Zhu B. (2020). Coastline change in Xiamen and surrounding areas for the past 40 years. Mar. Geol. Front.36, 14–21. doi: 10.16028/j.1009-2722.2019.114
33
Tu S. Li C. Shepherd B. E. (2025). Between-and within-cluster spearman rank correlations. Stat Med.44, e10326. doi: 10.1002/sim.10326
34
Wang H. Yuan G. Liu L. Lin N. (2021). Effective methodologies for coastline classification and delimitation. Mar. Environ. Sci.40, 430–434. doi: 10.13634/j.cnki.mes.2021.03.014
35
Wu H. Sun Z. Wang X. Li Y. Shi Z. (2022). Land-reclamation process and its effects on ecological environment of coastal waters in Fujian province. Werland Sci.20, 366–374. doi: 10.13248/j.cnki.wetlandsci.2022.03.010
36
Xiamen Municipal Bureau of, S (2023). Chapter 5 yearbook of xiamen special economic zone 2023. In: . Available online at: https://tjj.xm.gov.cn/tjnj/publish/2023/2023.htm.
37
Xiao X. Li Y. Shu F. Wang L. He J. Zou X. et al . (2022). Coupling relationship of human activity and geographical environment in stage-specific development of urban coastal zone: A case study of Quanzhou Bay, China, (1954–2020). Front. Mar. Sci.8, 781910. doi: 10.3389/fmars.2021.781910
38
Xing W. Wang Y. Xue Y. Liu X. Liu D. Zhang Z. et al . (2025). Spatial utilization patterns of coastal uses based on waterfront dependence. Cities161, 105932. doi: 10.1016/j.cities.2025.105932
39
Xiu C. Xiao R. Chen S. (2020). Ecosystem characteristics, theory and technology modes of ecological restoration in the main bay areas at domestic and abroad. Acta Ecologica Sin.40, 8377–8391. doi: 10.5846/stxb202005251328
40
Xu Y. Zeng R. Zhang Y. Ai Y. Lu W. (2025). Challenges of ecological protection and restoration in coastal zone of bay cities in China. J. Appl. Oceanogr.44, 122–130. doi: 10.3969/J.ISSN.2095-4972.20240218001
41
Yang J. Luo F. Wang A. Yu D. (2020). Comprehensive evaluation for silted bay restoration: a case study in Xiamen Bay. J. Appl. Oceanogr.39 (3), 389–399. doi: 10.3969/J.ISSN.2095-4972.2020.03.010
42
Yang W. Cai F. Liu J. Zhu J. Qi H. Liu Z. (2021). Beach economy of a coastal tourist city in China: A case study of Xiamen. Ocean Coast. Manage.211, 105798. doi: 10.1016/j.ocecoaman.2021.105798
43
Yu H. Zhang F. Yu H. Li Y. (2025). From shoreline to sea: evaluating development suitability through coastal zoning and a case study from shenzhen, China. Sustainability17, 1204. doi: 10.3390/su17031204
44
Zhang Y. Hou X. (2020). Characteristics of Coastline Changes on Southeast Asia Islands from 2000 to 2015. Remote Sensing.12 (3), 519. Available online at: https://www.mdpi.com/2072-4292/12/3/519.
45
Zhang T. (2023). Using satellite imagery to determine spatiotemporal patterns of built-up land use in relation to the coastline: an example from Xiamen, China. J. Coast. Res.39, 103–113. doi: 10.2112/jcoastres-d-22-00023.1
46
Zheng C. Xiao-jian S. Xiao X. (2018). Influence of Maluan Bay opening on the western and the eastern waters of Xiamen after Gaoji Crossway opening. J. Appl. Oceanogr.37, 496–505. doi: 10.3969/J.ISSN.2095-4972.2018.04.005
47
Zhu G. Xie Z. Xu X. Ma Z. Wu Y. (2016). The landscape change and theory of orderly reclamation sea based on coastal management in rapid industrialization area in Bohai Bay, China. Ocean Coast. Manage.133, 128–137. doi: 10.1016/j.ocecoaman.2016.09.016
48
Zhuang Q. Yu X. Lin Z. Wen R. Zhang J. Long Z. (2021). Assessment of ecological restoration effect and conservation measures of Xinglin bay in Xiamen. Ocean Dev. Manage.38, 91–98. doi: 10.20016/j.cnki.hykfygl.2021.04.014
Summary
Keywords
coastline utilization, coupling relationship, stage-specific development, urban bay, Xiamen
Citation
Lin W, Shu F, Luo F, Lin Y, Lin Y, Chen Z and Li Y (2026) Coupling relationship of industrial structure and coastal utilization in stage-specific development of urban bay: a case study of Xiamen, China (1958–2020). Front. Mar. Sci. 13:1767737. doi: 10.3389/fmars.2026.1767737
Received
15 December 2025
Revised
18 January 2026
Accepted
22 January 2026
Published
06 February 2026
Volume
13 - 2026
Edited by
Xuemei Li, Ocean University of China, China
Reviewed by
Xianzhe Cai, Zhejiang Ocean University, China
Xingchuan Gao, Ningbo University, China
Updates
Copyright
© 2026 Lin, Shu, Luo, Lin, Lin, Chen and Li.
This is an open-access article distributed under the terms of the Creative Commons Attribution License (CC BY). The use, distribution or reproduction in other forums is permitted, provided the original author(s) and the copyright owner(s) are credited and that the original publication in this journal is cited, in accordance with accepted academic practice. No use, distribution or reproduction is permitted which does not comply with these terms.
*Correspondence: Fangfang Shu, shufangfang@tio.org.cn
Disclaimer
All claims expressed in this article are solely those of the authors and do not necessarily represent those of their affiliated organizations, or those of the publisher, the editors and the reviewers. Any product that may be evaluated in this article or claim that may be made by its manufacturer is not guaranteed or endorsed by the publisher.