Abstract
Wave energy is a clean and renewable marine resource with great development potential. The China Sea, including the Bohai Sea, Yellow Sea, East China Sea and South China Sea, has complex marine conditions. This study aims to clarify the wave characteristics and spatiotemporal distribution of wave energy resources in the China Sea, providing a scientific basis for its rational development and utilization. Using 30-year ERA5 wind field data (1995–2024) as input, the SWAN wave model was adopted to numerically simulate the wave field in the China Sea. The multi-year, seasonal, and monthly average wave and wave ennergy characteristics were analyzed, and wave energy resources was evaluated with wave energy rose diagrams at characteristic points. The Bohai Sea and Yellow Sea had low annual mean wave heights mostly below 1.2 m, the East China Sea 1.2–1.7 m, and high-latitude South China Sea up to 2 m. Most regions except the Bohai Sea and northern Yellow Sea had annual average energy flux densities exceeding 4 kW/m² , especially near Taiwan Island and South China Sea. Wave energy was richest in winter, followed by autumn, and poorest in spring; The characteristic points the dominant direction was east-northeast, with density mainly distributed in 1–10 s wave periods and 0–5 m significant wave heights. The China Sea has substantial wave energy potential. The spatiotemporal and directional characteristics identified provide important references for the design, planning and utilization of wave energy conversion projects in the region.
1 Introduction
In recent years, energy demand and shortages have continued to grow, while environmental pollution caused by insufficient energy reserves and the excessive use of traditional fossil fuels has become increasingly severe. Therefore, there is an urgent need to develop renewable energy technologies to address the drawbacks and associated issues arising from the use of traditional fossil fuels (Mahmoodi et al., 2019). Furthermore, under the global context of “dual carbon” goals and energy structure transformation, wave energy power generation has garnered significant attention in numerous countries, with extensive research and development efforts focused on various wave energy conversion technologies and devices, gradually transitioning from demonstration projects to commercialization driven by technological breakthroughs, policy support, and the expansion of diverse application scenarios (López et al., 2014; Medina-López et al., 2017; López-Ruiz et al., 2018; Medina-López et al., 2019).
As one of the primary renewable energy sources, wave energy has distinct advantages that make it a promising alternative to traditional energy. Compared to other renewables, it has a smaller negative environmental impact and offers the potential to meet substantial energy demands (Clément et al., 2002). Specifically, waves represent an energy resource with multiple prominent advantages, including the highest energy flux, limited negative environmental impacts, and a relatively high utilization factor (Leijon et al., 2003; Henfridsson et al., 2007). From a quantitative perspective, global wave energy potential is estimated to range from 1 to 10 terawatts, which is comparable to current global energy demand levels (Panicker, 1977), further confirming its enormous development potential.
For China, energy shortages significantly constrain economic and social development in coastal regions. Enhancing energy supply capacity, ensuring energy transportation security, preserving ecological environments, and promoting sustainable socioeconomic development represent critical strategic tasks at the current stage (Ou et al., 2002). Wave energy, as a clean and abundant energy source, can not only meet the growing energy demands of coastal areas and improve the energy mix but also reduce environmental pollution (Mahmoodi et al., 2019). Therefore, research on the development and utilization of wave energy is particularly crucial for China and represents one of the key choices in its energy strategy (Wan et al., 2015).
Conducting a reasonable assessment of wave energy reserves is an essential foundational task prior to wave energy development and utilization, and refined analysis of the long-term evolution trends of wave energy in the China Sea—characterized by complex geographical and diverse climatic conditions—is particularly critical. With the continuous iteration of wave prediction technologies, recent studies have focused on long-term high-precision wave characteristic capture methods, Huang et al. proposed PatchTST and Improved-STID models to enhance the verification of simulation results’ temporal continuity and spatial distribution rationality (Huang et al., 2024a; Huang et al., 2024b). Currently, wave energy assessments predominantly rely on reanalysis and numerical simulation data: Jiang et al. (2021), Ye et al. (2022), Zheng et al. (2013), and Sun et al. (2022) analyzed wave energy resources, distribution, and long-term trends in China’s coastal waters or the China Sea using ERA-Interim, ERA5 reanalysis data, or SWAN, WAVEWATCH III models, while Reguero et al. (2015) conducted a global wave energy assessment and analyzed its seasonal and monthly variations.
Reanalysis data often have low resolution, and numerical simulation data usually have a short time span. On the basis of previous studies, this paper further conducts in-depth research, using the ERA5 (ECMWF Reanalysis V5 ERA5) wind field to drive the SWAN (Simulating Waves Nearshore) model to simulate the wave field of China’s seas from 1995 to 2024 with high resolution and long time span. Based on the computational results, we have analyzed the spatiotemporal distribution patterns of the wave field and the distribution characteristics of wave energy resources across three temporal scales: annual, seasonal, and monthly. We have identified areas with relative advantages in wave energy resources in the China Sea, and completed targeted resource assessments by focusing on specific characteristic sites. This study has clarified the long-term evolution characteristics of wave energy resources in the China Sea and defined their advantageous development areas, thus providing a scientific reference for the rational development and utilization of wave energy resources.
2 Data sources and evaluation methods
2.1 Data sources
The SWAN model, as a numerical wave model for coastal and shallow seas, is often used in numerical wave calculations. Originating from the Netherlands in the 1970s and 1980s, the model has been continuously updated, iterated, and developed, and has now been upgraded to the third generation. Its main mechanisms for wave propagation include diffraction, refraction, reflection, etc., and in the process of wave generation and dissipation, it considers various energy loss methods such as white-water dissipation, bottom friction, and wave breaking. Therefore, as a mature and reliable numerical model, it has been widely used in estuarine and wave calculations.
The basic principle of the SWAN model is energy conservation, which has different expressions in different coordinate systems. This paper adopts the equilibrium equation in the Cartesian coordinate system. Equation 1 is its equation in the Cartesian coordinate system (Zijlema and van der Westhuysen, 2005; Rusu and Soares, 2011):
Where x, y represent Cartesian coordinates, t represents time, N represents the wave action density derived from Equation 2, Stot represents the energy source function term, including generation, dissipation, and interactions between nonlinear waves, Cx, Cy, Cσ and Cθ represent the propagation velocities of wave action in the x, y, σ, and θ spaces, σ and θ represent the relative wave frequency and wave direction, respectively.
The model settings are shown in Table 1. The simulation time span of the wave model is 30 years (1995-2024), with a range of 105-130°E and 5-41°N. Water depth data were obtained from GEBCO (General Bathymetric Chart of the Oceans and collected nautical charts). The driving wind field employed wind speeds u and v at 10-meter height from the ERA5 (Hersbach et al., 2020), whose reliability has been extensively validated by the international scientific community. The wind field covers the range 105°–130°E, 5°–41°N, with a spatial resolution of 0.25° (approximately 30 km grid) and a temporal resolution of 1 hour over a 30-year period (1995–2024).
Table 1
| Category | Parameter | Setting |
|---|---|---|
| SWAN Computational Domain | Simulation extent | 105°-130°E, 5°-41°N |
| Spatial resolution | 0.1° x 0.1° | |
| Computational time step | 15 min | |
| Output time step | 1 h | |
| Bathymetry (GEBCO) | Bathymetric range | 105°-130°E, 5°-41°N |
| Bathymetric resolution | 0.1° x 0.1° | |
| Wind Forcing | Spatial coverage | 105°-130°E, 5°-41°N |
| Spatial resolution | 0.25° x 0.25° | |
| Temporal resolution | hourly (1 h) | |
| Physical Process Configuration | Wind input (linear) | Cavaleri and Malanotte-Rizzoli |
| Wind input (exponential) | Komen | |
| Whitecapping dissipation | Komen | |
| Coefficient of friction | JONSWAP | |
| Depth-induced wave breaking | γ=0.73 | |
| Nonlinear wave-wave interaction | Quadruplets |
SWAN model setting parameters.
2.2 Data verification
Based on the observed data from the three stations (S1, S2, S3) in Section 1.1, the numerical simulation results were validated through comparison. Figure 1 (right) marks the specific locations of the three observation stations, with their latitude and longitude coordinates listed in Table 2. Figures 2–4 present hourly comparisons of significant wave height and mean wave period between Stations S1 and S3, along with hourly comparisons of significant wave height at Station S2. The reason S2 station did not provide average wave period comparison charts is due to instrument failure during the observation period: the wave period sensor on this buoy experienced intermittent malfunctions, resulting in incomplete valid data that failed to meet quality control standards. These comparisons reveal that the simulation results are relatively reliable, with clear trends observed. The corresponding wave parameter data can serve as a crucial foundation for wave characteristic analysis and wave energy resource assessments.
Figure 1
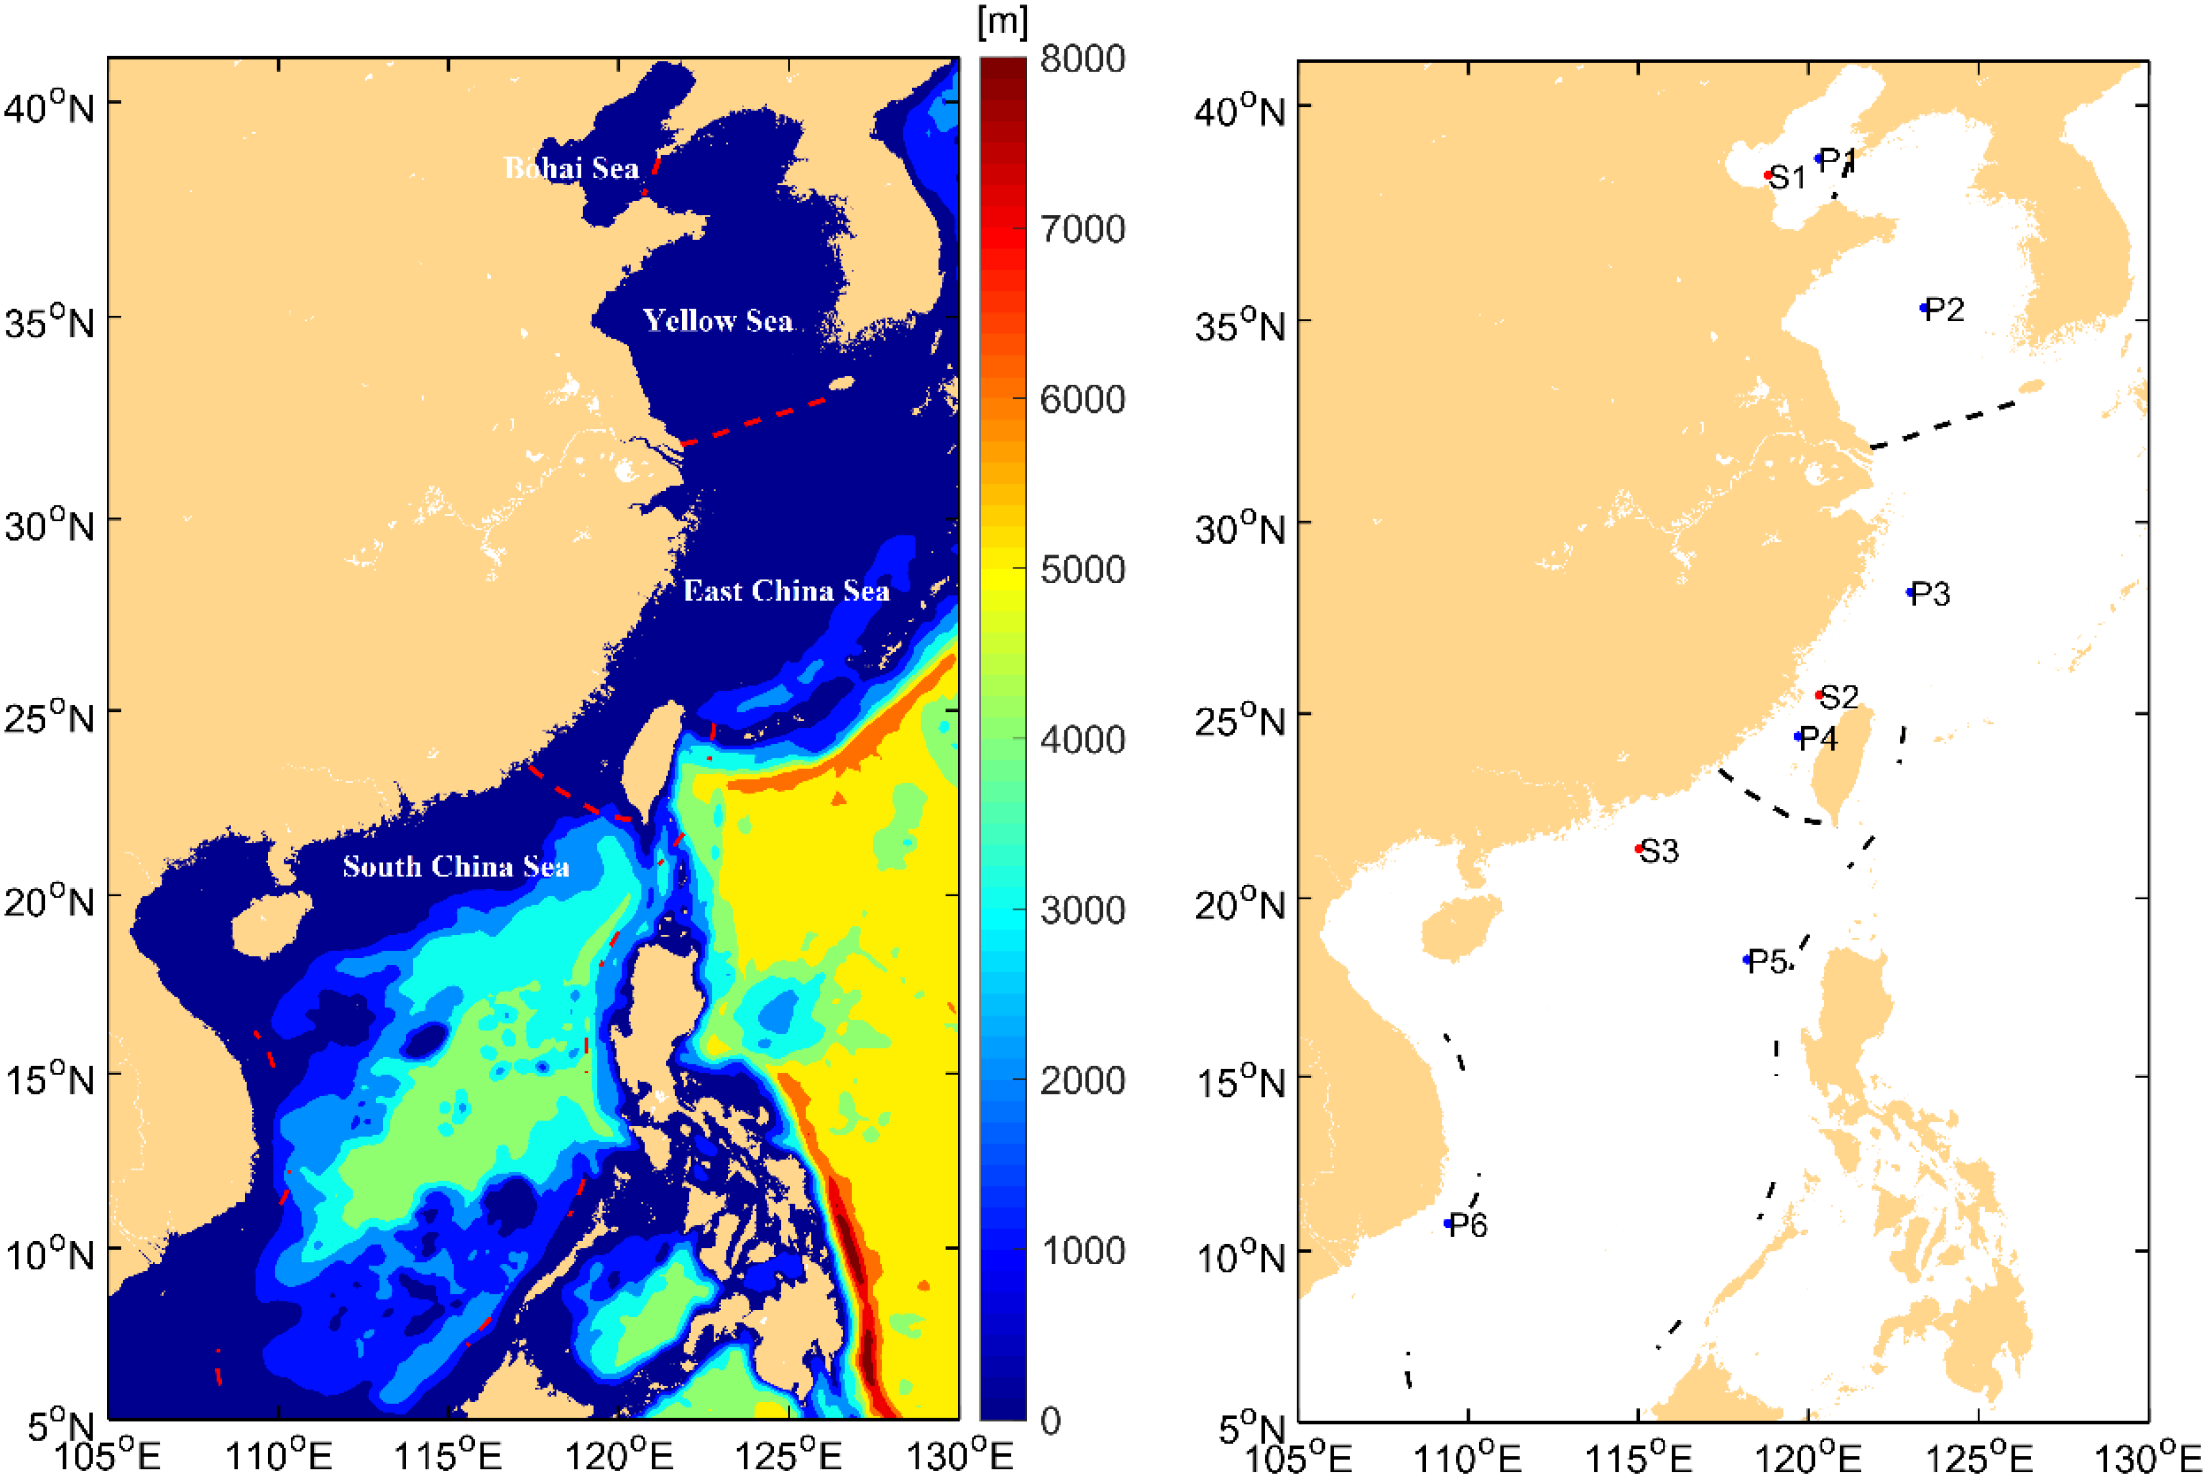
Bathymetry map of the calculation area (left) and location map of wave characteristic points and verification points (right).
Table 2
| Station | Longitude(°E) | Latitude(°N) |
|---|---|---|
| S1 | 118.8135 | 38.4138 |
| S2 | 120.31 | 25.50 |
| S3 | 115.017 | 21.352 |
Latitude and longitude positions of observation stations.
Figure 2
Hourly comparison diagram of significant wave height (a) and average wave period (b) at Station S1 (blue scatter points are measured data, red solid line is simulated data).
Figure 3
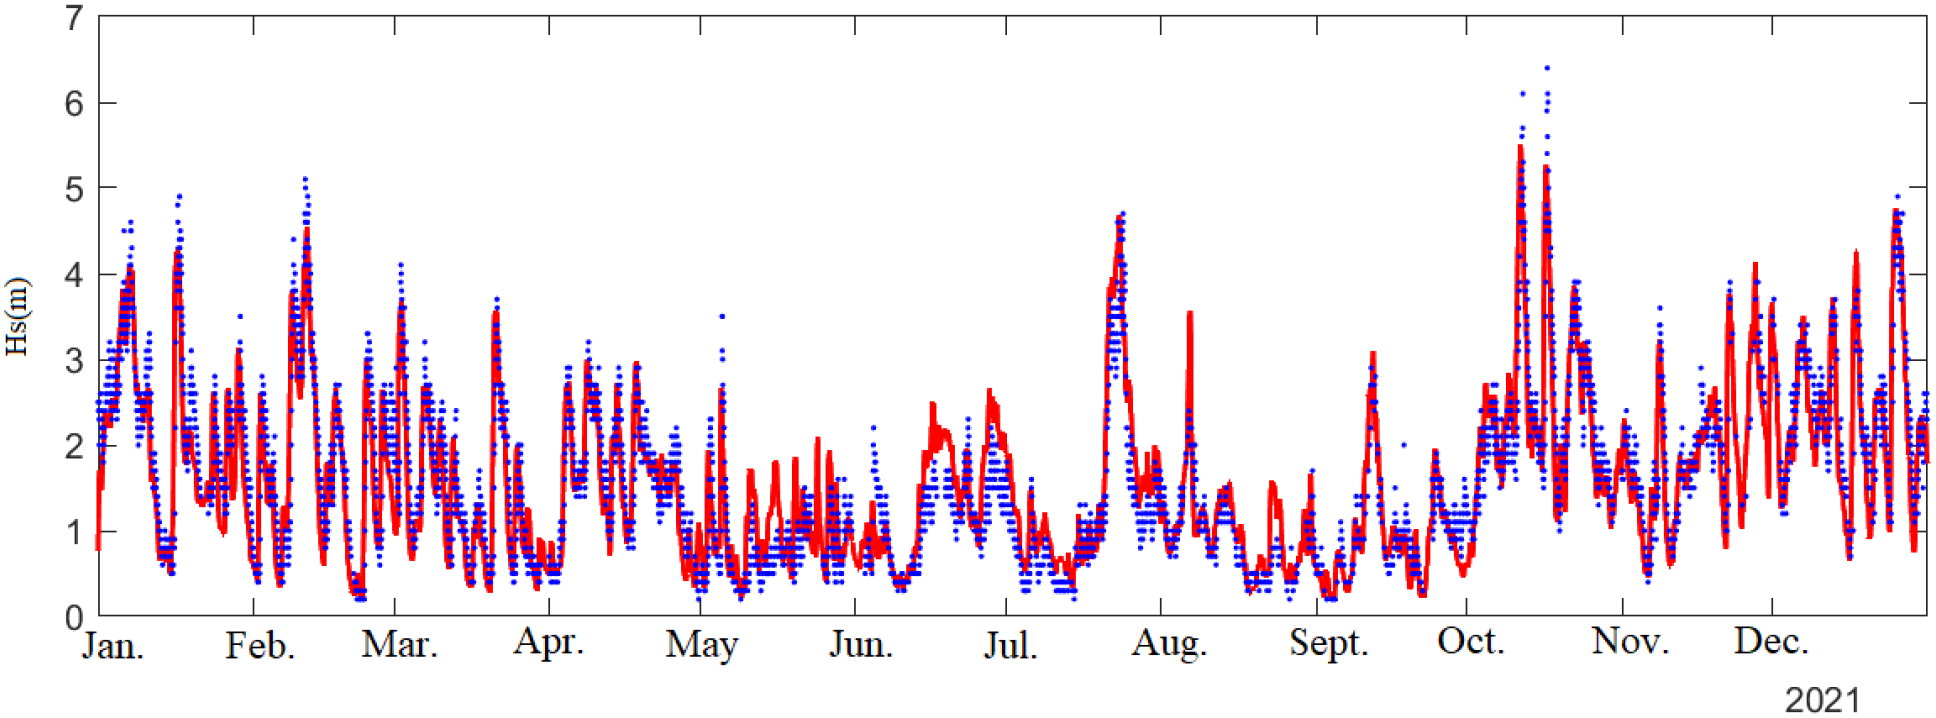
Hourly comparison diagram of significant wave height at Station S2 (blue scatter points are measured data, red solid line is simulated data).
Figure 4
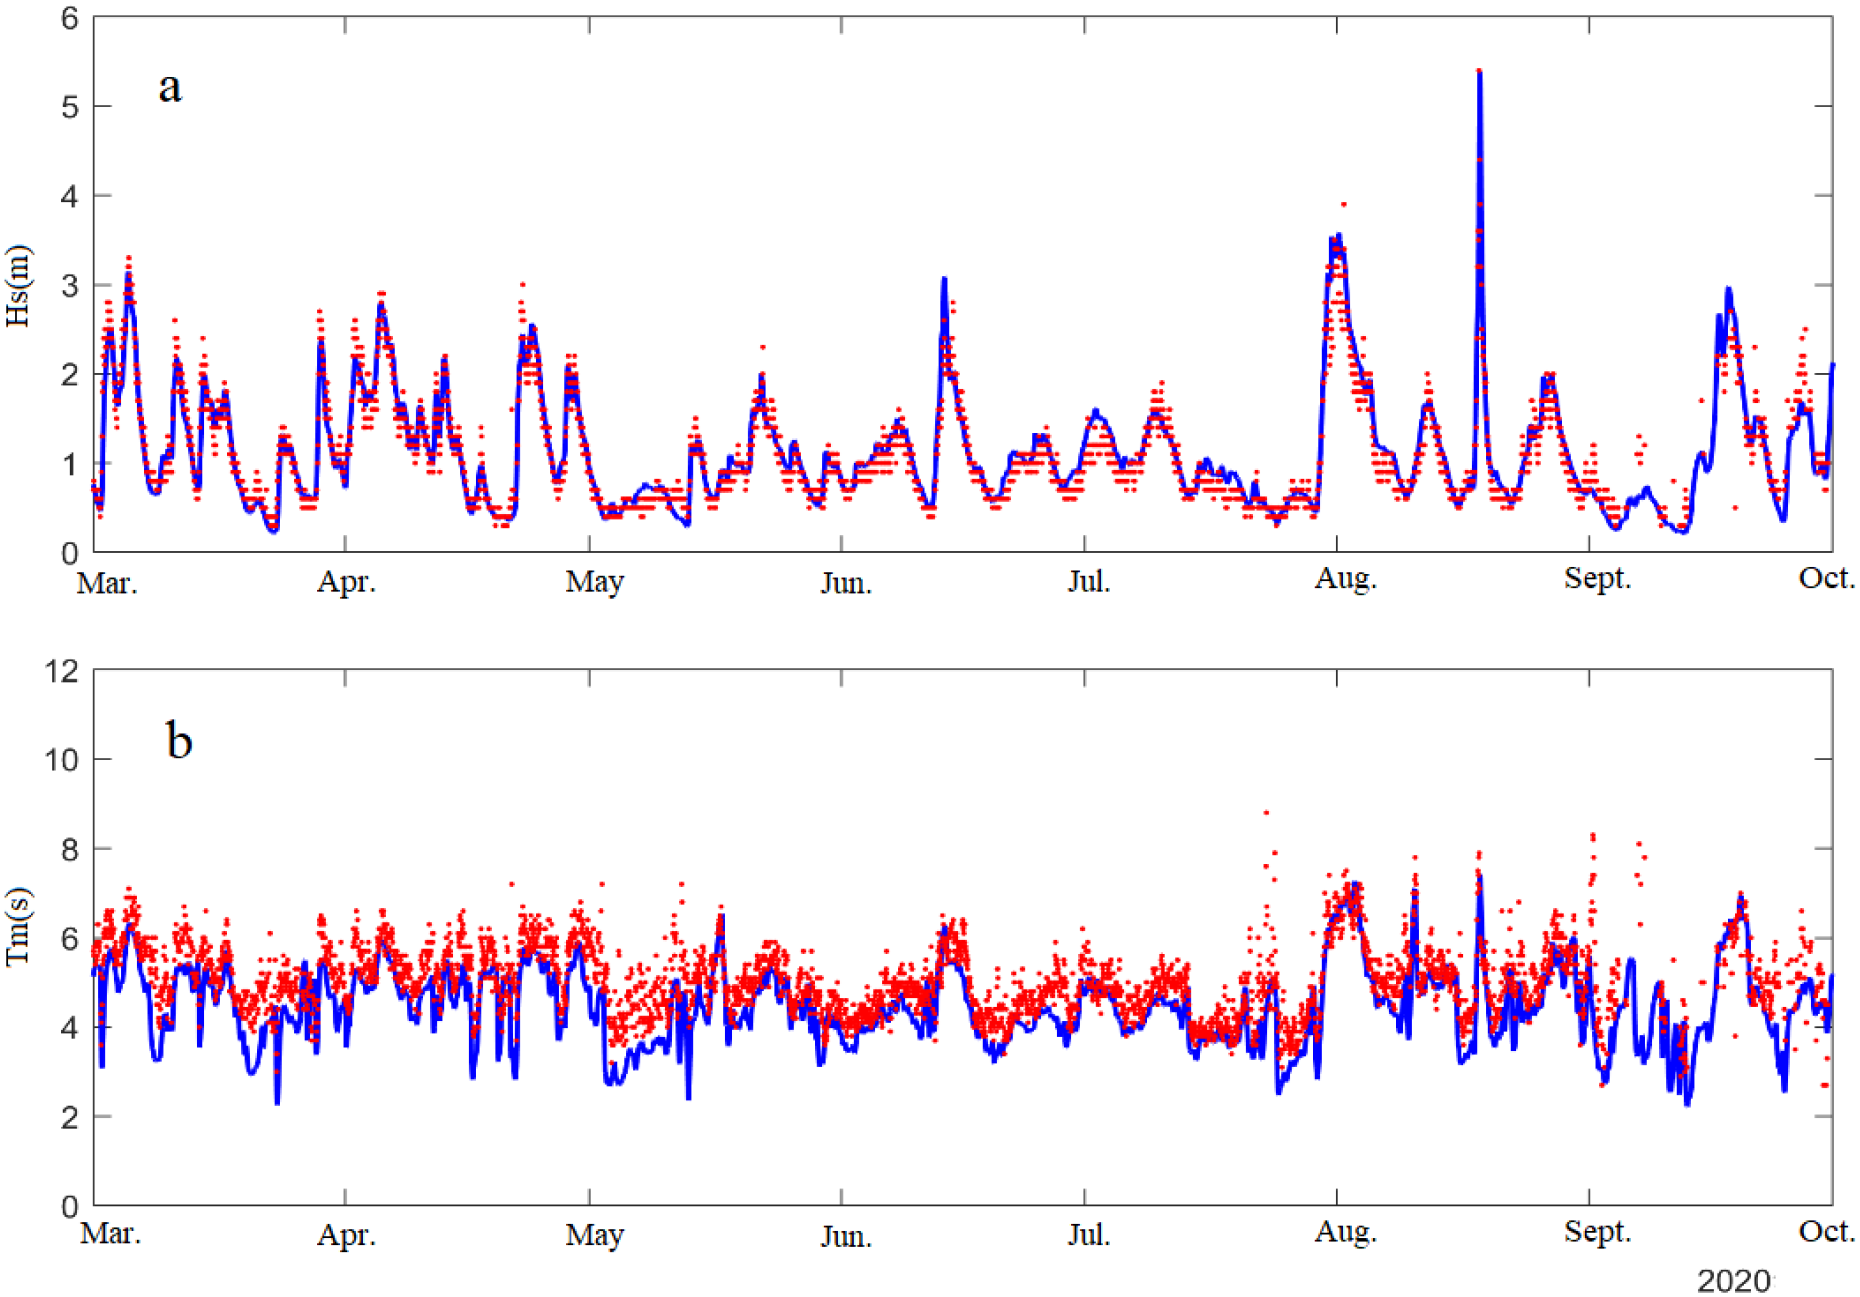
Hourly comparison diagram of significant wave height (a) and average wave period (b) at Station S3 (red scatter points are measured data, blue solid line is simulated data).
2.3 Wave energy assessment
Wave energy density (kW/m), also known as wave power flux density, represents the power of wave energy per unit width perpendicular to the wave. It serves as a crucial indicator for assessing wave energy resources (Vannucchi and Cappietti, 2016). This paper uses the following formula for calculation:
In the formula, Hs is the significant wave height, Tm is the average wave period, ρw is the density of seawater, Since the actual wave height of most ocean waves is less than 10m, and wave energy utilization mainly occurs on the seawater surface, this paper adopts a seawater density ρw of 1.022 × 10³ kg/m³ and a gravitational acceleration g of 9.8 m/s².
3 Wave characteristics
3.1 Annual average wave trend
In this paper, the 30-year (1995-2024) simulated significant wave height data are averaged to obtain the multi-year average significant wave height. The computational results are divided into two parts for analysis: one part covers the South China Sea, while the other encompasses the Bohai Sea, Yellow Sea, and East China Sea. It can be seen from Figure 5 that the maximum values of the annual mean significant wave height in the South China Sea are distributed in the central and northern region as well as the southeastern waters off Vietnam., with most sea areas having a wave height between 1.2~1.8m. Higher wave heights are observed in high-latitude regions, reaching up to 2 meters, while lower wave heights prevail in low-latitude areas and within Beibu Gulf. Due to the semi-enclosed nature of the South China Sea, waves generated in deep waters are absorbed upon reaching the coastline. Consequently, the wave height in the central is higher than that on both sides, and the wave field distribution is annular. Figure 5 also shows the vector arrows of wave direction; the overall wave direction predominantly points northeast and north, indicating that the South China Sea experiences a longer duration and more significant influence from the northeast monsoon.
Figure 5
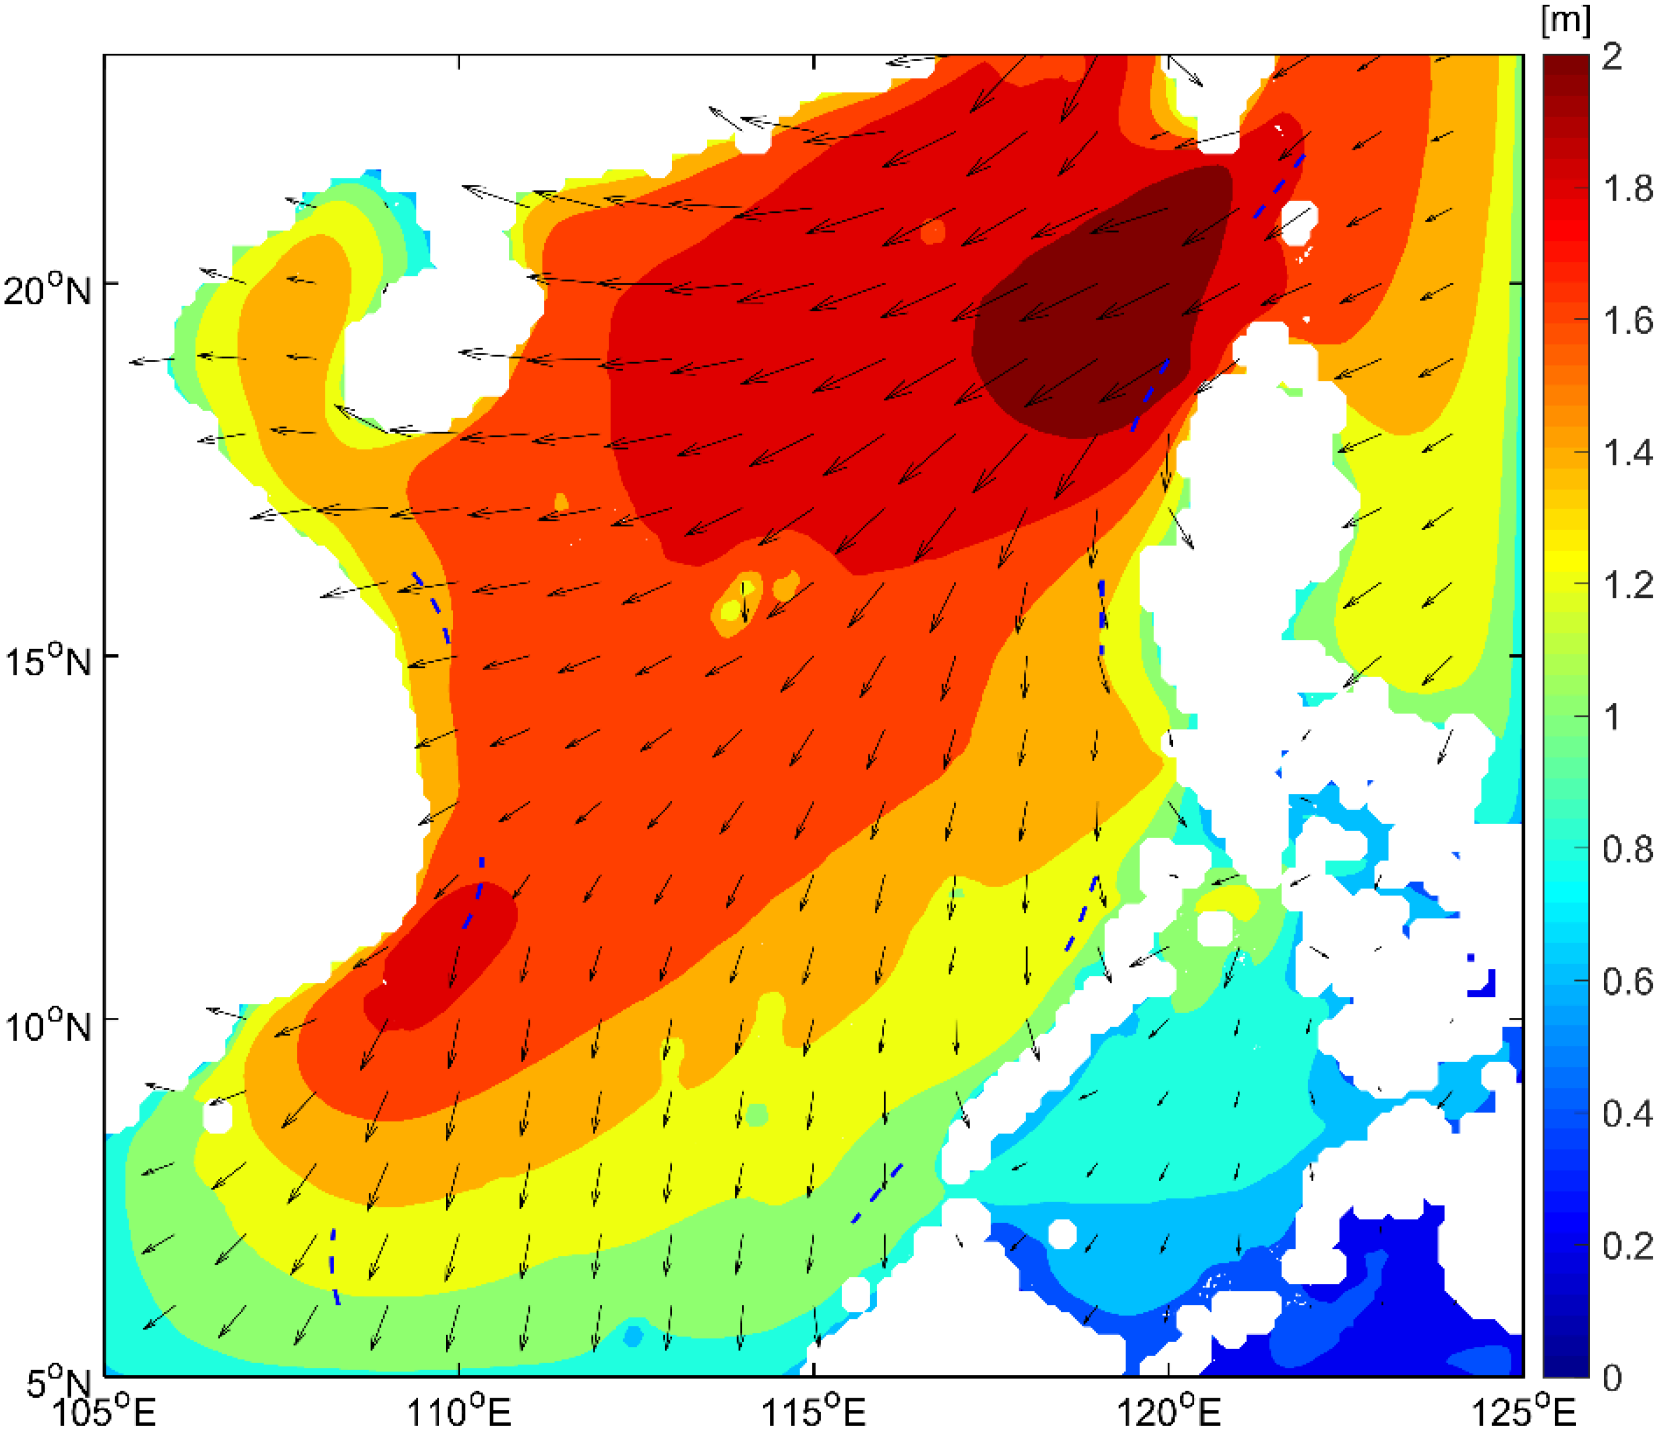
Annual average wave field characteristics of the South China Sea.
Figure 6 shows the distribution of average wave heights in the Bohai Sea, Yellow Sea, and East China Sea from 1995 to 2024. Most areas of the Bohai Sea have annual average wave heights below 0.8 m. The northern part of the Yellow Sea has lower annual average wave heights than its southern part, with the central and southern Yellow Sea regions ranging between 0.8 and 1.2 m. The East China Sea exhibits higher average wave heights, with most areas ranging between 1.3 and 1.5 m and in the southeastern Taiwan Island and the Taiwan Strait can reach more than 1.6m.
Figure 6
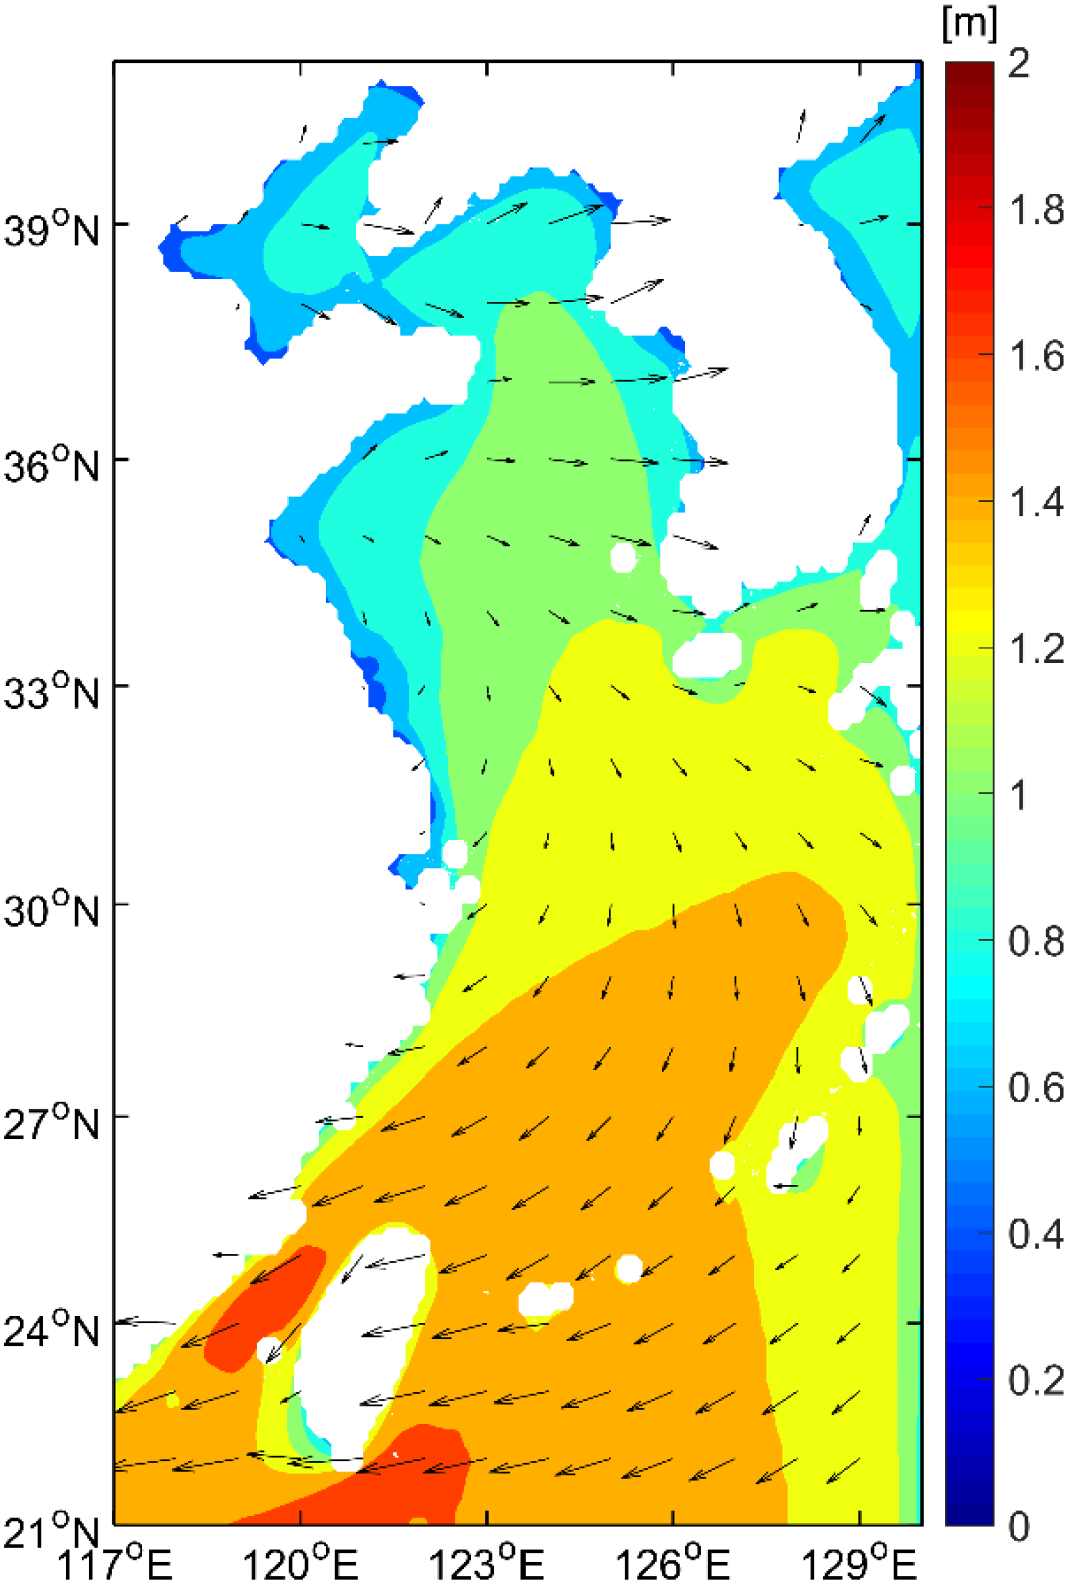
Annual average wave field characteristics of the Bohai Sea, Yellow Sea, and East China Sea.
3.2 Seasonal average wave trend
Figures 7 and 8 show the seasonal average distributions of significant wave height and wave direction for spring, summer, autumn, and winter in the Chinese seas. Spring spans March, April, and May; summer spans June, July, and August; autumn spans September, October, and November; and winter includes December, January, and February of the following year. This chapter employs this seasonal division for multi-year seasonal averaging calculations, analyzing the seasonal variation characteristics of Chinese seas.
Figure 7
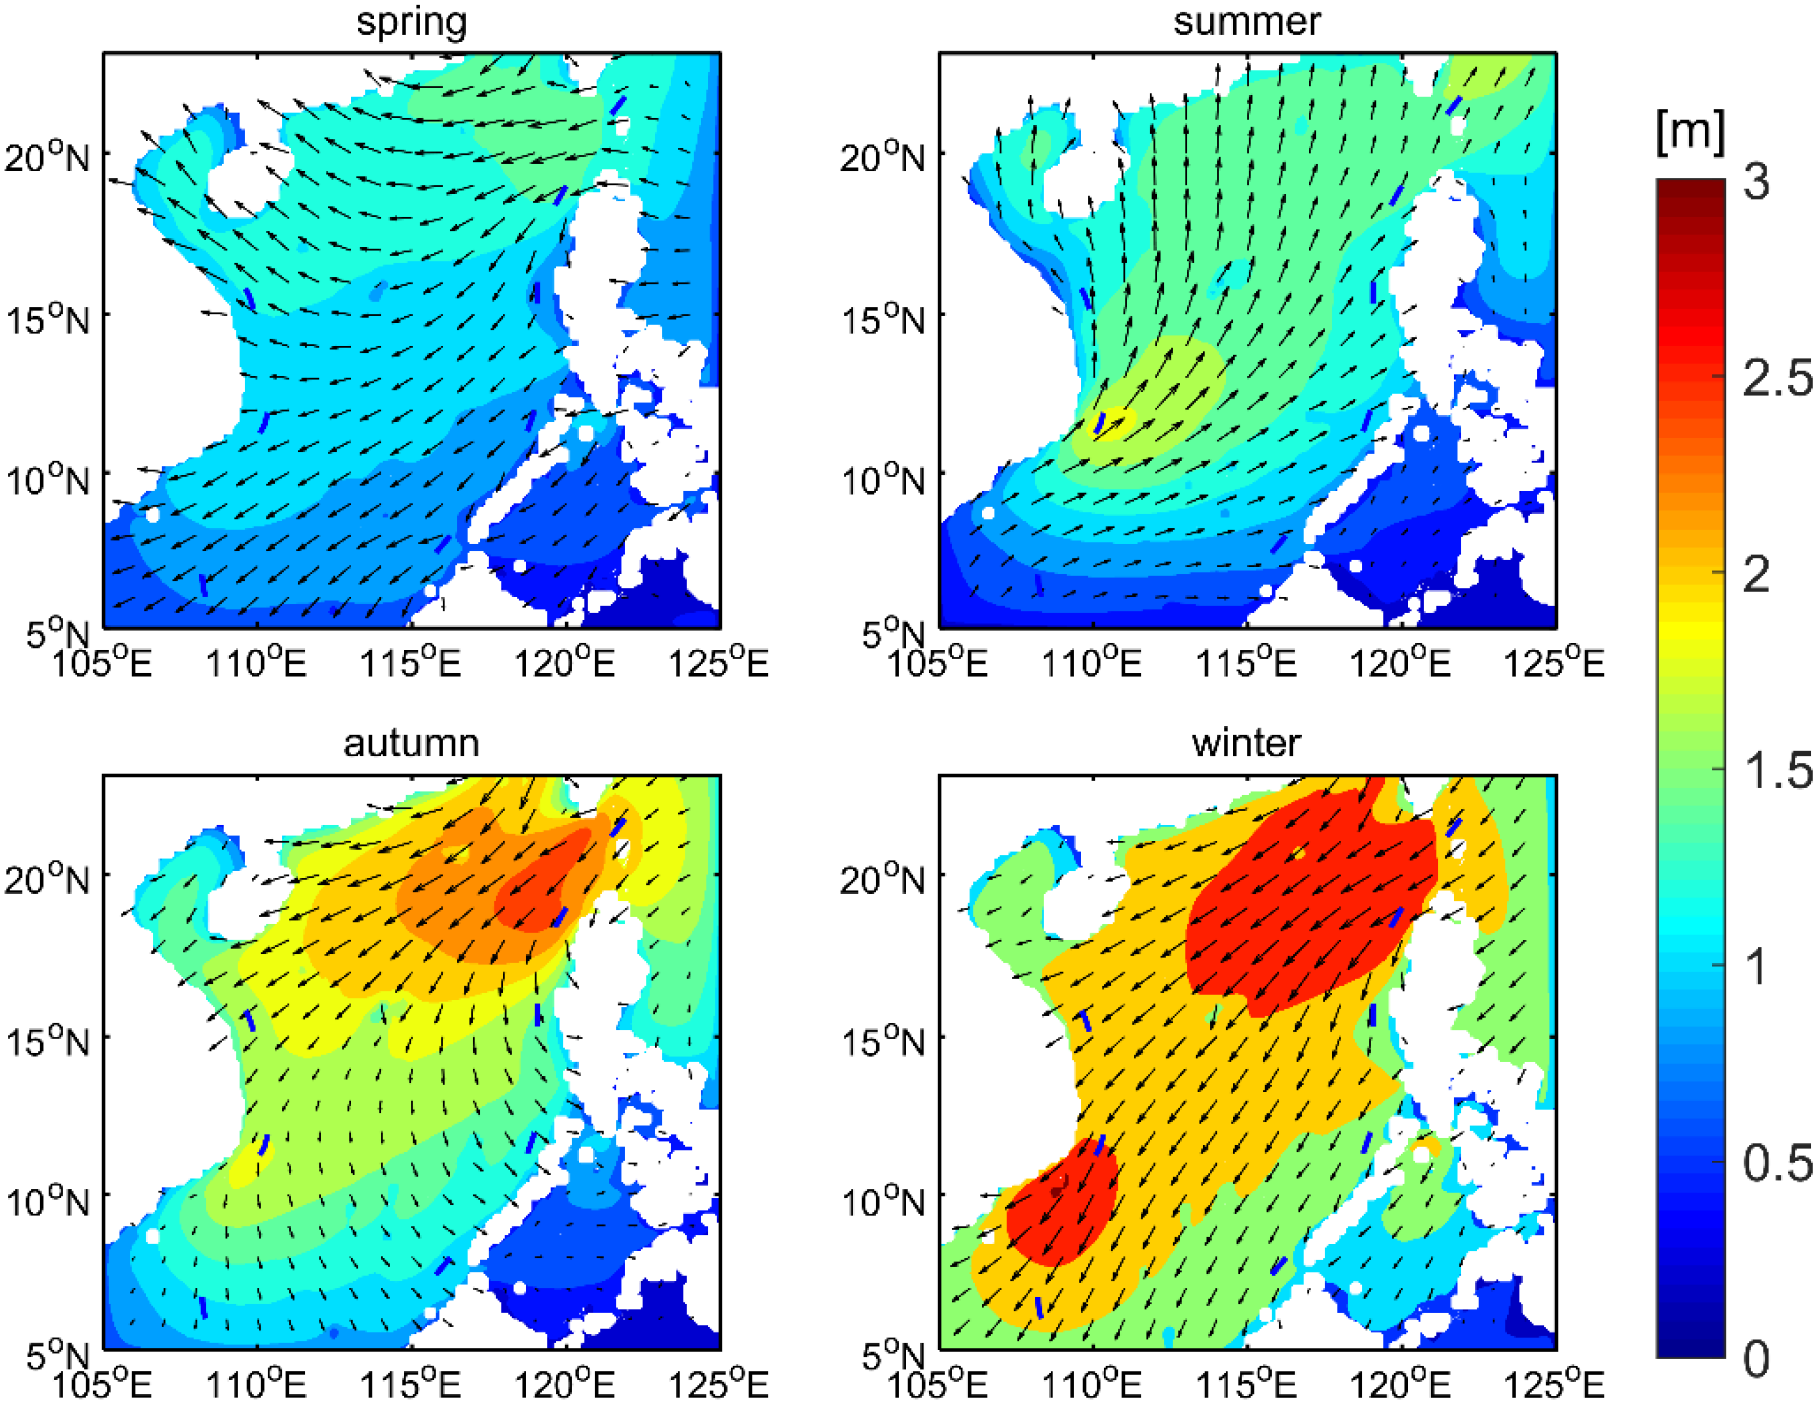
Seasonal average wave field characteristics of the South China Sea.
Figure 8
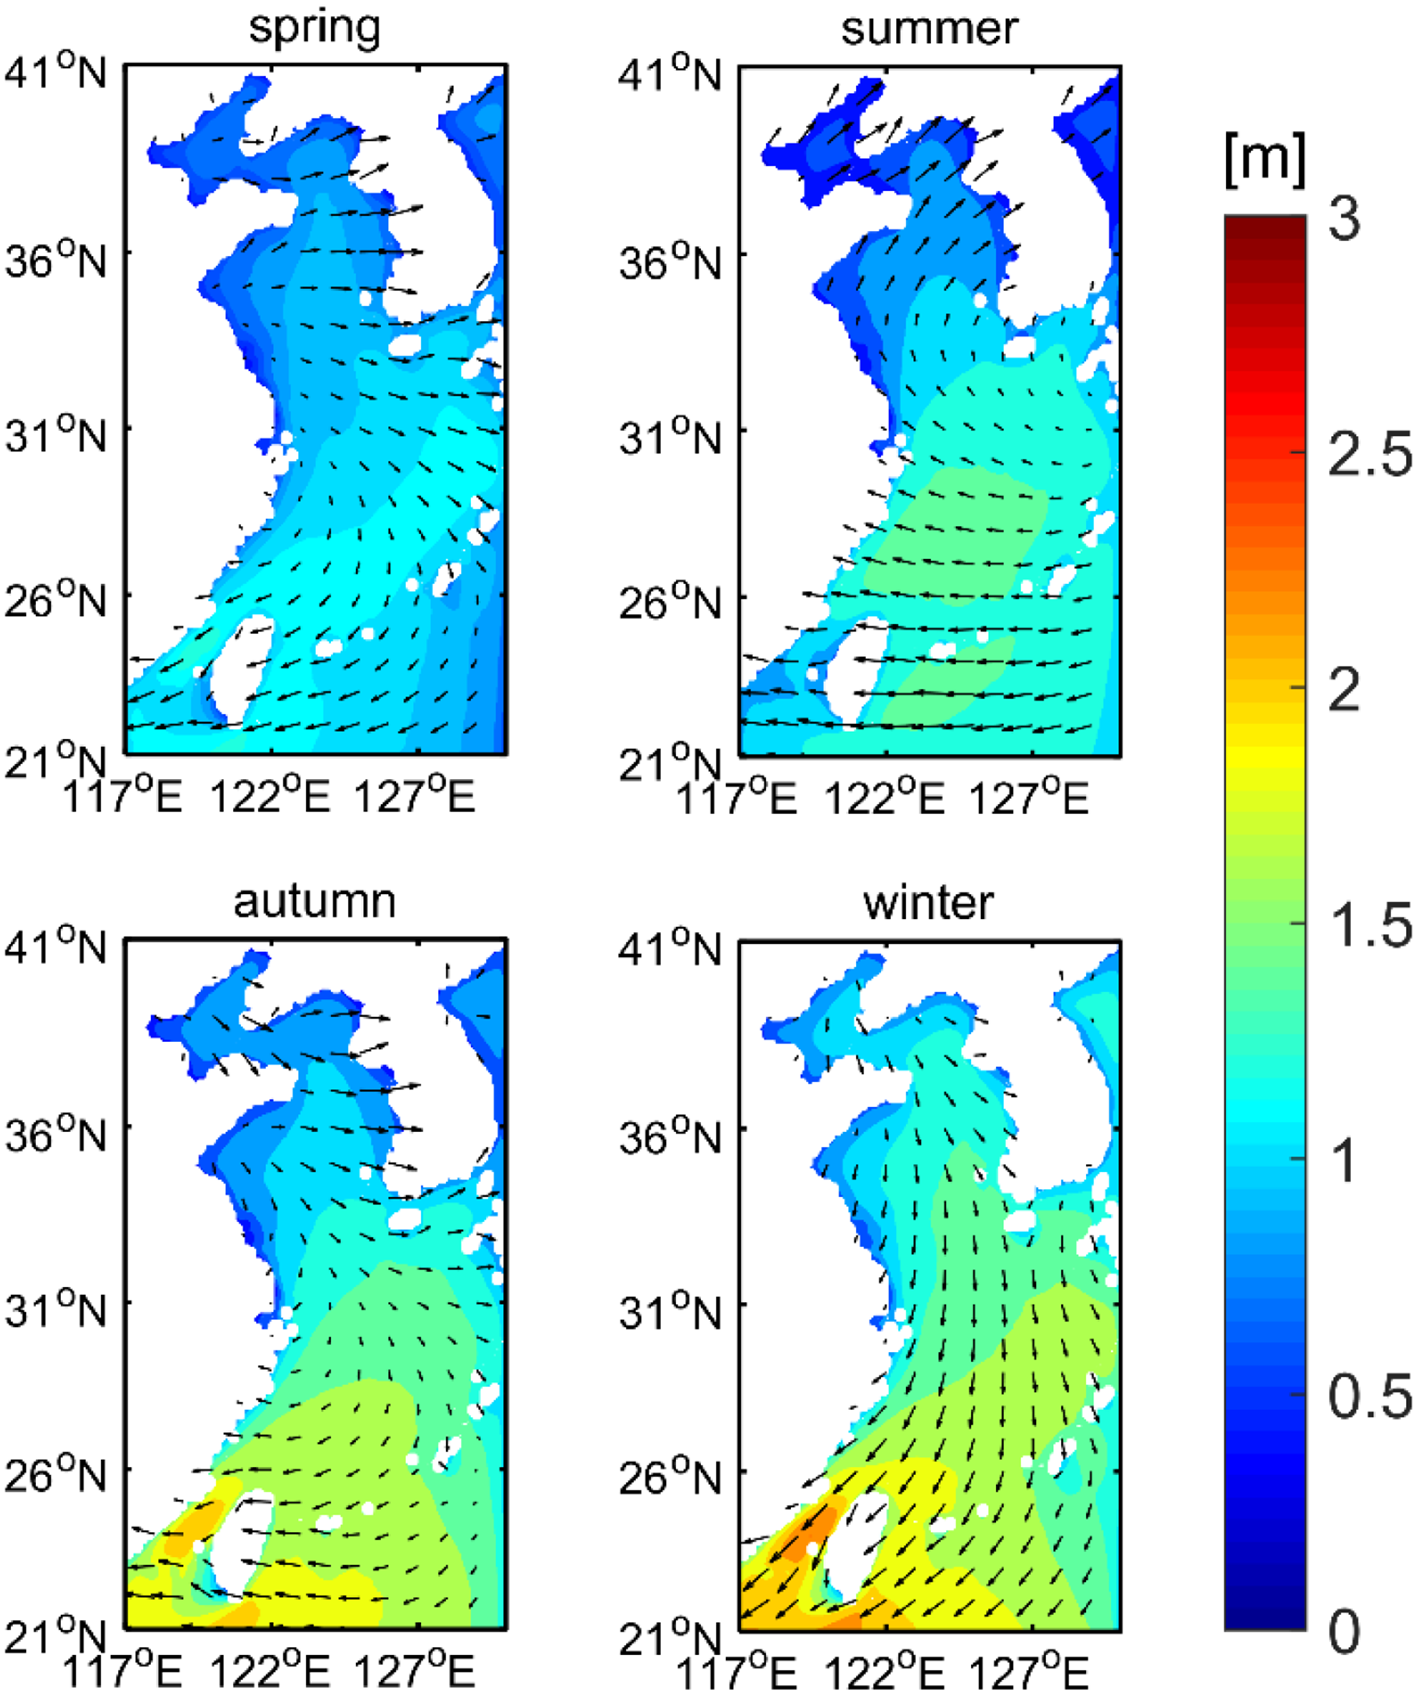
Seasonal average wave field characteristics of the Bohai Sea, Yellow Sea, and East China Sea.
As shown in Figure 7, the maximum multi-year average significant wave height in the South China Sea during spring reaches 1.5 m, with the majority of sea areas recording a significant wave height ranging from 0.8 to 1.5 m. In the waters adjacent to the Bashi Channel, the significant wave height exceeds 1.2 m, showing a decreasing trend with the reduction of latitude. Spring is a monsoon transition period, where the dominant wave direction is easterly across most sea areas, while a northeasterly wave direction is observed in the low-latitude southern waters.
In summer, the significant wave height in the central and northern South China Sea exceeds 1.2 m, while in the southeastern waters off Vietnam is significantly higher, reaching approximately 1.8 meters. Summer is a typical southwest monsoon season, with waves generated by the monsoon winds originating from the Indian Ocean. The dominant wave direction is southerly in the northern South China Sea, while the central and southern sea areas are characterized by a southwestward wave direction.
The maximum multi-year average significant wave height in the South China Sea during autumn is found in the western Bashi Channel, where the value can reach 2.5 m. As a monsoon climate transition period, autumn witnesses relatively disordered wave directions due to the adjustment process of the monsoon system.
The long-term average significant wave height in the South China Sea during winter is higher than that in the other three seasons: the significant wave height exceeds 2.5 m in both the western Bashi Channel and the southeastern waters of Vietnam, and remains above 2 m in the sea areas stretching in a northeast-southwest direction. Winter is the prevailing period of the northeast monsoon, during which the South China Sea features a uniformly northeastward wave direction with high regularity.
Figure 8 shows the seasonal average wave height distribution in the Bohai Sea, Yellow Sea, and East China Sea. Overall, wave heights are higher in autumn and winter, and lower in spring and summer. Wave heights in the Bohai Sea range between 0.5 and 1 meter throughout the year, with most coastal areas experiencing wave heights between 0 and 0.5 meters. The central sea area reaches its highest winter average wave height of up to 1.1 meters.
In the Yellow Sea, spring and summer annual average wave heights typically range from 0.5 to 1.2 meters, while winter wave heights peak in the southernmost regions, reaching up to 1.6 meters.
The East China Sea exhibits higher seasonal average wave heights than the Yellow Sea and Bohai Sea, with wave heights increasing from northwest to southeast throughout the year. Spring sees the lowest wave heights, with most areas ranging between 0.8 and 1.2 meters. During winter, the southwest of Taiwan Island experiences the highest wave heights, exceeding 2 meters.
Regarding wave direction, winter is dominated by the strong East Asian winter monsoon, resulting in stable and persistent wind patterns. The Bohai Sea and Yellow Sea predominantly experience northwest to north and true north wave directions, while the East China Sea primarily faces true north and northeast to north. Spring and autumn, being transitional monsoon periods, exhibit greater variability in wave direction. During summer, the Yellow Sea and Bohai Sea predominantly experience south to southwest wave directions, while the East China Sea primarily faces southeast.
3.3 Monthly average wave trend
The monthly mean significant wave height distribution in the South China Sea is shown in Figure 9. It reveals that from December to February, the monthly mean significant wave height ranges between 1.5 and 3 m, with December exhibiting the highest wave height. The maximum values occur in the western part of the Bashi Channel and the southeastern areas of Vietnam, reaching over 3 m. In November, the monthly mean significant wave height primarily ranged between 1.5 and 2.5 m, with the maximum occurring near the western part of the Bashi Channel, consistent with the winter months in spatial distribution. From March to October, the monthly mean significant wave height mainly ranges between 0.5 and 2 m, with the minimum monthly mean wave height occurring in May. As shown in Figure 10.
Figure 9
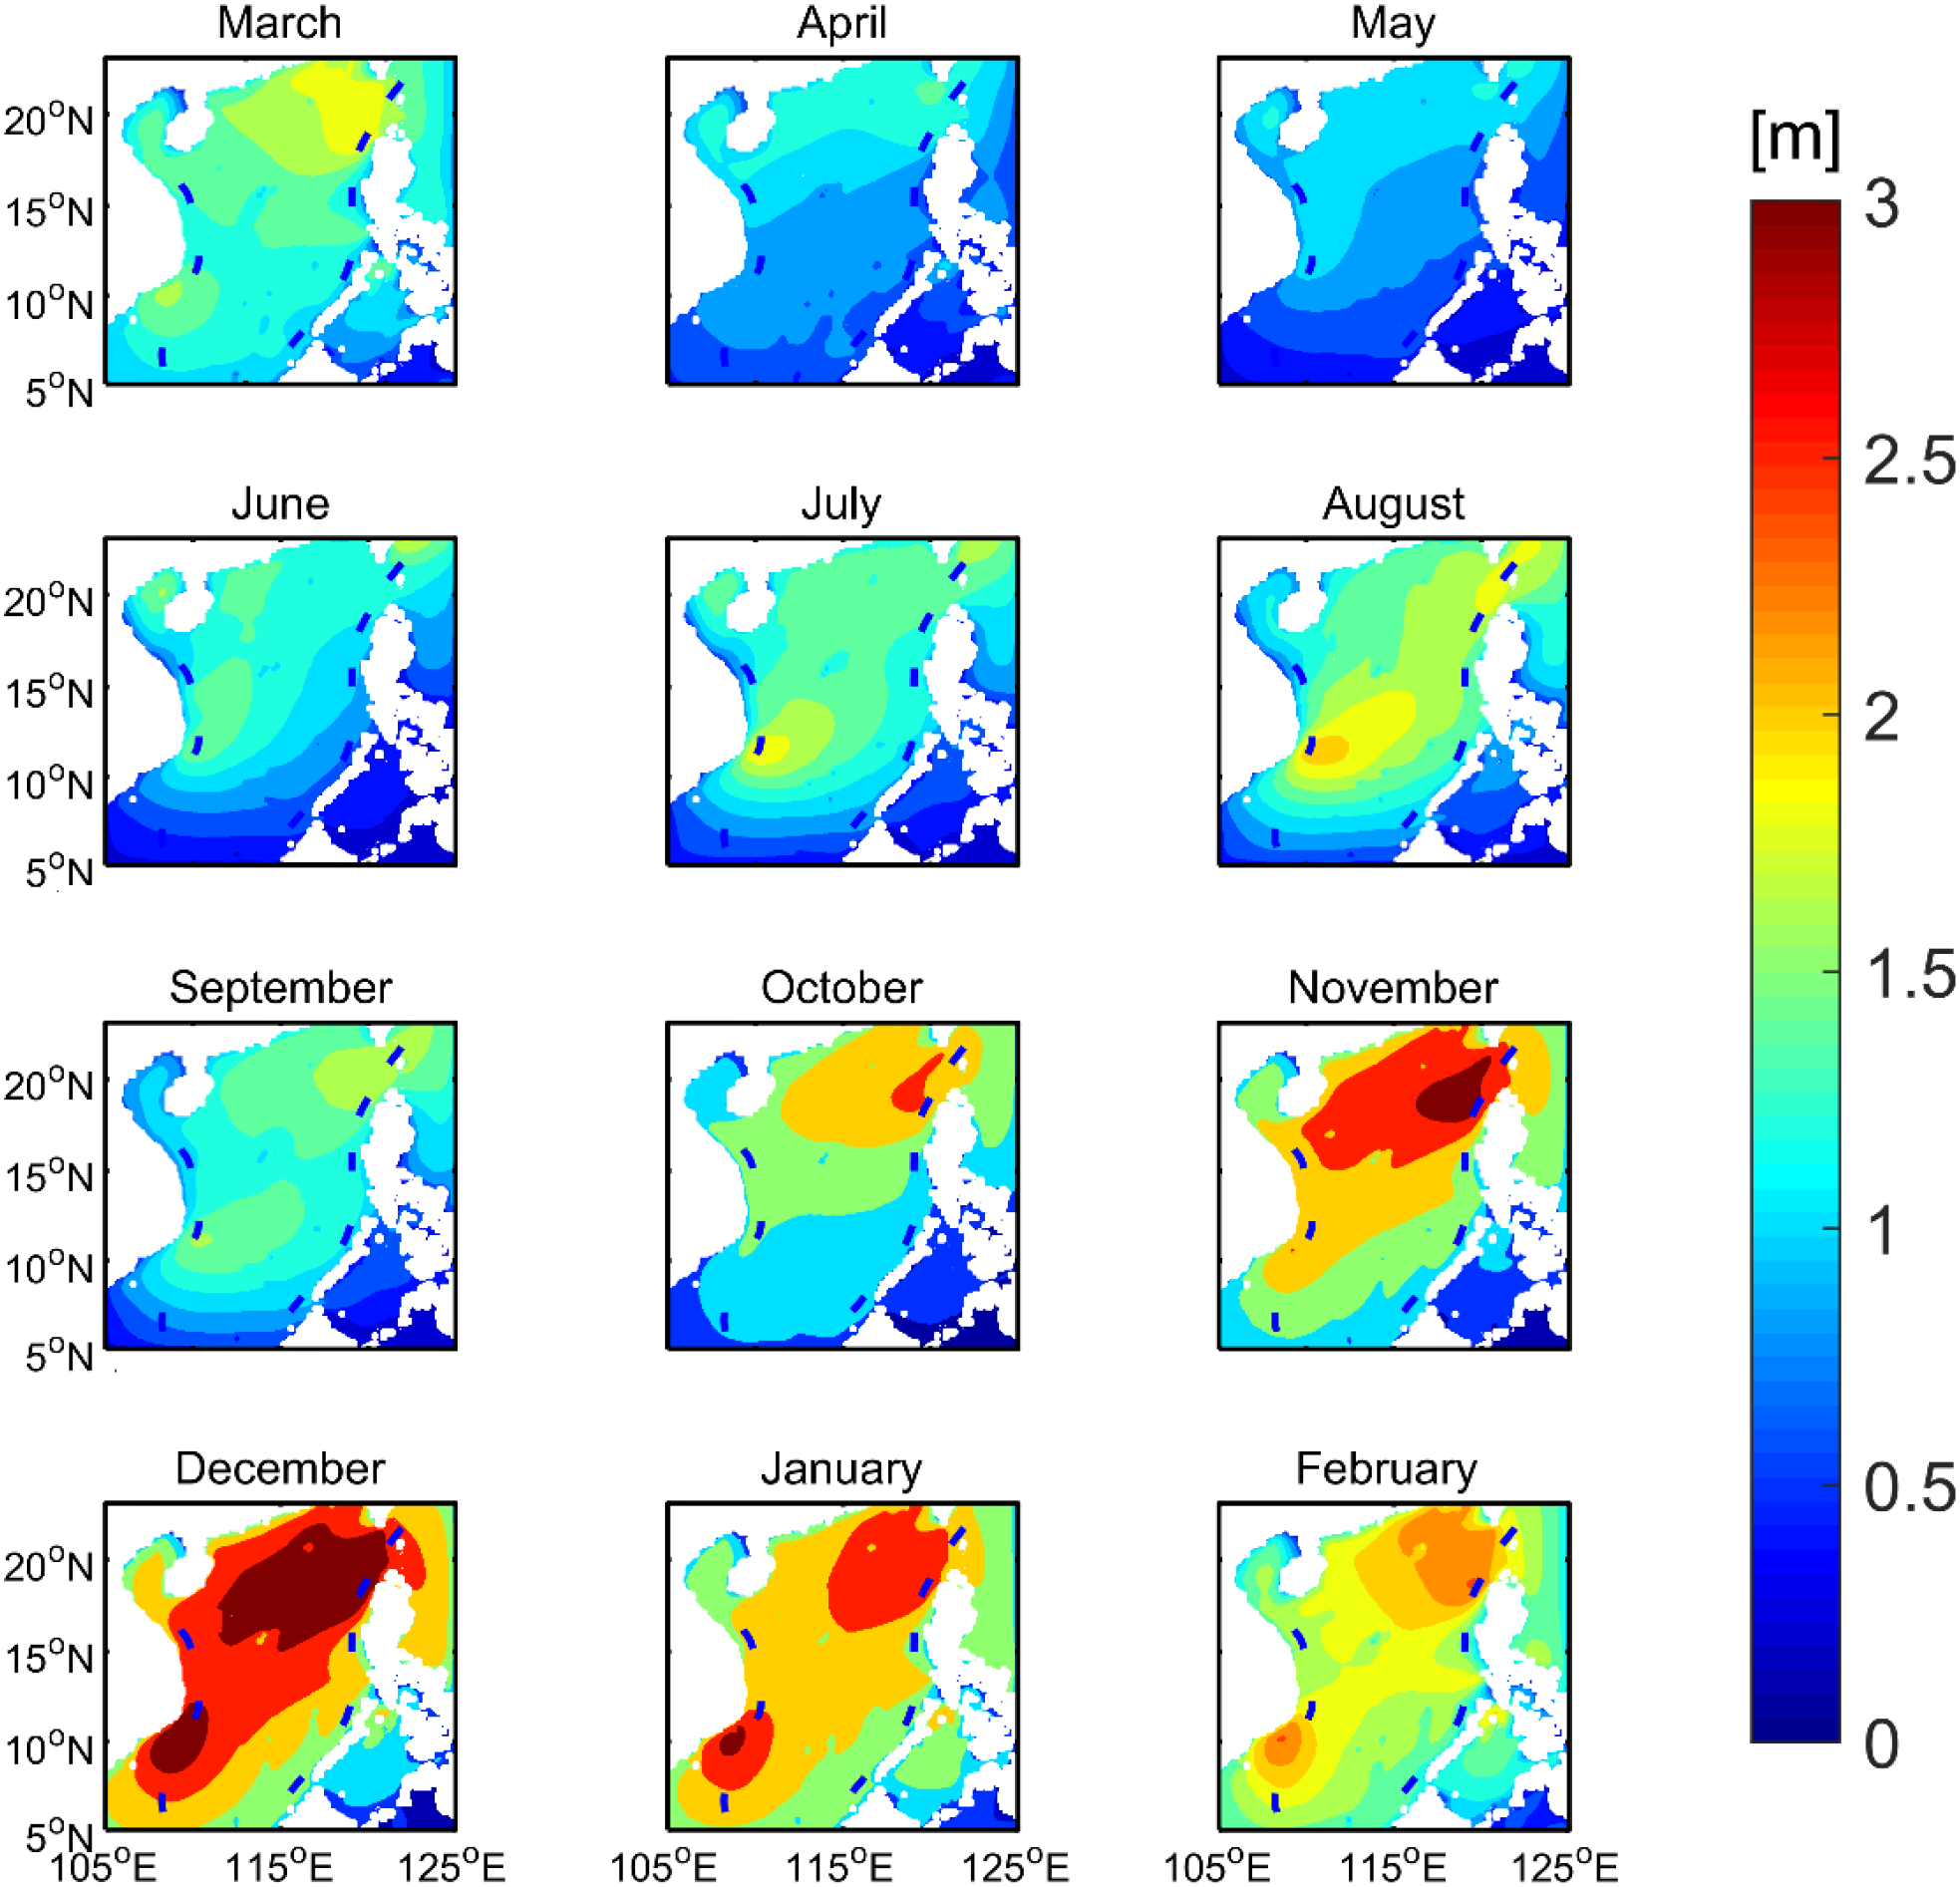
Monthly average wave field characteristics of the South China Sea.
Figure 10
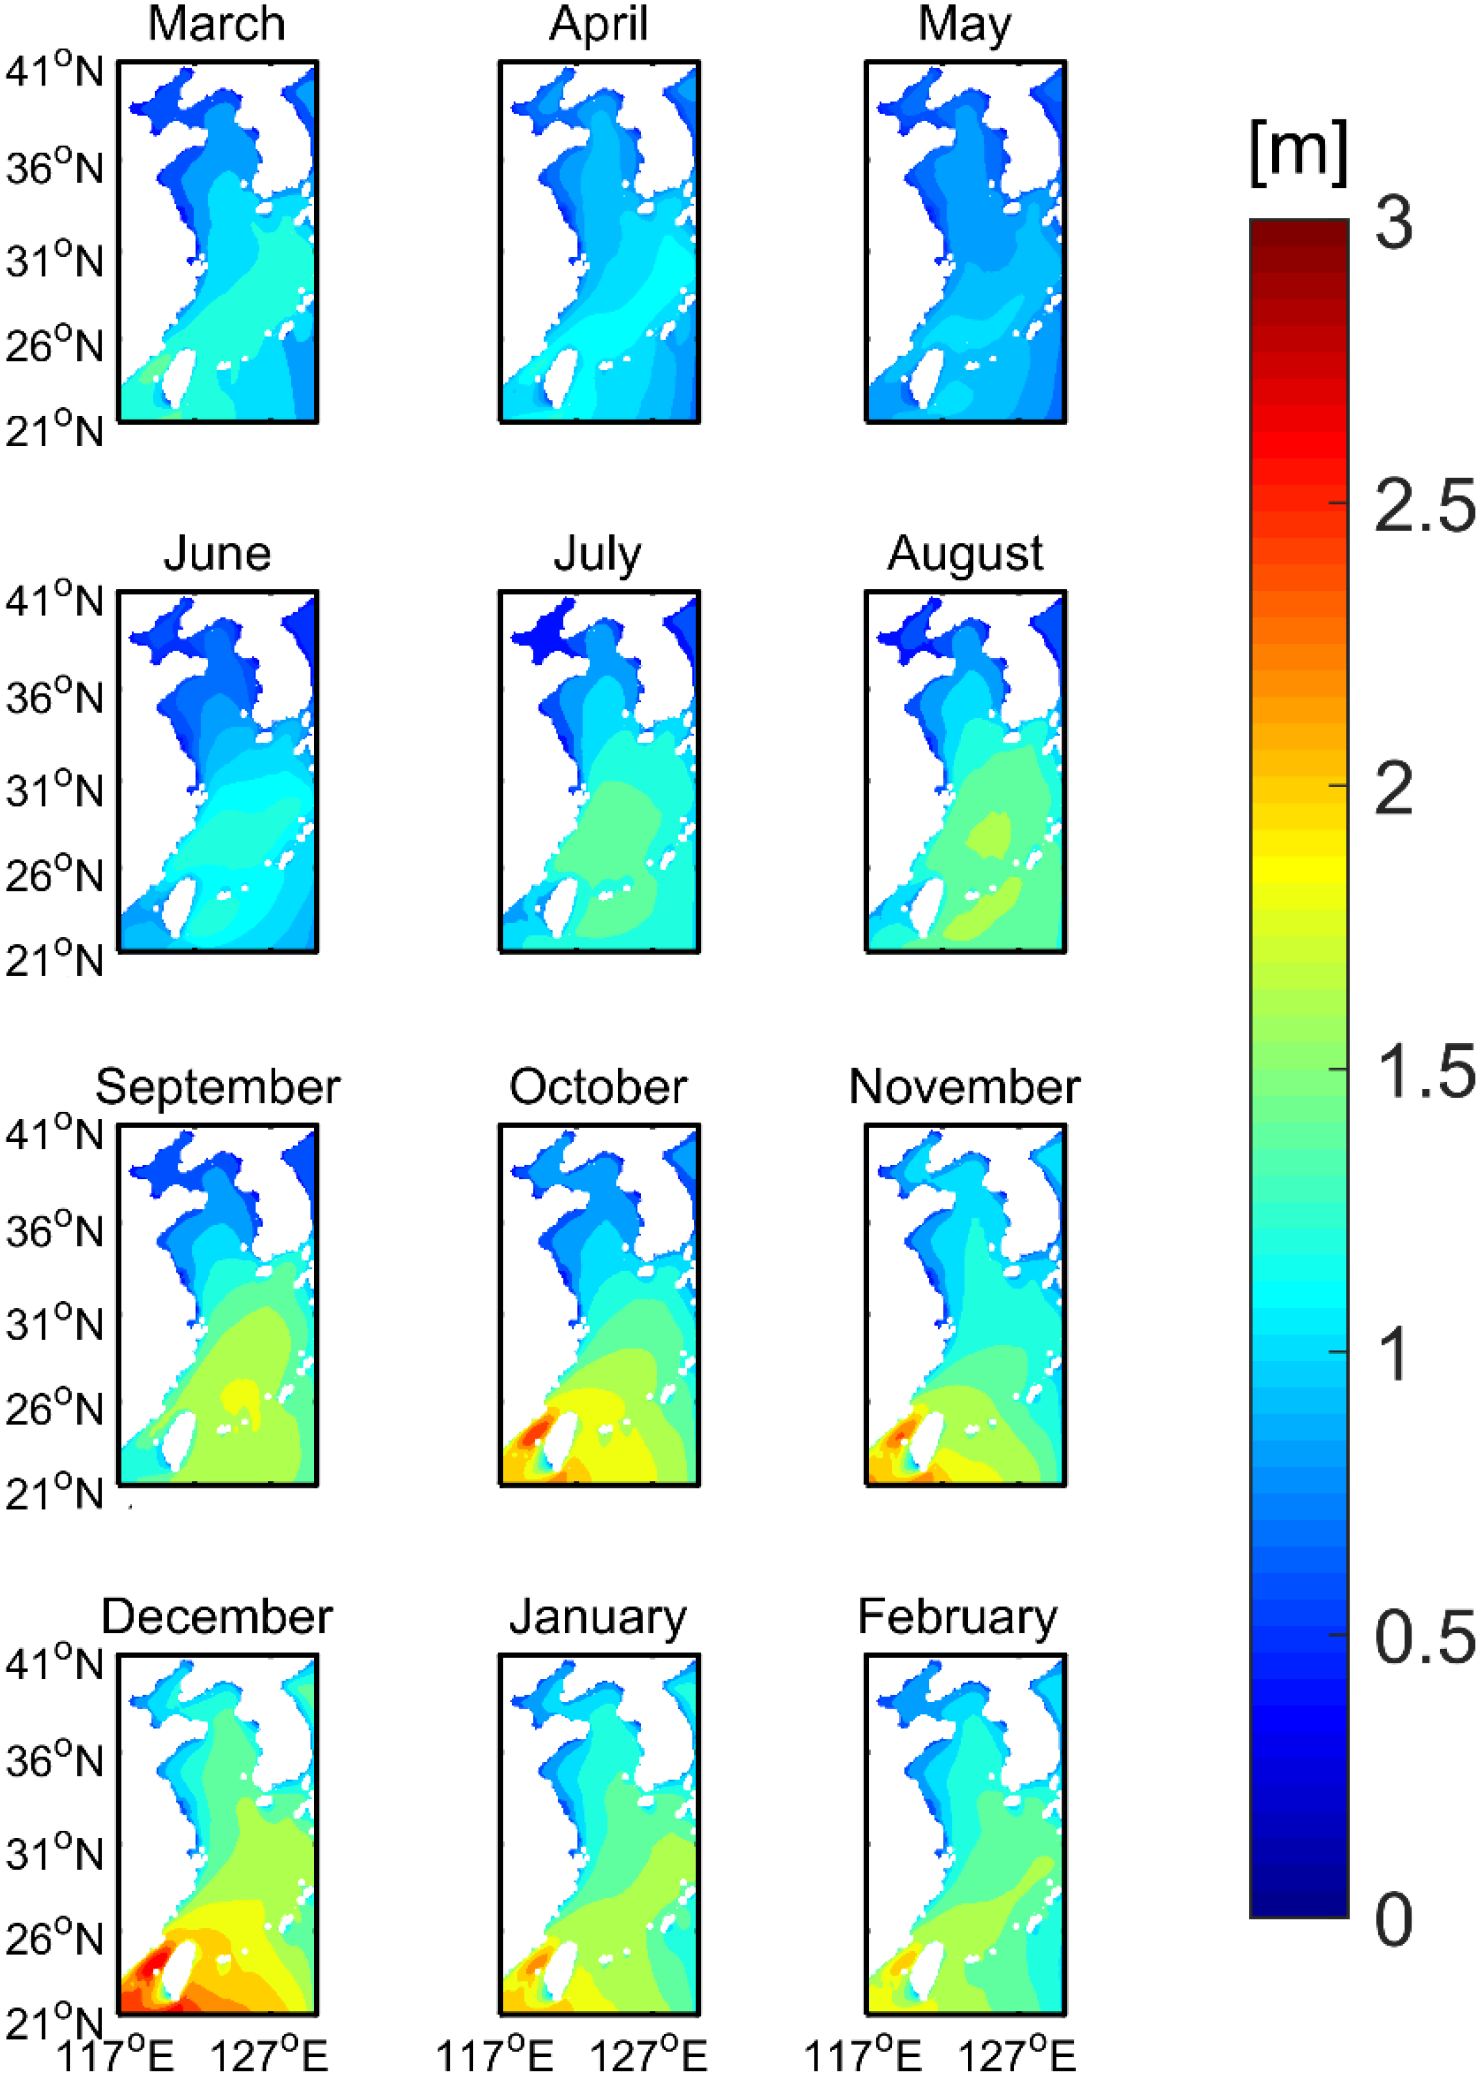
Monthly average wave field characteristics of the Bohai Sea, Yellow Sea, and East China Sea.
In the Bohai and Yellow Seas, the wave height is relatively large from December to February, with the maximum wave height of about 1.7m occurring in the southern Yellow Sea in December; the wave height in other months is between 0.3-1.3m, and the monthly average wave height in the Bohai Sea is below 1m; The East China Sea exhibits higher wave heights from December to February, with most areas exceeding 1.5 m. In December, wave heights near the Taiwan region peaked at approximately 2.5 m. From March to May, wave heights decrease, generally falling below 1.2 m. From June to August, wave heights in most areas range from 1 to 1.7 m, and from September to November range from 1 to 2 m.
4 Wave energy
4.1 Annual average characteristics of wave energy density
As shown in Figure 11, wave energy density in most areas of the South China Sea ranges between 5 and 15 kW/m, the high-value areas are distributed along the line from the western Bashi Strait to southeastern Vietnam, in a northeast-southwest trend, with energy density basically above 8kW/m. the low-value areas are distributed in the Beibu Gulf, Sulu Sea, and equatorial low-latitude sea areas, with energy density basically below 5kW/m.
Figure 11
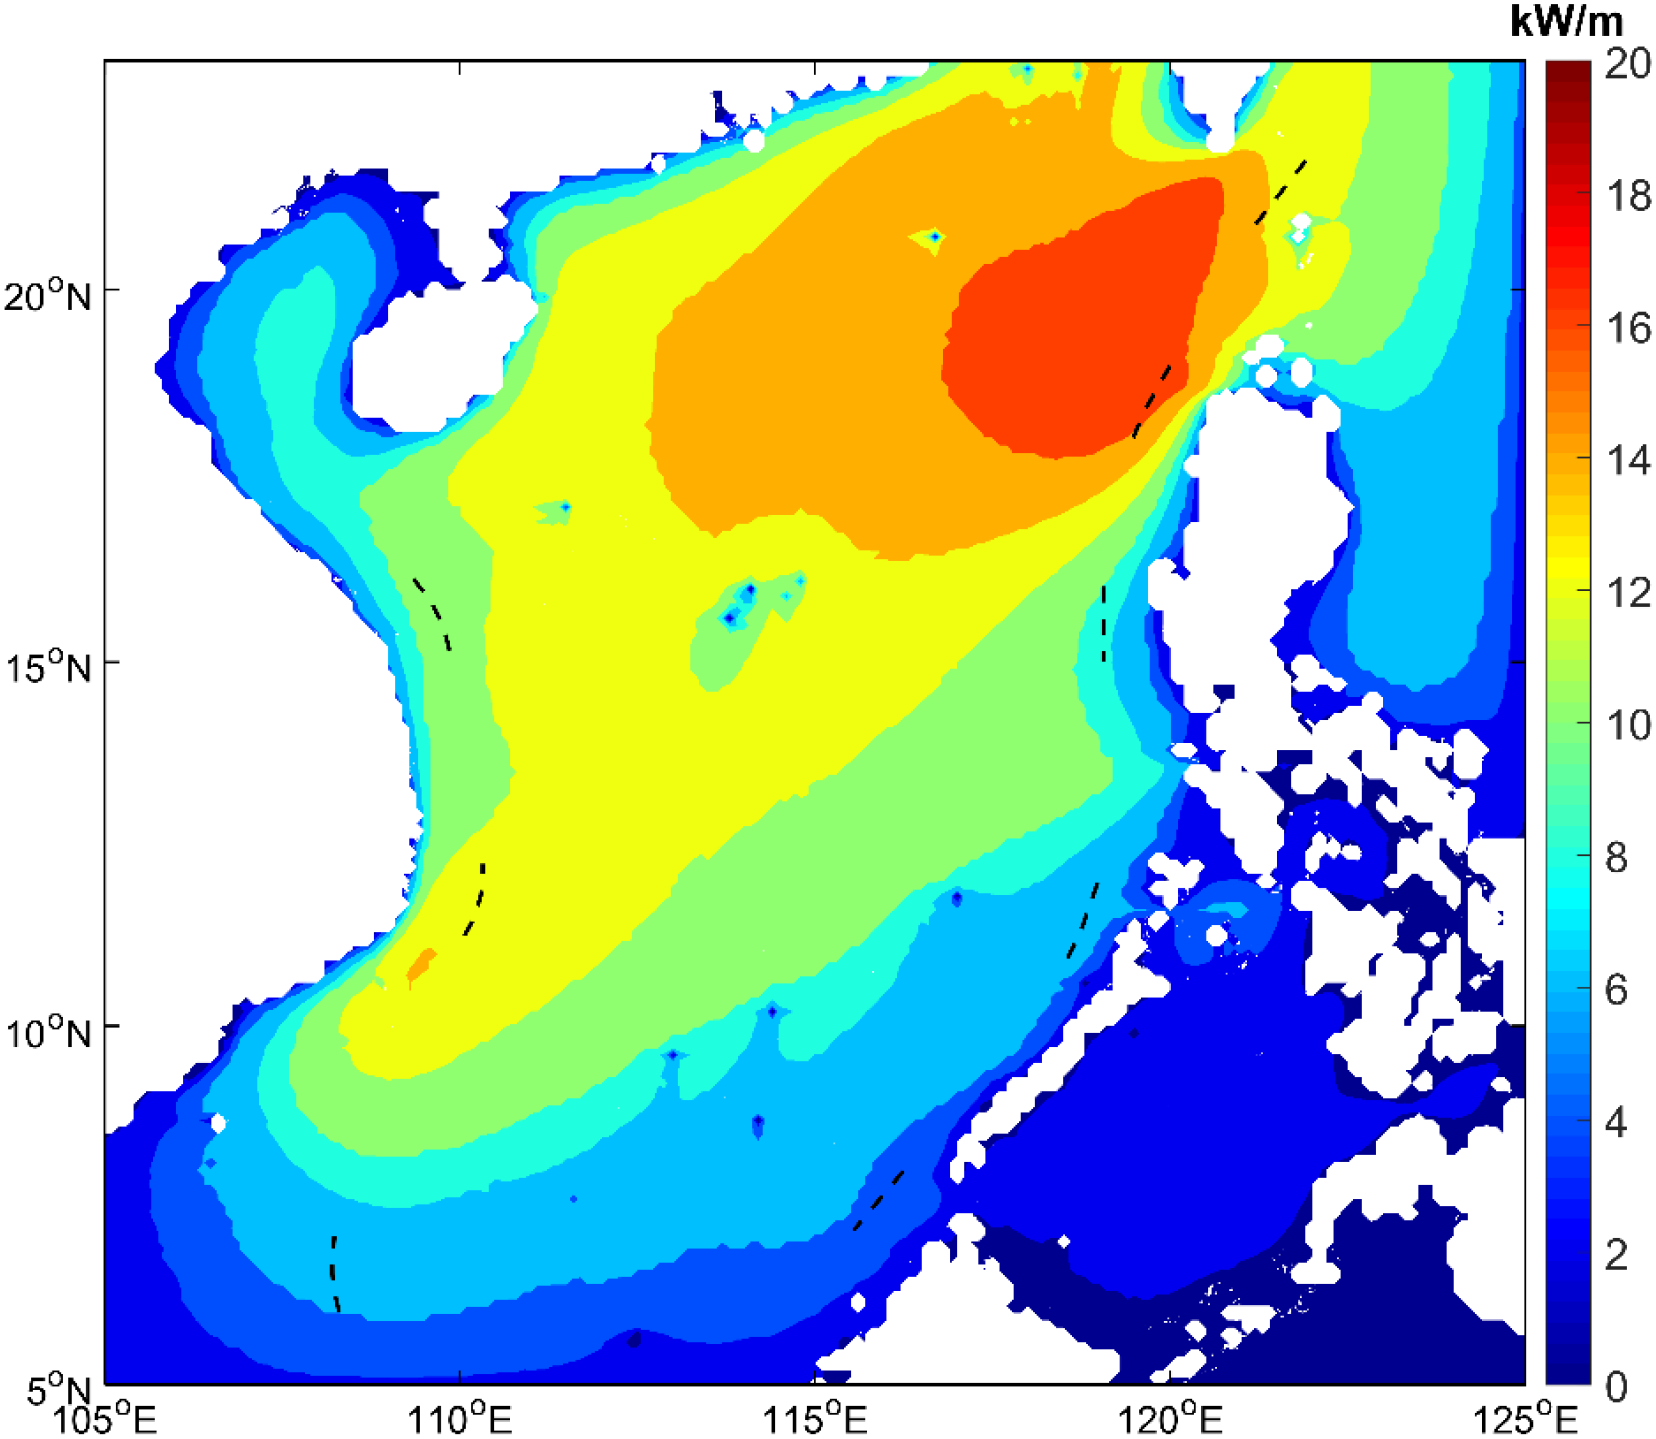
Spatial Distribution of Annual Mean Wave Energy in the South China Sea.
As shown in Figure 12, the overall distribution of annual average wave energy density is the smallest in the Bohai Sea, followed by the Yellow Sea, and the largest in the East China Sea. The wave energy density in the central Bohai Sea is relatively large, about 4kW/m, while in most coastal areas is below 2kW/m; In the Yellow Sea, the annual average wave energy flux gradually increases from north to south, in the sea area south of the Shandong Peninsula is above 4 kW/m, while that in the southernmost part of the Yellow Sea can reach 6~8 kW/m. In the East China Sea, the annual average wave energy flux increases from northwest to southeast, with most areas ranging between 8–13 kW/m. The highest values are found around Taiwan Island, reaching approximately 13 kW/m.
Figure 12
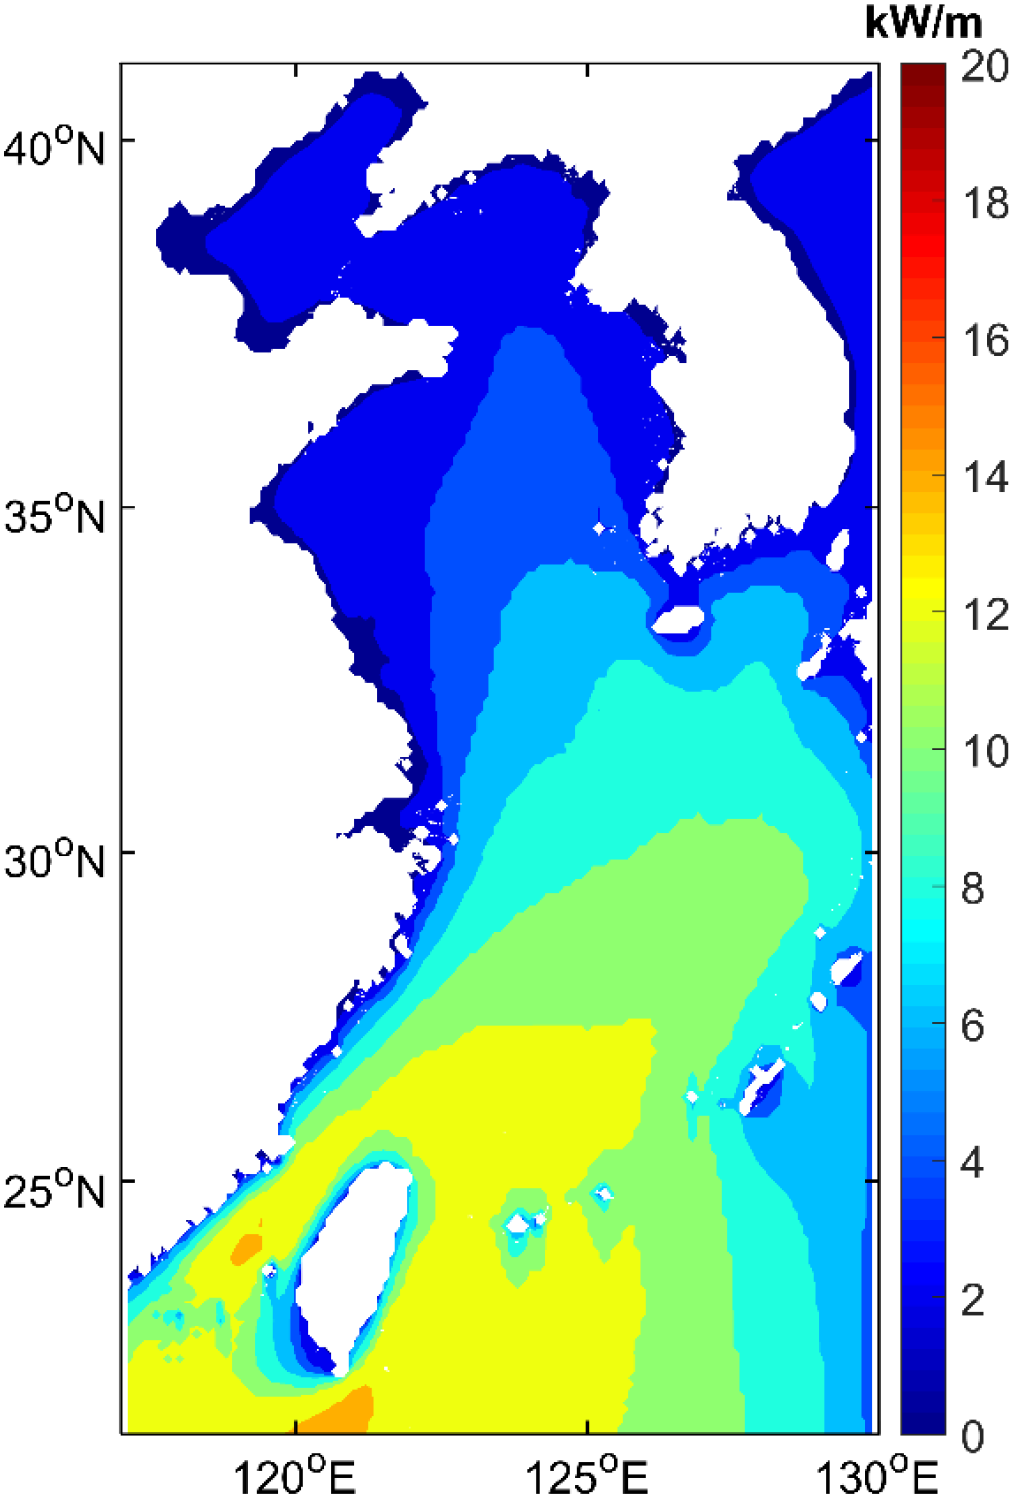
Spatial Distribution of Annual Mean Wave Energy in the Bohai Sea, Yellow Sea, and East China Sea.
4.2 Seasonal average characteristics of wave energy density
As shown in Figure 13, wave energy density is generally higher in winter and autumn than in spring and summer. Spring exhibits the lowest wave energy density, primarily below 7 kW/m, though most areas remain within exploitable ranges (values above 2 kW/m are typically considered usable). Summer’s higher values occur in the southeastern waters of Vietnam, reaching approximately 8 kW/m. In autumn, the high-value zones range from 10 to 18 kW/m, primarily distributed in the central and northern parts of the South China Sea. During winter, the high-value zones are concentrated across most of the South China Sea, ranging from approximately 12 to 30 kW/m and oriented in a northeast-southwest direction. This is presumably due to the large waves brought to the South China Sea by cold surges during the northeast monsoon period.
Figure 13
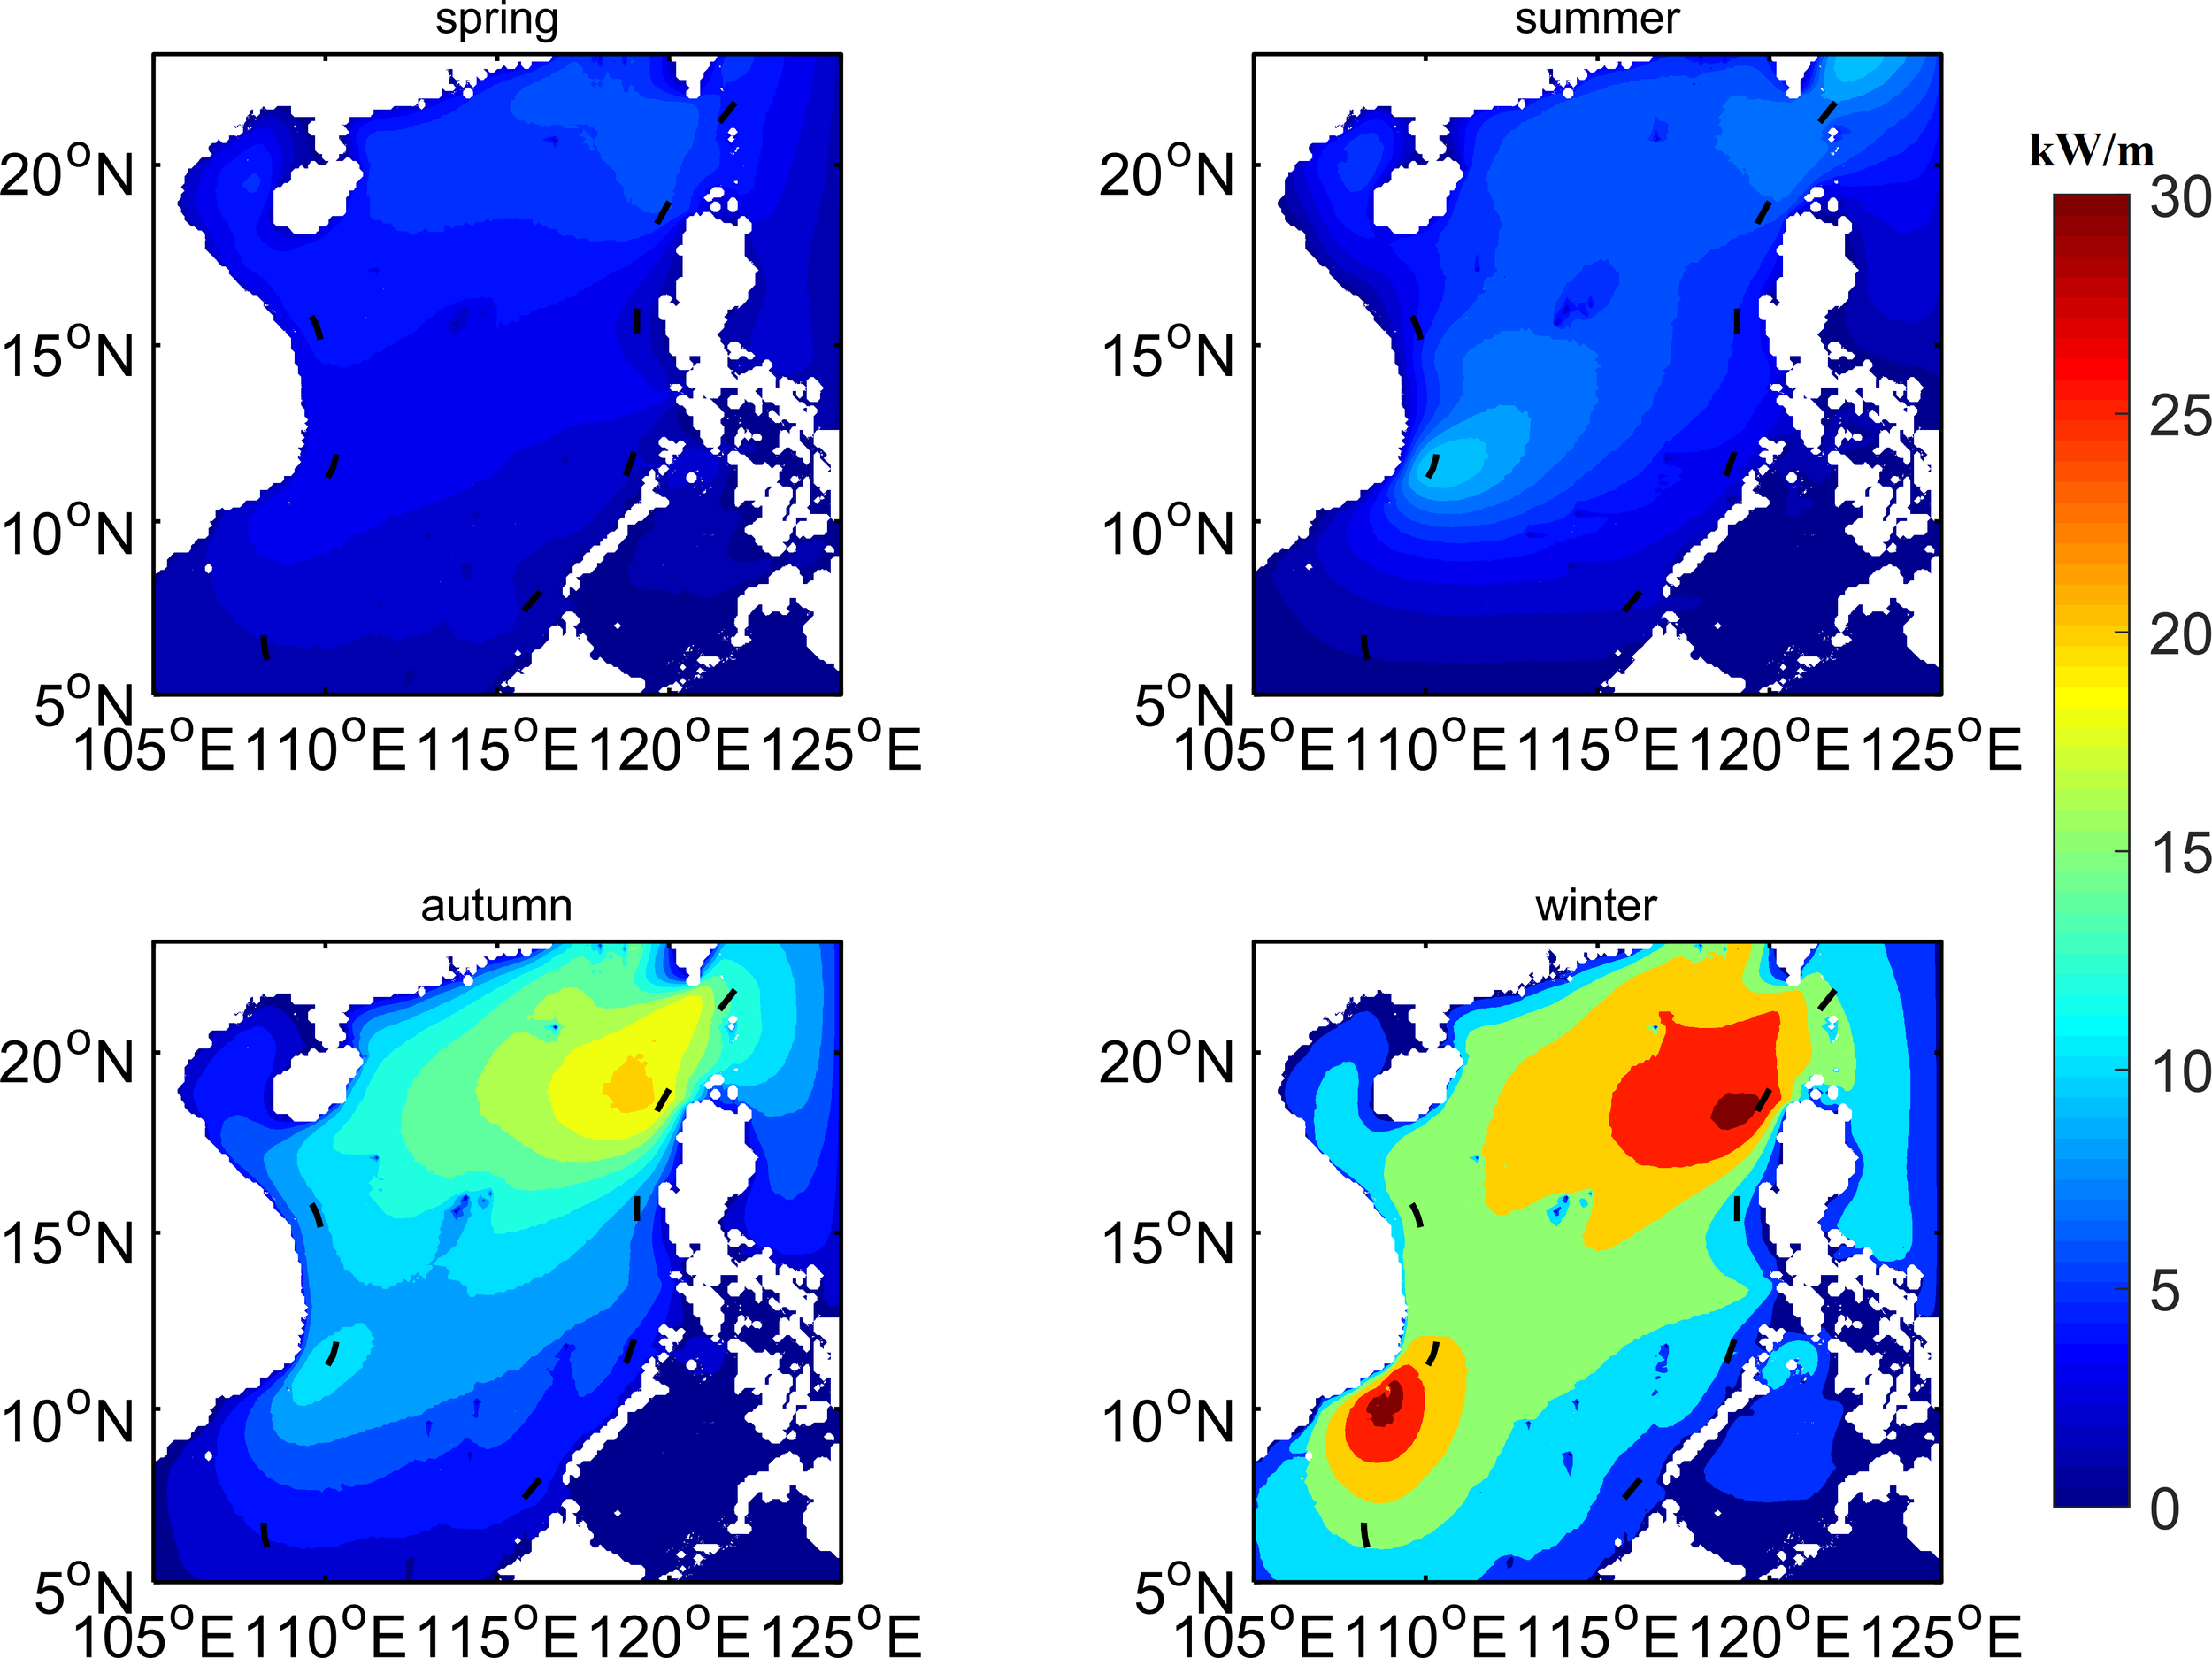
Spatial Distribution of Seasonal Mean Wave Energy in the South China Sea.
As shown in Figure 14, wave energy density in the Bohai Sea, Yellow Sea, and East China Sea is generally higher in winter and autumn than in spring and summer. The wave energy density in most areas of the Bohai Sea is below 3 kW/m in all four seasons. In the Yellow Sea, the distribution trend shows a gradual increase in seasonal mean wave energy from north to south. The maximum values in the central and southern Yellow Sea during spring and summer do not exceed 6 kW/m, while the southern can reach over 10 kW/m in winter. The seasonal average wave energy density in the East China Sea is higher than that in both the Yellow Sea and the Bohai Sea. During spring, most areas of the East China Sea is about 7 kW/m. In winter, the maximum wave energy density in the western and southern parts of the Taiwan Strait reaches 20 kW/m. Overall, the wave energy density in the open sea is greater than that near the coast, and the Bohai Sea with almost no development and utilization value.
Figure 14
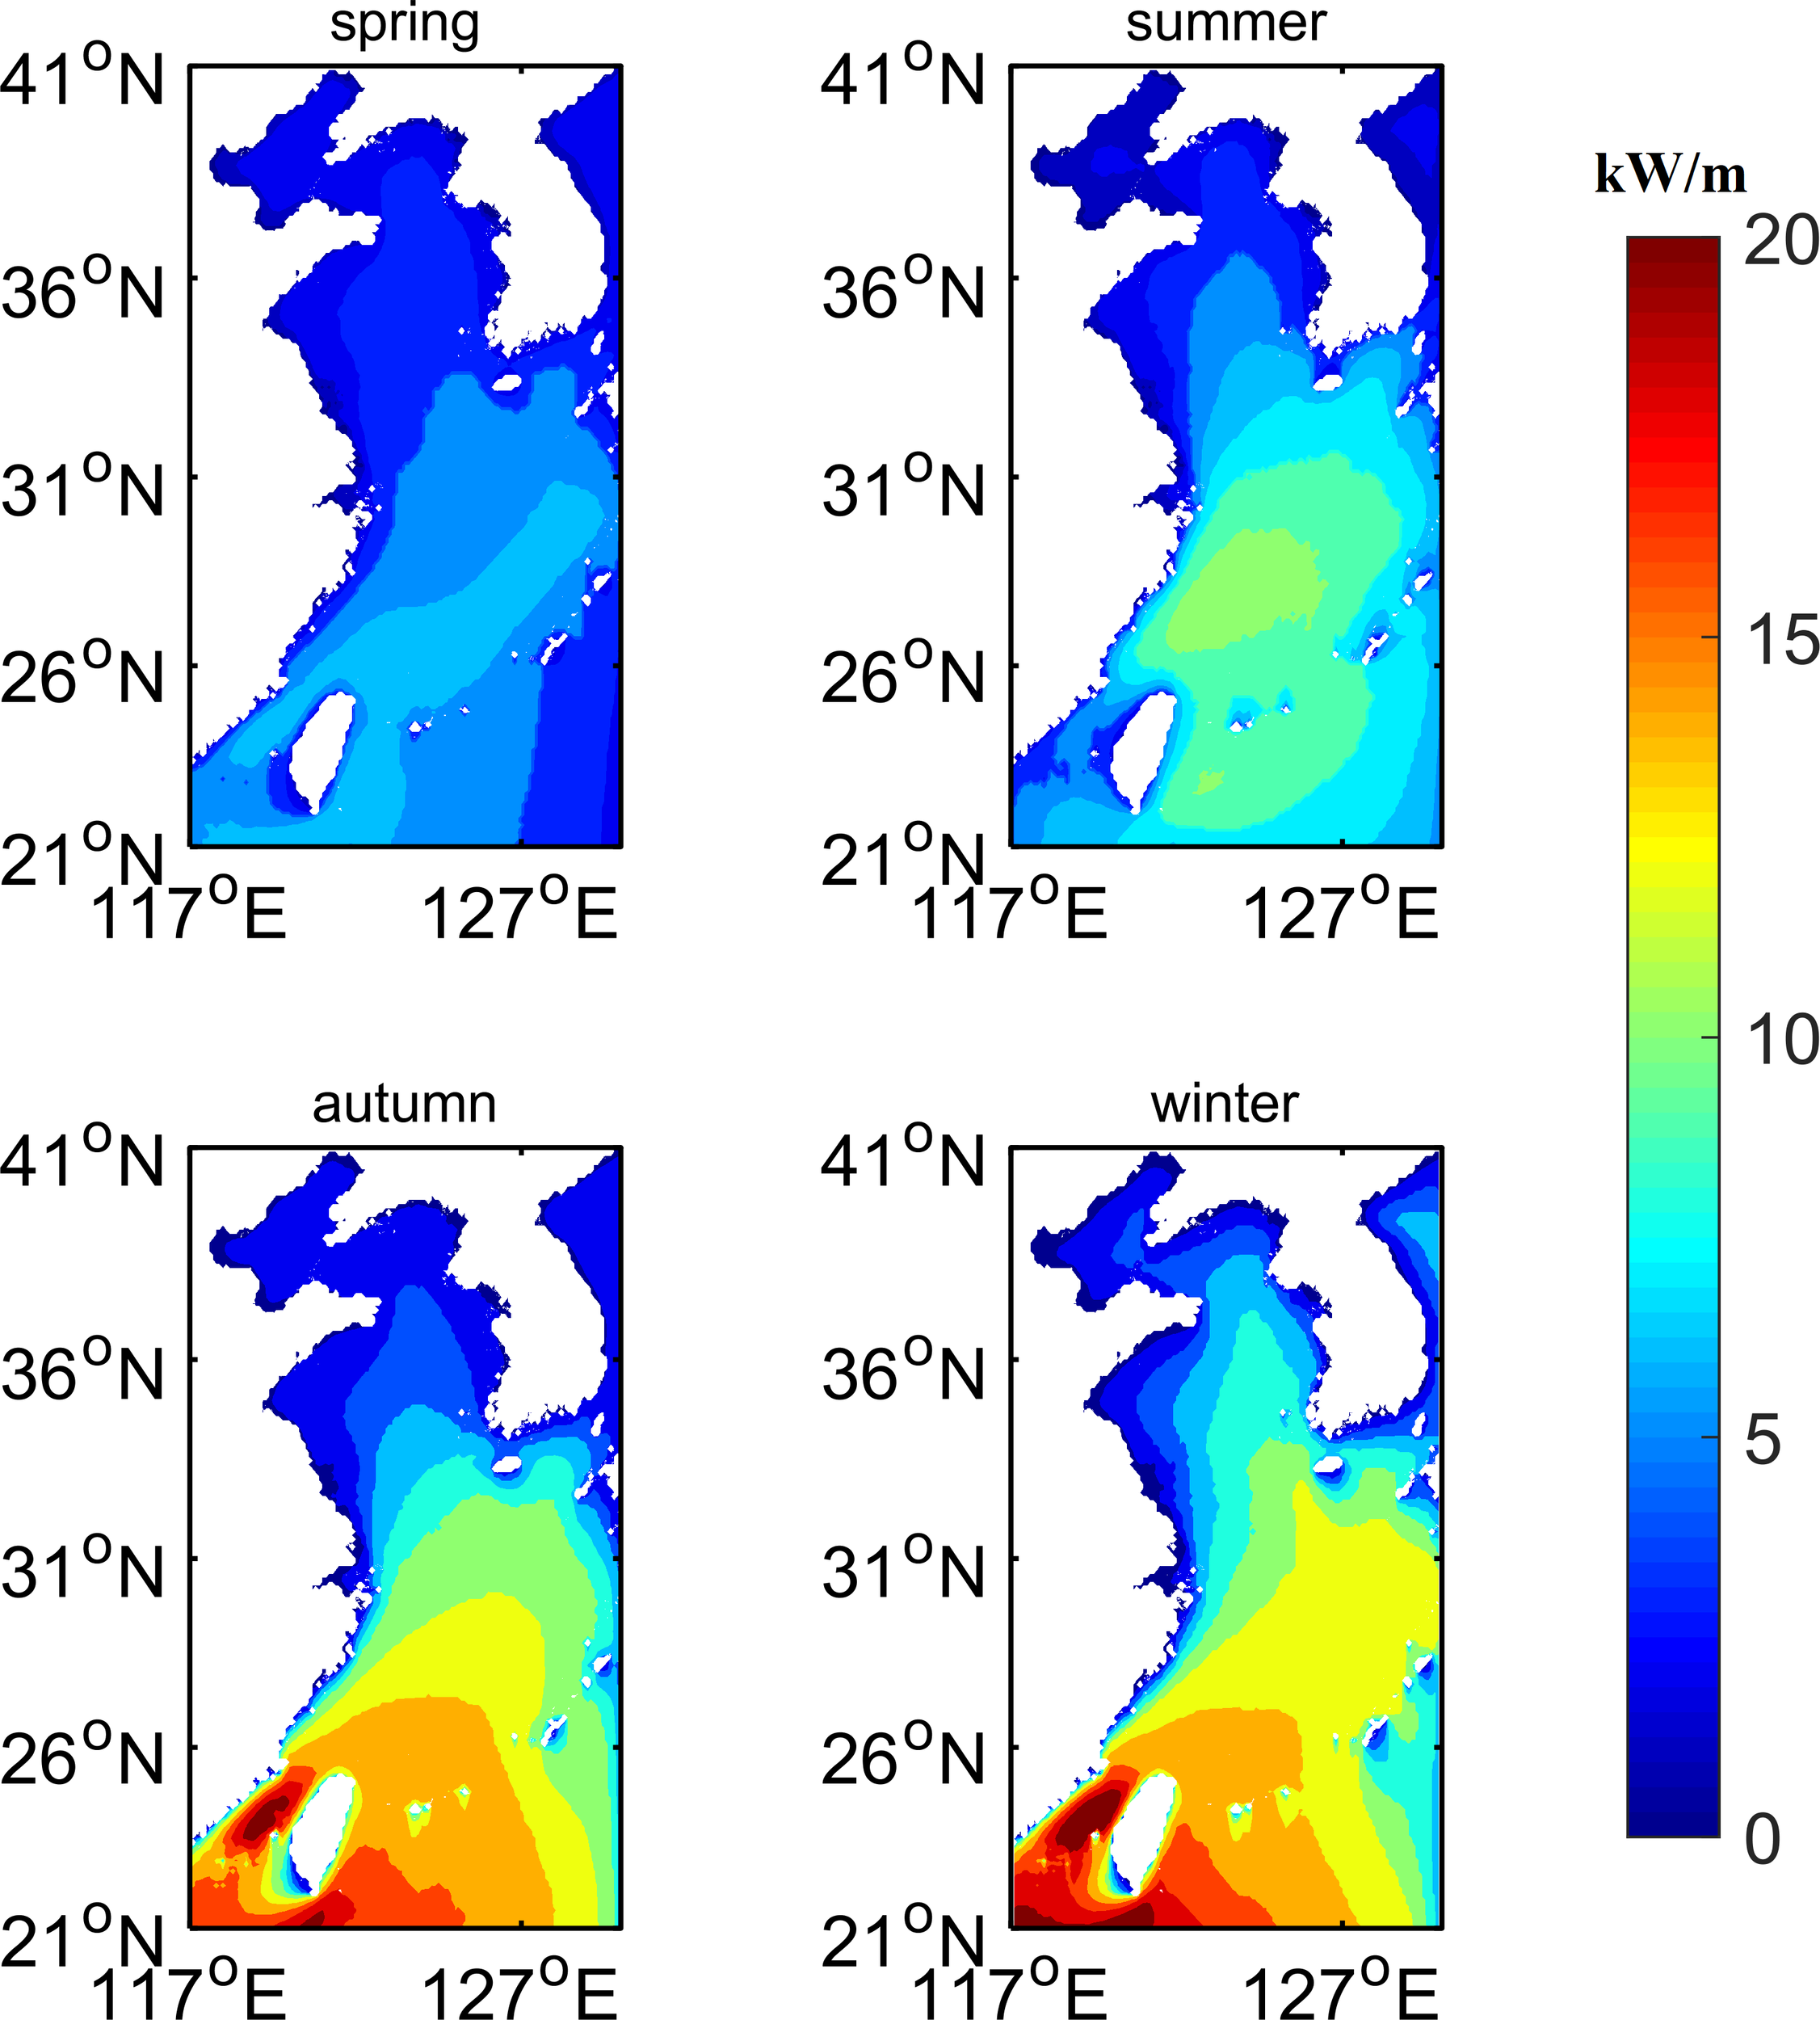
Spatial Distribution of Seasonal Mean Wave Energy in the Bohai Sea, Yellow Sea, and East China Sea.
4.3 Monthly average characteristics of wave energy density
The monthly average wave energy density distribution in the South China Sea is shown in Figure 15. The monthly average wave energy density is relatively high from November to February of the following year, primarily distributed between 10 and 30 kW/m, and in December, most areas exceed 30 kW/m. October follows with values primarily ranging from 5 to 20 kW/m², with higher concentrations in the central and northern regions. From March to September, wave energy density is lower, with generally below 10 kW/m².
Figure 15
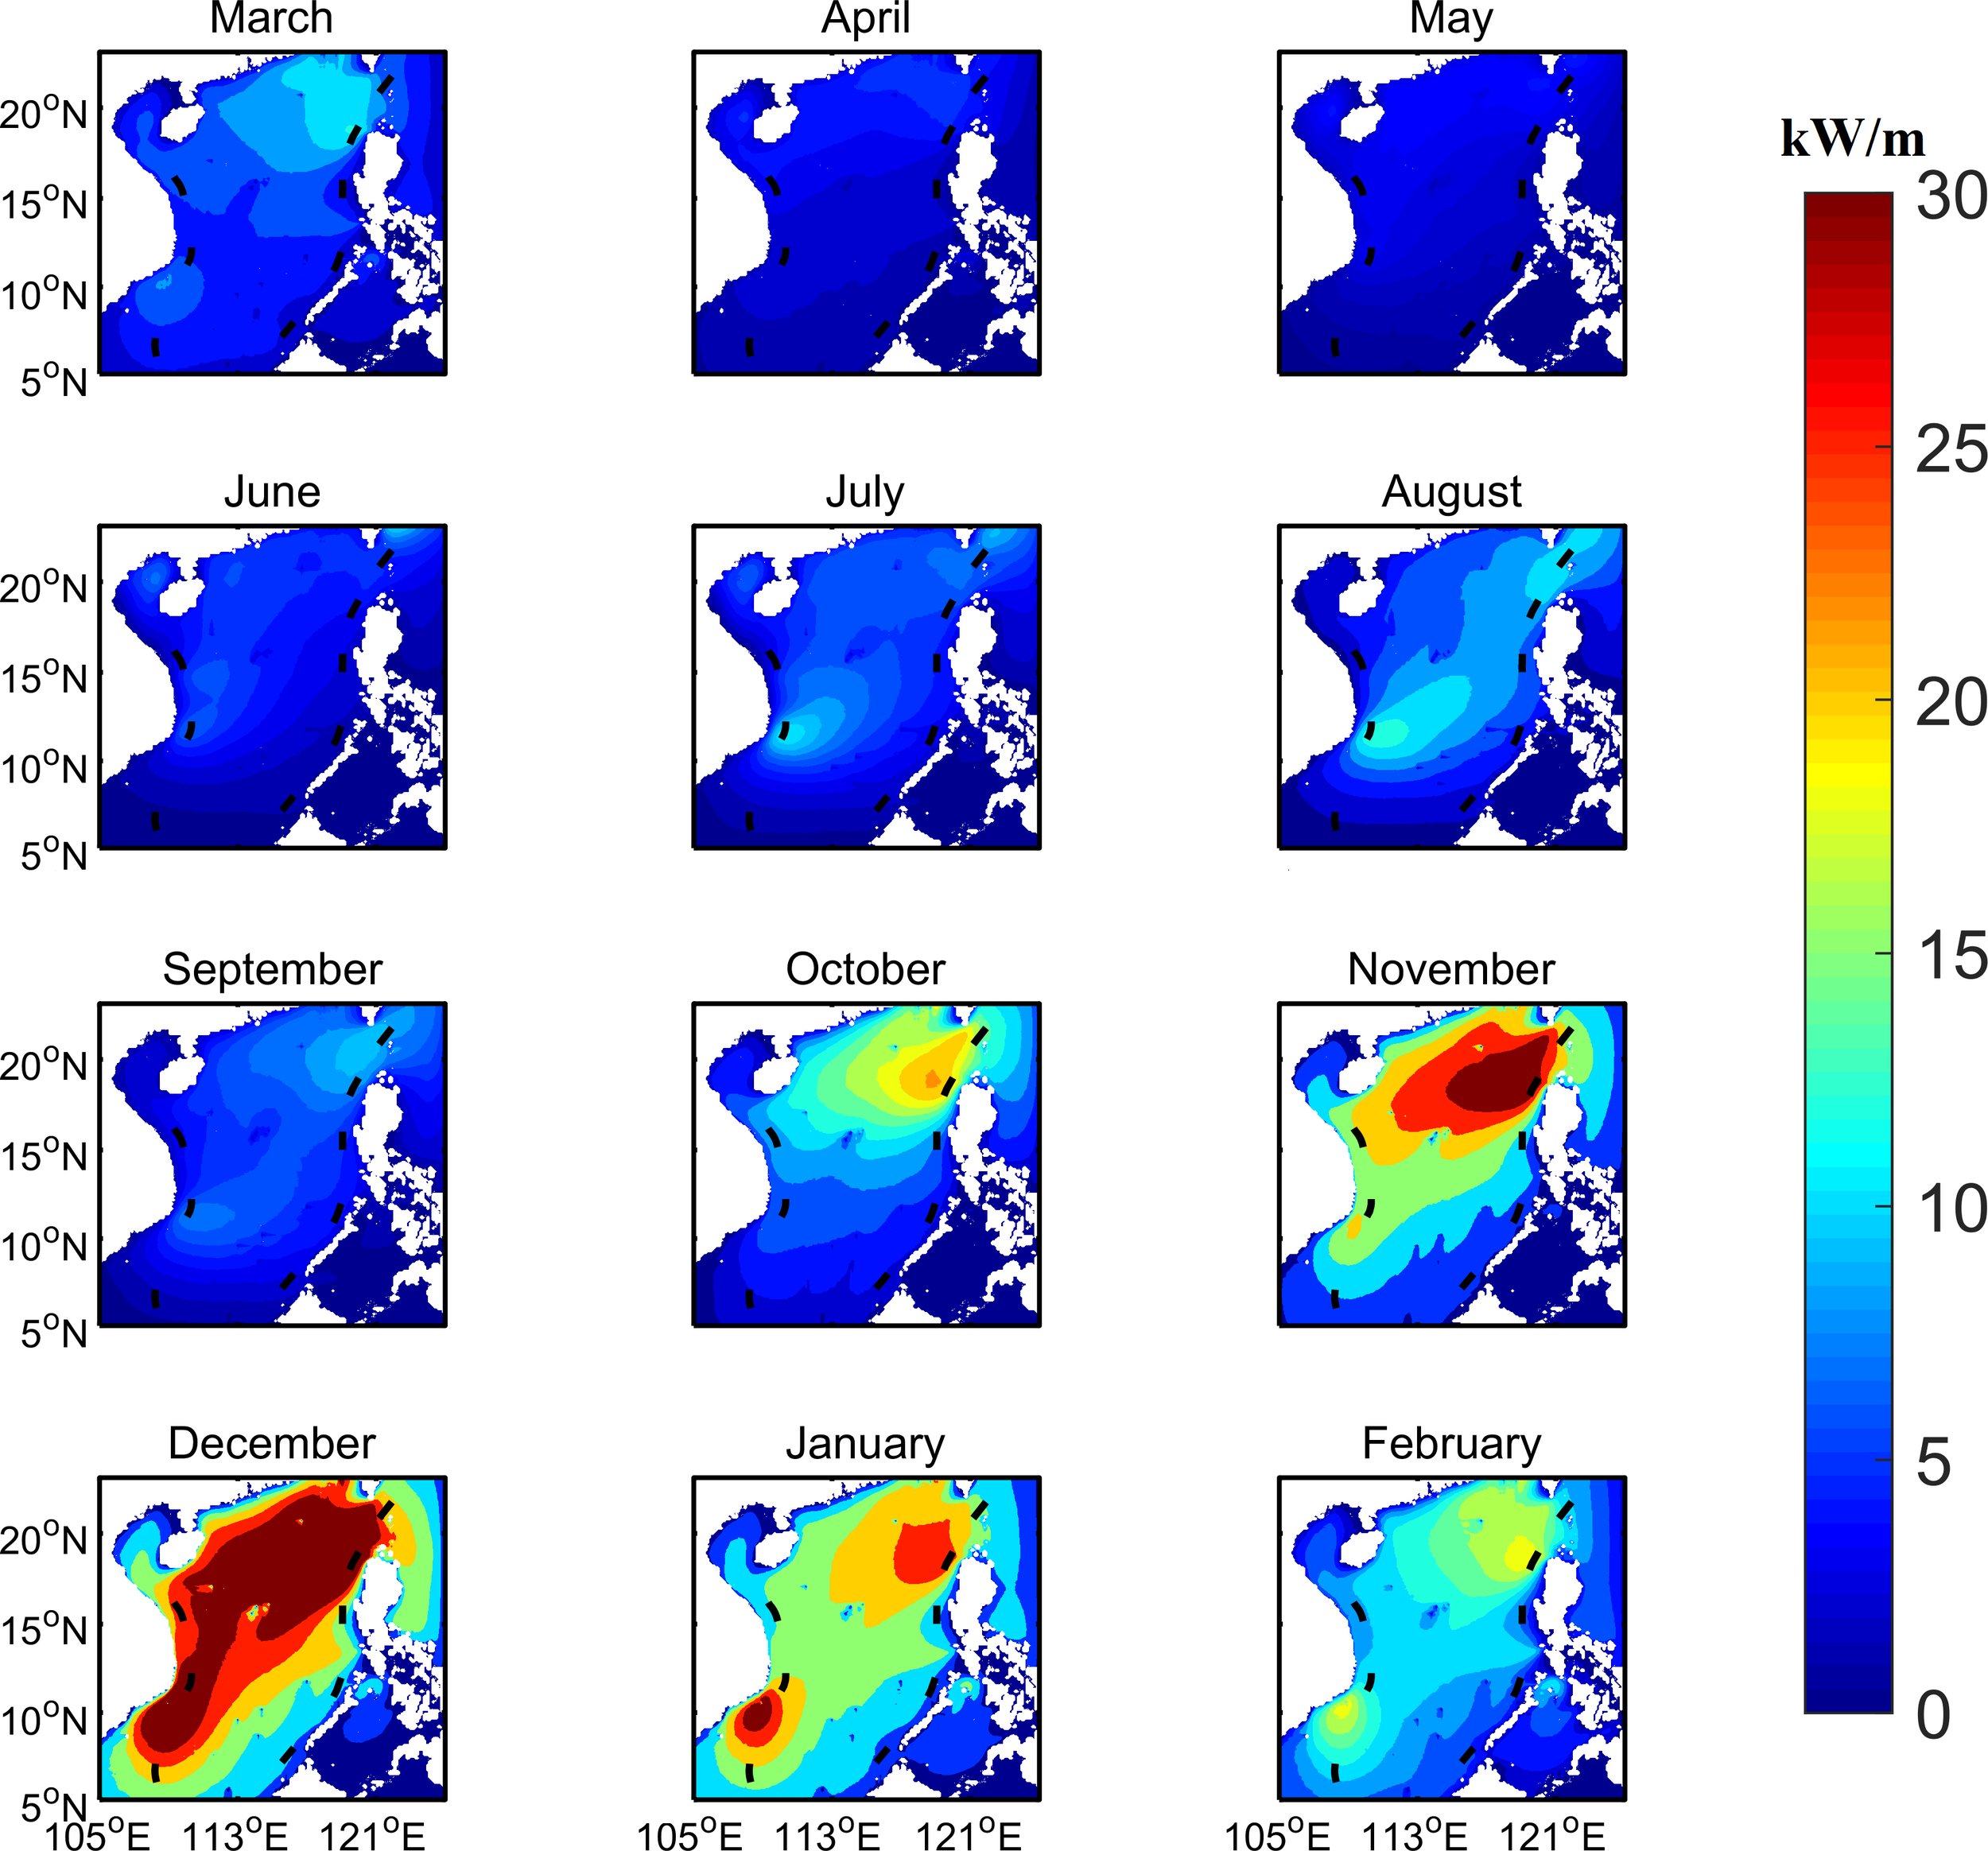
Spatial Distribution of Monthly Mean Wave Energy in the South China Sea.
The monthly average wave energy density distribution in the Bohai Sea, Yellow Sea, and East China Sea is shown in Figure 16. The monthly average wave energy density in the Bohai Sea is relatively low throughout the year, basically below 5 kW/m, and in the southern Yellow Sea is higher in December, with the maximum reaching 10 kW/m. The East China Sea exhibits lower wave energy from March to August, primarily ranging between 4 and 12 kW/m. while higher values occur from September to February, typically ranging from 9 to 16 kW/m. In January, most areas of the East China Sea exceed 10 kW/m, with regions surrounding Taiwan Island peaking at approximately 20 kW/m.
Figure 16
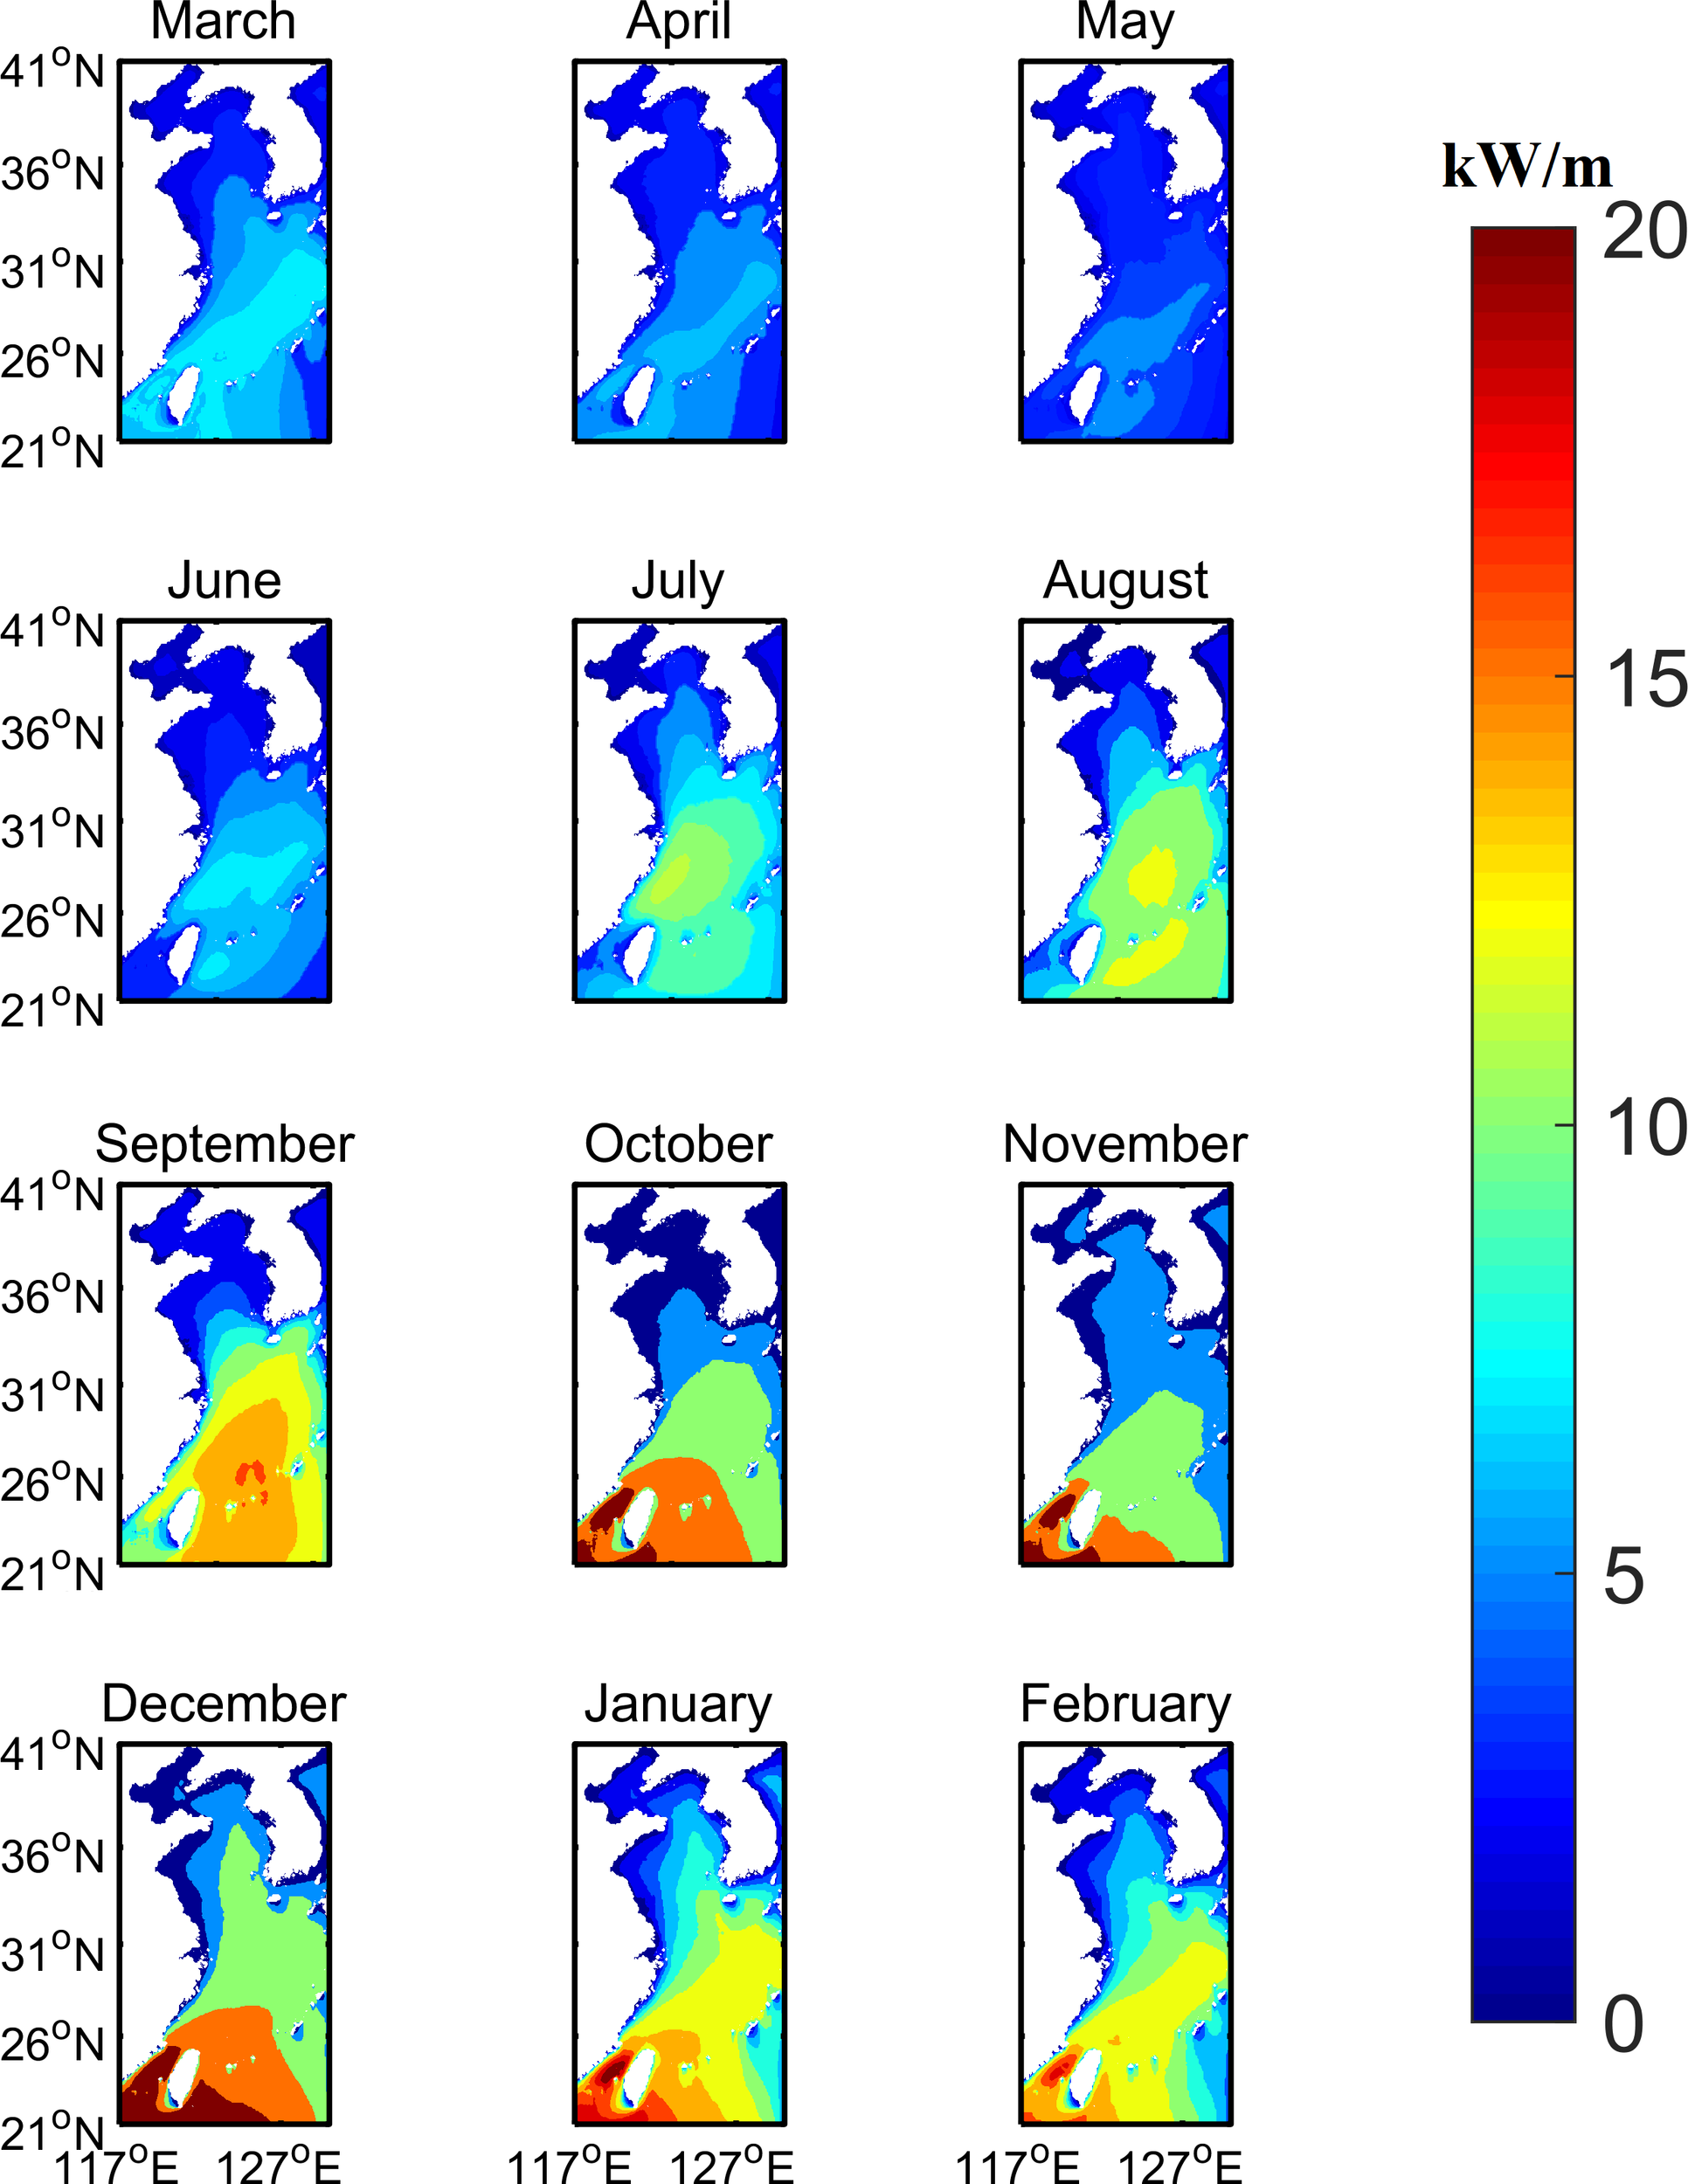
Spatial Distribution of Monthly Mean Wave Energy in the Bohai Sea, Yellow Sea, and East China Sea.
4.4 Wave energy assessment at characteristic points
To provide a more intuitive depiction of the status and directional characteristics of wave energy resources in the China Sea, six characteristic sites (P1 to P6) were selected across the Bohai Sea, Yellow Sea, East China Sea, and South China Sea. These points possess regional representativeness, enabling comparison of the spatiotemporal variations in wave energy resources across different sea areas; they are also located in zones of high wave energy flux density in their respective seas, allowing for the capture of typical resource characteristics. Among them, one characteristic point is located in the Bohai Sea, three in the Yellow Sea and East China Sea, and two in the South China Sea, the exact locations of these points are shown in Figure 1 (right). Resource analysis statistics were conducted on characteristic points. Wave energy density rose diagrams were plotted for 16 distinct directions and varying resource density energy level intervals, as shown in Figure 17.
Figure 17
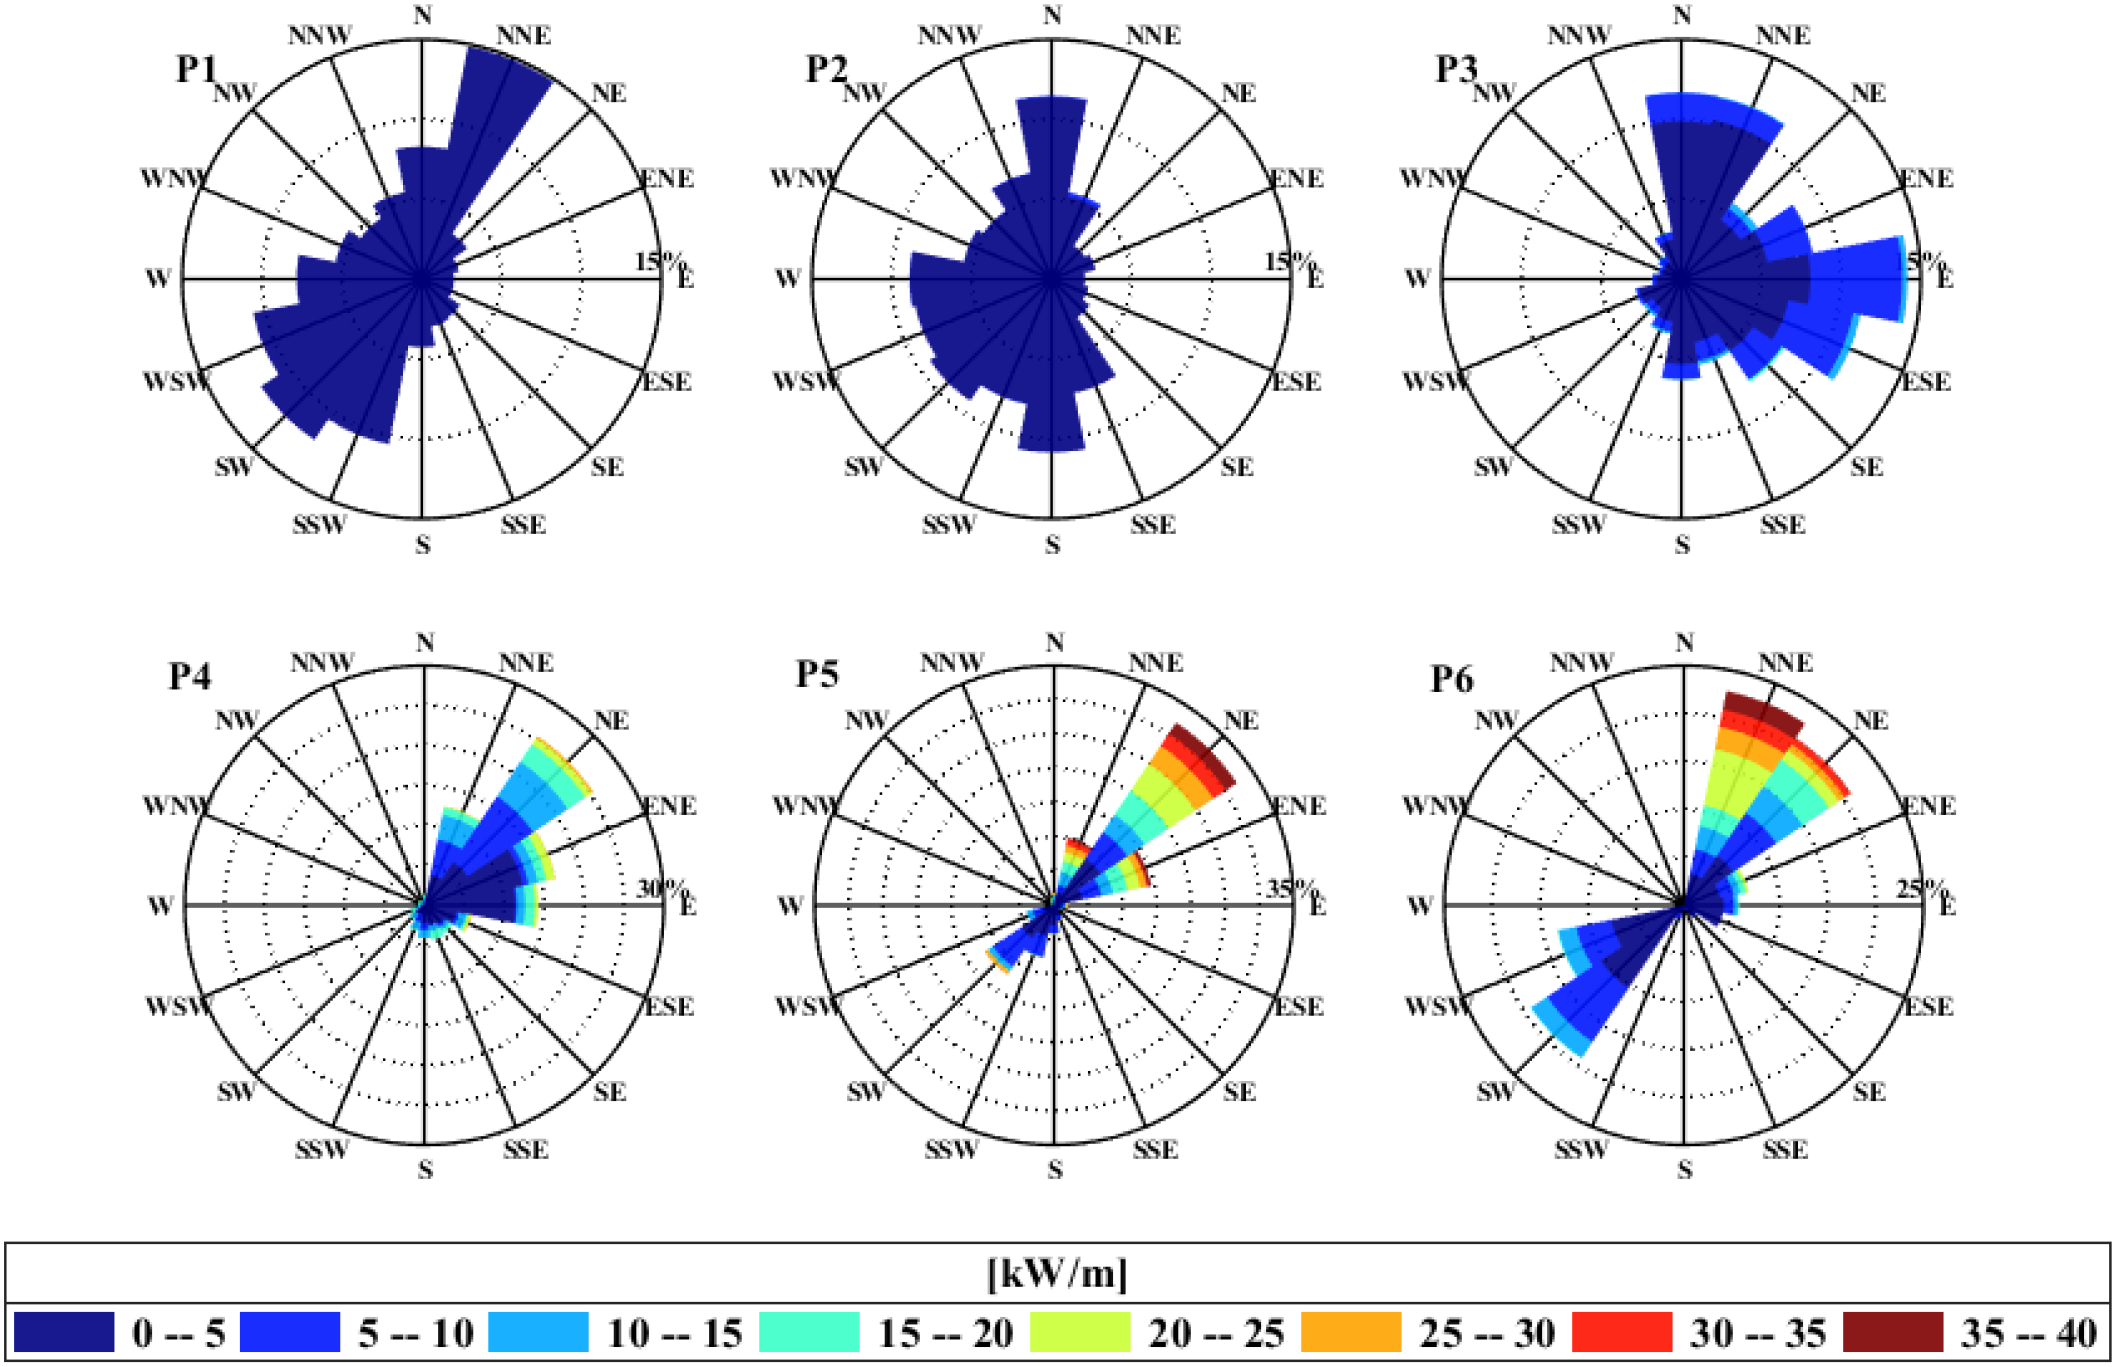
Rose Diagram of Wave Energy Density at Characteristic Points.
As shown in Figure 17, the wave energy density at P5 and P6 points in the South China Sea are significantly higher than that at other characteristic points (P1, P2, P3, P4). The dominant wave directions at P5 and P6 are predominantly NNE and NE, with frequency contributions exceeding 50%. The wave energy density ranges from 5 to 40 kW/m². At P4 within the Taiwan Strait, the dominant wave direction is NE, with ranging from 5 to 20 kW/m². The dominant wave directions at P3 are N and E, with wave energy density ranging from 2 to 10 kW/m². The wave energy density levels at P1 and P2 are significantly lower, with below 5 kW/m². Overall, during actual development, the relatively favorable locations P4-P6 should be prioritized for consideration.
To further analyze wave energy characteristics, this section combines scatter plots with wave energy density maps to illustrate the relationship between wave height, period, and their occurrence frequency, as shown in Figure 18. The horizontal axis represents wave energy density periods ranging from 0 to 15 seconds in 1-second intervals, while the vertical axis denotes significant wave height spanning 0 to 12 meters in 1-meter increments. The black numbers within boxes indicate the number of occurrences where both significant wave height and wave energy density period coincide within that interval. The curves represent wave energy density contour lines calculated using Equation 3, with colors ranging from blue to yellow indicating the percentage of total wave energy within that interval. This reveals that wave energy is primarily distributed in the range of wave energy density periods (1–10 s) and significant wave heights (0–5 m). Since the vertical axis represents significant wave height, values closer to the top of the image correspond to larger significant wave heights. As seen in Equation 3, larger significant wave heights correspond to higher wave energy density. However, due to their infrequent occurrence, they contribute a relatively small proportion to total wave energy.
Figure 18
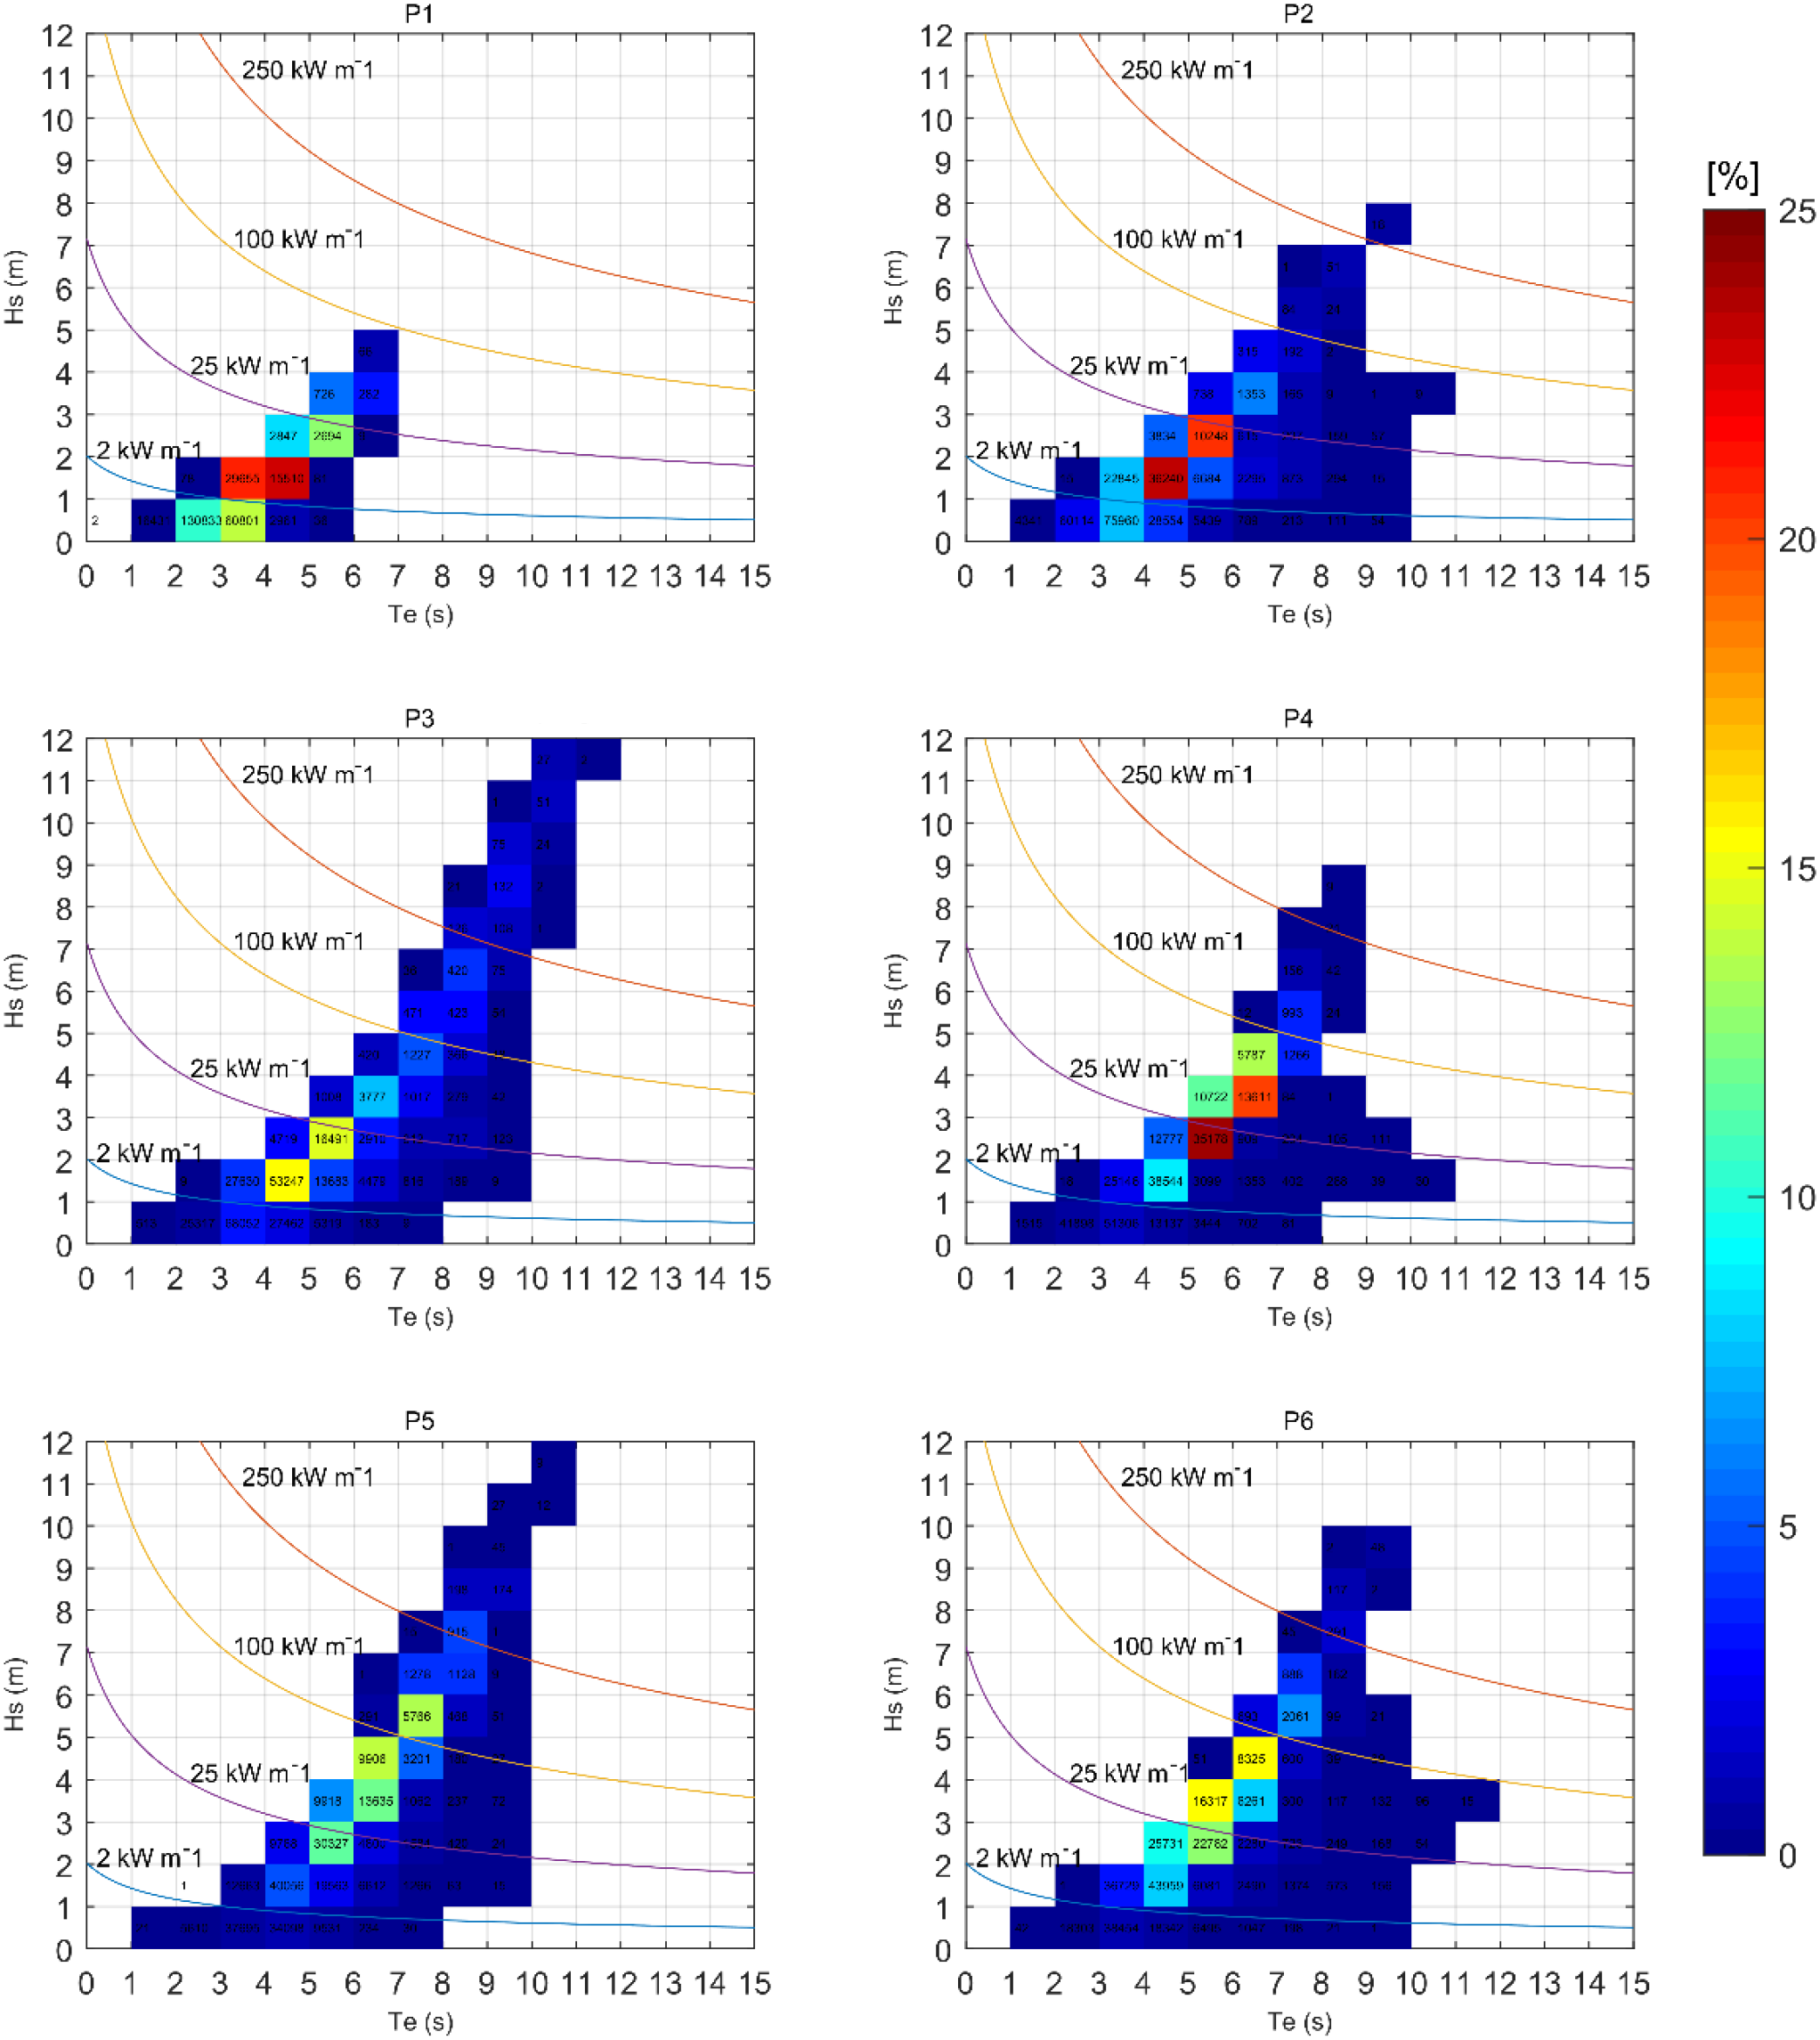
Combined Distribution Map of Wave Energy Density Period and Significant Wave Height at Six Characteristic Points.
5 Conclusions
This study utilizes ERA5 reanalysis wind field data to drive the SWAN numerical wave model, generating 30 years of wave data for the computational region (105–130°E, 5–41°N). Based on this data, it analyzes wave characteristics and wave energy resources in the China sea, aiming to provide scientific decision-making support for the rational development and utilization of wave energy. Through analysis of the results, the main conclusions are as follows:
-
Annual mean wave heights in most areas of the Bohai Sea are below 0.8 m and in most areas of the Yellow Sea, it ranges from approximately 0.8 to 1.2 m. In the East China Sea, annual mean wave heights gradually increase from northeast to southwest, with most areas exhibiting between 1.2 and 1.6 m, it is higher around Taiwan Island, reaching over 1.6 m. Seasonal wave height distribution generally shows higher values in autumn and winter and lower values in spring and summer. The wave height reaches its maximum in winter, with the central Bohai Sea reaching 1.1m, the southernmost part of the Yellow Sea exceeding 1.6m, and the East China Sea ranging from 1.5 to 2m. The annual mean significant wave height in the South China Sea generally decreases from northeast to southwest, ranging from 1.2 to 2.0 meters and the large values occur in winter, reaching up to 2.8 meters.
-
Regarding the characteristics of wave energy in China’s sea areas, in the open sea is more abundant than that near the coast. Except for the Bohai Sea and the northern Yellow Sea, most sea areas are high-frequency with wave energy density above 4 kW/m, and the northern South China Sea is a relatively high-frequency area with above 10 kW/m all year round. The wave energy density exhibits distinct seasonal characteristics: it possesses the most abundant resources in winter, followed by autumn, and spring has the least due to weak winds.
-
The rose diagram of wave energy density plotted from characteristic points indicates that wave energy resources are relatively scarce in the Bohai Sea and Yellow Sea, while resources at points in the South China Sea and Taiwan Strait are comparatively abundant. Influenced by the northeast monsoon, the predominant direction of wave energy at most points in the region is east-northeast. The combined distribution map of wave energy density period and significant wave height indicates that wave energy density is primarily distributed in the range of wave periods between 1 and 10 seconds and significant wave heights between 0 and 5 meters.
Statements
Data availability statement
The raw data supporting the conclusions of this article will be made available by the authors, without undue reservation.
Author contributions
YW: Writing – original draft, Conceptualization, Methodology, Validation, Software, Funding acquisition, Formal analysis. QZ: Writing – original draft, Validation, Visualization, Funding acquisition, Investigation. WJ: Writing – review & editing, Investigation, Visualization,Resources, Data curation. YB: Writing – review & editing, Methodology, Supervision, Validation, Investigation. HW: Writing – review & editing, Supervision, Project administration, Investigation, Visualization, Resources.
Funding
The author(s) declared that financial support was received for this work and/or its publication. This study was financially supported by the National Key Research and Development Program of China (2023YFC3106901).
Conflict of interest
The author(s) declared that this work was conducted in the absence of any commercial or financial relationships that could be construed as a potential conflict of interest.
Generative AI statement
The author(s) declared that generative AI was not used in the creation of this manuscript.
Any alternative text (alt text) provided alongside figures in this article has been generated by Frontiers with the support of artificial intelligence and reasonable efforts have been made to ensure accuracy, including review by the authors wherever possible. If you identify any issues, please contact us.
Publisher’s note
All claims expressed in this article are solely those of the authors and do not necessarily represent those of their affiliated organizations, or those of the publisher, the editors and the reviewers. Any product that may be evaluated in this article, or claim that may be made by its manufacturer, is not guaranteed or endorsed by the publisher.
References
1
Clément A. McCullen P. Falcão A. Fiorentino A. Gardner F. Hammarlund K. et al . (2002). Wave energy in Europe: current status and perspectives. Renewable Sustain. Energy Rev.6, 405–431. doi: 10.1016/S1364-0321(02)00009-6
2
Henfridsson U. Neimane V. Strand K. Kapper R. Bernhoff H. Danielsson O. et al . (2007). Wave energy potential in the Baltic Sea and the Danish part of the North Sea, with reflections on the Skagerrak. Renewable Energy32, 2069–2084. doi: 10.1016/j.renene.2006.10.006
3
Hersbach H. Bell B. Berrisford P. Hirahara S. Horányi A. Muñoz-Sabater J. et al . (2020). The ERA5 global reanalysis. Q. J. R. Meteorol. Soc.146, 1999–2049. doi: 10.1002/qj.3803
4
Huang X. Tang J. Shen Y. (2024a). Long time series of ocean wave prediction based on PatchTST model. Ocean Eng.301, 117572. doi: 10.1016/j.oceaneng.2024.117572
5
Huang X. Tang J. Shen Y. Zhang C. (2024b). An AI model for predicting the spatiotemporal evolution process of coastal waves by using the Improved-STID algorithm. Appl. Ocean Res.153, 104299. doi: 10.1016/j.apor.2024.104299
6
Jiang S. Shu X. Wang Q. Yan Z. (2021). Evolution characteristics of wave energy resources in Guangdong coastal area based on long time series ERA-interim reanalysis data. Mar. Sci. Bull.2021, 550–558.
7
Leijon M. Bernhoff H. Berg M. Ågren O. (2003). Economical considerations of renewable electric energy production—especially development of wave energy. Renewable Energy28, 1201–1209. doi: 10.1016/S0960-1481(02)00157-X
8
López I. Pereiras B. Castro F. Iglesias G. (2014). Optimisation of turbine-induced damping for an OWC wave energy converter using a RANS–VOF numerical model. Appl. Energy127, 105–114.
9
López-Ruiz A. Bergillos R. J. Raffo-Caballero J. M. Ortega-Sánchez M. (2018). Towards an optimum design of wave energy converter arrays through an integrated approach of life cycle performance and operational capacity. Appl. Energy209, 20–32. doi: 10.1016/j.apenergy.2017.10.062
10
Mahmoodi K. Ghassemi H. Razminia A. (2019). Temporal and spatial characteristics of wave energy in the Persian Gulf based on the ERA5 reanalysis dataset. Energy187, 115991. doi: 10.1016/j.energy.2019.115991
11
Medina-López E. Bergillos R. J. Moñino A. Clavero M. Ortega-Sánchez M. (2017). Effects of seabed morphology on oscillating water column wave energy converters. Energy135, 659–673. doi: 10.1016/j.energy.2017.06.165
12
Medina-López E. Moñino A. Bergillos R. J. Clavero M. Ortega-Sánchez M. (2019). Oscillating water column performance under the influence of storm development. Energy166, 765–774. doi: 10.1016/j.energy.2018.10.108
13
Ou S. H. Liau J. M. Hsu T. W. Tzang S. Y. (2002). Simulating typhoon waves by SWAN wave model in coastal waters of Taiwan. Ocean Eng.29, 947–971. doi: 10.1016/S0029-8018(01)00049-X
14
Panicker N. N. (1977). Power resource estimate of ocean surface waves: Closure. Ocean Eng.4, 213. doi: 10.1016/0029-8018(77)90025-7
15
Reguero B. G. Losada I. J. Méndez F. J. (2015). A global wave power resource and its seasonal, interannual and long-term variability. Appl. Energy148, 366–380. doi: 10.1016/j.apenergy.2015.03.114
16
Rusu L. Soares C. G. (2011). Modelling the wave–current interactions in an offshore basin using the SWAN model. Ocean Eng.38, 63–76. doi: 10.1016/j.oceaneng.2010.09.012
17
Sun P. Xu B. Wang J. (2022). Long-term trend analysis and wave energy assessment based on ERA5 wave reanalysis along the Chinese coastline. Appl. Energy324, 119709. doi: 10.1016/j.apenergy.2022.119709
18
Vannucchi V. Cappietti L. (2016). Wave energy assessment and performance estimation of state of the art wave energy converters in Italian hotspots. Sustainability8, 1300. doi: 10.3390/su8121300
19
Wan Y. Zhang J. Meng J. Wang J. (2015). Exploitable wave energy assessment based on ERA-Interim reanalysis data–A case study in the East China Sea and the South China Sea. Acta Oceanol. Sin.34, 143–155. doi: 10.1007/s13131-015-0641-8
20
Ye Q. Yang Z. Bao M. Shi W. Shi H. You Z. et al . (2022). Distribution characteristics of wave energy in the Zhe-Min coastal area. Ocean Eng.41, 163–172. doi: 10.1007/s13131-021-1859-2
21
Zheng C. Su Q. Liu T. (2013). Wave energy resources assessment and dominant area evaluation in the China sea from 1988 to 2010. Haiyang Xuebao35, 104–111.
22
Zijlema M. van der Westhuysen A. J. (2005). On convergence behaviour and numerical accuracy in stationary SWAN simulations of nearshore wind wave spectra. Coast. Eng.52, 237–256. doi: 10.1016/j.coastaleng.2004.12.006
Summary
Keywords
numerical simulation, SWAN, the China Sea, wave characteristics, wave energy assessment
Citation
Wu Y, Zhou Q, Jiang W, Bai Y and Wu H (2026) Wave characteristics and wave energy resource assessment of the waters bordering China. Front. Mar. Sci. 13:1777065. doi: 10.3389/fmars.2026.1777065
Received
29 December 2025
Revised
28 January 2026
Accepted
30 January 2026
Published
18 February 2026
Volume
13 - 2026
Edited by
Zhenjun Zheng, Hainan University, China
Reviewed by
Yanli He, Guangdong Ocean University, China
Xinyu Huang, Dalian University of Technology, China
Updates
Copyright
© 2026 Wu, Zhou, Jiang, Bai and Wu.
This is an open-access article distributed under the terms of the Creative Commons Attribution License (CC BY). The use, distribution or reproduction in other forums is permitted, provided the original author(s) and the copyright owner(s) are credited and that the original publication in this journal is cited, in accordance with accepted academic practice. No use, distribution or reproduction is permitted which does not comply with these terms.
*Correspondence: He Wu, wh_crane@163.com
Disclaimer
All claims expressed in this article are solely those of the authors and do not necessarily represent those of their affiliated organizations, or those of the publisher, the editors and the reviewers. Any product that may be evaluated in this article or claim that may be made by its manufacturer is not guaranteed or endorsed by the publisher.