Abstract
Rivers serve as critical conduits for transporting pollutants and nutrients to coastal zones, directly influencing coastal ecosystem functions and marine environmental health. Understanding spatiotemporal variations and driving mechanisms of river water quality is therefore critical for effective watershed management and coastal zone protection. This study analyzed water quality data from three monitoring sections (Suqiao, Xialiang Village, and Longxi) along the Luoqing River in Guilin, China, collected during January 2023–March 2025. Seven conventional parameters—water temperature, pH, dissolved oxygen (DO), permanganate index (CODMn), total nitrogen (TN), total phosphorus (TP), and ammonia nitrogen (NH3-N)—were evaluated using Spearman correlation analysis, principal component analysis (PCA), and machine learning models (CatBoost, Random Forest, and XGBoost). The results showed pronounced monthly variability but relatively stable interannual patterns, indicating dominant control by seasonal hydrological and biogeochemical processes. Spatial differences were evident, with downstream sections exhibiting higher pollution levels and more complex parameter interactions, reflecting intensified anthropogenic influences. PCA extracted two principal components explaining over 70% of the total variance: PC1 associated with nutrient and organic pollution (TN, TP, NH3-N, CODMn) and PC2 representing physicochemical conditions (pH and DO). A Composite Pollution Index (CPI) was constructed based on NH3-N, TN, TP and CODMn to characterize overall pollution levels. Machine learning models achieved high predictive performance for the CPI (R2 ≈ 0.994). The shapley Additive Explanations (SHAP) and partial dependence analyses identified TN as the primary controlling factor, with synergistic enhancement between TN and CODMn under high nitrogen conditions. Overall, Luoqing River water quality is characterized by a nitrogen-centered pollution structure, providing a scientific basis for targeted watershed management and coastal ecosystem protection.
1 Introduction
The Luoqing River constitutes a vital riverine ecosystem and key ecological functional zone within Guilin City, Guangxi Zhuang Autonomous Region, southwestern China, which serving multiple purposes including regional drinking water supply, ecological conservation, and landscape services. As a tributary of the Liujiang River, the Luoqing River forms part of the Pearl River Basin, where cumulative nutrient inputs from numerous tributaries are ultimately transported to the South China Sea. Effective pollution control in upstream tributaries is therefore fundamental to reducing basin-scale nutrient loading. In recent years, accelerated urbanization, intensified agricultural activities and increased human activity have placed mounting pressure on the river’s aquatic environment, with documented exceedances of nitrogen standards in multiple monitoring campaigns since 2020. Conventional water quality parameters including NH3-N, TN, TP and organic pollution indicators exhibit pronounced spatiotemporal fluctuations (Zhao et al., 2023; Anh et al., 2023). These pollutants not only directly impact the water quality classification of rivers, but may also adversely affect the stability of aquatic ecosystems by altering nutrient composition and dissolved oxygen conditions (Yang et al., 2008). Therefore, identifying the interrelationships among key water quality indicators in the Luoqing River body and the mechanisms driving their variations is of paramount importance for the scientific management of the aquatic environment and the ecological conservation of the river basin. Therefore, identifying the interrelationships among key water quality indicators in the Luoqing River and the mechanisms driving their variations is of paramount importance for watershed management and regional ecological conservation.
Traditional water quality assessment methods typically rely on single-indicator trend analysis or linear statistical analysis based on Pearson/Spearman correlation coefficients (Diamantini et al., 2018; Huang et al., 2025). Whilst sufficient to reveal partial linear relationships between water quality indicators, its explanatory power remains limited in river systems where multiple pollutants coexist and interaction pathways are complex. In practice, conventional water quality indicators often exhibit significant nonlinear relationships and synergistic variation patterns. For instance, alterations in nutrient concentrations may influence algal growth and dissolved oxygen levels, thereby modifying the overall water quality state. Within such multivariate, strongly coupled research contexts, reliance solely on traditional statistical methods is inadequate for comprehensively characterising the intrinsic mechanisms underlying water quality fluctuations (Chidiac et al., 2023).
Machine learning methodologies are increasingly being introduced into aquatic environmental research due to their advantages in handling high-dimensional data, non-linear relationships, and complex variable interactions. Relevant studies indicate that machine learning models can autonomously learn the non-linear associative structures between water quality indicators from long-term monitoring data, while identifying key factors that exert a dominant influence on water quality variations. Among these, models such as RandomForest, XGBoost, and CatBoost are widely employed for water quality prediction and driver identification due to their robust performance and interpretability. Feature importance analysis can be utilised to quantify the relative contribution of different water quality parameters to water quality changes (Li et al., 2025; Deng et al., 2025; Ding et al., 2025). Moreover, PCA as a commonly employed dimension reduction technique, can extract key controlling factors from multi-indicator monitoring data, thereby aiding in the revelation of the overall characteristics of water quality changes and the underlying controlling processes (Benkov et al., 2023; Nath Roy et al., 2024). Similar ML approaches have been applied to the Yangtze River and Pearl River, both identifying nitrogen as a primary pollution driver. However, these studies focused on larger river systems with different hydrological characteristics. Our study extends this methodology to a medium-sized karst-influenced river system, providing insights applicable to similar watersheds in Southwest China.
This study employs Spearman’s correlation analysis, PCA, and machine learning models to systematically analyse the interrelationships among conventional water quality indicators in riverine water bodies and their driving factors. This analysis is based on multi-section monitoring data from the Luoqing River collected over the past three years by Guilin City’s water quality monitoring station. The study aims to elucidate the spatiotemporal variation characteristics of Luoqing River water quality indicators; reveal correlations and coupling relationships among key water quality parameters; and identify critical controlling factors influencing water quality changes. The findings provide scientific basis for water quality management and zoned control of the Luoqing River, while offering reference for applying machine learning methods in similar riverine environmental studies.
2 Data and methods
2.1 Data sources and sampling points
The water quality data utilised in this paper originates from Guilin City’s Automated Water Quality Monitoring Network, which is centrally managed and operated by the municipal government. All monitoring data is derived from automated monitoring stations, ensuring high temporal continuity and data reliability.
The study selected three representative water quality monitoring sections along the main stem of the Luoqing River, covering different river segments and gradients of human activity intensity, to characterise the spatial variation in basin water quality. The names and geographical coordinates of each monitoring section are as follows: Suqiao Section Automated Monitoring Station (downstream): Longitude 110.133599°E, Latitude 25.075189°N; Xialiang Village Automated Monitoring Station (midstream): Longitude 110.036019°E, Latitude 25.057025°N; Longxi National Control Section Automated Monitoring Station (upstream): Longitude 109.878412°E, Latitude 24.790549°N.The study area is shown in Figure 1.
Figure 1
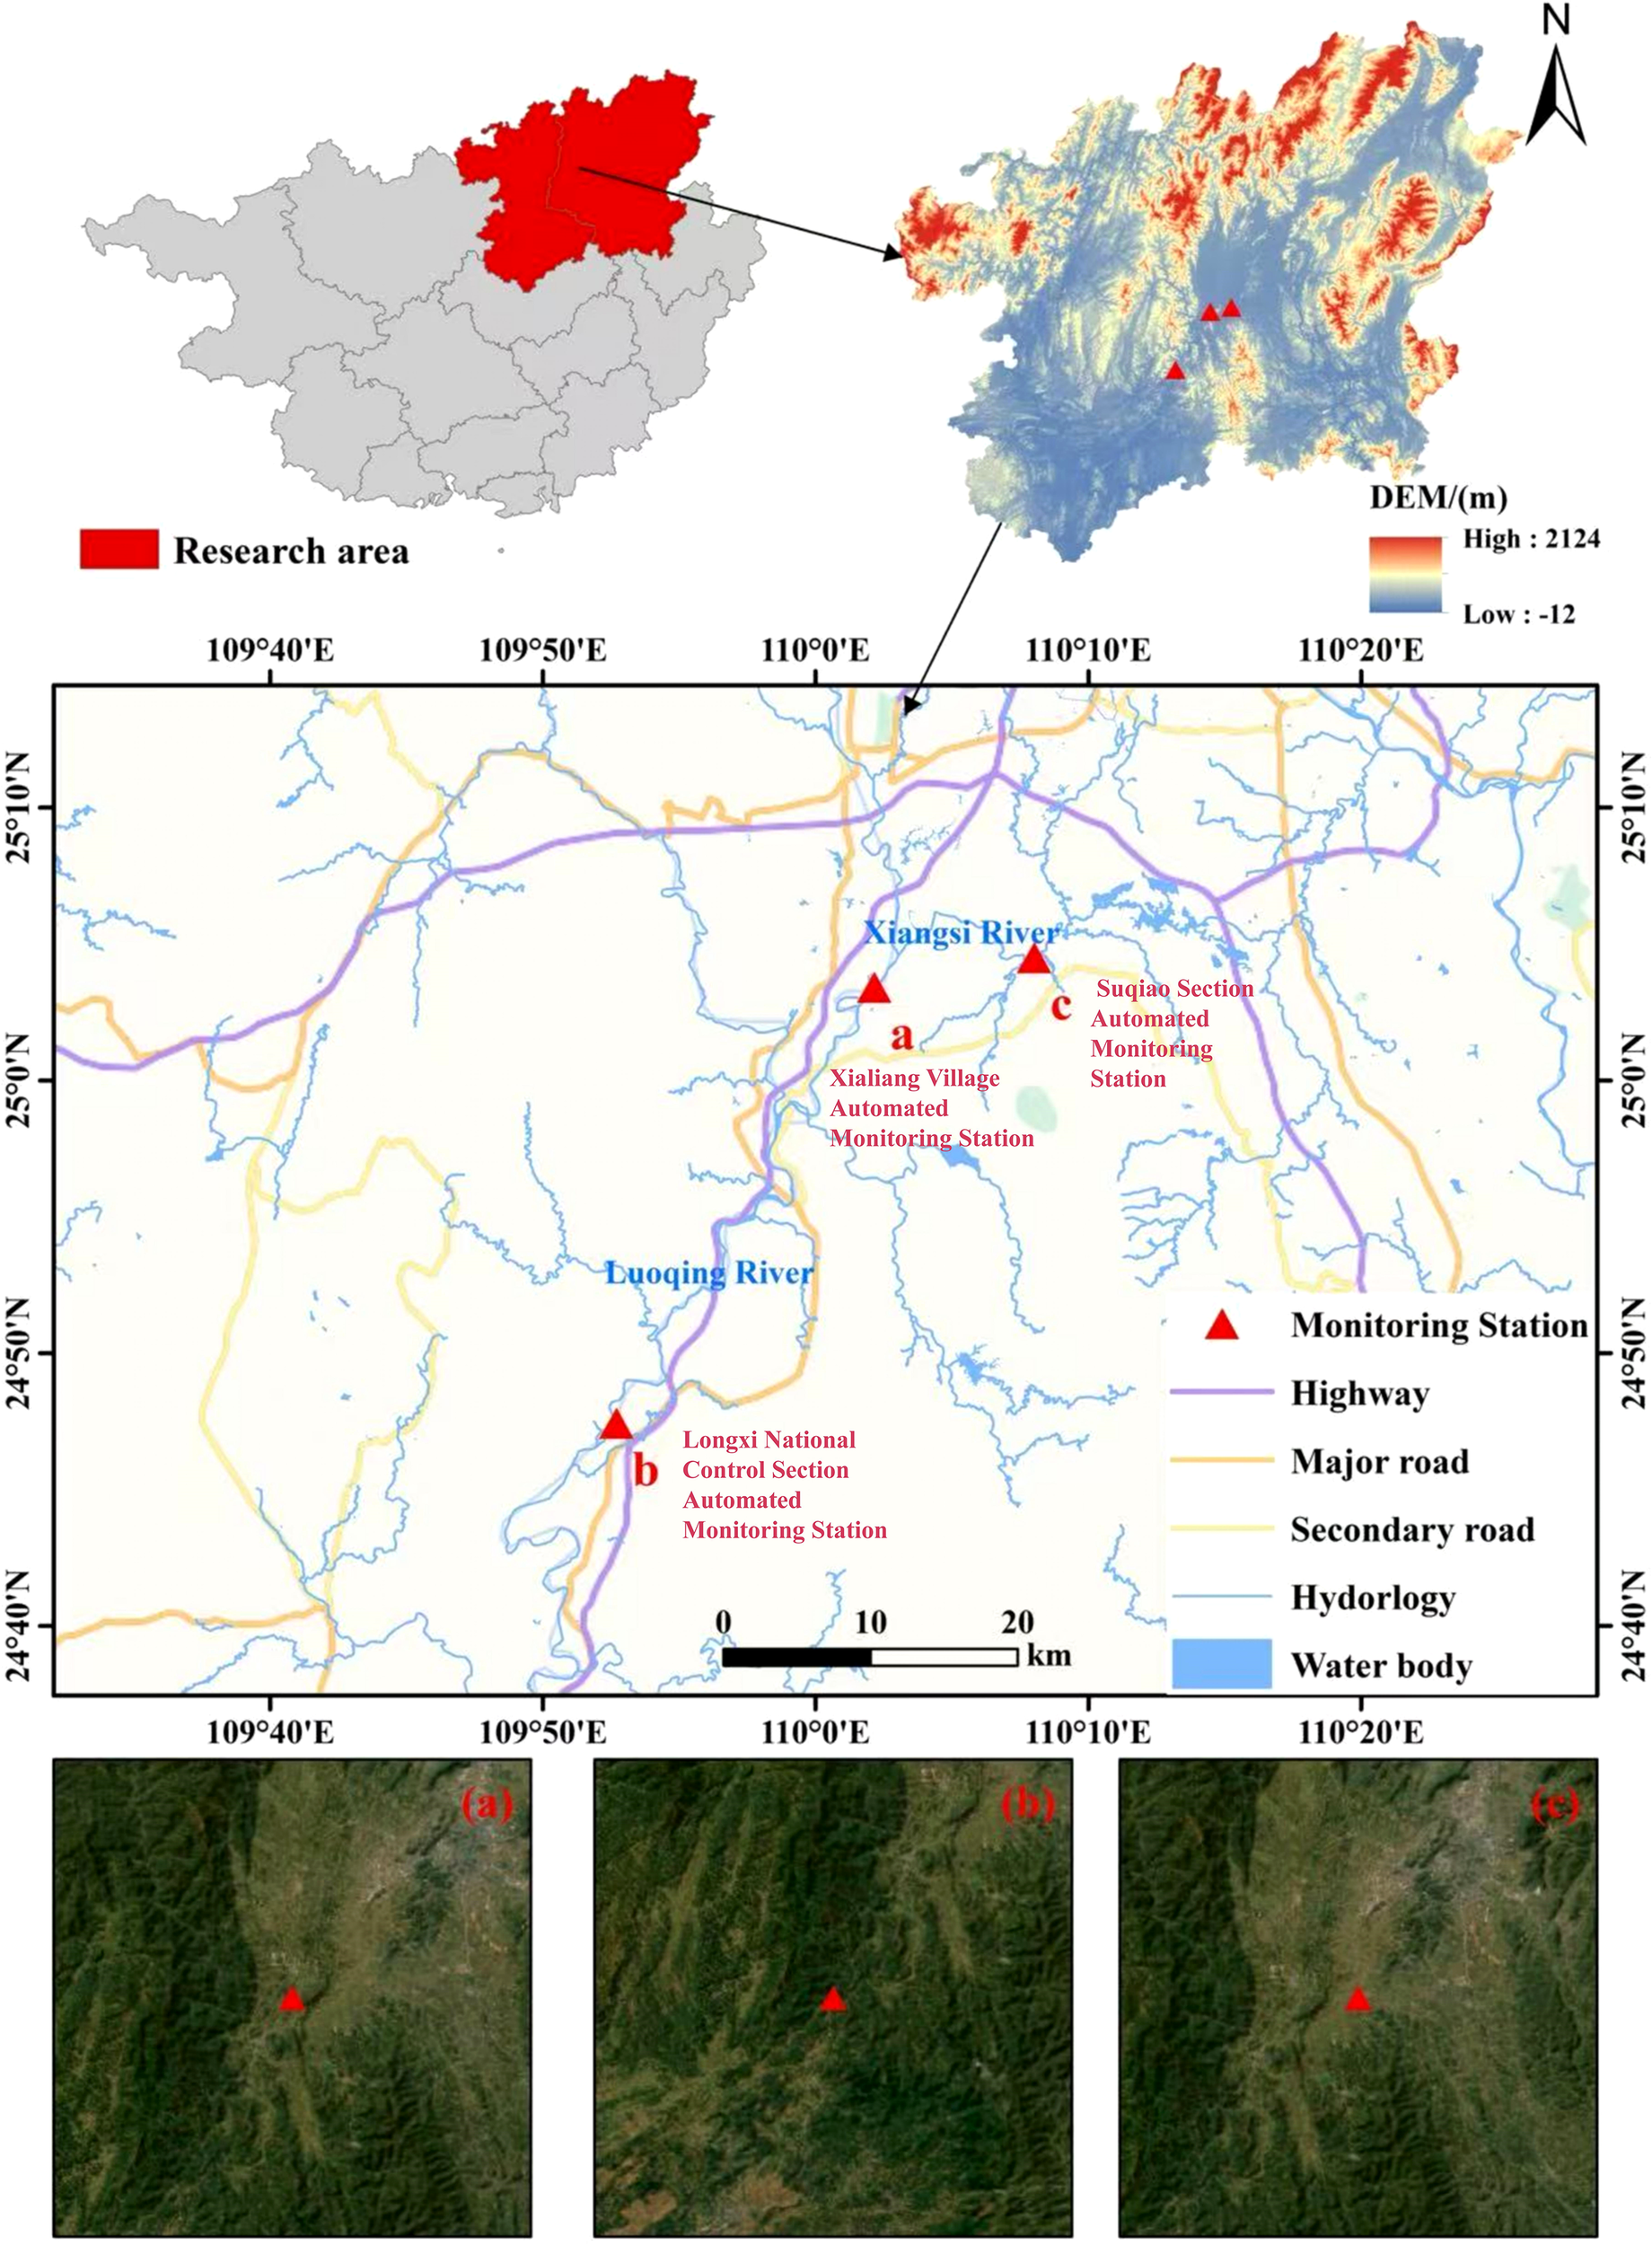
Location of the study area and water quality monitoring sections.
Monitoring is conducted daily, with continuous time series covering the three-year monitoring period from January 2023 to March 2025. This provides a reliable data foundation for analysing temporal variations in water quality indicators, spatial differences, and the synergistic relationships among multiple indicators.
2.2 Indicator system and pollutant categories
Based on the characteristics of the Luoqing River water environment and the available monitoring data, this paper establishes an analytical indicator system based on conventional water quality parameters, with particular emphasis on indicators reflecting organic pollution, nutrient levels, and the physicochemical state of the water body. The selected indicators include:
-
Organic pollution indicator: CODMn
-
Nutrient indicators: NH3-N, TN, TP
-
Water physicochemical parameters: DO, pH, Water temperature (T)
2.3 Data preprocessing
To ensure the reliability of subsequent statistical analysis and machine learning modelling, the raw monitoring data underwent systematic preprocessing, primarily encompassing missing value handling, outlier identification, and data standardisation.
2.3.1 Missing value handling
For minor data gaps in automated monitoring records arising from equipment maintenance or communication anomalies, interpolation methods utilising neighbouring sample information are employed. Specifically, provided the proportion of missing data remains low, either the K-Nearest Neighbours (KNN) method or Multiple Imputation by Chained Equations (MICE) is employed to estimate missing values, thereby maximising the retention of the statistical characteristics inherent in the original data. Missing data accounted for 3.2% of total observations, primarily due to equipment maintenance. The KNN method (k=5) was employed for imputation, selected based on its superior performance in preserving the correlation structure among water quality parameters compared to MICE in preliminary testing.
2.3.2 Outlier detection
Outliers are identified by combining statistical distribution characteristics with the box plot method. For extreme values significantly deviating from the normal variation range, they are excluded or corrected after confirming they do not represent genuine water quality sudden change events, thereby preventing unreasonable impacts on model training and parameter estimation.
2.3.3 Data standardisation
Given the significant variations in dimensionality and numerical ranges among different water quality indicators, all continuous variables were standardised prior to principal component analysis and machine learning modelling. Z-score standardisation was employed, setting the mean of each indicator to 0 and the standard deviation to 1, thereby preventing model bias towards indicators with large numerical values.
2.4 Analysis and modelling methods
2.4.1 Correlation analysis
To preliminarily identify synergistic relationships among water quality indicators, Spearman’s rank correlation coefficient was employed to analyse correlations between various water quality parameters. This correlation coefficient effectively characterises monotonic relationships between variables, proving suitable for data exhibiting non-normal distributions and potential non-linear relationships. Correlation analysis results were presented in the form of correlation matrices and heatmaps, enabling comparison of distinctive features in the correlation structures of water quality indicators across different cross-sections.
2.4.2 PCA
To reduce the dimensionality of multi-indicator data and identify key integrated factors controlling water quality variation, PCA was conducted on standardised water quality indicator data. By analysing the eigenvalues, variance explained, and variable loading distributions of each principal component, dominant factors contributing significantly to water quality fluctuations were identified. This approach revealed the underlying control mechanisms governing water quality variation at an aggregate level and highlighted structural differences in water quality across distinct cross-sections (Qian et al., 2007).
2.4.3 Construction of the CPI
To characterise the overall pollution level of the study area’s water bodies under the combined effects of multiple pollutants, this paper constructs a CPI based on data pre-processing (Yang et al., 2023), As the response variable for subsequent modelling analysis. This approach treats all pollutants equally, which is appropriate when no prior knowledge suggests differential importance among parameters. First, calculate the single-factor pollution index Pi for each pollutant:
Where Ci denotes the measured concentration of pollutant i, and Si represents the corresponding water quality standard limit for that pollutant. Water quality standard limits are selected from Class III standards in the Surface Water Environmental Quality Standards (GB3838-2002) (Ministry of Environmental Protection of the People’s Republic of China, 2002). Following the derivation of single-factor pollution indices for each pollutant, the composite pollution index is calculated using the arithmetic mean method:
Here, n denotes the number of pollutant indicators included in the calculation. This study selected NH3-N, TN, TP, and CODMn to construct the CPI, thereby comprehensively reflecting the nutrient pollution and organic pollution levels in the study area’s water bodies. Physicochemical parameters such as DO, pH, and water temperature were not directly incorporated into the CPI calculation. Instead, they were employed as explanatory variables in subsequent correlation analyses, principal component analyses, and machine learning modelling to investigate their moderating effects on the overall pollution level.
2.4.4 Machine learning model
Based on correlation analysis and PCA, three models—Random Forest (RF), XGBoost, and CatBoost—were selected to construct the CPI prediction model, thereby fully accounting for the different models’ characterization capabilities in capturing non-linear relationships and variable interactions (Zhu et al., 2022). The model employs water temperature, pH, DO, TN, TP, NH3-N, and CODMn as input variables, with CPI serving as the output variable. Through model training and testing, the relative contribution of each water quality indicator to CPI variation is assessed. To enhance the interpretability of model results, the SHAP method was employed to interpret the model predictions. This quantified the marginal contribution of different water quality indicators to CPI and, in conjunction with Partial Dependence Plots (PDP), analysed the interaction characteristics between key pollutants (Shams et al., 2023; Choudhary et al., 2025).
To evaluate the predictive performance and robustness of machine learning models, a comprehensive assessment of model performance on the test dataset was conducted using the coefficient of determination (R2), root mean square error (RMSE), and mean absolute error (MAE). To prevent overfitting, 5-fold cross-validation was employed during model training. Concurrently, by integrating feature importance rankings and SHAP value analysis results, water quality indicators exerting critical influence on comprehensive pollution level variations were identified, thereby providing a basis for subsequent pollution control and water environment management.
3 Results and analysis
3.1 Trends in data characteristics over three years
Based on monitoring data from three sections of the Luoqing River (Longxi, Xialiang Village and Suqiao) over the past three years, a systematic analysis was conducted on the temporal and spatial variation characteristics of key physicochemical indicators and nutrient parameters (Figures 2, 3).
Figure 2
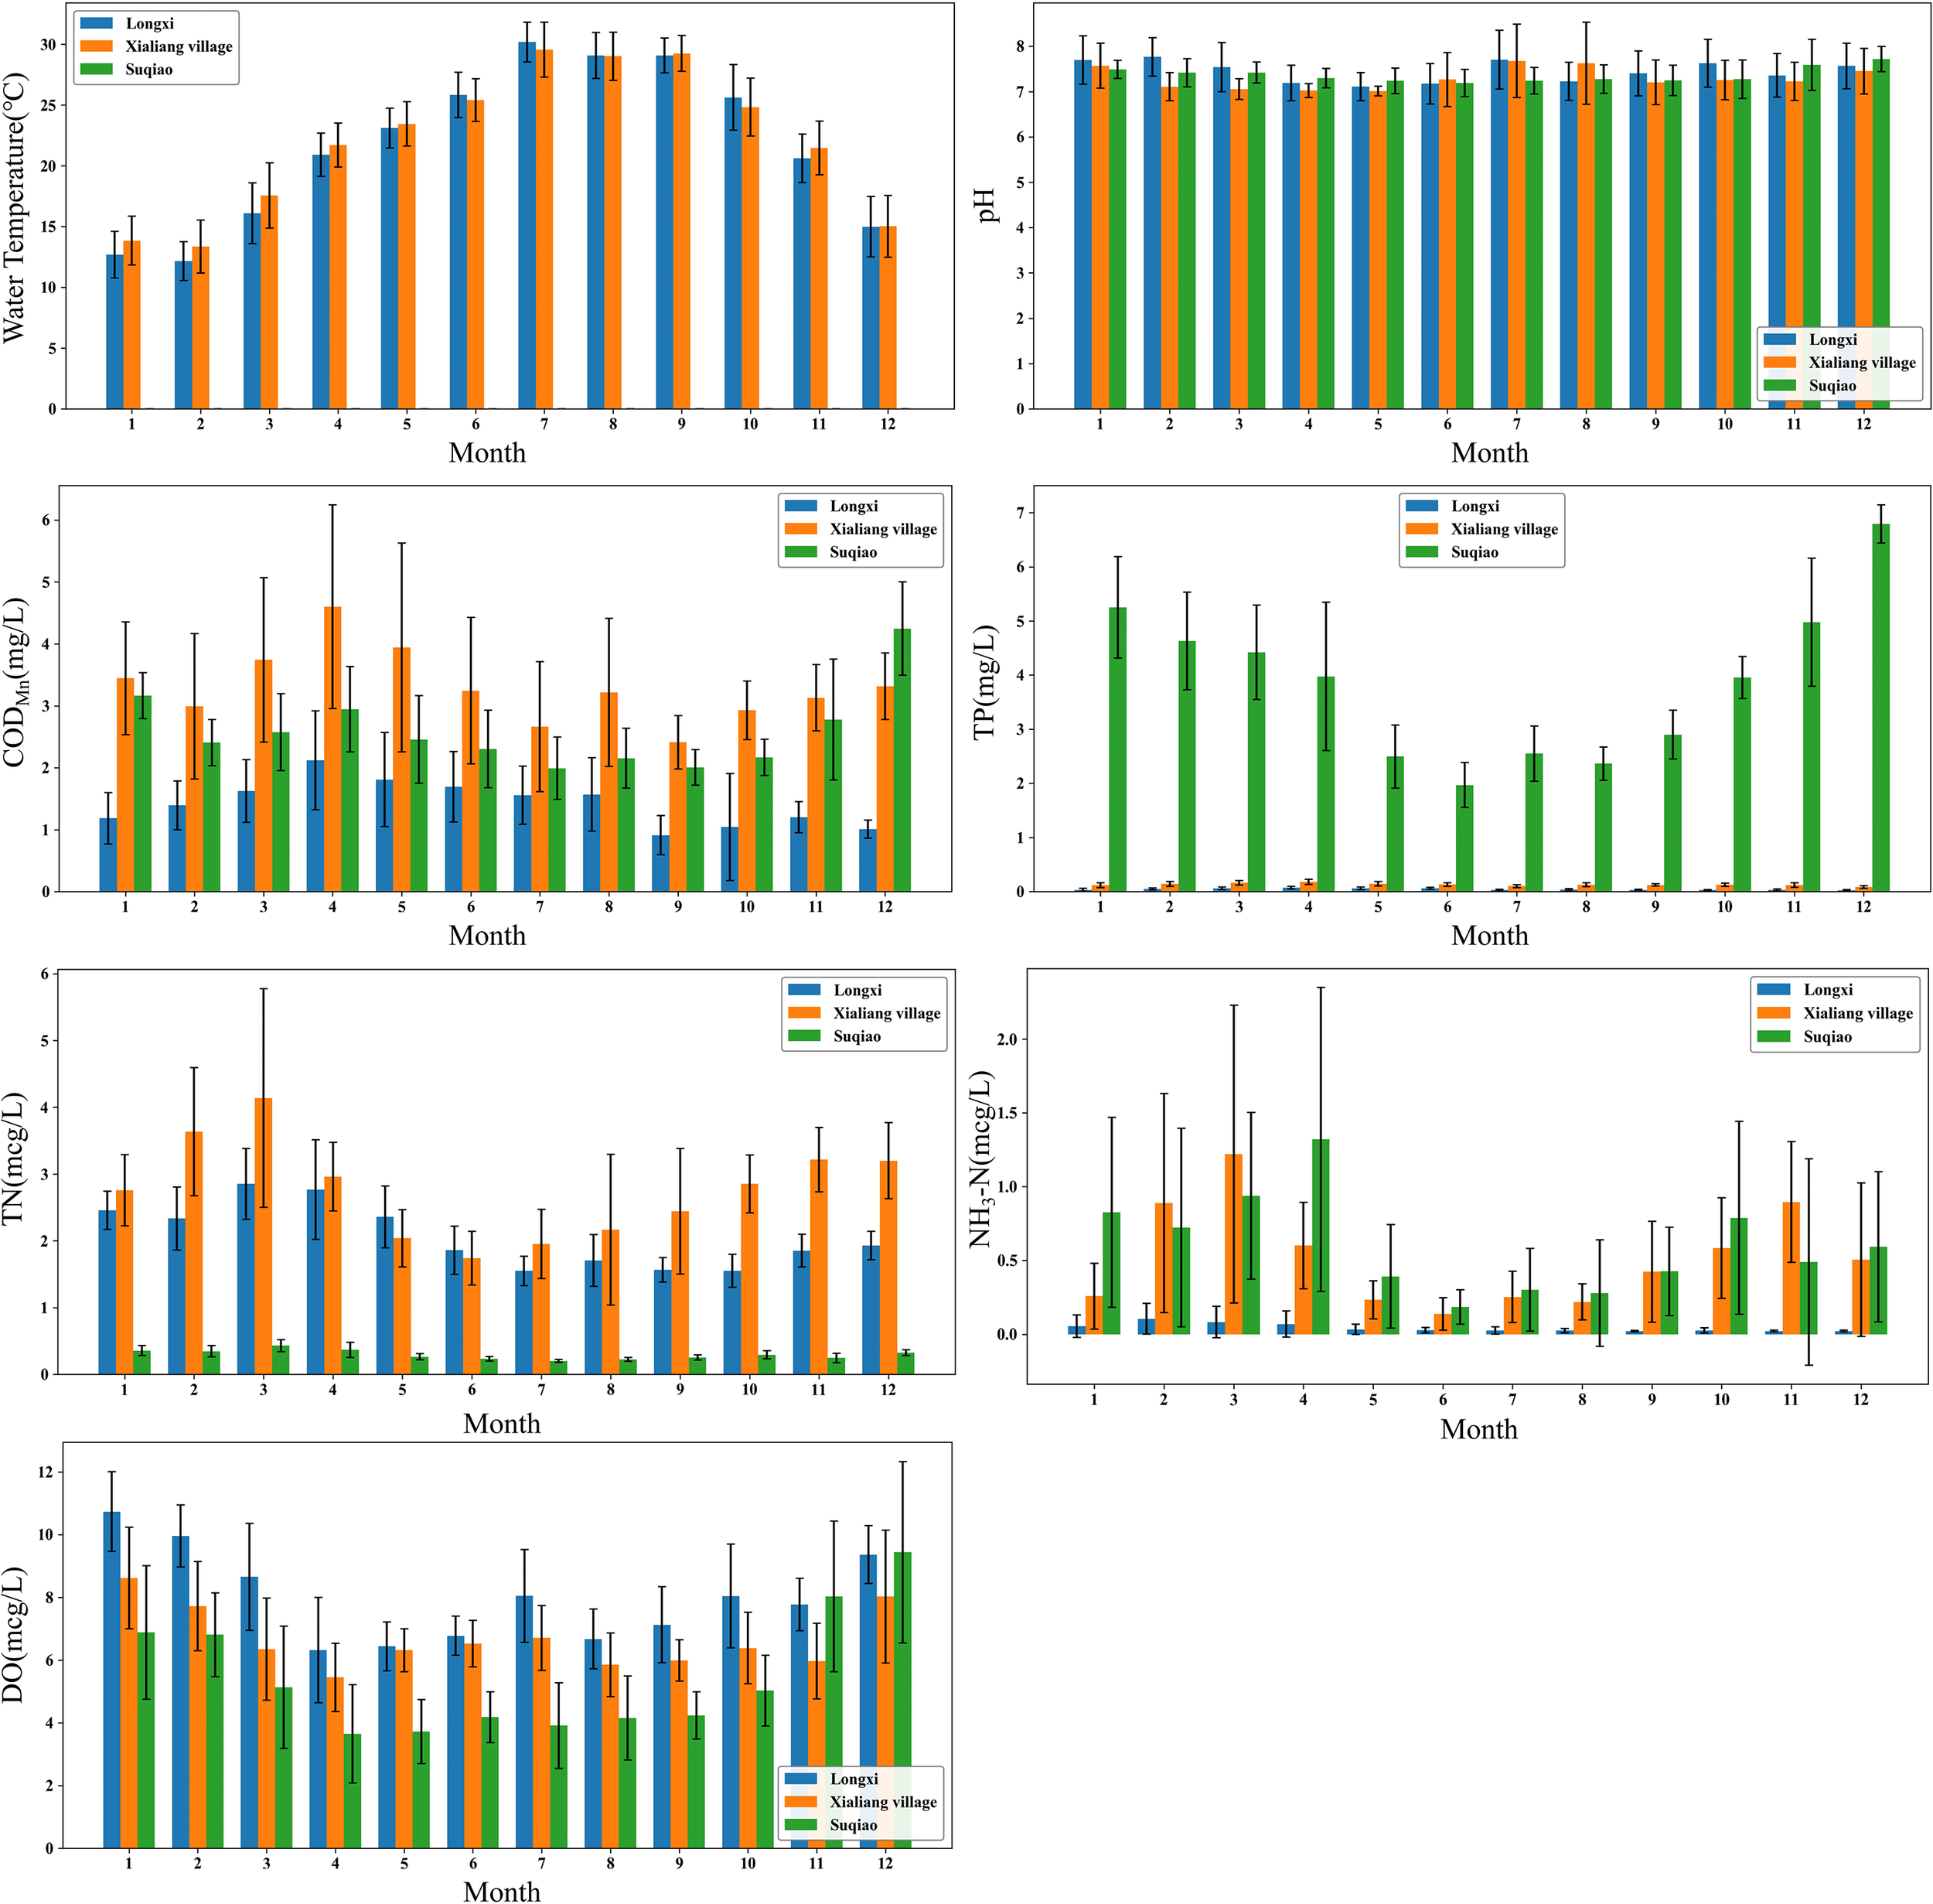
Inter-monthly variation characteristics of seven water quality indicators at three monitoring sections along the Luoqing River.
Figure 3
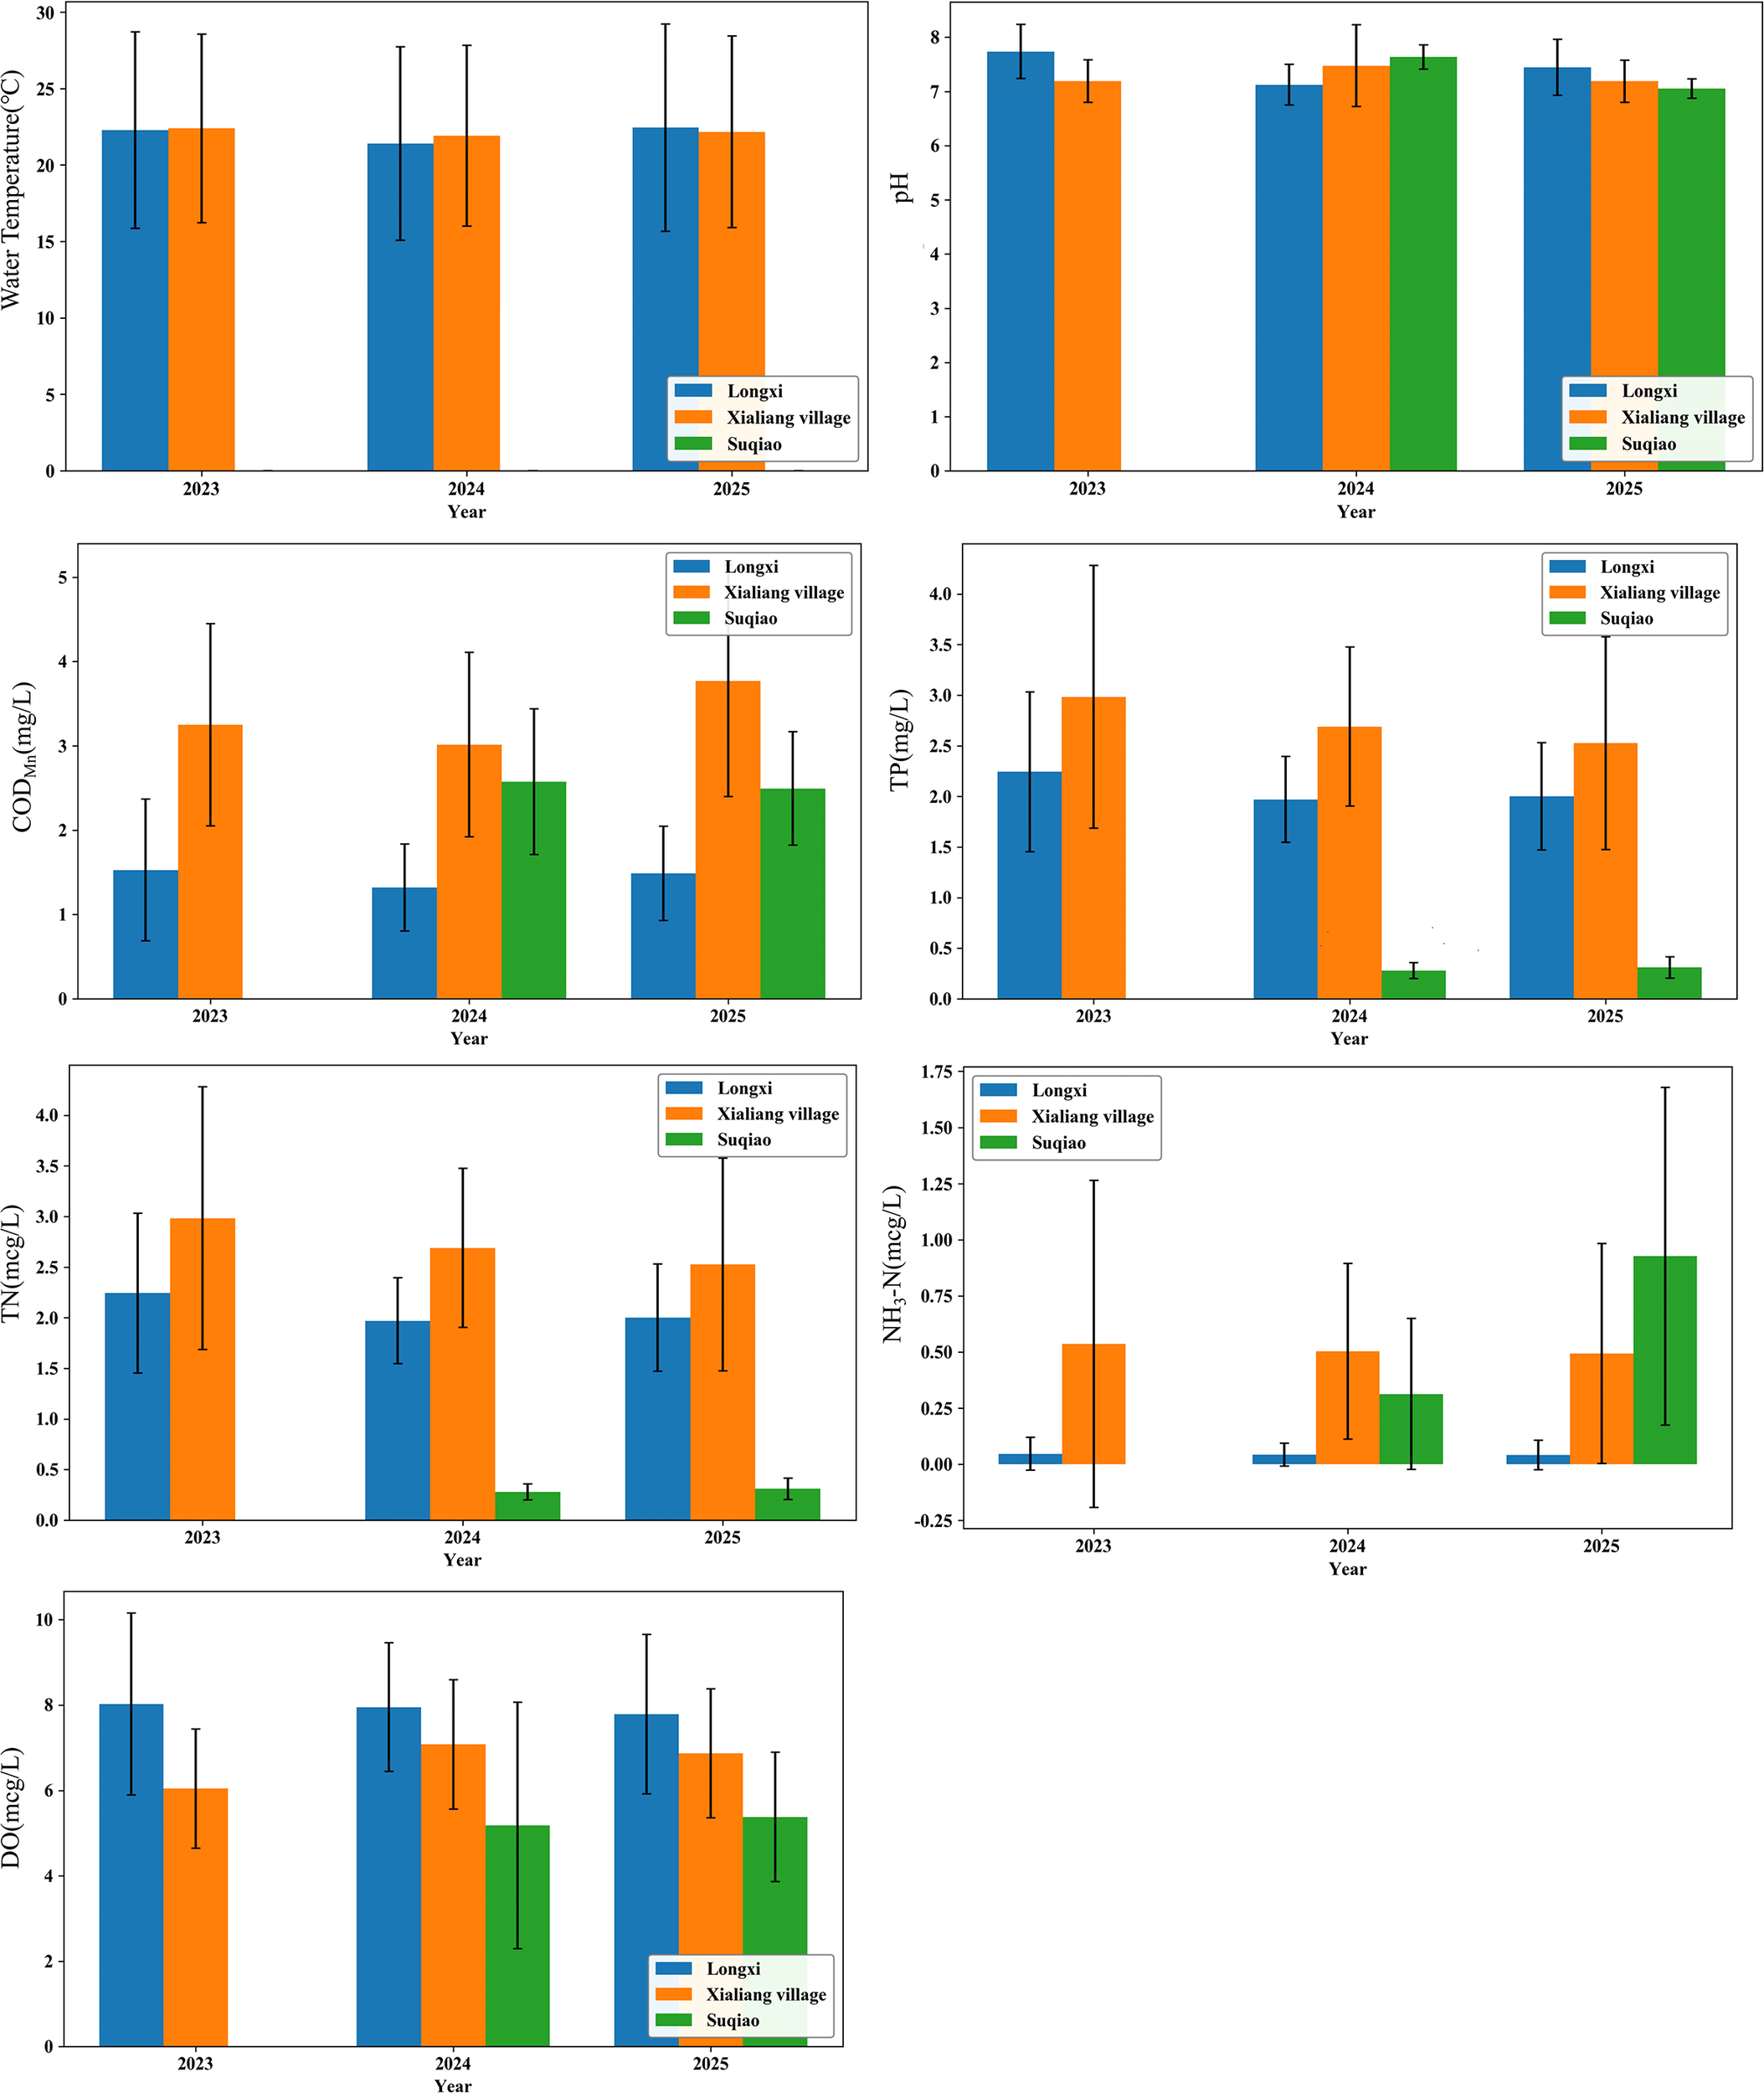
Interannual variation characteristics of seven water quality indicators at three monitoring sections along the Luoqing River.
3.1.1 Monthly variation characteristics of water quality indicators
Water temperatures exhibit pronounced seasonal variations throughout the year, generally following a single-peak pattern characterised by the lowest readings in winter and the highest in summer. This pattern is primarily governed by regional climatic conditions, with stable annual fluctuations consistent with the typical seasonal evolution of river water temperatures (Caissie, 2006).The pH value exhibited minimal overall fluctuation throughout the year, remaining within the neutral to weakly alkaline range across all months. This indicates that the Luoqing River possesses a robust buffering capacity against acidity and alkalinity on an annual timescale.
DO concentrations exhibit an inverse trend to water temperature throughout the year, remaining generally elevated during winter and early spring while decreasing markedly during the high-temperature summer period. This phenomenon is closely linked to reduced gas solubility at higher temperatures and heightened biological metabolic activity within the water body, reflecting typical seasonal regulatory characteristics (Ouellet et al., 2020).
CODMn exhibits pronounced inter-monthly fluctuations on an annual scale, generally tending towards higher values during spring through early summer and lower values throughout autumn and winter, with certain months experiencing periodic peaks. This indicates that the concentration of oxidisable organic matter in water bodies is significantly influenced by variations in runoff conditions and seasonal differences in biological activity intensity (Deng et al., 2018).
Nutrient indicators (TN, TP, and NH3-N) exhibited the most pronounced fluctuations on an intra-annual scale. Among these, TN remained relatively elevated during winter and early spring, decreased in summer due to enhanced biological uptake and runoff dilution, and showed a certain rebound in autumn. TP levels were higher in spring and early summer, declining in mid-to-late summer. NH3-N exhibits the most pronounced sensitivity to seasonal variation, with elevated concentrations during winter and early spring, followed by a marked reduction in summer that persists at lower levels. This pattern reflects the strong dependence of nitrogen transformation processes on temperature and hydrodynamic conditions (Liu et al., 2025b).
3.1.2 Interannual variation characteristics of water quality indicators
On an interannual scale, the annual averages of water temperature and pH remained relatively stable overall, with minor variations between different years and no discernible unidirectional trend (Caissie, 2006). The annual average concentration of dissolved oxygen also exhibits relatively stable variation characteristics, with interannual fluctuations significantly smaller than those on a monthly scale. This indicates that short-term seasonal factors are the primary drivers of DO fluctuations (Hamdhani et al., 2023).
The permanganate index exhibits certain fluctuations on an interannual scale, yet the overall variation remains limited, showing no sustained upward or downward trend. This indicates that the load of oxidisable organic matter in the water body remained relatively stable throughout the study period.
Nutrient indicators exhibit relatively complex interannual variations. Annual mean TN concentrations fluctuate between years, though no significant overall trend is discernible. TP concentrations at the Suqiao section show a marked upward trend over time, particularly pronounced in later study years, suggesting potential alterations in phosphorus input or accumulation processes at the interannual scale. The interannual variability of NH3-N is relatively pronounced, with some sections exhibiting concentration increases and greater variability in later years. This indicates that ammonia nitrogen remains influenced by unstable external inputs or transformation processes on an annual scale (Liu et al., 2025b).
3.1.3 Spatial variation characteristics of water quality indicators
At the spatial scale, water temperature and pH exhibit minimal variation across the three transects, with their trends showing high consistency at both monthly and annual intervals. This indicates that these two indicators are primarily governed by regional climatic conditions, with spatial heterogeneity being insignificant (Caissie, 2006).
Dissolved oxygen exhibits spatial variation across different cross-sections, with upstream sections generally displaying higher overall DO levels. In contrast, mid- and downstream sections show slightly reduced levels accompanied by greater fluctuations, a characteristic particularly pronounced during the high-temperature summer period. This reflects differences in hydrodynamic conditions and organic load between river segments (Hamdhani et al., 2023).
The spatial variation in permanganate index is notably pronounced, with mid- and downstream sections (Xialiang Village and Suqiao) exhibiting overall higher values than upstream sections, accompanied by greater fluctuations. This correlates closely with the relative concentration of industrial and agricultural activities in mid- and downstream areas, which intensifies the input of organic pollutants into water bodies. The spatial heterogeneity of nutrient indicators is most pronounced. Total nitrogen (TN) exhibits an overall upward trend from upstream to downstream sections, with the Suqiao section displaying elevated TN levels and significant interannual fluctuations, indicating greater pressure on downstream river segments regarding nitrogen accumulation and input. The annual average concentration of total phosphorus (TP) at the Suqiao section is markedly higher than at other sections, showing an upward trend in the latter part of the study period, reflecting the potential impact of human activity intensity in this area on phosphorus input. The spatial heterogeneity of NH3-N is most pronounced. Upstream sections generally exhibit lower concentrations, whereas mid- and downstream sections show greater variability, indicating heightened sensitivity to local pollution sources and environmental conditions (Deng et al., 2018).
Analysis across monthly, annual and spatial scales reveals that water quality variations in the Luoqing River exhibit distinct characteristics: pronounced monthly fluctuations, relatively stable annual patterns, and marked spatial disparities. Furthermore, different water quality indicators demonstrate significant differences in their responses to temporal and spatial scales.
3.2 Results of pollutant correlation analysis
To elucidate the synergistic relationships among various water quality indicators and their potential control mechanisms, Spearman’s rank correlation analysis was conducted on water temperature, pH, DO, CODMn, TN, TP and NH3-N at the Suqiao (downstream), Longxi (upstream), and Xialiang Village (midstream) monitoring sections, based on continuous monitoring data from 2023 to 2025. The results are presented in Figure 4 (Liu et al., 2023).
Figure 4
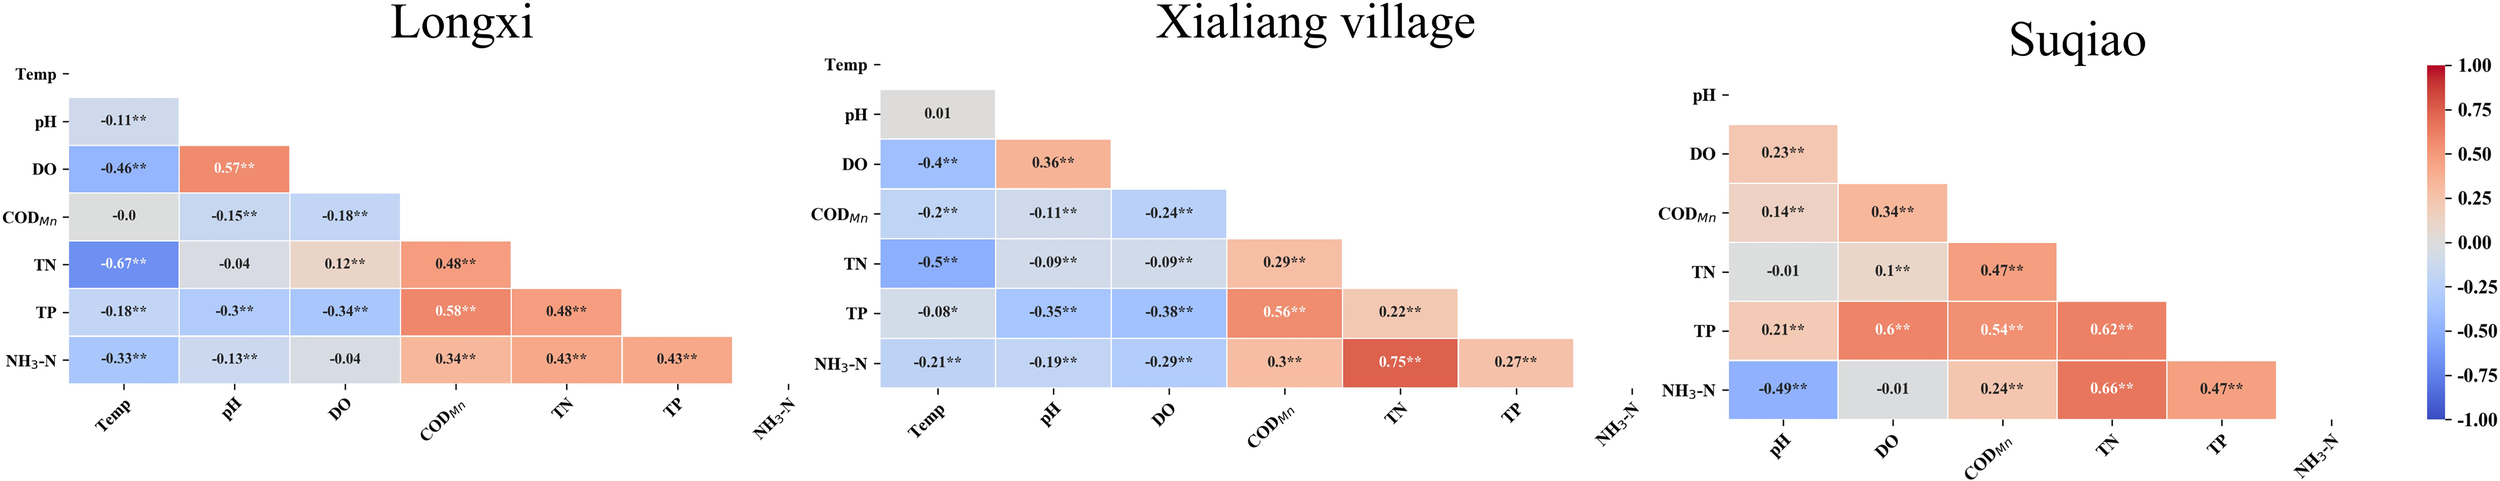
Spearman correlation matrices of water quality indicators at three monitoring sections along the Luoqing River.
3.2.1 Longxi section (Upstream)
The correlation structure of water quality indicators at the Longxi section exhibits a generally clear pattern, indicating that water quality variations are primarily governed by natural processes and background inputs. Nutrient indicators demonstrate significant synergistic variation characteristics, with both TN and TP, as well as TN and NH3-N, showing significant positive correlations. This suggests a degree of temporal synchrony between nitrogen and phosphorus, potentially linked to background inputs within the watershed and natural migration and transformation processes (Yang et al., 2025). Concurrently, DO exhibits a significant negative correlation with CODMn, while displaying weak to moderate negative correlations with TN, TP, and NH3-N. This indicates that even in upstream river sections, the processes of organic matter degradation and nutrient transformation exert a certain consumption effect on dissolved oxygen in the water body, albeit with relatively limited coupling intensity (Wang et al., 2023). Moreover, water temperature exhibited a significant negative correlation with TN and NH3-N concentrations, suggesting that seasonal variations in water temperature may regulate nitrogen form distribution by influencing microbial activity, biological uptake processes, and hydrodynamic conditions. This characteristic reflects the dominant role of natural seasonal factors in water quality changes at the upstream section (Zhang et al., 2023).
3.2.2 Xialiang village section (Midstream)
The correlation structure of water quality indicators at the Xialiang Village section exhibits stronger nitrogen form coupling characteristics compared to upstream sections. A significant positive correlation exists between TN and NH3-N, indicating pronounced synergistic variation among nitrogen forms at this section. This reflects enhanced temporal synchronisation within nitrogen cycling processes (Yang et al., 2025). CODMn also exhibits a significant positive correlation with TN and NH3-N, indicating that variations in organic pollution load and nitrogen enrichment processes at this section demonstrate a degree of consistency. This suggests that organic matter inputs and nitrogen pollution may share similar sources or are mutually coupled during migration and transformation processes (Wang et al., 2023). Concurrently, DO exhibited significant negative correlations with CODMn, TN, TP and NH3-N. This indicates that in the midstream of the river, the degradation of organic matter and the transformation of nutrient salts are highly sensitive to variations in dissolved oxygen levels, reflecting a markedly enhanced biogeochemical coupling among water quality processes (Liu et al., 2023).
3.2.3 Suqiao section (Downstream)
The correlation structure of water quality indicators at Suqiao section exhibits complex characteristics, demonstrating typical features of composite pollution. The correlations between nutrients have significantly intensified, with both TN and TP, as well as TN and NH3-N, showing strong positive correlations. This indicates that nutrient pollution at this section exhibits high temporal synergy, likely driven by multiple anthropogenic inputs including agricultural runoff and domestic sewage (Zhang et al., 2018). Concurrently, CODMn exhibits a moderate to strong positive correlation with TN and TP, indicating a marked consistency between organic pollutant inputs and nutrient accumulation processes at this cross-section. This reflects the characteristic of superimposed and synergistically enhanced organic and nutrient pollution in the downstream river section (Chidiac et al., 2023). Moreover, a significant negative correlation exists between pH and NH3-N, suggesting that in downstream river sections, the distribution of ammonia nitrogen forms and their migration and transformation processes may be significantly influenced by changes in water acidity conditions. This further heightens the sensitivity of water quality processes to environmental factors (Yang et al., 2025).
A comprehensive analysis of the correlation results across the three cross-sections reveals that the structural relationships between water quality indicators exhibit distinct variations along the river’s longitudinal axis. The downstream section (Suqiao) is characterised by nutrient regulation and natural processes; the upstream reaches (Longxi) exhibit pronounced synergistic variations between nitrogen forms and heightened dissolved oxygen responsiveness to pollution processes; while the midstream reaches (Xialiang village) display composite pollution characteristics marked by significantly synergistic amplification between organic pollutants and nutrients. This correlation pattern, transitioning from natural control upstream to anthropogenic-driven composite pollution downstream, reflects the substantial impact of increasing human activity intensity along the watershed on water quality structure.
3.3 PCA key factors influencing analysis and identification
To further identify the primary controlling factors of water quality changes within the study area and comprehensively describe the intrinsic relationships between water quality characteristics at different monitoring sections, principal component analysis was conducted on key physicochemical indicators based on monthly average water quality data from January 2023 to March 2025 across all monitoring sections (Zhang et al., 2025).
As shown in Figure 5, the PCA results indicate that the PC1 and the PC2 account for the primary variation in water quality within the study area. Specifically, PC1 explains approximately 50.0% of the total variance, while the PC2 accounts for roughly 20.3% of the total variance. Together, they cumulatively explain over 70% of the variance. The remaining variance is likely attributable to measurement noise, localized pollution events, and unmeasured environmental factors such as flow velocity and sediment interactions. This level of explanatory power is comparable to that observed in most PCA studies of river water quality, demonstrating sound statistical representativeness (Shrestha and Kazama, 2007).
Figure 5
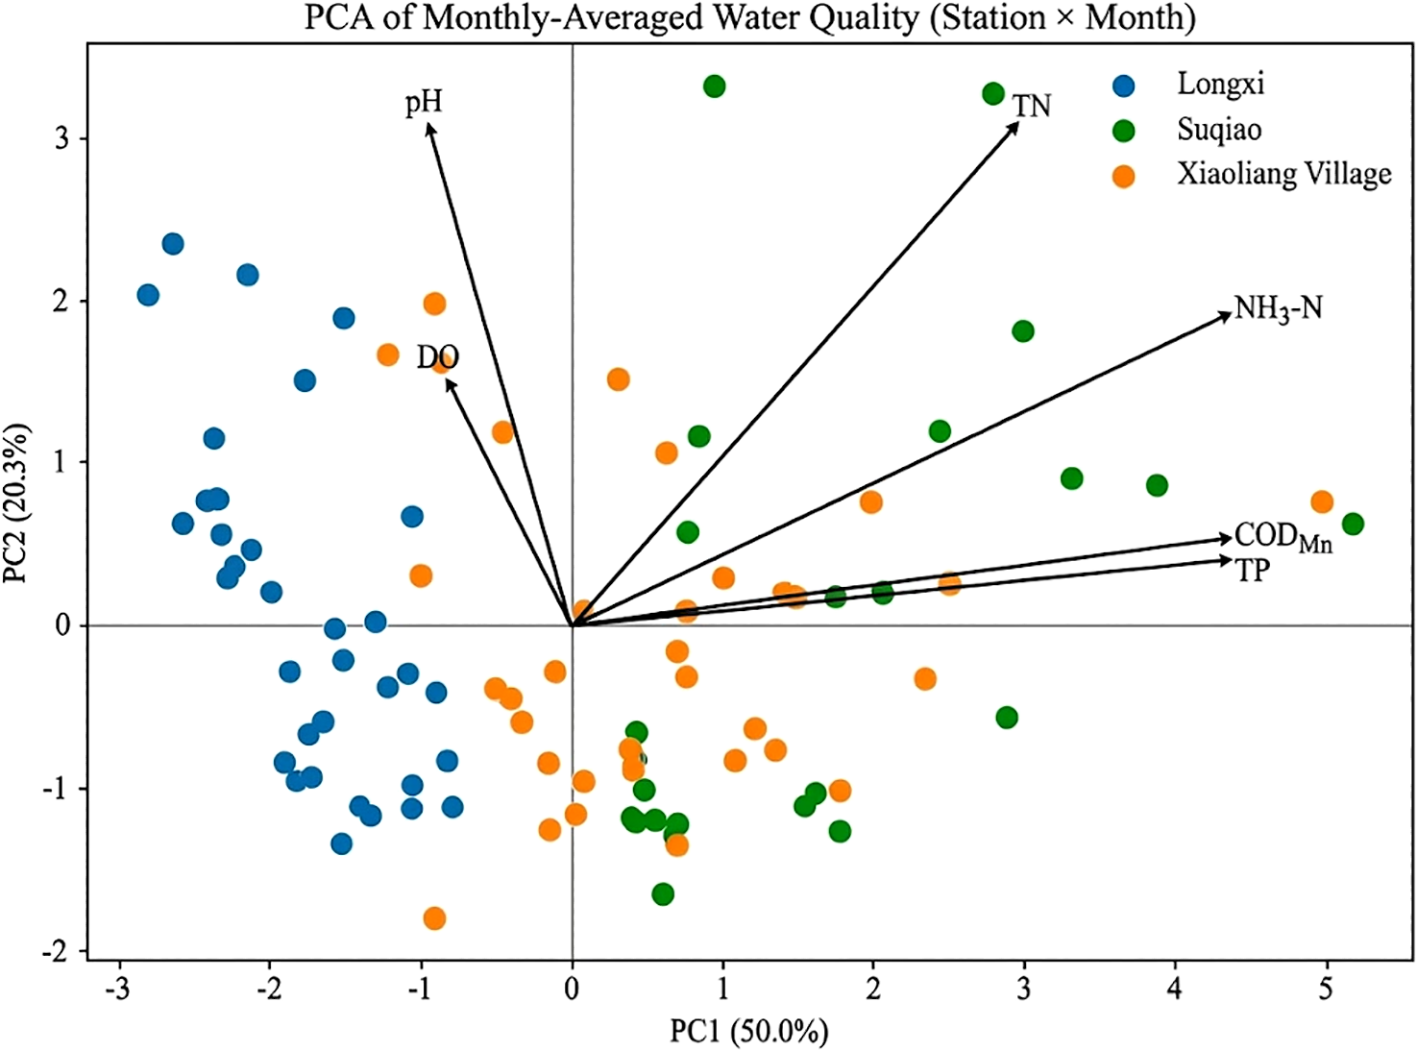
PCA biplot of monthly-averaged water quality data from three monitoring sections along the Luoqing River (January 2023–March 2025).
From the perspective of variable load distribution, TN, NH3-N, TP and CODMn all exhibit high positive loadings on PC1, with highly consistent arrow directions. This indicates that this principal component primarily represents a composite pollution load factor centred on nitrogen, phosphorus and organic matter. Regarding variable load distribution characteristics, TN, NH3-N, TP, and CODMn all exhibit substantial positive loadings on PC1, with highly consistent directionality within the principal component space. This indicates that PC1 principally reflects composite pollution load factors centred on nitrogen, phosphorus nutrients, and organic matter. This demonstrates that, within the study scale, nutrients and organic pollutants exhibit significant synergistic variation characteristics (Zeng et al., 2023). Their variations collectively govern the primary direction of water quality differences. This finding aligns with the conclusion from Spearman’s correlation analysis, which revealed a generally significant positive correlation between TN, TP, NH3-N and CODMn.
In contrast, pH and DO exhibit higher loadings on the second principal component (PC2), forming a distinct separation from the nutrient salts/organic matter axis represented by PC1 within the principal component space. Notably, the loading directions of pH and DO are relatively similar, indicating that both parameters are governed by analogous environmental processes within the water body. This primarily reflects the physicochemical state and redox conditions of the water (Shrestha and Kazama, 2007). By synthesising the variable load characteristics of PC1 and PC2, it is evident that water quality variations within the study area can be decomposed into two relatively independent yet interconnected control dimensions at a multi-indicator composite scale: one dimension represents pollution loads characterised by nutrients and organic matter, while the other dimension reflects the physicochemical state of the water body, represented by pH and DO.
In the principal component space, the sample points from each cross-section exhibit distinct differentiation along the PC1 axis. Samples from the Longxi section predominantly cluster in the negative region of PC1, corresponding to relatively low levels of TN, TP, NH3-N, and CODMn. This indicates a generally lower pollution load and comparatively favourable water quality at this section. Samples from the Xiaoliang Village section are largely concentrated in the intermediate region of PC1, exhibiting transitional characteristics. This reflects fluctuations in water quality levels across different months at this section, though overall it maintains a moderate nutrient load. In contrast, samples from the Suqiao section predominantly cluster in the positive region of PC1, aligning with high nutrient and organic pollutant loading directions. This indicates that this section exhibited relatively high nutrient and organic matter loading characteristics throughout the study period. The aforementioned spatial differentiation patterns in the principal component space align with inter-monthly and inter-annual variation analyses, further validating the significant differences in water quality structures across different cross-sections at a multi-indicator integrated scale. This also demonstrates that the PCA method can effectively characterise the overall structural features and primary influencing factors of water quality within the study area.
3.4 Key contaminating factors in machine learning model identification
Based on continuous monitoring data from January 2023 to March 2025, three machine learning models—CatBoost, RF and XGBoost—were constructed to forecast and interpret the CPI (Ding et al., 2023). The model’s predictions on the test set are shown in Figure 6, where the forecast values from all three models exhibit a highly consistent linear relationship with the actual CPI measurements. Among these, the CatBoost and XGBoost models demonstrated optimal predictive performance, with R2 both approximately 0.994 and RMSE around 0.015. The RF model exhibited slightly lower prediction accuracy but still maintained a high level (R2 ≈ 0.993, RMSE ≈ 0.016) (Choudhary et al., 2025). Overall, all three models were able to accurately capture the characteristics of CPI variations, indicating that the ensemble learning model constructed based on multiple water quality indicators possesses high reliability and stability in comprehensive pollution level prediction (Masood et al., 2023).
Figure 6
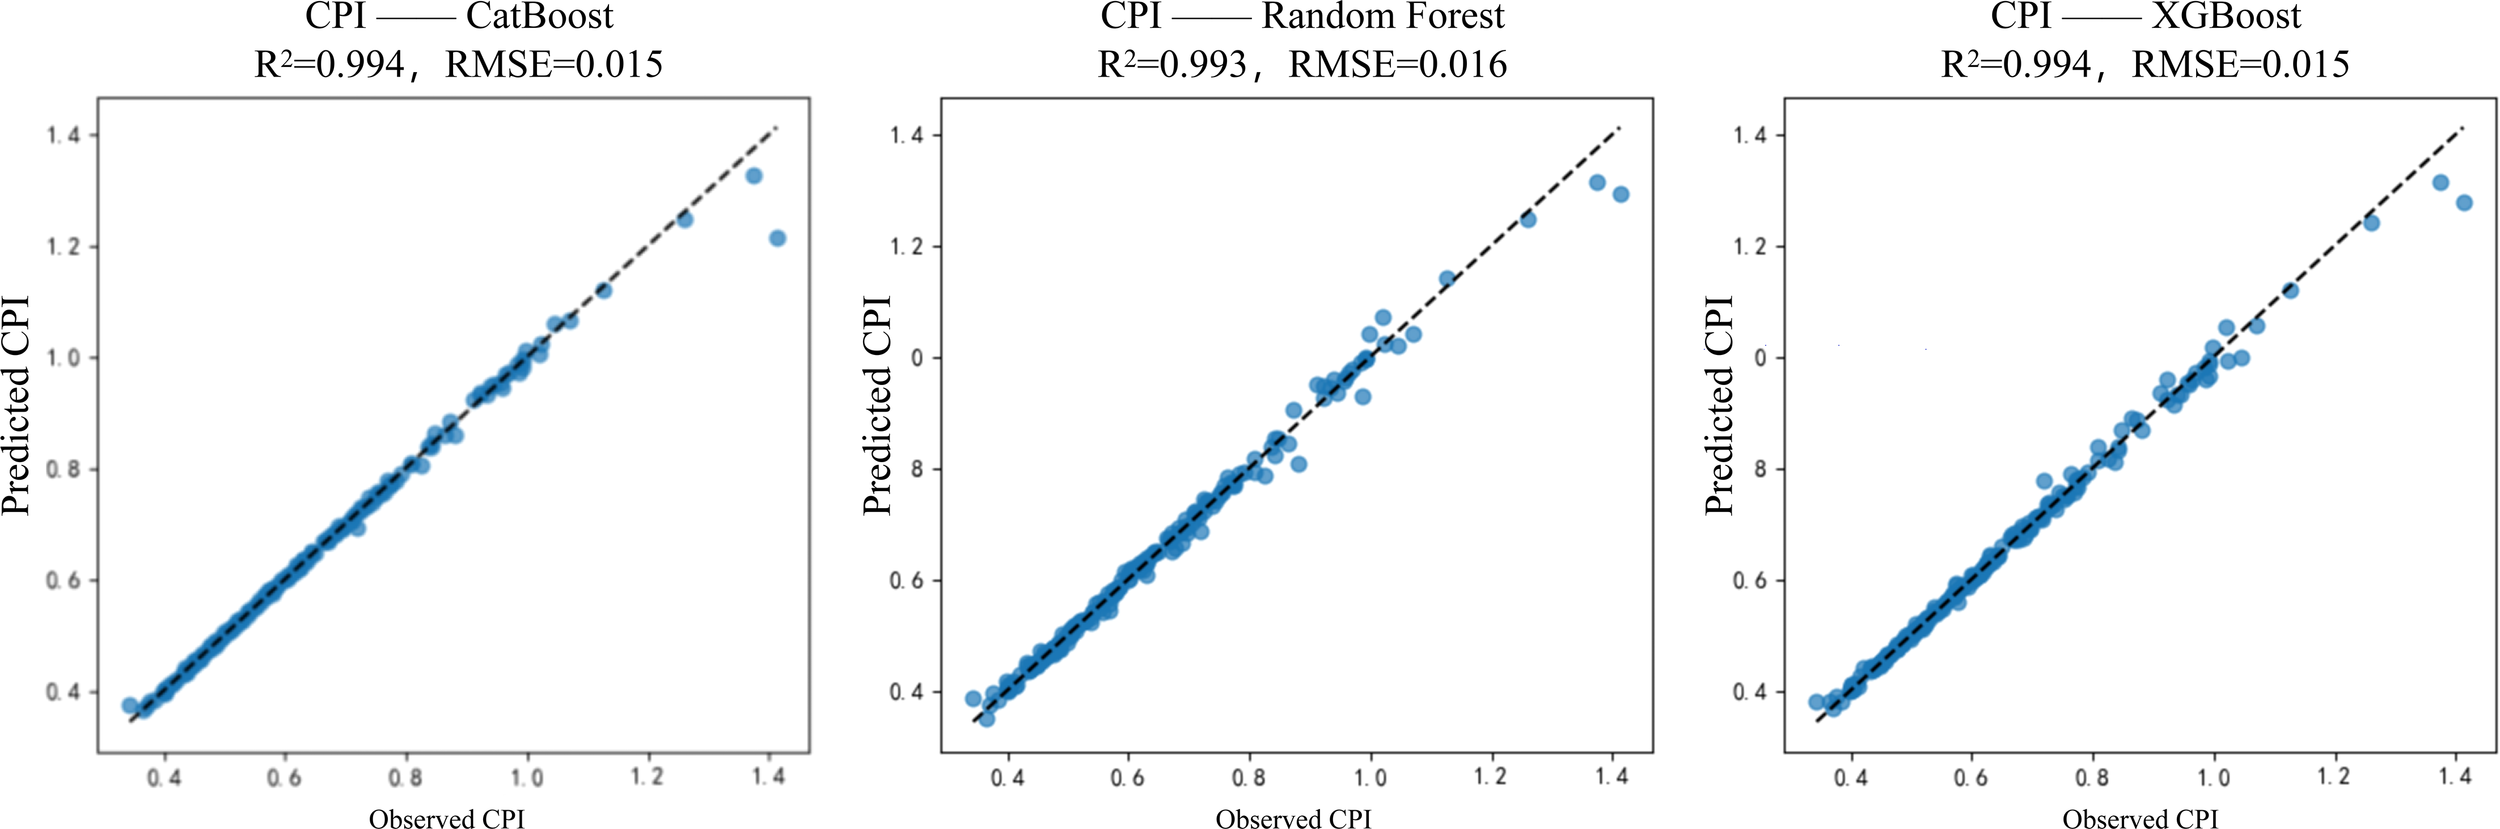
Evaluation of CPI prediction performance using three machine learning models.
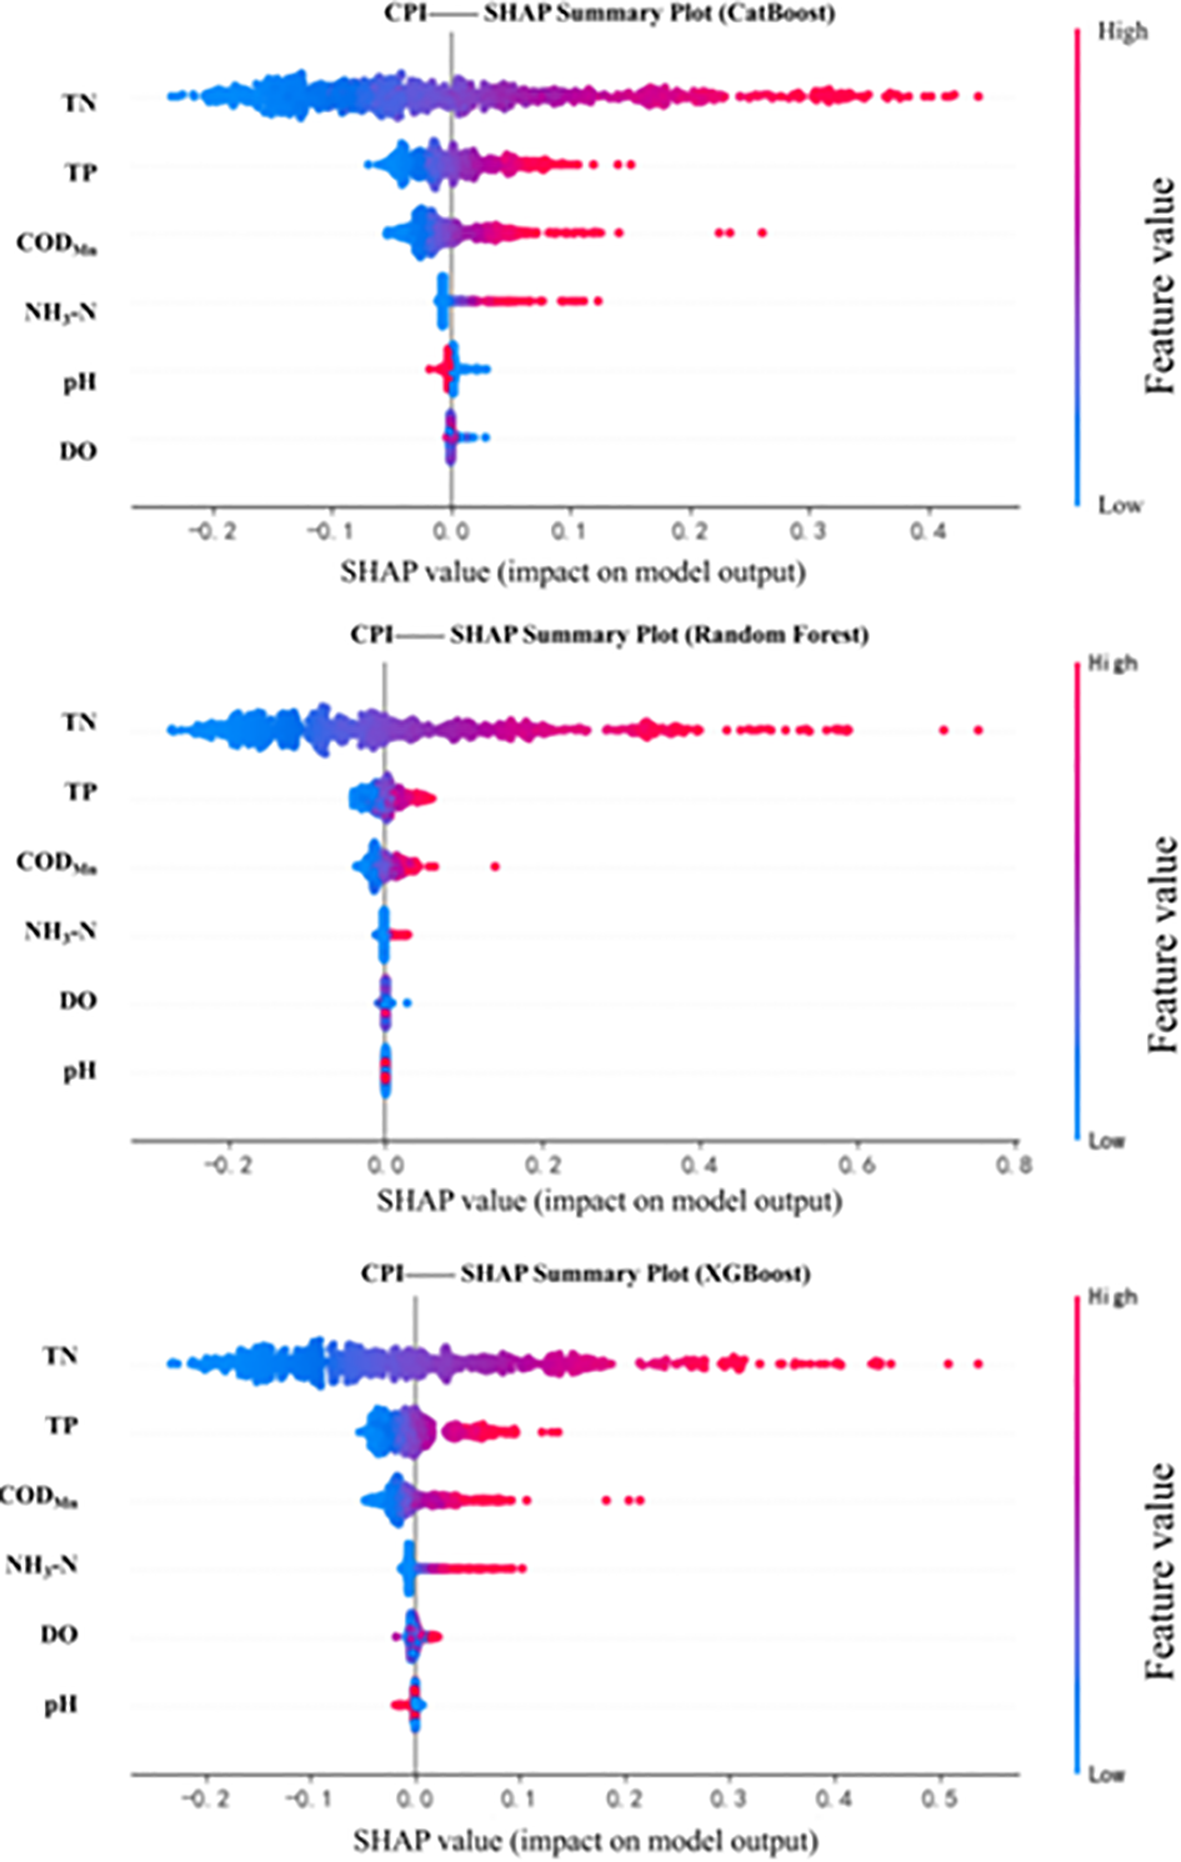
To enhance the interpretability of the model results, the SHAP method was further introduced to conduct interpretative analysis of the predictions from the three models (Figure 7) (Liu et al., 2025a). Despite differences in model architecture and training strategies among CatBoost, RF, and XGBoost, the key influencing factors identified and their relative importance rankings exhibit a high degree of consistency, demonstrating robust analytical results (Choudhary et al., 2025).Across all models, TN consistently emerged as the dominant factor exerting the most significant influence on CPI. Its SHAP values exhibited the widest distribution range, with notably positive contributions observed in the high-value intervals. This indicates that elevated TN levels will persistently drive CPI increases, confirming nitrogen pollution as the core factor underpinning shifts in overall pollution levels (Xu et al., 2024).
Figure 7
SHAP summary plots illustrating the contribution of individual water quality indicators to CPI predictions across three machine learning models.
TP and CODMn exhibited secondary yet stable significance across all three models. The SHAP distribution for TP revealed a pronounced positive contribution to CPI within the medium-to-high concentration range, reflecting phosphorus inputs’ persistent role in the integrated pollution formation process (Wang et al., 2021); The contribution of CODMn indicates that organic matter loading significantly impacts overall pollution levels by intensifying pollution severity. This demonstrates that nutrient pollution and organic pollution are not independent factors in the formation of the CPI, but rather exert a synergistic influence on overall pollution risk (Xu et al., 2024).
Further analysis via PDP examined the combined impact of TN-CODMn interactions on CPI (Figure 8). The response surface profiles for TN-CODMn constructed across all three models exhibited high consistency, further validating the robustness of the analytical results (Xiong et al., 2025). PDP results indicate that CPI exhibits a pronounced monotonic response to TN, with its contour lines displaying an overall near-vertical distribution. This confirms TN as the primary driving factor governing CPI variation. Across the entire range of CODMn changes, increases in TN consistently lead to significant CPI increases, whereas isolated variations in CODMn exert relatively limited influence on CPI. Concurrently, CODMn exhibits pronounced synergistic amplification effects within the medium-to-high TN range. At lower TN levels, CPI variations under different CODMn conditions remain modest. However, once TN exceeds a certain threshold, increasing CODMn substantially elevates CPI, thereby intensifying the overall pollution risk. This indicates that organic load does not independently determine CPI, but rather amplifies overall pollution levels by intensifying pollution severity or altering pollution composition under high nitrogen conditions (Alvarado et al., 2020).
Figure 8
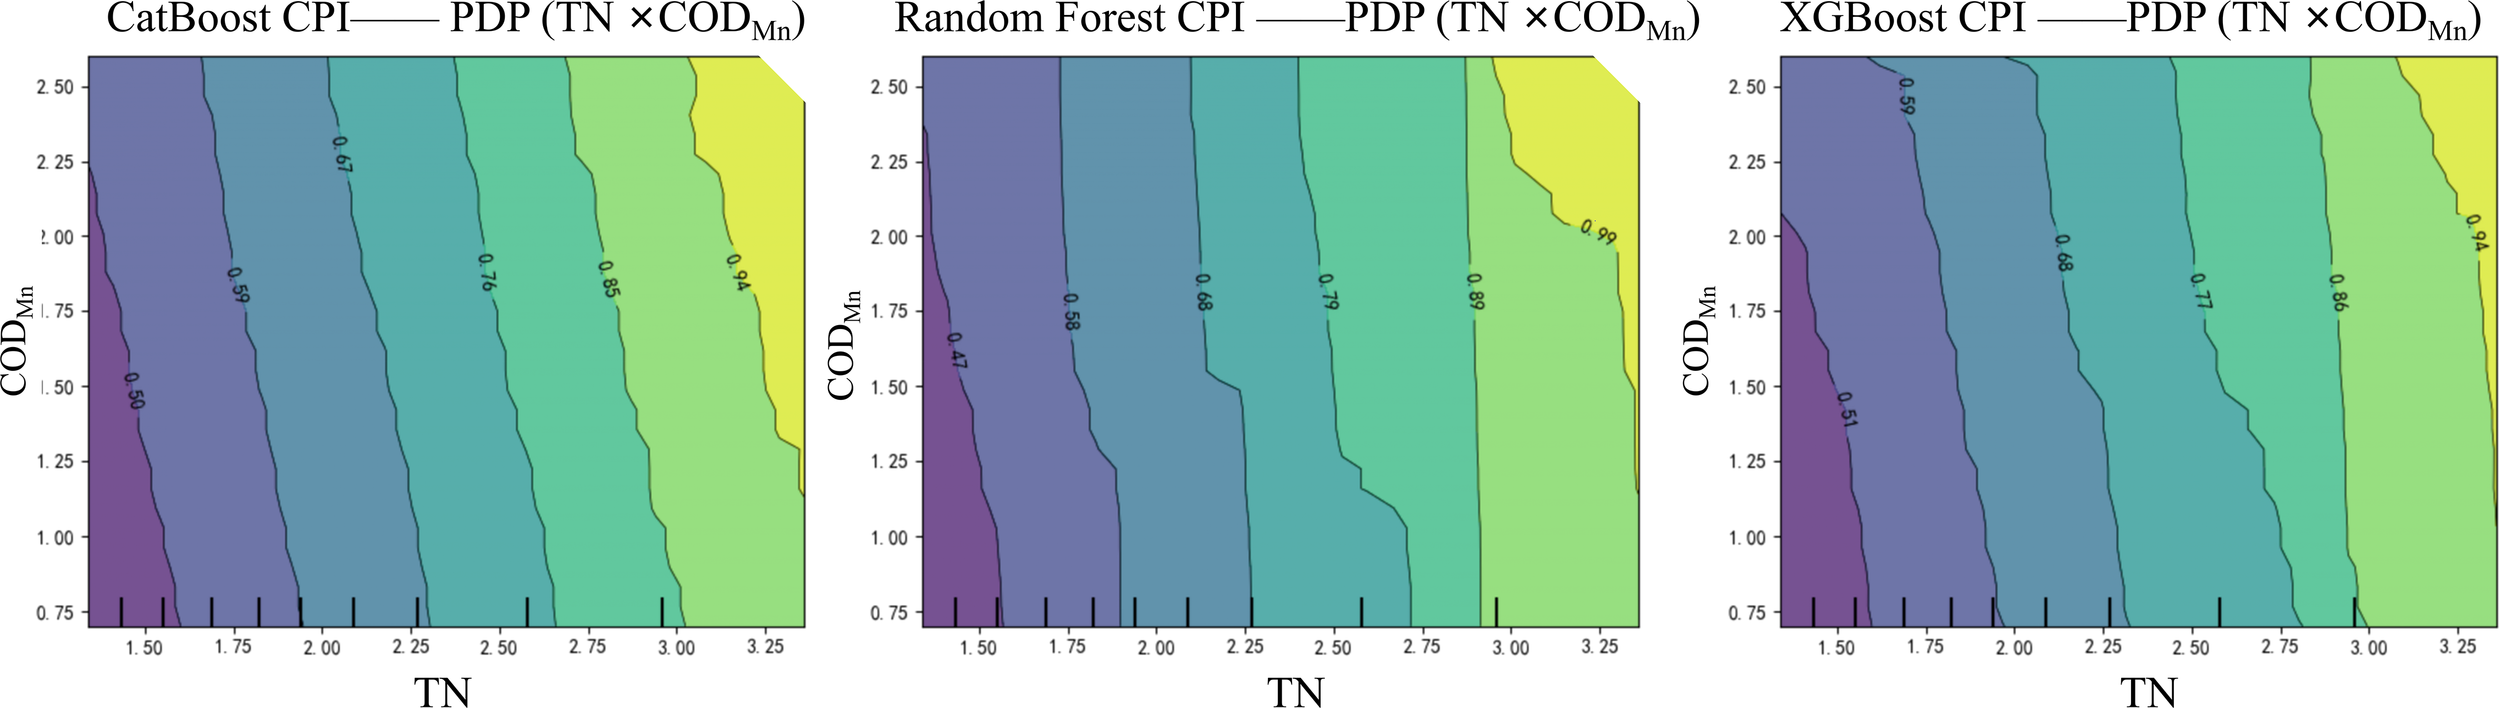
PDP response surfaces illustrating the interactive effects of TN and CODMn on the CPI.
4 Discussion
4.1 Multi-scale analysis
By integrating inter-monthly and inter-annual variations, spatial differences, correlation analysis, principal component analysis, and machine learning, the primary mechanisms governing water quality changes in the Luoqing River can be systematically elucidated across three dimensions: temporal, spatial, and pollution structure.
On a temporal scale, water temperature, dissolved oxygen, and certain nutrient indicators exhibited pronounced monthly fluctuations, whereas overall interannual variations remained relatively moderate. This indicates that water quality changes in the Luoqing River are primarily governed by seasonal processes, with short-term hydrological conditions and biogeochemical processes serving as key drivers of water quality fluctuations. Spearman’s correlation analysis further revealed widespread significant correlations between water temperature and nitrogen speciation, reflecting temperature’s crucial regulatory role in water quality structure by influencing microbial metabolism and nitrogen cycling processes.
At the spatial scale, significant differences in water quality structure were observed between different cross-sections. PCA results indicated that distinct differentiation characteristics emerged in the principal component space across different cross-sections. Nutrients (TN, TP) and organic pollution indicators (CODMn) jointly dominated the primary direction of water quality variation (Nath Roy et al., 2024). SHAP interpretation results further confirm that TN is the primary controlling factor driving variations in the CPI. Meanwhile, TP and organic load (CODMn) act as secondary yet stable significant factors, exhibiting a pronounced synergistic amplification effect on CPI under high nitrogen conditions (Nallakaruppan et al., 2024).
The two-dimensional PDP revealed the interactive mechanisms among pollution factors, indicating that CPI exhibits a distinct monotonic response to TN. TN exerts a persistent positive influence on CPI across the entire concentration range, demonstrating that nitrogen pollution plays a fundamental and decisive role within the study area (Aderemi et al., 2025). In contrast, the impact of CODMn exhibits pronounced scenario dependency, with its increase only significantly amplifying CPI when TN reaches elevated levels. The observed synergistic effect between TN and CODMn under high nitrogen conditions may reflect coupled biogeochemical processes: elevated organic matter (indicated by CODMn) provides carbon substrates for denitrifying bacteria, while high TN concentrations can inhibit complete denitrification, leading to N2O accumulation. Additionally, organic matter decomposition consumes dissolved oxygen, potentially shifting nitrogen cycling toward ammonification pathways.
The combined results of traditional statistical analysis and machine learning methods suggest that the primary mechanisms governing water quality fluctuations in the Luoqing River are as follows: seasonal processes dominate short-term variations, spatial location and human activity intensity determine pollution background levels, while nitrogen loading, through synergistic interactions with organic matter and phosphorus, primarily governs the formation and evolution of overall pollution levels.
4.2 Management recommendations based on differences in pollution patterns
Based on the findings of the aforementioned mechanism analysis, it is necessary to implement differentiated and targeted water environment regulatory strategies for different sections of the Luoqing River, taking into account the pollution structure and spatial heterogeneity.
(1) Upper river section: Focusing on the coordinated control of nitrogen and organic pollutants
The upstream river section exhibited overall high loads of TN, TP and CODMn in PCA and machine learning analyses, representing the key area driving elevated CPI values. This region should prioritise nitrogen pollution control as its primary objective, while strengthening coordinated management of agricultural non-point source pollution, domestic sewage discharge and industrial organic wastewater. It is recommended to mitigate the amplifying effect of organic matter inputs on comprehensive pollution risks under high nitrogen conditions and reducing TN discharge by 30% by enhancing agricultural fertiliser management and improving rural sewage collection and treatment facilities.
(2) Mid-river section: Mitigating nitrogen transformation and short-term fluctuation risks.
The middle reaches exhibit pronounced inter-monthly fluctuations over temporal scales. Correlation analyses reveal strong interconnections between nitrogen species, indicating active nitrogen cycling processes in this region. Management efforts should prioritise addressing runoff erosion during the rainy season and pollutant accumulation during low-flow periods. This can be achieved by strengthening flood season oversight, enhancing sewage interception and storage capacity, thereby mitigating water quality risks arising from rapid transformations between nitrogen species.
(3) Downstream river section: Maintain water quality stability and ecological buffer function
The downstream river section exhibits a relatively low overall pollution load and a more stable water quality structure, predominantly falling within the low CPI range in both PCA and machine learning analyses. The primary objectives for this area should be to maintain the current water quality status and prevent pollution rebound. This can be achieved by protecting riparian ecosystems, enhancing the water body’s self-purification capacity, and leveraging its role in buffering and mitigating pollution from upstream sources.
5 Conclusion
Based on water quality monitoring data from typical cross-sections of the Luoqing River between January 2023 and March 2025, a systematic investigation into water quality variation characteristics and their primary control mechanisms was conducted. This integrated time-series analysis, multivariate statistical methods, and multiple machine learning models. Results indicate that water quality in the Luoqing River exhibits significant seasonal fluctuations on a monthly scale, while interannual variations remain relatively moderate. This suggests that short-term hydrological conditions and biogeochemical processes are the primary drivers of water quality changes. At the spatial scale, distinct water quality characteristics were observed across different sections, with nutrients and organic pollution indicators exhibiting heterogeneous distribution between river segments. Correlation analysis and principal component analysis consistently revealed significant synergistic variation among TN, TP, NH3-N and CODMn, constituting the primary pollution structure driving water quality changes. Models constructed using CatBoost, RandomForest, and XGBoost all achieved high-precision prediction of the CPI, identifying total nitrogen as the primary controlling factor driving CPI variation. Total phosphorus and organic matter exhibited pronounced synergistic amplification effects under high nitrogen conditions. Overall, water quality dynamics in the Luoqing River are governed by a pollution structure centred on nitrogen contamination, with synergistic regulation by phosphorus and organic matter. Precise control of nitrogen inputs, combined with synergistic management strategies, represents a key pathway for reducing comprehensive pollution risks and enhancing water environmental quality within the basin. The transferable methodology established here can be applied to similar medium-sized rivers experiencing agricultural and urban pollution pressures.
Statements
Data availability statement
The original contributions presented in the study are included in the article/supplementary material. Further inquiries can be directed to the corresponding authors.
Author contributions
JZ: Conceptualization, Validation, Writing – original draft. YH: Methodology, Writing – review & editing. JY: Software, Validation, Visualization, Writing – original draft. KaD: Validation, Writing – original draft. HL: Resources, Writing – original draft. DW: Data curation, Writing – original draft. YX: Formal analysis, Writing – original draft. KuD: Investigation, Project administration, Supervision, Writing – original draft.
Funding
The author(s) declared that financial support was received for this work and/or its publication. This research was funded by the Guangxi Key Research and Development Program (grant number GuikeAB24010118), the Guangxi Natural Science Foundation (grant number 2025GXNSFDA069043 and 2025GXNSFBA069116), the Natural Science Foundation of China (grant number 52260023), the Research funds of The Guangxi Key Laboratory of Theory and Technology for Environmental Pollution Control (grant number 2301Z003), the Guangxi Talent Hub for Novel Materials and Equipment in Aquatic Ecosystem Restoration, the Sanya Science and Technology Special Fund (grant number 2022KJCX06) and the Central Public-interest Scientific Institution Basal Research Fund (grant number 1630042024012).
Conflict of interest
The author(s) declared that this work was conducted in the absence of any commercial or financial relationships that could be construed as a potential conflict of interest.
Generative AI statement
The author(s) declared that generative AI was not used in the creation of this manuscript.
Any alternative text (alt text) provided alongside figures in this article has been generated by Frontiers with the support of artificial intelligence and reasonable efforts have been made to ensure accuracy, including review by the authors wherever possible. If you identify any issues, please contact us.
Publisher’s note
All claims expressed in this article are solely those of the authors and do not necessarily represent those of their affiliated organizations, or those of the publisher, the editors and the reviewers. Any product that may be evaluated in this article, or claim that may be made by its manufacturer, is not guaranteed or endorsed by the publisher.
References
1
Aderemi I. A. Kehinde T. O. Okwor U. D. Ahmad K. H. Adjei K. Y. Ekechi C. C. (2025). Explainable AI for water quality monitoring: A systematic review of transparency, interpretability, and trust. IEEE Sensors Rev.2, 419–443. doi: 10.1109/SR.2025.3595500
2
Alvarado V. I. Hsu S.-C. Lam C.-M. Lee P.-H. (2020). Beyond energy balance: environmental trade-offs of organics capture and low carbon-to-nitrogen ratio sewage treatment systems. Environ. Sci. Technol.54, 4746–4757. doi: 10.1021/acs.est.9b05755
3
Anh N. T. Can L. D. Nhan N. T. Schmalz B. Luu T. L. (2023). Influences of key factors on river water quality in urban and rural areas: A review. Case Stud. Chem. Environ. Eng.8, 100424. doi: 10.1016/j.cscee.2023.100424
4
Benkov I. Varbanov M. Venelinov T. Tsakovski S. (2023). Principal component analysis and the water quality index-A powerful tool for surface water quality assessment: A case study on struma river catchment, Bulgaria. Water15, 1961. doi: 10.3390/w15101961
5
Caissie D. (2006). The thermal regime of rivers: a review. Freshw. Biol.51, 1389–1406. doi: 10.1111/j.1365-2427.2006.01597.x
6
Chidiac S. El Najjar P. Ouaini N. El Rayess Y. El Azzi D. (2023). A comprehensive review of water quality indices (WQIs): history, models, attempts and perspectives. Rev. Environ. Sci. Bio-Technology22, 349–395. doi: 10.1007/s11157-023-09650-7
7
Choudhary R. Kumar A. C P. Naik M. Choudhury M. Khan N. (2025). Predicting water quality index using stacked ensemble regression and SHAP based explainable artificial intelligence. Sci. Rep.15, 3119. doi: 10.1038/s41598-025-09463-4
8
Deng A. Ye C. Liu W. (2018). Spatial and seasonal patterns of nutrients and heavy metals in twenty-seven rivers draining into the south China sea. Water10, 50. doi: 10.3390/w10010050
9
Deng R. Zhu T. Zhou W. Liu F. Lin X. (2025). Machine learning based water quality evolution and pollution identification in reservoir type rivers. Environ. pollut.382, 126668. doi: 10.1016/j.envpol.2025.126668
10
Diamantini E. Lutz S. Mallucci S. Majone B. Merz R. Bellin A. (2018). Driver detection of water quality trends in three large European river basins. Sci. Total Environ.612, 49–62. doi: 10.1016/j.scitotenv.2017.08.172
11
Ding F. Hao S. Zhang W. Jiang M. Chen L. Yuan H. et al . (2025). Using multiple machine learning algorithms to optimize the water quality index model and their applicability. Ecol. Indic.172, 113299. doi: 10.1016/j.ecolind.2025.113299
12
Ding F. Zhang W. Cao S. Hao S. Chen L. Xie X. et al . (2023). Optimization of water quality index models using machine learning approaches. Water Res.243, 120337. doi: 10.1016/j.watres.2023.120337
13
Hamdhani H. Eppehimer D. E. Quanrud D. M. Bogan M. T. (2023). Seasonal and longitudinal water quality dynamics in three effluent-dependent rivers in Arizona. PeerJ11, e15069. doi: 10.7717/peerj.15069
14
Huang R. Deng J. Xiao Y. Yao L. Cui G. Fei Z. (2025). Research on high-precision fault identification of proton exchange membrane fuel cell experiment based on multiple correlation analysis and deep learning. Int. J. Hydrogen Energy158, 150530. doi: 10.1016/j.ijhydene.2025.150530
15
Li Y. Liu L. Cheng L. Shan Y. (2025). Unveiling surface water quality and key influencing factors in China using a machine learning approach. Sustainability17, 9205. doi: 10.3390/su17209205
16
Liu C. Yuan X. Li H. Qi Y. Shen X. Miao S. et al . (2025a). DDWQI: A novel water quality index based on data-driven approaches. Ecol. Indic.178, 113850. doi: 10.1016/j.ecolind.2025.113850
17
Liu H. Gao L. Yuan Z. Ma T. (2025b). Contrasting seasonal variations in riverine nitrogen and phosphorus concentrations in China: implications for N/P imbalances. Water Res.287, 124317. doi: 10.1016/j.watres.2025.124317
18
Liu S. Qiu Y. Fu R. Liu Y. Suo C. (2023). Identifying the water quality variation characteristics and their main driving factors from 2008 to 2020 in the Yellow River Basin, China. Environ. Sci. pollut. Res.30, 66753–66766. doi: 10.1007/s11356-023-27142-7
19
Masood A. Niazkar M. Zakwan M. Piraei R. (2023). A machine learning-based framework for water quality index estimation in the southern bug river. Water15, 3543. doi: 10.3390/w15203543
20
Ministry of Environmental Protection of the People’s Republic of China (2002). Environmental quality standards for surface water (GB3838-2002) (Beijing: China Environmental Science Press).
21
Nallakaruppan M. Gangadevi E. Shri M. Balusamy B. Bhattacharya S. Selvarajan S. (2024). Reliable water quality prediction and parametric analysis using explainable AI models. Sci. Rep.14, 7520. doi: 10.1038/s41598-024-56775-y
22
Nath Roy B. Roy H. Rahman K. S. Mahmud F. Bhuiyan M. M. K. Hasan M. et al . (2024). Principal component analysis incorporated water quality index modeling for Dhaka-based rivers. City Environ. Interact.23, 100150. doi: 10.1016/j.cacint.2024.100150
23
Ouellet V. St-Hilaire A. Dugdale S. Hannah D. Krause S. Proulx-Ouellet S. (2020). River temperature research and practice: Recent challenges and emerging opportunities for managing thermal habitat conditions in stream ecosystems. Sci. Total Environ.736, 139679. doi: 10.1016/j.scitotenv.2020.139679
24
Qian Y. Migliaccio K. Wan Y. Li Y. (2007). Surface water quality evaluation using multivariate methods and a new water quality index in the Indian River Lagoon, Florida. Water Resour. Res.43, W08405. doi: 10.1029/2006wr005716
25
Shams M. Elshewey A. El-Kenawy E. Ibrahim A. Talaat F. Tarek Z. (2023). Water quality prediction using machine learning models based on grid search method. Multimedia Tools Appl. 83, 35307-35334. doi: 10.1007/s11042-023-16737-4
26
Shrestha S. Kazama F. (2007). Assessment of surface water quality using multivariate statistical techniques: A case study of the Fuji river basin, Japan. Environ. Model. Software22, 464–475. doi: 10.1016/j.envsoft.2006.02.001
27
Wang F. Wang Y. Zhang K. Hu M. Weng Q. Zhang H. (2021). Spatial heterogeneity modeling of water quality based on random forest regression and model interpretation. Environ. Res.202, 111660. doi: 10.1016/j.envres.2021.111660
28
Wang Y. Wang C. Zhang C. Liang J. Mi W. Song G. et al . (2023). Water quality variation in the middle route of South-to-North Water Diversion Project, China. Front. Environ. Sci.11, 945884. doi: 10.3389/fenvs.2023.945884
29
Xiong Z. Liu X. Igou T. Li Z. Chen Y. (2025). Using hybrid machine learning to predict wastewater effluent quality and ensure treatment plant stability. Water17, 1851. doi: 10.3390/w17131851
30
Xu J. Mo Y. Zhu S. Wu J. Jin G. Wang Y. et al . (2024). Assessing and predicting water quality index with key water parameters by machine learning models in coastal cities, China. Heliyon10, e33695. doi: 10.1016/j.heliyon.2024.e33695
31
Yang S. Wang R. Zhao W. (2025). Characteristics of the water environment and the mechanism of nitrogen metabolism in the xisha river. Sustainability17, 4060. doi: 10.3390/su17094060
32
Yang X.-E. Wu X. Hao H.-L. He Z.-L. (2008). Mechanisms and assessment of water eutrophication. J. Zhejiang Univ. Sci. B9, 197–209. doi: 10.1631/jzus.B0710626
33
Yang Y. Huang X. Wu X. Liu C. Zhao S. Zhu X. (2023). The spatiotemporal variations characteristic and pollution evaluation of water quality in Qujiang River, China. Appl. Water Sci.13, 32. doi: 10.1007/s13201-022-01829-7
34
Zeng J. Liu Z. Liu X. Zhang L. Zhang J. Zeng Y. (2023). The spatiotemporal variations and potential causes of water quality of headwaters of dongjiang river, southeastern China. Sustainability15, 6455. doi: 10.3390/su15086455
35
Zhang H. Huang M. Sun Y. Deng X. Cai J. Du C. et al . (2023). Water quality evaluation and correlation analysis between dissolved oxygen and various water quality indicators in zhou river. Adv. Environ. Prot.13, 1363–1370. doi: 10.12677/AEP.2023.136164
36
Zhang X. Liu Y. Zhou L. (2018). Correlation analysis between landscape metrics and water quality under multiple scales. Int. J. Environ. Res. Public Health15, 1606. doi: 10.3390/ijerph15081606
37
Zhang X. Yu B. Xin Z. Cong M. Zhang C. (2025). Spatial-temporal variations of river water quality under human-induced land use changes in large river basins. Sci. Rep.15, 36955. doi: 10.1038/s41598-025-20876-z
38
Zhao K. Fu H. Zhu Y. Wang Y. Wang S. Li F. (2023). Environmental impacts of nitrogen and phosphorus nutrient diffusion fluxes at a sediment-water interface: the case of the yitong river, China. Sustainability15, 1210. doi: 10.3390/su15021210
39
Zhu M. Wang J. Yang X. Zhang Y. Zhang L. Ren H. et al . (2022). A review of the application of machine learning in water quality evaluation. Eco-Environment Health1, 107–116. doi: 10.1016/j.eehl.2022.06.001
Summary
Keywords
composite pollution index, correlation analysis, luoqing river, machine learning, principal component analysis, water quality
Citation
Zhang J, Huang Y, Yang J, Deng K, Li H, Wang D, Xu Y and Dong K (2026) Machine learning-based correlation analysis of conventional water quality parameters and composite pollution index in the Luoqing river of the South China Sea Coastal Zone. Front. Mar. Sci. 13:1782614. doi: 10.3389/fmars.2026.1782614
Received
07 January 2026
Revised
23 January 2026
Accepted
26 January 2026
Published
10 February 2026
Volume
13 - 2026
Edited by
Dongming Wu, Chinese Academy of Tropical Agricultural Sciences, China
Reviewed by
Sze-Mun Lam, Tunku Abdul Rahman University, Malaysia
Liying Zhu, Chinese Academy of Sciences (CAS), China
Tongchun Qin, Nantong Institute of Technology (NIT), China
Updates
Copyright
© 2026 Zhang, Huang, Yang, Deng, Li, Wang, Xu and Dong.
This is an open-access article distributed under the terms of the Creative Commons Attribution License (CC BY). The use, distribution or reproduction in other forums is permitted, provided the original author(s) and the copyright owner(s) are credited and that the original publication in this journal is cited, in accordance with accepted academic practice. No use, distribution or reproduction is permitted which does not comply with these terms.
*Correspondence: YuFeng Xu, 2021001@glut.edu.cn; Kun Dong, 2020005@glut.edu.cn
Disclaimer
All claims expressed in this article are solely those of the authors and do not necessarily represent those of their affiliated organizations, or those of the publisher, the editors and the reviewers. Any product that may be evaluated in this article or claim that may be made by its manufacturer is not guaranteed or endorsed by the publisher.