Abstract
This study investigated how normal corneal stromal profiles change with age, sex, and corrected intraocular pressure (IOP). A retrospective observational analytical study was conducted in Jordan, employing anterior segment spectral-domain optical coherence tomography AS-OCT, a measured corneal stromal thickness (CST) in 134 eyes across the central 6-mm corneal diameter. People between the ages of 18 and 79 were included, and the mean CST values were linked to age groups, IOP, and cis-gender populations, with the exclusion of certain eye conditions. The central stroma was thinnest at 484.6 (±32.6) μm, contrasting with the outer peripheral superior zone’s maximum thickness at 549.3 (±40.6) μm. A positive correlation between CST and the 30–49 age group was noted. In conclusion, this study highlights a centrifugal CST distribution, with the central stroma being the thinnest and the superior stroma being the thickest. AS SD-OCT, employing novel algorithms, proves vital in refractive surgery planning and corneal disease diagnosis. The research offers valuable insights into age, gender, and IOP interactions with corneal stromal characteristics, enhancing clinical strategies for corneal pathologies in the Jordanian population.
1 Introduction
In terms of structure, the cornea is composed of an avascular, collagen-rich stromal tissue lined by a self-renewing, stratified, non-keratinizing squamous epithelium that functions as a physical barrier between the eye’s internal structures and the outside world, thus protecting the eye from the external environment (1). The transparency of the cornea is dependent on the precise organization of the stroma proper. This orderly arrangement of uniform, small-diameter collagen fibrils is crucial for its transparency (2). In this regard, the absence of blood vessels, the unique architecture of collagen fibers, homogeneous extracellular matrix (ECM), and the relatively small number of stromal cells are all essential components (3).
Optical coherence tomography has been developed to reconstruct images of ocular structures including corneal thickness measurement, which has the advantages of non-contact, faster performance, and high reliability and repeatability (4–6). Moreover, the Anterior Segment OCT automatically generates corneal epithelial and stromal thickness maps, by which clinicians can obtain a wide-field evaluation of corneal thickness. OCT has become an essential clinical tool in ophthalmology. Cross-sectional images of the cornea, retina, choroid, and optic nerve can be obtained non-invasively by OCT. AS-OCT is used routinely for the diagnosis, evaluation of the progression of the disease, and monitoring the structural changes of the cornea before, during, and after treatments (4, 5, 7).
Studies have been done suggesting a link between central corneal thickness (CCT) and intraocular pressure (IOP), while some explained the findings as measurement errors due to overestimation of IOP in thicker corneas (8), others have concluded that CCT might be a powerful predictor of open angle glaucoma. Studies concerning corneal stromal thickness (CST) are a steppingstone to exploring this possible link and might help further ascertain central corneal thickness and CST as predictors of glaucoma.
Despite its clinical significance—add to the aforementioned, diagnosing keratoconus, pellucid degeneration, LASIK flap measurement, cross-linking depth assessment, trans-epithelial photorefractive keratectomy (Trans-PRK), corneal scar measurement in phototherapeutic keratectomy (PTK), and post-refractive surgery follow-up—the literature on the stromal thickness and its relationship to different variables such as age, sex, and IOP is scarce, and the studies that have been done deal with specific ethnicities and are limited by region. Given this, we considered it important to study stromal thickness. This, first of its type, study will increase our understanding of the normal stromal characteristics in Jordan and nearby Middle Eastern countries.
2 Materials and methods
2.1 Design and setting
This is a cross-sectional retrospective study that was conducted between January 2015 and December 2021 at the Amman Eye Clinic, a private ophthalmology center located in Amman, Jordan. A total of 134 eyes of 134 individuals out of 464 individuals examined were recruited for this study and provided consent to participate in the study, eye examination and consent to publication.
2.2 Sample size calculation
The G*Power (version 3.1.9.7) program was used to calculate the sample size, based on regression test. The minimum sample size required was 129 (power = 0.95, α = 0.05, medium effect size = 0.15, predictors = 4). A total of 134 were recruited for this study.
2.3 Eye selection procedure
Volunteers, patients seeking refractive surgery or cataract consultations, and patients seeking comprehensive ophthalmology examinations aged 18–79 were voluntarily enrolled in the study using a convenience sampling method (aka non-probability sampling). The study required the participants to meet the criteria for a normal cornea, defined by conducting a clinical examination and ruling out any exclusion criteria.
We performed all ocular scans between 12:00 PM and 6:00 PM to account for daily fluctuations in pachymetric thickness (9–12). For statistical analysis, we selected only one eye based on the best signal strength index, lack of segmentation errors, image centration to pupil, and absence of the previously mentioned exclusion criteria. In case of both eyes met normal corneal parameters, and then a random selection was made (Figure 1A). We also performed a full ocular examination to rule out any corneal abnormalities, including corneal scarring, keratoconus, prior intraocular surgery, high myopia, and hyperopia, among others. The majority of cases (n = 133) used either subjective refraction or automated refraction (Topcon KR-8000, Tokyo, Japan).
Figure 1

(A) Corneal Stromal Map (6 mm Ø) generated using Optovue Anterior segment OCT. Notice the non-homogeneous stromal surface as compared to the pachymetry surface. Examples of scans that were excluded. (B) A decentered scan of the left eye caused the corneal apex to shift to the nasal side; (C) Poor scan quality because of scan area coverage; (D) Subepithelial deposits caused by adenoviral keratitis in which the stroma is weakened; if the patient also has corneal ectasia, this condition could cause confusion.
2.4 Exclusion criteria
The medical records and scans of participants were examined for the following exclusion criteria: scans with inadequate corneal coverage, poor signal, scans that were off-centered (Figure 1B), or scans with a significant amount of irregularity (Figure 1C) (7). Previous intraocular surgery, contact lens wearing, post-refractive surgery, corneal inflammation (Figure 1D), dystrophy, dellen, pterygium, significant refractive errors (myopia >6D, hyperopia >4D, or astigmatism >3D), or glaucoma are all risk factors for these conditions. Scheimpflug tomography was used to identify keratectasia and keratoconus. To lessen the chance of causing harm to corneal epithelial cells, participants having tear film breakdown times less than 5 s, Schirmer I test results of less than 10 mm/5 min, or positive corneal staining/pooling were also disqualified. Macular scarring, age-related cataract, macular degeneration, newly diagnosed diabetic individuals, and retinitis pigmentosa were, nonetheless, included in the study (7). Additionally, all included scans were checked for signal strength index and corrected segmentation lines.
2.5 Keratoconus screening criteria
Finally, the keratoconus logistic regression model created by Qin et al. (9), was used to check each scan for keratoconus. As a result, each case with a high risk of developing keratoconus called for a repeated topography as well as, in some cases, a revision of the slit lamp and AS-OCT scans. We also disregarded cases of forme fruste keratoconus (FFK) or high risk for developing keratoconus.
2.6 Ethical approval
This study adhered to the principles of the Declaration of Helsinki and was approved by the Institutional Review Board at Applied Science University (2021-PHA-41). At the time of the initial clinic appointment, each subject’s and/or their guardian’s written informed consent was obtained for imaging, the measurement of corrected IOP, and the evaluation for dry eyes.
2.7 AS-OCT measurement of the CST
The CST measurements were taken using the add-on lens of the corneal adapter (CAM-L module, S/N 43412) and the anterior segment platform of the Optovue Avanti® 70,000 A-scans/second (Optovue, Fremont, CA, United States) spectral-domain OCT. There were eight meridional B-scans per capture, each with 1,024 A-scans and an axial resolution of 5 μm covering a 6 mm-diameter area. To avoid mistakes in corneal curvature or changes to the results, subjects were instructed to keep their eyes open wide while the scan was taking place. The operator made no attempt to open the subjects’ eyes. Within a few seconds of adequate fixation and centration, a scan was produced. The tear-film breakup time was reached before all readings were taken. Ophthalmic examinations and the Schirmer test were performed.
The corneal thickness maps were automatically created, with a total of 17 zones: one central zone with a diameter of 2 mm, eight paracentral zones making a circle 3 mm wide, and eight outer peripheral zones producing an outer circle 1 mm wide. The demographic and subject characteristic data were manually entered into Excel sheets where they were reviewed for accuracy and the existence of outliers or missing values.
2.8 Manifest and subject refraction
In total, 133 patients underwent automatic and subjective refraction. Axis, sphere, and cylinder were recorded.
2.9 IOP measurement
In the majority of patients (n = 101), Goldmann applanation tonometry was used, and it was corrected for the central corneal thickness (13, 14).
2.10 Statistical analysis
IBM SPSS Statistics for Mac, Ver. 28.0.1.0, was used to perform the statistical analysis (IBM Corporation, Armonk City, NY, United States). The continuous data were examined for normality and homogeneity using the Kolmogorov–Smirnov and Levene’s tests, respectively. The measured descriptive statistics included mean, range, and standard deviations. Inter-eye variability was examined by independent t-test in the central stromal zone and the ANOVA test was used to compare quantitative data between the various inner and outer zones to the center stromal thickness. A Holm-Bonferroni (HB) adjusted for three comparisons, for the center, inner, and outer zones in each octant, was used to reduce Type I error. To ascertain the impact of age, IOP, and sex on the stromal thickness in various zones of the stromal map, linear regression models were used. If there is a difference in stromal thickness between men and women, it was determined using a student’s independent t-test statistics. Keratometry (K), flat Keratometry (K), steep K, K average, sphere, cylinder, mean sphere equivalent, corneal curvatures, and stromal deviation values were additional variables included in the analysis.
3 Results
This section may be divided by subheadings. It should provide a concise and precise description of the experimental results, their interpretation, as well as the experimental conclusions that can be drawn.
3.1 Descriptive statistics and sample demographics
A total of 134 eyes of 134 individuals out of 464 examined individuals were selected upon meeting the criteria for normal cornea. The majority of final study participants were Jordanians (67.2%), Iraqis (23.1%), and other Arab Gulf region citizens (9.7%).
Detailed descriptive statistics performed on data obtained from the medical records and scan results are presented in Table 1. It includes refractive errors, IOP and demographic characteristics of the study population. A total of 134 individuals composed of 68 males (50.7%) and 66 females were included for analysis. The mean age was 44.7 ± 17.6 (male 44.3 ± 16.9, female 45.2 ± 18.3) ranging from 18 to 79 years, 41.8% of them were older than 50 years. In addition, these age groups had a lower magnitude of refractive errors that ranged between −0.51 D to 0.44 D and higher mean IOPs (16.4–18.2 mmHg). An independent t-test was performed to evaluate if there is a mean difference between right eye (n = 64) and left eye (n = 70) central stromal thickness; there was no statistically significant difference present (p = 0.796).
Table 1
| Age group in years | Patients, n | Sex, M/F | Refractive Error, SD | IOP, mmHg, SD |
|---|---|---|---|---|
| < 30 | 38 | 17/21 | −1.64 ± 1.8 | 15.5 ± 3.0 |
| n = 37 | n = 20 | |||
| 30–49 | 40 | 25/15 | −1.34 ± 1.8 | 16.7 ± 2.5 |
| n = 40 | n = 36 | |||
| 50–69 | 42 | 22/20 | −0.51 ± 1.9 | 16.4 ± 4.4 |
| n = 42 | n = 33 | |||
| >70 | 14 | +0.44 ± 1.1 | 18.2 ± 2.7 | |
| 4/10 | n = 14 | n = 12 | ||
| Total | 134 | 66/68 | −0.97 ± 1.9 | 16.6 ± 3.4 |
| N = 133 | N = 101 |
Descriptive statistics of the study population per age group.
n, Count; IOP, Intra ocular pressure; SD, Standard deviation; mmHg, Millimeter mercury; M, Male; F, Female.
3.2 Stromal thickness in the 17 corneal zones
The mean thicknesses of the center, inner, and outer zones of the stroma in eight octants are illustrated in Figure 2A. Superior and superior nasal quadrants showed the thickest stroma as compared to inferior and inferior temporal quadrants 13.4%, 13.1%, 6.6%, and 4.4%, respectively. The central stroma was the thinnest with a mean of 484.6 ± 32.6 μm, while the thickest point was the outer peripheral superior zone with a mean of 549.3 ± 40.6 μm. Variance analysis (one-way ANOVA) was used to examine whether the differences in the means of the stromal thickness maps were statistically significant in each of the 17 zones that comprise the 6 mm diameter circle. The mean thickness of the stroma increases from the center to the periphery in a centrifugal pattern, nasal zones were thicker than their temporal counterparts (p < 0.05). To test if the centrifugal increase in stromal thickness from center to periphery is statistically significant and not attributed to a type I error, both the size effect (eta-squared) and two post-hoc tests were performed: Bonferroni correction and a less strict sequential Holm-Bonferroni (HB) test with three comparisons per octant. As shown in Supplementary Table 1, the inferotemporal and temporal zones were likely caused by a type I error.
Figure 2
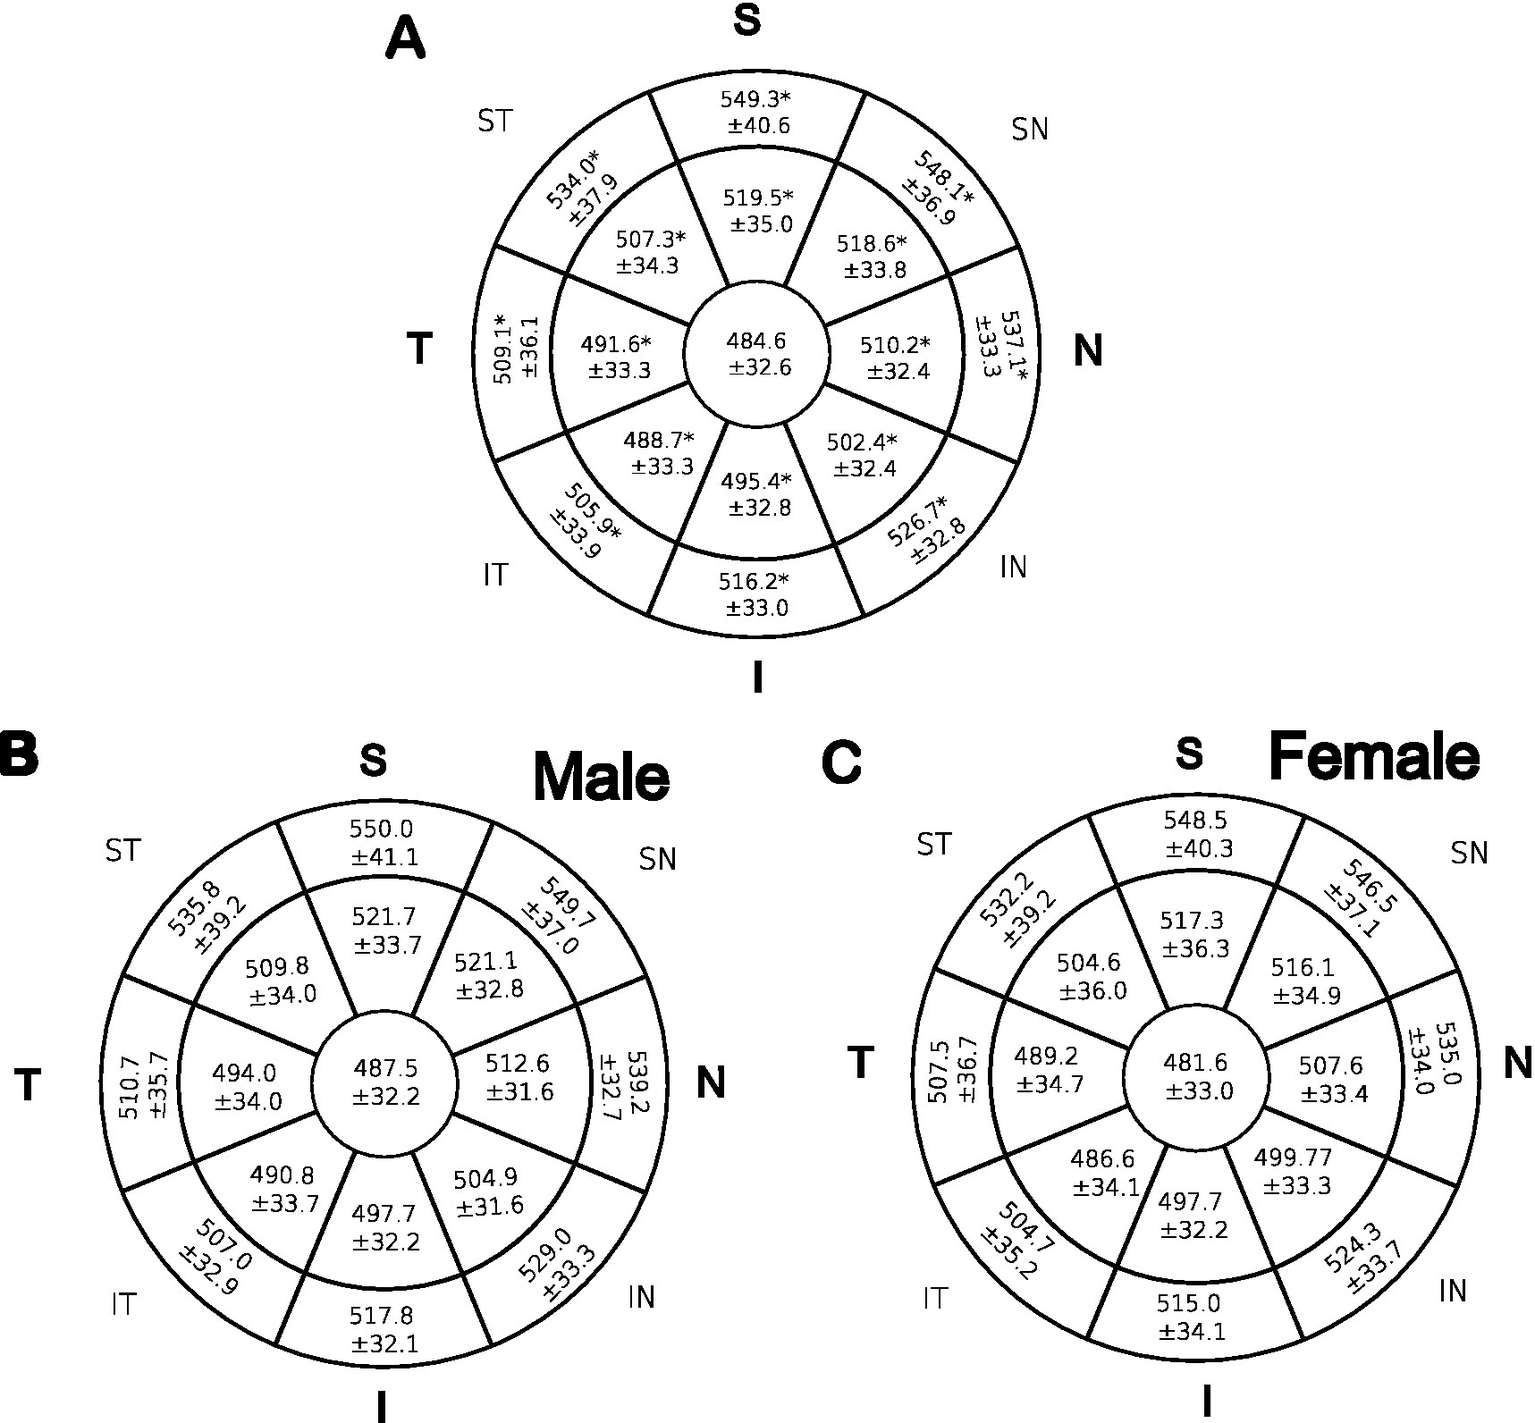
Mean CST in μm across 17 zones that make up eight octants. The means of each zone were compared using one-way ANOVA. (A): represent all patients. Student t-test was performed for panel (B) males and (C) females. *indicates significant p values < 0.05.
3.3 Gender
As illustrated, males (Figure 2B) showed thicker stroma than females (Figure 2C) in all zones examined by an independent t-test, for more statistical details refer to Supplementary Table 3. However, the difference was statistically insignificant (p > 0.05). Additionally, a linear regression analysis was conducted to determine whether there was a significant relationship between cis-gender within the same age group and between age groups of the same sex; no significant correlations were reported.
3.4 Effect of age on the stroma
A linear regression model was used to analyze the relationship between demographic factors such as age on stromal thickness, as shown in Supplementary Table 2. However, no statistically significant correlation between age as a continuous variable and stroma thickness was observed at p < 0.05. However, a negative, albeit insignificant, correlation between age and stromal thickness was observed in the central, inferior nasal, paracentral inferior, and paracentral inferior temporal zones, whereas all other zones demonstrated a positive, insignificant correlation.
Additionally, the age was divided into four sub-groups, and linear regression was used to analyze sub-group differences and correlations between age and stromal thickness. Interestingly, among those aged 30–49 years, 10 out of 17 stromal zones were statistically significant. In that particular cohort, the nasal quadrant resisted aging thinning alterations as demonstrated in Supplementary Table 2. The linear regression of the other age groups is presented in Supplementary Table 4.
Finally, the relationship between age and corneal stromal deviation was studied by the Pearson product–moment correlation coefficient, which led to the discovery that the determinant coefficient was significant (r = 0.235, p = 0.006). This indicates a moderately positive relationship between the two variables.
3.5 Intraocular pressure
Corrected IOP showed a strong correlation with stromal thickness in various stromal zones by linear regression as seen in Supplementary Table 2. Additionally, Supplementary Table 4 is a plot graph that demonstrates the negative linear regression correlation between the central stromal thickness and the corrected IOP.
4 Discussion
Corneal stromal thickness varies significantly between studies in normal adults, depending on factors like ethnic origin, sample demographics, refractive errors, diurnal variations, and age as seen in Table 2. Males had thicker stroma in all 17 zones, but the difference was not statistically significant. Furthermore, previous researchers, Figures 2B,C, supported this finding Table 2 (7, 12). We believe this observation is induced by sex hormones. This effect was demonstrated by the thickness of the corneal epithelia, which was significantly thicker in males compared to females (7, 13, 15). Gonadal hormone receptors are expressed in the nuclei of corneal epithelial, stromal, and endothelial cells (14, 16). Giuffra et al. (17) and Fortepiani et al. (18) demonstrated that the mean corneal thickness of women was thickest on the day of ovulation and thinnest at the end of the menstrual cycle. Interestingly, females showed more curved posterior cornea than males, this was reported in other research (19); one speculation is that it may be due to sex hormone levels and their fluctuation over time.
Table 2
| # | Author | Sample, n (M,F,All) | Age in years, Mean ± SD | ST in μm, Mean ± SD | AR in μm | Manufacture brand | Year |
|---|---|---|---|---|---|---|---|
| 1 | Kim et al. (15) | 122 (M) | 45.3 ± 18.0 | 489.6 ± 31.6 | 5 | Optovue RTVue | 2016 |
| 2 | Kim et al. (15) | 88 (F) | 43.7 ± 17.3 | 484.4 ± 32.8 | 5 | Optovue RTVue | 2016 |
| 3 | Optovue iVue FDA (31) | 108 (All) | 42.0 ± 15.7 | 485.2 ± 20.0 | 5 | Optovue iVue | 2017 |
| 4 | Hashmani et al. (13) | 118 (M) | 40.0 (All) | 467.4 ± 32.3 | 5 | Optovue Avanti | 2020 |
| 5 | Hashmani et al. (13) | 109 (F) | 466.7 ± 30.1 | 5 | Optovue Avanti | 2020 | |
| 6 | Reinstein et al. (12) | 110 eyes (56 All) | 38.4 ± 12.0 | 465.4 ± 36.9 | NA | Artemis VHFUS | 2009 |
| 7 | Haque et al. (32) | 20 (9F, 11 M) | 27.6 ± 5.9 | 463.4 ± 21.1 | NA | Humphrey-Zeiss OCT 2000 | 2008 |
| 8 | Batawi et al. (8) | 58 (M) | 68.2 ± 10.6 | 465.2 ± 31.2 | 4 | Zeiss Cirrus OCT | 2018 |
| 8 | Luft et al. (33) | 40 eyes (20 All) | 33 6 ± 11 | 482.1 ± 25.0 | 4.16 | Nidek | 2016 |
| 9 | Current study | 68 (M) | 44.3 ± 16.9 | 487.5 ± 32.2 | 5 | Optovue Avanti | 2022 |
| 10 | Current study | 66 (F) | 45.2 ± 18.3 | 481.6 ± 33.0 | 5 | Optovue Avanti | 2022 |
Literature reported central stromal thickness in normal adults.
n, Sample number; ST, Stromal thickness; AR, Axial resolution; M, Male; F, Female; SD, Standard deviation; VHFUS, Very high frequency ultrasound; NA, Not available.
Understanding the stromal thickness profile is fundamental for evaluating the biomechanics of the cornea in patients undergoing refractive surgery. Moreover, due to the fact that the following two conditions are linked with localized corneal thinning, normative stromal thickness profiles may prove to be a beneficial diagnostic tool for keratoconus or pellucid marginal degeneration (20, 21). It is essential that physicians investigate patients asking for surgery for risk factors that may alter the corneal thickness in certain patients, for instance in patients with sleep apnea, chronic hypoxia, and diabetic peripheral neuropathy (22–24).
Looking at the cornea at basic level may shed light on the normal and diseased eye. The normal human corneal stroma exhibits significant geometric anisotropy (25). Couple of previous studies applied x-ray scattering to plot the best-suited collagen orientation in normal corneas (26, 27). The preferred orthogonal orientation of the collagen was maintained in a vertical and horizontal pattern in the central cornea, where the collagen fibrils became circular or tangential in deposition at 1 mm from the limbus. The peripheral stromal region contains additional collagen lamellae and thus is thicker (25–27). This natural variation in corneal thickness has been linked to cell adhesion molecules like neurotrimin (NTM), contactin-associated protein-like 4 (CNTNAP4), and the collagen genes COL5A1 and COL8A2 (28).
Patel et al. (29) published a study in 2001 that studied the effect of aging on corneal tissues and discovered that keratocyte density decreased significantly as age increased at a rate of 0.45 percent per year. He did not, however, observe a significant correlation between aging and central stromal thickness. This may be explained in part by aging-related adaptations to the collagen fibrils, which thicken, as well as changes to the ECM (25, 26, 29) as well as keratocyte density decline as we age (13). Few studies have shown no correlation between age and stromal thickness, contrary to others where almost all zones had a significant negative correlation with age. At first, our study seems to be consistent with the former studies (10, 14, 20); however, in the current study, we observed that the stromal thickness of one particular age sub-group increased with age. As presented in Supplementary Table 2, individuals aged 30–49 years old exhibited a significant positive correlation with stromal thickness. We do not have an explanation for this observation, but it could be a result of hormonal changes and aging. Because the group sample size is 40 individuals, it may be prudent to refrain from drawing conclusions. Finally, the association between age and corneal stromal deviation was investigated, leading to the finding of a significant determinant coefficient. This implies that age and variations in stromal thickness have a relatively positive association (14).
Our study results, as explained in Supplementary Table 2, display a moderate correlation between ocular tonometry and CST. This is consistent with other published studies that indicate CST is more predictive of IOP than corneal epithelial thickness (10, 30).
5 Limitations
The small sample size and lack of random selection present some limitations in this study. Furthermore, the AS-OCT lacks the ability to differentiate between the endothelium cellular layer and the Descemet membrane, which might contribute to an overestimation of stromal thickness. Another possible limitation is that we did not study the physical characteristics of participants, including height, weight, and axial length.
6 Conclusion
In conclusion, using AS-OCT, this study establishes normative range of CST among patients in Jordan, and reveals a centrifugal CST distribution, where the thickest parts are found in the superior regions and the thinnest in the center region. Men have thicker stroma, which may be related to sex hormones. Reversals in corneal epithelial thickness and a favorable connection between stromal thickness and the 30–49-age range are two noteworthy findings.
Statements
Data availability statement
The original contributions presented in the study are included in the article/Supplementary material, further inquiries can be directed to the corresponding author.
Ethics statement
The studies involving humans were approved by Institutional Review Board at Applied Science University (2021-PHA-41). The studies were conducted in accordance with the local legislation and institutional requirements. The participants provided their written informed consent to participate in this study.
Author contributions
MA: Conceptualization, Data curation, Formal analysis, Funding acquisition, Investigation, Methodology, Project administration, Resources, Software, Supervision, Validation, Visualization, Writing – original draft, Writing – review & editing. HA: Conceptualization, Data curation, Investigation, Methodology, Project administration, Visualization, Writing – original draft. NH: Conceptualization, Formal analysis, Methodology, Project administration, Visualization, Writing – original draft, Writing – review & editing. MS: Conceptualization, Data curation, Methodology, Resources, Supervision, Visualization, Writing – original draft, Writing – review & editing. AI: Data curation, Methodology, Visualization, Writing – original draft, Writing – review & editing. MAS: Conceptualization, Formal analysis, Methodology, Supervision, Writing – original draft, Writing – review & editing. SMI: Conceptualization, Data curation, Investigation, Methodology, Writing – original draft. AFA: Formal analysis, Methodology, Writing – original draft, Writing – review & editing. TMA: Data curation, Methodology, Visualization, Writing – review & editing.
Funding
The author(s) declare that no financial support was received for the research, authorship, and/or publication of this article.
Acknowledgments
The authors used Quilbot for assistance on grammar.
Conflict of interest
The authors declare that the research was conducted in the absence of any commercial or financial relationships that could be construed as a potential conflict of interest.
Publisher’s note
All claims expressed in this article are solely those of the authors and do not necessarily represent those of their affiliated organizations, or those of the publisher, the editors and the reviewers. Any product that may be evaluated in this article, or claim that may be made by its manufacturer, is not guaranteed or endorsed by the publisher.
Supplementary material
The Supplementary material for this article can be found online at: https://www.frontiersin.org/articles/10.3389/fmed.2024.1485718/full#supplementary-material
Abbreviations
OCT, Optical coherence tomography; IOP, Intra-ocular pressure; VHFUS, Very high frequency ultrasound; K, Keratometry; SD-OCT, Spectral domain optical coherence tomography.
References
1.
Notara M Alatza A Gilfillan J Harris AR Levis HJ Schrader S et al . In sickness and in health: corneal epithelial stem cell biology, pathology and therapy. Exp Eye Res. (2010) 90:188–95. doi: 10.1016/j.exer.2009.09.023
2.
Espana EM Birk DE . Composition, structure and function of the corneal stroma. Exp Eye Res. (2020) 198:108137. doi: 10.1016/j.exer.2020.108137
3.
Nowell CS Radtke F . Corneal epithelial stem cells and their niche at a glance. J Cell Sci. (2017) 130:1021–5. doi: 10.1242/jcs.198119
4.
Chandapura RS Shetty R Shroff R Shilpy N Francis M Sinha RA . OCT layered tomography of the cornea provides new insights on remodeling after photorefractive keratectomy. J Biophotonics. (2018) 11:e201700027. doi: 10.1002/jbio.201700027
5.
Ang M Baskaran M Werkmeister RM Chua J Schmidl D Aranha dos Santos V et al . Anterior segment optical coherence tomography. Prog Retin Eye Res. (2018) 66:132–56. doi: 10.1016/j.preteyeres.2018.04.002
6.
Dembski M Nowińska A Ulfik-Dembska K Wylęgała E . Swept source optical coherence tomography analysis of the selected Eye’s anterior segment parameters. J Clin Med. (2021) 10:1094. doi: 10.3390/jcm10051094
7.
Abusamak M . Corneal epithelial mapping characteristics in Normal eyes using anterior segment spectral domain optical coherence tomography. Transl Vis Sci Technol. (2022) 11:6. doi: 10.1167/tvst.11.3.6
8.
Batawi H Lollett IV Maliakal C Wellik SR Anderson MG Feuer W et al . A comparative study of central corneal epithelial, stromal, and Total thickness in males with and without primary open-angle Glaucoma. Cornea. (2018) 37:712–9. doi: 10.1097/ICO.0000000000001575
9.
Qin B Chen S Brass R Li Y Tang M Zhang X et al . Keratoconus diagnosis with an optical coherence tomography- based Pachymetric scoring system. J Cataract Refract Surg. (2014) 39:1864–71. doi: 10.1016/j.jcrs.2013.05.048
10.
Ehlers N Bramsen T Sperling S . APPLANATION tonometry and central corneal thickness. Acta Ophthalmol Suppl. (1975) 53:34–43. doi: 10.1111/j.1755-3768.1975.tb01135.x
11.
Eyedocs (2023). IOP Correction for Central Corneal Thickness (CCT). Available online at: https://www.eyedocs.co.uk/ophthalmology-articles/glaucoma/769-iop-and-corneal-thickness (Accessed July 24, 2023).
12.
Reinstein DZ Archer TJ Gobbe M Silverman RH Coleman DJ . Stromal thickness in the Normal cornea: three-dimensional display with Artemis very high-frequency digital ultrasound. J Refract Surg. (2009) 25:776–86. doi: 10.3928/1081597X-20090813-04
13.
Hashmani N Hashmani M Asghar N Islam M Hashmani S . Wide stromal mapping using an anterior segment optical coherence tomography. Clin Ophthalmol. (2020) 14:751–7. doi: 10.2147/OPTH.S242035
14.
Kim WK Ryu IH Yoo J Kim SW . Effect of gender, age, and ocular and growth-related factors on corneal epithelial and stromal thickness in children. J Clin Med. (2020) 9:3849. doi: 10.3390/jcm9123849
15.
Kim BJ Ryu IH Kim SW . Age-related differences in corneal epithelial thickness measurements with anterior segment optical coherence tomography. Jpn J Ophthalmol. (2016) 60:357–64. doi: 10.1007/s10384-016-0457-x
16.
Nuzzi R Caselgrandi P . Sex hormones and their effects on ocular disorders and pathophysiology: current aspects and our experience. Int J Mol Sci. (2022) 23:3269. doi: 10.3390/ijms23063269
17.
Giuffrè G Di Rosa L Fiorino F Bubella DM Lodato G . Variations in central corneal thickness during the menstrual cycle in women. Cornea. (2007) 26:144–6. doi: 10.1097/01.ico.0000244873.08127.3c
18.
Fortepiani L Foutch BK Wilson MR . The effects of sex, oral contraception, and menstrual cycle phase on intraocular pressure, central corneal thickness, and foveal thickness: a descriptive analysis. Vision. (2021) 5:48. doi: 10.3390/vision5040048
19.
Goto T Klyce SD Zheng X Maeda N Kuroda T Ide C . Gender- and age-related differences in corneal topography. Cornea. (2001) 20:270–6. doi: 10.1097/00003226-200104000-00007
20.
Mohr N Shajari M Krause D Kassumeh S Siedlecki J Priglinger SG et al . Pellucid marginal degeneration versus keratoconus: distinction with wide-field SD-OCT corneal sublayer pachymetry. Br J Ophthalmol. (2021) 105:1638–44. doi: 10.1136/bjophthalmol-2020-316496
21.
Hwang ES Perez-Straziota CE Kim SW Santhiago MR Randleman JB . Distinguishing highly asymmetric keratoconus eyes using combined Scheimpflug and spectral-domain OCT analysis. Ophthalmology. (2018) 125:1862–71. doi: 10.1016/j.ophtha.2018.06.020
22.
Bojarun A Vieversyte Z Jaruseviciene R Galgauskas S Asoklis R Zablockis R . Effect of obstructive sleep apnea on corneal morphological characteristics. Cornea. (2019) 38:1576–81. doi: 10.1097/ICO.0000000000002069
23.
Kumar N Pop-Busui R Musch DC Reed DM Momont AC Hussain M et al . Central corneal thickness increase due to stromal thickening with diabetic peripheral neuropathy severity. Cornea. (2018) 37:1138–42. doi: 10.1097/ICO.0000000000001668
24.
Chalkiadaki E Andreanos K Florou C Droutsas K Maniou C Amfilochiou A et al . Corneal endothelial morphology and thickness alterations in patients with severe obstructive sleep apnea-hypopnea syndrome. Cornea. (2021) 40:73–7. doi: 10.1097/ICO.0000000000002373
25.
Daxer A Fratzl P . Collagen fibril orientation in the human corneal stroma and its implication in keratoconus. Invest Ophthalmol Vis Sci. (1997) 38:121–9. PMID:
26.
Aghamohammadzadeh H Newton RH Meek KM . X-ray scattering used to map the preferred collagen orientation in the human cornea and limbus. Structure. (2004) 12:249–56. doi: 10.1016/j.str.2004.01.002
27.
Meek KM Tuft SJ Huang Y Gill PS Hayes S Newton RH et al . Changes in collagen orientation and distribution in keratoconus corneas. Invest Ophthalmol Vis Sci. (2005) 46:1948–56. doi: 10.1167/iovs.04-1253
28.
Ulmer M Li J Yaspan BL Ozel AB Richards JE Moroi SE et al . Genome-wide analysis of central corneal thickness in primary open-angle Glaucoma cases in the NEIGHBOR and GLAUGEN consortia. Investig Opthalmol Vis Sci. (2012) 53:4468–74. doi: 10.1167/iovs.12-9784
29.
Patel SV McLaren JW Hodge DO Bourne WM . Normal human keratocyte density and corneal thickness measurement by using confocal microscopy in vivo. Invest Ophthalmol Vis Sci. (2001) 42:333–9. PMID:
30.
Lee M Ahn J . Effects of central corneal stromal thickness and epithelial thickness on intraocular pressure using Goldmann Applanation and non-contact tonometers. PLoS One. (2016) 11:e0151868. doi: 10.1371/journal.pone.0151868
31.
FDA (2021). Optovue iVue Corneal Thickness Study for FDA Access. Available online at: https://www.accessdata.fda.gov/cdrh_docs/pdf16/K163475.pdf (Accessed April, 14 2024).
32.
Haque S Jones L Simpson T . Thickness mapping of the cornea and epithelium using optical coherence tomography. Optom Vis Sci. (2008) 85:E963–76. doi: 10.1097/OPX.0b013e318188892c
33.
Luft N Ring MH Dirisamer M Mursch-Edlmayr AS Pretzl J Bolz M et al . Semiautomated SD-OCT measurements of corneal sublayer thickness in Normal and post-SMILE eyes. Cornea. (2016) 35:972–9. doi: 10.1097/ICO.0000000000000799
Summary
Keywords
stroma, ophthalmology, optical coherence tomography, mapping, anterior segment
Citation
Abusamak M, Issa SM, Alomari AF, Alsalamat HA, Haj Ali NS, Izmegna A, Shawashreh M, Abu Samak M and Abusamak TM (2024) Corneal stromal mapping characteristics in normal corneas using anterior segment SD-OCT. Front. Med. 11:1485718. doi: 10.3389/fmed.2024.1485718
Received
24 August 2024
Accepted
07 November 2024
Published
02 December 2024
Volume
11 - 2024
Edited by
Yalin Zheng, University of Liverpool, United Kingdom
Reviewed by
Jiancheng Mu, Sichuan University, China
Jing Ji Ji, Shanghai Ninth People’s Hospital, China
Updates
Copyright
© 2024 Abusamak, Issa, Alomari, Alsalamat, Haj Ali, Izmegna, Shawashreh, Abu Samak, and Abusamak.
This is an open-access article distributed under the terms of the Creative Commons Attribution License (CC BY). The use, distribution or reproduction in other forums is permitted, provided the original author(s) and the copyright owner(s) are credited and that the original publication in this journal is cited, in accordance with accepted academic practice. No use, distribution or reproduction is permitted which does not comply with these terms.
*Correspondence: Mohammad Abusamak, mabusamak@bau.edu.jo
†ORCID: Mohammad Abusamak, https://orcid.org/0000-0002-7832-1184
Disclaimer
All claims expressed in this article are solely those of the authors and do not necessarily represent those of their affiliated organizations, or those of the publisher, the editors and the reviewers. Any product that may be evaluated in this article or claim that may be made by its manufacturer is not guaranteed or endorsed by the publisher.