Due to a production error, the legends of Figures 2–8 were not implemented correctly.
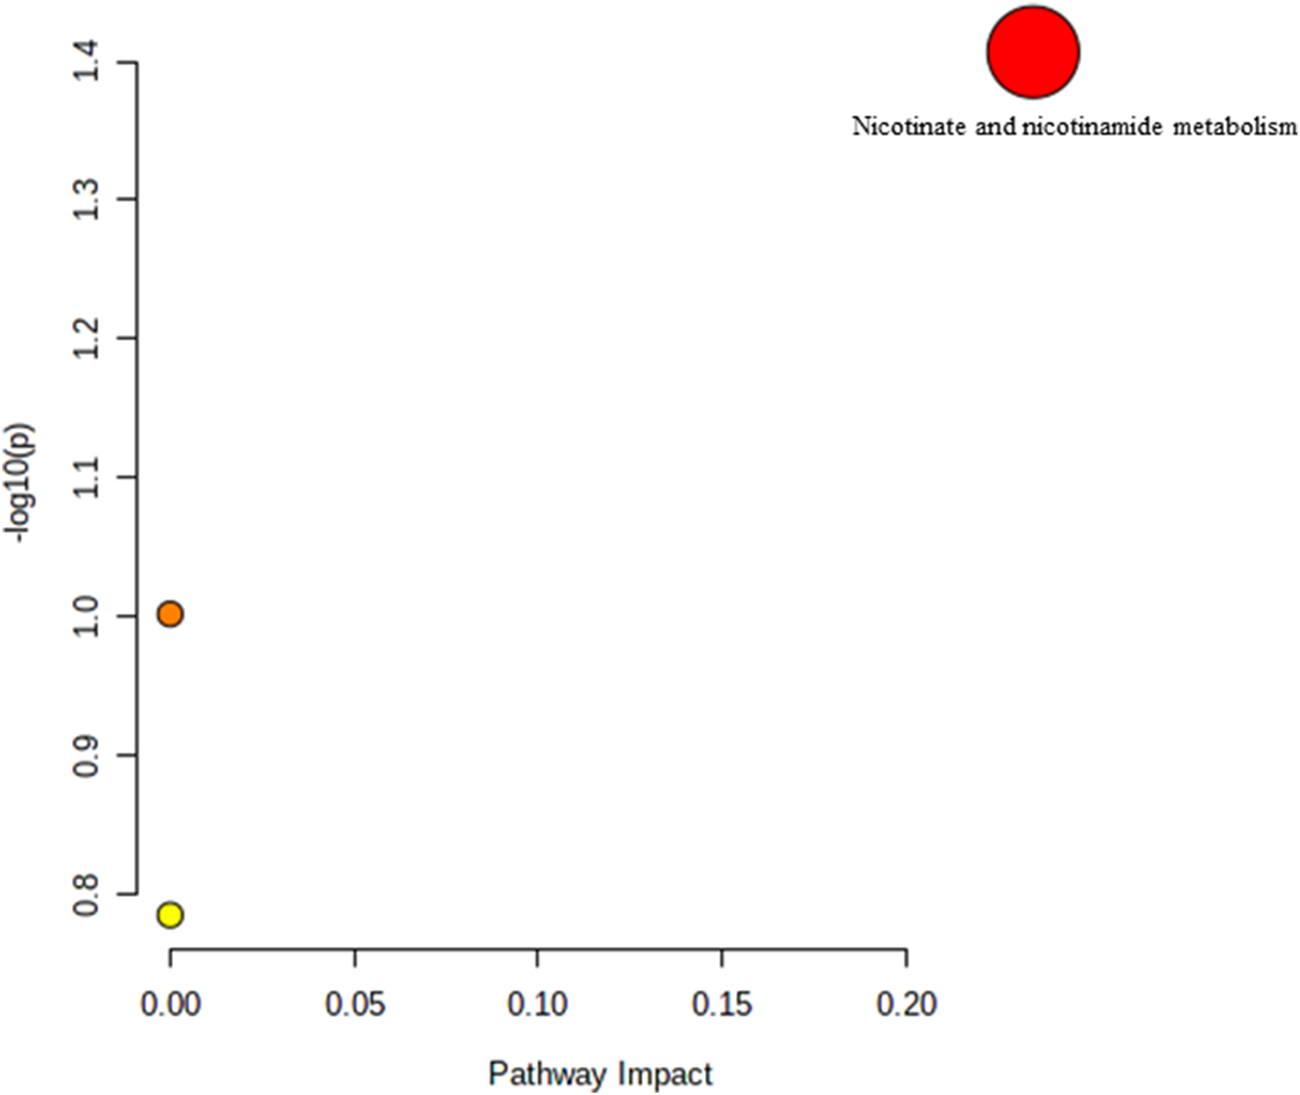
FIGURE 2

Biochemical pathway analysis of metabolites profiled for YC vs. AC.
FIGURE 3

Biochemical pathway analysis of metabolites profiled for YC vs. OC.
FIGURE 4

Biochemical pathway analysis of metabolites profiled for AC vs. OC. a: Fructose and mannose metabolism.
FIGURE 5
Biochemical pathway analysis of metabolites profiled for YC vs. YT.
FIGURE 6

Biochemical pathway analysis of metabolites profiled for AC vs. AT.
FIGURE 7

Biochemical pathway analysis of metabolites profiled for OC vs. OT.
FIGURE 8

Muscle metabolomes changes in ageing rats. Metabolite concentrations in muscle specimens are depicted graphically and subjected to quantitative analysis. Box and whiskers plots with 95% confidence intervals are presented for quantified amino acids. Analysis was performed using one-way Anova with Tukey’s post hoc analysis. *p < 0.05.
Figure 2 Legend reads as “Biochemical pathway analysis of metabolites profiled for YC vs. OC. (A) Purine metabolism; (B) Pentose and glucuronate interconversions (C) Arginine and proline metabolism.” The correct legend for Figure 2 is “'Biochemical pathway analysis of metabolites profiled for YC vs. AC.”
Figure 3 Legend reads as “Biochemical pathway analysis of metabolites profiled for AC vs. OC. a: Fructose and mannose metabolism.” The correct legend for Figure 3 is “Biochemical pathway analysis of metabolites profiled for YC vs. OC”.
Figure 4 Legend reads as “Biochemical pathway analysis of metabolites profiled for YC vs. YT.” The correct legend for Figure 4 is “Biochemical pathway analysis of metabolites profiled for AC vs. OC. a: Fructose and mannose metabolism”.
Figure 5 Legend reads as “Biochemical pathway analysis of metabolites profiled for AC vs. AT.” The correct legend for Figure 5 is “Biochemical pathway analysis of metabolites profiled for YC vs. YT”.
Figure 6 Legend reads as “Biochemical pathway analysis of metabolites profiled for OC vs. OT.” The correct legend for Figure 6 is “Biochemical pathway analysis of metabolites profiled for AC vs. AT”.
Figure 7 Legend reads as “Muscle metabolomes changes in ageing rats. Metabolite concentrations in muscle specimens are depicted graphically and subjected to quantitative analysis. Box and whiskers plots with 95% confidence intervals are presented for quantified amino acids. Analysis was performed using one-way Anova with Tukey’s post hoc analysis. *p < 0.05.” The correct legend for Figure 7 is “Biochemical pathway analysis of metabolites profiled for OC vs. OT”.
Figure 8 Legend reads as “Significant metabolic changes after tocotrienol-rich fraction treatment.” The correct legend for Figure 8 is “Muscle metabolomes changes in ageing rats. Metabolite concentrations in muscle specimens are depicted graphically and subjected to quantitative analysis. Box and whiskers plots with 95% confidence intervals are presented for quantified amino acids. Analysis was performed using one-way Anova with Tukey’s post hoc analysis. *p < 0.05”.
The publisher apologizes for the mistake. The original article has been updated.
Summary
Keywords
tocotrienol, sarcopenia, untargeted metabolites, skeletal muscle, ageing
Citation
Frontiers Production Office (2022) Erratum: Untargeted muscle tissue metabolites profiling in young, adult, and old rats supplemented with tocotrienol-rich fraction. Front. Mol. Biosci. 9:1119445. doi: 10.3389/fmolb.2022.1119445
Received
08 December 2022
Accepted
08 December 2022
Published
21 December 2022
Approved by
Frontiers Editorial Office, Frontiers Media SA, Switzerland
Volume
9 - 2022
Updates
Copyright
© 2022 Frontiers Production Office.
This is an open-access article distributed under the terms of the Creative Commons Attribution License (CC BY). The use, distribution or reproduction in other forums is permitted, provided the original author(s) and the copyright owner(s) are credited and that the original publication in this journal is cited, in accordance with accepted academic practice. No use, distribution or reproduction is permitted which does not comply with these terms.
*Correspondence: Frontiers Production Office, production.office@frontiersin.org
This article was submitted to Metabolomics, a section of the journal Frontiers in Molecular Biosciences
Disclaimer
All claims expressed in this article are solely those of the authors and do not necessarily represent those of their affiliated organizations, or those of the publisher, the editors and the reviewers. Any product that may be evaluated in this article or claim that may be made by its manufacturer is not guaranteed or endorsed by the publisher.