 Yulieth Torres-Llanos1*
 Jovanny Zabaleta2
 Nataly Cruz-Rodriguez3
 Sandra Quijano4Paula Carolina Guzmán5Iliana de los Reyes5
 Nathaly Poveda-Garavito1Ana Infante6
 Liliana Lopez-Kleine7
 Alba Lucía Combita1,8*
- 1Cancer Biology Group, Instituto Nacional de Cancerología, Bogotá, Colombia
- 2Department of Interdisciplinary Oncology, Louisiana State University Health Sciences Center, New Orleans, LA, United States
- 3Versiti Blood Research Institute, Milwaukee, WI, United States
- 4Department of Microbiology, Pontificia Universidad Javeriana, Bogotá, Colombia
- 5Department of Pediatrics, Hospital Militar Central, Bogotá, Colombia
- 6Department of Pediatrics, Hospital Universitario San Ignacio, Bogotá, Colombia
- 7Department of Statistics, Universidad Nacional de Colombia, Bogotá, Colombia
- 8Department of Microbiology, School of Medicine, Universidad Nacional de Colombia, Bogotá, Colombia
Introduction: Although B-cell acute lymphoblastic leukemia (B-cell ALL) survival rates have improved in recent years, Hispanic children continue to have poorer survival rates. There are few tools available to identify at the time of diagnosis whether the patient will respond to induction therapy. Our goal was to identify predictive biomarkers of treatment response, which could also serve as prognostic biomarkers of death, by identifying methylated and differentially expressed genes between patients with positive minimal residual disease (MRD+) and negative minimal residual disease (MRD-).
Methods: DNA and RNA were extracted from tumor blasts separated by immunomagnetic columns. Illumina MethlationEPIC and mRNA sequencing assays were performed on 13 bone marrows from Hispanic children with B-cell ALL. Partek Flow was used for transcript mapping and quantification, followed by differential expression analysis using DEseq2. DNA methylation analyses were performed with Partek Genomic Suite and Genome Studio. Gene expression and differential methylation were compared between patients with MRD−/− and MRD+/+ at the end of induction chemotherapy. Overexpressed and hypomethylated genes were selected and validated by RT-qPCR in samples of an independent validation cohort. The predictive ability of the genes was assessed by logistic regression. Survival and Cox regression analyses were performed to determine the association of genes with death.
Results: DAPK1, BOC, CNKSR3, MIR4435-2HG, CTHRC1, NPDC1, SLC45A3, ITGA6, and ASCL2 were overexpressed and hypomethylated in MRD+/+ patients. Overexpression was also validated by RT-qPCR. DAPK1, BOC, ASCL2, and CNKSR3 can predict refractoriness, but MIR4435-2HG is the best predictor. Additionally, higher expression of MIR4435-2HG increases the probability of non-response, death, and the risk of death. Finally, MIR4435-2HG overexpression, together with MRD+, are associated with poorer survival, and together with overexpression of DAPK1 and ASCL2, it could improve the risk classification of patients with normal karyotype.
Conclusion: MIR4435-2HG is a potential predictive biomarker of treatment response and death in children with B-cell ALL.
1 Introduction
B-cell acute lymphoblastic leukemias (B-cell ALL) are the most frequent neoplasms in children (Pui et al., 2008). Cure rates for acute lymphoblastic leukemias (ALL) have improved remarkably in the last 4 decades; however, while developed countries achieve 80% cure rates, those rates are around 60% in developing countries (Vera et al., 2012). Some studies have shown that, even under the same treatment protocols, Hispanic children have worse survival and treatment response compared to White and Asian children (Matasar et al., 2006; Walsh et al., 2013; Walsh et al., 2014). The mechanisms underlying these differences in survival rates are still unknown.
Currently, clinical parameters such as leukocyte count, age, extramedullary infiltration, chromosomal translocations, and minimal/measurable residual disease (MRD) classify patients into risk groups. MRD is the most used variable to define treatment response (van Dongen Jacques et al., 1998; Van Dongen JJM et al., 2015). However, due to low survival rates in our patients, it is possible to propose that those variables do not fully define risk groups, which leads to incorrect selection of chemotherapy protocol, affecting patient survival (Sok et al., 2022).
In ALL, gene expression alterations not only result from mutations; alterations at the epigenetic level also play a relevant role in this pathology (Garcia-Manero et al., 2009; Newton et al., 2014; Hu and Shilatifard, 2016; Nordlund and Syvänen, 2018). Thus, epigenetic alterations, including aberrant DNA methylation, could act as important molecular mechanisms in developing resistance to treatment of ALL (Newton et al., 2014). In bone marrow (BM), DNA methylation patterns change during normal hematopoiesis and play an essential role in lineage differentiation (Cullen et al., 2014; Wainwright and Scaffidi, 2017). As in normal cells, tumor cells may also depend on specific DNA methylation patterns to acquire their phenotype and maturation patterns (Patel and Vanharanta, 2017; Wainwright and Scaffidi, 2017; Poli et al., 2018). Therefore, the characterization of aberrant patterns in DNA methylation in tumors can provide important clues about how gene expression is regulated in these pathologies (Nordlund and Syvänen, 2018). Hogan et al., 2015 found that patients with relapses presented promoter hypermethylation and identified a clear signature of differentially expressed genes at the time of diagnosis and relapse; moreover, this signature differs between early-relapse patients and to late-relapse patients. Similarly, aberrant promoter methylation has been associated with MRD. For example, aberrant methylation of the promoters of the RASSF6 and RASSF10 genes has been observed in adults with B-cell ALL, which can be detected in peripheral blood and could be useful as potential biomarkers to measure MRD (Younesian et al., 2019). Furthermore, it has been reported that promoter methylation of the TLX3 and FOXE3 genes in children with B-cell ALL differentiates MRD + patients from MRD-patients (Chatterton et al., 2014).
Although differential methylation and gene expression patterns have been observed between samples at diagnosis and in relapse, whether these variables could be tools to predict treatment response, including relapse or death, is yet to be determined. Also, a CpG island methylation analysis identified candidate genes as biomarkers of pediatric ALL subgroups and their correlation with disease prognosis (Stumpel et al., 2009). Identifying genomic markers, derived from methylation and gene expression analysis, could improve risk classification, and define patient prognosis.
We hypothesized that gene expression and DNA methylation of blasts obtained at diagnosis differ between MRD+ and MRD-patients and that by comparing these two conditions, candidate genes predictive of treatment response and death could be identified. We collected BM samples obtained at diagnosis, purified leukemic blasts, and compared gene expression and DNA methylation profiles between MRD+ and MRD-patients at the end of induction, looking for overexpressed and hypomethylated genes in MRD + patients. Subsequently, we evaluated if the selected genes could predict response to induction chemotherapy, or death. The search for new genomic biomarkers will improve risk classification and, in the future, patient survival.
2 Materials and methods
2.1 Patient samples
Forty-three patients with B-ALL who attended the Instituto Nacional de Cancerología, Hospital Militar Central and Hospital Universitario San Ignacio (Bogotá, Colombia) between 2017 and 2021 were included. The discovery cohort consisted of 13 BM samples taken at the time of the diagnosis in which RNA-seq/DNA methylation protocols were performed. Sequencing data from 12 patients was used to enrich the survival analyses. Eighteen BM samples taken at the time of the diagnosis were included in the validation cohort by RT-qPCR.
Newly diagnosed patients were included in the study when they entered to the institutions for symptomatology associated with ALL and after verification of the inclusion criteria (not having received chemotherapy, not having another type of cancer, not having genetic diseases and being younger than 18 years old). The diagnosis was confirmed using flow cytometry (Van Dongen JJM et al., 2012) and morphological analysis of BM. This study was conducted following the recommendations of the Colombian Regulation for Research in Humans (Resolution 8430 of 1993, Ministry of Health of Colombia) and in accordance with the Declaration of Helsinki and approved by each participating institution’s Institutional Review Boards (IRB). All methods for nucleic acid analysis were approved by the LSUHSC Translational Genomics Core’s Institutional Biosafety Committee protocol number 17370. Informed consent was signed by the parents of all participants. Each patient was treated according to the assigned risk and in accordance with the Berlin-Frankfurt-Munich protocol (Stary et al., 2014). Patients with treatment abandonment or non-adherence to it were excluded.
According to the Berlin-Frankfurt-Munich protocol, response to induction therapy was evaluated by flow cytometry detecting MRD at day 15, where patients with <0.1% residual blasts in BM were MRD-, and patients with >0.1% residual blasts were considered MRD+. At day 33, patients with <0.01% residual blasts in BM were MRD-, while patients with >0.01% residual blasts were MRD+ (Stary et al., 2014). Therefore, we considered patients with MRD-day15 and MRD-day33 as MRD−/− and patients with MRD + day15 and MRD + day33 as refractory patients or MRD+/+.
2.2 Blasts isolation and purification
BM samples were collected by a hemato-oncologist and processed within 24 h after sample collection. First, mononuclear cells were separated from BM by density-gradient centrifugation (Lymphoprep, Lonza). The blasts were separated using magnetic microbeads coated with anti-CD19 or anti-CD34 antibodies, followed by MACS column enrichment (Miltenyi, Bergisch Gladbach, Germany). The purity of sorted blasts was assessed with CD34-PERCPCy5.5, CD45-V500, CD19-PECy7, and CD10 APC antibodies. Data was acquired in a FACSCanto II flow cytometer (Becton/Dickinson Biosciences, San Jose, CA), using the FACSDiva software program. Infinicyt software (Cytognos SL, Salamanca, Spain) was used for data analysis (Cruz-Rodriguez et al., 2016).
2.3 DNA and RNA extraction
DNA and RNA were extracted from MACS-sorted blasts using the Allprep mini kit and the robotic workstation QIAcube (Qiagen, Hilden, Germany). RNA quality was evaluated using the Agilent RNA 6000 Nano and Pico kits in the Agilent 2100 Bioanalyzer. RNA concentration was calculated using the Qubit™ RNA High Sensitivity and Broad Range kits, while DNA concentration was calculated using the Qubit dsDNA HS Assay Kit (Thermo Fisher Scientific).
2.4 Library preparation and RNA sequencing
Samples with RIN >6 and purity by flow cytometry with >90% blasts were selected for RNA-seq. For RNA library preparation, 300 ng of total RNA was used. TruSeq Stranded mRNA RNA libraries were prepared following Illumina’s protocol. Resulting libraries were sequenced at 2 × 75 bp on a NextSeq550 sequencer system at the Stanley S. Scott Cancer Center’s Translational Genomics Core at LSUHSC-New Orleans. On average, more than 50 million reads per sample were obtained. FASTQ files were uploaded to Partek Flow for analysis. First, removal of contaminant sequences (rDNA, mtrDNA, tRNA) was done with Bowtie 2.0 v2.2.5. Reads were aligned to the hg38 version of the human genome, using STAR 2.7.3a. Genes were quantified with RefSeq 96. For the analysis, genes with less than 5 reads in at least 80% of the samples were excluded. One sample with a low correlation (<0.4) with respect to the others was removed. Normalization was done with the Median Ratio and differential expression analysis was assessed with DESEQ2. Hierarchical clustering, pathways (KEEG) and GO terms were all analyzed in Partek Flow.
2.5 DNA methylation assay
Bisulfite conversion was performed in 500 ng of DNA for each sample following the recommendations of the EZ DNA Methylation-Startup Kit (Catalogue number D5001, Zymo Research, United States). Bisulfite-converted DNA was amplified and hybridized to the Infinium Methylation EPIC Kit chips and scanned on the Illumina’s iScan. Analysis of the methylation assays was done in Partek Genomic Suite. Low-confidence probes (p-value >0.05) and probes mapped to X and Y chromosomes were excluded. Normalization was done using NOOB (normalization for Illumina Infinium methylation arrays).
2.6 RT-qPCR
Total RNA from sorted blasts was treated with DNase I Amplification Grade (Invitrogen, United States) prior to reverse transcription. cDNA was synthesized using the SuperScript III First-Strand Synthesis SuperMix Kit (Invitrogen, United States), following the manufacturer’s procedures. TaqMan probes were used to quantify mRNA expression levels of candidate genes obtained by RNA-seq analysis (Assay IDs: DAPK1 Hs00234489_m1; NPDC1 Hs00209870_m1; CNKSR3 Hs00295109_m1; SLC18A2 Hs00996835_m1; CTHRC1 Hs00298917_m1; BOC Hs00264408_m1; SLC45A3 Hs00263832_m1; GAPDH Hs99999905_m1, ASCL2 Hs00270888_s1; MIR4435-2HG Hs03680374_m1). The reaction was amplified in a QuantStudio 12 K plex Real-Time PCR machine (Applied Biosystems). The 2−ΔΔCT method was used to estimate the fold induction of each gene using GAPDH and Ct values to determine the fold change (FC) for each sample. A pool of samples was used as internal calibrator, as well as water as negative control. Assays were done in duplicate.
2.7 Statistical analysis
2.7.1 Transcriptomic and methylation data analysis
Normalization and differential expression analysis were performed using the Deseq2 library in RStudio. Differentially expressed genes (DEGs) were selected if they had a p-value <0.05 and a FC > 2. ggplot library was used to generate heatmaps, and GenomeStudio to calculate beta values for each hybridized probe. The Partek Genomic Suite was used for differential methylation analysis to identify genes with differentially methylated CpGs (GDMCpGs). GDMCpGs were chosen if they had FC > 2 and FDR <0.05. Enrichment analysis and functional gene annotation were performed Clusterprofiler in RStudio. Pearson correlation was used to determine correlation between overexpressed genes and hypomethylated probes; those with an inverse correlation less than −0.50 and a p-value <0.05 were selected.
2.7.2 Experimental design
Figure 1 describes the methodological design of the study. Gene and methylation profiles of induction treatment were compared between MRD−/− vs. MRD+/+. Treatment response was the only variable used to define profiles in each comparison.
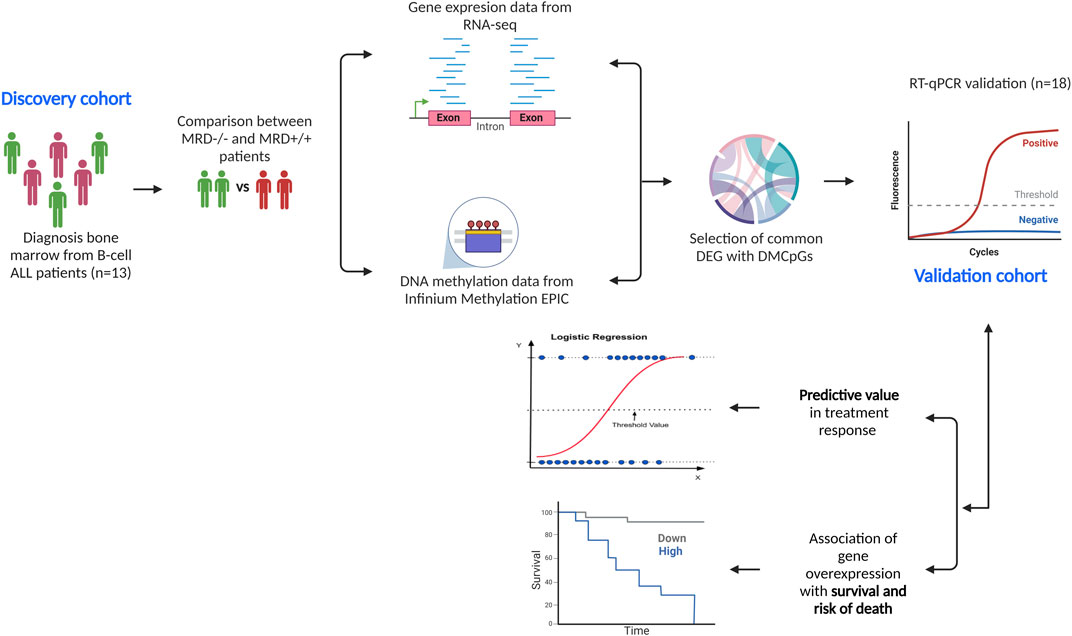
Figure 1. Methodological design of the study. We describe the descriptive cohort (n = 13) in which DNA methylation and gene expression analyses were performed separately, comparing the results between MRD−/− vs. MRD+/+. From the comparisons, 10 DEGs with differentially methylated CpGs were selected and verified in the validation cohort (n = 18) via RT-qPCR. Subsequently, the predictive ability of genes on outcomes such as achievement of complete remission at end of induction and death was tested. The relationship between gene overexpression and overall survival and risk of death was also assessed.
2.7.3 RT-qPCR analysis
Spearman correlation was used to determine any correlation between normalized RNA-seq counts and FC values for RT-qPCR. Genes with p-value <0.05 and r > 0.72 were selected. Mann-Whitney test was used to compare FC between MRD−/− and MRD+/+ patients. GraphPad software was used for statistical tests and graphic images. In both analyses, outliers were identified by the ROUT method (Q = 1%) and excluded from the analyses.
2.7.4 Clinical data analysis
To compare clinical variables between patient cohort, t-test and chi-square tests were used. The follow-up time for relapse and death was 2 years. Logistic regression analysis was performed to evaluate whether candidate genes could predict treatment response. Survival analyses were estimated according to gene expression using Kaplan-Meier curves. Cox regression was used to determine whether gene expression conferred a higher risk of death. The Youden index of normalized RNA-seq counts was used to define the cutoff threshold for overexpression for each gene.
3 Results
Table 1 describes the clinicopathological characteristics of the patients included in the discovery cohort, and Supplementary Material S1 shows the clinical variables of the validation cohort. As can be observed, no differences in clinical variables between MRD+/+ and MRD−/− patients, except for risk, were found. However, this was to be expected because MRD+/+ patients are considered intermediate to high risk, whereas MRD−/− patients may be low to intermediate risk. Interestingly, more than seventy percent of patients had normal karyotype. The MRD−/− group had 1 death related to relapse and progression and another one due to febrile neutropenia. Similarly, the MRD+/+ group had one death due to relapse and progression and 4 deaths during the induction phase (very aggressive disease).

Table 1. Clinical characteristics of the DISCOVERY cohort.
3.1 Identification of DEGs
To identify genes that could differentiate MRD+/+ patients from MRD−/− patients, we performed RNA-seq and MethylationEPIC in nucleic acids extracted from immunomagnetic column-enriched leukemic blasts obtained at the time of diagnosis. MRD status was obtained from medical charts at day 15 and 33. We then compared the gene expression and DNA methylation profiles between MRD−/− vs. MRD+/+ patients. Unsupervised hierarchical cluster analysis showed 117 upregulated and 36 downregulated DEGs MRD+/+ vs. MRD−/− patients (Figure 2A). Among the biological processes with the highest number of genes involved are neutrophil activation, serine/threonine membrane receptors, extracellular matrix organization, among others ((Figure 2B). The cellular components with the highest number of genes involved include cell-cell junction, adhesion, vesicles, among others ((Figure 2C).
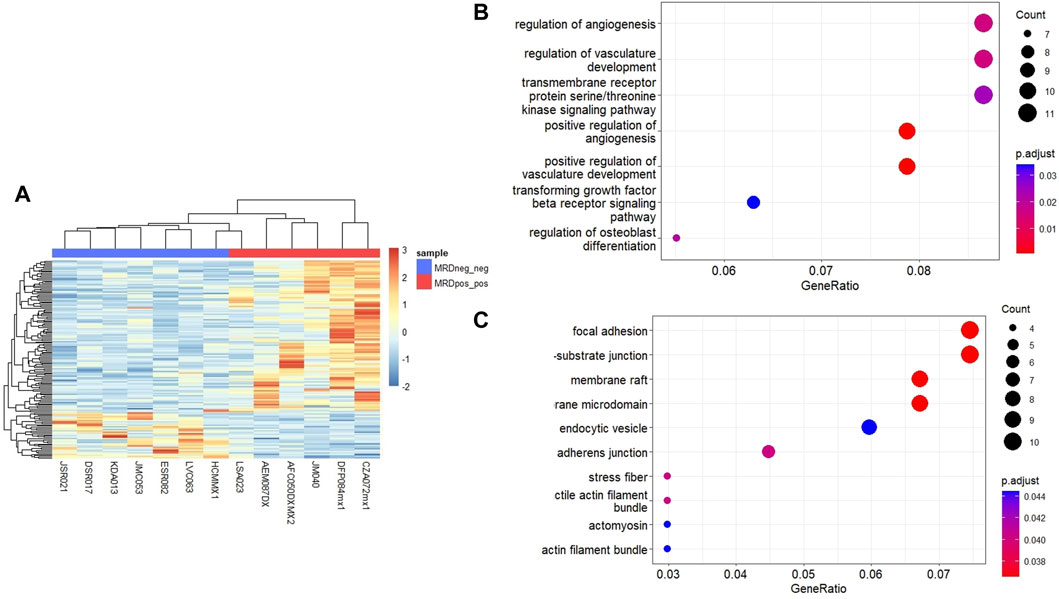
Figure 2. Differentially expressed genes between MRD+ and MRD-patients. (A) Heatmap of DEGs between MRD−/− and MRD+/+. Each column represents an individual patient and horizontal axis indicates each differentially expressed gene. In blue scale downregulated genes, and the red scale shows upregulated genes (FC > 2 and <−2, p-value <0.05). (B) Dot plot showing the 7 most significant biological processes in which differentially expressed genes between conditions are grouped. (C) Dot plot showing the 10 most significant cellular components in which differentially expressed genes between conditions are grouped.
3.2 Identification of GDMCpGs
Additionally, a total of 2726 GDMCpGs were identified between MRD+/+ and MRD−/− patients (Figure 3A). To establish a correlation between DEGs and their corresponding methylation levels, we compared DEGs and GDMCpGs to determine if there were common genes between the two techniques. This comparison revealed 40 common genes between MRD +/+ and MRD −/− patients (Figure 3B). Notably, we observed a significative inverse correlation involving the overexpression of 10 genes and their associated CpGs hypomethylation (Table 2).
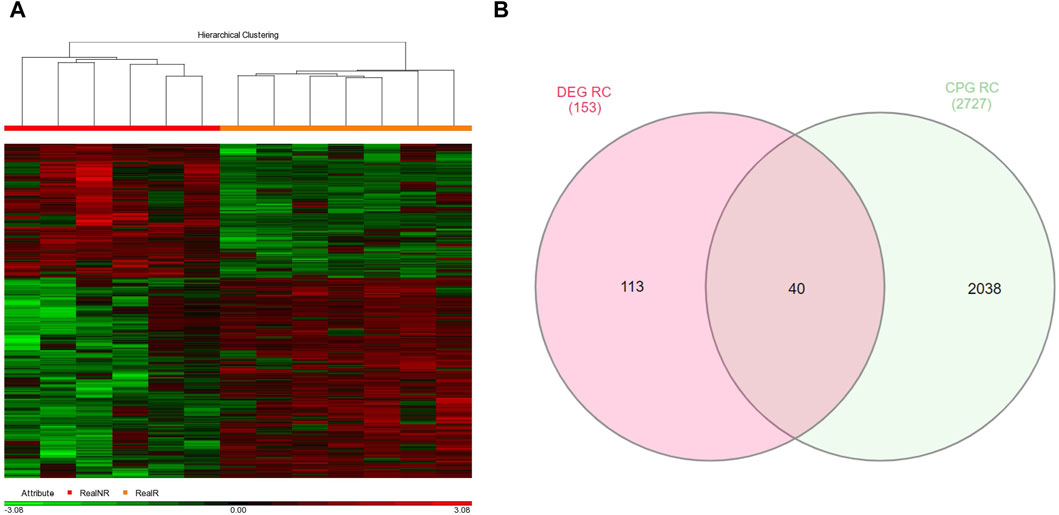
Figure 3. Genes with differentially methylated CpGs between MRD+ and MRD-patients. (A) Heatmap of differentially methylated GDMCpGs between MRD−/− and MRD+/+. Each column represents an individual patient and horizontal axis indicates the beta values of each differentially methylated CpG. Hypomethylated probes are shown in green and hypermethylated probes in red. The MRD−/− patient group is shown in orange and the MRD+/+ patient group in red. FC > 2 and <−2, p-value <0.05. (B) Venn diagram identifying common DEGs and GDMCpGs after MRD−/− vs. MRD+/+ comparison.
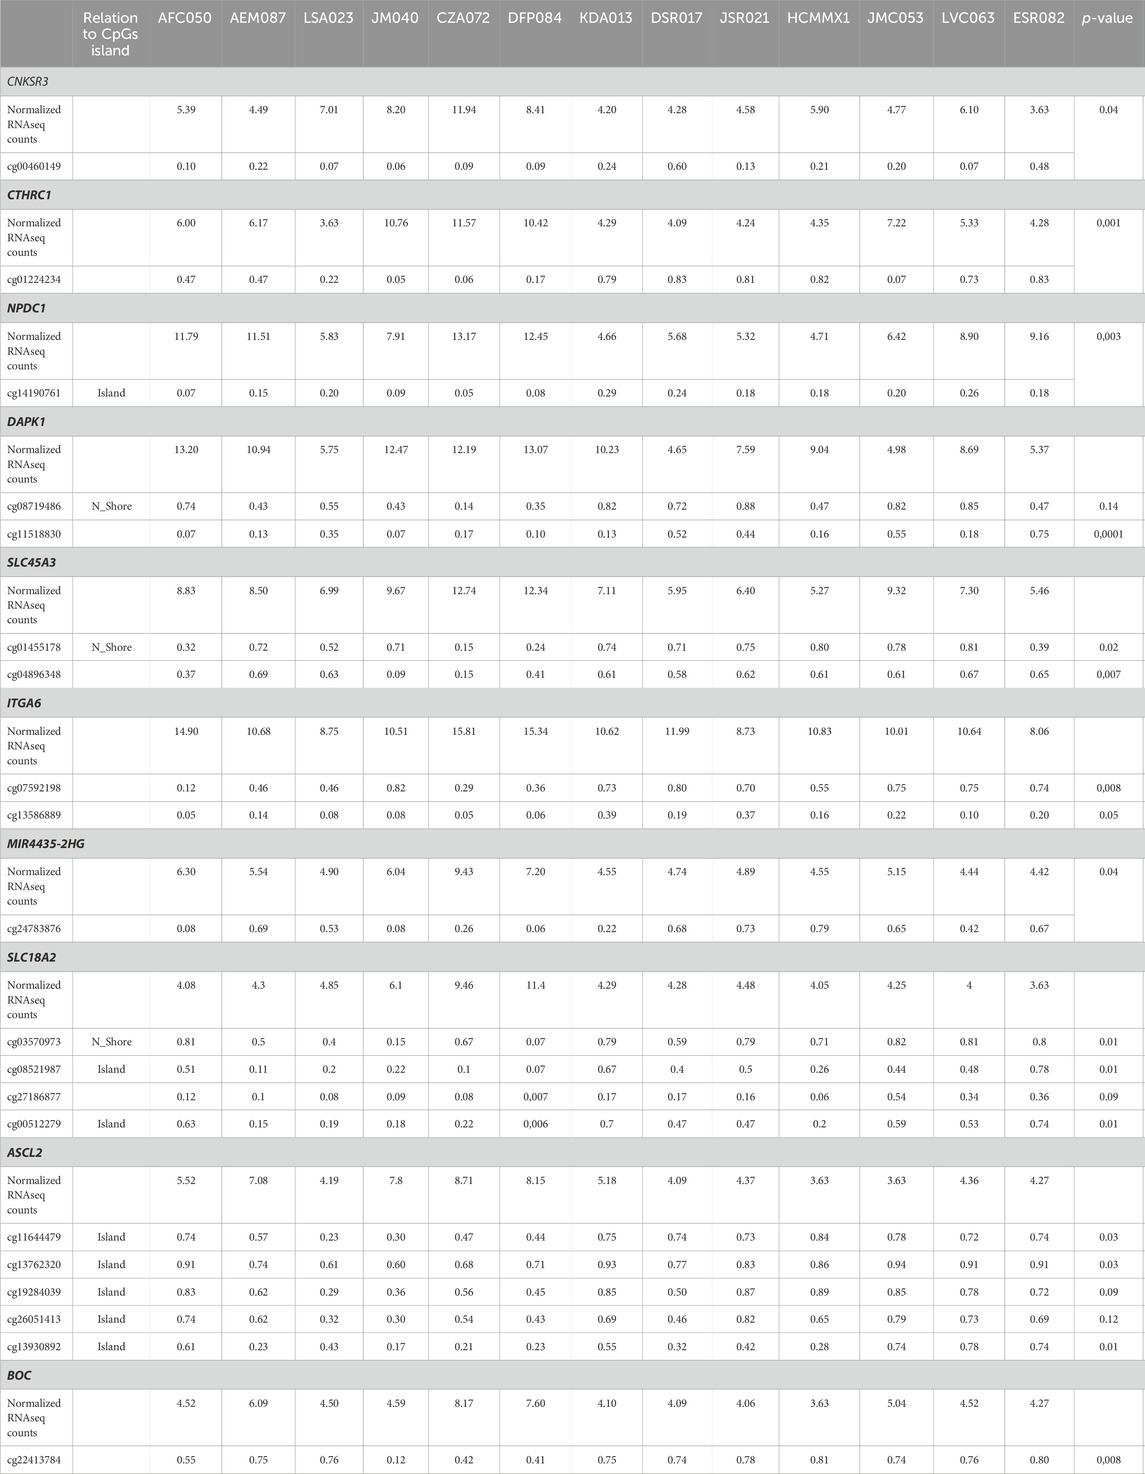
Table 2. Relationship between beta values of CPGS sites and normalized RNASEQ counts of differentially expressed genes between MRD+/+ and MRD−/− patients.
3.3 Gene verification by RT-qPCR
Subsequently, gene expression was verified by RT-qPCR and all genes showed correlation between the normalized read counts (RNA-seq) and the 2−ΔΔCT values obtained from RT-qPCR. Remarkably, CTHRC1, CNKSR3, MIR4435-2HG, DAPK1, and ITGA6 demonstrated correlations exceeding 0.80 (Figure 4). Although SLC18A2 was the gene with the best concordance, it was excluded from the analysis because only 6 patients were used for this analysis.
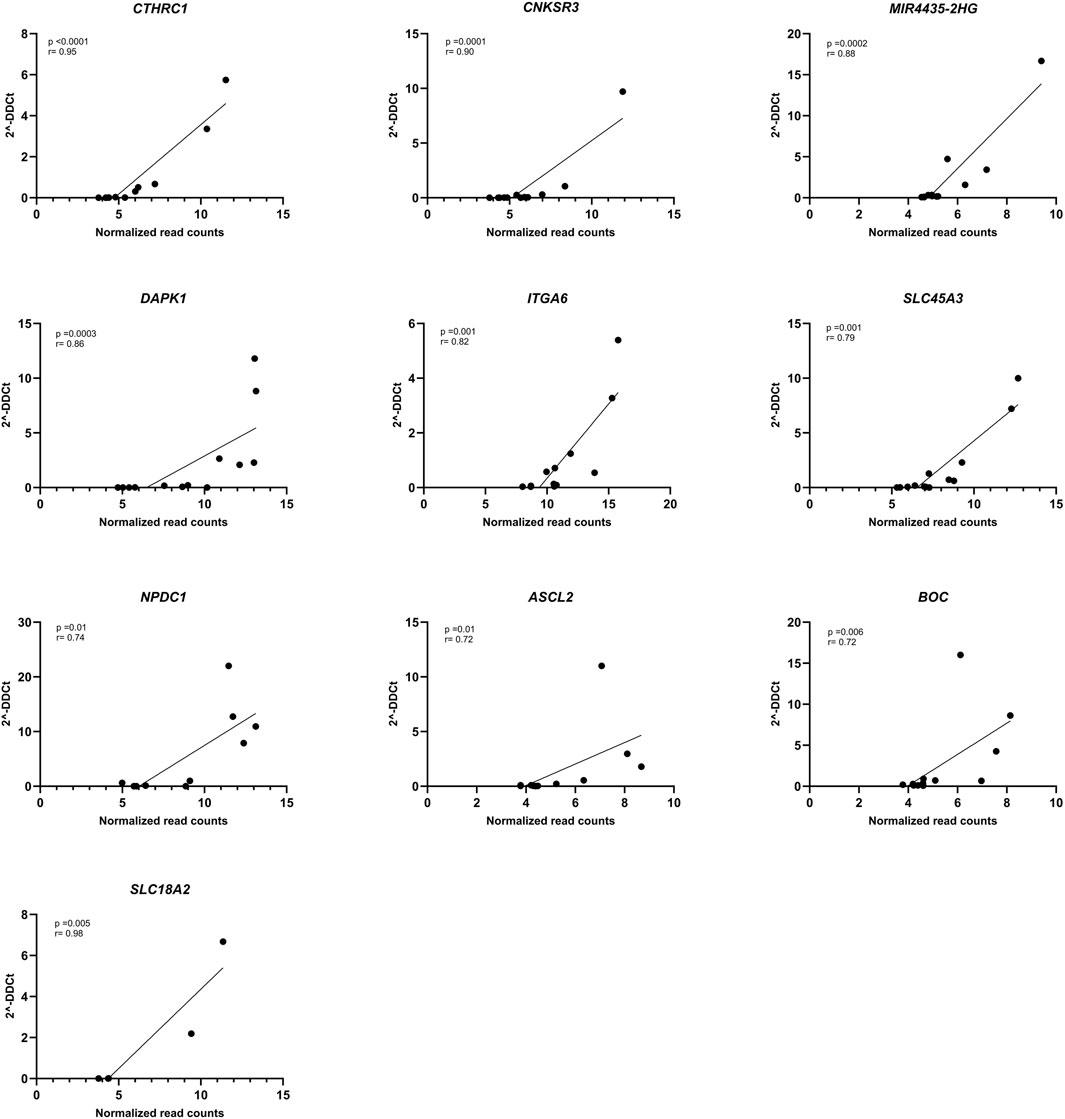
Figure 4. Correlation of RNA-seq data with RT-qPCR. Spearman correlation plot between normalized RNA-seq counts (X-axis) and 2−ΔΔCT (Y-axis) of DAPK1 (n = 13), CNKSR3 (n = 12), MIR4435-HG2 (n = 13), CTHRC1 (n = 12), NPDC1 (n = 10), SLC45A3 (n = 13), ITGA6 (n = 12), ASCL2 (n = 11), BOC (n = 13), and SLC18A2 (n = 6) genes. p-value <0.05 and r < 0.70.
Then, we wanted to test if the expression of these genes remained differential between MRD- and MRD + patients in the validation cohort. Due to the low incidence of the disease (Katz et al., 2015) and the small number of MRD + patients, samples from the MDR + patients in the discovery cohort were pooled with those from the validation cohort for RT-qPCR analyses. Consistent with RNA-seq results, all genes except CTHRC1 were overexpressed in MRD+/+ patients by RT-PCR (Figure 5).
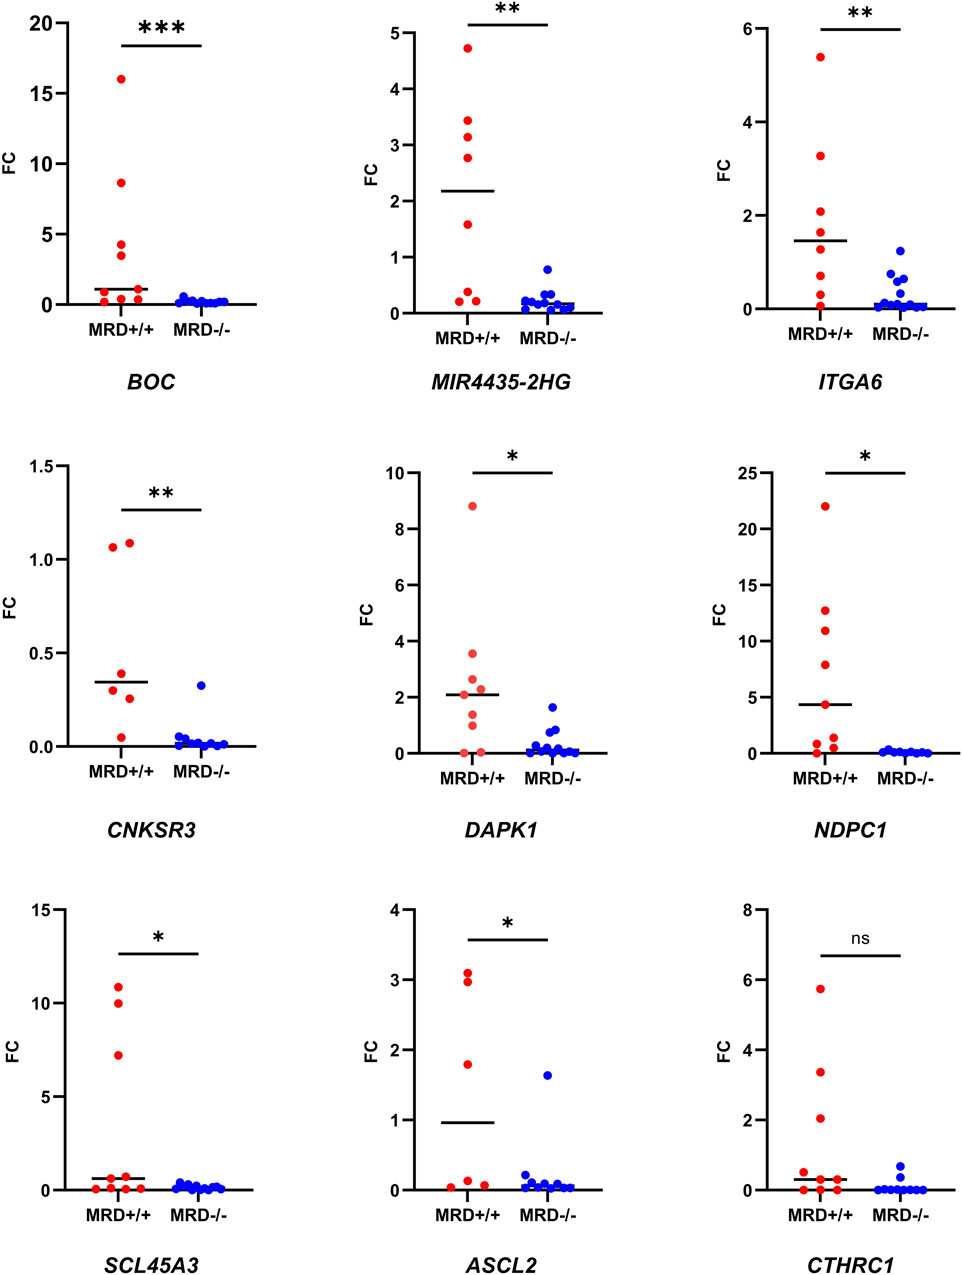
Figure 5. Comparison of fold change of the genes between MRD- and MRD + by RT-qPCR. Dot plot showing the comparison of FC of the nine selected genes between MRD−/− and MRD+/+ patients. Mann-Whitney test was used to compare FC between the groups (p-value = 0.03 (*), 0.0021 (**); 0.0008 (***), ns = >0.05)). Number of samples corresponding to each analysis: MIR4435-HG2 (MRD−/− = 12 vs. MRD+/+ = 8), DAPK1 (MRD−/− = 12 vs. MRD+/+ = 9), CNKSR3 (MRD−/− = 10 vs. MRD+/+ = 6), CTHRC1 (MRD−/− = 12 vs. MRD+/+ = 9), NPDC1 (MRD−/− = 9 vs. MRD+/+ = 9), SLC45A3 (MRD−/− = 12 vs. MRD+/+ = 9), ITGA6 (MRD−/− = 13 vs. MRD+/+ = 8), ASCL2 (MRD−/− = 10 vs. MRD+/+ = 6) and BOC (MRD−/− = 11 vs. MRD+/+ = 9).
3.4 Predictive value of genes
Afterward, we used logistic regression to evaluate whether genes could predict response to induction chemotherapy. Remarkably, MIR4435-2HG was found to be the best predictor of whether a patient would be MRD−/−, MRD+/+ (Figures 6A,B). It was observed that genes DAPK1, BOC, ASCL2, and CNKSR3 could also predict whether the patient would be MRD−/− or MRD+/+ (Supplementary Material S2). To assess whether MIR4435-2HG could predict the risk of death, we performed logistic regression using our normalized read counts. We observed that MIR4435-2HG can predict death with good sensitivity and specificity (Figures 6C,D). Interestingly, we found that patients with counts >5.1 had a 66% probability of being MRD+/+ to treatment (refractory), and this probability increased proportionally to increases in gene expression. Similarly, the probability of death increased when counts were >7.0 (Figure 6E).
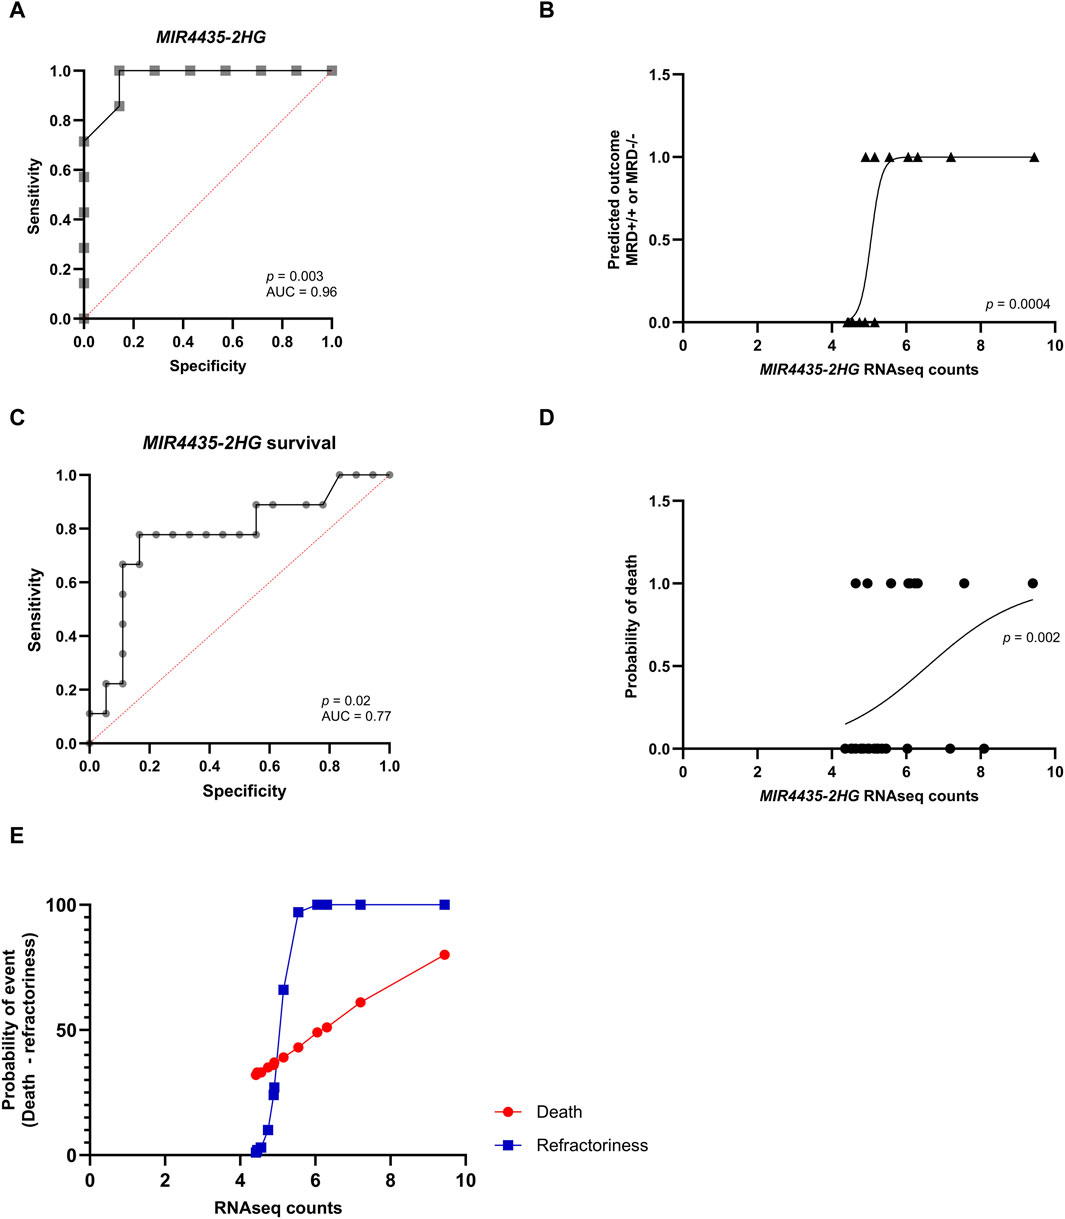
Figure 6. ROC curves and logistic regression graphs of MIR4435-2HG as a predictor of chemotherapy response and survival. Logistic regression analysis and ROC curves to determine the predictive capacity of the MIR4435-2HG and to determine its sensitivity and specificity. In logistic regressions, the probability of having one of the outcomes is represented on the Y-axis by numbers between 0 and 1, where 1 indicates that the patient does not respond to treatment and 0 indicates that the patient responds to treatment. On the X-axis, RNA-seq counts for the MIR4435-2HG gene are observed. (A,B) Prediction of if patient will be MRD−/− or MRD+/+ and (C,D) whether they will survive. Scatter plot of the relationship of RNAseq counts to the probability of death (red) or being refractory (blue) (E). Likelihood ratio test, p-value <0.05 and area under the ROC curve >0.77 and p-value <0.05.
3.5 Relationship between gene expression and risk of death
With the aim of testing the potential of the identified genes as predictive biomarkers of mortality, four Cox regression models were performed to determine the clinical variables that influence patient survival (white blood cell count at diagnosis, age, extramedullary infiltration, response on day 8 of corticosteroid treatment, MRD on day 15, and at the end of treatment). induction) and overexpression of the identified genes.
The initial model incorporated current clinical variables used to determine the risk of death, but none of these variables demonstrated a significant association with increased risk of mortality. In the second model, both clinical variables and gene overexpression were considered, with none of these variables increasing the risk of death. In the third model, MRD and overexpression of selected genes were included, revealing that overexpression of MIR4435-2HG emerged as the unique variable that elevated the risk of death 74-fold. Similarly, the fourth model, which evaluated the complete gene profile, indicated that overexpression of MIR4435-2HG significantly elevated the risk of death. (Table 3).
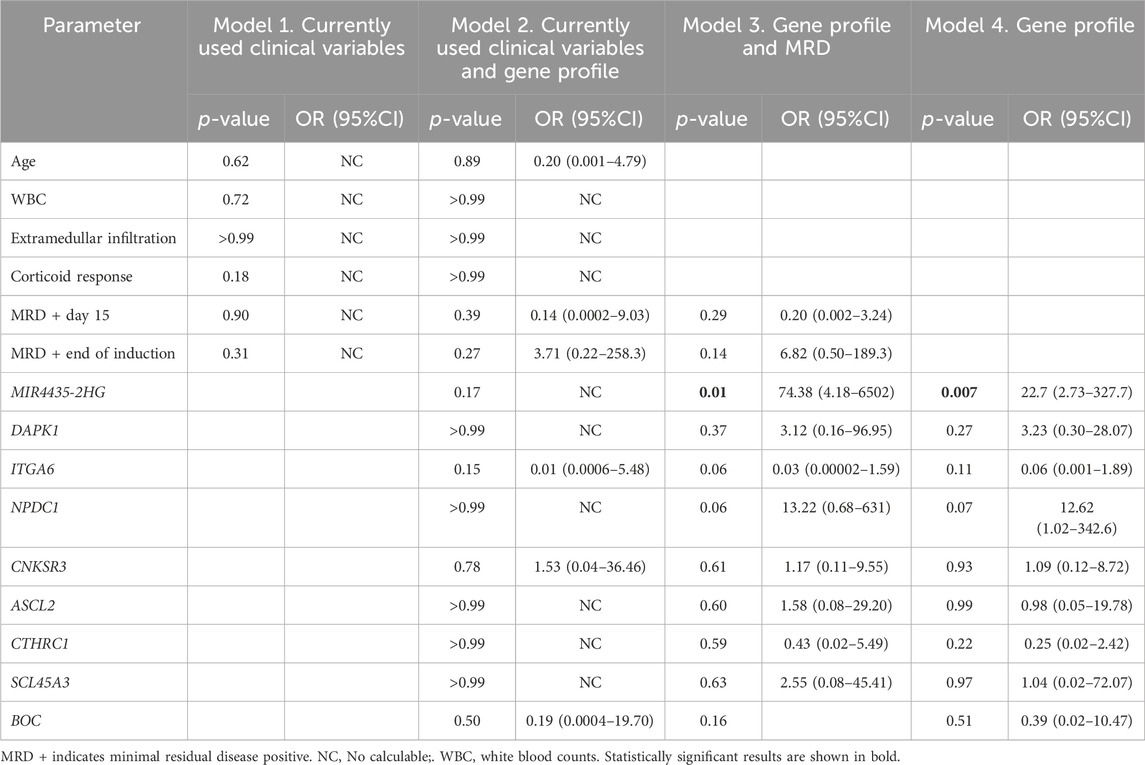
Table 3. Multiple Cox regression using currently clinical variables and gene profile.
In line with the previous result, survival analysis showed that patients with MIR4435-2HG overexpression had worse survival; however, it is important to validate this result in a larger cohort of patients (Figure 7A). Since MRD is the current variable most commonly used to define the risk of death, however, for the survival analysis we first considered MRD at the end of induction, effectively demonstrating that MRD-patients have better survival than MRD + patients. (Figure 7B). Importantly, a more accurate separation of survival curves was achieved when we compared the survival of patients combining MRD+ with MIR4435-2HG overexpression versus MRD-patients with MIR4435-2HG down-expression. This revealed that patients with MRD+ and MIR4435-2HG overexpression experienced markedly worse survival (Figure 7C).
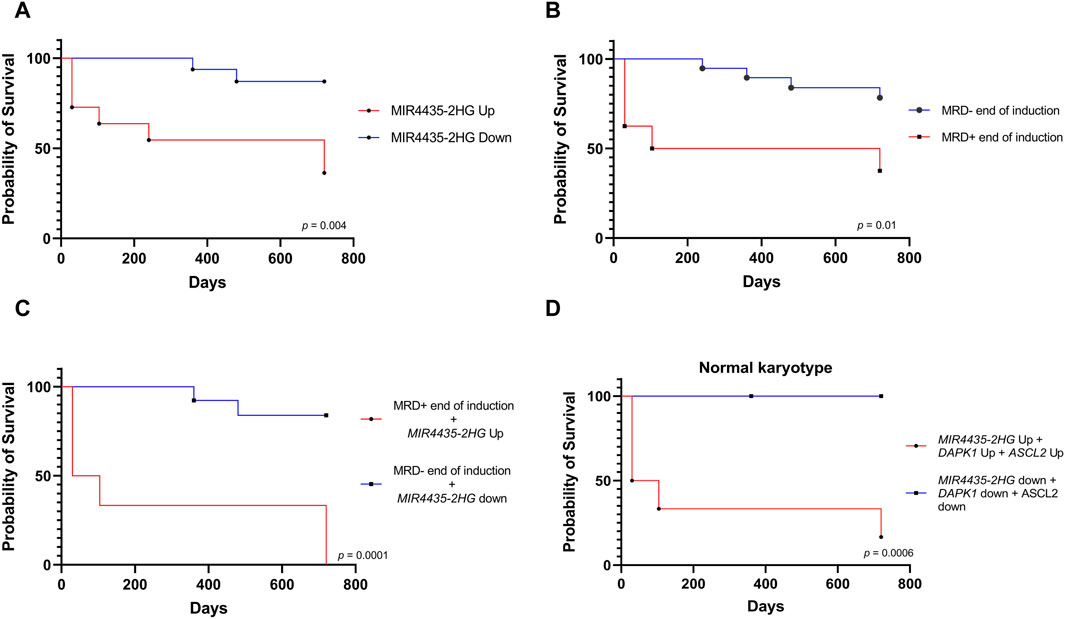
Figure 7. Relationship of the MIR4435-2HG expression with death. Kaplan-Meier analysis comparing 2-year survival with respect (A) MIR4435-2HG expression (n = 26); (B) MRD—or MRD + at the end of induction treatment (n = 26); (C) patients with overexpression of MIR4435-2HG and MRD + at the end of induction vs patients with low expression of MIR4435-2HG and MRD-at the end of induction (n = 26); and (D) patients with normal karyotype and overexpression or not of MIR4435-2HG, ASCL2, and DAPK1 (n = 15). p-value = <0.05.
Finally, given that more than half of our patients had normal karyotype, we evaluated whether selected genes could improve risk classification in this subgroup of patients. Remarkably, the simultaneous overexpression of MIR4435-2HG, DAPK1, and ASLC2 was associated with worse survival in patients with normal karyotype compared to those who did not overexpress them (Figure 7D).
4 Discussion
Given the wide genetic and epigenetic heterogeneity inherent in ALL, there is a critical need for new biomarkers to improve the prognosis of patients (Lejman et al., 2022). The present study conducted an integrative analysis of genome-wide DNA methylation and gene expression by RNA-seq in a cohort of 14 pediatric patients with B-cell ALL to explore whether differential DNA methylation genes and gene expression patterns could be proposed as potential predictive biomarkers that differentiate responder from non-responder patients and confer risk of death in pediatric patients with B-cell ALL.
Aberrant DNA methylation has been considered a hallmark in different types of cancer, including ALL (McCabe et al., 2009; Hanahan, 2022). Consistent with the findings of Borssén et al., 2018, our study demonstrated a clear separation in both DNA methylation and gene expression profiles between MRD- and MRD + patients. Notably, the overexpression of genes was associated with a more aggressive phenotype. Previously, Figueroa et al., 2013 reported that aberrant DNA methylation in childhood ALL could play a crucial role as a determinant of gene expression in disease-specific alterations. In our study, we observed a negative correlation between hypomethylation of CpGs and overexpression of genes DAPK1, CNKSR3, MIR4435-HG2, CTHRC1, NPDC1, SLC45A3, ITGA6, ASCL2, and BOC, supporting the idea that changes in DNA methylation have the potential to influence gene expression. While it is widely recognized that promoter methylation can influence gene expression (Moore et al., 2013), the specific biological mechanisms driving this alteration in leukemias remain unclear. Some researchers have proposed several approaches that may be linked to mutations in the epigenetic machinery. For instance, mutations in DNMTAs have been associated with a gain of function in the protein, leading to either global or segmented hypermethylation (Schulze et al., 2016; Brunetti et al., 2017). Conversely, alterations in DNA demethylation mechanisms, such as gain-of-function mutations in TET enzymes, can result in zones of hypomethylation (Huang et al., 2013; Bowman and Levine, 2017; Wu and Zhang, 2017). Additionally, some studies have suggested a correlation between altered methylation states and the availability of the substrate SAM (S-adenosylmethionine), indicating that a low dietary intake of SAM-containing foods could impact an individual’s methylation states (Mentch et al., 2015).
However, this study does not fully elucidate the biological mechanism underlying hypomethylation associated with gene overexpression. Nevertheless, these findings provide valuable insights that can help generate new hypotheses to further understand the underlying biological mechanisms.
Aberrant patterns of DNA methylation have been linked to clinical outcome in patients with ALL; however, further research is required to evaluate the clinical utility of some of these findings (Tsellou et al., 2005; Roman-Gomez et al., 2007; Kuang et al., 2008; Musialik et al., 2015; Mai et al., 2016; Ogawa et al., 2016). In this study, we selected MIR4435-2HG, DAPK1, ASCL2, BOC, and CNKSR3 as potential biomarkers of treatment response. Their overexpression reliably predicts treatment failure or refractoriness with high sensitivity and specificity. Notably, among these biomarkers, MIR4435-2HG stands out as the most robust predictor of therapeutic failure.
Recently, selected genes had been described as possible diagnostic and prognostic biomarkers in different types of cancer and other non-neoplastic diseases (Table 4).
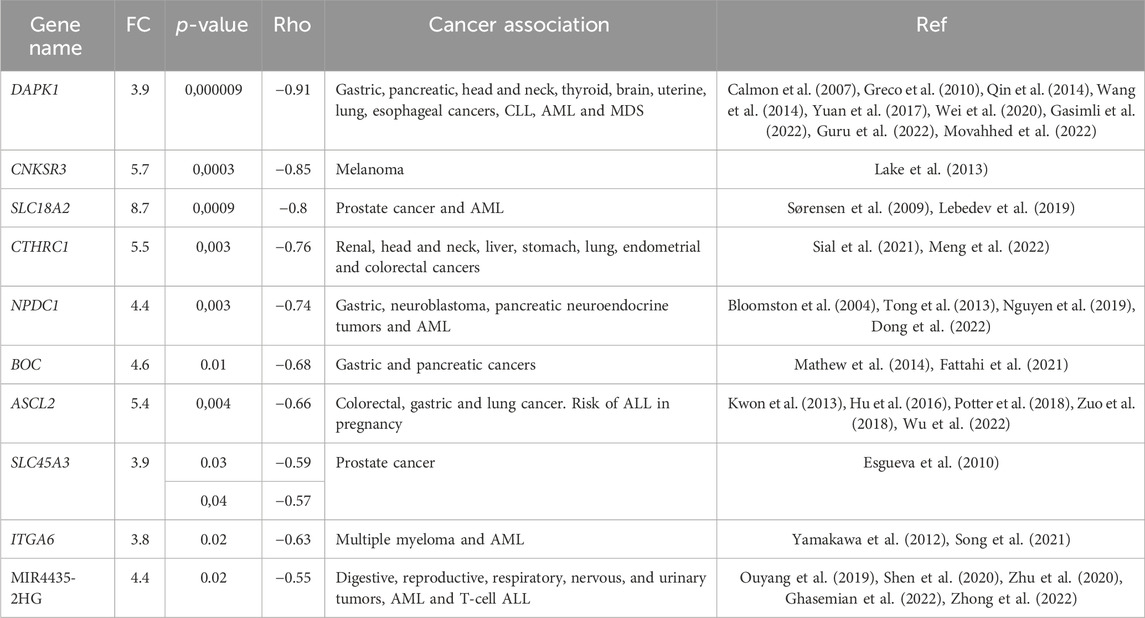
Table 4. List of genes choose as possible predictive biomarkers of induction chemotherapy response.
In particular, MIR4435-2HG, which is a long non-coding RNA, is also known as LncRNA-AWPPH, LINC00978, or MORRBID (Ghasemian et al., 2022). Interestingly, MIR4435-2HG overexpression has previously been associated with hypomethylation in gliomas (Zhong et al., 2022). In patients with T-cell ALL, MIR4435-2HG showed an elevated expression compared to healthy individuals and has been linked to the promotion of proliferation as well as the inhibition of apoptosis of ALL cell lines (Li et al., 2020). Although the precise biological role of MIR4435-2HG is still under investigation, it is known to contribute by deregulating different signaling pathways associated with proliferation, invasion, migration, epithelial-mesenchymal transition, and apoptosis. Specifically, it plays a role in signaling pathways such as TGF-β, WNT-β catenin, MDM2/p53, PI3K/AKT, Hippo, and MAPK/ERK (Ouyang et al., 2019; Zhong et al., 2022).
Unfortunately, no clinical variable was identified as risk factor for death in our population; however, MIR4435-2HG overexpression was found to significantly increases risk of death, predicts death, and correlated with poorer survival. Similar findings have been reported in acute myeloid leukemia by Zhigang Cai et al., 2020. Moreover, in other cancer models, MIR4435-2HG overexpression has consistently been associated with worse progression-free survival and overall survival (Ouyang et al., 2019; Zhu et al., 2020; Zhong et al., 2022).
No studies have explored the relationship between aberrant DNA methylation, gene overexpression, and MRD during induction chemotherapy. However, certain authors have reported differences in the methylation profiles of patients who experienced relapse compared to those who did not (Borssén et al., 2018), where patients with a less methylated CpG island methylator phenotype at diagnosis exhibited inferior overall survival compared to those with more methylated CpG island phenotype. In a prior study, Sandoval et al., 2012 reported hypomethylation in various genome regions, including Polycomb target genes, and its association with poor survival and relapse. Similarly, Hogan et al. reported epigenetic dysregulation in the acquisition of chemoresistance during relapse, involving genes CDKN2A, COL6A2, PTPRO, and CSMD1 (Hogan et al., 2015).
The search for biomarkers in the transcriptome or methylome of patients is very valuable, especially when 25% of patients with pediatric leukemia lack detectable genetic alterations and have a low mutation rate, which is a challenge for risk classification (Iacobucci and Mullighan, 2017). Interestingly, in our cohort, more than 70% of our patients showed no genetic alterations but displayed overexpressed of MIR4435-2HG, DAPK1 and ASCL2, which correlated with worse survival. These results suggest that assessing the expression of these genes by RT-qPCR could improve risk classification, especially in patients without genetic alterations.
While MIR4435-2HG overexpression appears to be a poor prognostic factor, the association of DAPK1 expression with poor prognosis is controversial (San Jose-Eneriz et al., 2013). In this study, we associated DAPK1 overexpression and hypomethylation with therapeutic failure, and poorer survival in patients with normal karyotype. DAPK1 has also been associated with resistance to imatinib in chronic myeloid leukemia (Guru et al., 2022), autophagia (Singh et al., 2016), alterations in the p53 signaling pathway in chronic lymphocytic leukemia (Wang et al., 2014) and methylated in myelodysplastic syndrome (Greco et al., 2010).
Here we propose a gene profile that can predict treatment response in children with B-ALL In particular, we demonstrate for the first time that MIR4435-2HG is overexpressed and hypomethylated in MRD + patients, and that it has the ability to predict treatment response and confer an increased risk of death in those patients who overexpress it (Figure 8). The detection of MIR4435-2HG could be combined with MRD analysis to improve risk classification, particularly in patients with normal karyotype. The proposed genetic profile offers the possibility of expanding research into new biomarkers predictive of response to treatment, which, in the future, would be a valuable tool to improve risk classification. A great contribution of this study is that the genes can be identified by RT-qPCR, which is efficient, fast, and cost-effective at the clinical level.
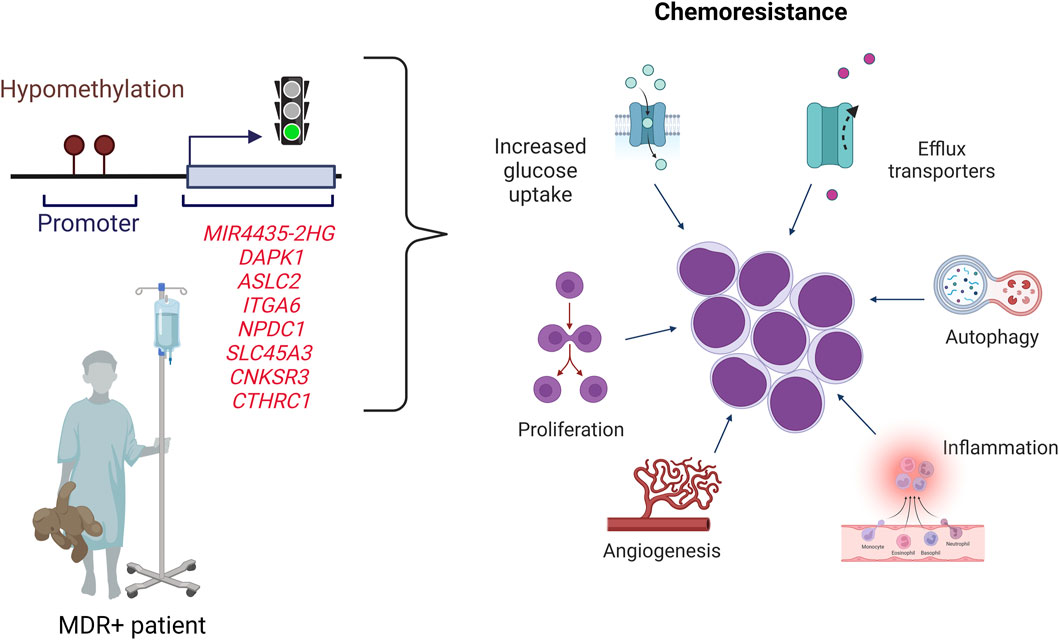
Figure 8. Proposed scheme for pediatric B-cell ALL patients. Patients with B-ALL who overexpress the MIR4435-2HG, DAPK1, ASCL2, ITGA6, NPDC1, SLC45A3, CNKSR3 and CTHRC1 genes have a high probability of being MRD+ and dying. The overexpression could be related to hypomethylation of the CpGs sites of these genes. The genes overexpressed are related to different hallmarks of cancer.
The limitations of this study are associated with the relatively low number of newly diagnosed patients eligible for this investigation, as well as the limited number of MRD + patients. Another limitation is associated with the follow-up duration for the patients, typically limited 2 years in most cases, which does not allow us to generate a solid conclusion about patient survival (death). Therefore, it is crucial to validate these results in a larger cohort of patients with a prolonged follow-up period for a more comprehensive evaluation.
Data availability statement
The datasets presented in this study can be found in online repositories. The names of the repository/repositories and accession number(s) can be found below: Gene Expression Omnibus (GEO), accession number GSE229056.
Ethics statement
The studies involving humans were approved by the Comité de investigaciones y ética de la facultad de medicina de la Pontificia Universidad Javeriana (Hospital Universitario San Ignacio). Comité de ética en investigación (Hospital Militar Central). Comité de ética en investigaciones del Instituto Nacional de Cancerología (Instituto Nacional de Cancerología). The studies were conducted in accordance with the local legislation and institutional requirements. Written informed consent for participation in this study was provided by the participants’ legal guardians/next of kin.
Author contributions
YT-L: Writing–review and editing, Writing–original draft, Visualization, Validation, Supervision, Software, Resources, Project administration, Methodology, Investigation, Funding acquisition, Formal Analysis, Data curation, Conceptualization. JZ: Writing–review and editing, Supervision, Software, Methodology, Investigation, Formal Analysis, Data curation. NC-R: Writing–review and editing, Methodology, Investigation, Formal Analysis, Conceptualization. SQ: Writing–review and editing, Methodology, Formal Analysis, Data curation. PG: Writing–review and editing, Methodology, Formal Analysis, Conceptualization. IR: Writing–review and editing, Methodology, Formal Analysis. NP-G: Writing–review and editing, Methodology. AI: Writing–review and editing, Methodology, Funding acquisition. LL: Writing–review and editing, Methodology, Investigation, Formal Analysis, Data curation. Alba Lucia AC: Writing–review and editing, Writing–original draft, Visualization, Supervision, Resources, Project administration, Methodology, Investigation, Funding acquisition, Formal Analysis, Conceptualization.
Funding
The author(s) declare that financial support was received for the research, authorship, and/or publication of this article. This study was supported by the Instituto Nacional de Cancerología and Hospital Universitario San Ignacio. JZ received funding from NIH grants P20 GM121288-06 and R25GM1148309-01.
Acknowledgments
We are mainly grateful to the patients who agreed to participate in the study, as well as to their tutors. We also thank the institutions that recruited the patients (Instituto Nacional de Cancerología, Hospital Militar Central and Hospital Universitario San Ignacio), especially Dr. Amaranto Suárez who provided support in the diffusion of the project within the Instituto Nacional de Cancerología, as well as Dr. David Garay, Dr. Eddie Pabón, Dr. Camila Prada, Dr. Jorge Buitrago, Andrea Naranjo, Giovanna Bedon, Bibiana Martinez, Paula Toro and Cindy Arevalo. Finally, special thanks to the Fundación Colombiana de Leucemia y Linfoma for the financial support to Yulieth Torres-Llanos in her PhD studies.
Conflict of interest
The authors declare that the research was conducted in the absence of any commercial or financial relationships that could be construed as a potential conflict of interest.
Publisher’s note
All claims expressed in this article are solely those of the authors and do not necessarily represent those of their affiliated organizations, or those of the publisher, the editors and the reviewers. Any product that may be evaluated in this article, or claim that may be made by its manufacturer, is not guaranteed or endorsed by the publisher.
Supplementary material
The Supplementary Material for this article can be found online at: https://www.frontiersin.org/articles/10.3389/fmolb.2024.1385140/full#supplementary-material
References
Bloomston, M., Durkin, A., Yang, I., Rojiani, M., Rosemurgy, A. S., Enkmann, S., et al. (2004). Identification of molecular markers specific for pancreatic neuroendocrine tumors by genetic profiling of Core biopsies. Ann. Surg. Oncol. 11 (4), 413–419. doi:10.1245/ASO.2004.03.077
Borssén, M., Nordlund, J., Haider, Z., Landfors, M., Larsson, P., Kanerva, J., et al. (2018). DNA methylation holds prognostic information in relapsed precursor B-cell acute lymphoblastic leukemia. Clin. Epigenetics 10 (1), 31–37. doi:10.1186/s13148-018-0466-3
Bowman, R. L., and Levine, R. L. (2017). TET2 in normal and malignant hematopoiesis. Cold Spring Harb. Perspect. Med. 7 (8), a026518. doi:10.1101/cshperspect.a026518
Brunetti, L., Gundry, M. C., and Goodell, M. A. (2017). DNMT3A in leukemia. Cold Spring Harb. Perspect. Med. 7 (2), a030320. doi:10.1101/cshperspect.a030320
Cai, Z., Aguilera, F., Ramdas, B., Daulatabad, S. V., Srivastava, R., Kotzin, J. J., et al. (2020). Targeting bim via a lncRNA morrbid regulates the survival of preleukemic and leukemic cells. Cell Rep. 31 (12), 107816. doi:10.1016/j.celrep.2020.107816
Calmon, M. F., Colombo, J., Carvalho, F., Souza, F. P., Filho, J. F. G., Fukuyama, É. E., et al. (2007). Methylation profile of genes CDKN2A (p14 and p16), DAPK1, CDH1, and ADAM23 in head and neck cancer. Cancer Genet. Cytogenet 173 (1), 31–37. doi:10.1016/j.cancergencyto.2006.09.008
Chatterton, Z., Burke, D., Emslie, K. R., Craig, J. M., Ng, J., Ashley, D. M., et al. (2014). Validation of DNA methylation biomarkers for diagnosis of acute lymphoblastic leukemia. Clin. Chem. 60 (7), 995–1003. doi:10.1373/clinchem.2013.219956
Cruz-Rodriguez, N., Combita, A. L., Enciso, L. J., Quijano, S. M., Pinzon, P. L., Lozano, O. C., et al. (2016). High expression of ID family and IGJ genes signature as predictor of low induction treatment response and worst survival in adult Hispanic patients with B-Acute lymphoblastic leukemia. J. Exp. Clin. Cancer Res. 35 (1), 64–14. doi:10.1186/s13046-016-0333-z
Cullen, S. M., Mayle, A., Rossi, L., and Goodell, M. A. (2014). Hematopoietic stem cell development: an epigenetic journey. Curr. Top. Dev. Biol. 107, 39–75. doi:10.1016/B978-0-12-416022-4.00002-0
Dong, R., Chen, S., Lu, F., Zheng, N., Peng, G., Li, Y., et al. (2022). Models for predicting response to immunotherapy and prognosis in patients with gastric cancer: DNA damage response genes. Biomed. Res. Int. 2022, 4909544. doi:10.1155/2022/4909544
Esgueva, R., Perner, S., J Lafargue, C., Scheble, V., Stephan, C., Lein, M., et al. (2010). Prevalence of TMPRSS2-ERG and SLC45A3-ERG gene fusions in a large prostatectomy cohort. Mod. Pathol. 23 (4), 539–546. doi:10.1038/modpathol.2009.193
Fattahi, S., Nikbakhsh, N., Ranaei, M., Sabour, D., and Akhavan-Niaki, H. (2021). Author Correction: association of sonic hedgehog signaling pathway genes IHH, BOC, RAB23a and MIR195-5p, MIR509-3-5p, MIR6738-3p with gastric cancer stage. Sci. Rep. 11 (1), 16027. doi:10.1038/s41598-021-95379-8
Figueroa, M., Chen, S., Andersson, A. K., Phillips, L. A., Li, Y., Sotzen, J., et al. (2013). Integrated genetic and epigenetic analysis of childhood acute lymphoblastic leukemia. J. Clin. Invest. 123 (7), 3099–3111. doi:10.1172/JCI66203
Garcia-Manero, G., Yang, H., Kuang, S. Q., O’Brien, S., Thomas, D., and Kantarjian, H. (2009). Epigenetics of acute lymphocytic leukemia. Semin. Hematol. 46 (1), 24–32. doi:10.1053/j.seminhematol.2008.09.008
Gasimli, K., Raab, M., Becker, S., Sanhaji, M., and Strebhardt, K. (2022). The role of DAPK1 in the cell cycle regulation of cervical cancer cells and in response to topotecan. J. Cancer 13 (3), 728–743. doi:10.7150/jca.66492
Ghasemian, M., Rajabibazl, M., Sahebi, U., Sadeghi, S., Maleki, R., Hashemnia, V., et al. (2022). Long non-coding RNA MIR4435-2HG: a key molecule in progression of cancer and non-cancerous disorders. Cancer Cell Int. 22, 215. doi:10.1186/s12935-022-02633-8
Greco, M., D’Alò, F., Scardocci, A., Criscuolo, M., Fabiani, E., Guidi, F., et al. (2010). Promoter methylation of DAPK1, E-cadherin and thrombospondin-1 in de novo and therapy-related myeloid neoplasms. Blood Cells Mol. Dis. 45 (3), 181–185. doi:10.1016/j.bcmd.2010.05.008
Guru, S. A., Sumi, M. P., Mir, A. R., Beg, M. M. A., koner, B. C., and Saxena, A. (2022). Aberrant hydroxymethylation in promoter CpG regions of genes related to the cell cycle and apoptosis characterizes advanced chronic myeloid leukemia disease, poor imatinib respondents and poor survival. BMC Cancer 22 (1), 405. doi:10.1186/s12885-022-09481-9
Hanahan, D. (2022). Hallmarks of cancer: new dimensions. Cancer Discov. 12, 31–46. doi:10.1158/2159-8290.CD-21-1059
Hogan, L. E., Meyer, J. A., Yang, J., Wang, J., Wong, N., Yang, W., et al. (2015). Integrated genomic analysis of relapsed childhood acute lymphoblastic leukemia reveals therapeutic strategies. Blood 118 (19), 5218–5226. doi:10.1182/blood-2011-04-345595
Hu, D., and Shilatifard, A. (2016). Epigenetics of hematopoiesis and hematological malignancies. Genes Dev. 30 (18), 2021–2041. doi:10.1101/gad.284109.116
Hu, X. G., Chen, L., Wang, Q. L., Zhao, X. L., Tan, J., Cui, Y. H., et al. (2016). Elevated expression of ASCL2 is an independent prognostic indicator in lung squamous cell carcinoma. J. Clin. Pathol. 69 (4), 313–318. doi:10.1136/jclinpath-2015-203025
Huang, H., Jiang, X., Li, Z., Li, Y., Song, C. X., He, C., et al. (2013). TET1 plays an essential oncogenic role in MLL-rearranged leukemia. Proc. Natl. Acad. Sci. U. S. A. 110 (29), 11994–11999. doi:10.1073/pnas.1310656110
Iacobucci, I., and Mullighan, C. G. (2017). Genetic basis of acute lymphoblastic leukemia. J. Clin. Oncol. 35 (9), 975–983. doi:10.1200/JCO.2016.70.7836
Katz, A. J., Chia, V. M., Schoonen, W. M., and Kelsh, M. A. (2015). Acute lymphoblastic leukemia: an assessment of international incidence, survival, and disease burden. Cancer Causes Control 26 (11), 1627–1642. doi:10.1007/s10552-015-0657-6
Kuang, S. Q., Tong, W. G., Yang, H., Lin, W., Lee, M. K., Fang, Z. H., et al. (2008). Genome-wide identification of aberrantly methylated promoter associated CpG islands in acute lymphocytic leukemia. Leukemia 22 (8), 1529–1538. doi:10.1038/leu.2008.130
Kwon, O. H., Park, J. L., Baek, S. J., Noh, S. M., Song, K. S., Kim, S. Y., et al. (2013). Aberrant upregulation of ASCL2 by promoter demethylation promotes the growth and resistance to 5-fluorouracil of gastric cancer cells. Cancer Sci. 104 (3), 391–397. doi:10.1111/cas.12076
Lake, S. L., Damato, B. E., Kalirai, H., Dodson, A. R., Taktak, A. F. G., Lloyd, B. H., et al. (2013). Single nucleotide polymorphism array analysis of uveal melanomas reveals that amplification of CNKSR3 is correlated with improved patient survival. Am. J. Pathology 182 (3), 678–687. doi:10.1016/j.ajpath.2012.11.036
Lebedev, T. D., Vagapova, E. R., Popenko, V. I., Leonova, O. G., Spirin, P. V., and Prassolov, V. S. (2019). Two receptors, two isoforms, two cancers: comprehensive analysis of kit and trka expression in neuroblastoma and acute myeloid leukemia. Front. Oncol. 9, 1046. doi:10.3389/fonc.2019.01046
Lejman, M., Chałupnik, A., Chilimoniuk, Z., and Dobosz, M. (2022). Genetic biomarkers and their clinical implications in B-cell acute lymphoblastic leukemia in children. Int. J. Mol. Sci. 23, 2755. doi:10.3390/ijms23052755
Li, X., Song, F., and Sun, H. (2020). Long non-coding RNA AWPPH interacts with ROCK2 and regulates the proliferation and apoptosis of cancer cells in pediatric T-cell acute lymphoblastic leukemia. Oncol. Lett. 20 (5), 239. doi:10.3892/ol.2020.12102
Mai, H., Liu, X., Chen, Y., Li, C., Cao, L., Chen, X., et al. (2016). Hypermethylation of p15 gene associated with an inferior poor long-term outcome in childhood acute lymphoblastic leukemia. J. Cancer Res. Clin. Oncol. 142 (2), 497–504. doi:10.1007/s00432-015-2063-6
Matasar, M. J., Ritchie, E. K., Consedine, N., Magai, C., and Neugut, A. I. (2006). Incidence rates of the major leukemia subtypes among U.S. Hispanics, Blacks, and non-Hispanic Whites. Leuk. Lymphoma 47 (11), 2365–2370. doi:10.1080/10428190600799888
Mathew, E., Zhang, Y., Holtz, A. M., Kane, K. T., Song, J. Y., Allen, B. L., et al. (2014). Dosage-dependent regulation of pancreatic cancer growth and angiogenesis by Hedgehog signaling. Cell Rep. 9 (2), 484–494. doi:10.1016/j.celrep.2014.09.010
McCabe, M. T., Brandes, J. C., and Vertino, P. M. (2009). Cancer DNA methylation: molecular mechanisms and clinical implications. Clin. Cancer Res. 15, 3927–3937. doi:10.1158/1078-0432.CCR-08-2784
Meng, C., Zhang, Y., Jiang, D., and Wang, J. (2022). CTHRC1 is a prognosis-related biomarker correlated with immune infiltrates in colon adenocarcinoma. World J. Surg. Oncol. 20 (1), 89. doi:10.1186/s12957-022-02557-7
Mentch, S. J., Mehrmohamadi, M., Huang, L., Liu, X., Gupta, D., Mattocks, D., et al. (2015). Histone methylation dynamics and gene regulation occur through the sensing of one-carbon metabolism. Cell Metab. 22 (5), 861–873. doi:10.1016/j.cmet.2015.08.024
Moore, L. D., Le, T., and Fan, G. (2013). DNA methylation and its basic function. Neuropsychopharmacology 38 (1), 23–38. doi:10.1038/npp.2012.112
Movahhed, P., Saberiyan, M., Safi, A., Arshadi, Z., Kazerouni, F., and Teimori, H. (2022). The impact of DAPK1 and mTORC1 signaling association on autophagy in cancer. Mol. Biol. Rep. 49, 4959–4964. doi:10.1007/s11033-022-07154-1
Musialik, E., Bujko, M., Kober, P., Wypych, A., Gawle-Krawczyk, K., Matysiak, M., et al. (2015). Promoter methylation and expression levels of selected hematopoietic genes in pediatric B-cell acute lymphoblastic leukemia. Blood Res. 50 (1), 26–32. doi:10.5045/br.2015.50.1.26
Newton, T. P., Cummings, C. T., Graham, D. K., and Bernt, K. M. (2014). Epigenetics and chemoresistance in childhood acute lymphoblastic leukemia. Int. J. Hematol. Oncol. 3 (1), 19–30. doi:10.2217/ijh.13.68
Nguyen, C. H., Glüxam, T., Schlerka, A., Bauer, K., Grandits, A. M., Hackl, H., et al. (2019). SOCS2 is part of a highly prognostic 4-gene signature in AML and promotes disease aggressiveness. Sci. Rep. 9 (1), 9139. doi:10.1038/s41598-019-45579-0
Nordlund, J., and Syvänen, A. C. (2018). Epigenetics in pediatric acute lymphoblastic leukemia. Semin. Cancer Biol. 51, 129–138. doi:10.1016/j.semcancer.2017.09.001
Ogawa, S., Tsuchida, M., Kaizu, K., Manabe, A., Sato, Y., Aoki, T., et al. (2016). Long-term outcome of 6-month maintenance chemotherapy for acute lymphoblastic leukemia in children. Leukemia 31 (3), 580–584. doi:10.1038/leu.2016.274
Ouyang, W., Ren, L., Liu, G., Chi, X., and Wei, H. (2019). Lncrna mir4435-2hg predicts poor prognosis in patients with colorectal cancer. PeerJ 2019 (4). doi:10.7717/peerj.6683
Patel, S. A., and Vanharanta, S. (2017). Epigenetic determinants of metastasis. Mol. Oncol. 11 (1), 79–96. doi:10.1016/j.molonc.2016.09.008
Poli, V., Fagnocchi, L., and Zippo, A. (2018). Tumorigenic cell reprogramming and cancer plasticity: interplay between signaling, microenvironment, and epigenetics. Stem Cells Int. 2018, 4598195. doi:10.1155/2018/4598195
Potter, C., Moorman, A. V., Relton, C. L., Ford, D., Mathers, J. C., Strathdee, G., et al. (2018). Maternal red blood cell folate and infant vitamin B12 status influence methylation of genes associated with childhood acute lymphoblastic leukemia. Mol. Nutr. Food Res. 62 (22), 1800411. doi:10.1002/mnfr.201800411
Pui, C.-H., Leslie, L., and Robison, A. T. L. (2008). Acute lymphoblastic leukaemia. Lancet 371, 1030–1043. doi:10.1016/s0140-6736(08)60457-2
Qin, Y., Ye, G. X., Wu, C. J., Wang, S., Pan, D. B., Jiang, J. Y., et al. (2014). Effect of DAPK1 gene on proliferation, migration, and invasion of carcinoma of pancreas BxPC-3 cell line. Int. J. Clin. Exp. Pathol. 7, 7536–7544.
Roman-Gomez, J., Jimenez-Velasco, A., Barrios, M., Prosper, F., Heiniger, A., Torres, A., et al. (2007). Poor prognosis in acute lymphoblastic leukemia may relate to promoter hypermethylation of cancer-related genes. Leuk. Lymphoma 48 (7), 1269–1282. doi:10.1080/10428190701344899
Sandoval, J., Heyn, H., Méndez-González, J., Gomez, A., Moran, S., Baiget, M., et al. (2012). Genome-wide DNA methylation profiling predicts relapse in childhood B-cell acute lymphoblastic leukaemia. Br. J. Haematol. 160, 406–409. doi:10.1111/bjh.12113
San Jose-Eneriz, E., Agirre, X., Rodriguez-Otero, P., and Prosper, F. (2013). Epigenetic regulation of cell signaling pathways in acute lymphoblastic leukemia. Epigenomics 5 (5), 525–538. doi:10.2217/epi.13.56
Schulze, I., Rohde, C., Scheller-Wendorff, M., Bäumer, N., Krause, A., Herbst, F., et al. (2016). Increased DNA methylation of Dnmt3b targets impairs leukemogenesis. Blood 127 (12), 1575–1586. doi:10.1182/blood-2015-07-655928
Shen, H., Sun, B., Yang, Y., Cai, X., Bi, L., Deng, L., et al. (2020). MIR4435-2HG regulates cancer cell behaviors in oral squamous cell carcinoma cell growth by upregulating TGF-β1. Odontology 108 (4), 553–559. doi:10.1007/s10266-020-00488-x
Sial, N., Ahmad, M., Hussain, M. S., Iqbal, M. J., Hameed, Y., Khan, M., et al. (2021). CTHRC1 expression is a novel shared diagnostic and prognostic biomarker of survival in six different human cancer subtypes. Sci. Rep. 11 (1), 19873. doi:10.1038/s41598-021-99321-w
Singh, P., Ravanan, P., and Talwar, P. (2016). Death associated protein kinase 1 (DAPK1): a regulator of apoptosis and autophagy. Front. Mol. Neurosci. 9, 46. doi:10.3389/fnmol.2016.00046
Sok, P., Brown, A. L., Taylor, O. A., Bernhardt, M. B., Bernini, J. C., Erana, R. A., et al. (2022). Abstract 3633: disparities in relapse among a large multi-ethnic population of children diagnosed with acute lymphoblastic leukemia (ALL): a report from the Reducing Ethnic Disparities in Acute Leukemia (REDIAL) Consortium. Cancer Res. 82 (12), 3633. doi:10.1158/1538-7445.AM2022-3633
Song, S., Zhang, J., Su, Q., Zhang, W., Jiang, Y., Fan, G., et al. (2021). Downregulation of ITGA6 confers to the invasion of multiple myeloma and promotes progression to plasma cell leukaemia. Br. J. Cancer 124 (11), 1843–1853. doi:10.1038/s41416-021-01362-5
Sørensen, K. D., Wild, P. J., Mortezavi, A., Adolf, K., Tørring, N., Heebøll, S., et al. (2009). Genetic and epigenetic SLC18A2 silencing in prostate cancer is an independent adverse predictor of biochemical recurrence after radical prostatectomy. Clin. Cancer Res. 15 (4), 1400–1410. doi:10.1158/1078-0432.CCR-08-2268
Stary, J., Zimmermann, M., Campbell, M., Castillo, L., Dibar, E., Donska, S., et al. (2014). Intensive chemotherapy for childhood acute lymphoblastic leukemia: results of the randomized intercontinental trial ALL IC-BFM 2002. J. Clin. Oncol. 32 (3), 174–184. doi:10.1200/JCO.2013.48.6522
Stumpel, D. J. P. M., Schneider, P., van Roon, E. H. J., Boer, J. M., de Lorenzo, P., Valsecchi, M. G., et al. (2009). Specific promoter methylation identifies different subgroups of MLL-rearranged infant acute lymphoblastic leukemia, influences clinical outcome, and provides therapeutic options. Blood 114 (27), 5490–5498. doi:10.1182/blood-2009-06-227660
Tong, C. W., Wang, J. L., Jiang, M. S., Hsu, C. H., Chang, W. T., and Huang, A. M. (2013). Novel genes that mediate nuclear respiratory factor 1-regualted neurite outgrowth in neuroblastoma IMR-32 cells. Gene 515 (1), 62–70. doi:10.1016/j.gene.2012.11.026
Tsellou, E., Troungos, C., Moschovi, M., Athanasiadou-Piperopoulou, F., Polychronopoulou, S., Kosmidis, H., et al. (2005). Hypermethylation of CpG islands in the promoter region of the p15INK4B gene in childhood acute leukaemia. Eur. J. Cancer 41 (4), 584–589. doi:10.1016/j.ejca.2004.12.010
Van Dongen Jjm, , Lhermitte, L., Böttcher, S., Almeida, J., Van Der Velden, V. H. J., Flores-Montero, J., et al. (2012). EuroFlow antibody panels for standardized n-dimensional flow cytometric immunophenotyping of normal, reactive and malignant leukocytes. Leukemia 26 (9), 1908–1975. doi:10.1038/leu.2012.120
Van Dongen Jjm, , Van Der Velden, V. H. J., Brüggemann, M., and Orfao, A. (2015). Minimal residual disease diagnostics in acute lymphoblastic leukemia: need for sensitive, fast, and standardized technologies. Blood 125 (26), 3996–4009. doi:10.1182/blood-2015-03-580027
van Dongen Jacques, J. M., Taku, S., Panzer-Grümayer, E. R., Andrea, B., Pongers-Willemse Marja, J., Lilly, C., et al. (1998). Prognostic value of minimal residual disease in acutelymphoblastic leukaemia in childhood. Lancet 352, 1731–1738. doi:10.1016/S0140-6736(98)04058-6
Vera, A. M., Pardo, C., Duarte, M. C., and Suárez, A. (2012). Experiencia en el análisis de la mortalidad por leucemia aguda pediátrica en el Instituto Nacional de Cancerología. Biomédica 32 (3), 355–364. doi:10.7705/biomedica.v32i3.691
Wainwright, E. N., and Scaffidi, P. (2017). Epigenetics and cancer stem cells: unleashing, hijacking, and restricting cellular plasticity. Trends Cancer 3 (5), 372–386. doi:10.1016/j.trecan.2017.04.004
Walsh, K. M., Chokkalingam, A. P., Hsu, L. I., Metayer, C., De Smith, A. J., Jacobs, D. I., et al. (2013). Associations between genome-wide Native American ancestry, known risk alleles and B-cell ALL risk in Hispanic children. Leukemia 27, 2416–2419. doi:10.1038/leu.2013.130
Walsh, K. M., de Smith, A. J., Welch, T. C., Smirnov, I., Cunningham, M. J., Ma, X., et al. (2014). Genomic ancestry and somatic alterations correlate with age at diagnosis in Hispanic children with B-cell acute lymphoblastic leukemia. Am. J. Hematol. 89 (7), 721–725. doi:10.1002/ajh.23727
Wang, L. Q., Kwong, Y. L., Wong, K. F., Kho, C. S. B., Jin, D. Y., Tse, E., et al. (2014). Epigenetic inactivation of mir-34b/c in addition to mir-34a and DAPK1 in chronic lymphocytic leukemia. J. Transl. Med. 12 (1), 52. doi:10.1186/1479-5876-12-52
Wei, J., Xie, Q., Liu, X., Wan, C., Wu, W., Fang, K., et al. (2020). Identification the prognostic value of glutathione peroxidases expression levels in acute myeloid leukemia. Ann. Transl. Med. 8 (11), 678. doi:10.21037/atm-20-3296
Wu, L., Sun, S., Qu, F., Liu, X., Sun, M., Pan, Y., et al. (2022). ASCL2 affects the efficacy of immunotherapy in colon adenocarcinoma based on single-cell RNA sequencing analysis. Front. Immunol. 13, 829640. doi:10.3389/fimmu.2022.829640
Wu, X., and Zhang, Y. (2017). TET-mediated active DNA demethylation: mechanism, function and beyond. Nat. Rev. Genet. 18 (9), 517–534. doi:10.1038/nrg.2017.33
Yamakawa, N., Kaneda, K., Saito, Y., Ichihara, E., and Morishita, K. (2012). The increased expression of integrin α6 (itga6) enhances drug resistance in evi1 high leukemia. PLoS One 7 (1), e30706. doi:10.1371/journal.pone.0030706
Younesian, S., Shahkarami, S., Ghaffari, P., Alizadeh, S., Mehrasa, R., and Ghaffari, S. H. (2019). Residual methylation of tumor suppressor gene promoters, RASSF6 and RASSF10, as novel biomarkers for minimal residual disease detection in adult acute lymphoblastic leukemia. Ann. Hematol. 98 (12), 2719–2727. doi:10.1007/s00277-019-03775-y
Yuan, W., Chen, J., Shu, Y., Liu, S., Wu, L., Ji, J., et al. (2017). Correlation of DAPK1 methylation and the risk of gastrointestinal cancer: a systematic review and meta-analysis. PLoS One 12 (9), e0184959. doi:10.1371/journal.pone.0184959
Zhong, C., Xie, Z., Zeng, L. H., Yuan, C., and Duan, S. (2022). MIR4435-2HG is a potential pan-cancer biomarker for diagnosis and prognosis. Front. Immunol. 13, 855078. doi:10.3389/fimmu.2022.855078
Zhu, L., Wang, A., Gao, M., Duan, X., and Li, Z. (2020). LncRNA MIR4435-2HG triggers ovarian cancer progression by regulating miR-128-3p/CKD14 axis. Cancer Cell Int. 20 (1), 145. doi:10.1186/s12935-020-01227-6
Keywords: B-cell acute lymphoblastic leukemia, biomarkers, MRD, gene expression, DNA methylation, prognosis, treatment response
Citation: Torres-Llanos Y, Zabaleta J, Cruz-Rodriguez N, Quijano S, Guzmán PC, de los Reyes I, Poveda-Garavito N, Infante A, Lopez-Kleine L and Combita AL (2024) MIR4435-2HG as a possible novel predictive biomarker of chemotherapy response and death in pediatric B-cell ALL. Front. Mol. Biosci. 11:1385140. doi: 10.3389/fmolb.2024.1385140
Received: 12 February 2024; Accepted: 28 February 2024;
Published: 30 April 2024.
Edited by:
Qingyu Luo, Dana–Farber Cancer Institute, United StatesReviewed by:
Lin Han, Dana–Farber Cancer Institute, United StatesKezhi Yan, Cystic Fibrosis Foundation, United States
Copyright © 2024 Torres-Llanos, Zabaleta, Cruz-Rodriguez, Quijano, Guzmán, de los Reyes, Poveda-Garavito, Infante, Lopez-Kleine and Combita. This is an open-access article distributed under the terms of the Creative Commons Attribution License (CC BY). The use, distribution or reproduction in other forums is permitted, provided the original author(s) and the copyright owner(s) are credited and that the original publication in this journal is cited, in accordance with accepted academic practice. No use, distribution or reproduction is permitted which does not comply with these terms.
*Correspondence: Alba Lucía Combita, YWNvbWJpdGFAY2FuY2VyLmdvdi5jbw==; Yulieth Torres-Llanos, eXh0b3JyZXNsQHVuYWwuZWR1LmNv