Abstract
Introduction: The cytoskeleton consists of actin, microtubules, septins, and intermediate filaments and, in most cells, is anchored to an extracellular matrix. Each cell has a unique arrangement of this network and readjusts it from time to time. To investigate the regulation of these reorganizations, we identified interactors from extracts of four cultured lines representing basal cells from the airway epithelium.
Methods: After immunoprecipitation with an antibody against keratin 17, samples were processed by liquid chromatography and tandem mass spectrometry. Samples not undergoing antibody-mediated capture were processed in parallel.
Results: The main keratins of basal cells, namely, Krt14 (type I) and Krt5 (type II), constituted 67% of the total keratin recovered. Several other intermediate filament proteins, nestin, lamin-B1, and prelamin A/C, were present but not enriched upon immunoprecipitation. Although the class of armadillo-repeat proteins was represented by beta-catenin1 and plakoglobin, other desmosome plaque constituents were absent. Large cytolinkers were represented by the spectraplakin, microtubule-actin cross-linking factor (Macf1), which was enriched by immunoprecipitation, and the plakin, plectin, which was not enriched. Subunits of actin filaments and microtubules, along with numerous proteins associated with them, were recovered in both immunoprecipitated samples and those lacking the capture step. Coefficients of determination were computed based on abundance. The actin-associated proteins, alpha-spectrin and brain-specific angiogenesis inhibitor (Baiaip2l), were modestly correlated with keratin abundance but highly correlated with one another and with the keratin-binding protein, annexin A2. This interaction network resembled the pedestal formed by pathogenic Escherichia coli. Microtubule-associated proteins, dynamin 1-like protein and cytoplasmic dynein 1 heavy chain (Dync1h1), were enriched by immunoprecipitation, suggesting association with keratins, whereas kinesin-1 heavy chain and microtubule-associated protein retinitis pigmentosa 1 (EB1), were not enriched. Dync1h1 abundance was negatively correlated with that of all the septins, suggesting resemblance to a known antagonistic septin-dynein 1 relationship on microtubules.
Conclusion: The cell lines showed remarkable uniformity with respect to the candidates interacting with cytoskeleton. The alpha-spectrin-Baiap2l network may link actin filaments to keratin precursor particles. A smaller interaction network centered on Dync1h1 was negatively correlated with all spectrin-Baiap2l constituents, suggesting that it and its binding partners are excluded from the pedestal-like domain.
1 Introduction
Along with a reduced ability to adhere to substrata, structural softening is a nearly universal characteristics of cancer cells. In previous studies, we correlated such structural changes with alterations in various biophysical traits (Heckman et al., 1987; Heckman and Jamasbi, 1999). Several review articles on this subject argue that the changes are related to the deregulation of growth control in the cancer cell [see for reviews (Alibert et al., 2017; Sheetz, 2019; Xin et al., 2023)]. Experimental studies on the human breast cancer cell lines, MDA MB231 and MCF10A, suggest that reduced adhesion may result from altered gene expression. Although there was little difference in the content of proteins such as paxillin, focal adhesion kinase, or integrins, the adhesive strength of the nontumorigenic MCF10A cells was an estimated 10-fold greater than the malignant MDA MB231 cells in the absence of cations (Fuhrmann et al., 2017). Studies of different populations, selected for lower or higher adhesiveness, found that 500 genes were differentially expressed. Several, KIF14, DYNC1H1, and AKAP9, were associated with microtubules. The list also included growth arrest specific 2 like 3 (GAS2L3), a cell cycle regulatory protein that links microtubules and actin filaments (Beri et al., 2020). Other cross-linkers, including KN motif and ankyrin repeat domains (Li et al., 2023) and an ortholog of Macf1, Short stop (Zhao et al., 2022), were thought to coordinate force transmission with microtubule recruitment. A few differentially expressed proteins may be able to modify the composition or rate of turnover of focal adhesions. This introduces a dilemma, because the cytoskeleton is integrated with adhesions by connections among proteins, making up a gigantic network. To address this problem, a database of putative interactors with cytoskeleton is needed.
We previously found that malignant respiratory airway cells were characterized by an aberrant arrangement of keratins (Manger and Heckman, 1982). The pattern of keratin rearrangement was intuitively recognizable. This would rarely be the case for rearrangement of the networks of actin or microtubules. Although the latter networks are studied more frequently than the keratins, they are known to interact with keratins in several ways. Keratin precursor particles of keratinocytes interact with the actin filaments that maintain membrane tension in the lamellipodium (Pora et al., 2020). Thus, the rearrangement observed could depend on the membrane force, and changes in either or both of these cytoskeletal networks may cause softening and/or reduced adhesiveness. In previous studies of the airway cells, actin was recovered in the pellet after extraction of the soluble proteins. It could not be dissociated even by high concentrations of salts and a nonionic detergent (Blobel et al., 1984; Heckman and Mayumi, 2022). This suggests tight binding between the two proteins, consistent with the idea that keratin rearrangement in malignant cells could depend on the membrane force maintained by actin. Previous work also disclosed that long keratin fibrils, like other types of intermediate filaments, undergo anterograde transport on microtubules, mediated by kinesin-1 (Robert et al., 2019).
Whereas the architectural elements have been known for decades, it has now become clear that they form networks. There are numerous links among the networks that may join them in the same way architectural elements, such as joists and beams, knit structures together in a building. Neither the cross-linkers nor the scaffolds that perform the joining functions are well-known. If these proteins can be identified, their roles can be tested to determine whether any can account for the abnormal traits. Putative scaffold interactors and cytoskeletal cross-linkers were found here by comparing the proteins in four lines representing basal cells of the respiratory airway epithelium. It was assumed that the linkers and scaffolds are characteristic of basal cells. Thus, a list of proteins common to all lines will include them. Using tandem mass spectrometry to analyze the proteins, we found subsets associated with actin and microtubules. The keratin-associated proteins are less understood and were grouped with scaffolds and scaffold interactors. This novel method yielded a database of candidates that may link the structural elements. The results suggest that proteins whose abundance is correlated represent networks of interacting constituents. If they form hetero-multimeric clusters, cooperative interactions among the proteins may be required to stabilize the structures. Further work is needed to confirm the existence of each complex and discern its role and localization in cells.
2 Materials and methods
2.1 Cell lines and cell culture
Cell lines were derived from the upper airway epithelium of pathogen-free Fischer 344 inbred rats. The BP3 line was derived from tumors induced with benzo(a)pyrene and serially transplanted in immunocompetent F344 rats (Jamasbi et al., 1978; Heckman and Olson, 1979). It was malignant upon injection of as few as 100 cells and readily metastasized to distant sites (Heckman and Olson, 1979; Heckman and Mayumi, 2022). The 1000 W line was derived from tracheal epithelium pre-exposed to 7,12-dimethylbenz(a)anthracene (Marchok et al., 1978). For comparison, the 2C1 and 4C9 lines were derived from rat tracheal organ explants treated with phorbol 12-myristate 13-acetate (Steele et al., 1978). The 2C1 line was not tumorigenic. The 4C9 line became tumorigenic after prolonged serial passage in culture and did not metastasize in host animals (Manger and Heckman, 1982). Ethical approval was not required for the studies involving animals, because the cell lines were provided by other researchers. All lines were grown in Waymouth MB 752/1 medium (Sigma-Aldrich, Burlington, MA) supplemented with 10% fetal bovine serum, 0.1 μg/mL hydrocortisone, and 0.1 μg/mL insulin. Cells were plated at 7–12 × 105 per 100 mm dish and maintained at 37°C in a humidified atmosphere of 5% CO2. Cells were passaged using Ca2+- and Mg2+-free solution containing ethylene diamine tetraacetate (EDTA) and trypsin (Life Science Technologies, Grand Island, NY).
2.2 Protein extraction and Lowry assay
All chemicals were from Sigma-Aldrich unless otherwise designated. To prepare cytoskeletons, cell cultures were rinsed thrice with cytoskeletal buffer [140 mM NaCl (Fisher Scientific, Fair Lawn, NJ), 5 mM MgCl2, (Mallinckrodt, St. Louis, MO), 20 mM tris (hydroxymethyl)aminomethane (TRIS), pH 7.6] and exposed to radioimmunoprecipitation assay (RIPA) solution. RIPA, containing 1% Triton X-100 (TX-100), 0.1% sodium deoxycholate, 0.1% sodium dodecylsulphate (SDS), 20 mM TRIS (pH 8.0), 1 mM EDTA (Fisher Scientific), 1 mM ethylene glycol tetraacetate, 140 mM NaCl, and 1 mM phenylmethylsulfonylfluoride (PMSF), heated to 90°C, was added to the culture. Cells were removed with a rubber policeman, and samples were flash-frozen and kept at −196°C until processing. Upon thawing, the protein concentrations were estimated using the Folin-Lowry method (Lowry et al., 1951).
The extracts made with the RIPA lysis mixture were compared to keratin-rich fractions isolated from respiratory airway cells. The latter samples were made by rinsing the dishes twice with isotonic TRIS buffer, followed by 1% TX-100 for 4 min. The cells were harvested with a rubber policeman and the cytoskeleton was pelleted by centrifugation at l, 500 × g at 4°C. Pellets were resuspended in 2% SDS, 10% glycerol (Fisher Scientific), 5% β-mercaptoethanol (Fisher Scientific), and 1 mM PMSF (pH 8.3), boiled until solubilized, and then analyzed as previously described (Heckman and Mayumi, 2022).
2.3 Antibody generation and immunoprecipitation (IP)
The Krt14 and Krt17 spots were excised from two-dimensional gels of keratins, prepared as described above (see Section 2.2). The combined spots were injected into a rabbit by the intradermal route, followed by booster doses, and the antiserum was collected after the last injection. To test antibody specificity, spots representing Krt14 and Krt17 were ground in a mortar and pestle with 300 mL 4% SDS, 150 mM TRIS, and 3 mM dithiothreitol. Serial dilutions of the material were made with TRIS buffer, and 2 mL aliquots were placed on Immobilon membranes. The blots were treated with 1:500 dilution of anti-keratin antibody, followed by 1:250 goat anti-rabbit horseradish peroxidase-tagged antibody (Millipore Corporation, Temecula, CA). They were developed in 2.5 mM 3,3′-diaminobenzidine in TRIS buffer with 0.03% H2O2 (Macron, Center Valley, PA), as described previously (Heckman et al., 2017). The antibody proved to be specific for Krt17 (Supplementary Material S1).
IP was done by adding 70 µL of lysate into an Eppendorf tube containing 400 µL of deionized water and 500 µL 2X concentrate of IP buffer at pH 7.4 [2% TX-100, 300 mM NaCl, 20 mM TRIS, 2 mM EDTA, 2 mM ethylene glycol tetraacetate, 0.4 mM sodium orthovanadate, and 1.0% Nonidet P-40 (BDH Chemicals, Poole, United Kingdom), with PMSF added to a final concentration of 1 mM]. An aliquot of 16 µL anti-keratin in 50% glycerol was added. Mixtures without antibody served as the controls for nonspecific binding. Tubes were mixed by inversion and incubated at 4°C with rotation for an hour. An aliquot of 100 µL 10% protein-A agarose beads (Life Technologies, Gaithersburg, MD) was added to each tube, and the tubes were incubated for an hour. Beads were recovered by centrifuging at 9,000 rpm at 4°C and rinsing twice with IP buffer. Upon recovery, they were suspended in phosphate-buffered saline and sent to Poochon Scientific, Frederick, MD, for mass spectrometry analysis.
2.4 Liquid chromatography and mass spectrometry-mass spectrometry (LC-MS-MS)
Samples were treated by in-solution digestion with trypsin/lys-C protease mix. Proteins were reduced with dithiothreitol at 56°C for 45 min followed by alkylation with iodoacetamide for 30 min at room temperature in the dark. Alkylated proteins were precipitated by 80% acetone followed by trypsin/lysC digestion at 37°C for 16 h. The peptide mixture was then concentrated and desalted using C18 Zip-tip. The peptides were made up in 20 µL of 0.1% formic acid and a 12 µL aliquot was analyzed by 60 min LC-MS-MS run. Mixtures were loaded onto a peptide trap cartridge at a flow rate of 5 μL/min. Trapped peptides were eluted onto a reversed-phase Easy-Spray Column PepMap RSLC, C18, 2 μM, 100A, 75 μm × 250 mm (Thermo Scientific) using a gradient of acetonitrile (3%–36%) in 0.1% formic acid. Peptides were eluted from the column, ionized, and sprayed into the spectrometer, using a Nano Easy-Spray Ion Source (Thermo). Settings were: spray voltage, 1.6 kV, capillary temperature, 275°C. The 15 most intense multiply charged ions (z ≥ 2) were sequentially isolated and fragmented in the octopole collision cell by high energy collisional dissociation (HCD) using normalized HCD collision energy 30 with automatic gain control target 1 × 10⁵ and maximum injection time of 200 ms at 17,500 resolution. The isolation window was set to 1.6. Dynamic exclusion was set to 20 s. Charge state screening was enabled to reject unassigned and 1+ and 7+ or higher charge states ions.
Raw data files obtained from the analysis were processed using Proteome Discoverer 2.4 software (ThermoFisher, San Jose, CA) based on the SEQUEST algorithm. Reports included data on protein assemblies, peptide spectrum matches, and MS1 peak area. MS profile searches were performed against the rat sequence database. Searches of immunoglobulin sequences were performed against the rabbit database. Cysteine carbamidomethylation (+57.021 Da) was set as a fixed modification. Oxidation (M), deamidation (N, Q), acetylation (K), phosphorylation (S, T, Y), HexNAc (S, T, N), and ubiquitin-K (K) (+114.043 Da) were designated as dynamic modifications. Minimum peptide length was five amino acids. Precursor mass and the fragment mass tolerance were set to 15 ppm and 0.05 Da, respectively. A maximum false discovery rate (FDR) of 0.01 was applied.
2.5 Database refinement
To assemble the database, we selected proteins with appropriate subcellular localizations, as determined from the UniProtKB (www.uniprot.org/uniprot) and Human Protein Atlas sites (www.proteinatlas.org). Searches were performed using the accession numbers or the gene name and organism “Rattus norvegicus.” Locations, e.g., cell junctions, endosomes, plasma membrane, vesicles, or cell periphery, which could attach scaffold proteins, were included. The resulting protein lists had 867 (4C9), 669 (2C1), 898 (1,000 W), and 813 (BP3) entries. The threshold required for further analysis was a posterior error probability (PEP) of <0.01. PEP is a measure of the probability that a given spectrum match is incorrect. The proteins were not considered further if the q-value was >0, reflecting overall quality of the discrimination procedure based on the false discovery rate for that sample. Proteins were considered further if the number of unique peptides was ≥2. With these criteria, the number of candidates identified per sample were: 362 (4C9), 244 (2C1), 355 (1,000 W), and 262 (BP3).
2.6 Statistical analysis
Proteins showing at least a two-fold increase in abundance due to capture by IP, relative to samples recovered at the same time without capture, were identified. The Mann-Whitney U test was used, because the data did not meet the normality assumption required for a t-test. Proteins with a total abundance of 9E+06, when summed over all samples, were further evaluated. Cytoskeletal constituents, actin and tubulin, were analyzed together with their associated proteins, as were constituents that could potentially interact with the keratins or other structures, which are specified above. Proteins with an unknown localization were analyzed if they could interact with scaffolds. The remaining proteins, not enriched due to capture by IP, were analyzed separately. The Pearson correlation coefficients were determined to learn whether the proteins were correlated with keratin content. Keratin mass was calculated as a fraction of the abundance of all proteins, i.e. 0.5464 and 0.3468 for two samples without antibody, and 0.3474 (4C9), 0.4903 (2C1), 0.5540 (1,000 W), and 0.6243 (BP3) for the respective lines. If the protein of interest was missing from one sample, the data from that sample were not included in the analysis. Values were determined using Social Science Statistics at https://www.socscistatistics.com/tests/pearson/default2.aspx. For proteins missing from two samples, Pearson correlation coefficients could not be determined. Unless R values are specified in the following text, the coefficient of determination (CD) is presented to enable the proteins to be evaluated in relation to overall keratin content. The experimental design is illustrated in Figure 1.
FIGURE 1

Workflow of the analysis. Three of cell lines were nontumorigenic or moderately tumorigenic. One cell line, BP3, was highly malignant and caused tumors at a dose of 100 cells (Heckman and Olson, 1979; Heckman and Mayumi, 2022).
2.7 Computational methods
The Python Anaconda environment (Anaconda, 2020), a software paradigm for data science and life sciences, was employed to calculate CDs for protein abundance. A data pipeline was developed as a Jupyter Notebook application. This consisted of data clean up, validation, and processing, and the data were stored in a csv file with one column/protein. Data were read into a Pandas DataFrame and, as is customary, missing values were replaced by NaN. Every pairwise comparison was validated to ensure that at least 5 values were non-null values, using the dropna method with a threshold of 2. Consistent with this threshold, 1,008 pairs, out of a total of 19,110 pairs, were excluded from further analysis. Python’s SciPy library was employed in the processing step to perform Pearson correlation. Its method, pearsonr, returns a dictionary object with a key value pair. Key is set to the name of the protein pair and value gives rise to a list that includes the CD. The dictionary object was converted to a DataFrame and the result stored as a csv file.
3 Results
The keratins recovered were typical of those found in basal cells. Krt14 and Krt5 were the main type I and type II keratins in basal cells, respectively, and they made up 67% of the total keratin content in the samples analyzed here. Krt17 and Krt6A together accounted for another 21%. Typical proteins of differentiated epidermal cells, e.g., Krt1-4 and Krt10, were poorly represented. Krt1-4 made up 3% and Krt10 1% of the total. Details are given elsewhere (Olatona, 2023). Two armadillo-repeat proteins, β-catenin and plakoglobin, were found, but plakophilin, desmocollin, and desmoglein, were absent, as was the keratin-binding protein, desmoplakin. This suggested that the junctions of respiratory airway cells had a simpler structure than the desmosomes between epidermal cells.
3.1 Proteins selectively recovered with anti-keratin antibody
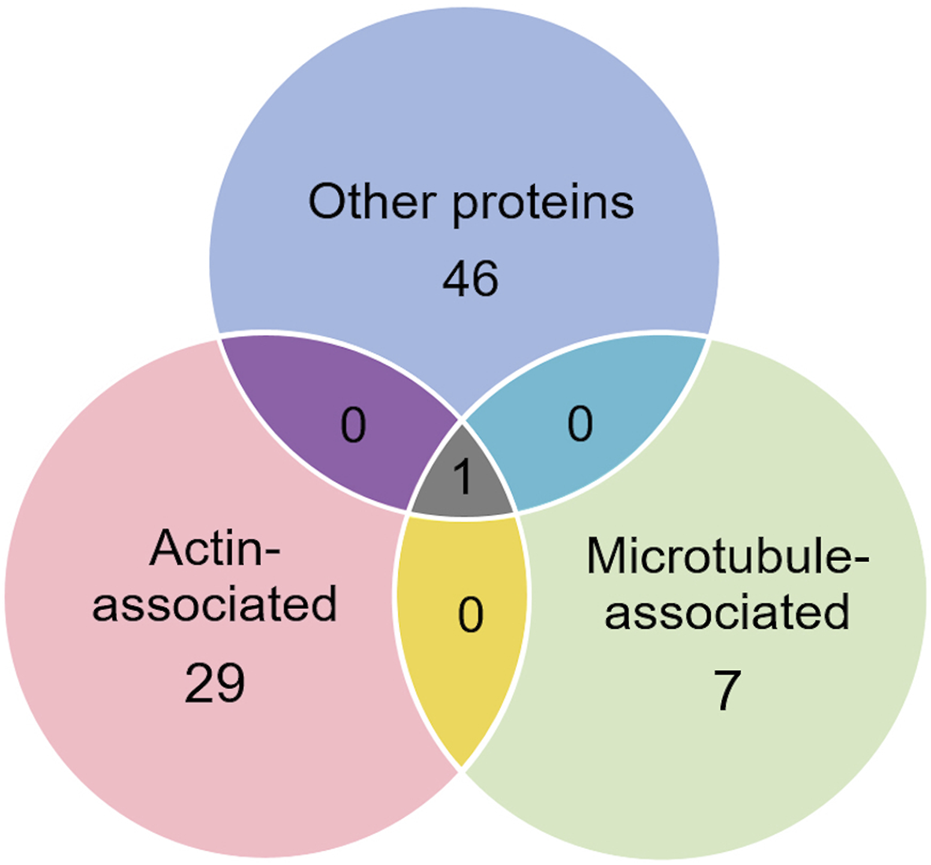
Of the proteins known to interact with one of the main architectural elements, there were 29 associated with actin, including β-actin itself, six with microtubules, including two tubulin subunits, and 38 proteins that bind to keratins, membranes, cell-cell junctions, intracellular vesicles, or cell-substrate adhesions. We identified a total of six cross-linking proteins among this group. These cross-links are highlighted in a Venn diagram (Figure 2) and in Tables 1, 2. Several proteins enriched by IP were found in cytoskeletal pellets from cells treated by TX-100 extraction. Whereas actin-related protein 3, annexin A2, and microtubule-actin cross-linking factor were in Krt14, Krt19, and Krt5 spots, respectively, β-actin was present in all spots analyzed from two-dimensional gels. A microtubule-associated protein, Dynamin-1-like, was found by IP (Table 2) and in the Krt17 spot (see Supplementary Material S6). It showed no correlation with keratin or Krt17 abundance, however. The only keratin-associated protein found within a keratin spot and also enriched by IP after RIPA was glutamine gamma-glutamyl transferase (Tgm1). It has a role in keratin structure as discussed below (see Section 3.1.3). Of the soluble proteins, 26S proteasome regulatory subunit 4 (Psmc1) and T-complex protein 1 subunit delta (Cct4) were found with Krt5 (see Supplementary Material S6).
FIGURE 2

Venn diagram showing different classes of proteins in preparations enriched by IP with anti-keratin antibody, identifying those that cross-link different cytoskeletal elements.
TABLE 1
| Accession | Gene | Protein description | MW | R2 | Modifications |
|---|---|---|---|---|---|
| P60711 | Actb | Actin, cytoplasmic 1 | 41.7 | 0.312 | Met-loss + Acetyl [N-Term] |
| O88656 | Arpc1b | Actin-related protein 2/3 complex subunit 1B | 41.0 | 0.015 | |
| Q5M7U6 | Actr2 | Actin-related protein 2 | 44.7 | 0.016 | |
| Q4V7C7 | Actr3 | Actin-related protein 3 | 47.3 | 0.066 | |
| O35889 | Afdn | Afadin | 207.5 | 0.002 | |
| P07150 | Anxa1 a | Annexin A1 | 22.4 | 0.008 | Met-loss + Acetyl [N-Term] |
| Q07936 | Anxa2a | Annexin A2 | 38.7 | 0.364 | Met-loss + Acetyl [N-Term] |
| Q08163 | Cap1 | Adenylyl cyclase-associated protein 1 | 51.6 | 0.021 | Met-loss + Acetyl [N-Term] |
| Q9Z1P2 | Actn1 | Alpha-actinin-1 | 102.9 | 0.057 | |
| Q6GMN2 | Baiap2 | Brain-specific angiogenesis inhibitor 1-associated protein 2 | 59.1 | 0.067 | |
| Q3KR97 | Baiap2l1 | Brain-specific angiogenesis inhibitor-1-associated protein 2-like protein 1 | 57.4 | 0.578 | |
| O89046 | Coro1b | Coronin-1B | 53.8 | 0.070 | |
| Q5XI32 | Capzb | F-actin-capping protein subunit beta | 30.6 | 0.124 | |
| P31977 | Ezr | Ezrin | 69.3 | 0.001 | |
| P85845 | Fscn1 | Fascin | 54.5 | 0.448 | |
| D3ZHA0 | Flnc | Filamin-C | 290.8 | 0.297 | |
| Q68FP1 | Gsn | Gelsolin | 86 | 0.326 | |
| F1LR10 | Lima1 | LIM domain and actin-binding protein 1 | 83.7 | 0.410 | Phospho [S360; S488] |
| D3ZHV2 | Macf1 a | Microtubule-actin cross-linking factor 1 | 619.2 | 0.376 | |
| Q64119 | Myl6 | Myosin light polypeptide 6 | 17 | 0.091 | Met-loss + Acetyl [N-Term] |
| P18666 | Myl12b | Myosin regulatory light chain 12B | 19.8 | 0.358 | |
| Q62812 | Myh9 | Myosin-9 | 226.2 | 0.004 | Phospho [S1944]; HexNAc [S1678] |
| Q62920 | Pdlim5 | PDZ and LIM domain protein 5 | 63.2 | 0.543 | |
| Q9WVC0 | Septin7 a | Septin-7 | 50.5 | 0.520 | |
| P16086 | Sptan1 | Spectrin alpha chain, non-erythrocytic 1 | 284.5 | 0.788 | |
| Q63610 | Tpm3 | Tropomyosin alpha-3 chain | 29.0 | 0.392 | Met-loss + Acetyl [N-Term] |
| Q05096 | Myo1b | Unconventional myosin-Ib | 131.8 | 0.104 | |
| Q63357 | Myo1d | Unconventional myosin-Id | 116.0 | 0.049 | Met-loss + Acetyl [N-Term]; Phospho [Y118] |
| Q5RKI0 | Wdr1 | WD repeat-containing protein 1/actin-interacting protein 1 (AIP1) | 66.1 | 0.029 |
Actin-associated proteins selectively recovered with antibody.
Legend: Italics represent proteins associated with both actin and microtubules; Bold represents proteins associated with actin and keratin.
TABLE 2
| Accession | Gene name | Protein description | MW | R2 | Modifications |
|---|---|---|---|---|---|
| P38650 | Dync1h1 | Cytoplasmic dynein 1 heavy chain 1 | 531.9 | 0.716 | |
| O35303 | Dnm1l | Dynamin-1-like protein | 83.9 | 0.088 | |
| Q91Y81 | Septin2 | Septin-2 | 41.6 | 0.501 | |
| Q9QZR6 | Septin9 | Septin-9 | 63.8 | 0.656 | |
| P68370/Q6P9V9 | Tuba1a | Tubulin alpha-1A (with 1B) | 50.1 | 0.303 | |
| Q5XIF6 | Tuba4a | Tubulin alpha-4A chain | 49.9 | 0.007 |
Microtubule-associated proteins selectively recovered with antibody.
Legend: Italics represent proteins associated with microtubules and actin.
3.1.1 Actin-associated proteins
One subunit of the actin filament, β-actin, and 28 actin accessories were selectively recovered by IP. The abundance of actin subunit, Actb, was positively correlated with myosin light chain 12B (Myl12b, CD 0.93) and a nuclear protein, lamin B1 (Lmnb1, CD 0.90). Elevated CDs between actin and proteins of Table 1 were limited to Lima1, Anxa2, Macf1, and Tpm3, and ranged from 0.82 to 0.87 (see Supplementary Material S5). As shown below in Table 1, α-spectrin (Sptan1) showed the highest CD with keratin abundance, and its CDs with two other actin-associated proteins, Baiap2l and Anxa2, were also high (Figure 3). A Baiap2 isoform, IRSp53, was known to form a complex with spectrin and initiate actin polymerization in pedestals formed by the virulent pathogen, enterohaemorrhagic Escherichia coli (Ruetz et al., 2012). Whereas the α-spectrin-Baiap2l relationship suggested that a similar complex was formed, no WH2 domain-containing protein was found here. Instead, the complex included Anxa2. A pleiotropic calcium- and anionic phospholipid-binding protein, Anxa2 was the sole protein of Table 1 known to bind to intermediate filaments (Chung et al., 2012; Chang et al., 2018), as highlighted in bold typeface. Although Anxa2 formed a heterotetramer with S100a10 (Bharadwaj et al., 2013), S100a10 was not specifically enriched by IP in these samples and was probably captured together with other proteins of an α-spectrin-Baiap2l-fascin (Fscn1) scaffold (Figure 3, see Section 3.2). In addition to Fscn1, which was correlated with Baiap2l, Macf1 and Lima1 were additional Baiap2l binding partners (Figure 3). The data suggested that Baiap2l and Sptan1 bind Anxa2, and then bind keratins using Anxa2 as an intermediary.
FIGURE 3

PPIN1 resembles the spectrin-IRSp53 pedestal. CDs are shown on the edges, and protein abundance values are given in Supplementary Material S5. Within the core region, the putative interactors’ edges numbered four (Baiap2l) or three (Anxa2) indicating their connectedness in the network. Additional proteins binding Anxa2, but not shown on this diagram, included Myl12b (CD 0.95), Tpm3 (CD 0.93), and Lima1 itself (CD 0.92). The presence of tropomyosin and myosin light chain on the PPIN suggests they stabilize an arrangement of actin filaments.
Because the core of Figure 3 resembled a pedestal-like network based on Baiap2l, it is called PPIN1. Baiap2l had high CDs with the other four proteins in the core, and all the Pearson correlations indicated a positive relationship. Fscn1 was strongly correlated with only two but was weakly correlated with Anxa2. It also had correlations with the actin-associated proteins, Lima1 and Macf1 (Figure 3). The many high, positive values suggested cooperative assembly of actin-associated proteins. Thus, it was surprising to find that these Fscn1 partners were not associated with Fscn1 in the STRING database (Supplementary Material S2).
Evaluation of the STRING database (Szklarczyk et al., 2015) showed no representation of Sptan1 or Anxa2 binding to Baiap2l (see Supplementary Materials S3, S4). Moreover, when we analyzed the keratins in pellets after extraction of the soluble proteins, the only constituent of the five-member PPIN1 still bound to keratin was Anxa2. However, two actin-binding proteins were found, namely, actin-related protein 3 and Macf1 (see Supplementary Material S6). Macf1 is related to three proteins within PPIN1 but more distantly than fascin, Anxa2, or S100a10.
Although the abundance of Krt17 in the samples was low, its values were tested for correlation with other proteins. The pairwise CD for Baiap2-Krt17 was 0.89. Baiap2 was an alternative IRSp53 isoform, which showed no correlation with total keratins (Table 1). That it may selectively bind Krt17 was supported by the observation of correlations between Baiap2 and known keratin-binding proteins, 14-3-3 beta/alpha (Ywhab, 0.90) and 14-3-3 eta (Ywhah, 0.88). Only 14-3-3 beta/alpha was correlated with Krt17 (CD 0.86). However, Krt17 may use weak relationships with adapters, including 14-3-3 alpha/beta and Anxa5 (CD 0.85), to bind to other cytoskeletal structures.
Several actin-associated proteins recovered by IP were known to process monomers or mediate filament disassembly or severing. Cap1 recharges actin monomers with ATP and facilitates their subsequent binding to profilin (Bertling et al., 2004; Colin et al., 2023). Wdr1 and Coro1b cooperate with actin depolymerization factors in disassembly (Tang et al., 2020). Gelsolin severs filaments and caps the minus ends. Another actin accessory, Capzb, functions as a barbed-end cap. A survey of interactions among these proteins suggested that Wdr1 and Cap1 (CD 0.95) had the greatest pairwise interaction.
3.1.2 Microtubule-associated proteins
Among the candidates evaluated, six were associated with microtubules, including α-tubulin subunits, 1 and 4. As in the case of actin subunits, the tubulin subunits had low CDs with other proteins of Table 2 (see Supplementary Material S5). Likewise, the α-tubulins showed no CDs with β-tubulin subunits above 0.69, suggesting that the whole microtubule was partly disassembled into subunits. Cytoplasmic dynein 1 heavy chain (Dync1h1) and septin-9 showed weak CDs with total keratin content (Table 2). The Pearson correlation coefficients, R, had opposite signs, however. This suggested that septin-9 was concentrated in keratin-rich samples, while Dync1h was depleted. Of the septins, septin-10 was present in too few samples to be analyzed, but septins −2 and −7 had weak interactions with overall keratin content (Tables 1–3). Filament formation by septins was well-known (Cavini et al., 2021). Our analysis suggested that this association was maintained in RIPA lysates, as the content of each was correlated with that of the other septins (R of 0.69–0.96). Thus, it was probable that septins work cooperatively to interact with other proteins.
TABLE 3
| Accession | Gene | Protein description | MW | R2 | Modifications |
|---|---|---|---|---|---|
| P35213 | Ywhab | 14-3-3 protein beta/alpha | 28.2 | 0.015 | |
| P62260 | Ywhae | 14-3-3 protein epsilon | 29.2 | 0.081 | |
| P68511 | Ywhah | 14-3-3 protein eta | 28.2 | 0.001 | Met-loss + Acetyl [N-Term] |
| P61983 | Ywhag | 14-3-3 protein gamma | 41.9 | 0.001 | |
| P04764 | Eno1 | Alpha-enolase | 47.1 | 0.396 | |
| P14669 | Anxa3 | Annexin A3 | 49.6 | 0.016 | |
| P55260 | Anxa4 | Annexin A4 | 35.8 | 0.088 | |
| P14668 | Anxa5 | Annexin A5 | 35.7 | 0.028 | |
| Q9R1T1 | Banf1 | Barrier-to-autointegration factor | 10 | 0.316 | |
| Q9WTT7 | Bzw2 | Basic leucine zipper and W2 domain-containing protein 2 (with Bzw1) | 48 | 0.002 | |
| Q9WU82 | Ctnnb1 | Catenin beta-1 | 85.4 | 0.209 | |
| Q8CFN2 | Cdc42 | Cell division control protein 42 homolog | 21.2 | 0.141 | |
| Q63532 | Sprr1a | Cornifin-A | 16.7 | 0.842 | |
| Q5M9G3 | Caprin1 | Cytoplasmic activation/proliferation-associated protein-1 | 78.1 | 0.580 | |
| Q7TQ20 | Dnajc2 | DnaJ homolog subfamily C member 2 | 71.7 | 0.577 | |
| Q62940 | Nedd4 | E3 ubiquitin-protein ligase NEDD4 | 102.3 | 0.005 | |
| Q641Z6 | Ehd1 | EH domain-containing protein 1 (with Ehd2) | 60.6 | 0.000 | |
| P68101 | Eif2s1 | Eukaryotic translation initiation factor 2 subunit 1 | 36.1 | 0.044 | |
| Q4G061 | Eif3b | Eukaryotic translation initiation factor 3 subunit B | 90.9 | 0.451 | Acetyl [N-Term] |
| Q6AYK8 | Eif3d | Eukaryotic translation initiation factor 3 subunit D | 63.9 | 0.154 | |
| Q641X8 | Eif3e | Eukaryotic translation initiation factor 3 subunit E | 52.2 | 0.019 | Met-loss + Acetyl [N-Term] |
| Q5RK09 | Eif3g | Eukaryotic translation initiation factor 3 subunit G | 35.6 | 0.000 | |
| B2GUV7 | Eif5b | Eukaryotic translation initiation factor 5B | 137.6 | 0.012 | |
| P08699 | Lgals3 | Galectin-3 | 27.2 | 0.072 | |
| P04897 | Gnai2 | Guanine nucleotide-binding protein G(i) subunit alpha-2 | 40.5 | 0.109 | |
| P06761 | Hspa5 | Endoplasmic reticulum chaperone BiP | 72.3 | 0.101 | |
| P42930 | Hspb1 | Heat shock protein beta-1 | 22.9 | 0.449 | |
| P82995 | Hsp90aa1 | Heat shock protein HSP 90-alpha | 84.8 | 0.385 | Phospho [S231] |
| P34058 | Hsp90ab1 | Heat shock protein HSP 90-beta | 83.2 | 0.355 | Phospho [S255] |
| Q64632 | Itgb4 | Integrin beta-4 | 200.5 | 0.390 | |
| Q7TQM5 | Kprp | Keratinocyte proline-rich protein | 76.3 | 0.347 | |
| P19804 | Nme2 | Nucleoside diphosphate kinase B | 17.3 | 0.070 | |
| P23606 | Tgm1 | Protein-glutamine gamma-glutamyltransferase K | 90.7 | 0.398 | |
| B4F7E8 | Niban2 | Protein Niban 2 | 84.7 | 0.081 | |
| P50399 | Gdi2 | Rab GDP dissociation inhibitor beta | 50.5 | 0.351 | |
| Q6RUV5 | Rac1 | Ras-related C3 botulinum toxin substrate 1 | 21.4 | 0.028 | |
| B3GNI6 | Septin11 | Septin-11 | 49.7 | 0.268 | Met-loss + Acetyl [N-Term] |
| Q2LAP6 | Tes | Testin | 47.6 | 0.011 |
Proteins associated with keratins or other structures selectively recovered with antibody.
Work by the Spiliotis group showed that, unlike septin-2, -6, and -7, septin-9 could regulate lysosome trafficking by affecting dynein-mediated movement. When bound to lysosomes, it recruited dynein to the membranes of these organelles (Kesisova et al., 2021), and they moved in the retrograde direction. When −2, −6, and −7 were the only septins present in experiments in vitro, they inhibited dynein and kinesin movement on microtubules (Suber et al., 2023). The cells of the current research lacked septin-6, but −11 is in the same subclass and is considered interchangeable with septin-6. While proteins generally showed little correlation with the abundance of α-tubulin subunits, septin-2 correlation with β-tubulin 2a (Tubb2a) was negative (R = −0.81). This was in marked contrast to the relationship of septin-11 with Tubb2a, where the correlation was high and positive (see Section 3.1.3). The remaining septins, i.e., −7 and −9, were uncorrelated with any tubulin subunit (CDs <0.15). The sign of correlation coefficients, R, between Dync1h and all septins was negative, suggesting that septins on the microtubule inhibited Dync1h from attaching to it (Figure 4A). This was consistent with results suggesting that septin-9 impedes dynein motor movement [see for review (Spiliotis and Kesisova, 2021)]. There were only a few proteins that had noticeable correlations with Dync1h (see Section 3.2).
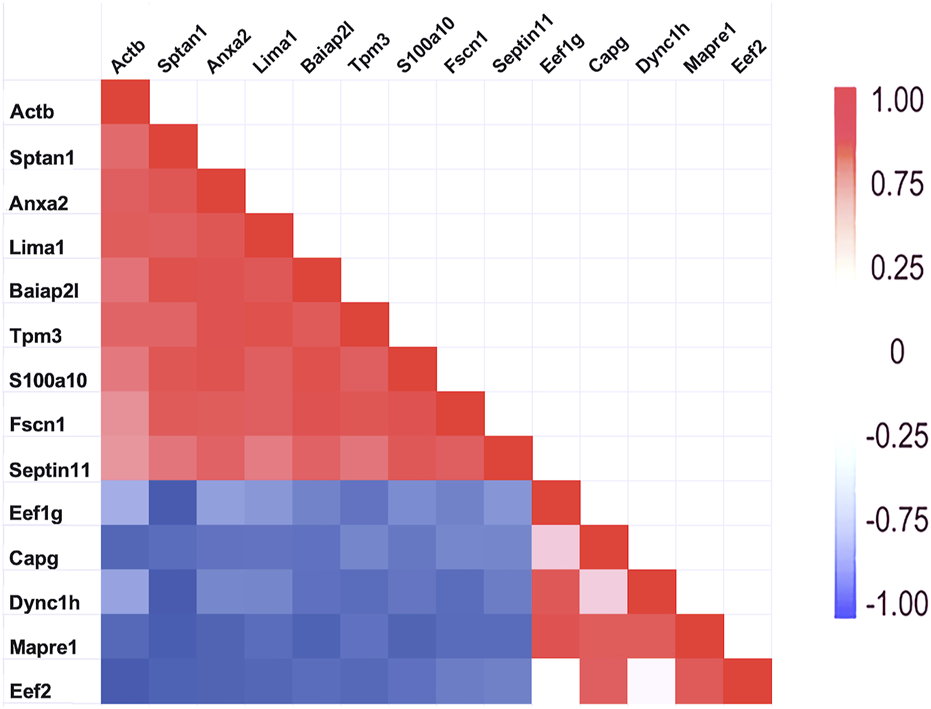
FIGURE 4

Septins cooperate with PPIN1 while avoiding Dync1h. Except for the interactions with PPIN1, correlations between septins and other proteins are mainly negative in sign, so Pearson coefficients (R) are shown. (A) Septins are correlated with PPIN1 core constituents, represented here solely by S100a10. Septin-11 binds β-tubulin 2a (Tubb2a), as indicated at top. Dync1h is excluded from sites that have septins. (B) PPIN2 is defined by a negative relationship between Dync1h and all PPIN1 proteins, represented by Sptan1 and S100A10.
The negative correlation of septin-2 with Tubb2a suggested that it may not bind to microtubules. As a part of the whole filament, however, it may affect septin turnover on the microtubule by reducing the overall binding energy. Septins-2 and septin-9 had positive coefficients, R, with the PPIN1 of Figure 3, as discussed below (see Section 3.2). Although uncorrelated with any tubulin subunit, Dync1h was negatively correlated with all proteins of the PPIN1 pedestal, represented by S100a10 in Figure 4B. Very few proteins were potential interactors with Dync1h. As its putative binding partners were not selectively recovered with anti-keratin antibody, the results are discussed below (see Section 3.2).
3.1.3 Potential interactors with keratins, membranes, or adhesive specializations
Among the additional proteins that could play a structural role, e.g., components of plasma membrane, vesicles, cell-cell junctions, cell-substrate adhesive contacts, or phase-separated condensates (Table 3), catenin-β1 and 14-3-3 were known to bind keratins. Their abundance was unrelated to total keratin content in the current samples, however. Cornifin A (Sprr1a) had the highest CD with keratin abundance. In keratinocytes, cornifin is cross-linked to many other proteins by transglutaminase type I (Steinert et al., 1998). Tgm1, with the same cross-linking function, was found (Table 3). As these crosslinks were thought to reflect the extent of terminal differentiation in the cultures, cornifin was not considered relevant to the search for cross-linkers. Tgm1 was found in a Krt19 spot on two-dimensional gels and was the only putative scaffold protein of Table 3 that was both enriched by IP and found in cytoskeletal pellets. Although Anxa5 showed a CD of 0.85 with Krt17, most CDs with keratins were low. A weak value was observed for RNA-binding protein, caprin1. This protein forms phase-separated membraneless condensates in stressed cells and was found to regulate the expression of Wilms’ tumor 1-associating protein (Gao et al., 2023). Although the keratin-binding subunit of integrin, b4, was recovered, it was uncorrelated with either total keratin (Table 3) or Krt17 content. Niban2, another protein that varied in abundance with Krt17 (CD 0.88), was not known to affect the cytoskeleton, but it showed CDs of 0.87 and 0.80 with Anxa5 and Baiap2 (Table 3), which were also correlated with Krt17.
Septin-11 abundance showed little correlation with keratin or Krt17 abundance, but as a part of the septin filament, it was correlated with both the PPIN1 and the microtubule. Its CD with Tubb2a, 0.98, was the highest observed for any protein with a cytoskeletal subunit, which suggested constitutive binding. Septin-11 was also positively correlated with PPIN1 proteins (α-spectrin, Anxa2, Baiap2l, S100a10, and fascin), as were septins −2 and −9. These constituents did not appear to recruit septin-7 (see Supplementary Material S5), nor did Tubb2a. Whereas septin-2 was biased against microtubule binding, as indicated above, septin-11 was biased in favor of binding. This suggested the possibility of its forming filaments on both the PPIN1 and microtubule. Thus, switching a protein to bind to actin or microtubules may rely on recruiting septin-11. Whereas this could depend on septin-11 posttranslational modifications, only methionine loss and N-terminal acetylation [Met-loss + Acetyl (N-Term)] were found (Table 3).
3.1.4 Proteins without scaffold interactions selectively recovered with antibody
Some miscellaneous proteins were analyzed. The rationale for this was that a protein with unknown localization may interact with a cross-linker or scaffold or with a keratin and thereby affect dynamic reorganization of architecture. None of these proteins showed a high correlation with keratin abundance (Table 4), however. When we computed their CDs with Krt17 abundance, adenosylhomocysteinase (Ahcy) was correlated (0.92), although no relationship between Ahcy and any cytoskeletal protein was known.
TABLE 4
| Accession | Gene | Protein description | MW | R2 | Modifications |
|---|---|---|---|---|---|
| P62193 | Psmc1 | 26S proteasome regulatory subunit 4 | 49.2 | 0.362 | |
| Q63347 | Psmc2 | 26S proteasome regulatory subunit 7 | 48.5 | 0.045 | |
| P62198 | Psmc5 | 26S proteasome regulatory subunit 8 | 45.6 | 0.847 | |
| P63326 | Rps10 | 40S ribosomal protein S10 | 18.9 | 0.069 | |
| P38983 | Rpsa | 40S ribosomal protein SA | 32.8 | 0.001 | |
| P39032 | Rpl36 | 60S ribosomal protein L36 | 105.4 | 0.016 | |
| P85968 | Pgd | 6-phosphogluconate dehydrogenase, decarboxylating | 53.2 | 0.156 | |
| Q9JMI1 | Aacs | Acetoacetyl-CoA synthetase | 87.6 | 0.175 | |
| P10760 | Ahcy | Adenosylhomocysteinase | 47.5 | 0.065 | |
| P51635 | Akr1a1 | Aldo-keto reductase family 1 member A1 | 36.5 | 0.040 | |
| P15178 | Dars1 | Aspartate--tRNA ligase, cytoplasmic | 57.1 | 0.129 | |
| P16638 | Acly | ATP-citrate synthase | 120.6 | 0.723 | |
| P22734 | Comt | Catechol O-methyltransferase | 29.6 | 0.025 | |
| P18395 | Csde1 | Cold shock domain-containing protein E1 | 88.8 | 0.000 | |
| O08651 | Phgdh | D-3-phosphoglycerate dehydrogenase | 56.5 | 0.351 | Met-loss + Acetyl [N-Term] |
| P55053 | Fabp5 | Fatty acid-binding protein 5 | 15.1 | 0.009 | |
| P05370 | G6pdx | Glucose-6-phosphate 1-dehydrogenase | 59.3 | 0.526 | Met-loss + Acetyl [N-Term] |
| Q66H61 | Qars1 | Glutamine--tRNA ligase | 87.6 | 0.364 | |
| Q9ESH6 | Glrx | Glutaredoxin-1 | 11.9 | 0.286 | |
| E9PU28 | Impdh2 | Inosine-5′-monophosphate dehydrogenase 2 | 55.8 | 0.015 | |
| P41562 | Idh1 | Isocitrate dehydrogenase [NADP] cytoplasmic | 46.7 | 0.041 | |
| P04642 | Ldha | L-lactate dehydrogenase A chain | 36.4 | 0.005 | |
| Q62667 | Mvp | Major vault protein | 95.7 | 0.035 | |
| Q9QVC8 | Fkbp4 | Peptidyl-prolyl cis-trans isomerase FKBP4 | 51.4 | 0.367 | |
| P35704 | Prdx2 | Peroxiredoxin-2 | 21.8 | 0.051 | |
| Q9EPH8 | Pabpc1 | Polyadenylate-binding protein 1 | 70.7 | 0.397 | |
| P34064 | Psma5 | Proteasome subunit alpha type-5 | 26.4 | 0.521 | |
| P60892 | Prps1 | Ribose-phosphate pyrophosphokinase 1 | 34.8 | 0.298 | |
| Q9QZK5 | Htra1 | Serine protease HTRA1 | 51.3 | 0.329 | |
| P63088 | Ppp1cc | Serine/threonine-protein phosphatase PP1-gamma catalytic subunit (with Ppp1cb) | 37.0 | 0.493 | |
| Q5XIM9 | Cct2 | T-complex protein 1 subunit beta | 57.4 | 0.183 | Met-loss + Acetyl [N-Term] |
| Q7TPB1 | Cct4 | T-complex protein 1 subunit delta | 58.1 | 0.004 | |
| Q920J4 | Txnl1 | Thioredoxin-like protein 1 | 32.2 | 0.151 | |
| Q9Z1A6 | Hdlbp | Vigilin | 141.5 | 0.002 | Met-loss + Acetyl [N-Term] |
| Q62764 | Ybx3 | Y-box-binding protein 3 | 38.8 | 0.207 | Met-loss + Acetyl [N-Term] |
| Q8K3Y6 | Zc3hav1 | Zinc finger CCCH-type antiviral protein 1 | 86.7 | 0.042 |
Proteins without cytoskeletal associations selectively recovered with antibody.
3.2 Proteins not enriched by IP with anti-keratin antibody
In addition to the above proteins, there were many proteins not enriched by IP that could be interacting with the cytoskeleton (Tables 5–7). The Venn diagram (Figure 5) summarizes the classes associated with different structures. Plectin was among the proteins that remained in the cytoskeletal pellet after cytoplasmic proteins were removed with TX-100. Plectin was associated with Krt5 (see Supplementary Material S6). In contrast, plectin in lysates prepared by RIPA had little correlation with overall keratin content. However, it appeared to interact with tropomyosin 4, plastin-3, and β-tubulin 2a, as judged by R values of 0.89–0.93. Other proteins that were found in cytoskeletal pellets included a tubulin subunit, Tubb5, and kinesin-1 heavy chain (Kif5b). Tubb5 was associated with a spot containing Krt14 and Krt6a, and Kif5b was associated only with the Krt14 spot. A second microtubule subunit in pellets, Tuba1c, was not well-represented in samples made by RIPA lysis. Several proteins that formed intermediate filaments or were associated with them were recovered in two-dimensional gels from cytoskeletal pellets. The scaffold, 14-3-3 protein zeta/delta, was associated with Krt19 and lamina-associated polypeptide 2 (Tmpo) with Krt5. A second lamin, prelamin A/C, was found in most of the purified keratin spots. The junction protein, plakoglobin (γ-catenin), was tightly bound to Krt5 and Krt19 (see Supplementary Material S6).
TABLE 5
| Accession | Gene name | Protein description | MW | R2 | Modifications |
|---|---|---|---|---|---|
| P63259 | Actg1 | Actin, cytoplasmic 2 | 41.8 | 0.008 | Met-loss + Acetyl [N-Term] |
| Q9QXQ0 | Actn4 | Alpha-actinin 4 | 104.8 | 0.166 | |
| Q4FZU6 | Anxa8 | Annexin A8 | 36.7 | 0.072 | |
| P18484 | Ap2a2 | AP-2 complex subunit alpha-2 | 104.0 | 0.023 | |
| P37397 | Cnn3 | Calponin-3 | 36.4 | 0.393 | Met-loss + Acetyl [N-Term] |
| B0BNA5 | Cotl1 | Coactosin-like protein | 15.9 | 0.054 | |
| P11442 | Cltc | Clathrin heavy chain 1 | 191.5 | 0.047 | Met-loss + Acetyl [N-Term] |
| P45592 | Cfl1 | Cofilin-1 | 18.5 | 0.149 | Met-loss + Acetyl [N-Term]; Phospho [S3] |
| Q7M0E3 | Dstn | Destrin | 18.5 | 0.207 | Met-loss + Acetyl [N-Term]; Phospho [S3] |
| Q4FZY0 | Efhd2 | EF-hand domain-containing protein D2 | 26.7 | 0.015 | |
| P62630 | Eef1a1 | Elongation factor 1-alpha 1 | 50.1 | 0.031 | Acetyl [K408] |
| Q68FR9 | Eef1d | Elongation factor 1-delta | 31.3 | 0.006 | Met-loss + Acetyl [N-Term] Phospho [S133] |
| Q68FR6 | Eef1g | Elongation factor 1-gamma | 50.0 | 0.762 | |
| P05197 | Eef2 | Elongation factor 2 | 95.2 | 0.361 | Met-loss [N-Term] |
| Q6AYC4 | Capg | Macrophage-capping protein | 38.8 | 0.620 | Acetyl [N-Term] |
| O35763 | Msn | Moesin | 67.7 | 0.485 | Met-loss + Acetyl [N-Term] |
| Q9JLT0 | Myh10 | Myosin 10 | 228.8 | 0.050 | |
| P55161 | Nckap1 | Nck-associated protein 1 | 128.8 | 0.040 | |
| Q63598 | Pls3 | Plastin- 3 | 70.6 | 0.061 | Acetyl [N-Term] |
| P30427 | Plec | Plectin* | 533.2 | 0.091 | Met-loss [N-Term]; Phospho [S4388; S4389; S4392; Y4396; S4409] |
| P62963 | Pfn1 | Profilin-1 | 14.9 | 0.128 | Met-loss + Acetyl [N-Term] Phospho [Y7] |
| P05943 | S100a10 | Protein S100-A10 | 11.1 | 0.456 | Met-loss [N-Term] |
| P05964 | S100a6 | Protein S100-A6 | 10.0 | 0.085 | Met-loss + Acetyl [N-Term] |
| Q9QWN8 | Sptbn2 | Spectrin beta chain, non-erythrocytic 2 | 270.9 | 0.022 | |
| Q9Z327 | Synpo | Synaptopodin | 99.9 | 0.319 | |
| P61589 | Rhoa | Transforming protein RhoA | 21.8 | 0.050 | |
| Q5XFX0 | Tagln2 | Transgelin-2 | 22.4 | 0.002 | |
| P09495 | Tpm4 | Tropomyosin alpha-4 chain | 28.5 | 0.260 | Met-loss + Acetyl [N-Term] |
| Q5RJR2 | Twf1 | Twinfilin-1 | 40.1 | 0.001 | Met-loss + Acetyl [N-Term] |
Actin subunit and actin-associated proteins not enriched in the IP preparations.
Legend: Bold Italics represent proteins associated with actin, microtubules, and keratin.
TABLE 6
| Accession | Gene | Protein description | MW | R2 | Modifications |
|---|---|---|---|---|---|
| P39052 | Dnm2 | Dynamin-2 (with Dmn1) | 98.2 | 0.143 | |
| Q04931 | Ssrp1 | FACT complex subunit SSRP1 | 80.9 | 0.529 | Met-loss + Acetyl [N-Term] |
| Q2PQA9 | Kif5b | Kinesin-1 heavy chain | 109.5 | 0.003 | Met-loss + Acetyl [N-Term] |
| Q66HR2 | Mapre1 | Microtubule-associated protein RP/EB family member 1 | 30.0 | 0.734 | Met-loss + Acetyl [N-Term] |
| Q6JE36 | Ndrg1 | Protein NDRG1 | 42.9 | 0.004 | |
| P13084 | Npm1 | Nucleophosmin | 32.5 | 0.087 | Acetyl [N-Term]; Phospho [S125] |
| P85108 | Tubb2a | Tubulin beta-2A chain | 49.9 | 0.036 | |
| Q6P9T8 | Tubb4b | Tubulin beta-4B chain | 49.8 | 0.062 | |
| P69897 | Tubb5 | Tubulin beta-5 chain | 49.6 | 0.205 |
Microtubule subunits and microtubule-associated proteins not enriched by IP preparation.
TABLE 7
| Accession | Gene | Protein description | MW | R2 | Modifications |
|---|---|---|---|---|---|
| P63102 | Ywhaz | 14-3-3 protein zeta/delta | 27.8 | 0.480 | |
| P61206 | Arf3 | ADP-ribosylation factor 3 | 20.6 | 0.106 | |
| P61751 | Arf4 | ADP-ribosylation factor 4 | 20.4 | 0.091 | |
| P84083 | Arf5 | ADP-ribosylation factor 5 | 20.5 | 0.060 | |
| Q32PX2 | Aimp2 | Aminoacyl tRNA synthase complex-interacting multifunctional protein 2 | 35.4 | 0.008 | |
| P35565 | Canx | Calnexin | 67.2 | 0.001 | |
| Q07009 | Capn2 | Calpain-2 catalytic subunit | 79.9 | 0.234 | |
| P18418 | Calr | Calreticulin | 48.0 | 0.340 | |
| Q9Z0W7 | Clic4 | Chloride intracellular channel protein 4 | 28.6 | 0.001 | |
| E9PSL7 | Cit | Citron rho-interacting kinase | 235.2 | 0.040 | Acetyl [K1295] |
| P23514 | Copb1 | Coatomer subunit beta | 106.9 | 0.026 | |
| O35142 | Copb2 | Coatomer subunit beta' | 102.5 | 0.074 | |
| Q66H80 | Arcn1 | Coatomer subunit delta | 57.2 | 0.041 | Met-loss [N-Term] |
| P97536 | Cand1 | Cullin-associated NEDD8-dissociated protein 1 | 136.3 | 0.236 | Met-loss + Acetyl [N-Term] |
| O35824 | Dnaja2 | DnaJ homolog subfamily A member 2 | 45.7 | 0.024 | |
| F1LP64 | Trip12 | E3 ubiquitin-protein ligase TRIP12 | 223.8 | 0.015 | |
| Q80U96 | Xpo1 | Exportin-1 | 123.0 | 0.039 | |
| P08753 | Gnai3i | Guanine nucleotide-binding protein G(i) subunit alpha-3 | 40.5 | 0.029 | |
| P54311 | Gnb1 | Guanine nucleotide-binding protein G(I)/G(S)/G(T) subunit beta-1 | 37.4 | 0.126 | Met-loss + Acetyl [N-Term] |
| P54313 | Gnb2 | Guanine nucleotide-binding protein G(I)/G(S)/G(T) subunit beta-2 | 37.3 | 0.045 | Met-loss + Acetyl [N-Term] |
| Q811S9 | Gnl3 | Guanine nucleotide-binding protein-like 3 | 60.6 | 0.367 | |
| O88600 | Hspa4 | Heat shock 70 kDa protein | 94.0 | 0.296 | |
| P63018 | Hspa8 | Heat shock cognate 71 kDa protein | 70.8 | 0.026 | |
| Q66HA8 | Hsph1 | Heat shock protein 105 kDa | 96.4 | 0.000 | |
| Q6P0K8 | Jup | Junction plakoglobin | 81.7 | 0.818 | Acetyl [K408] |
| Q62733 | Tmpo | Lamina-associated polypeptide 2, isoform beta | 50.2 | 0.589 | Met-loss [N-Term] |
| P70615 | Lmnb1 | Lamin-B1 | 66.6 | 0.388 | Met-loss + Acetyl [N-Term] |
| P43244 | Matr3 | Matrin-3 | 95.2 | 0.027 | Met-loss [N-Term] |
| P21708 | Mapk3 | Mitogen-activated protein kinase 3 | 43.1 | 0.234 | Met-loss + Acetyl [N-Term] |
| P21263 | Nes | Nestin | 208.7 | 0.066 | |
| P48679 | Lmna | Prelamin-A/C | 74.3 | 0.333 | Acetyl [N-Term] |
| Q9QZA2 | Pdcd6ip | Programmed cell death 6-interacting protein | 96.6 | 0.078 | |
| Q4QQR9 | Memo1 | Protein MEMO1 | 33.7 | 0.287 | |
| P61621 | Sec61a1 | Protein transport protein Sec61 subunit alpha isoform 1 | 52.2 | 0.025 | |
| P63245 | Rack1 | Receptor of activated protein C kinase 1 | 35.1 | 0.167 | Met-loss + Acetyl [N-Term] |
| Q6NYB7 | Rab1A | Ras-related protein Rab-1A | 22.7 | 0.037 | |
| Q9WVB1 | Rab6a | Ras-related protein Rab-6A | 23.6 | 0.001 | |
| P35281 | Rab10 | Ras-related protein Rab-10 | 22.8 | 0.005 | |
| O08679 | Mark2 | Serine/threonine-protein kinase MARK2 | 80.8 | 0.732 | |
| P06685 | Atp1a1 | Sodium/potassium-transporting ATPase subunit alpha-1 | 113.0 | 0.091 | |
| Q63377 | Atp1b3 | Sodium/potassium-transporting ATPase subunit beta-3 | 31.8 | 0.132 | |
| O08815 | Slk | STE20-like serine/threonine-protein kinase | 137.8 | 0.060 | |
| P28480 | Tcp1 | T-complex protein 1 subunit alpha | 60.3 | 0.901 | Acetyl [N-Term] |
| Q68FQ0 | Cct5 | T-complex protein 1 subunit epsilon | 59.5 | 0.117 | |
| Q6P502 | Cct3 | T-complex protein 1 subunit gamma | 60.6 | 0.061 | |
| Q9Z269 | Vapb | Vesicle-associated membrane protein-associated protein B | 26.9 | 0.487 |
Other potential interactors with cytoskeleton that are not enriched in IP preparations.
FIGURE 5
Venn diagram showing different classes of proteins that were not enriched by IP with anti-keratin. Only one, plectin, was already known to cross-link different cytoskeletal elements.
The actin isoform, γ-actin, was found among the proteins not enriched by IP. It lacked any correlation with keratin content but had a CD of 0.92 with protein Ndrg1. This actin has several different functions, some of which are microtubule-associated. Of the actin-associated proteins in Table 5, the highest CD with keratin content was 0.76 for eukaryotic elongation factor 1-gamma (Eef1g). Although Eef1g had a low CD with Krt17 abundance (CD 0.37), it was still the highest value for any protein of Table 5. This surprisingly suggested a link between γ-actin and keratin structures. As two α-spectrin and two β-spectrin (Sptbn2) molecules form a tetramer, we also sought binding partners of Sptbn2. It had high CDs with RhoA (0.95) and an actin-depolymerizing factor, twinfilin (0.81).
Among the proteins associated with the cytoskeleton but not enriched by IP, we found three tubulin subunits and a microtubule-stabilizing protein, dynamin1/2 (Table 6). The latter had high CDs with heat shock protein a5 (Hspa5, 0.99), annexin A4 (Anxa4, 0.96), and actin-associated proteins, Cap1 and Wdr1 (CDs 0.92 and 0.89 respectively). This suggested an interaction with the machinery for actin severing and recycling (Ono, 2013). Among proteins of this group, there was a motor protein, Kif5b, which is implicated in anterograde transport of vimentin and keratin filaments (Robert et al., 2019), and a plus-end binding (EB) protein EB1 (Mapre1). Mapre1 showed a modest CD with overall keratin abundance (Table 6), but only 0.33 with Krt17, consistent with its not being enriched by IP.
As mentioned above, a few proteins interacted positively with dynein heavy chain (Dync1h) but were negatively correlated with PPIN1 proteins. Those interacting with Dync1h included a eukaryotic elongation factor, Eef1g (R = 0.95), and the microtubule EB protein, Mapre1 (R = 0.93). Other proteins, namely, eukaryotic elongation factor, Eef2 (R = 0.45), and macrophage-capping protein, Capg (R = 0.57) were included in the network because they had positive Pearson correlations with Mapre1 and negative correlation coefficients with all members of the PPIN1 complex (Figure 6). One example is Eef1g, which had a high negative relationship to α-spectrin abundance (R = −0.98). Another is a subunit of the heterooligomeric T-complex (Tcp-1), a complex involved in folding cytosolic proteins (Jin et al., 2019). Tcp1 showed the highest CD with overall keratin abundance of any protein recovered (Table 7). While Tcp-1 had a high correlation with dynein heavy chain (R = 0.92), its abundance was negatively correlated with the comparable values for α-spectrin (R = −0.97) and other PPIN1 proteins. There are very few members of the PPIN2 cluster, but for every member analyzed, its correlation values with PPIN1 was likely to be negative (Supplementary Material S5).
FIGURE 6
Relationship of PPIN1 to PPIN2. The heatmap represents high Pearson correlation (R) values in red and low values in blue. Dynein C heavy chain interactions with other proteins appears to depend on two binding partners. One is eukaryotic elongation factor 1 g. It is highly correlated with end-binding protein, Mapre1, as well as with Dync1h. Another eukaryotic factor, Eef2, and macrophage-capping protein (Capg) are part of PPIN2 because of strong interactions with each other and with Mapre1. As shown by the negative correlations (blue), PPIN2 excludes PPIN1 proteins. Eef2 is also negatively corelated with Actb (see Section 3.1.1).
Jup, the junction plakoglobin, had a modest CD with keratin abundance (Table 7). Jup was one of only two armadillo repeat proteins recovered from most of the samples. The armadillo repeat, associated with the load-bearing function of intercellular junctions, was characteristic of two proteins detected at levels too low to be included in the analysis, namely, Diaphanous and β-catenin-like protein. A heat shock 70 protein was associated with keratins in intestinal epithelial cells (Mashukova et al., 2016). None of the heat shock proteins found in the current work were correlated with keratin or Krt17 content.
4 Discussion
There is a widespread consensus that cancer cells have an aberrant organization of their cytoskeletal and adhesive networks (Alibert et al., 2017; Sheetz, 2019; Xin et al., 2023). The defect may have its source in a functional node that undermines the integration of cytoskeletal networks. Although the roles of these structural elements cannot easily be deconstructed, it is possible that identifying the proteins essential for structural integration will help to address the overarching problem. To this end, we developed a database of potential interactors with cytoskeletal proteins, using an anti-Krt17 antibody in an IP protocol. Krt17 is expressed in embryonic epidermis, is inducible during wound repair, and forms heterodimers with the type II keratins, Krt6A, Krt5, and Krt8 (McGowan and Coulombe, 1998). Krt17 is not abundant in the cells studied, as Krt14 is the main acidic (type I) keratin. Strong denaturants are needed to dissociate keratin fibrils, so it was assumed that whole fibrils were present. This was supported by the finding that the main type II proteins, Krt5 and 6A, were in equal proportion to type I in the samples. As actin and tubulin subunits were also recovered, all the cytoskeletal networks were represented. The use of strong denaturants would cause the dissociation of accessory proteins from the cytoskeleton, so the PPIN networks were built up by analyzing protein-protein interactions.
The current research employed a novel approach, which combined biochemical and statistical methods to identify protein interaction networks. The rationale was that, if two proteins are persistently bound to each other, their abundances will show a constant ratio in all samples subjected to LC-MS-MS. The validity of the approach was supported by the observation of a high correlation between cornifin-A and total keratin abundance. As the main cytoskeletal proteins in the basal cells, the keratins are cross-linked to cornifin-A by transglutaminase, accounting for the correlation. The correlations of most recovered proteins with keratin content were modest, suggesting that most of these protein-protein interactions are easily dissociated. The chaperonin subunit, Tcp1, had a CD of 0.90 with keratin, but the chaperonins were known to encapsulate many proteins during folding. We found only one CD high enough to suggest constitutive binding between a recovered protein and a cytoskeletal protein, i.e., septin-11 to Tubb2a. Another protein, coatomer subunit beta’ (Copb2), was correlated with the α-tubulin 4a subunit, but there was no known relationship to microtubules.
A pool of keratin tetramers and higher order oligomers exists in cytoplasm, and it has been shown that these particles undergo retrograde movement and then merge into fibrils. In previous studies, Kölsch and coworkers showed that the particles’ movement depends on actin retrograde flow (Kölsch et al., 2009; Kölsch et al., 2010). The particles were found in a great variety of different cell types and moved continuously inward at 100–300 nm/min (Windoffer et al., 2004). Another type of saltatory movement takes the intermediate filament in a retrograde or anterograde direction (Wöll et al., 2005). This discontinuous motion was mediated by trafficking on microtubules, and both dynein and kinesin motors were implicated in filament transport (Helfand et al., 2002; Robert et al., 2019). A recent review summarizes aspects of neurofilament movement in axons and growth cones, which present fewer obstacles for visualizing fluorescent signals in living cells (Bott and Winckler, 2020).
4.1 Actin-associated proteins
Of the β-actin-associated proteins, only two had a CD of 0.90 or higher with Actb (Section 3.1.1) and neither protein was correlated with Krt17 or keratin abundance. Another subunit, Actg, was recovered, but only the protein, Ndrg1 (0.92), varied in abundance with Actg. Thus, high-affinity binding between any protein of our dataset and an actin subunit was not a likely basis for architectural integration.
It appears that the Baiap2l-Sptan1 pedestal (see Section 3.1.1) may be the interface where actin-dependent movement stimulates the movement of the precursor particles. PPIN1 was made up of five core proteins, α-spectrin, Anxa2, Baiap2l, S100a10, and fascin (Figure 3). Although Sptan1 was the only node showing a correlation with keratin abundance, all had positive Pearson coefficients with keratins (Baiap2l, 0.76; Sptan1, 0.89; S100a10, 0.67; Anxa2, 0.60; Fscn1, 0.67). Moreover, one of the core proteins, Anxa2, was retained with keratins in pellets containing the more stable cytoskeletal elements. Thus, it may represent a thermodynamically stable interaction, such as would be needed to load keratin precursor particles onto actin filaments. Anxa2 is has an interesting connection to the problem of cell softening, because it is overexpressed in many types of cancer (Abe and Takeichi, 2008). While there is no known paradigm for integrating the whole set of interactions into an image, the PPIN1 core constituents can be arranged into a speculative pattern (Figure 7). Its interactions with keratin particles may rely on multiple weak interactions, acconting for the numerous constituents. In addition to Sptan and Fscn1, which are known actin-binding proteins, some of the more peripheral constituents of PPIN1 are actin accessory proteins. One subset may link the pedestal to organized actin structures, such as focal adhesions and intercellular junctions [Lima1, tropomyosin 3 (Tpm3), and myosin light chain 12b (Myl12b)]. These proteins showed low levels of variation with keratin abundance but modest correlations with actin abundance (see Section 3.1.1). Another set of constituents, represented by Macf1, may link it to microtubules.
FIGURE 7
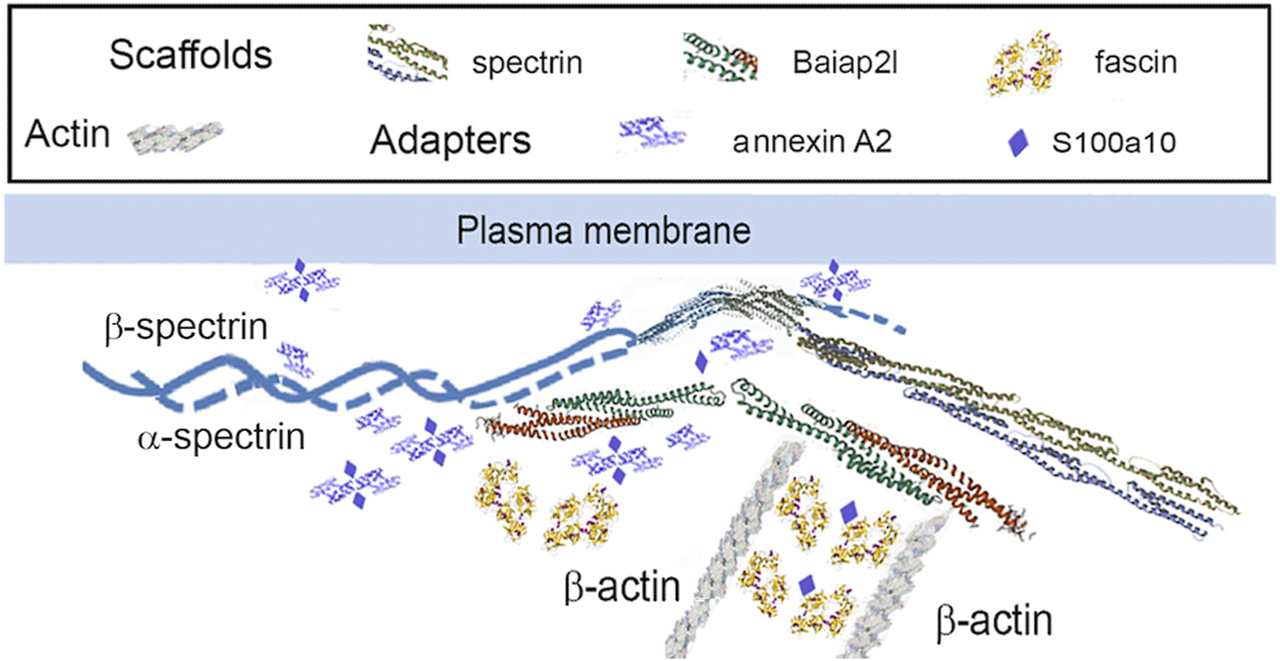
PPIN1 resembles a spectrin-IRSp53 pedestal. Fascin interacts strongly with the adapter, S100a10 and the scaffold, Baiap2l. It has weaker interactions with Macf1, Tpm3, and septin-2, and still weaker ones with Sptan1 and Anxa2. Other proteins interact with Anxa2, as judged by their CDs, but are not shown (Macf1, Myo12b, and Tpm3). Recruitment of Myo12b and Tpm3 suggests stabilization of a filament bundle, while Macf1 suggests a link to microtubules.
Surprisingly, the typical binding partners of IRSp53, i.e., Eps8 (epidermal growth factor receptor kinase substrate 8), VASP (vasodilator-stimulated phosphoprotein), N-WASP (neural Wiskott-Aldrich syndrome protein), and WAVE2 (WASP-family verprolin homologous protein) (Robens et al., 2010), were absent from our samples. Also, adducin, protein 4.1, and insulin receptor tyrosine kinase substrate, constituents of the Escherichia coli pedestal (Ruetz et al., 2012), were not found. This may suggest that the pedestal-like complex in the respiratory airway cells is markedly different than in HeLa cells. On the other hand, Eps8 and the other IRSp53-binding proteins may bind selectively to Baiap2 rather than Baiap2l. These isoforms have considerable differences, as shown in Supplementary Material S8. As both contain an I-BAR (inverse Bin-Amphiphysin-Rvs) domain that enforces a negative curvature on a membrane by binding phosphatidylinositol-4,5-bisphosphate (Tsai et al., 2022), a mixture of Baiap2 and Baiap2l could hypothetically bind to the plasma membrane and to Krt17. Another possible means of attaching the pedestal-like complex to the membrane might rely on Lima1, also called Eplin. Lima1 has N- and C-terminal actin-binding domains and stabilizes the circumferential belt of adherens junctions in kidney and colon cells by binding α-catenin (Abe and Takeichi, 2008). However, α-catenin is absent from our samples. The Pearson coefficients, R, were 0.97 or greater for Lima1 with Myl12b, Macf1, Tpm3, and β-catenin, and all were positive in sign. While all these proteins showed at least modest positive correlations with β-actin abundance, Macf1, Myl12b, and Tpm3 were also positively correlated with Baiap2l (see Supplementary Material S5). Thus, many of the actin-binding proteins may interact with Lima1 in a cluster centered on Baiap2 (see Section 3.1.1). Lima1 appears to bind sidewise on the filament and thereby inhibit nucleation of branches by Arp2/3 (Maul et al., 2003). An alternative mechanism by which Baiap2/IRSp53 could organize sites of keratin precursors at the membrane may involve 14-3-3 binding. Baiap2 interaction with 14-3-3 proteins promotes residence of the complex at lamellipodia (Robens et al., 2010). Further work is needed to clarity the relationships among the proteins of PPIN1.
4.2 Microtubule-associated proteins
The results with the microtubule-associated motor protein, Dync1h, suggested that this protein participated in a different network. Again, cooperative interaction among the constituents appeared to be important, but the PPIN2 was most clearly defined by its repulsion to all constituents of PPIN1. Among the chief constituents of PPIN2 (see Section 3.1.2) was the eukaryotic elongation factor 1 g (Eef1g). It is thought to be bound to actin through its interaction with Eef1a (Cristiano, 2020), but its relationship to microtubules was not previously suspected. Nevertheless, the CD for interaction with Mapre1 is 0.95, indicating a close relationship. It is possible it is a dual-use protein (Cristiano, 2020) and participates both in protein synthesis and in trafficking of cargo of microtubules. The heatmap of Figure 6 suggests that the abundance of Mapre1, like that of Dync1h, decreased in proportion to the increased abundance of the PPIN1 network (see Section 3.1.2). Although the behavior was known to be septin-mediated from previous studies, the involvement of Eef1g is a new finding. The current work also suggests a new role for septin-11. By inference, the high positive correlation to Tuba4a, suggests it binds tubulin directly.
5 Conclusion
The respiratory airway cell lines are remarkably uniform in the assemblage of proteins that might interact with cytoskeletal structures. The weak binding of accessory proteins, as inferred from the correlations, suggests that cytoskeletal networks are rearranged by the concerted action of several proteins. Avid binding of proteins to cytoskeletal elements may be generally disfavored, because the architectural structures must allow different partners to be recruited as new circumstances arise. Both PPINs illustrate this principle. The α-spectrin-Baiap2l network, PPIN1, is thought to mediate the assembly of keratin precursors on fibrils. PPIN2 apparently has a role in positioning organelles in the cell. It is apparently excluded from areas occupied by PPIN1, but it is unclear what physical or functional interactions maintain the two separate areas. Moreover, it is not known whether this kind of partitioning could contribute to structural defects of cancer cells. PPIN2 includes Dync1h, which does not appear closely related to cancer, but it also includes Mapre1. This protein, also called EB1, is overexpressed in some cancers and is considered an oncogene in colorectal cancer (Stypula-Cyrus et al., 2014). Further work is required to confirm the physical relationships among the proteins of the PPINs and their patterns of dynamic rearrangement. It is vital to relate the PPINs to dynamic relationships. This is needed not only to clarify these new interactions, and most other reported interaction networks, but also to find proteins that could potentially be therapeutic targets for upper airway malignancies.
Statements
Data availability statement
The original contributions presented in the study are included in the article/Supplementary Material, further inquiries can be directed to the corresponding author. The mass spectrometry proteomics data have been deposited to the ProteomeXchange Consortium via the PRIDE partner repository with the dataset identifier PXD054199.
Ethics statement
Ethical approval was not required for the study involving animals in compliance with local legislation and institutional requirements, as the cell lines were provided by other researchers.
Author contributions
OO: Conceptualization, Data curation, Formal Analysis, Investigation, Methodology, Validation, Writing–original draft, Writing–review and editing, Visualization. SC: Data curation, Formal Analysis, Investigation, Methodology, Validation, Writing–original draft, Writing–review and editing, Supervision, Visualization. RK: Data curation, Formal Analysis, Investigation, Methodology, Validation, Visualization, Writing–original draft, Writing–review and editing, Resources, Software. CH: Data curation, Formal Analysis, Investigation, Methodology, Resources, Validation, Writing–original draft, Writing–review and editing, Conceptualization, Project administration.
Funding
The author(s) declare that no financial support was received for the research, authorship, and/or publication of this article.
Acknowledgments
The authors thank Kai Niek for organizational work on the datasets, Janessa Jewell for assistance with graphical artwork, and Jessica Barnett for editing assistance.
Conflict of interest
The authors declare that the research was conducted in the absence of any commercial or financial relationships that could be construed as a potential conflict of interest.
Publisher’s note
All claims expressed in this article are solely those of the authors and do not necessarily represent those of their affiliated organizations, or those of the publisher, the editors and the reviewers. Any product that may be evaluated in this article, or claim that may be made by its manufacturer, is not guaranteed or endorsed by the publisher.
Supplementary material
The Supplementary Material for this article can be found online at: https://www.frontiersin.org/articles/10.3389/fmolb.2024.1423503/full#supplementary-material
References
1
Abe K. Takeichi M. (2008). EPLIN mediates linkage of the cadherin catenin complex to F-actin and stabilizes the circumferential actin belt. Proc. Natl. Acad. Sci. U. S. A.105 (1), 13–19. 10.1073/pnas.0710504105
2
Alibert C. Goud B. Manneville J.-B. (2017). Are cancer cells really softer than normal cells?Biol. Cell109, 167–189. 10.1111/boc.201600078
3
Anaconda I. (2020). Anaconda documentation. Anaconda software distribution. Available at: https://docs.anaconda.com/.
4
Beri P. Popravko A. Yeoman B. Kumar A. Chen K. Hodzic E. et al (2020). Cell adhesiveness serves as a biophysical marker for metastatic potential. Cancer Res.80 (4), 901–911. 10.1158/0008-5472.Can-19-1794
5
Bertling E. Hotulainen P. Mattila P. K. Matilainen T. Salminen M. Lappalainen P. (2004). Cyclase-associated protein 1 (CAP1) promotes cofilin-induced actin dynamics in mammalian nonmuscle cells. Mol. Biol. Cell15 (5), 2324–2334. 10.1091/mbc.e04-01-0048
6
Bharadwaj A. Bydoun M. Holloway R. Waisman D. (2013). Annexin A2 heterotetramer: structure and function. Int. J. Mol. Sci.14 (3), 6259–6305. 10.3390/ijms14036259
7
Blobel G. A. Moll R. Franke W. W. Vogt-Moykopf I. (1984). Cytokeratins in normal lung and lung carcinomas. I. Adenocarcinomas, squamous cell carcinomas and cultured cell lines. Virchows Arch. B45 (1), 407–429. 10.1007/BF02889883
8
Bott C. J. Winckler B. (2020). Intermediate filaments in developing neurons: beyond structure. Cytoskeleton77 (3-4), 110–128. 10.1002/cm.21597
9
Cavini I. A. Leonardo D. A. Rosa H. V. D. Castro D. D'Muniz Pereira H. Valadares N. F. et al (2021). The structural biology of septins and their filaments: an update. Front. Cell Dev. Biol.9, 765085. 10.3389/fcell.2021.765085
10
Chang X.-B. Yang Y.-Q. Gao J.-C. Zhao K. Guo J.-C. Ye C. et al (2018). Annexin A2 binds to vimentin and contributes to porcine reproductive and respiratory syndrome virus multiplication. Veterinary Res.49 (1), 75. 10.1186/s13567-018-0571-5
11
Chung B.-M. Murray C. I. Van Eyk J. E. Coulombe P. A. (2012). Identification of novel interaction between annexin A2 and keratin 17: evidence for reciprocal regulation. J. Biol. Chem.287 (10), 7573–7581. 10.1074/jbc.M111.301549
12
Colin A. Kotila T. Guérin C. Orhant-Prioux M. Vianay B. Mogilner A. et al (2023). Recycling of the actin monomer pool limits the lifetime of network turnover. EMBO J.42 (9), e112717. 10.15252/embj.2022112717
13
Cristiano L. (2020). EEF1G (Eukaryotic translation elongation factor 1 gamma). Atlas Genet. Cytogenet. Oncol. Haematol.24, 58–68. 10.4267/2042/70656
14
Fuhrmann A. Banisadr A. Beri P. Tlsty T. D. Engler A. J. (2017). Metastatic state of cancer cells may be indicated by adhesion strength. Biophysical J.112 (4), 736–745. 10.1016/j.bpj.2016.12.038
15
Gao Y. Yuan L. Ke C. Pei Z. Liu X. Wu R. et al (2023). Caprin-1 plays a role in cell proliferation and Warburg metabolism of esophageal carcinoma by regulating METTL3 and WTAP. J. Transl. Med.21 (1), 159. 10.1186/s12967-023-04001-0
16
Heckman C. A. (2022). “Cytokeratins of tumorigenic and highly malignant respiratory tract epithelial cells,” in Keratinocyte biology. Editor MayumiK. (Rijeka: IntechOpen). 10.5772/intechopen.102592
17
Heckman C. A. Campbell A. E. Wetzel B. (1987). Characteristic shape and surface changes in epithelial transformation. Exp. Cell Res.169, 127–148. 10.1016/0014-4827(87)90232-1
18
Heckman C. A. Jamasbi R. J. (1999). Describing shape dynamics in transformed cells through latent factors. Exp. Cell Res.246 (1), 69–82. 10.1006/excr.1998.4242
19
Heckman C. A. Olson A. C. (1979). Morphological markers of oncogenic transformation in respiratory tract epithelial cells. Cancer Res.39 (7), 2390–2399.
20
Heckman C. A. Pandey P. Cayer M. L. Biswas T. Zhang Z.-Y. Boudreau N. S. (2017). The tumor promoter-activated protein kinase Cs are a system for regulating filopodia. Cytoskeleton74 (8), 297–314. 10.1002/cm.21373
21
Helfand B. T. Mikami A. Vallee R. B. Goldman R. D. (2002). A requirement for cytoplasmic dynein and dynactin in intermediate filament network assembly and organization. J. Cell Biol.157 (5), 795–806. 10.1083/jcb.200202027
22
Jamasbi R. J. Nettesheim P. Kennel S. J. (1978). Demonstration of cellular and humoral immunity to transplantable carcinomas derived from the respiratory tract of rats. Cancer Res.38 (2), 261–267.
23
Jin M. Liu C. Han W. Cong Y. (2019). “TRiC/CCT chaperonin: structure and function,” in Macromolecular protein complexes II: structure and function. Editors HarrisJ. R.Marles-WrightJ. (Cham: Springer International Publishing), 625–654. 10.1007/978-3-030-28151-9_19
24
Kesisova I. A. Robinson B. P. Spiliotis E. T. (2021). A septin GTPase scaffold of dynein-dynactin motors triggers retrograde lysosome transport. J. Cell Biol.220 (2), e202005219. 10.1083/jcb.202005219
25
Kölsch A. Windoffer R. Leube R. E. (2009). Actin-dependent dynamics of keratin filament precursors. Cell Motil. Cytoskelet.66 (11), 976–985. 10.1002/cm.20395
26
Kölsch A. Windoffer R. Würflinger T. Aach T. Leube R. E. (2010). The keratin-filament cycle of assembly and disassembly. J. Cell Sci.123 (Pt 13), 2266–2272. 10.1242/jcs.068080
27
Li X. Goult B. T. Ballestrem C. Zacharchenko T. (2023). The structural basis of the talin-KANK1 interaction that coordinates the actin and microtubule cytoskeletons at focal adhesions. Open Biol.13 (6), 230058. 10.1098/rsob.230058
28
Lowry O. H. Rosebrough N. J. Rarr A. L. Randall R. J. (1951). Protein measurement with the Folin phenol reagent. J. Biol. Chem.193 (1), 265–275. 10.1016/s0021-9258(19)52451-6
29
Manger R. L. Heckman C. A. (1982). Structural anomalies of highly malignant respiratory tract epithelial cells. Cancer Res.42 (11), 4591–4599.
30
Marchok A. C. Rhoton J. C. Nettesheim P. (1978). In vitro development of oncogenicity in cell lines established from tracheal epithelium preexposed in vivo to 7,12-dimethylbenz(a)anthracene. Cancer Res.38 (7), 2030–2037.
31
Mashukova A. Forteza R. Salas P. J. (2016). Functional analysis of keratin-associated proteins in intestinal epithelia: heat-shock protein chaperoning and kinase rescue. Methods in enzymology. Editors WilsonK. L.SonnenbergA. (Academic Press), 139–154. 10.1016/bs.mie.2015.08.019
32
Maul R. S. Song Y. Amann K. J. Gerbin S. C. Pollard T. D. Chang D. D. (2003). EPLIN regulates actin dynamics by cross-linking and stabilizing filaments. J. Cell Biol.160 (3), 399–407. 10.1083/jcb.200212057
33
McGowan K. M. Coulombe P. A. (1998). Onset of keratin 17 expression coincides with the definition of major epithelial lineages during skin development. J. Cell Biol.143 (2), 469–486. 10.1083/jcb.143.2.469
34
Olatona O. A. (2023). “Biological Sciences, wmuatoifIIet All epithelia are characterized by keratins, which account for the majority of clinical cancers, the loss of cytoskeletal Keratin-associated Proteins in Basal Cells of Tumorigenic and Highly Malignant Airway Epithelia,”. OhioLINK Electronic Theses and Dissertations Center (Bowling Green State University), 194. Available at: http://rave.ohiolink.edu/etdc/view?acc_num=bgsu1688759563316062.
35
Ono S. (2013). The role of cyclase-associated protein in regulating actin filament dynamics—more than a monomer-sequestration factor. J. Cell Sci.126, 3249–3258. 10.1242/jcs.128231
36
Pora A. Yoon S. Dreissen G. Hoffmann B. Merkel R. Windoffer R. et al (2020). Regulation of keratin network dynamics by the mechanical properties of the environment in migrating cells. Sci. Rep.10 (1), 4574. 10.1038/s41598-020-61242-5
37
Robens J. M. Yeow-Fong L. Ng E. Hall C. Manser E. (2010). Regulation of IRSp53-dependent filopodial dynamics by antagonism between 14-3-3 binding and SH3-mediated localization. Mol. Cell. Biol.30 (3), 829–844. 10.1128/mcb.01574-08
38
Robert A. Tian P. Adam S. A. Kittisopikul M. Jaqaman K. Goldman R. D. et al (2019). Kinesin-dependent transport of keratin filaments: a unified mechanism for intermediate filament transport. FASEB J.33 (1), 388–399. 10.1096/fj.201800604R
39
Ruetz T. J. Lin A. E.-J. Guttman J. A. (2012). Enterohaemorrhagic Escherichia coli requires the spectrin cytoskeleton for efficient attachment and pedestal formation on host cells. Microb. Pathog.52 (3), 149–156. 10.1016/j.micpath.2011.12.001
40
Sheetz M. P. (2019). A tale of two states: normal and transformed, with and without rigidity sensing. Annu. Rev. Cell Dev. Biol.35, 169–190. 10.1146/annurev-cellbio-100818-125227
41
Spiliotis E. T. Kesisova I. A. (2021). Spatial regulation of microtubule-dependent transport by septin GTPases. Trends Cell Biol.31 (12), 979–993. 10.1016/j.tcb.2021.06.004
42
Steele V. E. Marchok A. C. Nettesheim P. (1978). Establishment of epithelial cell lines following exposure of cultured tracheal epithelium to 12-O-tetradecanoyl-phorbol-13-acetate. Cancer Res.38 (10), 3563–3565.
43
Steinert P. M. Candi E. Kartasova T. Marekov L. (1998). Small proline-rich proteins are cross-bridging proteins in the cornified cell envelopes of stratified squamous epithelia. J. Struct. Biol.122 (1-2), 76–85. 10.1006/jsbi.1998.3957
44
Stypula-Cyrus Y. Mutyal N. N. Cruz M. D. Kunte D. P. Radosevich A. J. Wali R. et al (2014). End-binding protein 1 (EB1) up-regulation is an early event in colorectal carcinogenesis. FEBS Lett.588 (5), 829–835. 10.1016/j.febslet.2014.01.046
45
Suber Y. Alam M. N. A. Nakos K. Bhakt P. Spiliotis E. T. (2023). Microtubule-associated septin complexes modulate kinesin and dynein motility with differential specificities. J. Biol. Chem.299 (9), 105084. 10.1016/j.jbc.2023.105084
46
Szklarczyk D. Franceschini A. Wyder S. Forslund K. Heller D. Huerta-Cepas J. et al (2015). STRING v10: protein-protein interaction networks, integrated over the tree of life. Nucleic Acids Res.43, D447–D452. 10.1093/nar/gku1003
47
Tang V. W. Nadkarni A. V. Brieher W. M. (2020). Catastrophic actin filament bursting by cofilin, Aip1, and coronin. J. Biol. Chem.295 (38), 13299–13313. 10.1074/jbc.RA120.015018
48
Tsai F. C. Henderson J. M. Jarin Z. Kremneva E. Senju Y. Pernier J. et al (2022). Activated I-BAR IRSp53 clustering controls the formation of VASP-actin-based membrane protrusions. Sci. Adv.8 (41), eabp8677. 10.1126/sciadv.abp8677
49
Windoffer R. Wöll S. Strnad P. Leube R. E. (2004). Identification of novel principles of keratin filament network turnover in living cells. Mol. Biol. Cell15 (5), 2436–2448. 10.1091/mbc.e03-09-0707
50
Wöll S. Windoffer R. Leube R. E. (2005). Dissection of keratin dynamics: different contributions of the actin and microtubule systems. Eur. J. Cell Biol.84 (2), 311–328. 10.1016/j.ejcb.2004.12.004
51
Xin Y. Li K. Huang M. Liang C. Siemann D. Wu L. et al (2023). Biophysics in tumor growth and progression: from single mechano-sensitive molecules to mechanomedicine. Oncogene42, 3457–3490. 10.1038/s41388-023-02844-x
52
Zhao A. J. Montes-Laing J. Perry W. M. G. Shiratori M. Merfeld E. Rogers S. L. et al (2022). The Drosophila spectraplakin Short stop regulates focal adhesion dynamics by cross-linking microtubules and actin. Mol. Biol. Cell33 (5), ar19. 10.1091/mbc.E21-09-0434
Summary
Keywords
actin comet, intercellular junction proteins, minus-end-directed motor, keratin precursor particle, respiratory tract, tandem (hybrid) mass spectrometry, protein-protein interaction (PPI)
Citation
Olatona OA, Choudhury SR, Kresman R and Heckman CA (2024) Candidate proteins interacting with cytoskeleton in cells from the basal airway epithelium in vitro. Front. Mol. Biosci. 11:1423503. doi: 10.3389/fmolb.2024.1423503
Received
26 April 2024
Accepted
24 June 2024
Published
30 July 2024
Volume
11 - 2024
Edited by
Binh P. Nguyen, Victoria University of Wellington, New Zealand
Reviewed by
Yao Zhang, Michigan State University, United States
Ruby Sharma, Albert Einstein College of Medicine, United States
Updates
Copyright
© 2024 Olatona, Choudhury, Kresman and Heckman.
This is an open-access article distributed under the terms of the Creative Commons Attribution License (CC BY). The use, distribution or reproduction in other forums is permitted, provided the original author(s) and the copyright owner(s) are credited and that the original publication in this journal is cited, in accordance with accepted academic practice. No use, distribution or reproduction is permitted which does not comply with these terms.
*Correspondence: Carol A. Heckman, heckman@bgsu.edu
Disclaimer
All claims expressed in this article are solely those of the authors and do not necessarily represent those of their affiliated organizations, or those of the publisher, the editors and the reviewers. Any product that may be evaluated in this article or claim that may be made by its manufacturer is not guaranteed or endorsed by the publisher.