Abstract
Background:
Ovarian cancer is a highly lethal gynecological malignancy characterized by significant heterogeneity and immunosuppressive tumor microenvironments, contributing to poor prognosis and therapeutic resistance. This study investigates the immunological and prognostic significance of FN1-expressing tumor cells using integrated multi-omics approaches.
Methods:
The study used GEO database data processed with Seurat and Harmony R. Each cluster had marker genes and cells were tested for preference. Cell stemness was measured using AUCell and CytoTRACE. The gene regulatory network was analyzed using pySCENIC. Molecular signaling exchange study was done with CellChat. And immune infiltration as well as prognostic stratification was performed using bulk analysis. Finally, the identified FN1 targets were validated in conjunction with the spatial transcriptome as well as experimentally.
Results:
The study highlighted FN1 expression as a key factor in ovarian cancer prognosis and immune resistance. High FN1 tumor cells were linked to poor survival. FN1 knockdown inhibited tumor growth by reducing tumor cells aggregation, invasion, and migration. Our findings suggested that FN1+ tumor cells contributed to immunotherapy resistance, making FN1 a potential biomarker and therapeutic target for improving treatment outcomes in ovarian cancer.
Conclusion:
A prognostic model created based on FN1 tumor cells provided a new idea for clinical staging of ovarian cancer patients. Meanwhile, this study provided new insights into the heterogeneity of tumor cells and suggested a potential therapeutic target, FN1, which could be helpful for precise immunotherapy of ovarian cancer.
1 Introduction
Ovarian cancer, a very lethal gynecologic malignancy, is characterized by its intricate tumor microenvironment (TME) and its metastatic potential (Deng et al., 2022; Almeida-Nunes et al., 2022; Zhu et al., 2022). Ovarian cancer is a heterogeneous disease characterized by a variety of tumors that exhibit diverse clinicopathological, genetic, and prognostic features, demonstrating significant tumor heterogeneity both within and among subtypes (Kossai et al., 2018; Xiao et al., 2022; Cho and Shih, 2009). High-grade plasmacytoid carcinoma represents the most common subtype of ovarian cancer, characterized by its aggressive nature and generally poor prognosis for affected patients (Wang Y. et al., 2022). Epithelial ovarian cancer, particularly high-grade serous ovarian carcinoma, characterized by extensive genomic instability, high rates of intraperitoneal metastasis, and frequent development of chemoresistance. Surgery and chemotherapy are the primary treatments for ovarian cancer; however, chemotherapy resistance leads to patients’ recurrence within a few years of initiating treatment (Wood and Ledermann, 2022; Yang et al., 2020; Jiang et al., 2020). Despite initial responses to cytoreductive surgery and platinum-based chemotherapy, the majority of patients experience relapse, often within 18 months, due to acquired resistance and the persistence of tumor subclones (Dou et al., 2023). Immunotherapy has grown rapidly in the past 20 years, modernizing cancer treatment and ushering in precision healthcare (Morand et al., 2021; Kuroki and Guntupalli, 2020; Zhang L. et al., 2024; Ye et al., 2025). The mechanisms underlying immune evasion remain inadequately understood, thereby constraining the efficacy of cancer immunotherapy. Recent advances in molecular profiling have revealed that ovarian cancer is not a single disease but rather a heterogeneous group of neoplasms with distinct molecular, cellular, and clinical characteristics. This heterogeneity is further complicated by the TME, which plays a pivotal role in immune evasion, therapeutic resistance, and disease progression. Emerging immunotherapeutic strategies, including immune checkpoint inhibitors and adoptive T cell therapies, have shown limited efficacy in unselected ovarian cancer populations. A deeper understanding of immune-tumor interactions and the identification of key immunomodulatory drivers are urgently needed to improve patient stratification and treatment outcomes (Xu et al., 2020). In this context, our study focuses on FN1+ tumor cells using an integrated multi-omics approach, aiming to elucidate their role in immune escape and prognostic stratification. This work contributes to the broader effort to develop precision immunotherapies tailored to the complex immunobiology of ovarian cancer.
Single-cell RNA sequencing (scRNA-seq) is a powerful method for examining ovarian cancer heterogeneity with unprecedented detail (Xu et al., 2022; Zhang et al., 2023a; Zhao et al., 2025a; Zhao et al., 2025b). This method enables researchers to delineate diverse cell types, ascertain biological states, and reveal dynamic interactions within the tumor microenvironment by examining individual cells (Olbrecht et al., 2021; Olalekan et al., 2021). The TME strongly influences tumor growth, progression, and therapy response (Yu et al., 2023; Han et al., 2023). In the TME, immune cells and ovarian cancer cells engage in reciprocal signaling that modifies the immune response and influences the progression of the disease (Luo et al., 2021). Ovarian cancer with TME has been shown to recruit several immune cell types, and recent years have yielded a more profound understanding of the intricacies of their interactions (So et al., 2018; Lin S. C. et al., 2022; Kasikova et al., 2024). The TME of ovarian cancer is recognized for its significant immunosuppressive properties, facilitating evasion of immune surveillance and unrestricted tumor proliferation (Cai and Jin, 2017). Consequently, it is essential to deepen our comprehension of the underlying mechanisms to formulate enhanced tactics and augment the clinical applicability of immunotherapy.
Spatial Transcriptomics (ST) is a technology that examines and delineates the expression profiles of specific cell types in a spatial context to elucidate expression variations among organs, tissues, and pathological conditions, and it can resolve transcript profiles of tissues at distinct spatial locales (Rao et al., 2021). ST technology, when integrated with traditional single-cell sequencing, in situ methods, and other histological techniques, facilitates the examination of cellular heterogeneity and localization within tissue architecture. This approach offers a more accurate research trajectory for disease investigation, significantly enhancing the comprehension of pathogenic mechanisms and informing targeted therapeutic strategies.
In the current study, we dissected tumor-immune cell interactions in ovarian cancer to improve immunoprecision therapy and identify barriers to immunotherapy by using scRNA-seq and ST. Utilizing CellChat, we further examined intercellular communication within the tumor microenvironment and found FN1-CD44, a significant signaling network that may be targeted for immunoprecision treatments (Wan et al., 2024). We identified it as a significant mediator of interactions between tumor cells and stromal components, indicating its significance in establishing microenvironments favorable to tumor proliferation. This cellular communication may be the most effective intervention for ovarian cancer. Simultaneously, we illustrated the distribution of important subtypes and signaling pathways in tissue sections from ovarian cancer patients utilizing ST techniques, which have confirmed their viability as immunotherapeutic targets. Ultimately, in vitro assays for functional confirmation demonstrated that FN1 knockdown diminished tumor cell invasiveness and activity. These findings offer significant insights into the molecular mechanisms of ovarian cancer and pinpoint potential targets for personalized immunotherapy.
2 Methods
2.1 Origin of data
The GEO database (https://www.ncbi.nlm.nih.gov/geo/) supplied the ovarian cancer single-cell RNA sequencing dataset, obtained under accession number GSE181955. The samples comprised one normal ovary, two primary ovarian cancer specimens, and two omental tissues. Tissue slices for spatial transcriptomics were acquired from GSE211956. This study did not necessitate ethical approval as it utilized publicly available data.
2.2 RNA sequencing in single cells
The Seurat package (version 4.3.0) was used to process gene expression data in R (version 4.2.0) (Butler et al., 2018). 500 < nCount <100,000, 300 <nFeature <7,500, mitochondrial gene expression ≤25% of total genes, and erythrocyte gene expression ≤5% of total genes were the quality control criteria used to screen the cells. The data were first normalized using “NormalizeData” (Jiang et al., 2022), followed by “FindVariableFeatures” (Wu et al., 2021; Zhao et al., 2024a; Lin L. et al., 2024; Ni et al., 2025; Hou et al., 2025; Li et al., 2025; Wang et al., 2024) to select the first 2,000 variable genes, then followed by “ScaleData” to standardize the data. Next, we downscaled the obtained data using principal component analysis (PCA) and used the Harmony R package (version 0.1.1) to handle batch effects. Then, we used the “FindClusters” and “FindNeighbors” tools (Ge et al., 2024; Jin et al., 2024; Nie et al., 2024; Zhang Y. et al., 2024) to cluster the first 30 principal components (PCs) into cells. Lastly, based on the important PCs, gene expression was visualized using uniform manifold approximation and projection (UMAP) (Ge et al., 2024; Ding et al., 2023).
2.3 Cell type identification
To identify marker genes for each cluster, Seurat’s FindAllMarkers tool was used to conduct a differential gene expression analysis across cell clusters (Zhang et al., 2019; Huang et al., 2024; Ding et al., 2023). After that, we used the singleR package to identify and label various cell clusters according to the patterns of marker gene composition. These were then manually confirmed and improved using the CellMarker database.
2.4 Preference analysis of cells
Odds ratios were computed using the methods outlined in the study to evaluate the preference of tumor cell subtypes for cancer (Zheng et al., 2021).
2.5 Cell stemness analysis
The authors used AUCell (Aibar et al., 2017), a technique for locating active genes in scRNA-seq data, to evaluate the stemness of TC subtypes. Furthermore, cell stemness was assessed using the CytoTRACE R package (version 0.3.3), which allowed for speculative inference about the chronological order of cell differentiation (Lin et al., 2024b; Sun et al., 2024; Li et al., 2024).
2.6 Trajectory analysis of TCs subtypes
The Monocle 2 algorithm (Qiu et al., 2017; Zhao et al., 2023; Feng et al., 2025), which condensed high-dimensional gene expression data into a lower-dimensional space for display, was used to predict pseudotime trajectories of TCs subtypes. Trajectories were created from the cells, and each branch point was recognized. The Slingshot R package (version 2.6.0) was used to investigate lineage and pseudotime links in more detail (Zhou et al., 2024; Zhao et al., 2024b; Shao et al., 2024). This technique fitted branching trajectories with synchronized master curves and created lineage structures using clustering-based minimal spanning trees.
2.7 Analysis of cellular subtype enrichment
Using the ClusterProfiler R package (version 4.6.0), we enriched differentially expressed genes (DEGs) using Gene Ontology (GO) (Zhao et al., 2022a; Lin et al., 2022b; Zhao Z. J. et al., 2021), Kyoto Encyclopedia of Genes and Genomes (KEGG) (Wang et al., 2020; Zhao Z. et al., 2021), and Gene Set Enrichment Analysis (GSEA) (Zhang et al., 2023b; Chen Y. et al., 2022a; Sun et al., 2022a). We set significance of all terms at an adjusted p-value whose threshold was less than 0.05 and analyzed the data (Alexa et al., 2006). The filtering criteria for fold change were based on a log2 fold change threshold of 1, which means that only genes with a fold change greater than or equal to 1 (or less than or equal to −1) were considered as differentially expressed.
2.8 Gene regulatory network analysis
SCENIC identified active transcriptional regulators from single-cell data. The pySCENIC R software package (version 0.10.0) and Python (version 3.7) for single-cell regulatory network inference and clustering analysis were utilized to identify transcription factors (TFs) with notable expression differences in various TCs subtypes. To start, we used GRNBoost to find putative target genes linked to every TF. In order to find potential sites for direct binding, more DNA-motif analysis was carried out. AUCell has been used to evaluate the activity of the regulators in individual cells, and the top five TFs have been chosen based on the results. The website https://reorigins.aertslab.org/cistarget/ is where the human gene-motif rankings were first created. The Connection Specificity Index (CSI) methodology has been used to define regulatory modules in order to find certain association partners (Suo et al., 2018). Lastly, we classified different regulator modules using hierarchical clustering based on Euclidean distance. Studying the relationships between various regulators is made easier by building the regulator linkage network with a threshold value of 0.65.
2.9 Molecular signaling communication analysis
CellChat inferred ligand-receptor-mediated intercellular communication. Depending on the ligand-receptor level, regulatory frameworks were constructed and interactions were analyzed using the CellChat R software program (version 1.6.1) (Jin et al., 2021; Lin et al., 2024c; Liu et al., 2024). Using the “netVisualDiffInteraction” and “IdentifyCommunicationPatterns” features, we estimated the number of communication patterns and visualized variations in intercellular communication strength, setting a significant level where the p-value was 0.05.
2.10 Spatial transcriptomics deconvolution and analysis of cellular interactions
We utilized the integrated scRNA-seq dataset as a reference to execute cell type decomposition within the histological structures of the ST slide, employing the robust cell type decomposition (RCTD) approach with doublet_mode set to “full” (Cable et al., 2022).
Cell-cell interactions were assessed using stLearn, followed by a modified pseudo-time trajectory analysis in spatial contexts via stLearn (Pham et al., 2023), which utilized PAGA trajectory analysis based on tissue-wide SME normalized gene expression data to reveal relationships among subtypes. A pseudotime spatial trajectory algorithm was utilized to describe the malignant growth across the sections, identifying spatial and transcriptional connections among the subtypes.
2.11 Building prognostic models
We investigated the impact of ovarian cancer-associated TCs on patient survival prediction using key marker genes unique to crucial TCs subtypes. To find the most significant predictive genes, LASSO regression (Zheng R. et al., 2022; Zheng R. Z. et al., 2022; Li X. Y. et al., 2022) was performed after univariate Cox analysis. A risk score model, which is defined as Risk score = , was then established by doing multivariate Cox regression analysis to determine risk coefficients for each gene (Chen B. et al., 2022; Zou et al., 2022; Zhao J. et al., 2022). Using the “surv_cutpoint” tool to find an ideal threshold, patients were divided into low-risk and high-risk categories. The “Survival” R package (version 3.3.1) was used to analyze the survival of these cohorts (Lin et al., 2022c; Lin et al., 2022d; Lin et al., 2023), and the “ggsurvplot” function was used to show the survival curves. ROC curves were produced using the “timeROC” package (version 0.4.0) in order to evaluate the model’s prediction accuracy (Wang J. et al., 2022). AUC was then defined as the area under the ROC curve and responds to the accuracy of this predictive model (Zhao et al., 2022c). In order to purify transcriptomes from bulk data without distinguishing individual cells, CIBERSORT was also used to estimate the number of cell types in bulk RNA-seq data (Newman et al., 2019). Transcripts per million (TPM) values were used to pre-normalize the TCGA bulk RNA-seq data. Using 1,000 permutations without batch correction, a signature matrix was constructed using TPM-normalized datasets for particular cell types. To enable CIBERSORT to estimate the cell type fractions in both cohorts, ovarian cancer patients from the TCGA database were randomly assigned to training and testing cohorts in a 1:1 ratio according to survival status.
2.12 Analysis of immune infiltration
The CIBERSORT R program (version 0.1.0) was used to quantify immune cell infiltration and expression differences between various risk score groups. Correlations between immune cells and risk scores, modeled genes, and OS were then examined. Tumor purity, immunological score, EATIMATE score, and stromal score levels across different risk groups were assessed using the Xcell algorithm and the ESTIMATE R package (version 1.0.13).
2.13 Culture of cell lines
We used the American Type Culture Collection’s Caov-3 and SK-OV-3 cell lines, which we cultivated at 37°C, 5% CO2, and 95% humidity. The SK-OV-3 cell line was kept in MD10 medium with the same serum and antibiotic concentrations, whereas the Caov-3 cell line was cultivated in MD02 medium with 10% fetal bovine serum and 1% penicillin-streptomycin.
2.14 Transfection of cells
For every transfection, we utilized Lipofectamine 3000 RNAiMAX (Invitrogen, United States). Six-well plates were seeded with cells at 50% confluence, and the cells were transfected with the knockdown models (Si-FN1-1 and Si-FN1-2) and negative control (si-NC), respectively. GenePharma’s (Suzhou, China) short interfering RNA (siRNA) constructs were used to knock down FN1.
2.15 Test of colony formation
The cells were cultivated for 10 days after being seeded into six-well plates. The cells were then fixed for 15 minutes using 4% paraformaldehyde. The cells were then stained for 15 min using 0.5% crystal violet. Lastly, we used ImageJ software (National Institutes of Health, Bethesda, Maryland, United States) to take pictures of the colonies and determine their number.
2.16 Test of cell activity test
Transfected Caov-3 and SK-OV-3 cell lines were seeded at 5 × 10³ per well in 96-well plates, and their cell activity was assessed using the CCK-8 test. The cells were then cultivated for the entire day. We next filled each well with 10 μL of CCK-8 reagent (Vazyme, A311-01) and incubated them for 2 hours at 37°C in the dark. Lastly, on days 1, 2, 3, and 4 after transfection, we measured absorbance at 450 nm using a microplate reader (Thermo, A33978) and plotted the average OD values.
2.17 Test of transwell
Prior to the experiment, we first starved the cells for the entire day in serum-free media. The cell suspension was then added to the superior chamber of Costar plates that had been pre-treated with Matrigel (BD Biosciences, United States), while serum-enriched media was present in the inferior chamber. Following 2 days of incubation, we treated the cells with 4% paraformaldehyde and evaluated their capacity for invasion using crystal violet staining.
2.18 Test of wound-healing
Stable transfected cells were put into 6-well plates, and their growth was monitored until confluence. We made a scratch in each well using a sterile 200-μL pipette tip, cleaned the wells with PBS to get rid of any debris, and then incubated them in a medium free of serum. We took pictures of the scratch both then and 48 h later, and we measured its width using ImageJ software.
2.19 Proliferation test of 5-Ethynyl-2′-deoxyuridine (EdU)
In 6-well plates, 5 × 10³ transfected Caov-3 and SK-OV-3 cells were added to each well, and the cells were cultivated for the entire night. In the meanwhile, we combined 10 mM EdU with serum-free medium to create a 2× EdU working solution. Following a 2-h incubation period at 37°C, we rinsed the cells with PBS, fixed them for 30 min with 4% paraformaldehyde, and permeabilized them for 15 min with 2 mg/mL glycine and 0.5% Triton X-100. After that, we dyed them for half an hour at room temperature using 1X Apollo and 1X Hoechst 33,342. Finally, cell proliferation was evaluated using fluorescence microscopy.
3 Results
3.1 ScRNA-seq single-cell mapping found six primary cell types in ovarian cancer
Initially, eight tissue samples—normal ovarian tissue, omental tissue, and ovarian cancer tissue—were obtained from GEO to ascertain the cell types implicated in the progression of ovarian cancer. We would conduct a series of multi-omics analyses and experimental validation of the obtained sample data (Figure 1). Genes failing to meet the minimal expression threshold were excluded following an assessment of the quality and completeness of the raw data. Following the removal of batch effects and quality control, 35,726 cells were retained and categorized into 28 clusters (Figure 2A). Through the analysis of cellular genetic profiles and prevalent markers, these 28 cell clusters were conclusively identified as six principal cell types: fibroblasts (DCN), myeloid cells (LYZ), proliferating cells (MKI67), epithelial cells (EPCs, WFDC2), T/NK cells (CCL5), B and plasma cells (IGKC) (Figure 2B). The fraction of EPCs was increasing, but the proportion of T/NK cells was decreasing in ovarian cancer tissues, omental tissues, and normal ovarian tissues. Specifically, myeloid cells exhibited a decline from omental tissue to ovarian cancer tissue and an increase correspondingly from normal ovarian tissue to omental tissue. EPCs predominantly resided in the G1 and S phases, whereas T/NK cells were more prevalent in the G1, G2/M, and S phases, with G2/M being the most frequent (Figures 2C–E). The main enriched genes in the bubble diagram for each cell type corresponded with the known marker genes (Figure 2F). Finally, the quantity of RNAs expressed in EPCs was illustrated by violin plots and UMAP plots, which further indicated that the characteristic RNAs were predominant across all cell types (Figure 2G). Ovarian cancer tissues demonstrated significantly elevated expression levels of both items in comparison to other tissues. We additionally associated EPCs with ovarian cancer, as prior studies indicated that ovarian cancer originates from three distinct tissue types: around 3 to 5 percent from germ cells, 5 to 8 percent from stromal cells, and 85 to 95 percent from epithelial cells.
FIGURE 1

Summary chart. The concept and methodology of our entire paper were illustrated in the graphic. Prior to clustering and evaluating the TCs, we first acquired the raw data of ovarian cancer patients from GEO. Next, we clustered the main cells within the data. Second, we performed a number of analyses for the TCs, such as communication, transcription factor, enrichment, and trajectory analyses. We then identified the relevant subtype and developed a predictive model using the subtype. Lastly, using the signaling molecules of interest identified by the communication analysis, we conducted in vitro studies.
FIGURE 2
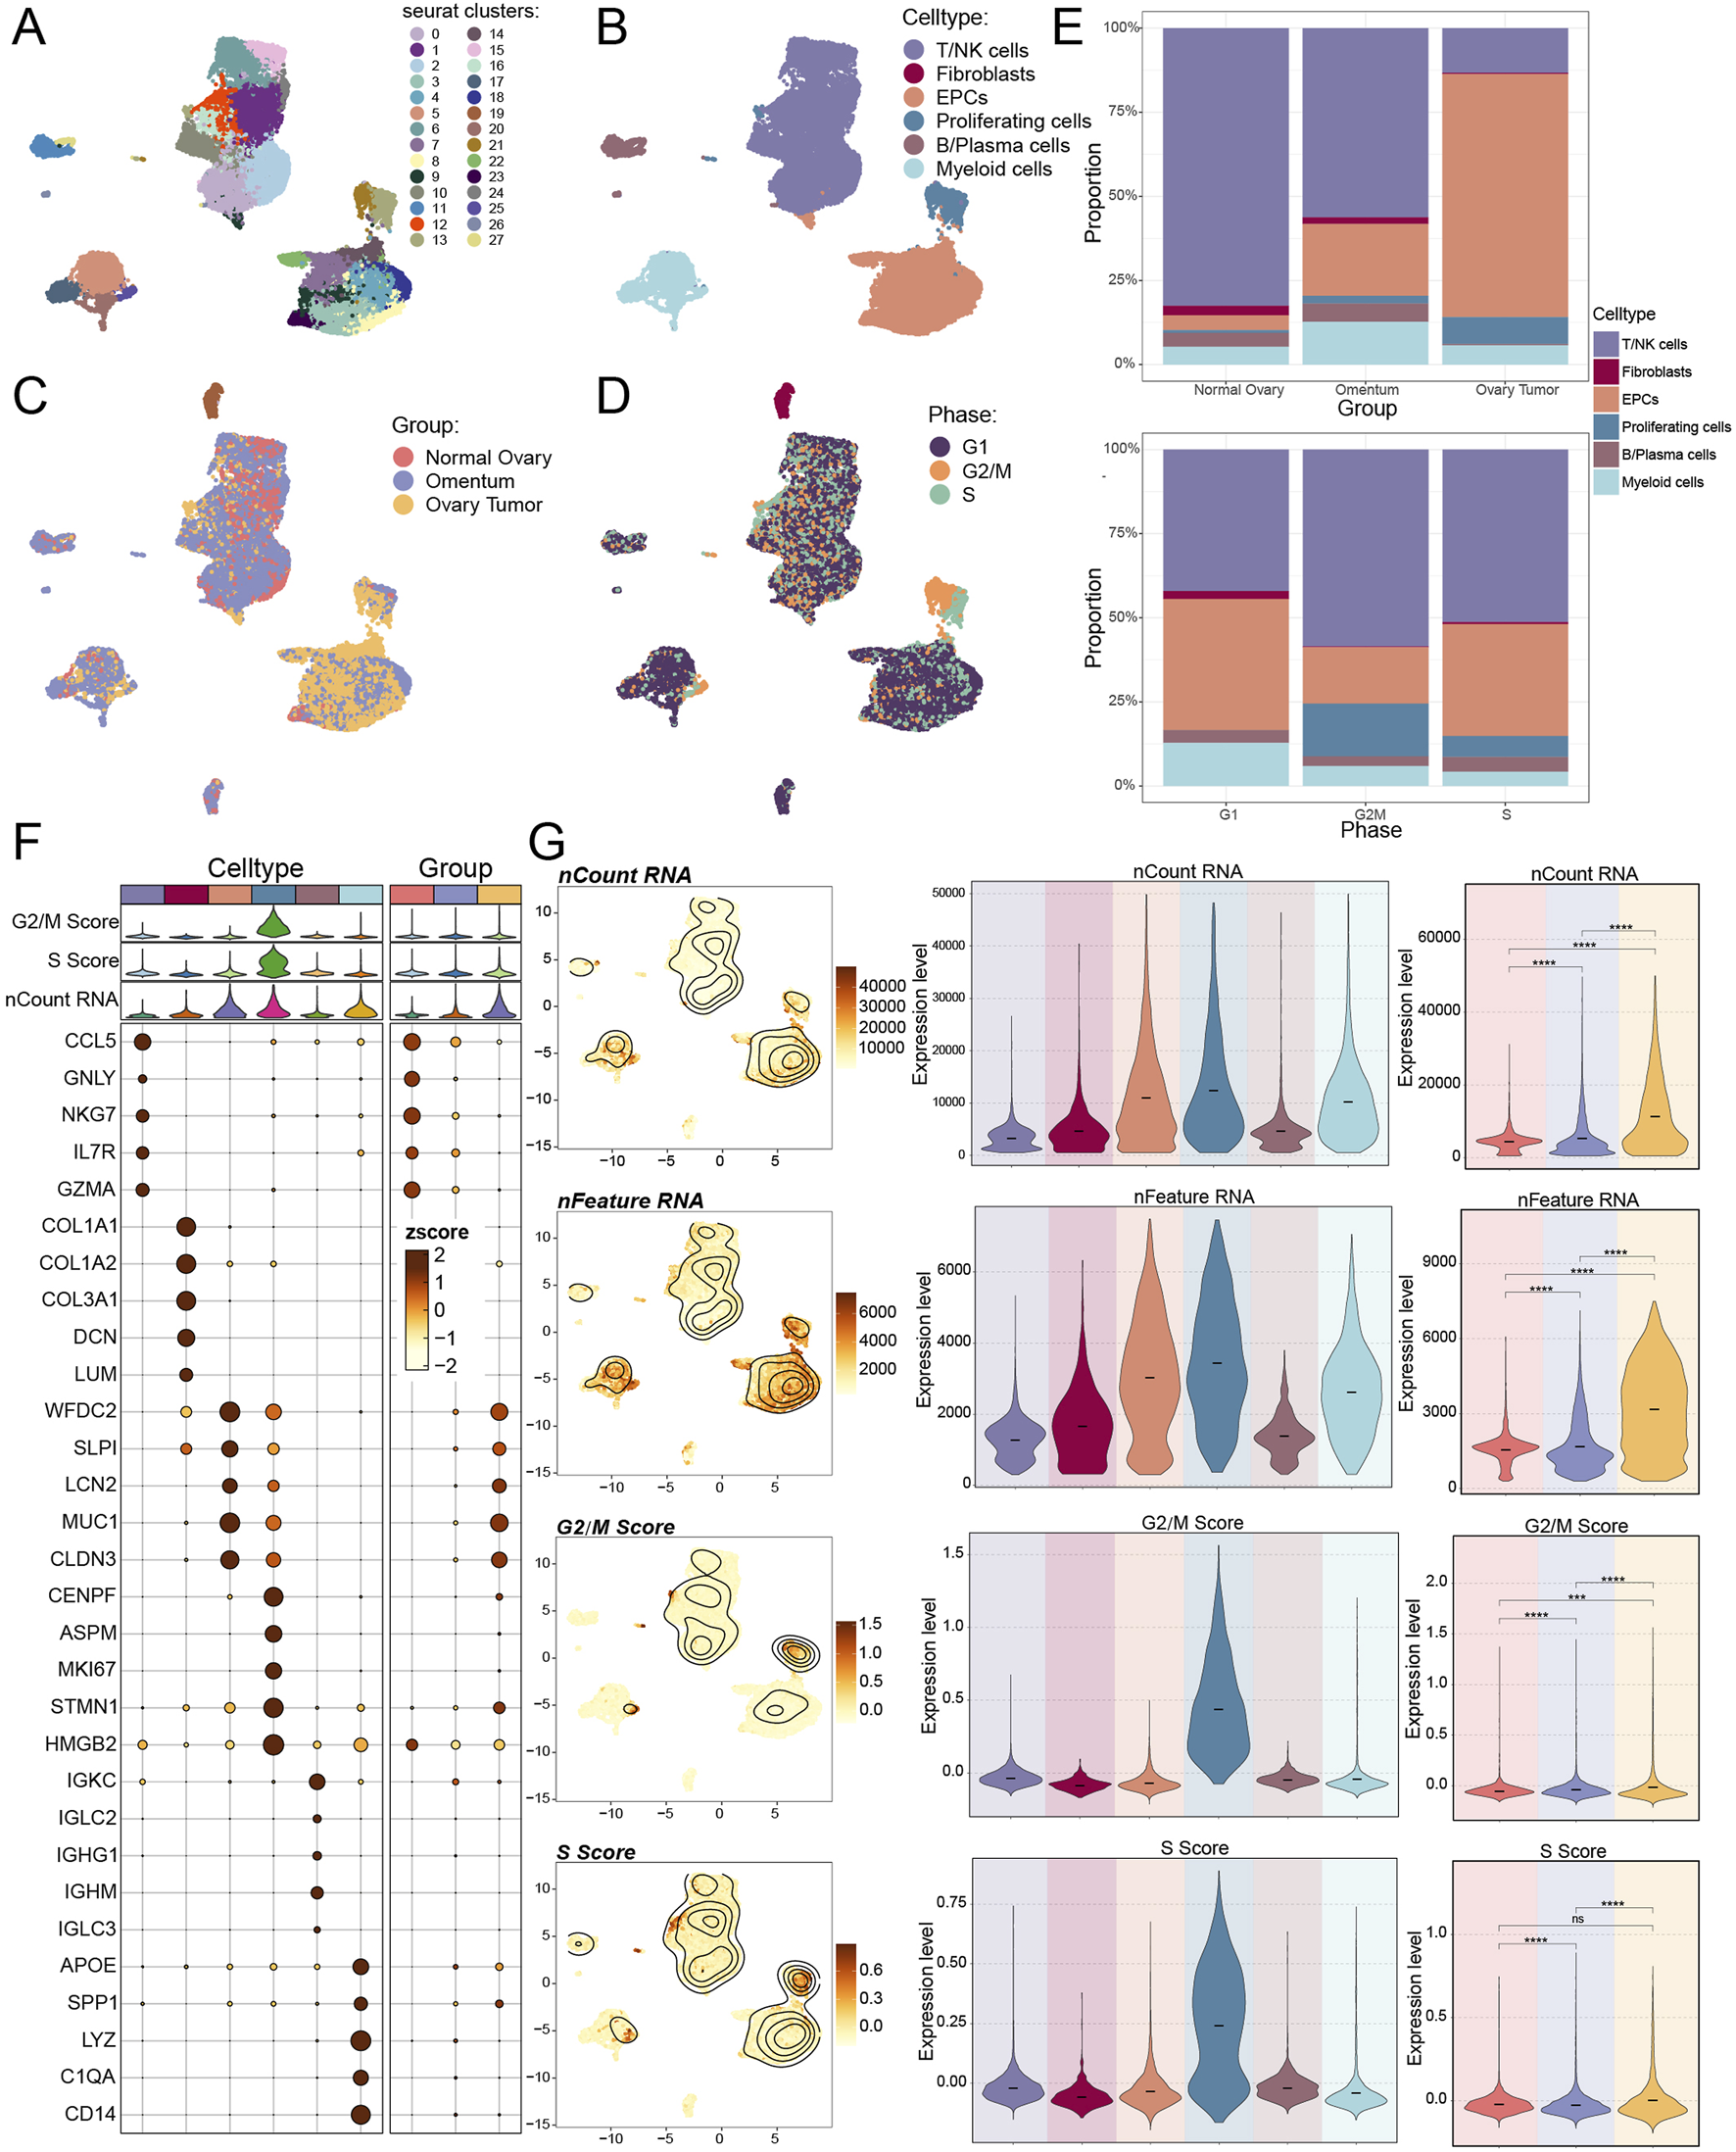
Single-cell mapping of ovarian cancer. (A–D) The UMAP plot (A) displayed the distribution of 28 cell clusters in both normal participants and ovarian cancer patients; six primary cell types were subsequently clustered (B). Additionally, the UMAP figure displayed the distribution of tissue origins (C) and cell phases (D). (E) The proportions of various cell types from different tissue origins (above) and cell phases (below) were displayed by bar graphs. (F) Using an enrichment bubble plot, the top five marker genes for ovarian cancer were shown to have differential expression across the six main cell types and three tissue sources. Bubble colors were associated with zscore, or normalized data. (G) UMAP plots and violin plots, respectively, were used to show the expression levels of nCount-RNA, nFeature-RNA, G2/M.Score, and S. Score in each cell type and tissue origin. And ns represented difference not significant, *** represented p < 0.001, **** represented p < 0.0001.
3.2 Utilizing single cells for the purpose of analyzing tumor cells in ovarian cancer
We then utilized inferCNV to distinguish malignant TCs from EPCs due to the robust correlation between EPCs and ovarian cancer TCs (Supplementary Figure S1). We chose T cells and NK cells as reference cell types for the inferred CNV analysis based on their well-established role as non-malignant, genetically stable immune populations within the tumor microenvironment. These cells are not expected to harbor tumor-specific genomic alterations, making them appropriate baselines for distinguishing CNV signals that are characteristic of malignant cells. To distinguish various TCs subtypes, we down-clustered the 10,953 TCs identified according to the flag genes produced by the cells. The subtypes were subsequently assigned their corresponding genes: C0 TNFRSF18+ TCs, C1 DAPL1+ TCs, C2 SLC40A1+ TCs, C3 FN1+ TCs, C4 MEIS2+ TCs, and C5 CFAP126+ TCs (Figures 3A–C). C0 TNFRSF18+ TCs were found in all three tissues, C1 DAPL1+ TCs and C4 MEIS2+ TCs were more common in both normal and tumor tissues overall, and C2 SLC40A1+ TCs were most common in one of the tumor samples. The analysis found that the omental tissues were dominated by C3 FN1+ TCs (Figures 3D,E). The propensity of ovarian cancer cells to disseminate to the omentum and the incidence of intraperitoneal metastases are well recognized (Arie et al., 2013; Miyamoto et al., 2023). Furthermore, the omentum was among the initial sites where malignancies establish or disseminate into the peritoneal cavity, serving as a vital pre-metastatic environment for the progression of invasive disease (Etzerodt et al., 2020; Bella et al., 2022). A comparable study indicated that FN1, the gene associated with C3 FN1+ TCs, served as a marker correlated with unfavorable outcomes, while another investigation revealed its involvement in regulating the advancement of ovarian cancer (Wei et al., 2021; Meagher et al., 2022). The precise mechanism by which it led to ovarian cancer remained unidentified. The amplification of JUNB was associated with a worse outcome in ovarian cancer patients, while the gene MSLN, prevalent in C3 FN1+ TCs, was previously thought to have a role in the peritoneal dissemination of ovarian TCs (Hilliard, 2018; Perez-Benavente et al., 2022) (Figure 3F). These investigations further corroborated our previous hypotheses. Consequently, ovarian tumor cells were likely to establish the initial cluster of tumors in the omentum, which would then generate malignant cancer cells and ultimately result in ovarian cancer. Furthermore, we might deduce that C5 CFAP126+ TCs predominantly favored the G2/M phase, while C2 SLC40A1+ TCs exhibited a high preference for the S phase. We subsequently calculated the variances in nCount RNA, nFeature RNA, and CNV score expression levels among subtypes and tissue sources (Figure 3G). It would be beneficial for us to examine the pathways of the TCs from omental tissues to ovarian cancer tissues, as the three results exhibited notable discrepancies between ovarian cancer and omental tissues, highlighting significant heterogeneity between these two tissue types.
FIGURE 3

Single cell analysis in tumor cells (TCs). (A) six subtypes of TCs from ovarian cancer patients were displayed by UMAP plot. (B) The first five marker genes for different TCs subtypes were shown by the heatmap, with purple representing high expression. (C) The expression and distribution of the six TCs subtypes named genes were demonstrated by UMAP plot. (D) The proportion of TCs subtypes from each sample origin was displayed by bar graphs. (E) Ro/e score was used to estimate tissue origins (left) and cell phases (right) preference of different TCs subtypes. (F) Differential expression of the first five marker genes in the 6 TCs subtypes and in the three tissue origins were shown by bubble plot. Bubble colors are linked to normalised data (zscore). (G) Bar graphs displayed the expression levels of nCount-RNA, nFeature-RNA and CNVscore in each TCs subtype as well as tissue origin. And ns represents difference not significant, * represented p < 0.05, **** represented p < 0.0001.
3.3 Cellular stemness of CytoTRACE AUC score showed C3 FN1+ TCs hyperdifferentiation with high cellular stemness
Subsequently, to assess the malignancy level of the TCs in each subtype, we utilized CytoTRACE to gain an early insight into the differentiation extent of each subtype (Figures 4A–C). C2 SLC40A1+ TCs and C5 CFAP126+ TCs, characterized by a significant prevalence in ovarian cancer tissues, demonstrated a low degree of differentiation, suggesting a higher malignancy in these two subtypes of TCs. This was consistent with the tissue percentage and tissue preference of each subtype found in Figures 3D,E. We focused on C3 FN1+ TCs, which exhibited a relatively lower degree of malignancy, suggesting that they might still be in the growth and development phase rather than fully mature. This corroborated our previous hypothesis that malignant TCs linked to ovarian cancer may develop in the omentum. Bubble plots, which were displayed as violin plots and UMAP plots, showed that the stemness genes enriched to C3 FN1+ TCs were primarily BMI1, CTNNB1, KDM5B, and MYC (Figures 4D,E). Significant differences in expression levels were observed for these four genes between ovarian cancer and omental tissues. Expression levels were markedly elevated in ovarian cancer tissues compared to omental tissues, suggesting a potential role in facilitating the malignant proliferation of TCs within omental tissues. Previous studies have demonstrated that BMI1 promotes TCs growth and metastasis in ovarian cancer by altering TCs angiogenesis and extracellular matrix structure, primarily through the regulation of adhesion plaques and the PI3K/AKT signaling pathway (Zhao et al., 2018). The Wnt/β-catenin pathway, established by CTNNB1 encoding β-catenin, was a crucial signaling pathway implicated in the epithelial-mesenchymal transition (EMT) and has been shown to play a significant role in the carcinogenesis of ovarian cancer. (Arend et al., 2013). Ultimately, we evaluated the stemness of each subtype’s cells using AUC scoring, revealing that C3 FN1+ TCs obtained a high score, indicating their potential to promote the proliferation of malignant TCs (Figure 4F).
FIGURE 4

Cell stemness analysis of TCs subtypes. (A) The distribution of CytoTRACE values for TCs subtypes was shown by the left panel. Colors represented upper or lower cell stemness. And the spatial distribution of TCs subtypes was shown by the right panel. (B) The TCs subtypes were arranged based on the CytoTRACE prediction order and presented in boxline plots. (C) The genes associated with CytoTRACE were showed in bar graph, where greater than 0 is a positive association shown in red and less than 0 is a negative association shown in blue. (D) Bubble plot showed the expression levels of stemness genes in each TCs subtype and tissue origin. (E) Four stemness genes (BMI1, CTNNB1, KDM5B and MYC) expressed in each TCs subtype and tissue origin were presented in UMAP and violin plots. And ns represents difference not significant, * represented p < 0.05, **** represented p < 0.0001. (F) UMAP plot and bar graphs showed the AUC values and their distribution for cell stemness for each TCs subtype and tissue origin. And ns represents difference not significant, * represented p < 0.05, **** represented p < 0.0001.
3.4 C3 FN1+ TCs were found at an early stage of tumor formation
We employed the Monocle and SlingShot methodologies for trajectory inference to examine the sequence of developmental trajectories of TCs subtypes. We initially constructed a graph depicting the differentiation trajectory of pseudotime utilizing Monocle (Figure 5A). C0 TNFRSF18+ TCs, C4 MEIS2+ TCs, and C5 CFAP126+ TCs were distributed at all developmental stages, whereas C1 DAPL1+ TCs was primarily disseminated in the latter stages of development, according to a comparison of the subtypes’ differentiation trajectories using Figure 5B. On the other hand, C3 FN1+ TCs essentially did not go beyond node 1, while C2 SLC40A1+ TCs and C3 FN1+ TCs were primarily seen in the early phases of tumor development. Figure 5C illustrated the differentiation trajectories from various tissue origins. The differentiation trajectory of TCs was divided into seven phases, with findings indicating that the highest proportion of C3 FN1+ TCs, the earliest subtype in development, was observed in stage 1 (Figure 5D). The violin plots illustrating the developmental sequence indicated that omental tissues developed prior to ovarian cancer tissues, exhibiting a statistically significant difference, with C3 FN1+ TCs identified as the earliest subtype of TCs (Figures 5E,F).
FIGURE 5
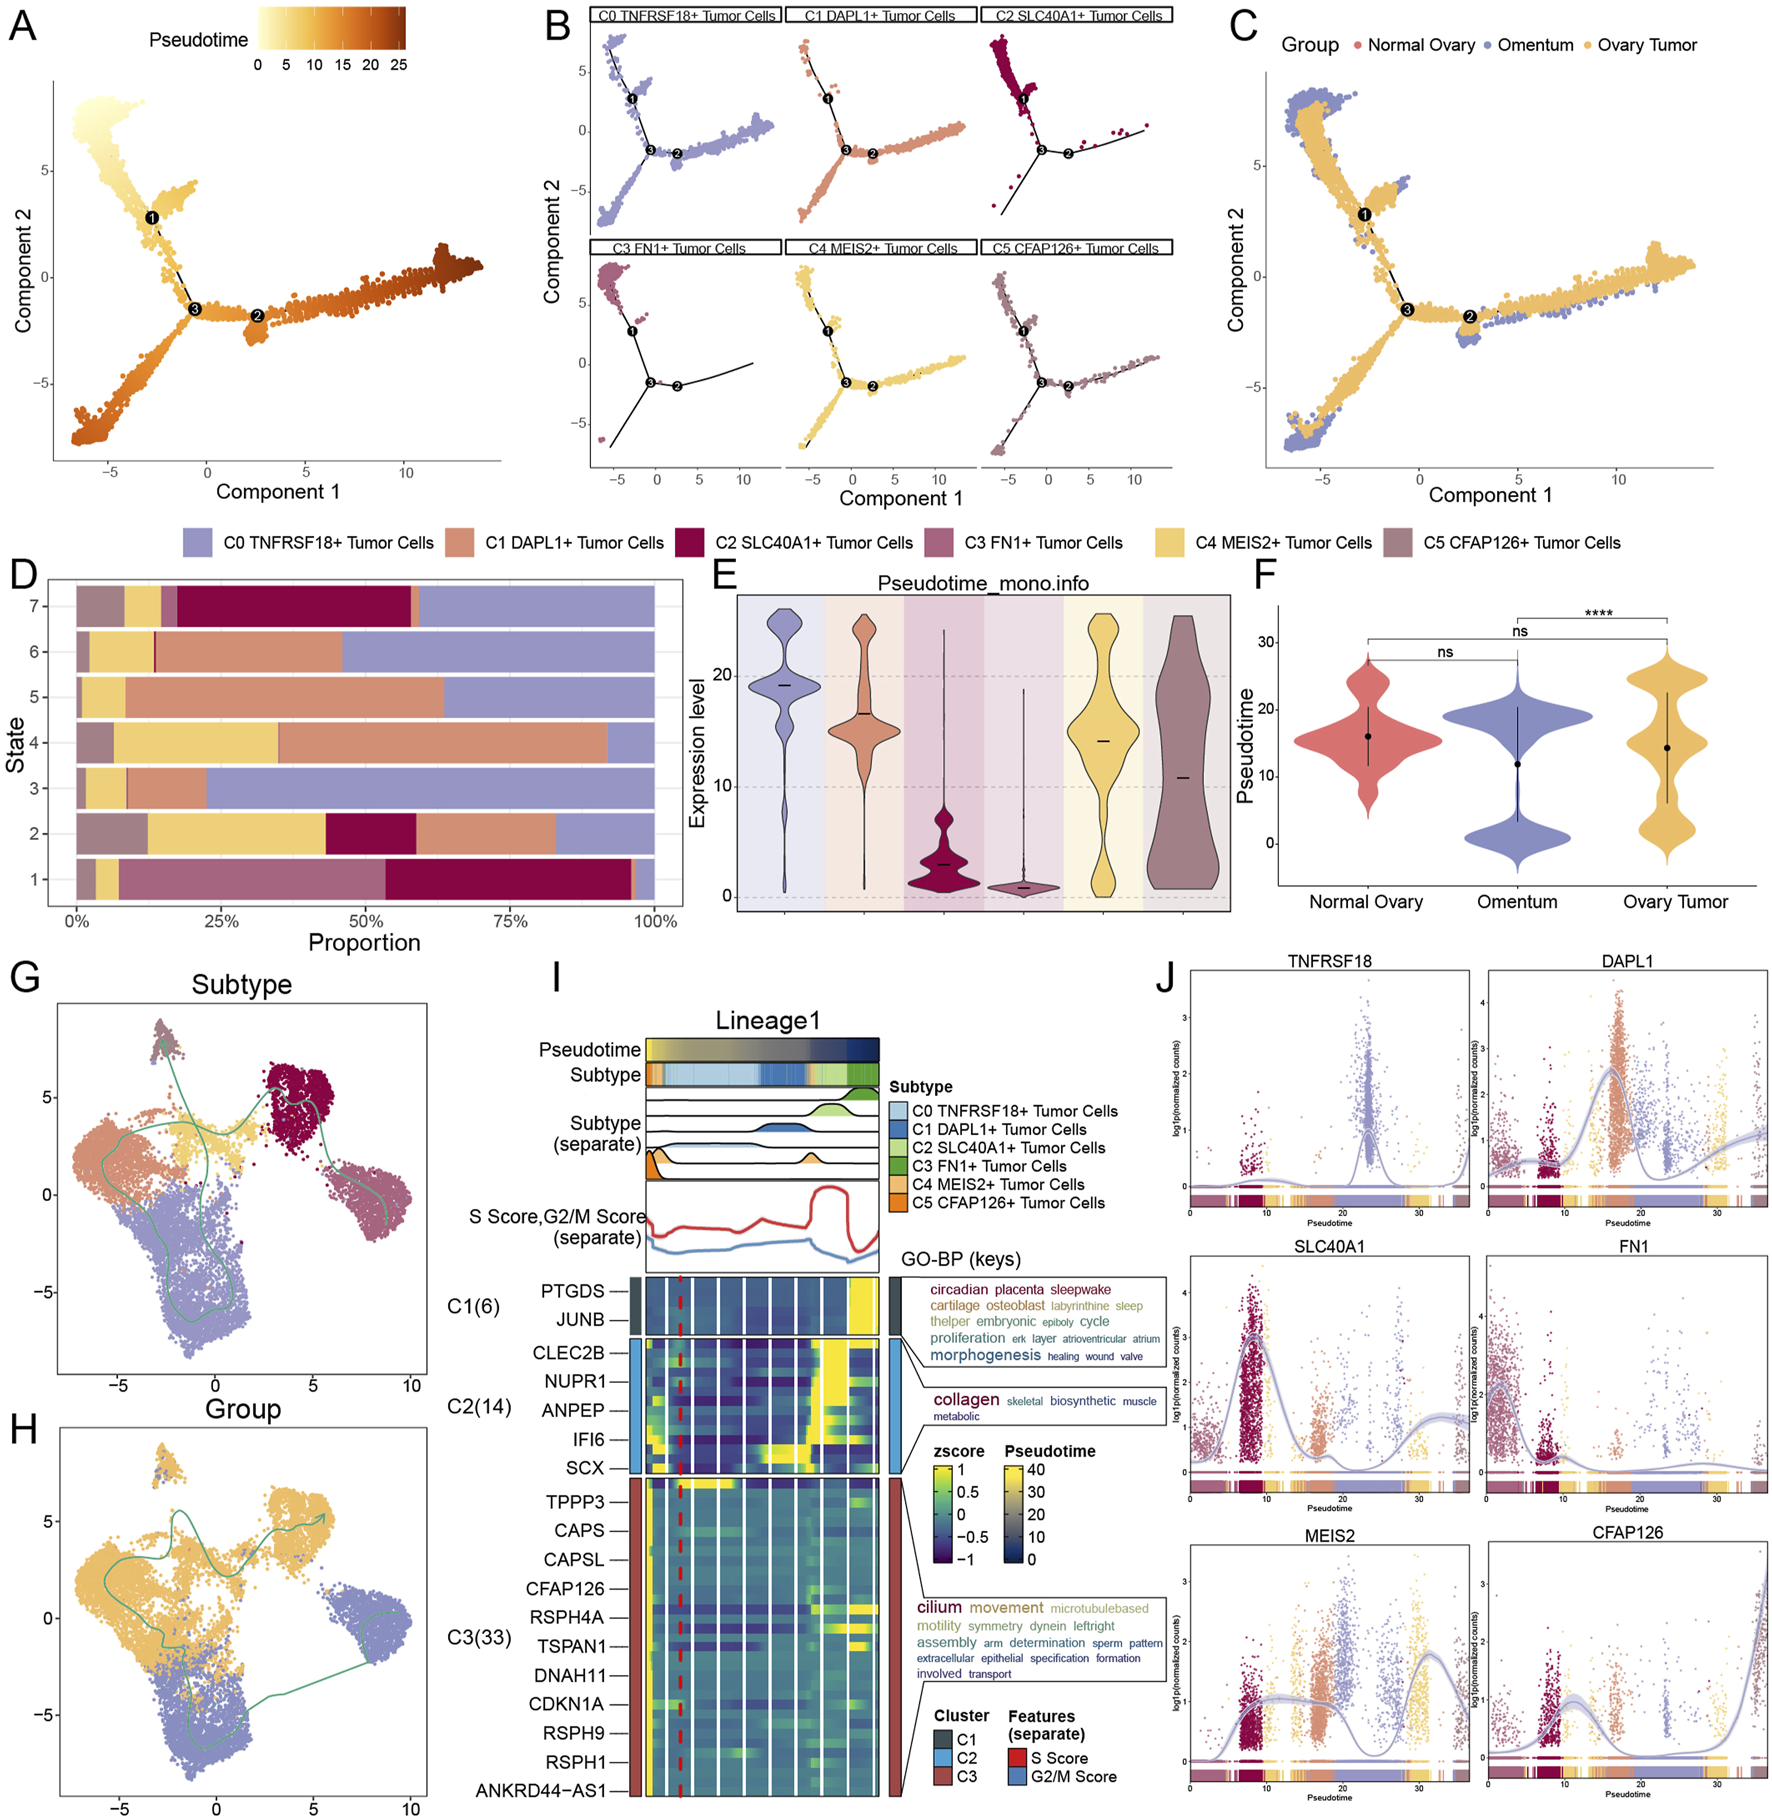
Prediction of developmental differentiation trajectories in TCs. (A–C) Monocle 2-predicted trajectories of TCs differentiation were displayed by pseudotime trajectory plots, which showed the distribution of Monocle-predicted pseudotemporal order (A), subtypes (B) and tissue origins (C), respectively. (D) Considering the proportion of TCs subtypes at each of the seven time points, the order was ranked according to the pseudotemporal state. (E and F) Pseudotime order expression of each TCs subtype (E) and tissue origin (F) was shown by violin plots, with lower expression levels representing a more advanced order of expression. And ns represents difference not significant, **** represented p < 0.0001. (G and H) Differentiation trajectories’ distribution of six TCs subtypes (G) and tissue origins (H) simulated with the pseudotemporal order in TCs. (I) Heatmap showed the correlation features of the pseudotime trajectory system of TCs. Pseudotime values are linked to differentiation, with 0 indicating the beginning point and 40 indicating the ending point. (J) The trajectories of the named genes for the six TCs subtypes, showing changes along the lineage, were demonstrated by the dynamic trends plots obtained after SlingShot visualization.
To further elucidate trajectories among all TC subtypes and tissues, we subsequently employed SlingShot analysis. As the diverse tissues advanced in the sequence of omental-ovarian cancer, with minimal involvement from normal tissues in the developmental process, the distinct subtypes evolved and differentiated in the subsequent order: C3 FN1+ TCs, C2 SLC40A1+ TCs, C1 DAPL1+ TCs, C0 TNFRSF18+ TCs, C4 MEIS2+ TCs, and C5 CFAP126+ TCs (Figures 5G,H). The results of SlingShot’s analysis aligned with Monocle’s findings, indicating that omental tissue and C3 FN1+ TCs subtypes were likely origins of ovarian cancer formation. Examining the role of C3 FN1+ TCs in the malignant proliferation of TCs within omental tissue, leading to carcinogenesis, might provide new insights for targeted therapies in ovarian cancer. The functional processes associated with the lineage trajectory of TCs subtypes were subsequently determined using GO-BP enrichment analyses (Figure 5I). Lastly, the dynamic trend diagrams were used to illustrate the distribution and variations in expression of specific genes across TCs subtypes in pseudotime (Figure 5J). The initial high expression of FN1, the gene that wass named for C3 FN1+ TCs, and the subsequent low level of fluctuation state following an abrupt decline piqued our interest. This illustrated the importance of C3 FN1+ TCs being highly active during the initial stages.
3.5 The C3 FN1+ TCs subtype promoted the development of malignant TCs through various mechanisms
We performed enrichment pathway analyses to examine the role of C3 FN1+ TCs in tumor regeneration and to understand the specific functional activities of these cells during early developmental stages. It was intriguing to observe that the pathway identified by GO-BP enrichment analysis of C3 FN1+ TCs was cytoplasmic translation, a mechanism that was closely associated with TCs proliferation (Figures 6A,D). Furthermore, prior research has shown that protein translation promoted the growth of ovarian cancer tumors, a mechanism that was similar to the one we have identified (Guo et al., 2019). Moreover, the KEGG enrichment analysis was used to identify the critical pathways for C3 FN1+ TCs, including ribosome, allograft rejection, and type I diabetes mellitus. It was intriguing to observe that we collected research that established type I diabetes mellitus as a risk factor for cancer and that individuals with this condition were more likely to develop ovarian cancer (Swerdlow et al., 2023; Suh and Kim, 2019). Utilizing the word cloud, we identified morphogenesis as the most relevant pathway associated with C3 FN1+ TCs, indicating its involvement in the early development of ovarian cancer (Figure 6B). The hypothesis was validated through a review of relevant literature, which revealed that multiple genes associated with tissue and cellular morphogenesis play a role in the development of ovarian cancer (Shi-Peng et al., 2017; Chen et al., 2021). GSEA has identified enriched activities including the development of epithelium, cell differentiation, positive regulation of developmental processes, cell adhesion, morphogenesis of animal organs, and growth factor response (Figure 6C). The cancer cells from the omentum spread and adhered to the ovary, leading to the development of ovarian carcinoma and morphological changes in the ovary. Additionally, the epithelial cells in C3 FN1+ TCs experienced mutations during development to form TCs, which subsequently responded to growth factors, proliferated, and differentiated, ultimately resulting in the formation of malignant proliferating cells. Finally, we identified upregulated and downregulated pathways in C3 FN1+ TCs through GSEA once again (Figure 6E). The pathway was enhanced in response to antigen processing, peptide antigen presentation, and epidermal growth factor. Epidermal growth factor has been demonstrated to enhance ovarian epithelial cell proliferation, facilitate EMT, elevate cancer cell invasiveness and drug resistance, and negatively impact patient differentiation and prognosis (Rodriguez et al., 1991; Grassi et al., 2017; Oh et al., 2014).
FIGURE 6
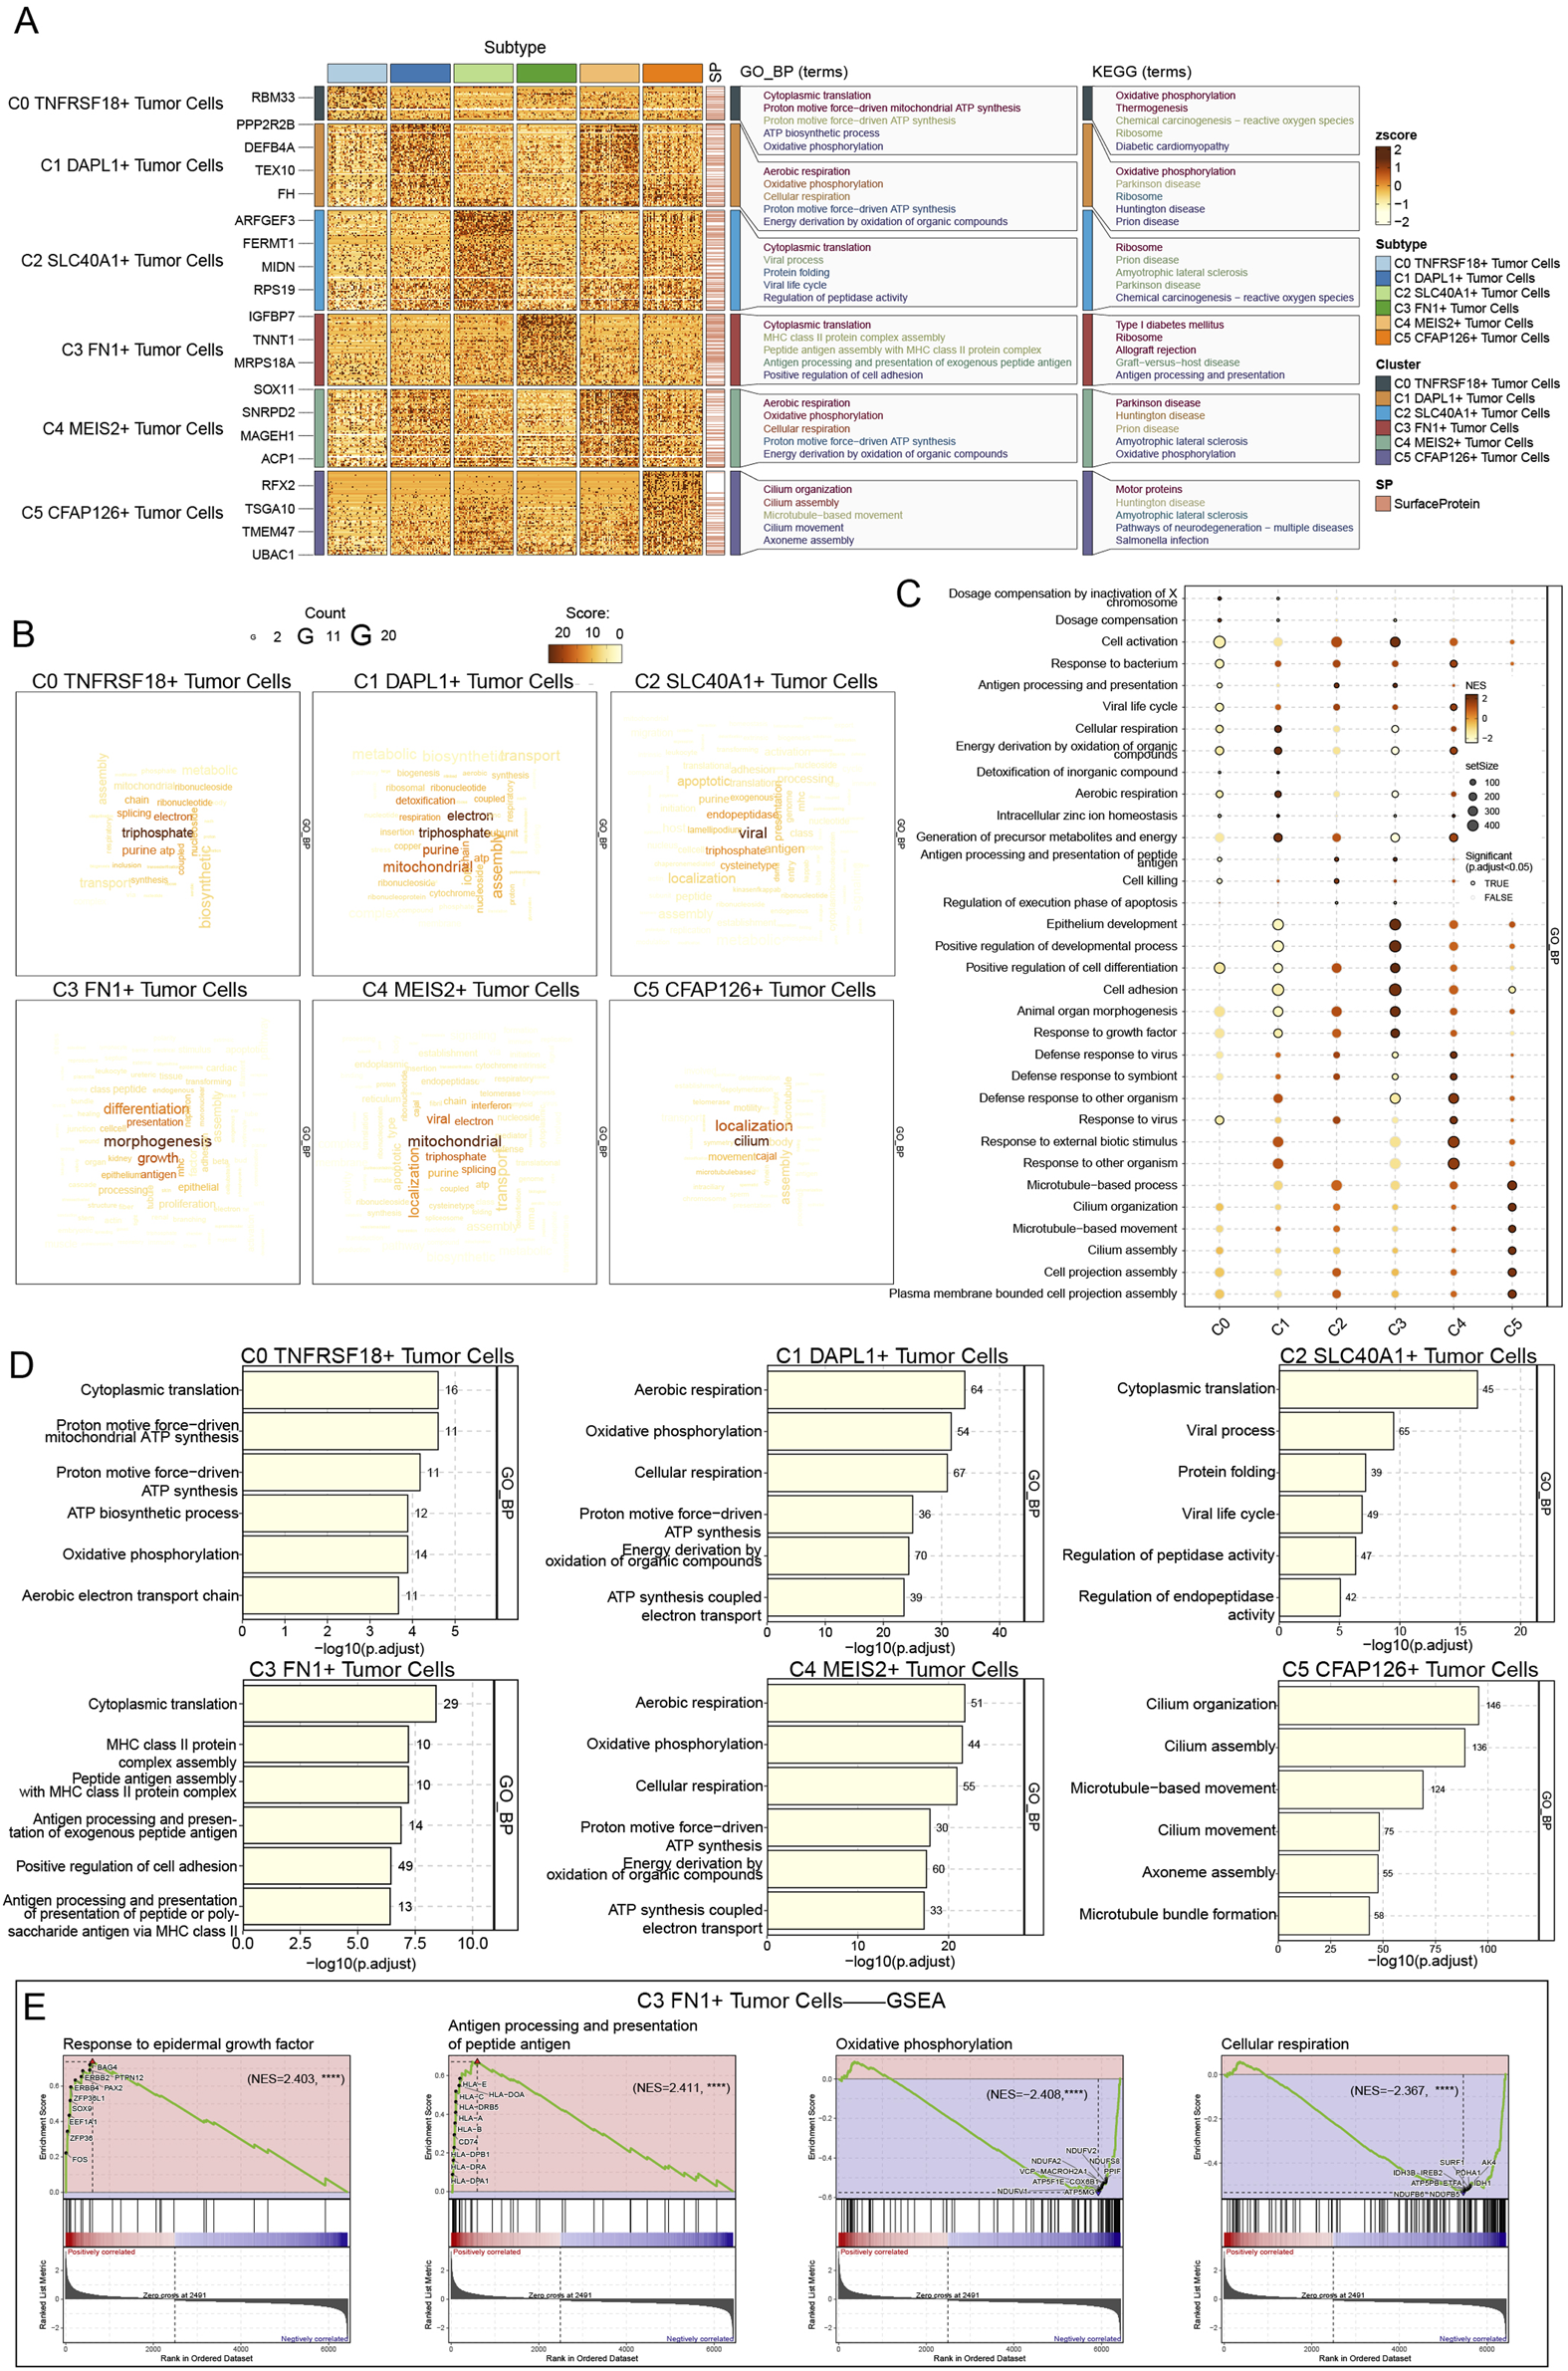
Enrichment analysis of TCs for genes and pathways. (A) The GO-BP and KEGG enrichment term scores were displayed by heatmap. (B) The activity of different pathways in TCs subtypes was demonstrated by the word cloud diagrams. (C) GSEA analysis map depicting various pathways in each TCs subtype was generated. (D) The bar graphs revealed the GO-BP results for each TCs subtype separately. (E) GSEA results among C3 FN1+ TCs.
3.6 The role of C3 FN1+ TCs subtypes in the development of ovarian cancer through the M2 regulatory factor module
We employed pyscenic to examine the gene regulatory architecture of C3 FN1+ TCs to understand the influence of TFs on cellular activities. A preliminary categorization of all TCs based on regulatory activity was conducted initially (Figure 7A). The UMAP plot derived from the activities of the TFs exhibited reduced discretization, as indicated by the clustering results, thereby excluding confounding variables. The C3 FN1+ TCs exhibited limited discretization and were predominantly located on the right side of the figure. Based on the CSI, we divided the TF subtypes into two regulatory factor modules, M1 and M2, in order to see the correlation between them (Figure 7B). Each of these two regulatory factor modules gathered TFs that might potentially work together to regulate genes. In the M2 regulatory module, we could observe that C3 FN1+ TCs had the greatest regulon activity score (Figure 7C). As a result, the primary regulators of the transcription carried out by C3 FN1+ TCs were also the regulatory factors grouped in M2. ATF3, CEBPB, NR2F1, JUND, and YY1 were the five main regulators in C3 FN1+ TCs, as shown in Figures 7D–F. We demonstrated the distribution of these five regulators on UMAP and the expression of each in the various TCs subtypes (Figures 7G–L). Almost all five regulators exhibited low expression in other TCs subtypes while demonstrating high expression in C3 FN1+ TCs, suggesting a specialized expression pattern. Research indicated that cells from recurrent solid tumors demonstrated increased expression of ATF3, implying its role in promoting ovarian cancer aggressiveness, treatment resistance, and recurrence (Bopple et al., 2024). Furthermore, elevated JUNB levels have been shown to enhance tumor growth and metastasis in mice by altering the TGF-β2-stimulated response from an antiproliferative to a pro-invasive one. Additionally, tumor genomic data suggest that JUNB amplification correlates with poor prognosis in ovarian cancer patients (Perez-Benavente et al., 2022). The most notable finding was that NR2F1, absent in nearly all other subtypes, regulated the TGF-β1-driven EMT, influencing immunological response and platinum sensitivity (Liang et al., 2022). In a nutshell, TF analyses suggested that C3 FN1+ TCs played a promoting role in ovarian carcinogenesis and were associated with poor prognosis.
FIGURE 7
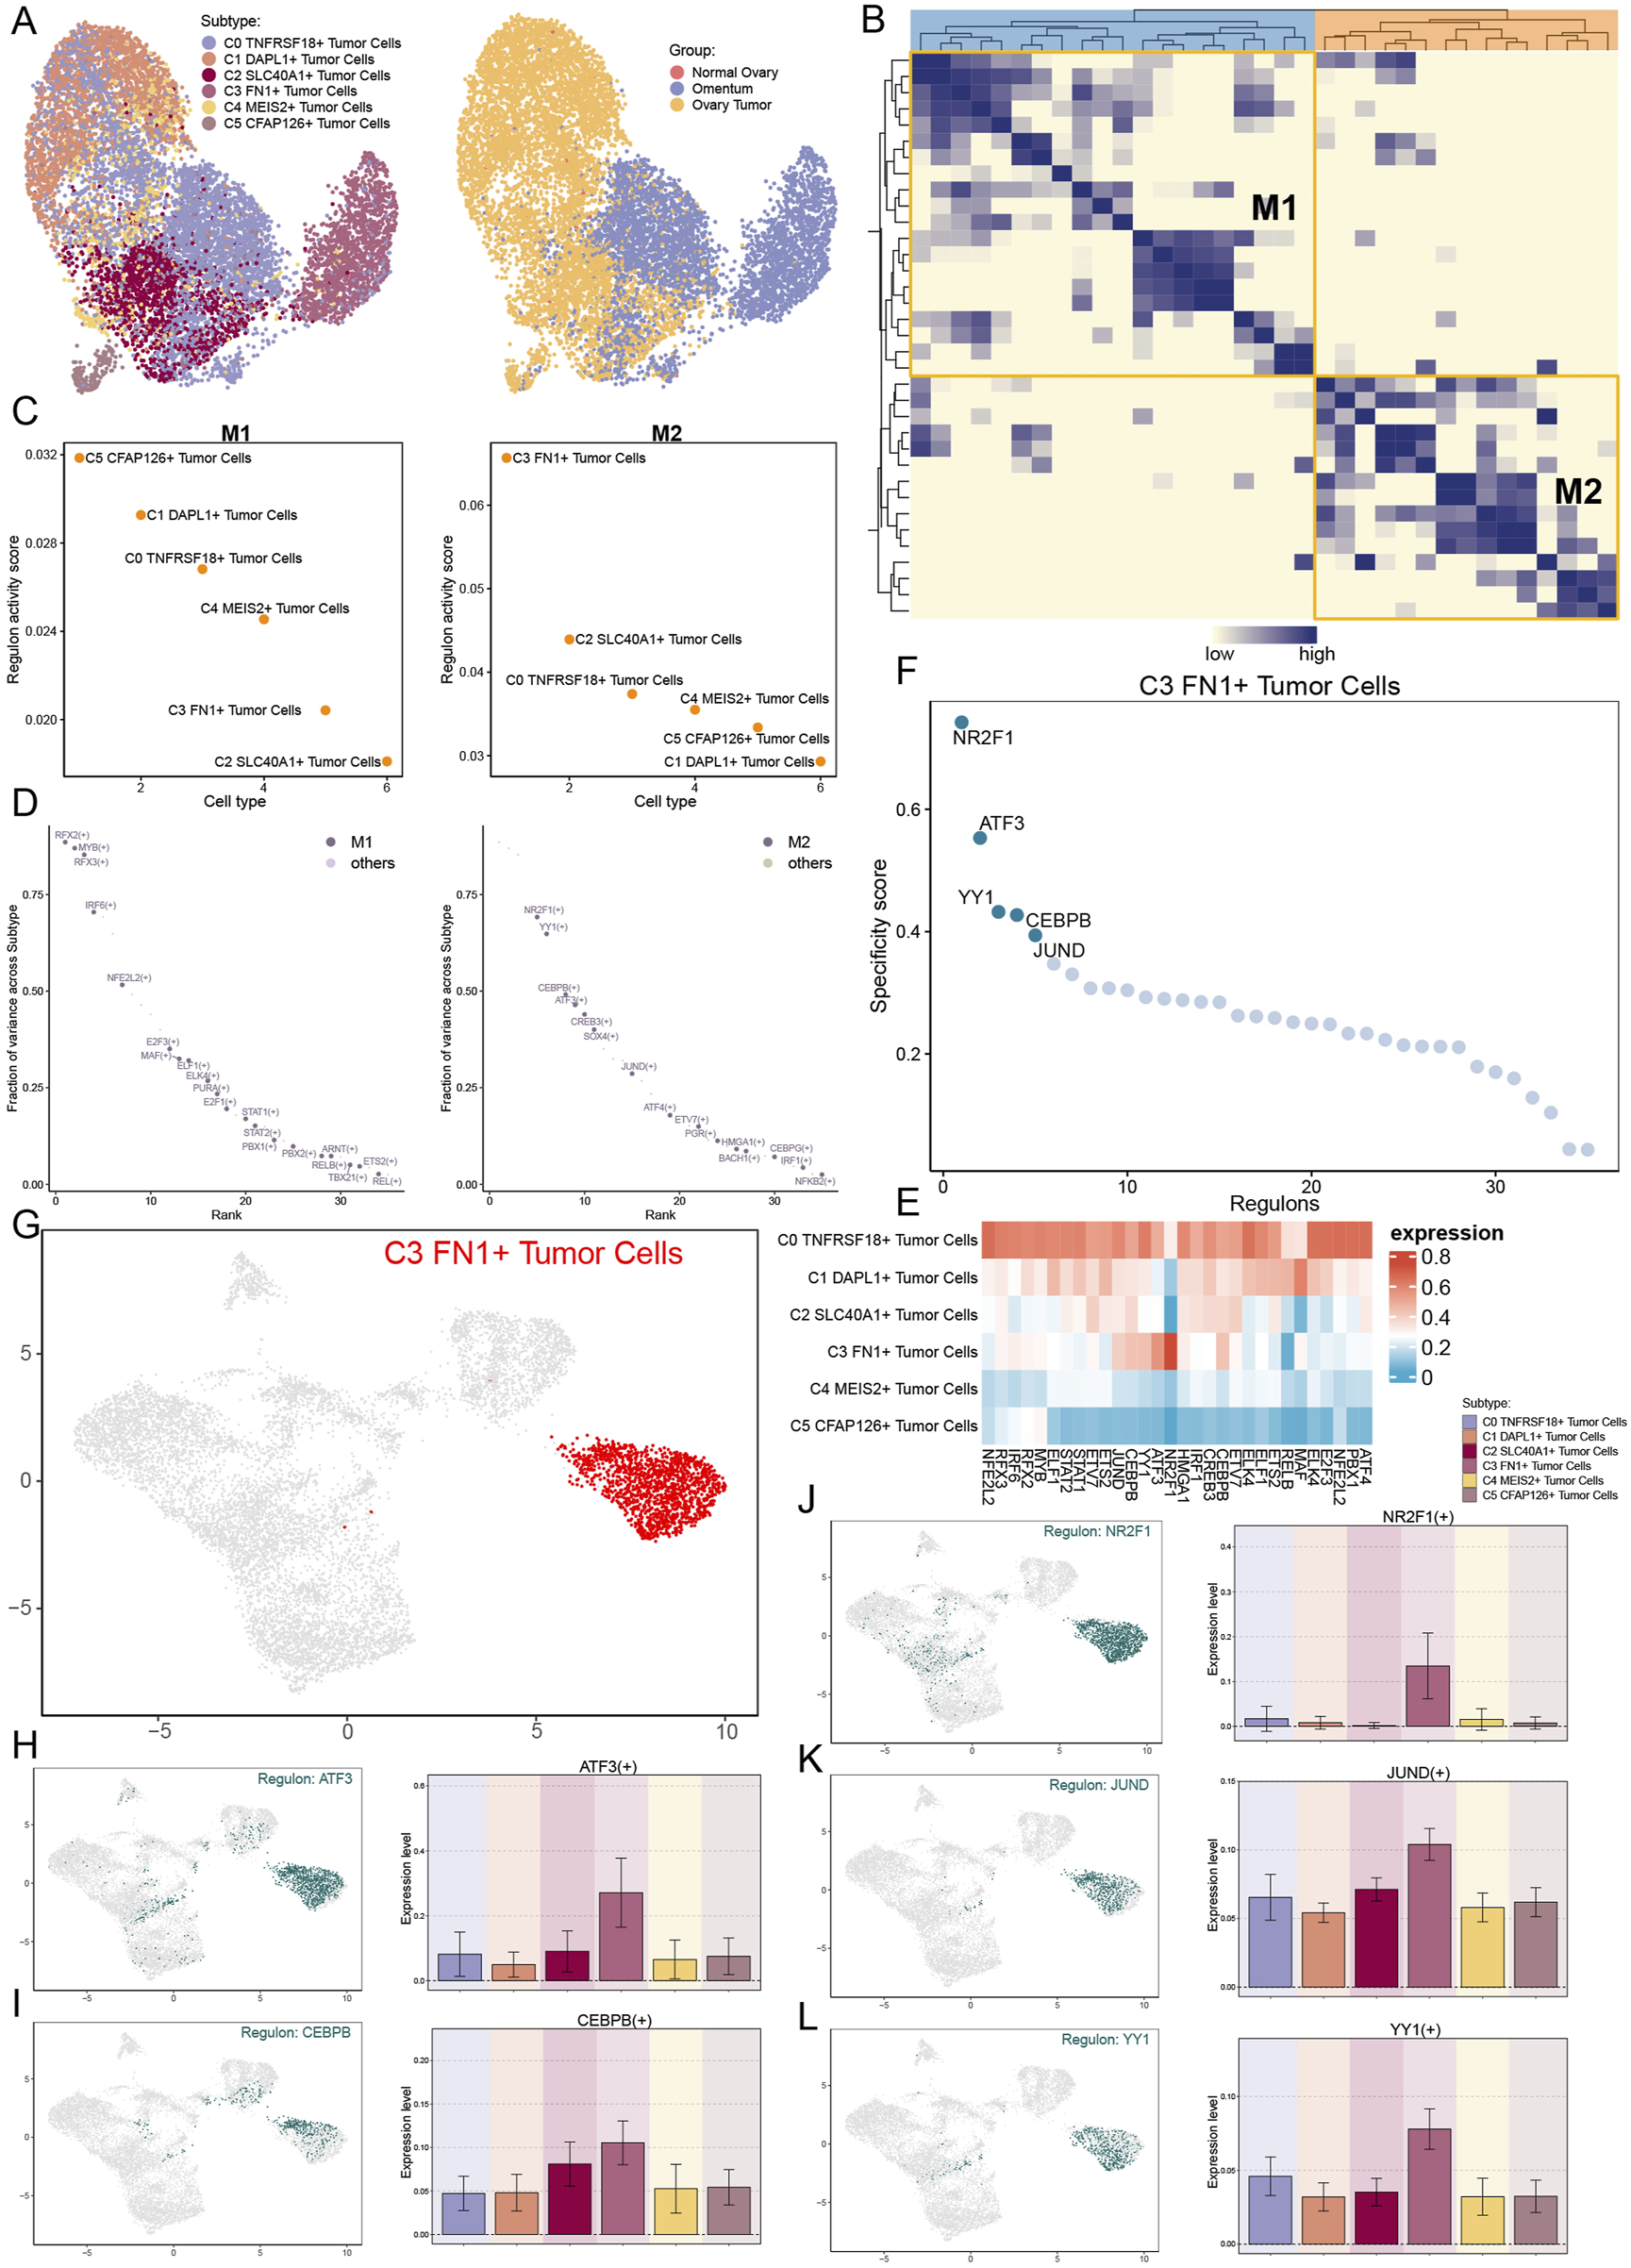
Analysis of upstream transcript levels for TCs. (A) UMAP plots of all TCs were visualised according to regulator activity. (B) Based on regulon connection specificity index matrix, regulon modules were identified. (C) Regulon activity scores of different TCs subtypes in regulatory modules M1 and M2. (D) Expression ranking of regulatory modules M1 and M2 related genes in all TCs. (E) The heatmap illustrated the expression of the regulators in each TCs subtype, with red indicating higher expression and blue indicating lower expression. (F and G) Regulated genes highly expressed in the C3 FN1+ TCs subtype and their expression distribution in UMAP. (H–L) The expression of the five highly expressed genes (ATF3, CEBPB, NR2F1, JUND and YY1) in the C3 FN1+ TCs subtype and their distribution were shown separately.
3.7 An examination of the global communication of cells diagnosed with ovarian cancer
For the purpose of defining and comprehending complex biological interactions, we conducted research on communication webs between ligands and receptors as well as intercellular linkages. Using CellChat analysis, we initially reported the intercellular communication webs that were present in ovarian cancer, which included a large number of cell types and a variety of TCs subtypes (Figure 8A). Concurrently, utilizing the C3 FN1+ TCs subtype of interest as the originating cell, we established a communication network for it (Figure 8B). We observed a notable cellular association between proliferating cells and myeloid cells, as well as C3 FN1+ TCs cells. To understand the communication patterns in ovarian cancer, we analyzed the relationship between the populations of cells that released and received signaling molecules and the fundamental communication dynamics among the cells (Figure 8C). This discovery enabled us to identify three distinct patterns of incoming and outgoing signaling, together with the signaling molecules associated with each pattern. Subsequently, we employed heatmaps to illustrate the expression of numerous signaling molecules in both incoming and outgoing signaling pathways across different cell types and TCs subtype, respectively (Figure 8D). The efferent signaling pathway in C3 FN1+ TCs exhibited substantial expression of MIF, APP, FN1, AGRN, WNT, and NECTIN. Finally, we measured the ligand-receptor network to ascertain the exact outgoing and incoming cellular communication patterns relevant to the six TCs subtypes (Figure 8E). C3 FN1+ TCs predominantly accepted THBS, GRN, and EGF signaling molecules in incoming communication, while they primarily emitted COLLAGEN, FN1, and SEMA3 signaling molecules in outgoing communication. The focus of our investigation was the FN1 dominant signaling pathway. Additional research was required to comprehensively elucidate the impact of FN1 signaling molecules on ovarian cancer development.
FIGURE 8

Analysis of communication interactions of various cells in ovarian cancer. (A) The count (left) and weights (right) of cell interactions in ovarian cancer were demonstrated by circle plots. (B) The C3 FN1+ TCs subtype was taken as the sender and its interactions with the remaining cells were analysed. (C) Heatmap demonstrated pattern recognition of all-cell interactions. The outgoing (left) and incoming (right) plots showed three pattern recognition cases for incoming signals and three pattern recognition cases for outgoing signals. (D) Ligands and receptors linked to the outgoing and incoming signals of cell interactions was displayed by heatmap. (E) The secretory cell communication patterns among various cells of ovarian cancer were demonstrated by outgoing and incoming contribution bubble plots.
3.8 Further examination of the pro-cancer role of the FN1 signaling pathway
A circular diagram illustrated the intercellular communication framework, with FN1 serving as the signaling molecule. A hierarchical diagram was utilized to refine the specific intercellular connections between cells utilizing FN1 as the signaling molecule (Figures 9A,B). The findings indicated that C3 FN1+ TCs, fibroblasts, T/NK cells and myeloid cells exhibited significant signaling cross-talk, with FN1 serving as the secreted ligand. Subsequently, we elucidated the intercellular communication network of the FN1-CD44 signaling pathway and further identified the receptor CD44 (Figures 9C,D). Myeloid cells and T/NK cells were two examples of ligand-receiving target cells associated with both targeted therapy and ovarian cancer. Myeloid cells, encompassing monocytes, granulocytes, dendritic cells, and macrophages, constituted a significant proportion of the TME in cancer and were crucial in regulating tumor spread (van Vlerken-Ysla et al., 2023). The molecular pathways facilitating interaction between macrophages and disseminated cancer cells might serve as innovative targets for the prevention of metastasis and disease recurrence. It was exhilarating to observe that tissue-resident macrophages in the omentum have been empirically demonstrated to facilitate the metastatic dissemination of ovarian cancer in prior studies (Etzerodt et al., 2020; An and Yang, 2021; Jazwinska et al., 2023). Furthermore, immunotherapy aimed at T cells in ovarian cancer suggested that the advancement of ovarian cancer was affected by the interactions between T cells and cancer cells (Blanc-Durand et al., 2023; Nasiri et al., 2023). Using the centrality measure method, which assessed the relative importance of each cell type in this process, the cell types mediating and influencing FN1 signal-mediated intercellular communication were identified. Myeloid cells acted as receivers, mediators, and influencers within the FN1 signaling pathway, whereas C3 FN1+ TCs were significantly expressed as senders, as illustrated in Figure 9E. The heatmap again demonstrated the significant signaling interactions generated by fibroblasts and C3 FN1+ TCs functioning as secretory cells on myeloid cells (Figure 9F). The findings demonstrated that C3 FN1+ TCs and fibroblasts primarily utilized FN1 as a ligand to interact with myeloid cells, with CD44 serving as the receptor. Bubble and violin plots depicted cell-cell interactions among several ligands, with FN1 serving as the ligand (Figures 9G,H). These findings increased our interest in the study of FN1 as well as C3 TCs subtype even more, so we next analyzed them further in the context of the clinic through the ST.
FIGURE 9
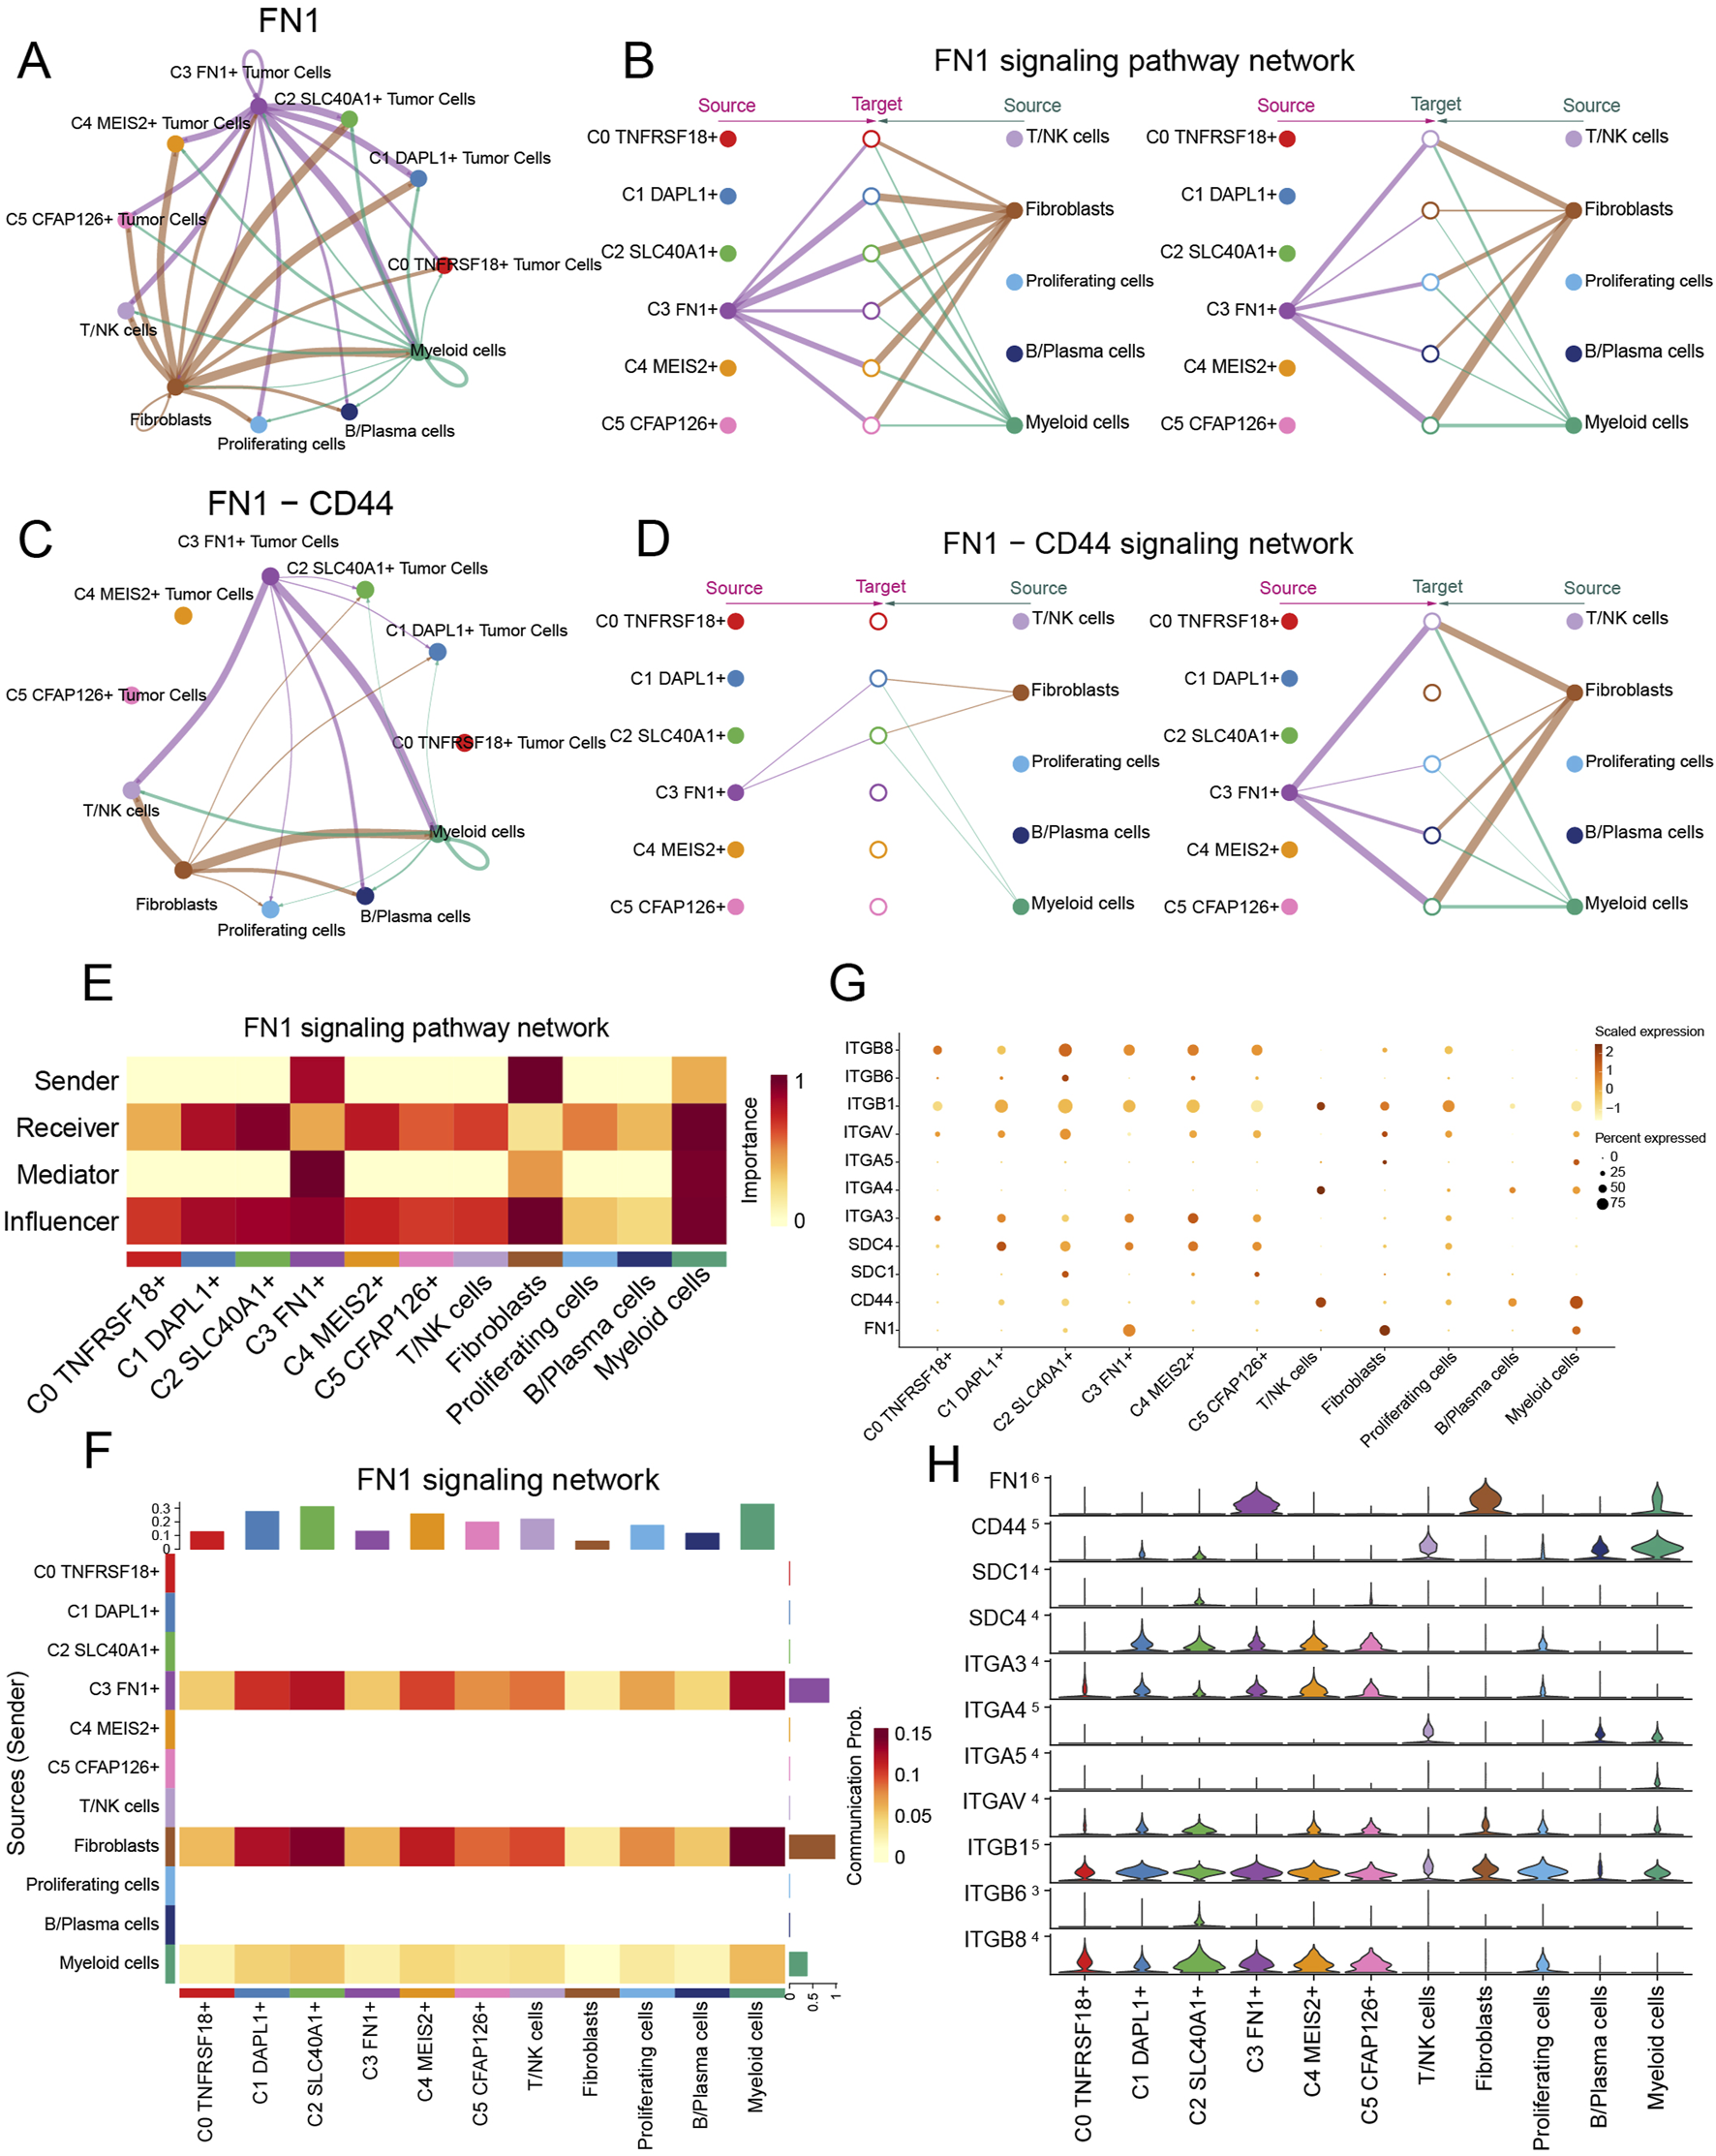
Visualization of the FN1 signaling pathway. (A–D) Circle and hierarchical diagrams depicted FN1 signaling (A and B) and the intercellular communication network of the FN1-CD44 signaling pathway (C and D). (E) The centrality score of the FN1 signaling pathway was demonstrated by heatmap. (F) The cell interactions of the FN1 signaling pathway were demonstrated by heatmap. (G and H) Bubble plots (G) and violin plots (H) revealed cell interactions in the FN1 signaling pathways.
3.9 Spatial transcription analysis elucidated the spatial distribution of C3 FN1+ TCs subtypes
We integrated scRNA-seq and spatial transcriptomics to elucidate the gene regulatory programs and cell-cell interactions that contribute to ovarian cancer development. Tissue sections were collected from an ovarian cancer patient, and ST data were processed (Figure 10A). We executed deconvolution with the RCTD approach to transfer cellular type labels from scRNA-seq data to ST data. Figure 10B presented the two examined outcomes. The C3 FN1+ TCs subtypes and EPCs were situated in the upper right quadrant of the slice, corresponding to the area identified as the tumor location in the tissue (Denisenko et al., 2024). Simultaneously, the locations of the C3 FN1+ TCs subtype and the C5 CFAP126+ TCs subtype corresponded to areas containing tumor tissue. Consequently, the data derived from ST indicated that the C3 FN1+ TCs subtype was indeed correlated with tumor formation in spatial locations. Subsequently, we illustrated the enrichment of spatial distributions for the C3 FN1+ TCs subtype, FN1, and myeloid cells. The findings indicated that the spatial locations of the C3 FN1+ TCs subtype and myeloid cells corresponded with the results derived from the RCTD, and that FN1 was also present in the vicinity of the C3 FN1+ TCs subtypes (Figure 10C). We utilized stLearn for extrapolation to further examine the cellular interactions at specific spatial areas. Our prior research of FN1-CD44 cell contacts in ovarian cancer demonstrated the expression of the receptor, ligand, and ligand-receptor in the corresponding sections (Figure 10D). The ligand FN1 was mostly expressed by the C3 FN1+ TCs subtype and fibroblasts, with the area of elevated expression aligning with the spatial distribution of these two cell types. The expression region of the receptor CD44 was situated between FN1, and there were areas within the tumor where both ligand-receptors were expressed. It was initially established that FN1 and CD44 interact through paracrine and proximal secretion mechanisms. Figure 10E illustrated a substantial quantity of cellular contacted in the area inhabited by fibroblasts, maybe linked to the preformation communication of the tumor. By evaluating the intensity of contacts across all areas in the tissue sections, we concluded that the intensity of cellular interactions was highest and statistically significant in the tumor region (Figure 10F). Our examination of the molecular and cytoarchitectural aspects of ovarian cancer corroborated the finding that the C3 FN1+ TCs subtype facilitated ovarian cancer via the FN1-CD44 signaling pathway, and that they were linked through a paracrine cell-cell communication network inside the ovarian cancer milieu.
FIGURE 10
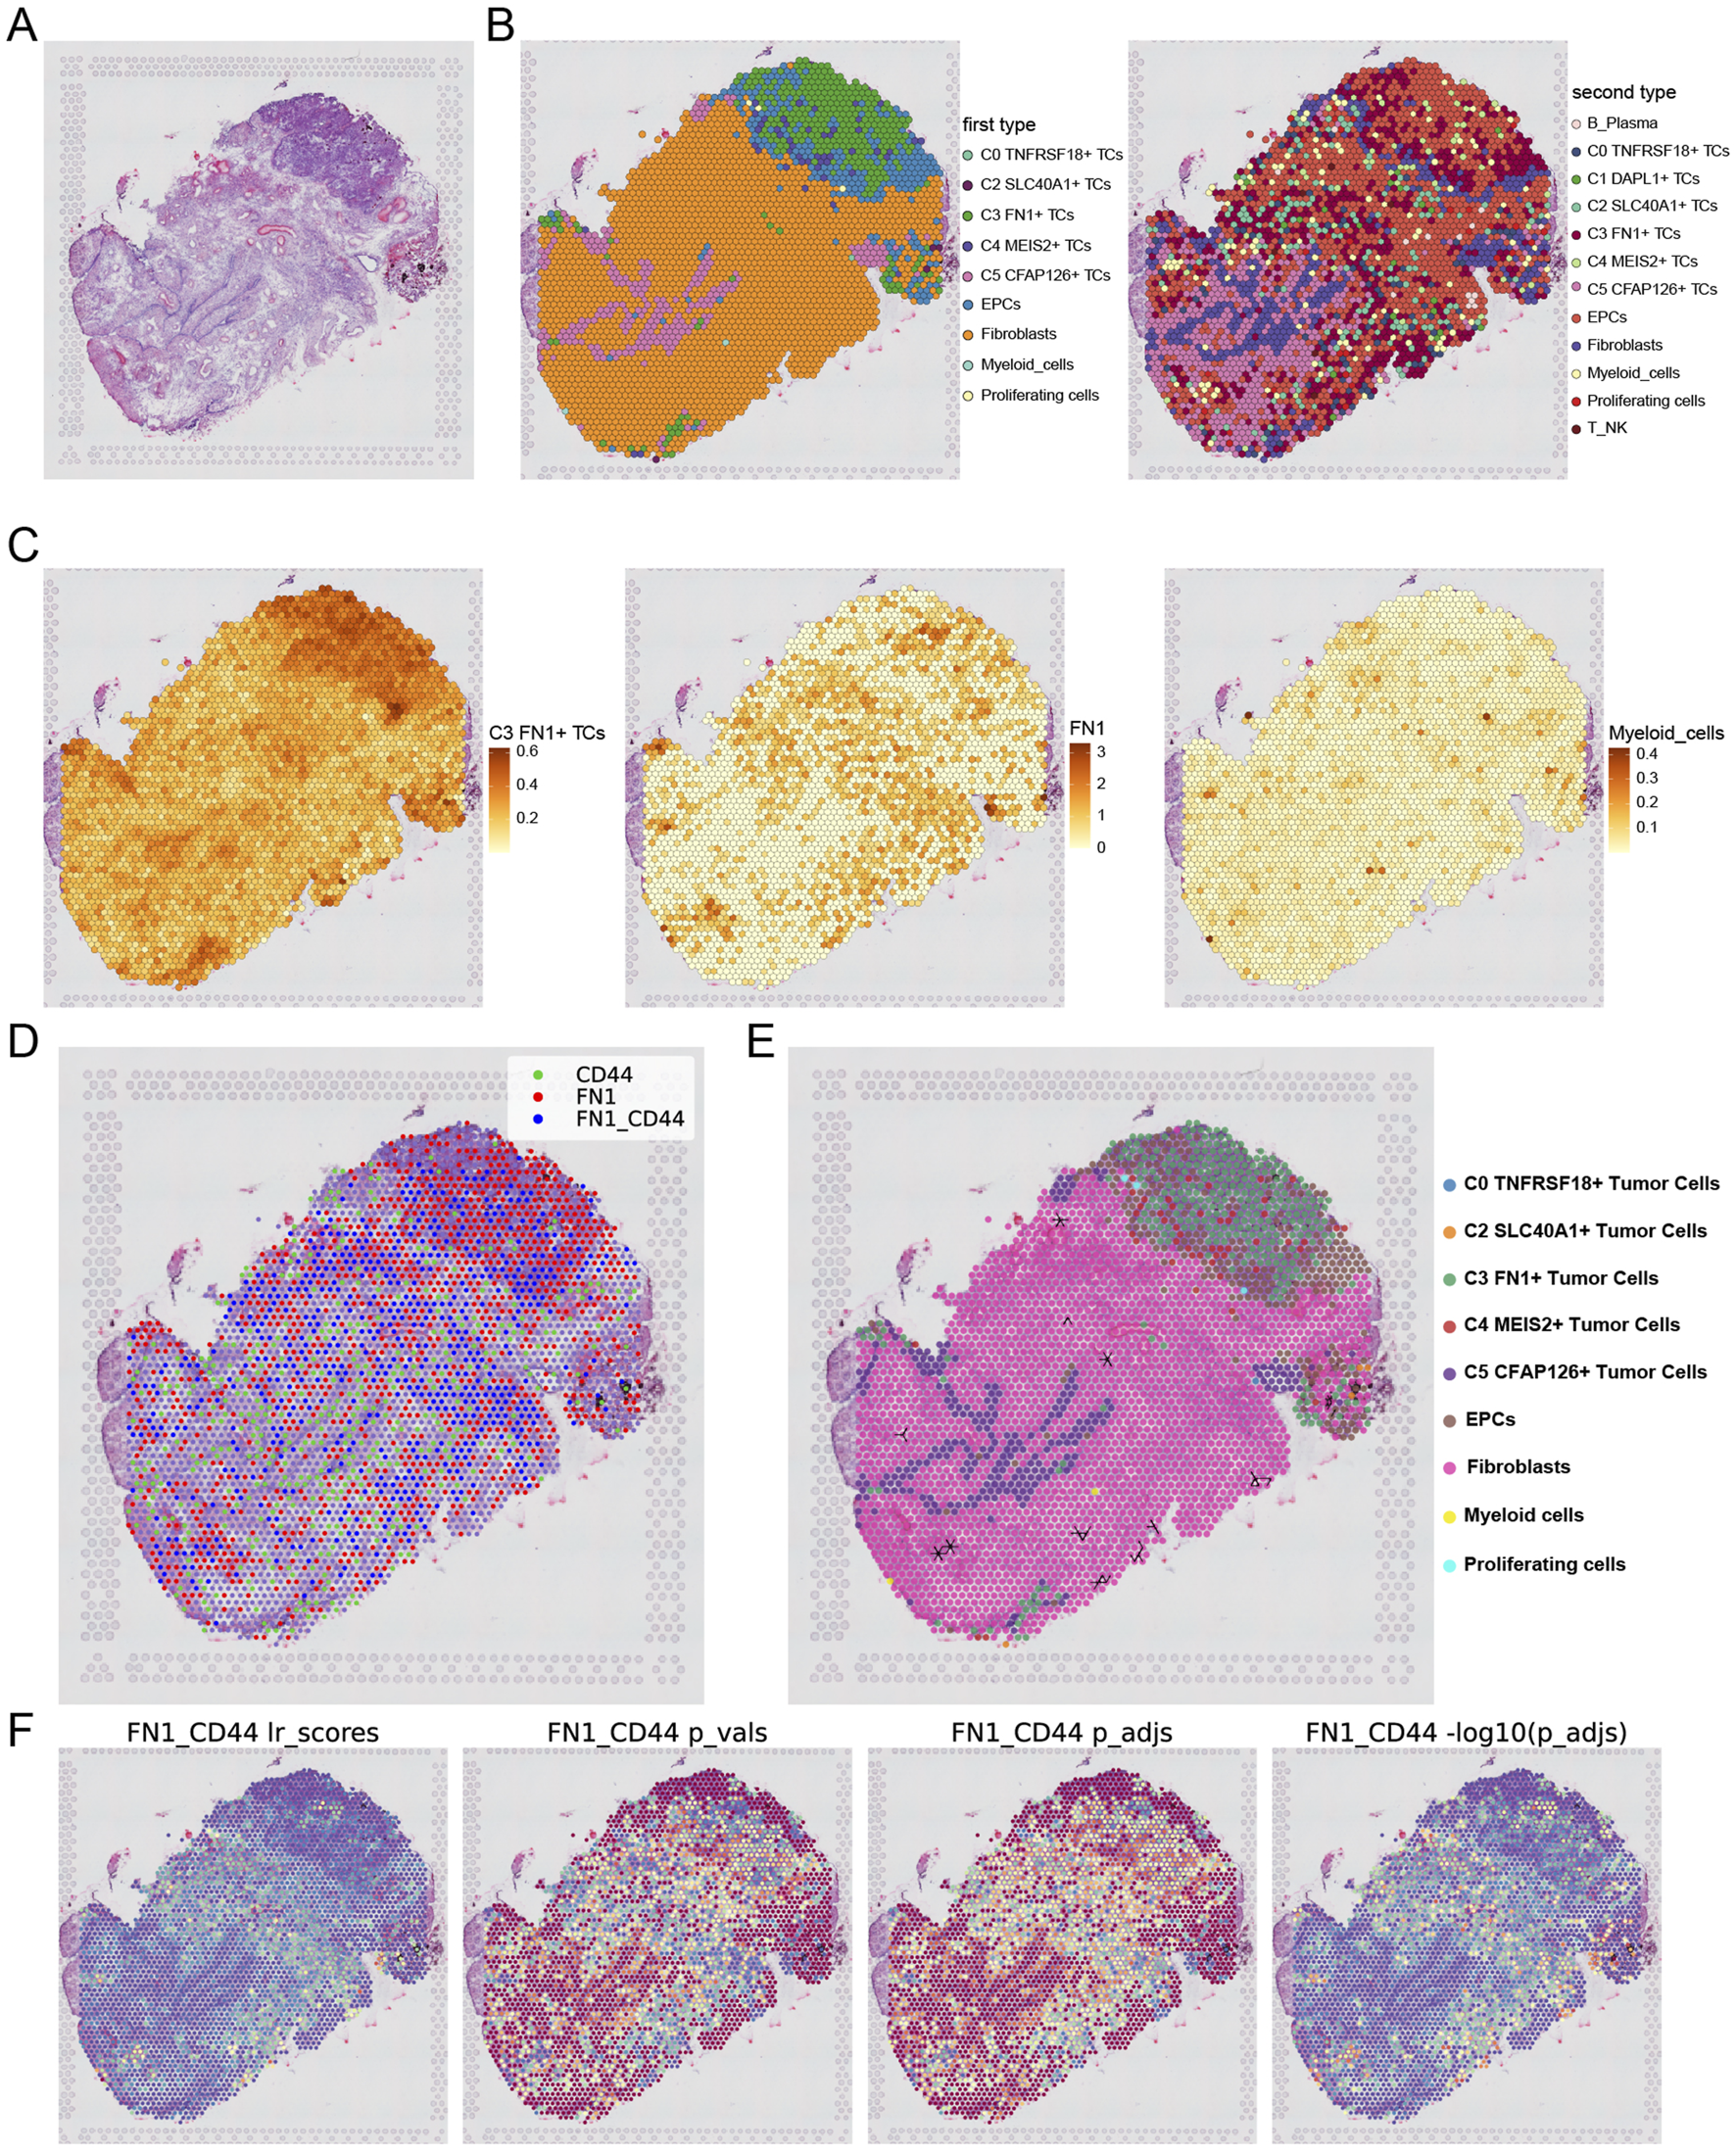
Analysis of spatial transcriptomics and cellular interactions. (A) Tissue section from a patient with ovarian cancer were shown. (B) Two results obtained by using RCTD for deconvolution. (C) The enrichment of the C3 and C5 subtypes as well as FN1 on the section was shown. (D) Spots were dichotomized as expressing ligand (red), expressing receptor (green), or both receptor and ligand (blue), with the criterion of whether the receptor expression was greater than the minimum expression threshold. (E) The direction indicated by the arrow indicated the FN1-CD44 cell interactions in section. (F) The statistical values of the FN1-CD44 interactions pairs in each spot were shown. lr_scores indicated the strength of the interactions in all spots and the p-values were shown. Darker colors indicated stronger communications.
3.10 Create pertinent prognostic models to confirm clinical viability
The prognosis of patients classified according to strong or weak FN1 expression was initially validated. The survival curves (Guan et al., 2023; Sun et al., 2022b) for the two groups exhibited significant differences, suggesting that FN1 could serve as a valuable prognostic indicator for ovarian cancer (Figure 11A). Subsequently, univariate Cox regression analysis identified 17 mRNAs as potential predictive characteristics derived from the top 100 marker mRNAs of C3 FN1+ TCs (Figure 11B). Of these, it was discovered that HMGN3 and CXCR4 were protective factors (HR <1), whereas the other mRNAs were risk factors (HR >1). LASSO and multivariate regression analysis were employed to address multicollinearity among the mRNAs, ultimately identifying 10 genes associated with prognosis (Figures 11C,D). Analysis of the coefficient values of these prognostic mRNAs revealed that all were classified as risk mRNAs, except for HMGN3 and CXCR4 (Figure 11E). The study involved two groups: high and low FTRS (FN1+ TCs Risk Score) groups, aimed at investigating the influence of FN1 high-expressing TCs on ovarian cancer patients, utilizing the 10 prognostic mRNAs identified from the TCGA cohort (Figures 11F–H). Furthermore, we confirmed that the model effectively predicted the OS C-index (Figure 11I). The model’s predictive accuracy was evidenced by the ROC curve (Figure 11J). The survival outcomes were notably poorer in the FTRS high-expression group, and there was significant variation in survival between groups categorized by FTRS (Figure 11K). We employed the ROC curve to evaluate the rigor of this prediction, and the findings demonstrated enhanced accuracy (Figure 11L). Furthermore, we illustrated the upregulation and downregulation of the initial 30 DEGs via volcano plots (Figure 11M). Subsequently, we examined the pertinent functional pathways with KEGG enrichment methodologies. The signaling pathways regulating stem cell pluripotency and receptor activation in chemical carcinogenesis were highlighted in KEGG (Figure 11N). Both pathways were associated with the initiation of ovarian carcinogenesis, corroborating our previous theories regarding the function of TCs that express FN1.
FIGURE 11

Construction of a risk score atlas for survival prognosis and enrichment pathway analysis in ovarian cancer. (A) Overall survival (OS) curves grouped by FN1 expression levels. (B) Forest plot of one-way cox regression analysis. (C) Values of the super-parameter λ were obtained by cross-validation using the minimum criterion in the LASSO-Cox model. The best lambda was used to generate a non-zero coefficient for the OS curve for the different scoring subgroups, where the optimal lambda yielded 10 non-zero coefficients. (D) Forest plot of multifactor Cox regression analysis. (E) The coefficient values of 10 mRNAs used for model building was showed by bar graph. (F–H) Risk profiles in the TCGA cohort. (I) The C-index of the AUC values for predicting 1-year, 3-year, and 5-year survival based on risk scores was depicted by the boxline plot. (J) The sensitivity and specificity of the risk scores for predicting 1-year, 3-year, and 5-year survival were depicted by the ROC curves. (K) OS curves for two scoring groups in a cohort. (L) The sensitivity and specificity of survival prediction for 1-year, 3-year, and 5-year survival were shown by the ROC curves. (M) Significantly DEGs were shown by the volcano plot. (N) The enrichment analysis results of differential genes in KEGG pathways for high and low FTRS groups were revealed by bar graphs.
3.11 An investigation on the immunological infiltration that occurred in ovarian cancer
The extent of immune infiltration in each group was assessed to comprehensively map immune cells in ovarian cancer. Figure 12A presented a thorough depiction of the distribution of 10 prognostically significant mRNAs and immune infiltration levels assessed by the three methodologies: ESTIMATE, CIBERSORT, and Xcell, illustrating the diverse immune infiltration statuses across different risk groups. The relative abundance of stromal and immune components within the tumor samples, enabling us to assess overall immune infiltration and stromal content differences between risk groups. The allocation of 22 immune cells across different risk categories was subsequently illustrated through a box line plot and heatmap utilizing the CIBERSORT tool (Figures 12B,C). Although M0 macrophages, M2 macrophages, and resting CD4 memory T cells constituted the predominant components of the immunological environment in ovarian cancer, the precise distinctions in distribution between the two groups could not be discerned. Subsequently, we illustrated the correlation between risk scores and 22 immune cell types within the tumor microenvironment of ovarian cancer (Figure 12D). The two primary risk factors were resting dendritic cells and active mast cells, whereas the two most effective protective variables were M1 macrophages and B cell memory. Subsequently, we employed a heatmap (Figure 12E) to analyze the correlations among diverse immune cells, eight risk genes, two protective genes (HMGN3 and CXCR4), risk scores, and prognosis. The risk scores corresponded with the findings of Figure 12D; however, we were focused on the contrasting results about the connection of M1 and M2 macrophages with overall survival (OS). Prognosis exhibited a positive correlation with M1 macrophages, whereas M2 macrophages demonstrated an inverse effect. M2 macrophages were associated with the risk factor TIMP3, while M1 macrophages were associated with the protective component CXCR4. Previous studies have also used TIMP3 to construct prognostic characteristics and risk stratification, and patients in the high-risk group had a poorer prognosis (Feng et al., 2022). Subsequently, to more effectively analyze the disparities in immune cell expression between the two risk groups, we conducted additional screening for immune cells that were more representative of the ovarian cancer tumor microenvironment (Figures 12F,G). A selection of six representative immune cells was made. It was noteworthy that immune cells positively correlated with risk scores were significantly expressed in the high group, while the low group demonstrated elevated expression of immune cells negatively correlated. Our primary emphasis was macrophages, revealing that M1 macrophages, favorably correlated with prognosis and negatively correlated with risk score, had substantially high expression in the elevated group. This indicated that M1 macrophages served as a protective immune cell type within the ovarian cancer TME. The literature also documented its cancer-inhibiting properties (Gunassekaran et al., 2021).
FIGURE 12
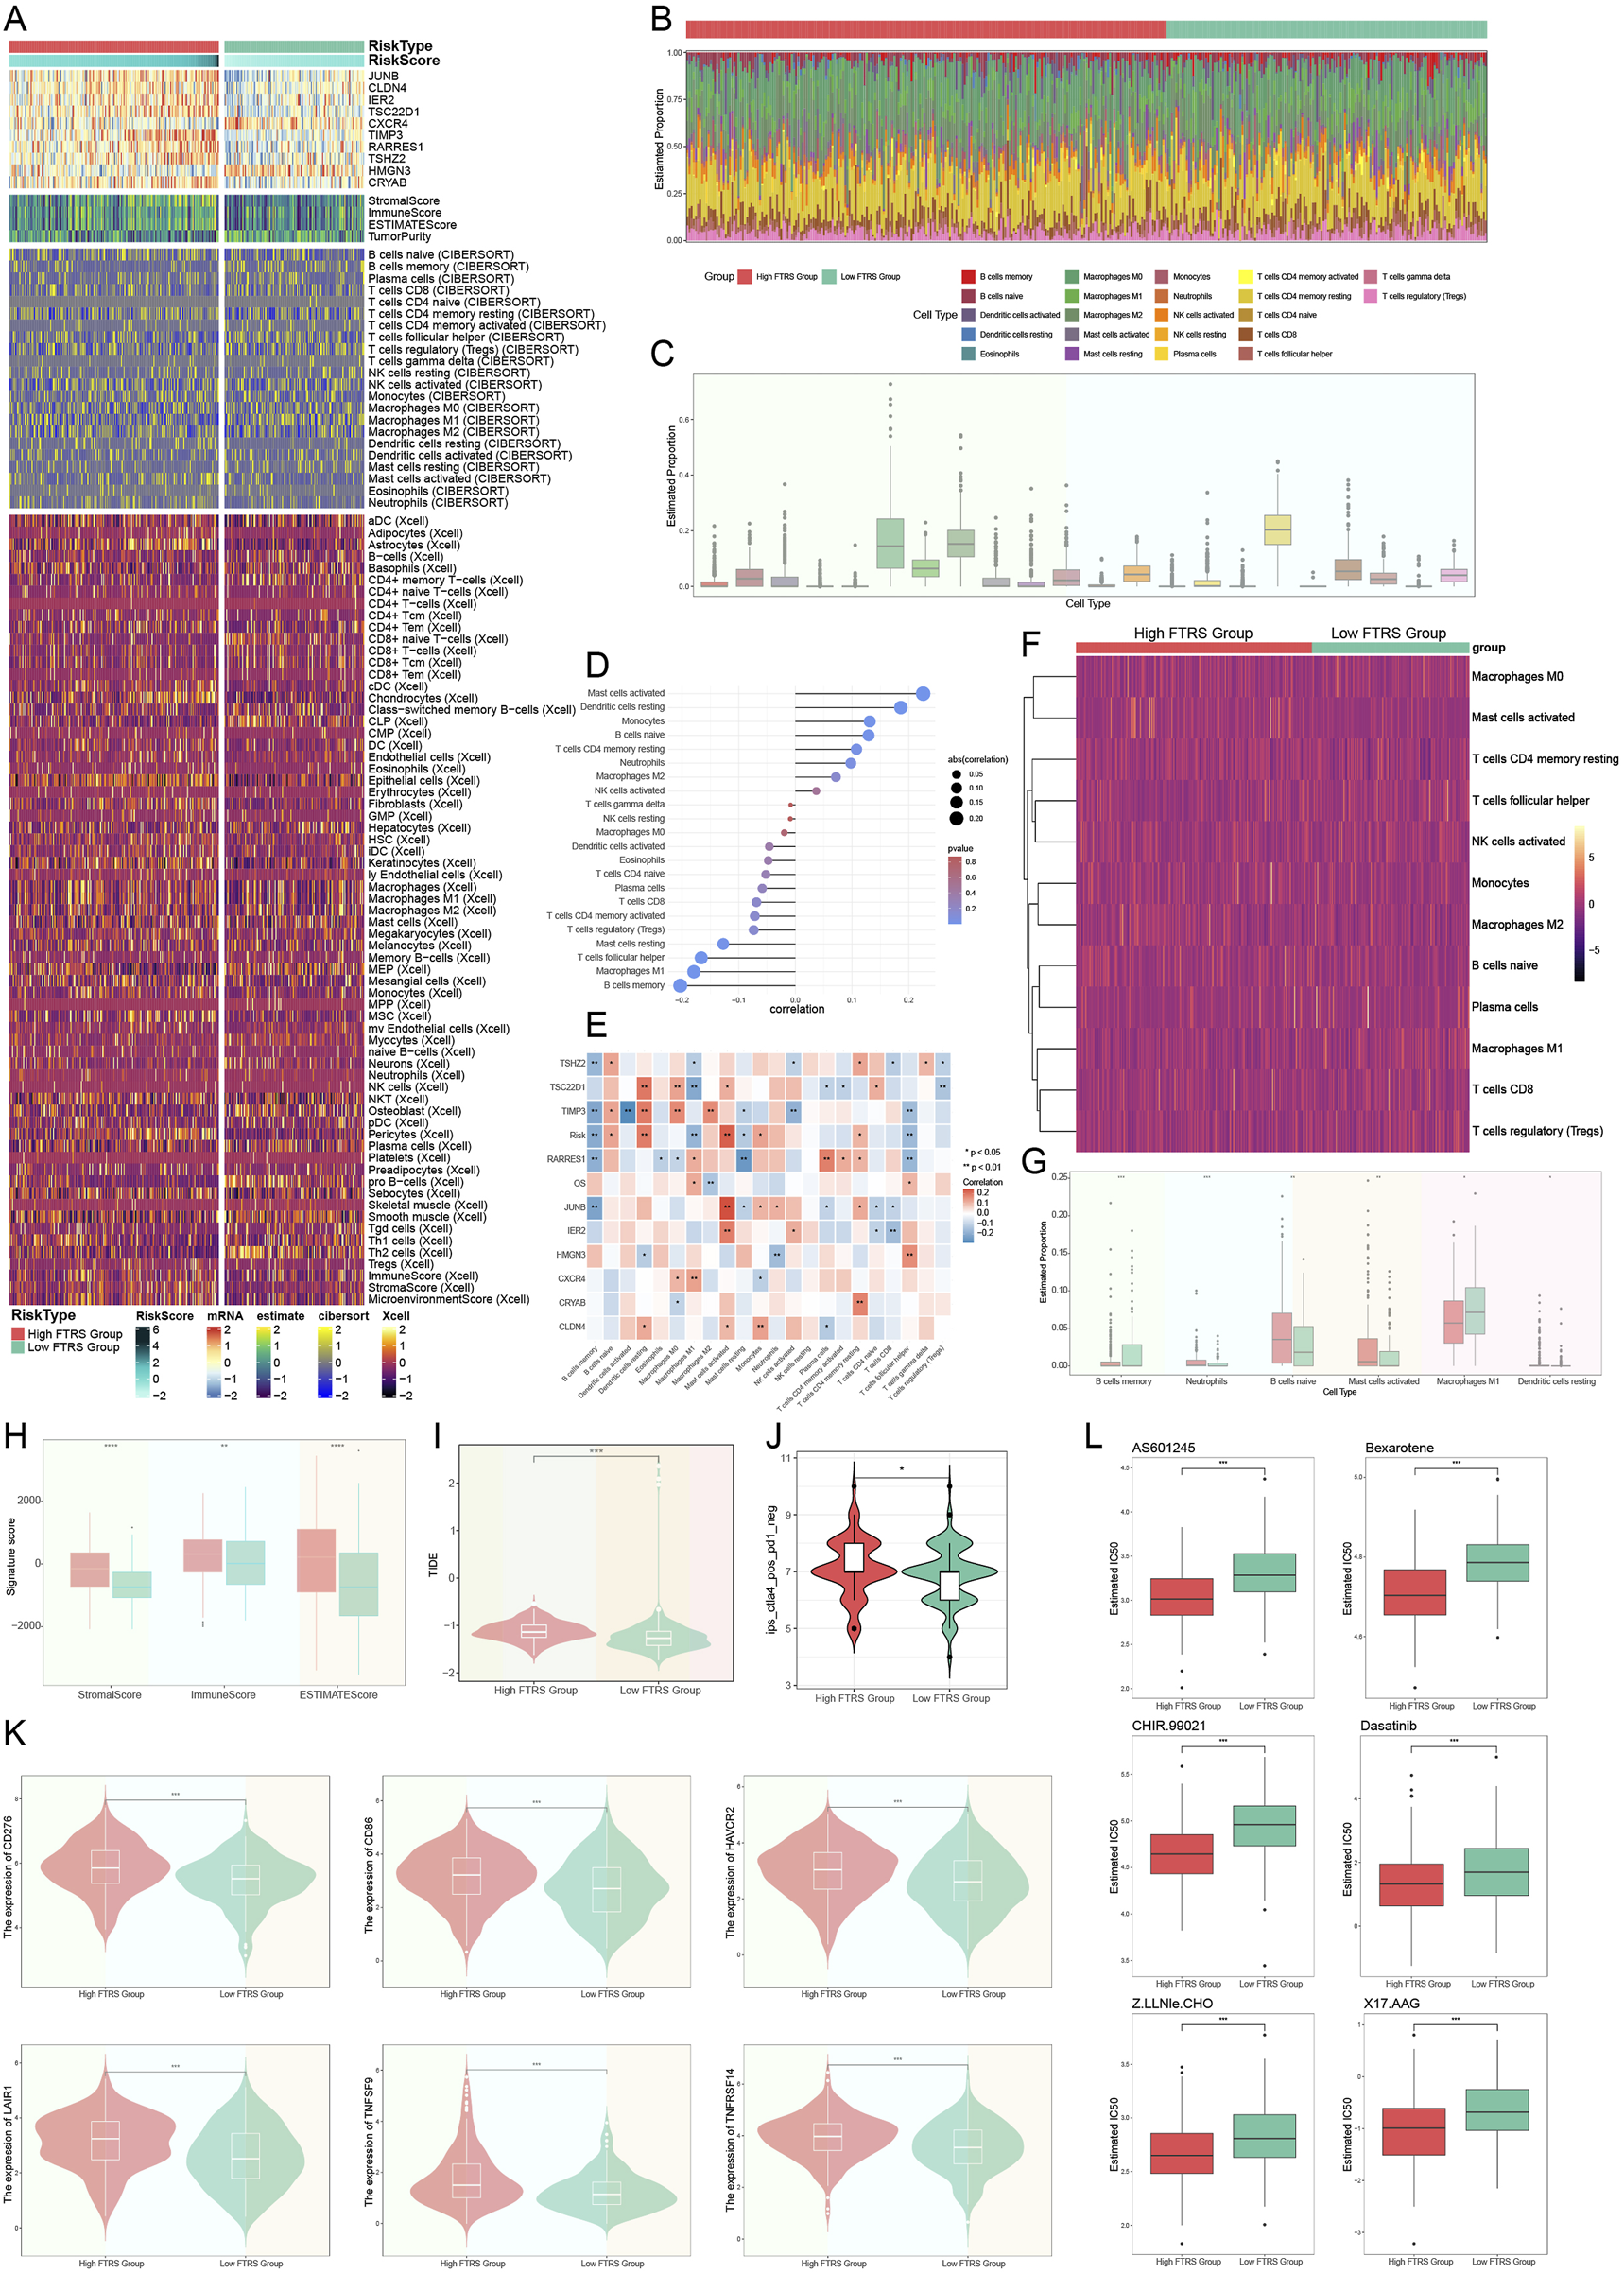
Analysis of immune infiltration in ovarian cancer. (A) The heatmap demonstrated the level of immune infiltration for different risk groups, which were analyzed using a variety of tools. (B) Immunoinfiltration analyses of different risk groups were performed with the CIBERSORT tool alone and visualized using heatmap. (C) The box line plot showed the predicted percentage of 22 immune cells in ovarian cancer. (D) The lollipop plot presented the correlation coefficients between the 22 immune cells and the risk score. (E) Heatmap of the correlation between 10 prognostic genes and 22 immune cells in ovarian cancer. And * represented p < 0.05, ** represented p < 0.01. (F) The heatmap further demonstrated the differences in the distribution of the selected 12 immune cells across the different risk groupings. (G) Box line plot demonstrated the differences in the distribution of the six immune cells in ovarian cancer among different risk groups, and all were statistically significant. And * represented p < 0.05, ** represented p < 0.01, *** represented p < 0.001. (H) Immune score, stromal score, and estimate score were computed for the high- and low-FTRS groups. And ** represented p < 0.01, **** represented p < 0.0001. (I) The difference in TIDE scores between the two risk subgroups was demonstrated by violin plot. And *** represented p < 0.001. (J) IPS specifically predicted response to anti-CTLA4 in ovarian cancer patients in different risk groups, with higher scores resulting in higher response rates. And * represented p < 0.05. (K) Violin plots illustrating the responsiveness of different risk groups to six immune checkpoint treatments, where more expression meant better responsiveness to that immune checkpoint treatment. And *** represented p < 0.001. (L) The sensitivities of the different risk groups to the six drugs were visualized with box line plots, with a lower IC50 indicating a higher sensitivity to the drug. And *** represented p < 0.001.
We calculated the stromal score, immunological score, and ESTIMATE score for both the low and high FTRS groups utilizing ESTIMATE. All values in the low FTRS group were significantly lower than those in the high FTRS group, indicating a greater degree of immune cell infiltration in the high FTRS group (Figure 12H). The group’s response to immunotherapy was then predicted using the Tumor Immune Dysfunction and Exclusion (TIDE), with elevated scores correlating to diminished efficacy of immune checkpoint inhibition medications (Jiang et al., 2018). The TIDE score was significantly higher in the high-risk group compared with the low-risk group (Figure 12I), suggesting that high FN1 expression significantly impeded the effectiveness of immune checkpoint blockade therapy. Immunophenotypic scores (IPS) of ovarian cancer patients were subsequently used to predict their responsiveness to anti-CTLA4 therapy (Figure 12J). The data showed that the response rate to anti-CTLA4 therapy was higher in the high-risk group. Figure 12K depicted six immune checkpoints highly expressed in the high-risk group, including CD276, CD86, HAVCR2, LAIR1, TNFSF9, and TNFRSF14, which collectively impeded antitumor immune responses. Figure 12L depicted the six drugs with low IC50 values in the high-risk group, suggesting that the high-risk group was more sensitive to these drugs. Overall, the findings suggested that TCs with elevated levels of FN1 might play a key role in immunotherapy resistance and could serve as a compelling biomarker in predicting survival time in patients with ovarian tumors.
3.12 Knockout FN1 in vitro studies confirmed its involvement in ovarian cancer
The Caov-3 and SK-OV-3 cell lines were utilized in in vitro research to target FN1 mRNA degradation using siRNA to inhibit FN1 expression. Initially, mRNA levels were evaluated prior to and after to FN1 knockdown. Both cell lines exhibited a significant decrease in mRNA expression levels relative to the control group (Figure 13A). Following FN1 knockdown, the CCK-8 assay demonstrated a significant reduction in TCs viability (Figure 13B). Furthermore, the colony formation assay indicated that FN1 knockdown inhibited the aggregation of TCs (Figures 13C,D). Furthermore, transwell and scratch assays were employed to evaluate the migratory and invasive capacities of TCs, revealing a significant reduction in both following FN1 knockdown (Figures 13E–H). This result was also observed by the EdU staining assay (Figure 13I). The aforementioned findings indicated that FN1 knockdown inhibited ovarian cancer tumor growth by obstructing TCs aggregation, activity, invasion, and migration. This result has provided us with a novel approach for targeted therapy in ovarian cancer inside the clinical setting.
FIGURE 13
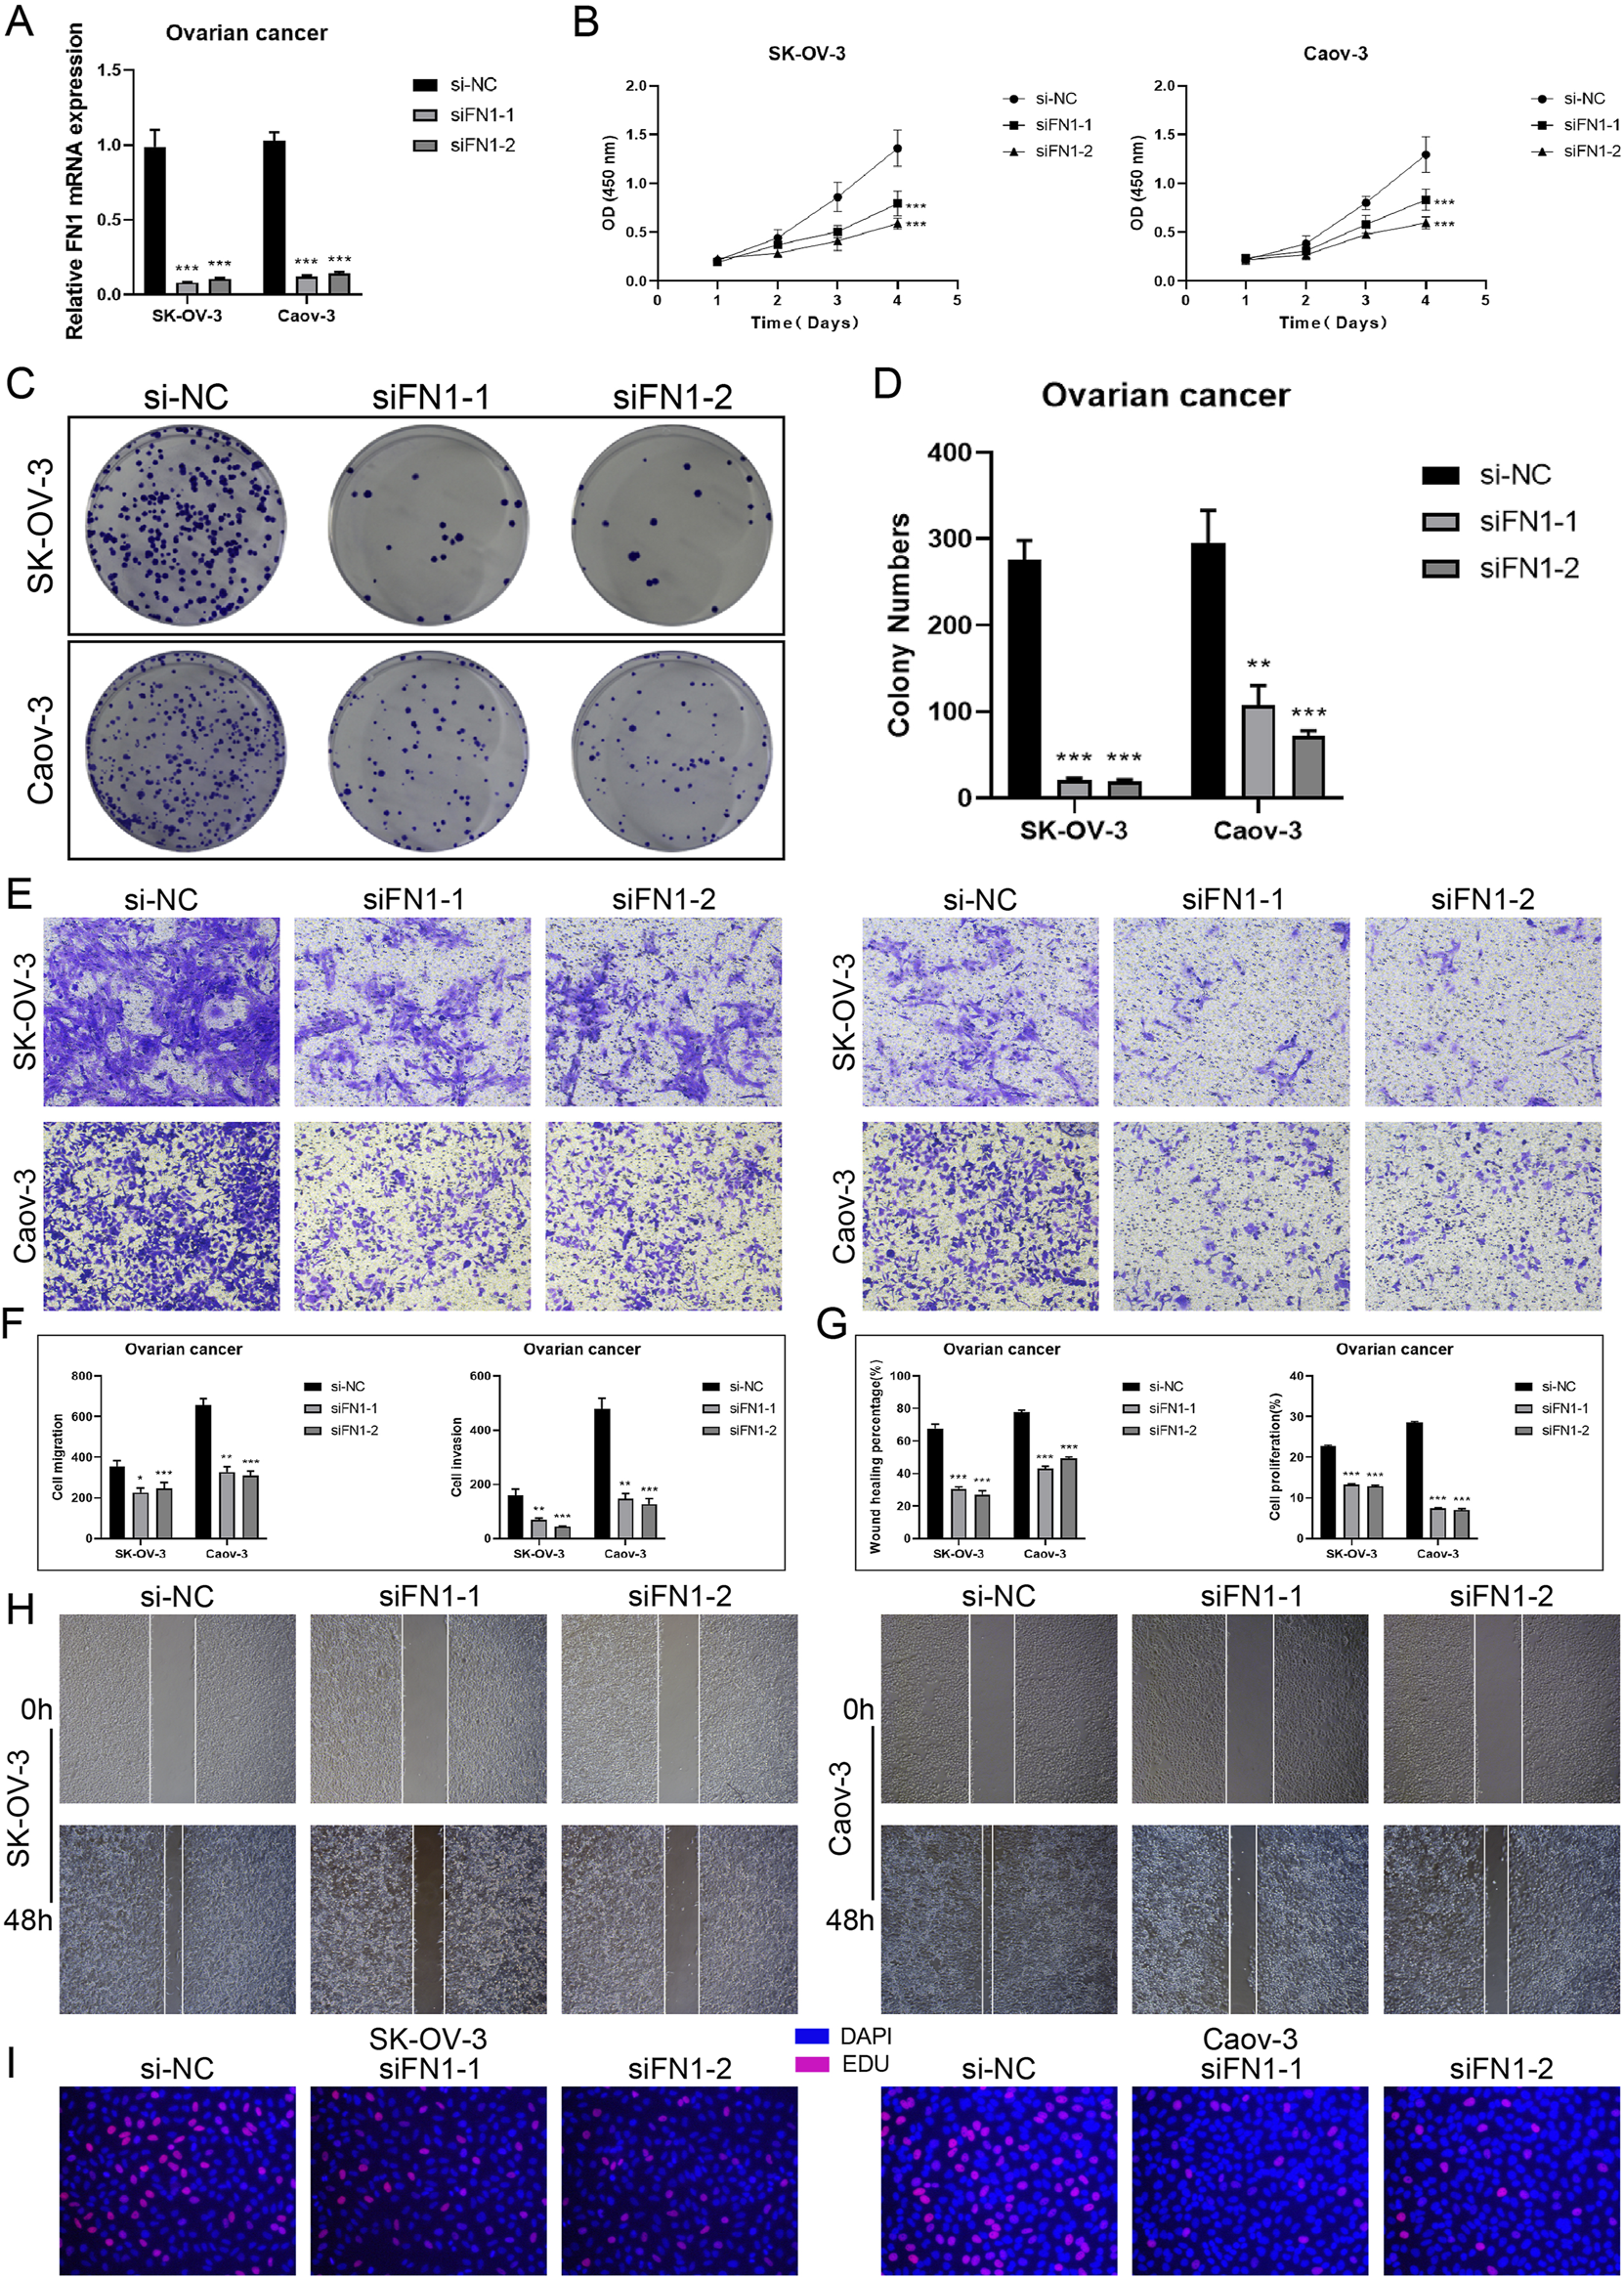
In vitro experiments targeting FN1 signaling molecules. (A) Knockdown of FN1 significantly reduced mRNA expression levels in both experimental groups (Caov-3 and SK-OV-3). And *** represented p < 0.001. (B) CCK-8 testing demonstrated that the viability of TCs was notably reduced following the knockdown of FN1 in comparison to the control group. And *** represented p < 0.001. (C and D) Colony formation testing displayed that the knockdown of FN1 significantly reduced the number of colonies in the experimental group. And *** represented p < 0.001. (E and F) The migration and invasive abilities of TCs in both experimental groups were inhibited by FN1 knockdown, as demonstrated by the transwell experiments and shown in the quantitative plots. This clarification has been added to all relevant figure notes to enhance reader understanding and interpretability of the results. And * represented p < 0.05, ** represented p < 0.01, *** represented p < 0.001. (G and H) The quantitative plots showed a significant reduction in both migration and proliferation abilities of TCs following FN1 knockdown, while the inhibition of TCs migration by FN1 knockdown was indicated by the scratch assays. And *** represented p < 0.001. (I) The knockdown of FN1 inhibited the proliferation of TCs was observed by EdU staining test.
4 Discussion
Ovarian cancer exhibited considerable regional and temporal diversity at the molecular, cellular, and anatomical levels. Both innate and learned resistance arose from the varied responses to systemic and surgical interventions due to this complexity. Ovarian cancer is hence highly aggressive and often fatal. Rather than being a singular disease, it has multiple subtypes, each with distinct and evolving molecular profiles that change as the disease advances and is managed. Treatment options were further confounded by the dynamic interactions between cancer cells and stromal components inside the tumor microenvironment, which were essential in facilitating disease progression and modulating the tumor’s response to therapy (Hollis, 2023; Veneziani et al., 2023). The recent therapy strategy for ovarian cancer involves the introduction of immune-related molecularly targeted medicines, which elicit immunostimulatory or immunosuppressive effects alongside their cytostatic and cytotoxic actions against malignant cells (Moniot et al., 2024; Fucikova et al., 2022; Kim et al., 2012; Gritsina et al., 2015). Previous studies have primarily focused on profiling immune cell infiltration and checkpoint expression in bulk RNA-seq data or characterizing tumor heterogeneity through either scRNA-seq or spatial transcriptomics independently. These studies just highlighted immunotherapy potential by profiling immune checkpoint landscapes or T cell functionality, but lacked integrative spatial-functional insight. Our study advances this by combining scRNA-seq, spatial transcriptomics, gene regulatory network analysis (pySCENIC), and intercellular communication analysis (CellChat) to elucidate a comprehensive tumor-immune interaction map, particularly around FN1+ tumor cells. This integrative framework surpasses earlier studies by adding spatial resolution and direct experimental validation of therapeutic targets.
We identified six primary cell types, including EPCs, by the analysis of ovarian cancer samples, omental tissue, and normal ovarian tissue. These cell types exhibited an increasing percentage correlated with cancer progression. This illustrated the significance of EPCs in the progression of ovarian cancer. We discovered six kinds of TCs utilizing inferCNV. The C3 FN1+ TCs distinguished themselves through their strong association with omental tissue, suggesting their role as metastasis drivers and early facilitators of tumor nesting. This outcome aligned with prior studies indicating that the omentum serves as a pre-metastatic site that facilitates the proliferation of ovarian cancer cells (Li et al., 2023; Lee et al., 2019). Our CytoTRACE research indicated that key stemness markers like as BMI1 and CTNNB1 were prevalent in C3 FN1+ TCs. These cells were linked to pathways crucial for EMT and tumor proliferation (Banerjee et al., 2017; Wen et al., 2019; Lozneanu et al., 2021). The elevated stemness of this subtype indicates its potential involvement in the first stages of cancer, which may influence the onset of metastasis. The participation of C3 FN1+ TCs as an initial subtype was validated by monocle and SlingShot trajectory analyses, which positioned them at the commencement of the developmental pathway. C3 FN1+ TCs were posited as essential for understanding carcinogenesis and evolution, derived from developmental trajectories of ovarian to omental cancer tissues. These data suggested that concentrating on the first molecular mechanisms associated with this subtype might be crucial for developing innovative intervention strategies and personalized treatment.
The SCENIC investigation found ATF3, JUND, and NR2F1 as significantly active in C3 FN1+ TCs. NR2F1’s involvement in EMT and chemoresistance, along with ATF3’s association with heightened treatment resistance, rendered these factors pivotal in cancer progression (Fu et al., 2021; Li D. et al., 2022; Liu et al., 2023; Rodriguez-Tirado et al., 2022). CellChat research revealed that C3 FN1+ TCs were involved in significant intercellular communication, specifically through the FN1-CD44 signaling pathway. Fibroblasts and myeloid cells collaborated to create an environment conducive to cancer proliferation and dissemination (Umansky et al., 2019; Zhang H. et al., 2023; Biffi and Tuveson, 2021). In order to provide additional evidence that there was a connection between tumor subtypes that had a higher FN1 expression and the growth and metastasis of the tumor, we decided to investigate the ST. To translate cell type annotations from scRNA-seq to ST data, tissue sections taken from a patient with ovarian cancer were evaluated using the RCTD approach. According to the findings of the investigation, the C3 FN1+ TCs subtype were found to be spatially connected with tumor sites, and their positions were shown to be consistent with the distribution of myeloid cells and circulating FN1. Through further analysis utilizing stLearn, it was shown that FN1, which was largely expressed by C3 FN1+ TCs subtype and fibroblasts, interacted with the receptor CD44 through paracrine and proximal secretion. This interaction suggested that FN1 played a crucial role in conveying information between tumors. According to the findings of the study, the C3 FN1+ TCs subtype was responsible for the promotion of ovarian cancer through the FN1-CD44 signaling pathway. This route was supported by a paracrine cell-cell communication network that existed inside the microenvironment of the tumor.
The fact that FN1 had a role in both cell adhesion and migration brought to light the biological potential of this protein as a therapeutic target (Zhang et al., 2017; Zhou et al., 2022). The effective communication between C3 FN1+ TCs and immune cells highlighted their ability to employ immune evasion strategies, which might enhance cancer survival and dissemination. Patient stratification could be reliably achieved through the utilization of FN1, which might serve as a prognostic biomarker for ovarian cancer. The Caov-3 and SK-OV-3 cell lines utilized in in vitro FN1 knockdown studies demonstrated dramatic decreases in cell survival, motility, and invasion. These findings indicated the therapeutic potential of targeting FN1 to disrupt the supportive networks of C3 FN1+ TCs, hence reducing tumor development and metastasis while enhancing immuno-precision therapy methods.
The creation of an FTRS model that exhibited robust predictive capability for patient survival, grounded in ten prognostic mRNAs. Upon the creation of an FTRS model, it was observed that patients exhibiting elevated FTRS levels had significantly diminished survival probabilities. This score signified a more aggressive TME that could influence treatment resistance, as it was associated with heightened immune infiltration and immunosuppressive conditions. A higher FTRS score predicted a worse prognosis as well as poorer immunotherapy responsiveness. The immunological landscape of ovarian cancer, wherein specific immune cell types—such as M1 and M2 macrophages—substantially influence patient prognosis and their responsiveness to immunotherapy. Numerous prior papers have demonstrated that M2-type macrophages facilitate immune escape in the tumor microenvironment through diverse mechanisms, resulting in an immunological-hyporesponsive milieu (Ma et al., 2021; Yu et al., 2024; Ning et al., 2023). Immunological checkpoint therapy and personalized treatment strategies might be influenced by immunological escape in high-risk populations. Drug sensitivity testing offered valuable insights into precision medicine for ovarian cancer treatment by identifying potential targeted therapies for high-risk populations. The FTRS model, based on ten prognostic mRNAs, effectively predicts ovarian cancer patient survival by reflecting an immunosuppressive tumor microenvironment linked to poor prognosis, immunotherapy resistance, and potential targets for precision treatment.
Nonetheless, there were some shortcomings in our study. This study utilized only eight tissue samples, potentially failing to represent the diversity of ovarian cancer across different patient populations. Secondly, computational predictions had limitations, and the analysis of immune infiltration patterns, TIDE scores, and immune checkpoint expression were largely based on bioinformatics algorithms and hypothesis generation that had not been experimentally or clinically validated. Although these methods could provide valuable clues, the results needed to be interpreted with caution and future confirmation was still needed in combination with functional experiments and clinical data. Thirdly, although the function of FN1 was validated through in vitro experiments utilizing Caov-3 and SK-OV-3 cell lines, these findings may not adequately reflect the in vivo tumor microenvironment. Future research should employ in vivo models to corroborate these findings.
To sum up, this study concluded that C3 FN1+ TCs represented a significant early high-stem subtype that contributed to the progression of ovarian cancer. Their significant role in transcriptional regulation and intercellular communication underscored their importance in influencing the TME. Focusing on FN1, a critical target gene, enabled the development of novel immunoprecision therapies aimed at halting tumor growth and enhancing patient prognosis. The distribution of key immune cell types, including M1 macrophages as protective factors and M2 macrophages as risk factors, significantly impacted the immunological landscape of ovarian cancer within the TME. The findings underscored the significance of the TME in shaping disease progression and patient outcomes. The immunologic profile of the high-risk population was correlated with reduced responsiveness to immune checkpoint treatments. This highlighted the necessity for the development of targeted immunotherapies. The creation of novel immunoprecision drugs tailored for ovarian cancer patients might enhance the immune system’s capacity to combat ovarian cancer and increase its efficacy in immunotherapy, resulting in better patient outcomes.
Statements
Data availability statement
The original contributions presented in the study are included in the article/Supplementary Material, further inquiries can be directed to the corresponding authors.
Author contributions
XZ: Conceptualization, Methodology, Writing – review and editing, Validation, Visualization, Data curation, Writing – original draft. ZX: Conceptualization, Visualization, Validation, Writing – original draft, Writing – review and editing, Data curation. FZ: Visualization, Writing – review and editing, Validation, Conceptualization, Writing – original draft. QW: Validation, Conceptualization, Writing – review and editing, Writing – original draft, Visualization, Data curation. WN: Validation, Writing – review and editing, Visualization, Writing – original draft, Conceptualization. SW: Writing – review and editing, Writing – original draft, Validation, Conceptualization, Supervision, Visualization.
Funding
The author(s) declare that no financial support was received for the research and/or publication of this article.
Acknowledgments
The Graphical Abstract was created using Figdraw (Image ID: YPUPSaa9f9). Gratitude is extended to Figdraw for its contribution to this article.
Conflict of interest
The authors declare that the research was conducted in the absence of any commercial or financial relationships that could be construed as a potential conflict of interest.
Generative AI statement
The author(s) declare that no Generative AI was used in the creation of this manuscript.
Publisher’s note
All claims expressed in this article are solely those of the authors and do not necessarily represent those of their affiliated organizations, or those of the publisher, the editors and the reviewers. Any product that may be evaluated in this article, or claim that may be made by its manufacturer, is not guaranteed or endorsed by the publisher.
Supplementary material
The Supplementary Material for this article can be found online at: https://www.frontiersin.org/articles/10.3389/fmolb.2025.1611964/full#supplementary-material
References
1
Aibar S. González-Blas C. B. Moerman T. Huynh-Thu V. A. Imrichova H. Hulselmans G. et al (2017). SCENIC: single-cell regulatory network inference and clustering. Nat. Methods14 (11), 1083–1086. 10.1038/nmeth.4463
2
Alexa A. Rahnenfuhrer J. Lengauer T. (2006). Improved scoring of functional groups from gene expression data by decorrelating GO graph structure. Bioinformatics22 (13), 1600–1607. 10.1093/bioinformatics/btl140
3
Almeida-Nunes D. L. Mendes-Frias A. Silvestre R. Dinis-Oliveira R. J. Ricardo S. (2022). Immune tumor microenvironment in ovarian cancer ascites. Int. J. Mol. Sci.23 (18), 10692. 10.3390/ijms231810692
4
An Y. Yang Q. (2021). Tumor-associated macrophage-targeted therapeutics in ovarian cancer. Int. J. Cancer149 (1), 21–30. 10.1002/ijc.33408
5
Arend R. C. Londoño-Joshi A. I. Straughn J. M. Jr Buchsbaum D. J. (2013). The Wnt/β-catenin pathway in ovarian cancer: a review. Gynecol. Oncol.131 (3), 772–779. 10.1016/j.ygyno.2013.09.034
6
Arie A. B. McNally L. Kapp D. S. Teng N. N. H. (2013). The omentum and omentectomy in epithelial ovarian cancer: a reappraisal: part II--the role of omentectomy in the staging and treatment of apparent early stage epithelial ovarian cancer. Gynecol. Oncol.131 (3), 784–790. 10.1016/j.ygyno.2013.09.013
7
Banerjee M. S. Chakraborty P. K. Dwivedi S. K. D. Ding K. Moxley K. M. Mukherjee P. et al (2017). BMI1, a new target of CK2α. Mol. Cancer16 (1), 56. 10.1186/s12943-017-0617-8
8
Bella A. Arrizabalaga L. Di Trani C. A. Fernández-Sendin M. Teijeira A. Russo-Cabrera J. S. et al (2022). Omentum: friend or foe in ovarian cancer immunotherapy?Int. Rev. Cell Mol. Biol.371, 117–131. 10.1016/bs.ircmb.2022.04.017
9
Biffi G. Tuveson D. A. (2021). Diversity and biology of cancer-associated fibroblasts. Physiol. Rev.101 (1), 147–176. 10.1152/physrev.00048.2019
10
Blanc-Durand F. Clemence W. X. L. Tan D. (2023). Targeting the immune microenvironment for ovarian cancer therapy. Front. Immunol.14, 1328651. 10.3389/fimmu.2023.1328651
11
Bopple K. Oren Y. Henry W. S. Dong M. Weller S. Thiel J. et al (2024). ATF3 characterizes aggressive drug-tolerant persister cells in HGSOC. Cell Death Dis.15 (4), 290. 10.1038/s41419-024-06674-x
12
Butler A. Hoffman P. Smibert P. Papalexi E. Satija R. (2018). Integrating single-cell transcriptomic data across different conditions, technologies, and species. Nat. Biotechnol.36 (5), 411–420. 10.1038/nbt.4096
13
Cable D. M. Murray E. Zou L. S. Goeva A. Macosko E. Z. Chen F. et al (2022). Robust decomposition of cell type mixtures in spatial transcriptomics. Nat. Biotechnol.40 (4), 517–526. 10.1038/s41587-021-00830-w
14
Cai D. L. Jin L. P. (2017). Immune cell population in ovarian tumor microenvironment. J. Cancer8 (15), 2915–2923. 10.7150/jca.20314
15
Chen B. Luo Y. Kang X. Sun Y. Jiang C. Yi B. et al (2022b). Development of a prognostic prediction model based on a combined multi-omics analysis of head and neck squamous cell carcinoma cell pyroptosis-related genes. Front. Genet.13, 981222. 10.3389/fgene.2022.981222
16
Chen H. He Y. Wen X. Shao S. Liu Y. Wang J. (2021). SOX9: advances in gynecological malignancies. Front. Oncol.11, 768264. 10.3389/fonc.2021.768264
17
Chen Y. Luo Z. Lin J. Qi B. Sun Y. Li F. et al (2022a). Exploring the potential mechanisms of Melilotus officinalis (L.) pall. In chronic muscle repair patterns using single cell receptor-ligand marker analysis and molecular dynamics simulations. Dis. Markers2022, 9082576. 10.1155/2022/9082576
18
Cho K. R. Shih I. (2009). Ovarian cancer. Annu. Rev. Pathol.4, 287–313. 10.1146/annurev.pathol.4.110807.092246
19
Deng Y. Tan Y. Zhou D. Bai Y. Cao T. Zhong C. et al (2022). Single-cell RNA-sequencing atlas reveals the tumor microenvironment of metastatic high-grade serous ovarian carcinoma. Front. Immunol.13, 923194. 10.3389/fimmu.2022.923194
20
Denisenko E. de Kock L. Tan A. Beasley A. B. Beilin M. Jones M. E. et al (2024). Spatial transcriptomics reveals discrete tumour microenvironments and autocrine loops within ovarian cancer subclones. Nat. Commun.15 (1), 2860. 10.1038/s41467-024-47271-y
21
Ding Y. Zhao Z. Cai H. Zhou Y. Chen H. Bai Y. et al (2023). Single-cell sequencing analysis related to sphingolipid metabolism guides immunotherapy and prognosis of skin cutaneous melanoma. Front. Immunol.14, 1304466. 10.3389/fimmu.2023.1304466
22
Dou L. Lu E. Tian D. Li F. Deng L. Zhang Y. (2023). Adrenomedullin induces cisplatin chemoresistance in ovarian cancer through reprogramming of glucose metabolism. J. Transl. Int. Med.11 (2), 169–177. 10.2478/jtim-2023-0091
23
Etzerodt A. Moulin M. Doktor T. K. Delfini M. Mossadegh-Keller N. Bajenoff M. et al (2020). Tissue-resident macrophages in omentum promote metastatic spread of ovarian cancer. J. Exp. Med.217 (4), e20191869. 10.1084/jem.20191869
24
Feng S. Xu Y. Dai Z. Yin H. Zhang K. Shen Y. (2022). Integrative analysis from multicenter studies identifies a WGCNA-derived cancer-associated fibroblast signature for ovarian cancer. Front. Immunol.13, 951582. 10.3389/fimmu.2022.951582
25
Feng X. Luo Z. Zhang W. Wan R. Chen Y. Li F. et al (2025). Zn-DHM nanozymes enhance muscle regeneration through ROS scavenging and macrophage polarization in volumetric muscle loss revealed by single-cell profiling. Adv. Funct. Mater., 2506476. 10.1002/adfm.202506476
26
Fu D. Wang C. Yu L. Yu R. (2021). Induction of ferroptosis by ATF3 elevation alleviates cisplatin resistance in gastric cancer by restraining Nrf2/Keap1/xCT signaling. Cell Mol. Biol. Lett.26 (1), 26. 10.1186/s11658-021-00271-y
27
Fucikova J. Palova-Jelinkova L. Klapp V. Holicek P. Lanickova T. Kasikova L. et al (2022). Immunological control of ovarian carcinoma by chemotherapy and targeted anticancer agents. Trends Cancer8 (5), 426–444. 10.1016/j.trecan.2022.01.010
28
Ge Q. Zhao Z. Li X. Yang F. Zhang M. Hao Z. et al (2024). Deciphering the suppressive immune microenvironment of prostate cancer based on CD4+ regulatory T cells: implications for prognosis and therapy prediction. Clin. Transl. Med.14 (1), e1552. 10.1002/ctm2.1552
29
Grassi M. L. Palma C. d. S. Thomé C. H. Lanfredi G. P. Poersch A. Faça V. M. (2017). Proteomic analysis of ovarian cancer cells during epithelial-mesenchymal transition (EMT) induced by epidermal growth factor (EGF) reveals mechanisms of cell cycle control. J. Proteomics151, 2–11. 10.1016/j.jprot.2016.06.009
30
Gritsina G. Xiao F. O'Brien S. W. Gabbasov R. Maglaty M. A. Xu R. H. et al (2015). Targeted blockade of JAK/STAT3 signaling inhibits ovarian carcinoma growth. Mol. Cancer Ther.14 (4), 1035–1047. 10.1158/1535-7163.MCT-14-0800
31
Guan H. Chen X. Liu J. Sun J. Guo H. Jiang Y. et al (2023). Molecular characteristics and therapeutic implications of Toll-like receptor signaling pathway in melanoma. Sci. Rep.13 (1), 13788. 10.1038/s41598-023-38850-y
32
Gunassekaran G. R. Poongkavithai Vadevoo S. M. Baek M. C. Lee B. (2021). M1 macrophage exosomes engineered to foster M1 polarization and target the IL-4 receptor inhibit tumor growth by reprogramming tumor-associated macrophages into M1-like macrophages. Biomaterials278, 121137. 10.1016/j.biomaterials.2021.121137
33
Guo J. Li X. Zhang W. Chen Y. Zhu S. Chen L. et al (2019). HSP60-regulated mitochondrial proteostasis and protein translation promote tumor growth of ovarian cancer. Sci. Rep.9 (1), 12628. 10.1038/s41598-019-48992-7
34
Han J. Zhang B. Zhang Y. Yin T. Cui Y. Liu J. et al (2023). Gut microbiome: decision-makers in the microenvironment of colorectal cancer. Front. Cell Infect. Microbiol.13, 1299977. 10.3389/fcimb.2023.1299977
35
Hilliard T. S. (2018). The impact of mesothelin in the ovarian cancer tumor microenvironment. Cancers (Basel)10 (9), 277. 10.3390/cancers10090277
36
Hollis R. L. (2023). Molecular characteristics and clinical behaviour of epithelial ovarian cancers. Cancer Lett.555, 216057. 10.1016/j.canlet.2023.216057
37
Hou M. Zhao Z. Li S. Zhang Z. Li X. Zhang Y. et al (2025). Single-cell analysis unveils cell subtypes of acral melanoma cells at the early and late differentiation stages. J. Cancer16 (3), 898–916. 10.7150/jca.102045
38
Huang W. Kim B. S. Zhang Y. Lin L. Chai G. Zhao Z. (2024). Regulatory T cells subgroups in the tumor microenvironment cannot be overlooked: their involvement in prognosis and treatment strategy in melanoma. Environ. Toxicol.39 (10), 4512–4530. 10.1002/tox.24247
39
Jazwinska D. E. Kulawiec D. G. Zervantonakis I. K. (2023). Cancer-mesothelial and cancer-macrophage interactions in the ovarian cancer microenvironment. Am. J. Physiol. Cell Physiol.325 (3), C721–C730. 10.1152/ajpcell.00461.2022
40
Jiang H. Yu D. Yang P. Guo R. Kong M. Gao Y. et al (2022). Revealing the transcriptional heterogeneity of organ-specific metastasis in human gastric cancer using single-cell RNA sequencing. Clin. Transl. Med.12 (2), e730. 10.1002/ctm2.730
41
Jiang P. Gu S. Pan D. Fu J. Sahu A. Hu X. et al (2018). Signatures of T cell dysfunction and exclusion predict cancer immunotherapy response. Nat. Med.24 (10), 1550–1558. 10.1038/s41591-018-0136-1
42
Jiang Y. Wang C. Zhou S. (2020). Targeting tumor microenvironment in ovarian cancer: premise and promise. Biochim. Biophys. Acta Rev. Cancer1873 (2), 188361. 10.1016/j.bbcan.2020.188361
43
Jin S. Guerrero-Juarez C. F. Zhang L. Chang I. Ramos R. Kuan C. H. et al (2021). Inference and analysis of cell-cell communication using CellChat. Nat. Commun.12 (1), 1088. 10.1038/s41467-021-21246-9
44
Jin W. Zhang Y. Zhao Z. Gao M. (2024). Developing targeted therapies for neuroblastoma by dissecting the effects of metabolic reprogramming on tumor microenvironments and progression. Theranostics14 (9), 3439–3469. 10.7150/thno.93962
45
Kasikova L. Rakova J. Hensler M. Lanickova T. Tomankova J. Pasulka J. et al (2024). Tertiary lymphoid structures and B cells determine clinically relevant T cell phenotypes in ovarian cancer. Nat. Commun.15 (1), 2528. 10.1038/s41467-024-46873-w
46
Kim A. Ueda Y. Naka T. Enomoto T. (2012). Therapeutic strategies in epithelial ovarian cancer. J. Exp. Clin. Cancer Res.31 (1), 14. 10.1186/1756-9966-31-14
47
Kossai M. Leary A. Scoazec J. Y. Genestie C. (2018). Ovarian cancer: a heterogeneous disease. Pathobiology85 (1-2), 41–49. 10.1159/000479006
48
Kuroki L. Guntupalli S. R. (2020). Treatment of epithelial ovarian cancer. BMJ371, m3773. 10.1136/bmj.m3773
49
Lee W. Ko S. Y. Mohamed M. S. Kenny H. A. Lengyel E. Naora H. (2019). Neutrophils facilitate ovarian cancer premetastatic niche formation in the omentum. J. Exp. Med.216 (1), 176–194. 10.1084/jem.20181170
50
Li D. Xu M. Wang Z. Huang P. Huang C. Chen Z. et al (2022b). The EMT-induced lncRNA NR2F1-AS1 positively modulates NR2F1 expression and drives gastric cancer via miR-29a-3p/VAMP7 axis. Cell Death Dis.13 (1), 84. 10.1038/s41419-022-04540-2
51
Li G. Yi X. Du S. Gong L. Wu Q. Cai J. et al (2023). Tumour-derived exosomal piR-25783 promotes omental metastasis of ovarian carcinoma by inducing the fibroblast to myofibroblast transition. Oncogene42 (6), 421–433. 10.1038/s41388-022-02560-y
52
Li H. Bian Y. Xiahou Z. Zhao Z. Zhao F. Zhang Q. (2025). The cellular signaling crosstalk between memory B cells and tumor cells in nasopharyngeal carcinoma cannot be overlooked: their involvement in tumor progression and treatment strategy is significant. J. Cancer16 (1), 288–314. 10.7150/jca.101420
53
Li X. Lin Z. Zhao F. Huang T. Fan W. Cen L. et al (2024). Unveiling the cellular landscape: insights from single-cell RNA sequencing in multiple myeloma. Front. Immunol.15, 1458638. 10.3389/fimmu.2024.1458638
54
Li X. Y. Zhao Z. J. Wang J. B. Shao Y. H. Hui-Liu You J. X. et al (2022a). m7G methylation-related genes as biomarkers for predicting overall survival outcomes for hepatocellular carcinoma. Front. Bioeng. Biotechnol.10, 849756. 10.3389/fbioe.2022.849756
55
Liang Q. Xu Z. Liu Y. Peng B. Cai Y. Liu W. et al (2022). NR2F1 regulates TGF-β1-mediated epithelial-mesenchymal transition affecting platinum sensitivity and immune response in ovarian cancer. Cancers (Basel)14 (19), 4639. 10.3390/cancers14194639
56
Lin L. Zou J. Pei S. Huang W. Zhang Y. Zhao Z. et al (2024a). Germinal center B-cell subgroups in the tumor microenvironment cannot be overlooked: their involvement in prognosis, immunotherapy response, and treatment resistance in head and neck squamous carcinoma. Heliyon10 (19), e37726. 10.1016/j.heliyon.2024.e37726
57
Lin S. C. Liao Y. C. Chen P. M. Yang Y. Y. Wang Y. H. Tung S. L. et al (2022a). Periostin promotes ovarian cancer metastasis by enhancing M2 macrophages and cancer-associated fibroblasts via integrin-mediated NF-κB and TGF-β2 signaling. J. Biomed. Sci.29 (1), 109. 10.1186/s12929-022-00888-x
58
Lin Z. Fan W. Sui X. Wang J. Zhao J. (2023). Necroptosis-related LncRNA signatures for prognostic prediction in uterine corpora endometrial cancer. Reprod. Sci.30 (2), 576–589. 10.1007/s43032-022-01023-9
59
Lin Z. Fan W. Yu X. Liu J. Liu P. (2022b). Research into the mechanism of intervention of SanQi in endometriosis based on network pharmacology and molecular docking technology. Med. Baltim.101 (37), e30021. 10.1097/MD.0000000000030021
60
Lin Z. Li X. Shi H. Cao R. Zhu L. Dang C. et al (2024c). Decoding the tumor microenvironment and molecular mechanism: unraveling cervical cancer subpopulations and prognostic signatures through scRNA-Seq and bulk RNA-seq analyses. Front. Immunol.15, 1351287. 10.3389/fimmu.2024.1351287
61
Lin Z. Sui X. Jiao W. Chen C. Zhang X. Zhao J. (2022d). Mechanism investigation and experiment validation of capsaicin on uterine corpus endometrial carcinoma. Front. Pharmacol.13, 953874. 10.3389/fphar.2022.953874
62
Lin Z. Sui X. Jiao W. Wang Y. Zhao J. (2022c). Exploring the mechanism and experimental verification of puerarin in the treatment of endometrial carcinoma based on network pharmacology and bioinformatics analysis. BMC Complement. Med. Ther.22 (1), 150. 10.1186/s12906-022-03623-z
63
Lin Z. Wang F. Yin R. Li S. Bai Y. Zhang B. et al (2024b). Single-cell RNA sequencing and immune microenvironment analysis reveal PLOD2-driven malignant transformation in cervical cancer. Front. Immunol.15, 1522655. 10.3389/fimmu.2024.1522655
64
Liu N. Yan M. Tao Q. Wu J. Chen J. Chen X. et al (2023). Inhibition of TCA cycle improves the anti-PD-1 immunotherapy efficacy in melanoma cells via ATF3-mediated PD-L1 expression and glycolysis. J. Immunother. Cancer11 (9), e007146. 10.1136/jitc-2023-007146
65
Liu P. Xing N. Xiahou Z. Yan J. Lin Z. Zhang J. (2024). Unraveling the intricacies of glioblastoma progression and recurrence: insights into the role of NFYB and oxidative phosphorylation at the single-cell level. Front. Immunol.15, 1368685. 10.3389/fimmu.2024.1368685
66
Lozneanu L. Balan R. A. Păvăleanu I. Giuşcă S. E. Căruntu I. D. Amalinei C. (2021). BMI-1 expression heterogeneity in endometriosis-related and non-endometriotic ovarian carcinoma. Int. J. Mol. Sci.22 (11), 6082. 10.3390/ijms22116082
67
Luo X. Xu J. Yu J. Yi P. (2021). Shaping immune responses in the tumor microenvironment of ovarian cancer. Front. Immunol.12, 692360. 10.3389/fimmu.2021.692360
68
Ma Y. S. Wu T. M. Ling C. C. Yu F. Zhang J. Cao P. S. et al (2021). M2 macrophage-derived exosomal microRNA-155-5p promotes the immune escape of colon cancer by downregulating ZC3H12B. Mol. Ther. Oncolytics20, 484–498. 10.1016/j.omto.2021.02.005
69
Meagher N. S. Gorringe K. L. Wakefield M. Bolithon A. Pang C. N. I. Chiu D. S. et al (2022). Gene-expression profiling of mucinous ovarian tumors and comparison with upper and lower gastrointestinal tumors identifies markers associated with adverse outcomes. Clin. Cancer Res.28 (24), 5383–5395. 10.1158/1078-0432.CCR-22-1206
70
Miyamoto T. Murphy B. Zhang N. (2023). Intraperitoneal metastasis of ovarian cancer: new insights on resident macrophages in the peritoneal cavity. Front. Immunol.14, 1104694. 10.3389/fimmu.2023.1104694
71
Moniot A. Schneider C. Chardin L. Yaniz-Galende E. Genestie C. Etiennot M. et al (2024). The CD47/TSP-1 axis: a promising avenue for ovarian cancer treatment and biomarker research. Mol. Cancer23 (1), 166. 10.1186/s12943-024-02073-0
72
Morand S. Devanaboyina M. Staats H. Stanbery L. Nemunaitis J. (2021). Ovarian cancer immunotherapy and personalized medicine. Int. J. Mol. Sci.22 (12), 6532. 10.3390/ijms22126532
73
Nasiri F. Farrokhi K. Safarzadeh Kozani P. Mahboubi Kancha M. Dashti Shokoohi S. Safarzadeh Kozani P. (2023). CAR-T cell immunotherapy for ovarian cancer: hushing the silent killer. Front. Immunol.14, 1302307. 10.3389/fimmu.2023.1302307
74
Newman A. M. Steen C. B. Liu C. L. Gentles A. J. Chaudhuri A. A. Scherer F. et al (2019). Determining cell type abundance and expression from bulk tissues with digital cytometry. Nat. Biotechnol.37 (7), 773–782. 10.1038/s41587-019-0114-2
75
Ni G. Sun Y. Jia H. Xiahou Z. Li Y. Zhao F. et al (2025). MAZ-mediated tumor progression and immune evasion in hormone receptor-positive breast cancer: targeting tumor microenvironment and PCLAF+ subtype-specific therapy. Transl. Oncol.52, 102280. 10.1016/j.tranon.2025.102280
76
Nie W. Zhao Z. Liu Y. Wang Y. Zhang J. Hu Y. et al (2024). Integrative single-cell analysis of cardiomyopathy identifies differences in cell stemness and transcriptional regulatory networks among fibroblast subpopulations. Cardiol. Res. Pract.2024, 3131633. 10.1155/2024/3131633
77
Ning Q. Jian T. Cui S. Shi L. Jian X. He X. et al (2023). Tim-3 facilitates immune escape in benzene-induced acute myeloid leukemia mouse model by promoting macrophage M2 polarization. Ecotoxicol. Environ. Saf.266, 115532. 10.1016/j.ecoenv.2023.115532
78
Oh J. Park S. H. Lee T. S. Oh H. K. Choi J. H. Choi Y. S. (2014). High expression of epidermal growth factor-like domain 7 is correlated with poor differentiation and poor prognosis in patients with epithelial ovarian cancer. J. Gynecol. Oncol.25 (4), 334–341. 10.3802/jgo.2014.25.4.334
79
Olalekan S. Xie B. Back R. Eckart H. Basu A. (2021). Characterizing the tumor microenvironment of metastatic ovarian cancer by single-cell transcriptomics. Cell Rep.35 (8), 109165. 10.1016/j.celrep.2021.109165
80
Olbrecht S. Busschaert P. Qian J. Vanderstichele A. Loverix L. Van Gorp T. et al (2021). High-grade serous tubo-ovarian cancer refined with single-cell RNA sequencing: specific cell subtypes influence survival and determine molecular subtype classification. Genome Med.13 (1), 111. 10.1186/s13073-021-00922-x
81
Perez-Benavente B. Fathinajafabadi A. de la Fuente L. Gandía C. Martínez-Férriz A. Pardo-Sánchez J. M. et al (2022). New roles for AP-1/JUNB in cell cycle control and tumorigenic cell invasion via regulation of cyclin E1 and TGF-β2. Genome Biol.23 (1), 252. 10.1186/s13059-022-02800-0
82
Pham D. Tan X. Balderson B. Xu J. Grice L. F. Yoon S. et al (2023). Robust mapping of spatiotemporal trajectories and cell–cell interactions in healthy and diseased tissues. Nat. Commun.14 (1), 7739. 10.1038/s41467-023-43120-6
83
Qiu X. Mao Q. Tang Y. Wang L. Chawla R. Pliner H. A. et al (2017). Reversed graph embedding resolves complex single-cell trajectories. Nat. Methods14 (10), 979–982. 10.1038/nmeth.4402
84
Rao A. Barkley D. França G. S. Yanai I. (2021). Exploring tissue architecture using spatial transcriptomics. Nature596 (7871), 211–220. 10.1038/s41586-021-03634-9
85
Rodriguez G. C. Berchuck A. Whitaker R. S. Schlossman D. Clarke-Pearson D. L. Bast R. C. Jr (1991). Epidermal growth factor receptor expression in normal ovarian epithelium and ovarian cancer. II. Relationship between receptor expression and response to epidermal growth factor. Am. J. Obstet. Gynecol.164 (3), 745–750. 10.1016/0002-9378(91)90508-o
86
Rodriguez-Tirado C. Kale N. Carlini M. J. Shrivastava N. Rodrigues A. A. Khalil B. D. et al (2022). NR2F1 is a barrier to dissemination of early-stage breast cancer cells. Cancer Res.82 (12), 2313–2326. 10.1158/0008-5472.CAN-21-4145
87
Shao W. Lin Z. Xiahou Z. Zhao F. Xu J. Liu X. et al (2024). Single-cell RNA sequencing reveals that MYBL2 in malignant epithelial cells is involved in the development and progression of ovarian cancer. Front. Immunol.15, 1438198. 10.3389/fimmu.2024.1438198
88
Shi-Peng G. Chun-Lin C. Huan W. Fan-Liang M. Yong-Ning C. Ya-Di Z. et al (2017). TMED2 promotes epithelial ovarian cancer growth. Oncotarget8 (55), 94151–94165. 10.18632/oncotarget.21593
89
Song M. Sandoval T. A. Chae C. S. Chopra S. Tan C. Rutkowski M. R. et al (2018). IRE1α-XBP1 controls T cell function in ovarian cancer by regulating mitochondrial activity. Nature562 (7727), 423–428. 10.1038/s41586-018-0597-x
90
Suh S. Kim K. W. (2019). Diabetes and cancer: cancer should Be screened in routine diabetes assessment. Diabetes Metab. J.43 (6), 733–743. 10.4093/dmj.2019.0177
91
Sun C. Chen Y. Kim N. H. Lowe S. Ma S. Zhou Z. et al (2022a). Identification and verification of potential biomarkers in gastric cancer by integrated bioinformatic analysis. Front. Genet.13, 911740. 10.3389/fgene.2022.911740
92
Sun C. Ma S. Chen Y. Kim N. H. Kailas S. Wang Y. et al (2022b). Diagnostic value, prognostic value, and immune infiltration of LOX family members in liver cancer: bioinformatic analysis. Front. Oncol.12, 843880. 10.3389/fonc.2022.843880
93
Sun L. Shao W. Lin Z. Lin J. Zhao F. Yu J. (2024). Single-cell RNA sequencing explored potential therapeutic targets by revealing the tumor microenvironment of neuroblastoma and its expression in cell death. Discov. Oncol.15 (1), 409. 10.1007/s12672-024-01286-5
94
Suo S. Zhu Q. Saadatpour A. Fei L. Guo G. Yuan G. C. (2018). Revealing the critical regulators of cell identity in the mouse cell atlas. Cell Rep.25 (6), 1436–1445.e3. 10.1016/j.celrep.2018.10.045
95
Swerdlow A. J. Jones M. E. Slater S. D. Burden A. C. F. Botha J. L. Waugh N. R. et al (2023). Cancer incidence and mortality in 23 000 patients with type 1 diabetes in the UK: long-term follow-up. Int. J. Cancer153 (3), 512–523. 10.1002/ijc.34548
96
Umansky V. Adema G. J. Baran J. Brandau S. Van Ginderachter J. A. Hu X. et al (2019). Interactions among myeloid regulatory cells in cancer. Cancer Immunol. Immunother.68 (4), 645–660. 10.1007/s00262-018-2200-6
97
van Vlerken-Ysla L. Tyurina Y. Y. Kagan V. E. Gabrilovich D. I. (2023). Functional states of myeloid cells in cancer. Cancer Cell41 (3), 490–504. 10.1016/j.ccell.2023.02.009
98
Veneziani A. C. Gonzalez-Ochoa E. Alqaisi H. Madariaga A. Bhat G. Rouzbahman M. et al (2023). Heterogeneity and treatment landscape of ovarian carcinoma. Nat. Rev. Clin. Oncol.20 (12), 820–842. 10.1038/s41571-023-00819-1
99
Wan R. Chen Y. Feng X. Luo Z. Peng Z. Qi B. et al (2024). Exercise potentially prevents colorectal cancer liver metastases by suppressing tumor epithelial cell stemness via RPS4X downregulation. Heliyon10 (5), e26604. 10.1016/j.heliyon.2024.e26604
100
Wang J. Zhang Z. Shang D. Liao Y. Yu P. Li J. et al (2022b). A novel nomogram for prediction of post-hepatectomy liver failure in patients with resectable hepatocellular carcinoma: a multicenter study. J. Hepatocell. Carcinoma9, 901–912. 10.2147/JHC.S366937
101
Wang J. Zhao F. Zhang Q. Sun Z. Xiahou Z. Wang C. et al (2024). Unveiling the NEFH+ malignant cell subtype: insights from single-cell RNA sequencing in prostate cancer progression and tumor microenvironment interactions. Front. Immunol.15, 1517679. 10.3389/fimmu.2024.1517679
102
Wang Y. Xie H. Chang X. Hu W. Li M. Li Y. et al (2022a). Single-cell dissection of the multiomic landscape of high-grade serous ovarian cancer. Cancer Res.82 (21), 3903–3916. 10.1158/0008-5472.CAN-21-3819
103
Wang Y. Zhao Z. J. Kang X. R. Bian T. Shen Z. M. Jiang Y. et al (2020). lncRNA DLEU2 acts as a miR-181a sponge to regulate SEPP1 and inhibit skeletal muscle differentiation and regeneration. Aging (Albany NY)12 (23), 24033–24056. 10.18632/aging.104095
104
Wei X. Lou H. Zhou D. Jia Y. Li H. Huang Q. et al (2021). TAGLN mediated stiffness-regulated ovarian cancer progression via RhoA/ROCK pathway. J. Exp. Clin. Cancer Res.40 (1), 292. 10.1186/s13046-021-02091-6
105
Wen J. Min X. Shen M. Hua Q. Han Y. Zhao L. et al (2019). ACLY facilitates colon cancer cell metastasis by CTNNB1. J. Exp. Clin. Cancer Res.38 (1), 401. 10.1186/s13046-019-1391-9
106
Wood G. E. Ledermann J. A. (2022). Adjuvant and post-surgical treatment in high-grade epithelial ovarian cancer. Best. Pract. Res. Clin. Obstet. Gynaecol.78, 64–73. 10.1016/j.bpobgyn.2021.09.002
107
Wu F. Fan J. He Y. Xiong A. Yu J. Li Y. et al (2021). Single-cell profiling of tumor heterogeneity and the microenvironment in advanced non-small cell lung cancer. Nat. Commun.12 (1), 2540. 10.1038/s41467-021-22801-0
108
Xiao Y. Bi M. Guo H. Li M. (2022). Multi-omics approaches for biomarker discovery in early ovarian cancer diagnosis. EBioMedicine79, 104001. 10.1016/j.ebiom.2022.104001
109
Xu J. Fang Y. Chen K. Li S. Tang S. Ren Y. et al (2022). Single-cell RNA sequencing reveals the tissue architecture in human high-grade serous ovarian cancer. Clin. Cancer Res.28 (16), 3590–3602. 10.1158/1078-0432.CCR-22-0296
110
Xu Y. She Y. Li Y. Li H. Jia Z. Jiang G. et al (2020). Multi-omics analysis at epigenomics and transcriptomics levels reveals prognostic subtypes of lung squamous cell carcinoma. Biomed. Pharmacother.125, 109859. 10.1016/j.biopha.2020.109859
111
Yang C. Xia B. R. Zhang Z. C. Zhang Y. J. Lou G. Jin W. L. (2020). Immunotherapy for ovarian cancer: adjuvant, combination, and neoadjuvant. Front. Immunol.11, 577869. 10.3389/fimmu.2020.577869
112
Ye B. Fan J. Xue L. Zhuang Y. Luo P. Jiang A. et al (2025). iMLGAM: integrated Machine Learning and Genetic Algorithm-driven Multiomics analysis for pan-cancer immunotherapy response prediction. Imeta4 (2), e70011. 10.1002/imt2.70011
113
Yu P. Wang Y. Yuan D. Sun Y. Qin S. Li T. (2023). Vascular normalization: reshaping the tumor microenvironment and augmenting antitumor immunity for ovarian cancer. Front. Immunol.14, 1276694. 10.3389/fimmu.2023.1276694
114
Yu Y. Liang Y. Xie F. Zhang Z. Zhang P. Zhao X. et al (2024). Tumor-associated macrophage enhances PD-L1-mediated immune escape of bladder cancer through PKM2 dimer-STAT3 complex nuclear translocation. Cancer Lett.593, 216964. 10.1016/j.canlet.2024.216964
115
Zhang B. Chen X. Wang Z. Guo F. Zhang X. Huang B. et al (2023b). Identifying endoplasmic reticulum stress-related molecular subtypes and prognostic model for predicting the immune landscape and therapy response in pancreatic cancer. Aging (Albany NY)15 (19), 10549–10579. 10.18632/aging.205094
116
Zhang B. Sun J. Guan H. Guo H. Huang B. Chen X. et al (2023a). Integrated single-cell and bulk RNA sequencing revealed the molecular characteristics and prognostic roles of neutrophils in pancreatic cancer. Aging (Albany NY)15 (18), 9718–9742. 10.18632/aging.205044
117
Zhang H. Sun Z. Li Y. Fan D. Jiang H. (2017). MicroRNA-200c binding to FN1 suppresses the proliferation, migration and invasion of gastric cancer cells. Biomed. Pharmacother.88, 285–292. 10.1016/j.biopha.2017.01.023
118
Zhang H. Yue X. Chen Z. Liu C. Wu W. Zhang N. et al (2023c). Define cancer-associated fibroblasts (CAFs) in the tumor microenvironment: new opportunities in cancer immunotherapy and advances in clinical trials. Mol. Cancer22 (1), 159. 10.1186/s12943-023-01860-5
119
Zhang L. Cui Y. Zhou G. Zhang Z. Zhang P. (2024a). Leveraging mitochondrial-programmed cell death dynamics to enhance prognostic accuracy and immunotherapy efficacy in lung adenocarcinoma. J. Immunother. Cancer12 (10), e010008. 10.1136/jitc-2024-010008
120
Zhang X. Lan Y. Xu J. Quan F. Zhao E. Deng C. et al (2019). CellMarker: a manually curated resource of cell markers in human and mouse. Nucleic Acids Res.47 (D1), D721–D728. 10.1093/nar/gky900
121
Zhang Y. Zhao Z. Huang W. Kim B. S. Lin L. Li X. et al (2024b). Pan-cancer single-cell analysis revealing the heterogeneity of cancer-associated fibroblasts in skin tumors. Curr. Gene Ther.25. 10.2174/0115665232331353240911080642
122
Zhao F. Hong J. Zhou G. Huang T. Lin Z. Zhang Y. et al (2024b). Elucidating the role of tumor-associated ALOX5+ mast cells with transformative function in cervical cancer progression via single-cell RNA sequencing. Front. Immunol.15, 1434450. 10.3389/fimmu.2024.1434450
123
Zhao F. Jiang X. Li Y. Huang T. Xiahou Z. Nie W. et al (2024a). Characterizing tumor biology and immune microenvironment in high-grade serous ovarian cancer via single-cell RNA sequencing: insights for targeted and personalized immunotherapy strategies. Front. Immunol.15, 1500153. 10.3389/fimmu.2024.1500153
124
Zhao J. Zou J. Jiao W. Lin L. Wang J. Lin Z. (2022b). Construction of N-7 methylguanine-related mRNA prognostic model in uterine corpus endometrial carcinoma based on multi-omics data and immune-related analysis. Sci. Rep.12 (1), 18813. 10.1038/s41598-022-22879-6
125
Zhao Q. Qian Q. Cao D. Yang J. Gui T. Shen K. (2018). Role of BMI1 in epithelial ovarian cancer: investigated via the CRISPR/Cas9 system and RNA sequencing. J. Ovarian Res.11 (1), 31. 10.1186/s13048-018-0406-z
126
Zhao Z. Ding Y. Tran L. J. Chai G. Lin L. (2023). Innovative breakthroughs facilitated by single-cell multi-omics: manipulating natural killer cell functionality correlates with a novel subcategory of melanoma cells. Front. Immunol.14, 1196892. 10.3389/fimmu.2023.1196892
127
Zhao Z. Dong Y. Xiahou Z. Sun C. (2025a). Single-cell atlas of endothelial cells in atherosclerosis: identifying C1 CXCL12+ ECs as key proliferative drivers for immunological precision therapeutics in atherosclerosis. Front. Immunol.16, 16–2025. 10.3389/fimmu.2025.1569988
128
Zhao Z. Li T. Dong X. Wang X. Zhang Z. Zhao C. et al (2021b). Untargeted metabolomic profiling of cuprizone-induced demyelination in mouse corpus callosum by UPLC-orbitrap/MS reveals potential metabolic biomarkers of CNS demyelination disorders. Oxid. Med. Cell Longev.2021, 7093844. 10.1155/2021/7093844
129
Zhao Z. Zhao Z. Lin Z. Fan L. Xiahou Z. Dong Y. et al (2025b). Decoding multiple myeloma: single-cell insights into tumor heterogeneity, immune dynamics, and disease progression. Front. Immunol.16, 16–2025. 10.3389/fimmu.2025.1584350
130
Zhao Z. J. Chen D. Zhou L. Y. Sun Z. L. Wang B. C. Feng D. F. (2022c). Prognostic value of different computed tomography scoring systems in patients with severe traumatic brain injury undergoing decompressive craniectomy. J. Comput. Assist. Tomogr.46 (5), 800–807. 10.1097/RCT.0000000000001343
131
Zhao Z. J. Wei D. P. Zheng R. Z. Peng T. Xiao X. Li F. S. (2021a). The gene coexpression analysis identifies functional modules dynamically changed after traumatic brain injury. Comput. Math. Methods Med.2021, 5511598. 10.1155/2021/5511598
132
Zhao Z. J. Zheng R. Z. Wang X. J. Li T. Q. Dong X. H. Zhao C. Y. et al (2022a). Integrating lipidomics and transcriptomics reveals the crosstalk between oxidative stress and neuroinflammation in central nervous system demyelination. Front. Aging Neurosci.14, 870957. 10.3389/fnagi.2022.870957
133
Zheng L. Qin S. Si W. Wang A. Xing B. Gao R. et al (2021). Pan-cancer single-cell landscape of tumor-infiltrating T cells. Science374 (6574), abe6474. 10.1126/science.abe6474
134
Zheng R. Zhuang Z. Zhao C. Zhao Z. Yang X. Zhou Y. et al (2022a). Chinese admission warning strategy for predicting the hospital discharge outcome in patients with traumatic brain injury. J. Clin. Med.11 (4), 974. 10.3390/jcm11040974
135
Zheng R. Z. Zhao Z. J. Yang X. T. Jiang S. W. Li Y. d. Li W. J. et al (2022b). Initial CT-based radiomics nomogram for predicting in-hospital mortality in patients with traumatic brain injury: a multicenter development and validation study. Neurol. Sci.43 (7), 4363–4372. 10.1007/s10072-022-05954-8
136
Zhou W. Lin Z. Tan W. (2024). Deciphering the molecular landscape: integrating single-cell transcriptomics to unravel myofibroblast dynamics and therapeutic targets in clear cell renal cell carcinomas. Front. Immunol.15, 1374931. 10.3389/fimmu.2024.1374931
137
Zhou Z. Wang H. Zhang X. Song M. Yao S. Jiang P. et al (2022). Defective autophagy contributes to endometrial epithelial-mesenchymal transition in intrauterine adhesions. Autophagy18 (10), 2427–2442. 10.1080/15548627.2022.2038994
138
Zhu J. W. Charkhchi P. Akbari M. R. (2022). Potential clinical utility of liquid biopsies in ovarian cancer. Mol. Cancer21 (1), 114. 10.1186/s12943-022-01588-8
139
Zou J. Lin Z. Jiao W. Chen J. Lin L. Zhang F. et al (2022). A multi-omics-based investigation of the prognostic and immunological impact of necroptosis-related mRNA in patients with cervical squamous carcinoma and adenocarcinoma. Sci. Rep.12 (1), 16773. 10.1038/s41598-022-20566-0
Summary
Keywords
FN1 signaling pathway, prognostic stratification, spatial transcriptomics, immune infiltration analysis, ovarian cancer
Citation
Zhang X, Xiahou Z, Zhao F, Wu Q, Nie W and Wang S (2025) Integrated multi-omics analysis reveals the immunotherapeutic significance of tumor cells with high FN1 expression in ovarian cancer. Front. Mol. Biosci. 12:1611964. doi: 10.3389/fmolb.2025.1611964
Received
15 April 2025
Accepted
30 May 2025
Published
19 June 2025
Volume
12 - 2025
Edited by
Pengpeng Zhang, Nanjing Medical University, China
Reviewed by
Hailin Tang, Sun Yat-sen University Cancer Center (SYSUCC), China
Yisheng Chen, Ningde Normal University, China
Biao Zhang, First Affiliated Hospital, Dalian Medical University, China
Updates
Copyright
© 2025 Zhang, Xiahou, Zhao, Wu, Nie and Wang.
This is an open-access article distributed under the terms of the Creative Commons Attribution License (CC BY). The use, distribution or reproduction in other forums is permitted, provided the original author(s) and the copyright owner(s) are credited and that the original publication in this journal is cited, in accordance with accepted academic practice. No use, distribution or reproduction is permitted which does not comply with these terms.
*Correspondence: Shouyan Wang, weihai58@163.com; Wei Nie, 609914572@qq.com
†These authors have contributed equally to this work and share first authorship
Disclaimer
All claims expressed in this article are solely those of the authors and do not necessarily represent those of their affiliated organizations, or those of the publisher, the editors and the reviewers. Any product that may be evaluated in this article or claim that may be made by its manufacturer is not guaranteed or endorsed by the publisher.