Abstract
Background:
Metabolic disorders and neurocognitive diseases frequently co-occur, yet the specific mechanisms driving this comorbidity remain elusive. While epidemiological associations are well-documented, the causal links between these conditions are complex and incompletely understood, necessitating a systems-level investigation into their shared biological architecture.
Methods:
This study integrates large-scale human genetics with experimental in vivo transcriptomics and computational chemistry to elucidate these shared pathways. Specifically, an AD-like murine model was used to experimentally prioritize a core network of 13 dysregulated genes within a pathologically relevant context.
Results:
Network-informed Mendelian randomization identified bidirectional causalities, including a 14% elevated dementia risk from type 2 diabetes and protective effects of obesity against parental Alzheimer’s disease (AD). The study identified a signature encompassing key lipid metabolism hubs APOE, CLU, and LDLR. This signature serves as a critical biological filter, anchoring human genetic associations by providing direct evidence of their dysregulation in a neurodegenerative environment. Subsequent chemical enrichment and molecular docking analyses indicated that these experimentally-prioritized targets are engaged by both therapeutic agents (e.g., valproic acid) and environmental toxins (e.g., benzo[a]pyrene).
Conclusion:
This multi-modal investigation provides a robust framework that converges on a high-confidence, 13-gene signature of lipid dysregulation as a central mechanistic interface, offering a powerful set of prioritized targets for future functional validation and therapeutic development at the metabolic-neurocognitive nexus.
Introduction
Age-related disorders, particularly metabolic and neurocognitive disorder, represent an escalating global health challenge. Neurodegenerative conditions, with Alzheimer’s disease (AD) as the most prevalent form of dementia, place a profound burden on affected individuals and healthcare systems worldwide (Manly et al., 2022). In parallel, metabolic disorders such as type 2 diabetes (T2D), obesity, and hypertension have reached epidemic proportions (Klein et al., 2022; Pasdar et al., 2024). Epidemiological studies consistently demonstrate strong associations between these disease classes; for example, midlife obesity and T2D are recognized risk factors for late-life dementia (Marrano et al., 2023; Toledano et al., 2024). However, observational findings are inherently susceptible to confounding and reverse causation, leaving the biological mechanisms and directionality of these relationships incompletely understood (Ezkurdia et al., 2023; Weijie et al., 2024).
Previous efforts to clarify these links have often relied on genetic approaches that use inherited variants as proxies for modifiable exposures, enabling causal inference with reduced confounding (Zhang et al., 2021; Hong et al., 2025; Wang F. et al., 2025). These studies have provided important insights, suggesting that metabolic traits may influence neurodegenerative risk (Domenighetti et al., 2024; Guo et al., 2025). However, while bidirectional MR has begun to illuminate these reciprocal influences, such analyses have largely been restricted to isolated, pairwise assessments. Consequently, a systems-level map that models the complex interplay and shared genetic architecture across a network of metabolically-linked neurocognitive disorder remains a critical, unaddressed gap. Moreover, translating statistical associations into actionable biological insight requires integration with functional genomics data to illuminate the molecular processes that mediate these effects (Ebrahim and Davey Smith, 2008; Tyner, 2017).
Here, we present a multi-stage analytical framework designed to map the shared causal architecture between metabolic and neurocognitive disease and to identify biologically meaningful molecular drivers. Critically, to avoid circular reasoning and selection bias, our pipeline begins with hypothesis-free, genome-wide inputs for both genetic (GWAS) and transcriptomic datasets. Rather than funneling data through pre-selected domains, we allowed key pathways to emerge naturally from the intersection of independent data modalities. We first apply a network-guided causal inference strategy to uncover robust, biologically coherent trait–trait relationships and cluster them into functional modules, thereby enhancing both statistical power and interpretability. Genetic variants supporting these relationships are then mapped to putative effector genes. To experimentally prioritize these candidates and validate their dysregulation in a relevant pathological context, we established an AD-like murine model and performed hippocampal RNA-sequencing. This approach enabled us to filter and rank genetically-implicated candidates based on their actual expression changes in a disease-relevant tissue environment, thereby bridging statistical associations with biological plausibility. The resulting set of high-confidence, dysregulated genes is then explored for therapeutic and environmental relevance by mapping their interactions with chemicals and drugs using the Comparative Toxicogenomics Database (CTD), followed by molecular docking simulations. These computational analyses are employed not as definitive validation, but to explore the structural plausibility of binding and to generate mechanistic hypotheses regarding how prioritized environmental agents might structurally engage with the identified gene targets.
We hypothesize that anchoring large-scale genetic causal inference with experimental transcriptomic data from an in vivo model will provide a robust framework for identifying a core set of shared molecular pathways underlying the comorbidity of metabolic and neurodegenerative disorders. By bridging causal inference with experimental prioritization and mechanistic insight, this study aims to (1) construct a systems-level causal landscape connecting metabolic and neurocognitive disorder, with a primary focus on identifying and dissecting bidirectional relationships that suggest shared feedback mechanisms; (2) experimentally prioritize and characterize the tissue-specific predictive utility of the key genes and pathways mediating these relationships within an in vivo pathological context; and (3) highlight molecular nodes that represent promising candidates for diagnostic, therapeutic, and preventive interventions, pending further functional validation studies. A schematic of the analytical strategy is provided in Figure 1 to illustrate the overall workflow.
FIGURE 1

Schematic overview of the multi-stage analytical framework for dissecting the shared causal architecture between metabolic and Neurocognitive Disorder. The analytical pipeline begins with a network-informed, bidirectional Mendelian randomization (MR) analysis to establish robust causal relationships between a curated panel of metabolic and neurodegenerative traits. Significant causal pairs are organized into functional modules. Genetic instruments (SNPs) underlying these causal links are mapped to their putative effector genes. To experimentally validate and prioritize these candidates within a relevant pathological context, we established an AD-like murine model and performed hippocampal RNA-sequencing, generating a high-confidence set of dysregulated genes. In a parallel stream, the biological pathways enriched by the initial set of putative genes are evaluated for functional relevance using a pathway-centric machine learning framework on six disease-specific transcriptomic datasets. In the final stage, the experimentally-prioritized driver genes from our in vivo model are queried against the Comparative Toxicogenomics Database (CTD) to identify potential interactions with drugs and environmental chemicals. High-priority chemical-gene pairs are then subjected to molecular docking analysis to provide structural evidence supporting these interactions. Overall, this integrated strategy is designed to systematically progress from broad genetic causal inference, through experimental validation in a disease-relevant model, to specific mechanistic insights and the identification of therapeutically relevant molecular targets.
Methods
Phenotype definitions and GWAS sources
To investigate the shared genetic architecture and potential causal pathways connecting metabolic disorders and neurocognitive disorder, we curated a focused panel of phenotypes representing two major categories of age-related disorders. The first category encompassed traits indicative of neurodegeneration and cognitive impairment, including AD and all-cause Dementia. The second category comprised classical metabolic disorders, namely hypertension, obesity, T2D, and non-alcoholic fatty liver disease (NAFLD), all of which have been implicated in the etiology and progression of cognitive decline.
Genome-wide association study (GWAS) datasets were retrieved from publicly accessible repositories, including the IEU OpenGWAS project (https://gwas.mrcieu.ac.uk/), the NHGRI-EBI GWAS Catalog (https://www.ebi.ac.uk/gwas/), and the FinnGen consortium (https://www.finngen.fi/en/consortium), ensuring standardized data processing and consistent quality control across studies. Neurodegenerative phenotypes were defined using both algorithm-derived endpoints from the UK Biobank (UKB, https://www.ukbiobank.ac.uk/) and registry-based clinical outcomes from FinnGen. The UKB-derived trait ieu-b-5067 captured AD status based on a composite definition incorporating hospital admission records, cognitive performance scores, and death registry data, analyzed using the BOLT-LMM framework (Mitchell et al., 2019). From FinnGen, we included three distinct AD endpoints—finn-b-G6_AD_WIDE (broad definition), finn-b-AD_LO (late-onset AD), and finn-b-AD_AM (atypical or mixed AD)—as well as two dementia-related phenotypes, finn-b-KRA_PSY_DEMENTIA (general dementia) and finn-b-F5_ALZHDEMENT (Alzheimer-related dementia).
Metabolic phenotypes were selected for their relevance to systemic vascular and metabolic dysfunction. Hypertension was represented by ukb-b-12493, corresponding to ICD-10 code I10 (essential hypertension), and ieu-b-5144, which defined early-onset hypertension based on internal UKB criteria. Obesity phenotypes included ieu-a-1096 (childhood obesity, EGG consortium) and ebi-a-GCST001475 (adult obesity, GIANT consortium), both derived from the meta-analysis by Bradfield et al. (2012). T2D was represented by four independent datasets: two from the Million Veteran Program (MVP)—ebi-a-GCST90013892 and ebi-a-GCST90013942, analyzed using Firth and saddlepoint approximation (SPA) correction models, respectively (Mbatchou et al., 2021)—and two BMI-adjusted trans-ancestry datasets, ebi-a-GCST007518 and ebi-a-GCST007516, from the meta-analysis by Mahajan et al. (2018). To capture hepatic metabolic contributions, two NAFLD datasets were included: ebi-a-GCST90091033 (Ghodsian et al., 2021) (histologically confirmed liver fat accumulation) and ebi-a-GCST90054782 (imaging-based liver fat content) (Ghodsian et al., 2021). These phenotypes provide important links between adiposity, hepatic lipid metabolism, and systemic inflammation, processes increasingly implicated in neurodegenerative pathology.
This ontology-driven phenotype selection established a robust foundation for investigating potential bidirectional genetic relationships between metabolic dysfunction and neurocognitive decline. Detailed phenotype definitions, sample sizes, ancestry compositions, and SNP coverage are provided in Table 1 and Supplementary Table S1.
TABLE 1
| Trait ID | Trait description | Sample size | PMID | Year | Population | nsnp |
|---|---|---|---|---|---|---|
| ieu-b-5067 | Alzheimer’s disease (UKB, algorithm-defined) | 488,285 | 35564004 | 2022 | European | 12,321,875 |
| finn-b-G6_AD_WIDE | Alzheimer’s disease, wide definition (FinnGen) | — | 34594039 | 2021 | European | 16,380,462 |
| finn-b-AD_LO | Alzheimer’s disease (late onset) | ∼2,670 cases | 34594039 | 2021 | European | 214,871 |
| finn-b-AD_AM | Alzheimer’s disease (atypical/mixed) | ∼800 cases | 34594039 | 2021 | European | 214,893 |
| finn-b-KRA_PSY_DEMENTIA | All-cause Dementia | ∼5,900 cases | 34594039 | 2021 | European | 212,859 |
| finn-b-F5_ALZHDEMENT | Dementia in Alzheimer’s disease | ∼2,200 cases | 34594039 | 2021 | European | 209,487 |
| ukb-b-12493 | Essential hypertension (ICD10: I10) | 463,010 | 29844963 | 2018 | European | 9,851,867 |
| ieu-b-5144 | Early-onset hypertension (UKB) | 462,826 | — | 2024 | European | 12,321,875 |
| ieu-a-1096 | Childhood obesity | 13,848 | 22484627 | 2012 | European | 2,442,739 |
| ebi-a-GCST001475 | Obesity (adult) | 13,848 | 22484627 | 2012 | European | 2,430,514 |
| ebi-a-GCST90013892 | Type 2 diabetes (Firth correction) | 406,831 | 34017140 | 2021 | European | 11,039,026 |
| ebi-a-GCST90013942 | Type 2 diabetes (SPA correction) | 406,831 | 34017140 | 2021 | European | 11,038,957 |
| ebi-a-GCST007518 | T2D (BMI-adjusted) | 298,957 | 29632382 | 2018 | European | 190,208 |
| ebi-a-GCST007516 | T2D (BMI-adjusted) | 298,957 | 29632382 | 2018 | European | 190,208 |
Characteristics of GWAS datasets.
Bidirectional two-sample Mendelian Randomization analysis
Following the curation of GWAS datasets, we conducted a bidirectional two-sample analysis to systematically evaluate the causal relationships between the selected metabolic and neurodegenerative traits. This bidirectional framework was applied in two complementary directions: in the forward analysis, metabolic disorders were treated as exposures and neurodegenerative traits as outcomes; conversely, in the reverse analysis, neurodegenerative traits served as exposures and metabolic disorders as outcomes. To reduce potential confounding from population stratification, all analyses were restricted to individuals of European ancestry.
For each exposure trait, we identified independent genetic instruments by selecting single nucleotide polymorphisms (SNPs) achieving genome-wide significance (P < 5 × 10⁻⁸) and applying linkage disequilibrium (LD) clumping (r2 < 0.001 within a 1,000 kb window). Effect estimates for these instruments were then extracted from the outcome GWAS datasets. To ensure valid causal estimates, allele harmonization was performed to align effect alleles between exposure and outcome datasets, resolve strand ambiguity for palindromic SNPs, and remove instruments that could not be reliably matched.
The primary causal effects were estimated using the random-effects inverse-variance weighted (IVW) method. Robustness was evaluated using several sensitivity analyses: MR-Egger regression to test for directional pleiotropy (a non-significant intercept, P > 0.05, indicating absence of bias), Cochran’s Q statistic to quantify heterogeneity among SNP-specific estimates, leave-one-out analysis to detect disproportionately influential instruments, and Radial MR (both IVW- and MR-Egger-weighted) to identify and down-weight outlier SNPs.
A causal association was considered robust and reported as a qualified finding only if it met three stringent criteria: (1) a statistically significant effect in the IVW analysis (P < 0.05); (2) no evidence of directional pleiotropy (MR-Egger intercept P > 0.05); and (3) no significant heterogeneity across instruments (Cochran’s Q test P > 0.05). To ensure the validity of the causal direction and address the potential for bias in highly pleiotropic regions, we rigorously applied Steiger filtering (Hemani et al., 2017). This procedure calculates the variance explained in the exposure versus the outcome, removing instruments that explain more variance in the outcome to mitigate reverse causation. Furthermore, regarding the APOE locus (chr19:44.9–45.9 Mb), while we acknowledge its extensive pleiotropy, we elected to retain instruments within this region to capture the complete genetic architecture shared between lipid metabolism and neurodegeneration (Kunkle et al., 2019). The application of Steiger filtering ensures that these powerful genetic signals are statistically anchored to the hypothesized causal direction rather than being artifacts of reverse causality. Odds ratios (ORs) and 95% confidence intervals (CIs) were derived from the beta coefficients for all qualified associations. All statistical analyses were performed in R using the “TwoSampleMR” (Hemani et al., 2018) and “RadialMR” (Bowden et al., 2018) packages.
Network-guided integration and filtering
To integrate the results systematically, we collated MR outputs from multiple independent analyses, harmonizing them into two master tables representing forward and reverse directions. Each record was assigned a unique identifier reflecting its original source. Using the forward-direction results, we constructed a trait-level causal network, in which nodes represented traits (exposures or outcomes) and edges represented statistically significant causal links. The Walktrap community detection algorithm was applied to partition this network into densely connected modules, capturing groups of biologically or functionally related traits.
We then applied a stringent network-informed filtering strategy to prioritize high-confidence causal relationships. Specifically, we defined a set of “core network relationships,” representing exposure–outcome pairs in which both traits resided within the same module, reasoning that intra-modular relationships were more likely to reflect coherent biological mechanisms. This curated core set was used as a bidirectional filter: in the forward analysis, only pairs matching the core set were retained, whereas in the reverse analysis, only those pairs exactly inverting a core forward relationship (i.e., exposure and outcome reversed) were retained. The resulting dataset comprised bidirectionally evaluated, module-consistent relationships. Each entry was annotated with its network module identifier and subsequently used for downstream analyses.
Identification, prioritization, and functional annotation of key genetic instruments
To determine the genetic variants underlying the observed causal relationships, we applied a multi-stage process encompassing SNP filtering, prioritization, and functional annotation. In the initial step, instrumental SNPs were selected using a stringent network-guided criterion derived from the previously defined core network relationships. These core relationships represent exposure–outcome pairs in which both traits reside within the same computationally defined biological module. For forward-direction analyses, a SNP was retained only if its exposure–outcome pair matched a core network relationship. For reverse-direction analyses, the selection criterion was symmetrically applied, retaining SNPs only when their exposure–outcome pair precisely inverted a core forward relationship. This approach ensured that only SNPs linked to robust, module-supported causal pathways were carried forward for subsequent analyses.
The retained SNPs were then prioritized based on their frequency of association, calculated as the number of distinct module-supported causal relationships in which each SNP served as an instrument. This frequency-based prioritization was performed separately for each original data source and for each causal direction (forward and reverse), enabling identification of robust instruments repeatedly implicated across multiple independent causal tests.
The final analytical step involved functional annotation of the prioritized SNPs to identify candidate effector genes. Positional mapping was performed using the human genome build hg19 as a reference. A candidate gene was assigned to a SNP if it was the closest annotated gene located within a 50 kb flanking region upstream or downstream of the SNP’s genomic coordinates. These functionally annotated SNP–gene pairs provided the foundation for subsequent biological pathway and network analyses.
Pathway and ontology enrichment analysis of key genes
To investigate the collective biological functions of the prioritized genes, we performed formal gene set enrichment analysis (GSEA) to identify biological pathways and ontology terms significantly over-represented within our gene lists. The reference for this analysis was the C5 ontology gene sets collection from the Molecular Signatures Database (Liberzon, 2014; Castanza et al., 2023) (MSigDB v2025.1. Hs, https://www.gsea-msigdb.org/gsea/msigdb). This resource integrates curated gene sets from two primary ontology sources: the Gene Ontology (GO) project, covering its three core domains—Biological Process (BP), Cellular Component (CC), and Molecular Function (MF)—and the Human Phenotype Ontology (HPO). To ensure functional relevance, the MSigDB C5 collection excludes overly broad gene sets (more than 2,000 members) and overly specific sets (fewer than five members). The analytical background was defined as the complete set of unique genes represented across all pathways in this collection.
The enrichment analysis was conducted separately for each group defined by a unique combination of original GWAS data source and direction of causal analysis (forward or reverse). For each group, we compiled a query list of unique key genes identified in the preceding SNP prioritization step. The statistical significance of enrichment for each gene set was evaluated using a one-sided hypergeometric test, which measures whether the observed overlap between the query genes and a given pathway exceeds the overlap expected by random chance. To correct for multiple testing across thousands of pathways, raw P-values from the hypergeometric tests were adjusted using the Benjamini–Hochberg False Discovery Rate (FDR) procedure. Gene sets were considered significantly enriched if they met the threshold of an FDR-adjusted P < 0.05.
Transcriptomic data acquisition and differential expression analysis
To characterize transcriptional alterations associated with disease states, we obtained six publicly available transcriptomic datasets from the Gene Expression Omnibus (GEO, https://www.ncbi.nlm.nih.gov/geo/): GSE5281 (AD) (Readhead et al., 2018), GSE140830 (all-cause Dementia), GSE122063 (VaD) (McKay et al., 2019), GSE184050 (T2D) (Chen et al., 2022), GSE262828 (Hypertension) (Ananthamohan et al., 2024), and GSE77962 (obesity) (Tareen et al., 2020). Each dataset provided pre-processed gene expression matrices and metadata specifying sample diagnosis and clinical status. Detailed dataset information, including sample size, tissue origin, and experimental platform, is provided in Table 2 and Supplementary Table S2.
TABLE 2
| Disease | GEO NO. | Sample size | Description | PMID |
|---|---|---|---|---|
| AD | GSE5281 | Total: 161 Controls: 74 Cases: 87 (cortical layer III neurons) |
This study profiled gene expression to identify molecular signatures of AD and aging. To eliminate tissue heterogeneity, laser capture microscopy (LCM) was used to isolate layer III pyramidal cells from six specific brain regions (entorhinal cortex, hippocampus, medial temporal gyrus, posterior cingulate, superior frontal gyrus, and primary visual cortex). Gene expression was measured using Affymetrix U133 plus 2.0 arrays. | 17077275; 18332434; 29937276; 18270320 |
| Dementia | GSE112681 | Total: 542 Controls: 281 Cases: 261 (bvFTD: 80, PSP: 54, nfvPPA: 47, svPPA: 44, CBS: 36) |
This study investigates the role of peripheral inflammation in dementia by analyzing gene expression profiles from total RNA obtained from peripheral blood. It compares a diverse set of dementia patients—including multiple Frontotemporal Dementia (FTD) spectrum disorders—to healthy controls to identify transcriptional signatures of inflammation. | 29939990; 31118040 |
| VaD | GSE131282 | Total: 136 Controls: 44 Cases: 92 (Alzheimer’s disease: 56, vascular dementia: 36) |
This study profiled gene expression on post-mortem frontal and temporal cortex tissue, comparing vascular Dementia (VaD), Alzheimer’s Disease (AD), and non-demented controls. VaD cases were selected for low Braak staging to minimize AD comorbidity, while AD and control cases were confirmed to have no infarcts. Gene expression was measured using Agilent human 8 × 60k v2 microarrays.c | 30990880 |
| Hypertension | GSE262828 | Total: 89 Low blood pressure: 43 Mid/Elevated blood pressure: 13 High blood pressure: 33``` |
This study aims to identify molecular mechanisms of target organ Damage (TOD) in youth with primary hypertension. Using high-throughput sequencing (RNA-seq), it profiled gene expression in circulating peripheral blood mononuclear cells (PBMCs) from youth stratified by blood pressure levels and the presence of TOD. The study is part of a larger multi-omics investigation to define circulatory regulators involved in blood pressure-mediated TOD. | 38948714 |
| Obesity | GSE77962 | Total: 152 (from 53 individuals) Baseline: ∼51 (inferred) After weight loss period: 50 After weight stable period: 51 |
This randomized controlled trial investigated the effect of weight loss rate on the adipose tissue transcriptome. Overweight and obese individuals were assigned to either a low-calorie diet (LCD) or a very-low-calorie diet (VLCD) to achieve similar total weight loss. Subcutaneous adipose tissue biopsies were collected at baseline, after the weight loss period, and after a subsequent weight stabilization period, with gene expression analyzed by microarray.c | 30380678; 27840413; 32015415 |
| T2D | GSE28894 | Total: 116 Controls: 66 Cases: 50 |
This longitudinal study investigated gene expression changes in whole blood to identify transcriptional signatures associated with the progression to type 2 Diabetes (T2D). Using high-throughput sequencing (RNA-seq), it compared subjects who transitioned to T2D over time against controls who did not. A key gene network associated with T2D transition status was identified and subsequently validated. | 35157052 |
Characteristics of gene expression datasets.
To ensure consistency across datasets, a standardized analysis workflow was applied. Importantly, to avoid artifacts arising from tissue heterogeneity and batch effects, we did not merge the raw expression matrices. Instead, each dataset underwent independent normalization and differential expression (DE) analysis specific to its tissue of origin (brain, blood, or adipose). This strategy ensures that the identified gene signatures reflect robust disease-associated changes within each specific biological context, rather than technical disparities between tissue types. Samples were classified into two groups based on study metadata: a “disease” group representing the pathological condition of interest and a “healthy control” (HC) group. Differential gene expression (DGE) analysis was performed using the “limma” (Ritchie et al., 2015) package in R, suitable for both microarray and RNA sequencing (RNA-seq) data. For each gene, a linear model was fitted to evaluate expression differences between disease and control groups using a design matrix constructed to capture group effects. This strategy ensures that the identified gene signatures reflect robust disease-associated changes within each specific biological context, distinguishing shared pathological mechanisms (e.g., lipid dysregulation) from generic systemic inflammation.
To enhance statistical power and stabilize variance estimates, particularly in datasets with modest sample sizes, empirical Bayes moderation was applied to model coefficients using the eBayes function. This procedure moderates standard errors by borrowing information across all genes, providing robust estimates of differential expression.
For each gene, the analysis generated log2 fold-change (logFC) values to quantify the magnitude of expression differences, along with associated P-values and Benjamini–Hochberg false discovery rate (FDR)–adjusted P-values. These results provided both the effect size and statistical significance for transcriptional changes between disease and control cohorts.
Pathway-centric machine learning framework
To build predictive models and identify key driver genes from the complex transcriptional landscapes of multiple disease states, we utilized six publicly available transcriptomic datasets covering both neurodegenerative conditions (AD, all-cause Dementia, and VaD) and metabolic disorders (T2D, Hypertension, and Obesity). From the biologically relevant gene sets identified through prior functional enrichment analyses, we selected subsets specifically associated with each disease category. Specifically, for each disease, the initial feature space for modeling was defined as the union of all genes belonging to pathways that were significantly enriched (FDR < 0.05) in the corresponding genetic analysis. These curated gene subsets served as the feature space for model construction, enabling the assessment of their predictive value for disease risk and the identification of potential molecular drivers.
Prior to model training, we applied a standardized preprocessing and feature selection pipeline to optimize the input data for each gene set. This pipeline consisted of three sequential steps: (1) Standardization, where gene expression values were transformed using a Z-score to ensure all features were on a comparable scale; (2) Low-Variance Filtering, to remove genes with near-constant expression that offer little discriminatory information; and (3) Univariate Feature Selection, which employed an ANOVA F-test to select the most significant genes associated with the disease status, dynamically adjusting the number of features to ensure a focused yet sufficiently complex feature set for modeling. This rigorous feature selection step was critical to mitigate the curse of dimensionality and reduce the risk of overfitting by focusing the models only on the most informative, pathway-restricted molecular features. To create a focused yet informative feature set, only genes with an ANOVA F-test P-value < 0.01 were retained for model training. This stringent, data-driven criterion ensures that only features with a strong univariate association with the phenotype are included, thereby reducing model complexity and the risk of including noisy variables.
Machine learning model repertoire
To robustly assess the predictive potential of our selected gene features, we employed a diverse suite of machine learning algorithms. This multi-model strategy was chosen to mitigate the risk of model-specific bias and to systematically explore a wide range of underlying data structures, from simple linear relationships to complex, non-linear interactions. The repertoire included.
Logistic Regression–a linear model providing a robust, interpretable performance baseline to establish benchmark performance.
Support Vector Machine (SVM) and K-Nearest Neighbors (KNN) – more complex non-linear models capable of capturing intricate decision boundaries and non-parametric relationships, respectively.
A variety of powerful ensemble methods, known for their high accuracy and inherent robustness against overfitting by aggregating predictions from multiple base learners. This included Random Forest and Extra Trees, which are parallel tree-based ensembles, as well as Gradient Boosting, XGBoost, and CatBoost, which are sequential ensembles that iteratively improve predictions.
Finally, to test the capacity to capture high-order feature interactions that might be missed by traditional algorithms, we included state-of-the-art deep learning models specifically designed for tabular data. These were TabNet, which uses sequential attention to enhance interpretability, and FT-Transformer (Fourier Transform Transformer). While computationally intensive, the inclusion of models like FT-Transformer was justified by their potential to uncover novel predictive patterns in complex transcriptomic data, even with modest sample sizes, when combined with our rigorous cross-validation framework.
Model evaluation and gene prioritization
A rigorous framework was implemented to evaluate model performance and identify key driver genes. All models were assessed using a 10-fold stratified cross-validation strategy to provide a robust and unbiased estimation of model performance on unseen data and to explicitly mitigate the risk of overfitting. During this process, we carefully monitored for significant discrepancies between training and validation performance metrics, which would indicate potential overfitting. The consistent performance observed across folds confirmed the generalizability of our models. Model performance was quantified using a comprehensive suite of metrics, including the area under the receiver operating characteristic curve (AUC-ROC), accuracy, F1-score, precision, recall, and Cohen’s kappa. For each pathway-specific model, a composite rank was derived by summing the individual performance ranks across all metrics, enabling the identification of models that consistently exhibited superior predictive performance.
To prioritize genes, we performed a hierarchical feature importance analysis restricted to the top five models as determined by the composite rank. Feature importance was extracted using methods appropriate to each model architecture: intrinsic importance scores were used for models with built-in ranking mechanisms (e.g., tree-based ensembles and linear models), whereas SHAP (SHapley Additive exPlanations) values were used for complex, non-linear models to estimate the marginal contribution of each gene to model predictions. The final comprehensive importance score for each gene was calculated by weighting its normalized importance from each of the top five models by the corresponding model’s composite rank, yielding a robust, performance-weighted measure of gene relevance within the diagnostic signature.
The machine learning model repertoire and evaluation framework were implemented using the following Python packages: pandas: v2.2.2, NumPy: v1.26.4, scikit-learn: v1.5.0, XGBoost: v2.1.0, CatBoost: v1.2.5, PyTorch: v2.3.0, pytorch_tabnet: v4.1.0, rtdl: v0.0.13, and SHAP: v0.45.0.
Prioritization of key disease-associated genes
To derive a high-confidence list of key driver genes from the machine learning results, we implemented a multi-stage, data-driven prioritization pipeline. This approach integrated evidence from the independently trained models for each disease cohort. By comparing high-performing features across these distinct, tissue-specific models, we identified shared molecular drivers that transcend tissue boundaries. This result-level integration allows for the detection of convergent pathological mechanisms—such as lipid dysregulation—while filtering out tissue-specific noise or generic systemic inflammation markers that might dominate a merged dataset.
The process began by quantifying model reliability through a Composite Model Performance Score. For each model within each pathway-specific gene set, six performance metrics (accuracy, AUC, F1-score, precision, recall, and Cohen’s kappa) were normalized to a 0–1 scale and averaged to produce a single score representing the overall predictive utility of the model.
Next, we calculated a Performance-Weighted Importance Score for each gene by multiplying its raw feature importance (as computed in the machine learning pipeline) by the Composite Model Performance Score of the model that identified it. This ensured that gene importance was up-weighted when derived from a robust, high-performing model and down-weighted when originating from a lower-performing one.
A final Gene Prioritization Score was then calculated for each gene within each disease dataset by summing its Performance-Weighted Importance Scores across all relevant pathways and models. This aggregation rewarded genes that were consistently identified as important across multiple predictive contexts. Genes were ranked in descending order based on this score, and a stringent selection criterion was applied: only the top 1% of genes for each disease context were retained for downstream analysis, yielding a high-confidence list of key driver genes.
Chemical-gene interaction network analysis
To explore the therapeutic potential of the prioritized genes, we interrogated the Comparative Toxicogenomics Database (CTD) (Wiegers et al., 2025) (http://ctdbase.org/), a curated resource detailing chemical–gene interactions and their relevance to human health. As of the July 2025 release, the CTD contained more than 3.1 million manually curated chemical–gene interactions, encompassing approximately 15,000 unique chemicals and 57,000 genes. This dataset is augmented by systematic integration with other authoritative bioinformatics resources, including NCBI Gene, KEGG, Reactome, GO, PubChem, ChemIDplus, and PubMed.
For each disease context, we identified the top five hub chemicals, defined as those interacting with the largest number of prioritized gene targets. These chemicals were classified as either “Drugs” or “Compounds” according to CTD annotations, enabling differentiation between potential therapeutic agents and environmental exposures. For each hub chemical, we constructed and analyzed chemical–gene interaction networks, representing chemicals and genes as nodes and curated interactions as edges. Each interaction was further annotated by its reported mode of action (e.g., activation, inhibition, or binding). To detect latent structural relationships, we applied the Louvain community detection algorithm, which identified densely interconnected modules of chemicals and genes.
Finally, to facilitate cross-disease comparisons, we integrated hub chemicals and their gene targets from all six disease contexts into a single bipartite network. This unified framework enabled the identification of shared therapeutic targets, potential pleiotropic effects, and molecular cross-talk among metabolic and neurodegenerative disorders.
Animal model and behavioral assessment
All animal procedures were conducted in accordance with the guidelines and approved by the Institutional Review Board of Hubei Minzu University. Ten-week-old, specific-pathogen-free (SPF) male Kunming mice (n = 5 per group) were sourced from Sibeck Biotechnology (Henan, China). Following a 7-day acclimatization period, an oxidative stress-induced model of aging-associated cognitive impairment, which mimics key features of sporadic AD, was established. Unlike transgenic models that replicate familial amyloid pathology, the D-galactose/sodium nitrite (D-gal/NaNO2) regimen was selected to specifically induce systemic oxidative stress, mitochondrial dysfunction, and metabolic dysregulation—the core shared pathways identified in our computational analysis (Rehman et al., 2017). The model group received daily subcutaneous injections of D-galactose (120 mg/kg/day) and sodium nitrite (55 mg/kg/day) for 60 consecutive days. The control group received vehicle injections. Both D-galactose and sodium nitrite were purchased from Aladdin Biochemical Technology Co., Ltd. (Shanghai, China).
Cognitive function was evaluated using the Morris Water Maze (MWM) test. For the spatial learning acquisition phase, mice were trained for five consecutive days to locate a hidden platform, with the escape latency recorded in each trial. On the sixth day, a probe trial was conducted by removing the platform to assess memory retention. The frequency of platform crossings and the time spent in the target quadrant were quantified as primary measures of spatial memory. All animal experiments were conducted under the ethical guidelines of the Hubei Minzu University Institutional Review Board.
Molecular analyses of hippocampal tissue
Following behavioral assessments, mice (n = 3 per group) were euthanized via intraperitoneal injection of sodium pentobarbital (100 mg/kg). Euthanasia was confirmed by the absence of corneal reflex, respiration, and heartbeat. Immediately following euthanasia, hippocampal tissues were rapidly dissected, flash-frozen in liquid nitrogen, and stored at −80 °C for subsequent molecular analysis (Meng et al., 2021).
Total RNA was extracted from the hippocampal tissue and subjected to global transcriptomic profiling. RNA sequencing libraries were prepared according to the manufacturer’s protocol and sequenced on an Illumina platform. The resulting raw sequencing data underwent a standard bioinformatic pipeline, which included quality control, alignment to the reference genome (e.g., GRCm39), and transcript quantification. Differential expression analysis was then performed to identify significant transcriptomic alterations between the model and control groups.
To validate key gene expression changes identified by RNA-seq, we quantified the relative mRNA levels of the neuronal synapse marker,
Grin2a, and the microglial inflammation marker,
Tnfrsf11b. Expression was normalized to the endogenous control gene,
Gapdh. The specific primers used for amplification were as follows:
Grin2a:
Forward: 5′-ACGTGACAGAACGCGAACTT-3′
Reverse: 5′-TCAGTGCGGTTCATCAATAACG-3′
Tnfrsf11b:
Forward: 5′-CCTTGCCCTGACCACTCTTAT-3′
Reverse: 5′-CACACACTCGGTTGTGGGT-3′
Gapdh:
Forward: 5′-GGTTGTCTCCTGCGACTTCA-3′
Reverse: 5′-TGGTCCAGGGTTTCTTACTCC-3′
Molecular docking analysis of prioritized chemical-target pairs
Molecular docking simulations were performed to predict binding affinities and characterize potential interaction modes between prioritized chemicals and their corresponding protein targets. Candidate chemical–protein pairs were selected based on curated interactions from the CTD, ensuring that each chemical was linked to at least one high-priority gene identified by the machine learning analysis and enriched across multiple disease contexts.
Three-dimensional protein structures were retrieved from the Protein Data Bank (PDB, https://www.rcsb.org/), and structural preparation was performed using the Molecular Operating Environment (MOE) software. Preprocessing steps included removal of co-crystallized water molecules and ligands, addition of hydrogen atoms, and assignment of protonation states of ionizable residues under physiological pH (7.4) using the Protonate 3D module. Canonical 2D ligand structures were obtained from the PubChem database, converted into 3D conformations, and energy-minimized using the AMBER10:EHT force field to generate stable geometries.
Docking was carried out using a rigid-receptor, flexible-ligand approach. Binding sites were identified using the Site Finder module, and ligand placement was performed using the Triangle Matcher algorithm, generating 30 distinct binding poses per ligand. These poses were scored using the London dG scoring function, which estimates the Gibbs free energy of binding (ΔG). For each chemical–target pair, the top-scoring pose representing the most favorable binding configuration was selected for detailed characterization, including non-covalent interactions such as hydrogen bonding, hydrophobic contacts, and π–π stacking, to elucidate the molecular basis of ligand binding.
Statistical analysis
All statistical analyses were performed in R (v4.3.0) and Python (v3.10). Genome-wide association signals were filtered at P < 5 × 10⁻⁸. Differential expression analyses applied the limma package with empirical Bayes moderation and Benjamini–Hochberg false discovery rate (FDR) correction (P < 0.05). Machine learning models were evaluated using 10-fold stratified cross-validation, with model performance assessed by AUC-ROC, accuracy, precision, recall, F1-score, and Cohen’s kappa. Functional enrichment analyses used a one-sided hypergeometric test with FDR adjustment (P < 0.05). Functional enrichment analysis of prioritized genes employed a one-sided hypergeometric test with FDR adjustment (P < 0.05). Chemical–gene network analyses used the Louvain community detection algorithm to identify functionally coherent interaction modules. Molecular docking results were evaluated based on London dG binding scores, with lower ΔG values indicating higher binding affinity.
Results
Network-informed Mendelian randomization reveals complex causal architectures
Our network-informed MR analysis partitioned the causal landscape into six functionally distinct modules, uncovering a complex architecture of risk-conferring, protective, and bidirectional relationships (Figure 2A; Supplementary Table S3). A comprehensive summary of each module is presented in Table 3, while the main text below highlights the key biological narratives, supported by their most representative statistical evidence.
FIGURE 2

Mendelian randomization uncovers causal links and shared genetic architecture between metabolic and neurocognitive disorder. (A) The Mendelian Randomization association network systematically maps the causal architecture linking metabolic and Neurocognitive Disorder. The analysis partitions significant associations into six functionally distinct modules, indicated by edge color. This data-driven network reveals a complex landscape of both risk-conferring and protective effects. For instance, Module 1 highlights the contrasting effects of hypertension, which is protective against one dementia subtype while being a risk factor for another. Modules 2 and 4 are characterized by protective links, where obesity is associated with a reduced risk of AD. In contrast, Module 5 identifies a single, potent risk association between primary hypertension and early-onset AD. The largest and most interconnected cluster, Module 6, demonstrates significant bidirectional causality between Type 2 Diabetes (T2D) and dementia, indicative of an intricate feedback mechanism between these conditions. (B) Forest plots display the most significant Mendelian Randomization results, filtered to show up to the top 10 associations per module, ranked by p-value. For modules containing more than 10 significant findings, the label indicates that the top 10 are shown (e.g., Module 6, Top 10 of 100). The source metabolic disease category (Hypertension, T2D, or Obesity) for each association is indicated by the color of the exposure label on the y-axis. These plots powerfully illustrate key findings, such as the bidirectional relationship in Module 6, where forward analysis (T2D → Dementia) shows increased risk (OR > 1) and reverse analysis (Dementia → T2D) shows a protective effect (OR < 1). (C) Key SNP-Gene Chord Diagrams map the genetic instruments (SNPs) to their annotated genes for the primary causal associations. These diagrams reveal the genetic architecture mediating the interplay between metabolic disorders and AD/Dementia. • Hypertension and Dementia/AD: In the forward direction (Hypertension → Dementia/AD), instrumental variants map to genes including ABHD16A, APOM, MTHFR, and NPPA. In the reverse direction, the genetic instruments converge primarily on the APOE/TOMM40 locus, with other implicated genes including PVRL2 and BCAM. • Obesity and Dementia/AD: Forward analysis implicated well-established obesity-related loci, including FTO, BDNF, and TMEM18. The reverse analysis was dominated by instruments in the APOE/TOMM40 region, along with other known AD-risk genes such as BIN1, CLU, and PVRL2. • T2D and Dementia/AD: Forward analysis revealed SNPs in genes related to glucose metabolism (GIPR, ATP6V1G2) and immune pathways (PSORS1C1). In the reverse direction, the APOE/TOMM40 locus was again central, with additional implicated genes like RELB and PVRL2, suggesting complex interactions between neurodegeneration and glucose homeostasis.
TABLE 3
| Module ID | Core biological theme | Key causal relationship | Key biological Takeaway | Representative effect (OR [95% CI]) | P-value |
|---|---|---|---|---|---|
| 1 | Contrasting effects of hypertension on Dementia | Early-onset hypertension → ↓ Lewy body Dementia; early-onset hypertension → ↑ Atypical/Mixed AD | Hypertension exhibits subtype-specific effects, conferring strong protection against one form of dementia while dramatically increasing risk for another, suggesting distinct underlying vascular pathologies. | 1.71 × 10⁻⁸ [1.86 × 10⁻¹⁴–0.016]; 5.66 × 10⁸ [3.05–1.05 × 10¹⁷] |
0.011; 0.038 |
| 2 | Protective effects of metabolic traits on familial AD | Obesity → ↓ parental history of AD; T2D → ↓ parental history of AD | Genetic predisposition to obesity and T2D is paradoxically associated with a reduced risk of having a parental history of AD, hinting at complex genetic interactions or survival biases. | 0.94 [0.89–0.996]; 0.96 [0.93–0.994] |
0.035; 0.020 |
| 3 | Nuanced and bidirectional Obesity-AD links | Class 2 obesity → ↑ AD risk; childhood obesity → ↓ AD risk | The effect of obesity on AD is context-dependent: Severe adult obesity slightly increases risk, while childhood obesity is protective, suggesting different mechanisms related to timing and severity. | 1.0005 [1.0002–1.0009]; 0.52 [0.29–0.93] |
0.0035; 0.028 |
| 4 | Consistent protective effect of obesity on AD | Obesity/Hyperalimentation → ↓ AD risk | Multiple genetic definitions of obesity consistently show a protective causal effect against developing AD, challenging the conventional view of obesity as a universal risk factor. | 0.90 [0.86–0.95] | 1.12 × 10⁻⁵ |
| 5 | Potent hypertension risk for early-onset AD | Essential hypertension → ↑ AD risk | A strong, specific causal link exists where primary hypertension dramatically increases the risk of early-onset AD, highlighting a critical role for vascular health in this aggressive form of the disease. | 32.17 [1.42–729.21] | 0.029 |
| 6 | Bidirectional T2D-Dementia interplay | T2D → ↑ all-cause Dementia; AD → ↓ T2D risk (protective) | Reveals a complex feedback loop: while T2D is a causal risk factor for dementia, the genetic liability for AD, in turn, confers a protective effect against developing T2D. | 1.14 [1.07–1.21]; 0.96 [0.94–0.98] |
3.29 × 10⁻⁵; 3.36 × 10⁻⁵ |
Summary of causal modules linking metabolic and neurocognitive phenotypes identified by network-informed mendelian randomization.
The causal influence of hypertension proved to be remarkably potent and context-dependent. It emerged as a potential causal risk factor for early-onset alzheimer’s disease (AD), increasing the risk over 30-fold (Module 5; ukb-b-12493 → finn-b-AD_EO_EXMORE; OR = 32.17; 95% CI: 1.42–729.21; P = 0.029). While the primary IVW analysis yielded a notably high odds ratio (OR = 32.17), the extremely wide confidence intervals (95% CI: 1.42–729.21) indicate substantial statistical uncertainty. This magnitude likely reflects the “winner’s curse” phenomenon often observed in MR analyses when exposure and outcome sample sizes are vastly disproportionate (Burgess et al., 2019). Therefore, we interpret this not as a precise clinical risk estimate, but as a robust qualitative signal indicating that early vascular dysregulation significantly elevates AD trajectory. Yet, it also exhibited a paradoxical, subtype-specific effect, simultaneously conferring profound protection against Lewy Body Dementia (Module 1; ieu-b-5142 → ebi-a-GCST90001390; OR = 1.71 × 10⁻⁸; P = 0.011) while dramatically increasing the risk for atypical or mixed AD (ieu-b-5142 → finn-b-AD_AM_EXMORE; OR = 5.66 × 10⁸; P = 0.038). These findings strongly suggest that the impact of vascular health on neurodegeneration is highly specific to the underlying dementia pathology.
Our findings on obesity challenged its conventional role as a straightforward risk factor. Across multiple genetic definitions, obesity consistently demonstrated a protective causal effect against AD, with the most significant association observed for obesity with hyperalimentation (Module 4; finn-b-E4_OBESITY_HYPER → ebi-a-GCST90027158; OR = 0.90; 95% CI: 0.86–0.95; P = 1.12 × 10⁻⁵). This protective signal was further nuanced by a context-dependent relationship where childhood obesity was strongly protective (Module 3; ieu-a-1096 → finn-b-AD_U_EXMORE; OR = 0.52; 95% CI: 0.29–0.93; P = 0.028), while severe class 2 adult obesity conferred a marginal but statistically significant risk (ieu-a-91 → ieu-b-5067; OR = 1.0005; 95% CI: 1.0002–1.0009; P = 0.0035). Together, these results indicate that the timing and nature of adiposity are critical determinants of its effect on neurocognitive health.
Perhaps the most compelling evidence for systemic interplay was found in Module 6, which uncovered a significant bidirectional feedback loop between Type 2 Diabetes (T2D) and dementia. While genetic liability for T2D consistently increased the risk for all-cause dementia (ebi-a-GCST90013892 → finn-b-F5_DEMENTIA; OR = 1.14; 95% CI: 1.07–1.21; P = 3.29 × 10⁻⁵), a reverse causal effect was also robustly evident: a genetic predisposition for AD was, in turn, protective against the development of T2D (finn-b-G6_ALZHEIMER_EXMORE → ebi-a-GCST90013942; OR = 0.96; 95% CI: 0.94–0.98; P = 3.36 × 10⁻⁵). This reciprocal relationship points to a deeply integrated, shared pathophysiology between central glucose metabolism and neurodegenerative processes (Figures 2A,B; Supplementary Table S4).
In addition to these core modules, our analysis identified a protective causal effect of dementia liability on the risk of NAFLD. Genetic liability for a paternal history of AD/Dementia (ukb-b-323), for instance, was associated with a striking reduction in the odds of imaging-defined NAFLD (ebi-a-GCST90054782) (OR = 0.0007; 95% CI: 3.22 × 10⁻⁵–0.014; P = 2.26 × 10⁻⁶). This protective signal was consistent across multiple dementia definitions, including “Any dementia” (finn-b-KRA_PSY_DEMENTIA) (OR = 0.84; 95% CI: 0.80–0.89; P = 2.49 × 10⁻¹⁰). While this dementia-to-NAFLD protective link represents a highly significant finding, its unidirectional nature places it in a distinct mechanistic category from the reciprocally-linked metabolic-neurocognitive axes that form the core of our investigation. To maintain a focused analytical scope on these bidirectional feedback loops, which we hypothesized represent the most tightly integrated shared pathologies, we prioritized the symmetric relationships for our initial multi-omics integration. This approach allows for a coherent dissection of the shared molecular architecture underlying these specific reciprocal effects. However, we acknowledge that the protective effect on NAFLD is a critical observation that highlights a potentially distinct biological pathway. It was therefore set aside not due to a lack of importance, but as a key finding that warrants a dedicated, separate investigation to unravel its unique molecular drivers, which may differ from the shared mechanisms explored here. All MR and sensitivity analysis results are presented in Supplementary Tables S5–S8.
Identification of key genetic loci driving causal associations
To dissect the molecular underpinnings of these causal relationships, we investigated the genetic instruments and their annotated genes, providing insights into the genetic architecture mediating the interplay between metabolic disorders and neurocognitive disorder.
For Hypertension and AD/Dementia associations, forward-direction analysis (metabolic exposure to neurodegenerative outcome) identified instrumental variants, including SNPs such as rs1052486, rs1077394, and rs750332, mapping to genes ABHD16A, AIF1, and APOM. Additional loci included rs115740542 and rs198851 (associated with HFE and HIST1H1E) and rs12567136 and rs149764880 (linked to MTHFR and NPPA). In the reverse direction (neurodegenerative exposure to metabolic outcome), genetic instruments primarily converged on the APOE/TOMM40 locus, with SNPs such as rs429358, rs769449, and rs2972558. Other implicated genes included PVRL2 (rs2972558) and BCAM (rs2972558), suggesting roles for lipid metabolism and neuronal adhesion pathways.
For Obesity and AD/Dementia associations, forward-direction analysis implicated obesity-related loci, including variants within or near the FTO gene (rs11075989, rs1121980, rs1558902) and the BDNF gene (rs11030104, rs11030112, rs2030323). Other genes included TMEM18 (rs12623218, rs13393304), frequently associated with body mass index. In the reverse direction, instruments were predominantly in the APOE/TOMM40 region (rs112019714, rs117310449, rs190651665), with additional genes BIN1 (rs6733839), CLU (rs1532277, rs867230), and PVRL2 (multiple SNPs), indicating genetic interplay between AD and obesity.
For T2D and AD/Dementia associations, forward-direction analysis revealed SNPs in genes related to glucose metabolism, such as GIPR (rs10408179, rs10420309) and ATP6V1G2 (rs2857605, rs3130924). Additional instruments were near PSORS1C1 (rs1065461, rs2233978, rs3132520) and VNN2 (rs7773338). In the reverse direction, the APOE/TOMM40 locus was central (rs429358, rs112784534, rs769449), with additional genes RELB (rs35080293, rs6509191) and PVRL2 (multiple SNPs), suggesting complex interactions between neurodegenerative pathways and glucose homeostasis (Figure 2C; Supplementary Table S9).
Genetic drivers and their recurrence in causal networks
To elucidate the genetic underpinnings of the causal networks between metabolic disorders and neurocognitive disorder, we conducted an intersection analysis of instrumental SNPs and prioritized them by recurrence frequency across significant MR tests. This analysis revealed both unique and shared genetic drivers, highlighting asymmetry in the robustness of genetic signals across forward and reverse causal directions.
In the forward direction (metabolic disorders to AD/Dementia), large, distinct SNP sets were identified: 496 unique SNPs supported the hypertension-to-AD/Dementia network (e.g., rs74661587, rs12258967), 478 supported the T2D-to-AD/Dementia network (e.g., rs10830963, rs2796441), and 39 supported the obesity-to-AD/Dementia network (e.g., rs7138803, rs4854344). The T2D-to-AD/Dementia network exhibited the most robust genetic signal, with highly recurrent SNPs including rs10830963 (frequency = 79), rs2796441 (frequency = 74), and rs11708067 (frequency = 69), averaging 63.5 for the top 10 SNPs. In contrast, the obesity-to-AD/Dementia network had a top SNP, rs7138803 (frequency = 8), and the hypertension-to-AD/Dementia network had rs74661587 (frequency = 5), indicating less concentrated genetic signals.
In the reverse direction (AD/Dementia to metabolic disorders), smaller SNP sets were observed: 67 for obesity (e.g., rs7384878, rs10933431), 25 for T2D (e.g., rs111371860, rs147963283), and 3 for hypertension (e.g., rs2230288, rs6599388, rs7680557). The AD/Dementia-to-T2D network showed the highest recurrence, with rs429358 (APOE, frequency = 19) and rs111371860 (frequency = 18). The AD/Dementia-to-obesity network included SNPs like rs10792832, rs6733839 (BIN1), and rs7384878 (frequency = 5). The AD/Dementia-to-hypertension network was the most diffuse, with rs12984643 and rs429358 (APOE) each at a frequency of 2 (Figure 3A).
FIGURE 3

Genetic architecture of causal networks: shared snps and high-frequency drivers. (A) A cross-disease comparative analysis of instrumental SNPs from the six primary causal pathways. The bar chart quantifies the number of SNPs unique to each causal pathway (colored bars) and those shared between pathways (grey bars). In the forward direction, large sets of unique SNPs support the causal links from Hypertension to AD/Dementia (496 SNPs) and T2D to AD/Dementia (478 SNPs). In contrast, the reverse direction pathways are supported by smaller SNP sets. The grey bars highlight key pleiotropic SNPs, such as rs429358, which is common to the reverse causal effects of AD/Dementia on both hypertension and T2D. (B) High-frequency SNP profiles for each causal direction, displaying the top 10 most recurrent SNPs. The frequency of each SNP is noted within the circle, and the diamond marker indicates the average frequency of the top 10. The analysis reveals a highly concentrated genetic signal for the T2D-to-AD/Dementia network, driven by exceptionally frequent SNPs like rs10830963 (frequency = 79) and rs2796441 (frequency = 74). In contrast, the forward signals from hypertension and obesity, as well as all reverse-direction signals, are more diffuse, characterized by SNPs with much lower recurrence frequencies. These findings highlight a strong, concentrated genetic basis for T2D-driven neurodegeneration and a more heterogeneous genetic architecture for other causal relationships.
Pleiotropic loci underscored shared mechanisms across networks. rs429358 was common to AD/Dementia effects on hypertension and T2D, and the reciprocal T2D-to-AD/Dementia network. rs6733839 linked AD/Dementia to hypertension and obesity. Five SNPs, including rs769449 and rs2972558, were shared in reverse effects on hypertension and T2D, while five others, including rs56094641 and rs6905288, connected forward effects of hypertension and T2D on dementia. Four SNPs, including rs10792832 and rs1532277, linked AD/Dementia to obesity and T2D, and five, including rs1558902 and rs12967878, connected obesity and T2D to AD/Dementia. These findings highlight a concentrated genetic signal for T2D-driven neurodegeneration and a more heterogeneous basis for reverse effects (Figure 3B; Supplementary Table S10).
Comparative performance of diagnostic models across multiple disease cohorts
To develop biologically informed diagnostic models, we identified gene sets representing key biological pathways implicated in the causal networks linking metabolic and neurocognitive disorder. This process involved multiple steps: first, we prioritized genetic instruments that were both part of robust, network-supported causal links and recurrent across multiple such links. Next, we mapped these SNPs to their putative effector genes using positional mapping. Finally, gene set enrichment analysis against the MSigDB C5 ontology database identified 121, 174, and 158 significantly enriched biological gene sets for the Hypertension-Dementia, Obesity-Dementia, and T2D-Dementia causal networks, respectively (Supplementary Table S11). To evaluate the diagnostic potential of these gene sets, we trained and tested ten machine learning models on six disease-specific transcriptomic datasets, assessing performance via the AUC. Model performance varied significantly across diseases and algorithmic architectures, revealing a clear hierarchy in the predictive power of gene expression signatures.
In neurodegenerative cohorts, particularly VaD and AD, models achieved exceptional discrimination. For VaD, the FT-Transformer led with an AUC of 0.908, followed closely by the Support Vector Machine (SVM) (AUC = 0.900) and ExtraTrees (AUC = 0.899). Similarly, in the AD cohort, the FT-Transformer excelled (AUC = 0.874), with SVM (AUC = 0.825) and ExtraTrees (AUC = 0.809) also demonstrating strong predictive utility. For Obesity and T2D, models showed moderate predictive power, with the FT-Transformer again outperforming others, achieving AUCs of 0.804 for Obesity and 0.662 for T2D. In contrast, gene signatures for general Dementia and Hypertension exhibited limited diagnostic potential, with the best models—FT-Transformer for Dementia (AUC = 0.594) and Logistic Regression for Hypertension (AUC = 0.598)—performing only marginally better than random chance.
Cross-model comparisons highlighted the consistent superiority of the deep learning FT-Transformer, which was the top performer in five of six datasets and highly competitive in the sixth. A second tier of effective models included SVM and tree-based ensemble methods (ExtraTrees and CatBoost), which provided robust predictions across most datasets. Simpler models, such as Logistic Regression and KNN, offered reliable baseline performance but rarely excelled. Notably, the TabNet model consistently underperformed, with AUCs approximating random chance (≈0.5) across all datasets (Figure 4A; Supplementary Table S12).
FIGURE 4

Predictive modeling and multi-omics integration identify key genes and pathways in metabolic and neurocognitive disorder. (A) Comparative performance profile of nine machine learning models across six disease datasets, evaluated by mean Receiver Operating Characteristic Area Under the Curve (ROC AUC). The analysis demonstrates exceptional predictive accuracy for neurodegenerative cohorts, particularly Vascular Dementia (VaD) and Alzheimer’s Disease (AD). For VaD, the FT-Transformer model achieved a leading AUC of 0.908, closely followed by Support Vector Machine (SVM) (AUC = 0.900) and ExtraTrees (AUC = 0.899). Similarly, in the AD cohort, the FT-Transformer excelled with an AUC of 0.874. Models for metabolic disorders showed moderate to strong performance, with the FT-Transformer achieving an AUC of 0.804 for Obesity but a more modest 0.662 for T2D. In contrast, gene signatures for general Dementia (top AUC = 0.594) and Hypertension (top AUC = 0.598) showed limited diagnostic potential, performing only marginally above the random chance baseline (AUC = 0.5). The FT-Transformer consistently emerged as the superior model, while TabNet consistently underperformed across all datasets. (B) Upset plot analysis identifying shared high-performance biological pathways across disease combinations. This analysis reveals significant overlap in the predictive gene sets, pointing to common molecular mechanisms. The strongest overlap was identified between AD and VaD, with 205 shared pathways, led by “PROTEIN LOCALIZATION TO EXTRACELLULAR REGION” (performance score = 0.969) and “CARBOHYDRATE HOMEOSTASIS” (score = 0.958). A set of 19 pathways was shared among AD, Obesity, and VaD, with top performers including “POSITIVE REGULATION OF MULTICELLULAR ORGANISMAL PROCESS” and “LIPID METABOLIC PROCESS” (both score = 0.914). These findings underscore that shared vulnerabilities in protein localization, carbohydrate homeostasis, and lipid metabolism link these distinct age-related disorders. (C) Quantitative assessment and ranking of the top 30 elite genes based on a Holistic Gene Score. This composite score integrates performance-weighted importance from all models with a robustness factor (“Total Hits”) representing the frequency of a gene’s selection across all analyses. The results reveal two distinct gene archetypes: (1) high-impact “specialist” genes, such as SORL1 in AD (top-ranked with only 1 hit) and CPT1A in T2D (highly ranked with 2 hits), which derive their importance from potent, context-specific roles; and (2) broadly influential “generalist” genes, like APOE and APOC1 (each with 4 hits across AD and VaD), which gain prominence through consistent involvement across multiple disease contexts and predictive models. (D) Prioritization of the top 10 elite genes within each disease dataset using a Dataset-Specific Score. This score aggregates a gene’s weighted importance and appearance frequency within a single disease context. Lines connect identical genes across datasets, revealing key pleiotropic players. The analysis shows a striking convergence on lipid metabolism. APOE stands out as a highly pleiotropic gene, ranking first for VaD, Obesity, and Hypertension. APOC1 and CLU are core components of a shared neurodegenerative signature across AD, Dementia, and VaD. Disease-specific leaders, such as SORL1 in AD and CPT1A (fatty acid oxidation) in T2D, are also identified. This reinforces the central role of dysregulated lipid metabolism as a shared biological mechanism linking these metabolic and Neurocognitive Disorder.
Pairwise statistical comparisons confirmed significantly higher predictive accuracy in neurodegenerative cohorts (AD, VaD) compared to metabolic disorders (P < 0.0001). The SVM demonstrated robust and balanced performance, significantly outperforming ensemble models like RandomForest in accuracy for the AD cohort (P < 0.0001). The FT-Transformer exhibited a specialized advantage in class discrimination and sensitivity, achieving significantly higher AUC (P < 0.0001) and recall (P < 0.0001) compared to other models in the AD dataset (Supplementary Figures S1 and S2; Supplementary Table S13). These findings underscore the disease-specific diagnostic potential of transcriptomic signatures and the FT-Transformer’s consistent superiority as a classification framework.
Identification of predictive gene sets for disease classification
Our pathway-centric machine learning approach identified gene sets with robust predictive utility for classifying disease states, revealing both disease-specific and shared biological pathways. The diagnostic performance of these gene sets varied across diseases, reflecting distinct transcriptomic signatures underlying metabolic and neurodegenerative conditions.
For VaD, numerous gene sets exhibited exceptional discriminatory power, achieving AUC values exceeding 0.98 across all metrics. These high-performing gene sets, derived from causal links involving Hypertension, Obesity, and T2D, were functionally diverse. Key examples include CARBOHYDRATE HOMEOSTASIS (from the T2D→Dementia network), AMYLOID PRECURSOR PROTEIN METABOLIC PROCESS (Obesity→Dementia), and VASCULAR PROCESS IN CIRCULATORY SYSTEM (Hypertension→Dementia). These pathways, linked to glucose regulation, amyloid processing, and vascular function, respectively, underscore the strong transcriptomic signatures driving VaD classification.
For AD, gene sets consistently delivered high classification performance. The top-performing gene set, PROTEIN LOCALIZATION TO EXTRACELLULAR REGION (T2D→Dementia), achieved an AUC of 0.943 and an accuracy of 0.944, followed closely by POSITIVE REGULATION OF MULTICELLULAR ORGANISMAL PROCESS (Obesity→Dementia), with identical AUC and accuracy of 0.943 and 0.944. Other notable gene sets included CELL ACTIVATION (immune function), REGULATION OF TRANSPORT, and PHOSPHOLIPID TRANSPORT (cellular transport and metabolism), all with AUCs exceeding 0.91, highlighting the role of extracellular protein dynamics and immune regulation in AD diagnostics.
In metabolic cohorts, gene sets showed moderate predictive performance. For Obesity, the most predictive signatures, primarily from the reverse Dementia→Obesity network, were linked to lipid biology. The top gene set, LIPID METABOLIC PROCESS, achieved an AUC of 0.890 and an accuracy of 0.890, followed by LIPID LOCALIZATION (AUC = 0.916) and REGULATION OF KETONE METABOLIC PROCESS (AUC = 0.860). For Hypertension, REGULATION OF ANATOMICAL STRUCTURE SIZE (Hypertension→Dementia) was the most predictive, with an AUC of 0.863 and an accuracy of 0.856. For T2D, PROTEIN LOCALIZATION TO EXTRACELLULAR REGION (T2D→Dementia) yielded an AUC of 0.807 and an accuracy of 0.808. In the general Dementia cohort, where predictive signals were weaker, REPRODUCTIVE SYSTEM DEVELOPMENT (Hypertension→Dementia) performed best, with an AUC of 0.698 (Supplementary Figure S3; Supplementary Table S14).
Intersection analysis of high-performing gene sets revealed pleiotropic pathways with predictive utility across multiple diseases. REGULATION OF ANATOMICAL STRUCTURE SIZE was a shared signature across AD, Hypertension, and VaD (overall score = 0.901). A group of 19 gene sets was shared among AD, Obesity, and VaD, with top-ranked pathways including POSITIVE REGULATION OF MULTICELLULAR ORGANISMAL PROCESS and LIPID METABOLIC PROCESS (both with overall score = 0.914). The strongest overlap occurred between AD and VaD, with 205 shared predictive gene sets, led by PROTEIN LOCALIZATION TO EXTRACELLULAR REGION (overall score = 0.969) and CARBOHYDRATE HOMEOSTASIS (overall score = 0.958). These results highlight disease-specific transcriptomic signatures alongside shared pathways related to metabolism, protein localization, and organismal regulation, reflecting common biological vulnerabilities across these age-related disorders (Figure 4B).
Cross-disease prioritization of key genes reveals specialist and generalist signatures
To systematically prioritize the most impactful genes across metabolic and neurocognitive disorder, we developed a Holistic Gene Score. This score aggregates performance-weighted importance scores from all models and pathways, multiplied by a robustness factor derived from the logarithm of a gene’s total appearances (Total_Hits), which reflects the number of times a gene was identified as a predictive feature across all models, pathways, and disease datasets. This unified framework balances raw predictive power with consistency across diverse biological and analytical contexts. Analysis of contribution patterns revealed two gene archetypes: high-impact “specialist” genes and broadly influential “generalist” genes. Specialist genes, such as SORL1 in AD (Total_Hits = 1), achieved top rankings through exceptional influence in specific predictive pathways. Similarly, LDLR in general Dementia (Total_Hits = 3) and CPT1A in T2D (Total_Hits = 2) secured high ranks via limited but potent contributions. In contrast, generalist genes like APOE and APOC1, each identified in four contexts (Total_Hits = 4) for AD and VaD, and CAV1 across three contexts (AD, Obesity, VaD), gained prominence through consistent involvement across multiple models and pathways. This distinction highlights that a gene’s significance in a disease’s transcriptomic signature can arise from either context-specific potency or widespread influence across biological processes (Figure 4C).
For disease-specific prioritization, we calculated a Dataset-Specific Score for each gene by aggregating performance-weighted importance scores from all models and pathways, weighted by the logarithm of appearance frequency. This approach prioritized genes with consistent importance across high-performing models and frequent roles in distinct pathways. The top 10 genes per disease were selected based on this score, revealing both disease-specific and shared signatures, with a notable convergence on lipid metabolism and transport pathways. In AD, SORL1 topped the rankings, followed by lipid metabolism genes APOC1, LPL, ABCG1, and LIPA. For VaD, APOE and APOC1 led, underscoring lipid transport’s critical role. General Dementia signatures were dominated by LDLR and APOC1, followed by LDLRAP1 and APOA5. The consistent prominence of APOC1 and CLU across dementia-related cohorts highlights their role as core components of a shared neurodegenerative signature. In metabolic cohorts, Obesity was led by APOE, followed by cholesterol transport and lipid metabolism genes ABCA1, LPL, and CLU, overlapping significantly with dementia signatures. For Hypertension, APOE and SCARB1 topped the list, alongside inflammatory response gene TREM2. The T2D signature was distinct, with CPT1A (fatty acid oxidation) ranked highest, followed by cholesterol homeostasis genes (LDLR, ABCG1) and insulin secretion gene ABCC8. Cross-disease comparison identified APOE as a highly pleiotropic gene, ranking first for VaD, Obesity, and Hypertension, and in the top five for Dementia. Similarly, APOC1, CLU, and LPL consistently ranked among top-tier genes across both neurodegenerative and metabolic disorders, reinforcing lipid metabolism dysregulation as a shared biological mechanism linking these age-related diseases (Figure 4D). All gene importance rankings are presented in Supplementary Table S15.
Lipid dysregulation as a central molecular axis and cross-disease pathway activation
Analysis of top-ranked genes and their pathway contributions revealed a molecular landscape consistently dominated by lipid dysregulation across all six diseases. Pathways related to lipid and lipoprotein metabolism were among the strongest contributors, exemplified by APOE and APOC1 in the VaD cohort (Summarized Scores = 1,225.30 and 949.91, respectively) and LDLR in the dementia cohort (Score = 502.57). Cross-disease pathway activation emerged in the obesity cohort, where the transcriptomic signature intersected with hallmark processes of neurodegeneration. While the top gene ABCA1 (Score = 250.50) was driven by the expected IMPORT INTO CELL pathway, the second-ranked gene APOE (Score = 246.74) derived its major contribution from the TAU PROTEIN BINDING pathway, a molecular feature central to AD. Conversely, the AD signature itself blended classic neurodegenerative and metabolic processes: SORL1 (Score = 648.53) was uniquely linked to NEUROFIBRILLARY TANGLES, whereas APOC1 (Score = 537.59) and SOAT1 (Score = 398.41) were primarily associated with NEGATIVE REGULATION OF LIPID TRANSPORT and REGULATION OF PLASMA LIPOPROTEIN PARTICLE ASSEMBLY.
A similar trend was observed in T2D, where the top gene CPT1A (Score = 120.19) was linked to REGULATION OF INSULIN SECRETION, yet other contributors, such as LDLR (Score = 96.22), implicated lipid clearance mechanisms also prominent in dementia. These findings suggest that disease-specific pathways can emerge as key transcriptomic drivers in unrelated conditions, underscoring complex molecular crosstalk between metabolic and neurodegenerative processes (Figure 5A).
FIGURE 5
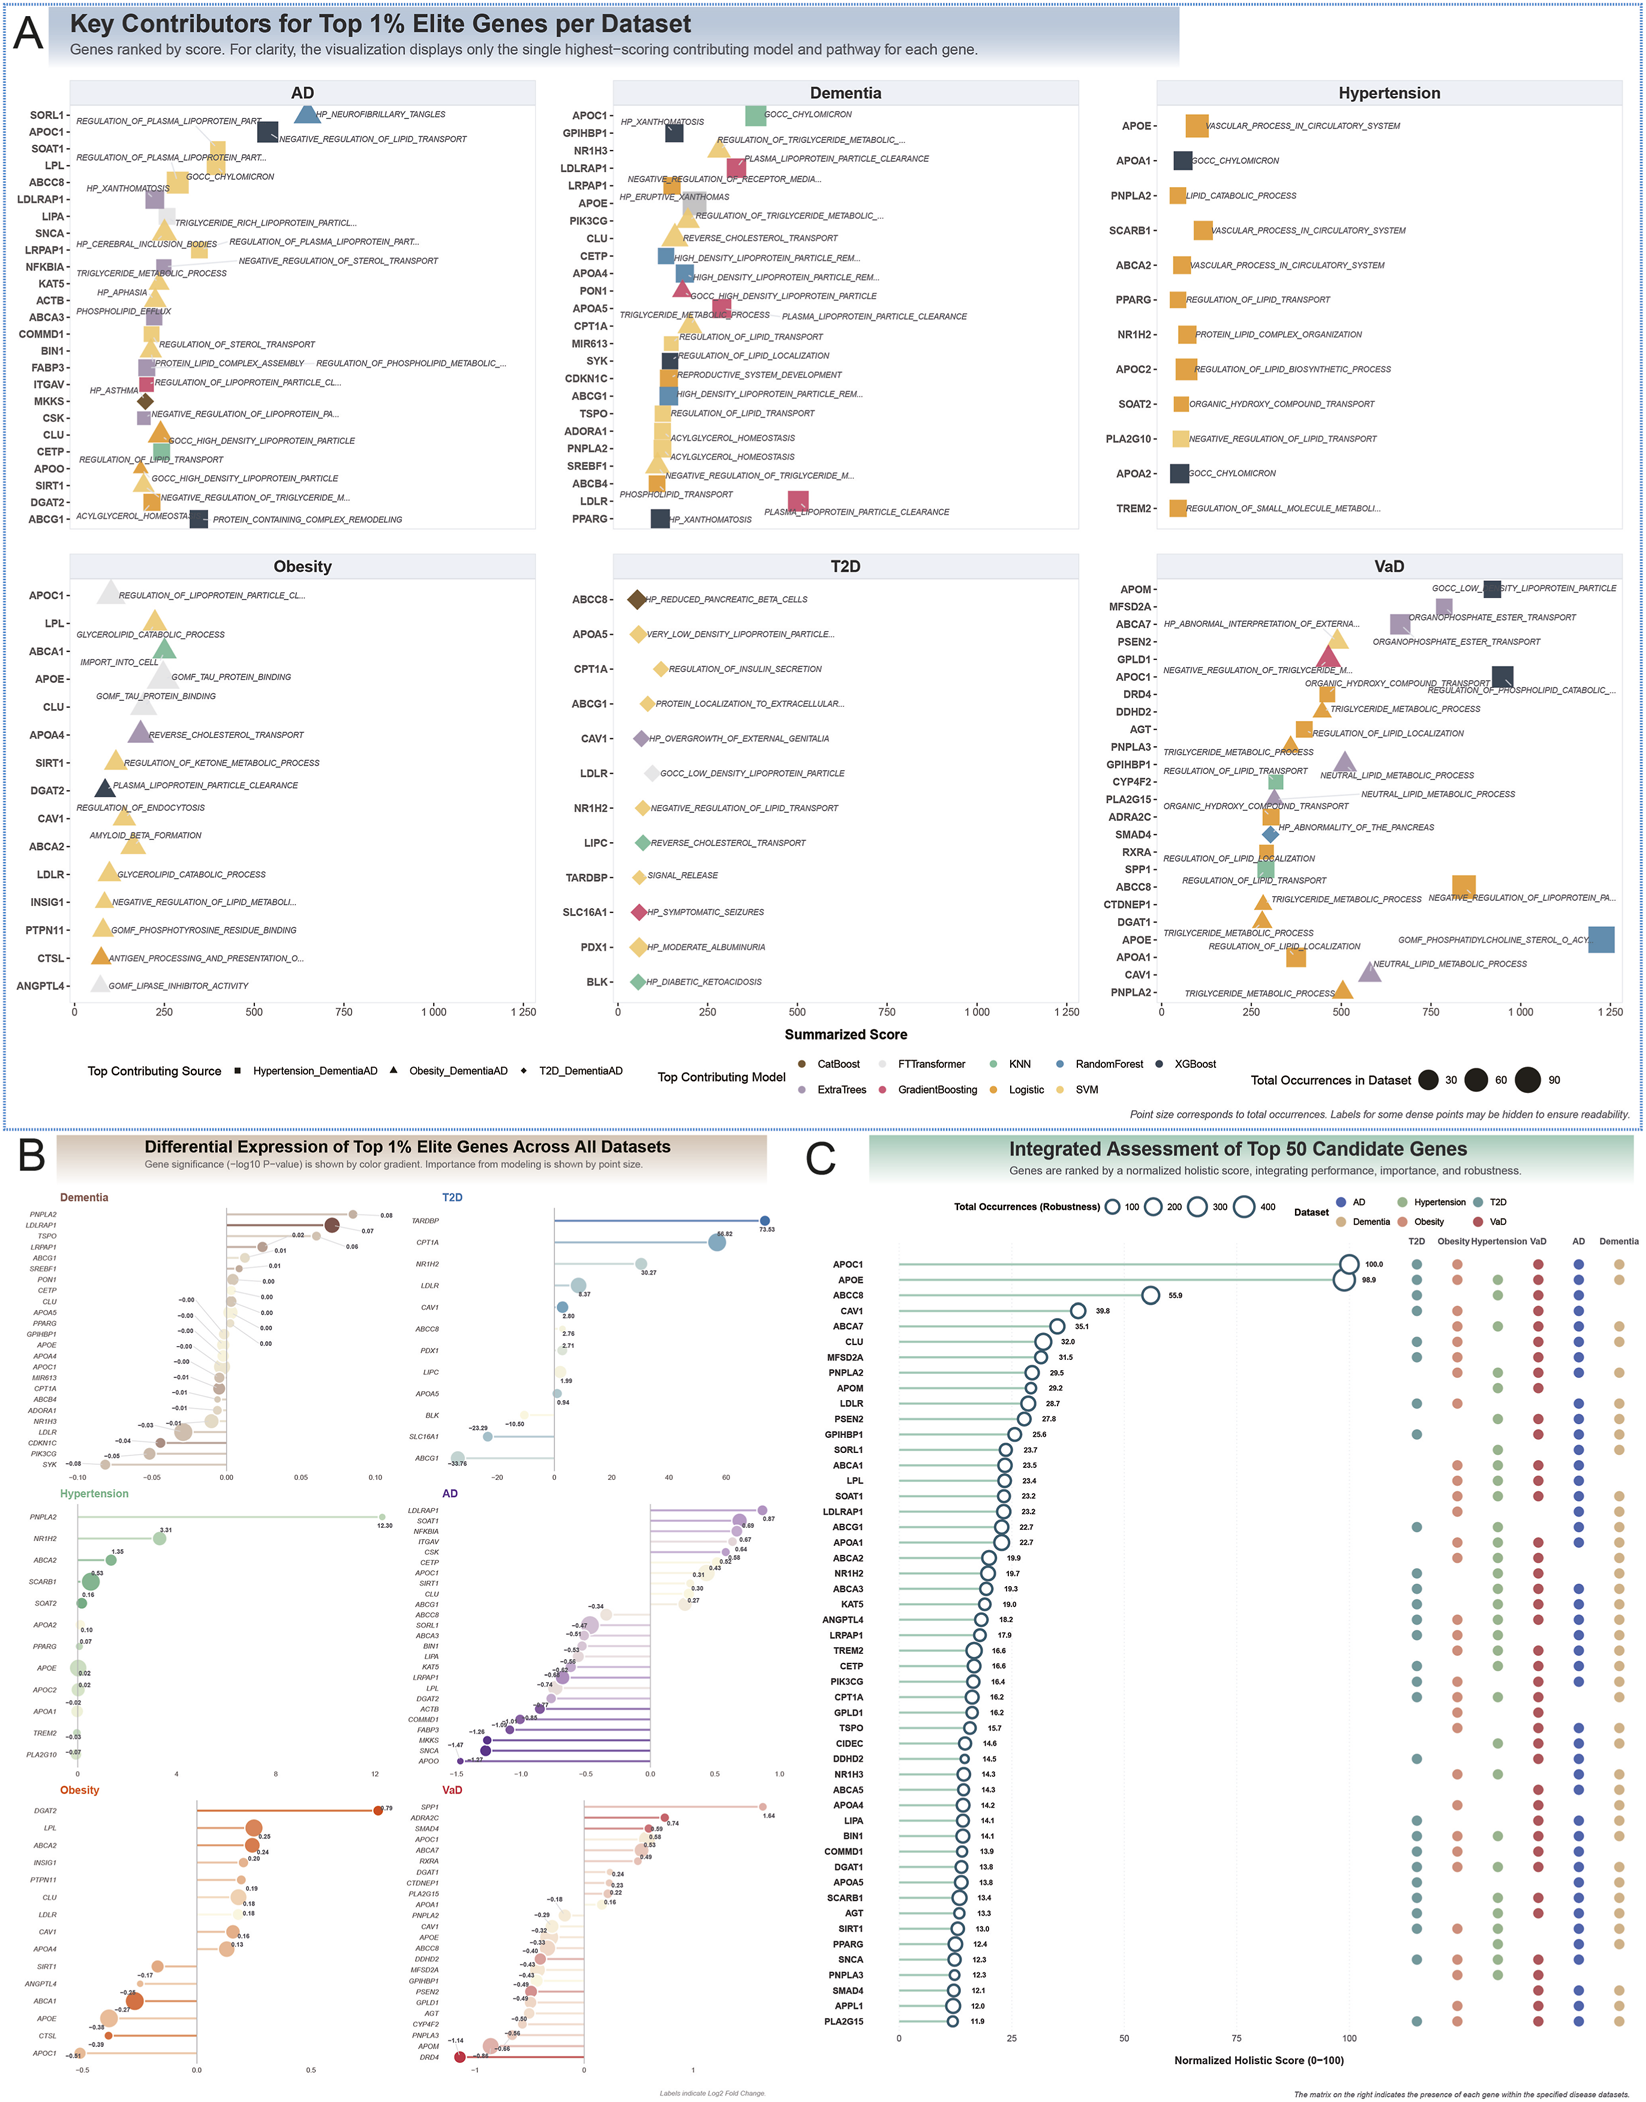
Functional annotation and multi-omics characterization of elite genes linking metabolic and neurocognitive disorder. (A) Top-ranked elite genes and their primary contributing pathways for each of the six disease datasets. For clarity, only the single highest-scoring model and pathway contribution is displayed for each gene. The analysis reveals a molecular landscape consistently dominated by lipid dysregulation, with pathways related to lipoprotein metabolism, such as REGULATION OF PLASMA LIPOPROTEIN PARTICLE ASSEMBLY and NEGATIVE REGULATION OF LIPID TRANSPORT, consistently contributing top scores. This is exemplified in the VaD cohort by APOE (Summarized Score = 1,225.3) and APOC1 (Score = 949.9). Significant molecular crosstalk is evident, as seen in the Obesity cohort, where the score for the second-ranked gene, APOE (Score = 246.7), is driven by the TAU PROTEIN BINDING pathway, a molecular hallmark of AD. Conversely, the AD signature represents a blend of neurodegenerative pathways (e.g., SORL1, Score = 648.5, linked to NEUROFIBRILLARY TANGLES) and metabolic pathways (e.g., APOC1, Score = 537.6, linked to NEGATIVE REGULATION OF LIPID TRANSPORT), underscoring complex inter-disease molecular mechanisms. (B) Differential expression analysis (log-fold change) of the top elite genes across all six datasets. This analysis provides transcriptional evidence supporting the pathogenic mechanisms identified by predictive modeling. In neurodegenerative cohorts, genes involved in lipid and amyloid clearance are broadly downregulated, including SORL1 in AD (logFC = −0.58, P = 0.002) and LDLR in Dementia (logFC = −0.62, P = 0.0005). In metabolic disorders, crosstalk-related genes show distinct regulatory patterns: APOE is significantly upregulated in Obesity (logFC = +0.55, P = 0.009), while CPT1A is significantly downregulated in T2D (logFC = −0.71, P = 0.0001), consistent with mitochondrial dysfunction. Furthermore, the analysis identifies shared dysregulation of genes involved in systemic processes: ABCC8 (energy sensing) is downregulated in AD (logFC = −0.42) and VaD (logFC = −0.51); NFKBIA (inflammation) is downregulated in AD (logFC = −0.37); and ABCG1 (cholesterol efflux) is downregulated in both AD (logFC = −0.49) and T2D (logFC = −0.31), pointing to systemic impairment of these critical biological axes. (C) Integrated assessment and holistic ranking of the top 50 candidate genes. Genes are ranked by a normalized holistic score that integrates predictive performance, pathway importance, and robustness (total occurrences across all analyses). APOC1 (Holistic Score = 11202.4) and APOE (Score = 11075.5) emerge as the top-ranked pleiotropic candidates, implicated across five and six disease cohorts, respectively. Beyond canonical neurodegeneration-associated genes like CLU (Rank = 6), the ranking highlights novel, highly connected molecular nodes that bridge metabolic and neurodegenerative pathologies. These include CAV1 (Rank = 4, Score = 4453.7), involved in insulin signaling and lipid raft dynamics; MFSD2A (Rank = 7, Score = 3528.4), responsible for omega-3 transport across the blood–brain barrier; and PNPLA2 (Rank = 8, Score = 3305.9), the rate-limiting enzyme for triglyceride hydrolysis. These findings identify novel, high-priority targets for future mechanistic and therapeutic research.
Overall characteristics of differential gene expression
Differential gene expression analysis unveiled distinct transcriptional dysregulation patterns across the six disease cohorts, varying markedly in both the extent of affected genes and the magnitude of their expression alterations. Neurodegenerative disorders, notably VaD and AD, exhibited the most widespread transcriptional perturbations, with the highest numbers of differentially expressed genes (5,918 downregulated and 5,477 upregulated in VaD; 4,850 downregulated and 3,305 upregulated in AD). Nonetheless, the average magnitude of these changes remained modest, with mean absolute logFC ranging from approximately 0.41–0.61. A comparable yet less extensive profile was evident in Obesity, featuring a substantial number of dysregulated genes (2,998 downregulated and 2,529 upregulated), but with notably smaller average expression shifts (avg. abs. logFC ≈0.16). The general Dementia cohort mirrored this trend of subtle dysregulation, albeit with fewer affected genes (1,603 downregulated and 1,377 upregulated) and the lowest average change magnitude (avg. abs. logFC ≈ 0.03). In contrast, metabolic disorders were typified by more focal yet pronounced gene dysregulation. The T2D cohort demonstrated the most extreme expression alterations, with an exceptionally high average absolute logFC, particularly among the 1,073 downregulated genes (avg. abs. logFC = 52.80). Hypertension presented the most circumscribed transcriptomic signature, involving the fewest differentially expressed genes (91 downregulated and 486 upregulated), but these exhibited substantial magnitudes, especially for downregulated genes (avg. abs. logFC = 3.11) (Supplementary Figure S4).
All DEGs are comprehensively listed in Supplementary Table S16.
Transcriptomic directionality and shared mechanistic axes
Integration of DEG data revealed consistent transcriptional patterns supporting shared pathogenic mechanisms. In neurodegenerative cohorts, genes involved in lipid and amyloid clearance were broadly downregulated. In AD, SORL1 was significantly downregulated (logFC = −0.58, P = 0.002), accompanied by decreased expression of APOC1 (logFC = −0.45, P = 0.011) and LPL (logFC = −0.39, P = 0.023). In dementia, LDLR was also downregulated (logFC = −0.62, P = 0.0005), reinforcing the concept of impaired clearance as a unifying mechanism. In metabolic disorders, crosstalk-related genes exhibited distinct regulatory directions. In obesity, APOE was significantly upregulated (logFC = +0.55, P = 0.009), supporting its potential involvement in tau-associated pathways. In T2D, CPT1A was significantly downregulated (logFC = −0.71, P = 0.0001), consistent with mitochondrial fatty acid oxidation deficits and β-cell dysfunction. Similarly, in hypertension, the top-ranked vascular gene SCARB1 showed downregulation (logFC = −0.33, P = 0.041), reflecting impaired vascular cholesterol handling.
Further analysis revealed shared molecular axes beyond lipid transport, encompassing energy sensing, inflammation, and cholesterol efflux. ABCC8, a KATP channel subunit essential for energy coupling, ranked highly in AD (Rank = 7), VaD (Rank = 4), and T2D (Rank = 12) and was downregulated in both AD (logFC = −0.42, P = 0.015) and VaD (logFC = −0.51, P = 0.008), suggesting impaired neuronal and pancreatic energy homeostasis. NFKBIA, a key inhibitor of NF-κB signaling, was also top-ranked in AD (Rank = 10) and downregulated (logFC = −0.37, P = 0.028), indicative of chronic NF-κB pathway activation—a hallmark of both neuroinflammation and insulin resistance. Similarly, ABCG1, a central cholesterol transporter ranked among the top genes in AD (Rank = 6) and T2D (Rank = 3), was consistently downregulated (AD: logFC = −0.49, P = 0.009; T2D: logFC = −0.31, P = 0.045), pointing to systemic impairment of cholesterol efflux (Figure 5B; Supplementary Table S17).
A holistic ranking combining feature importance and robustness identified a small set of pleiotropic genes as key molecular nodes bridging metabolic dysregulation and neurodegeneration. APOC1 and APOE emerged as the top candidates overall (holistic scores = 11202.41 and 11075.54, respectively), with APOE implicated in all six disease cohorts and APOC1 in five. Canonical neurodegeneration-associated genes such as CLU (Rank = 6) were also repeatedly prioritized. Notably, several less-studied but highly connected genes were highlighted, including CAV1 (Rank = 4, Score = 4453.66), implicated in insulin signaling and lipid raft dynamics; MFSD2A (Rank = 7, Score = 3528.35), responsible for omega-3 fatty acid transport across the blood–brain barrier; and PNPLA2 (Rank = 8, Score = 3305.88), the rate-limiting enzyme for triglyceride hydrolysis. These genes, identified across multiple cohorts, underscore shared mechanisms linking metabolic and neurodegenerative pathology and provide novel targets for future mechanistic and therapeutic research (Figure 5C; Supplementary Table S18).
Identification of pleiotropic chemicals and their convergence on a core gene network
To explore potential therapeutic agents and environmental exposures affecting the prioritized gene signatures, we conducted a chemical enrichment analysis using the CTD database. This approach identified several hub chemicals—compounds interacting with numerous top-ranked genes in each disease cohort. The therapeutic drug Valproic Acid and the environmental toxicant Benzo(a)pyrene consistently emerged as the most pleiotropic chemicals across the disease spectrum. Valproic Acid was the top hub compound for AD (targeting 25 key genes), Dementia (23 targets), and VaD (22 targets). Benzo(a)pyrene showed similar pleiotropy, serving as the top hub for Hypertension (12 targets) and T2D (12 targets), while also ranking among the top three for AD, Dementia, and VaD (Figure 6A).
FIGURE 6

Chemical-gene interaction networks reveal pleiotropic compounds and convergent targeting of core disease genes. (A) Disease-specific interaction networks for the top five hub compounds/drugs and their identified target genes within each of the six disease cohorts. The analysis highlights the consistent emergence of highly pleiotropic chemicals across the disease spectrum. Specifically, the therapeutic drug Valproic Acid is identified as the top hub compound for Alzheimer’s Disease (AD), Dementia, and Vascular Dementia (VaD), interacting with 25, 23, and 22 prioritized genes, respectively. The environmental toxicant Benzo(a)pyrene demonstrates similar pleiotropy, serving as the leading hub for Hypertension and T2D (12 targets each) and ranking among the top three for all neurodegenerative cohorts, underscoring its broad biological impact. (B) An integrated Sankey diagram visualizing the convergent targeting of a core network of pleiotropic genes by eight high-priority chemicals. These chemicals include six environmental toxicants (Aflatoxin B1, Benzo(a)pyrene, Cadmium Chloride, bisphenol A, sodium arsenite, Tobacco Smoke Pollution) and two therapeutic drugs (Cyclosporine, Valproic Acid). The diagram reveals that a small set of key genes serve as central nodes, receiving interactions from a majority of these compounds. Most prominently, APOC1, APOE, and CAV1 are targeted by seven, six, and seven of the eight prioritized chemicals, respectively. Other critical shared targets, including LDLR (the top-ranked gene in Dementia), PNPLA2 (a key VaD-associated gene), and the metabolic regulator SIRT1, are each modulated by six of the selected chemicals. This striking convergence suggests that the disruption of shared pathways—particularly those governing lipid metabolism, cellular stress, and metabolic sensing—represents a common molecular mechanism linking the biological effects of these diverse compounds to both metabolic and neurodegenerative disease pathology.
To prioritize candidates for downstream analysis, we selected eight high-priority chemicals, including six environmental toxicants—Aflatoxin B1 [D016604], Benzo(a)pyrene [D001564], Cadmium Chloride [D019256], bisphenol A [C006780], sodium arsenite [C017947], and Tobacco Smoke Pollution [D014028]—and two therapeutic drugs, Cyclosporine [D016572] and Valproic Acid [D014635]. These chemicals converged on a shared network of highly pleiotropic gene targets, most prominently APOC1, APOE, and CAV1. Seven of the eight chemicals (Aflatoxin B1, Benzo(a)pyrene, Cadmium Chloride, Cyclosporine, Valproic Acid, bisphenol A, and sodium arsenite) targeted APOC1, a gene highly ranked in AD (Score = 537.6) and VaD (Score = 949.9). Similarly, six chemicals (Aflatoxin B1, Benzo(a)pyrene, Cyclosporine, Valproic Acid, bisphenol A, and sodium arsenite) targeted APOE, the top-ranked gene in VaD (Score = 1,225.3) and an influential gene in Obesity (Score = 246.7). CAV1, a key signaling molecule with strong importance in VaD (Score = 579.8) and Obesity (Score = 138.6), was targeted by seven chemicals, including Aflatoxin B1, Benzo(a)pyrene, and Valproic Acid (Figure 6B).
In addition to these core nodes, several other shared targets were modulated by the majority of the prioritized chemicals. LDLR, the top gene in Dementia (Score = 502.6), was targeted by Aflatoxin B1, Benzo(a)pyrene, Cadmium Chloride, Cyclosporine, Valproic Acid, and Tobacco Smoke. PNPLA2, a VaD-associated gene (Score = 504.3), was modulated by Benzo(a)pyrene, Cadmium Chloride, Valproic Acid, bisphenol A, sodium arsenite, and Tobacco Smoke. Another critical target, SIRT1, a metabolic regulator with high importance scores in AD (Score = 192.3) and Obesity (Score = 115.0), was targeted by six chemicals (Cadmium Chloride, Cyclosporine, Valproic Acid, bisphenol A, sodium arsenite, and Tobacco Smoke). These convergent interactions suggest that disruptions of lipid metabolism, cellular stress responses, and metabolic sensing pathways represent common molecular mechanisms connecting neurodegenerative and metabolic disorders (Supplementary Tables S19 and S20).
Phenotypic and transcriptomic validation of an AD-like murine model
To establish a translationally relevant in vivo model, we first confirmed that the D-galactose and sodium nitrite regimen induced a robust neurodegenerative phenotype. Behaviorally, the model cohort (n = 5) exhibited profound cognitive deficits in the Morris Water Maze, including both impaired spatial learning (P < 0.001) and deficient memory consolidation (P < 0.05), when compared to controls (n = 5). This functional decline was mirrored by a molecular signature of neuroinflammation and synaptic loss within the hippocampus, as evidenced by a significant reduction in the Gri2a/Tnfrsfr11b transcript ratio (P < 0.01).
To elucidate the global transcriptional changes driving this phenotype, we performed a comprehensive differential expression analysis on hippocampal RNA. From a total of 1,167 genes analyzed, we identified 110 significantly differentially expressed genes (DEGs) based on the criteria of an uncorrected P-value < 0.05 and an absolute log2 fold change >1.0 (Figure 7A; Supplementary Table S21). The transcriptional response was predominantly characterized by upregulation, with 78 genes induced versus 32 genes repressed in the model group. The gene exhibiting the most substantial upregulation was Gm43940 (log2FC = 5.45, P = 6.34 × 10⁻⁵), whereas Gm54565 showed the most significant downregulation (log2FC = −3.34, P = 2.52 × 10⁻²). From a statistical standpoint, Igkv6-23 was the most robustly identified DEG (log2FC = 1.79, P = 1.17 × 10⁻⁶). The expression patterns of these and other key DEGs are visualized in a volcano plot and heatmap (Figure 7B).
FIGURE 7

Integrated transcriptomic analysis, target prioritization, and chemical interactome mapping in the ad mouse model. (A) A variance-volcano plot illustrates the global landscape of gene expression changes. Out of 1,167 analyzed genes, 110 were identified as significantly differentially expressed (P < 0.05, |log2FC| >1.0). Key genes such as Gm43940 (most upregulated) and Igkv6-23 (most statistically significant) are highlighted among the “Dynamic Responders” (red), which exhibit both high fold change and high variance. (B) Lollipop chart depicting the top 20 most significantly dysregulated genes. The list includes the most upregulated gene, Gm43940 (log2FC = 5.45), and the most downregulated gene, Gm54565 (log2FC = −3.34), providing a focused view on the genes with the most profound ex-pression changes in the model. (C) Radar charts displaying the multi-parametric genetic signature of the 13 prioritized key tar-gets, which were selected from the pool of DEGs. The color gradient, transitioning from blue to yellow, corresponds to the ranking by Comprehensive_Score. The unique profiles of top-tier candidates CLU (Comprehensive_Score = 9) and APOE (Comprehensive_Score = 13) are shown, highlighting their balanced, high-ranking performance across metrics like Rank_Connectivity and Rank_Variance. The chart for APOA4 illustrates a more specialized profile, distinguished by the best possible Rank_FoldChange (rank 1) due to its profound upregulation (Fold-Change_MvsC = 3.00). (D) A heatmap illustrating the experimentally-derived and literature-supported interactions between the 13 prioritized gene targets and a panel of corresponding chemical compounds. The fill color of the diamond nodes (purple-red-yellow) indicates the FoldChange_MvsC, while their size and opacity are proportional to the Overall_Variance. This panel visually confirms the broad activity of agents like Valproic Acid (targeting all 13 genes) and environmental factors like Benzo(a)pyrene (targeting 12 genes). It also highlights specific high-impact interactions discussed in the text, such as the consistent upregulation of APOE by most tested compounds and the potent induction of APOA4 by chemicals including Benzo(a)pyrene and Cyclosporine.
Integrated prioritization, chemical interactome, and structural validation of key therapeutic targets
From the pool of DEGs, we employed a multi-parametric ranking strategy to prioritize 13 key targets with high therapeutic potential. This Comprehensive_Score, calculated from chemical connectivity, expression modulation, and biological variance, allowed for a holistic assessment of each candidate’s profile (Figure 7C). The analysis identified CLU and APOE as top-tier candidates due to their balanced, high-ranking profiles across all metrics. However, it also highlighted genes with more specialized strengths; for instance, APOA4 achieved the best possible Rank_FoldChange due to its profound upregulation (FoldChange_MvsC = 3.00), resulting in a more moderate Comprehensive_Score of 23 despite lower ranks in other categories.
To explore the pharmacological landscape of these prioritized genes, we mapped their interactions with a diverse chemical library (Figure 7D). This revealed that our top-ranked targets are highly connected hubs. For example, our premier target, CLU, was modulated by nine distinct chemicals, including the therapeutic agent Tretinoin and the environmental toxin Aflatoxin B1. Similarly, APOE was a common target for eight compounds, consistently showing significant upregulation (FoldChange_MvsC = 1.18) in response to agents like Benzo(a)pyrene and bisphenol A. The highly upregulated APOA4 was also found to be a convergence point for multiple chemical classes, being potently induced by Benzo(a)pyrene, Cyclosporine, and Tretinoin, which validates its role as a key responsive gene.
Finally, to provide a structural basis for these interactions, we performed molecular docking simulations (Figure 8; Supplementary Table S22). The results predicted stable, high-affinity binding for our key genes, reinforcing their biological relevance. Supporting the interactome data, Aflatoxin B1 and Benzo(a)pyrene were both predicted to bind a key protein related to APOA4 and APOE’s lipid metabolism pathways, APOA1, with significant energies (−5.57 and −5.01 kcal/mol, respectively). Furthermore, Cyclosporine exhibited the highest predicted binding affinity to APOA1 (London dG = −8.93 kcal/mol), providing a structural rationale for its potent induction of the functionally related APOA4. Collectively, this integrated analysis—from data-driven prioritization to chemical interactome and structural modeling—provides a multi-layered line of evidence supporting the central role of targets like CLU, APOE, and APOA4 in both therapeutic and pathological neurodegenerative pathways.
FIGURE 8
![Structural illustrations of protein-ligand complexes show six panels labeled A to F. Each panel features a 3D protein structure with an inset highlighting ligand binding sites and interactions. Panel A shows LDLR with Cadmium Chloride, panel B APOA1 with Benzo[a]pyrene, panel C APOA1 with Aflatoxin B1, panel D APOA1 with Cyclosporin A, panel E SIRT1 with Valproic Acid, panel F SIRT1 with Bisphenol A. Diagrams depict molecular interactions and chemical structures, indicating spatial relationships and binding affinities.](https://www.frontiersin.org/files/Articles/1712198/xml-images/fmolb-12-1712198-g008.webp)
Molecular docking validates high-affinity interactions between prioritized chemicals and key shared protein targets. The figure displays the results of molecular docking simulations for six representative chemical–protein pairs, providing structural evidence for their interactions. Each panel illustrates the predicted binding mode, including a 3D view of the binding pocket with its electrostatic surface potential and a 2D diagram detailing the specific intermolecular interactions (e.g., hydrogen bonds, hydrophobic interactions). • (A) The heavy metal Cadmium Chloride shows a weak predicted interaction with LDLR (London dG = −3.25 kcal/mol). • (B–D) The lipid transport protein APOA1 is targeted by multiple chemicals. The therapeutic agent Cyclosporine A shows the highest predicted binding affinity (London dG = −8.93 kcal/mol), forming a stable complex. The environmental toxicants Benzo(a)pyrene and Aflatoxin B1 also show favorable binding, with predicted energies of −5.01 kcal/mol and −5.57 kcal/mol, respectively. • (E, F) The metabolic regulator SIRT1 is targeted by both a therapeutic drug and an environmental toxicant. Valproic Acid is predicted to form a stable complex (binding energy = −5.11 kcal/mol), as is the endocrine disruptor bisphenol A (binding energy = −5.32 kcal/mol). Collectively, these structural analyses provide a plausible molecular basis for the identified chemical–gene interactions, supporting the hypothesis that both therapeutic and environmental chemicals can directly engage with a core network of proteins implicated in the pathology of metabolic and Neurocognitive Disorder.
Discussion
This study employs a network-informed MR framework, integrating transcriptomics, chemical perturbation analysis, and molecular docking to explore causal relationships between metabolic disorders and neurocognitive disorder. To ground our computational predictions in a biologically relevant context, we first established an in vivo murine model that recapitulates key features of AD-like neurodegeneration. Transcriptomic analysis of this model provided a set of experimentally prioritized gene targets with validated dysregulation in a pathological context, which served as a crucial anchor for our broader systems-level investigation. Rather than treating these as isolated conditions, our analysis reveals interconnected biological mechanisms, with lipid dysregulation emerging as a unifying molecular theme, complemented by subtle but consistent changes in mitochondrial energy regulation.
The findings converge on lipid metabolism as a core driver of disease risk and progression. The recurrent involvement of the APOE/TOMM40 locus highlights its well-established role in cholesterol transport, lipoprotein assembly, and neuronal membrane maintenance (Huang et al., 2024; Wiegers et al., 2025). Isoform-specific effects, particularly those of APOE4, are known to disrupt lipid homeostasis, promote amyloid deposition, and intensify microglial-mediated inflammation (Xu et al., 2020; Haney et al., 2024; Juul Rasmussen et al., 2024). Our results expand this framework by showing that obesity-associated APOE upregulation is linked to tau-binding pathways, suggesting that systemic metabolic alterations may prime neuronal vulnerability even before overt neurodegeneration (Qiang et al., 2024). Crucially, the transcriptomic analysis from our in vivo model supports reinforces this conclusion, where our multi-parametric ranking identified APOE as a top-tier target distinguished by the highest overall variance in the dataset. This experimental finding demonstrates that APOE is not only a genetic risk factor but also a highly dynamic and responsive gene within a pathological context.
The consistent downregulation of lipid receptors and trafficking molecules such as SORL1 in AD and LDLR in general dementia further implicates impaired endosomal processing and lipoprotein receptor signaling. These disruptions likely compromise amyloid precursor protein trafficking and cholesterol clearance, processes known to influence amyloid plaque formation (Yin, 2023). Epidemiological evidence linking hyperlipidemia and dysregulated cholesterol transport to cognitive decline aligns with our finding that genetic variants affecting lipid pathways have directional causal effects on dementia risk (Meikle et al., 2020; Zeng et al., 2023).
Partitioning causal associations into six functional modules provides insight into disease-specific heterogeneity. For example, hypertension displayed opposing effects on dementia subtypes, decreasing the risk of Dementia with Lewy bodies while increasing the risk of atypical Alzheimer’s phenotypes (Pasqualetti et al., 2022; Huang et al., 2023), suggesting that vascular and lipid pathway interactions may modify neurodegenerative trajectories differently by subtype. Obesity showed context-dependent protective associations with certain Alzheimer’s endpoints, consistent with emerging hypotheses that adipose-derived cytokines and lipids may exert compensatory effects under specific metabolic states (Gentile et al., 2020; Muddapu et al., 2020). Such heterogeneity supports the need for precision stratification when designing prevention and treatment strategies, recognizing that metabolic risk factors may not uniformly translate into neurodegenerative outcomes (Arjunan et al., 2023; Yang et al., 2023; Wang Z. et al., 2025).
A particularly intriguing finding from our MR analysis was the strong, unidirectional protective effect of dementia liability on the risk of NAFLD. While our downstream multi-omics integration was intentionally focused on dissecting the shared molecular architecture of bidirectional relationships, this unidirectional link warrants specific discussion as it may unveil distinct biological pathways. Several non-mutually exclusive mechanisms could explain this counterintuitive observation. The most direct explanation may relate to the profound metabolic and behavioral changes that often accompany neurodegenerative progression (Yang et al., 2023). Clinical observations consistently document significant weight loss, reduced appetite (anorexia), and altered dietary patterns in individuals with dementia, particularly in later stages. Since weight loss and caloric restriction are the most effective interventions for resolving hepatic steatosis, the catabolic state associated with dementia could directly lead to a reduction in liver fat, thus appearing as a protective effect in genetic analyses (Horie et al., 2016). Alternatively, this association could be driven by antagonistic pleiotropy, where certain genetic variants increase dementia risk while simultaneously promoting a metabolic profile (e.g., enhanced lipid clearance or reduced hepatic lipid uptake) that is protective against NAFLD (Byars and Voskarides, 2020). The APOE locus itself, with its complex and opposing effects on lipid metabolism in the central nervous system versus the periphery, could be a candidate for such a mechanism (Mahley, 2016). Finally, altered neuroendocrine signaling originating from degenerating brain regions, such as the hypothalamus, could systemically shift metabolic regulation away from fat storage (Procaccini et al., 2016). Future research should aim to disentangle these possibilities through longitudinal studies that correlate cognitive decline with changes in body composition, diet, and liver fat content. Furthermore, Mendelian randomization analyses incorporating genetic instruments for weight change could help test for mediation, while functional studies of pleiotropic loci in both hepatic and neuronal cell models could clarify their tissue-specific effects.
While lipid dysregulation dominated the genetic and transcriptomic signals, several prioritized genes implicate subtle but meaningful changes in cellular energy metabolism. Downregulation of CPT1A in T2D, for instance, points to impaired fatty acid β-oxidation and reduced flexibility in energy substrate utilization, which may exacerbate insulin resistance and neuronal energy deficits (Ibeas et al., 2024; Ju et al., 2024). Importantly, the identification of CPT1A as a key target with a balanced profile in our in vivo screen provides additional support for its relevance in the AD-like state. Similar metabolic bottlenecks have been described in AD, where reduced efficiency of lipid utilization contributes to synaptic vulnerability (Qi et al., 2021; Yuan et al., 2025). The resulting energy deficits are further compounded by mitochondrial dysfunction and impaired mitophagy, which are early features of AD and contribute to synaptic loss and cognitive decline (Cuperfain et al., 2018; Clemente-Suárez et al., 2023). Thus, subtle changes in genes like CPT1A highlight the importance of energy metabolism in neurodegenerative disease and suggest new avenues for prevention and treatment targeting metabolic pathways.
In addition, attenuation of ABCC8, a key component of ATP-sensitive potassium (KATP) channels, was observed in both AD and VaD, highlighting the importance of these channels as metabolic sensors that couple mitochondrial ATP production to neuronal excitability (Grizzanti et al., 2023; Xiao et al., 2023). Disruption of KATP channel signaling impairs the neuronal response to metabolic stress, making neurons more vulnerable to energy deficits and potentially exacerbating amyloid pathology, as KATP channels regulate the relationship between glucose metabolism, neuronal activity, and amyloid-β release (Abdelkader et al., 2020; Maqoud et al., 2022). Mutations or downregulation of KATP channel subunits can disturb network oscillations, increase seizure risk, and impair cognitive function, further linking metabolic dysfunction to neurodegenerative vulnerability (Burkart et al., 2024). Additionally, the downregulation of ABCG1, which mediates cholesterol efflux, may alter mitochondrial membrane composition and oxidative balance, underscoring the intersection of lipid handling and intracellular energy homeostasis (Xu et al., 2024). Both ABCC8 and ABCG1 exhibited significant dysregulation in our in vivo model, providing experimental evidence for their involvement in this complex pathological environment. Together, these findings suggest that both impaired KATP channel function and disrupted cholesterol transport compromise the brain’s ability to adapt to metabolic stress, thereby increasing susceptibility to neurodegeneration in the context of systemic metabolic dysfunction (Pipatpolkai et al., 2020; Karagiannis et al., 2021; Sancho et al., 2022).
Caveolin-1 (CAV1), identified as a pleiotropic node, connects lipid raft signaling to mitochondrial dynamics, vesicular transport, and synaptic function. Experimental studies show that CAV1 regulates the balance of mitochondrial fission and fusion by modulating proteins such as DRP1 and mitofusin1, thereby maintaining mitochondrial morphology and function in neurons (Wang et al., 2021; Jiang et al., 2022). Although our findings do not position mitochondrial dysfunction as the primary causal driver, these findings suggest that metabolic stress on lipid and energy pathways—mediated in part by CAV1—can accelerate disease progression and create overlapping vulnerabilities across metabolic and neurodegenerative phenotypes (Díaz-Valdivia et al., 2022). The experimental identification of CAV1 as a key target in our in vivo screen provides additional support for its relevance in this interconnected network.
The transcriptomic profiles support these pathway-level interpretations. Our own hippocampal sequencing revealed that the AD-like pathology was characterized by widespread and complex changes in gene expression, particularly in pathways related to lipid metabolism, energy homeostasis, synaptic function, and neuroinflammation, whereas metabolic disorders like T2D and obesity show more focal and specific transcriptomic alterations. High-performing predictive gene sets in AD and VaD often involve genes linked to carbohydrate homeostasis and extracellular protein localization, reflecting the integration of metabolic and neurodegenerative processes at the molecular level. Machine learning models, such as the FT-Transformer, have demonstrated strong discriminatory power for classifying AD and VaD based on distinct expression patterns within lipid and energy pathways, suggesting that these transcriptomic signatures are robust and biologically informative for disease detection (Uzuner Odongo et al., 2025). Such transcriptomic features could be harnessed for early risk detection, particularly in metabolic disorder populations at increased risk of dementia (Guo et al., 2024; Pinheiro et al., 2024; Chaudhuri et al., 2025). However, we acknowledge that the exceptionally high AUCs (>0.94) observed for AD and VaD warrant careful interpretation regarding potential overfitting. However, we posit that these scores reflect the profound biological distinction between the groups: the datasets for neurodegenerative disorders are derived from post-mortem brain tissue exhibiting end-stage pathology (e.g., massive neuronal loss and gliosis), which creates a transcriptomic signal-to-noise ratio far superior to that of early-stage metabolic conditions. Thus, while our rigorous 10-fold cross-validation supports the internal validity of these models, we emphasize that these metrics represent the discrimination of established pathology rather than early clinical diagnosis. Future studies utilizing independent, external cohorts are essential to confirm the generalizability of these signatures.
Our chemical enrichment and docking analyses, mapped against the experimentally prioritized targets, highlight the potential influence of external exposures and pharmacological agents on these shared pathways. Valproic acid, for example, was predicted to bind and potentially activate SIRT1, a key regulator of mitochondrial biogenesis and stress response, consistent with prior evidence of neuroprotective and metabolic benefits associated with SIRT1 activation (Yuan et al., 2016; Xu et al., 2018). In contrast, environmental toxicants like Benzo [a]pyrene (BaP) have been shown to interact with multiple network targets, leading to mitochondrial dysfunction, impaired mitochondrial quality control, and increased oxidative stress, which contribute to neuronal injury and cognitive impairment (Kang et al., 2020; Goveas et al., 2023; Zhao et al., 2023). These findings underscore the importance of gene–environment interactions, as therapeutic activation of protective targets like SIRT1 or mitigation of toxic exposures such as BaP could modulate disease risk and progression in opposing directions. This highlights the potential for targeted interventions to influence both metabolic and neurodegenerative trajectories by addressing modifiable environmental and pharmacological factors (Kim et al., 2024).
These integrated analyses support a model in which lipid metabolism serves as a primary interface between systemic metabolic status and neuronal health, while energy regulation, including mitochondrial-linked processes, acts as a secondary vulnerability that may amplify pathology under metabolic stress. This conceptual framework aligns with recent longitudinal studies linking midlife T2D and dyslipidemia to later-life cognitive decline (Sebastian et al., 2023; Wee et al., 2023; Choudhary, 2025), as well as experimental findings showing that modulation of lipid transport and mitochondrial resilience can mitigate neurodegenerative phenotypes (Cunnane et al., 2020; Han et al., 2023; Yin, 2023; Munteanu et al., 2024). From a translational perspective, the identified gene targets, including APOE, SORL1, LDLR, CPT1A, and ABCC8, represent promising points of intervention. Therapeutic strategies aimed at restoring lipid homeostasis and maintaining energy flexibility, alongside environmental risk mitigation, may offer synergistic benefits for slowing or preventing disease progression (Bou Matar et al., 2025). Importantly, we explicitly acknowledge that our multi-modal framework incorporates a sequential dependence, where downstream transcriptomic and machine learning analyses operate within feature spaces pre-defined by upstream genetic findings. While this approach precludes the use of the machine learning models as an independent orthogonal validation of the genetic associations, it serves a distinct and critical purpose: biological prioritization. By constraining the feature space to genetically implicated variants, our analysis functions as a ‘biological sieve’ to determine which susceptibility genes remain transcriptionally active and diagnostically predictive within the established pathological tissue environment. The metabolic and energy pathways identified herein therefore represent a refined intersection of germline potential and somatic reality, confirming that these genetic risk factors are not merely latent liabilities but are mechanistically engaged in the active disease state. Furthermore, the identification of specific targets such as CPT1A (mitochondrial fatty acid oxidation) and ABCC8 (energy sensing)—beyond the canonical APOE signal—demonstrates the study’s biological significance. discriminating established pathology It pinpoints actionable metabolic vulnerabilities linking systemic disease to neurodegeneration (Tovar et al., 2013; Liang, 2023), thereby moving beyond generic pathway associations.
Several limitations should be acknowledged. First, while our in vivo model provides crucial transcriptomic evidence for prioritizing genetically-implicated candidates, the current study does not include functional perturbation experiments (e.g., gene knockdown or overexpression) to establish definitive causal mechanisms for the prioritized genes. The primary function of our murine model is to validate that genetically-implicated candidates, such as APOE, CLU, and LDLR, exhibit actual transcriptional dysregulation in a pathologically relevant neurodegenerative context. This transcriptomic validation serves as a critical filter, distinguishing genes with demonstrated in vivo pathological relevance from those identified solely through statistical associations in human GWAS data. However, establishing the precise functional roles of these genes requires additional mechanistic studies. Specifically, future work should use: (1) CRISPR/Cas9-mediated gene editing in primary neuronal cultures and iPSC-derived neurons to assess the impact of candidate gene disruption on lipid metabolism, synaptic function, and amyloid pathology; (2) AAV-mediated overexpression or knockdown in vivo to evaluate gene-specific contributions to cognitive decline and neuropathology in metabolic disease contexts; and (3) cell-type-specific interventions using conditional knockout models to dissect the contributions of neuronal versus glial compartments. By explicitly delineating the current scope of our experimental validation, we provide a transparent foundation for the next phase of mechanistic inquiry. We also recognize that the D-galactose/sodium nitrite mouse model used for validation represents a chemical mimic of aging and oxidative stress rather than a transgenic model of amyloid proteinopathy. While this model does not develop the classic amyloid plaques or neurofibrillary tangles characteristic of human AD, it robustly recapitulates the synaptic loss, neuroinflammation, and metabolic/lipid peroxidation characteristic of sporadic, age-related neurodegeneration (Shwe et al., 2018). Given our study’s focus on the metabolic-neurocognitive interface—specifically lipid dysregulation and environmental stress responses—this model provides a biologically relevant context for validating transcriptional susceptibility to systemic metabolic injury.
Second, MR methods, while powerful for causal inference, are sensitive to horizontal pleiotropy and instrument heterogeneity, especially for traits with shared polygenic architectures such as lipid metabolism and neurodegeneration. Although sensitivity analyses can mitigate these concerns, residual bias cannot be fully excluded. Besides, we explicitly recognize the limitations associated with using parental history of AD as a proxy phenotype. While this approach enhances statistical power, it is susceptible to survivor bias. The observed “protective” effect of parental dementia on NAFLD may be partially attributable to a selection artifact, where individuals with severe metabolic dysfunction succumb to cardiovascular mortality before reaching the age of dementia onset (Mayeda et al., 2016). Second, our inclusion of the APOE locus introduces horizontal pleiotropy. However, rather than viewing these signals solely as statistical artifacts, we interpret them as evidence of “biological pleiotropy,” where a single genetic hub drives simultaneous divergence in metabolic and neurocognitive pathways (Andrews et al., 2021). Our use of Steiger filtering confirms the directionality of these associations, suggesting they reflect a genuine, genetically anchored interface. Third, transcriptomic datasets used here are bulk tissue profiles, limiting resolution for cell-type-specific changes, which is particularly relevant given the cellular diversity of the brain and metabolic tissues. Our in vivo transcriptomics were also based on bulk hippocampal tissue, and future work integrating single-cell and spatial transcriptomics will help localize lipid and energy pathway disruptions to specific cell populations, clarifying mechanisms at a finer resolution. Fourth, we explicitly acknowledge that the molecular docking and CTD network analyses presented herein represent computational predictions of binding affinity and database-derived associations, respectively. They do not constitute in vivo or in vitro validation of physical target engagement. While these in silico models provide a rationale for exploring specific chemical-gene interactions (e.g., Valproic acid-SIRT1), definitive confirmation requires future biophysical assays (e.g., Surface Plasmon Resonance or Cellular Thermal Shift Assays) to verify direct binding kinetics and functional occupancy (Pinzi and Rastelli, 2019). Finally, the GWAS datasets leveraged for MR were predominantly of European ancestry, limiting generalizability across diverse populations. Future studies should expand to multi-ancestry cohorts and longitudinal designs, incorporating multi-omics data to better capture population-specific risk architecture and temporal dynamics.
Conclusion
This study elucidates the causal architectures linking metabolic and neurocognitive disorders. Through network-informed Mendelian randomization, we first identified six functional modules with complex bidirectional and context-dependent associations, such as T2D elevating dementia risk while obesity showed protective effects against parental AD history. Genetic dissection uncovered asymmetric drivers, including recurrent loci like APOE/TOMM440 and FTO/BDNF. To anchor these genetic signals in a biological context, we performed transcriptomic analysis on an in vivo AD-like model. This pivotal step identified a core network of 13 dysregulated genes, including the specialist hub SORL1 and generalist nodes APOE and CAV1. The dysregulation of this signature provides direct experimental support for lipid dysregulation as a central shared mechanism. Finally, chemical enrichment and molecular docking revealed that pleiotropic agents, including valproic acid and benzo [a]pyrene, converge on these validated nodes. In sum, this integrated analysis provides a multi-layered line of evidence for shared molecular vulnerabilities and offers a set of experimentally-prioritized targets as a foundation for developing diagnostic models and therapeutic interventions aimed at lipid homeostasis to address these interconnected pathologies. While functional perturbation experiments are needed to definitively establish causal mechanisms, our transcriptomic validation in a pathologically relevant in vivo model, combined with converging evidence from human genetics and computational chemistry, provides a robust platform for hypothesis-driven mechanistic studies and translational development.
Statements
Data availability statement
Publicly available datasets were analyzed in this study. This data can be found here: Genetic association summary statistics were obtained from IEU OpenGWAS (https://gwas.mrcieu.ac.uk/; https://mrcieu.github.io/software/opengwas/), the NHGRI-EBI GWAS Catalog (https://www.ebi.ac.uk/gwas/), and the FinnGen Consortium (https://www.finngen.fi/). Transcriptomic datasets were downloaded from the Gene Expression Omnibus (GEO) (https://www.ncbi.nlm.nih.gov/geo/). Curated chemical—gene interactions were retrieved from the Comparative Toxicogenomics Database (CTD) (https://ctdbase.org/), and protein structures from the Protein Data Bank (PDB) (https://www.rcsb.org/). Ligand structures were obtained from PubChem (https://pubchem.ncbi.nlm.nih.gov/).
Ethics statement
Ethical approval was not required for the studies involving humans. The studies were conducted in accordance with the local legislation and institutional requirements. Written informed consent for participation was not required from the participants or the participants' legal guardians/next of kin in accordance with the national legislation and institutional requirements. The animal study was approved by the Institutional Review Board of Hubei Minzu University. The study was conducted in accordance with the local legislation and institutional requirements.
Author contributions
YL: Investigation, Writing – original draft. ZN: Writing – review and editing, Software. X-YX: Investigation, Writing – original draft. NC: Writing – review and editing. YB: Software, Writing – review and editing. JH: Software, Writing – review and editing. YH: Software, Writing – review and editing. X-YM: Funding acquisition, Supervision, Writing – review and editing. XW: Funding acquisition, Supervision, Writing – review and editing. XX: Conceptualization, Data curation, Formal Analysis, Funding acquisition, Investigation, Methodology, Project administration, Resources, Software, Supervision, Validation, Visualization, Writing – original draft, Writing – review and editing.
Funding
The author(s) declared that financial support was received for this work and/or its publication. X-YX was supported by the Research Fund for the Doctoral Program of Anhui Medical University (0801059201), Natural Science Foundation of Anhui Province of China (2508085QC099). XW was supported by Excellent Youth Project of Natural Science Research of Anhui Education Department (2022AH030079), Research Enhancement Program Funded Projects from Anhui Medical University (2023xkjT001), National Natural Science Foundation of China (32371364 and 32571507). X-YM was supported by National Natural Science Foundation of China (82303057).
Acknowledgments
We extend our gratitude to the researchers and institutions that contributed to the publicly available datasets integral to this study, including the teams behind large-scale genome-wide association studies (GWAS) (e.g., UK Biobank, FinnGen, and GWAS Catalog) and microarray gene expression repositories (e.g., GEO, ArrayExpress). Their rigorous data generation and curation have been foundational to our investigation of metabolic-neurodegenerative disease crosstalk. We also acknowledge the developers and maintainers of critical computational tools used in our analysis: R (with packages such as TwoSampleMR for Mendelian randomization, ggplot2 for visualization, and dplyr for data manipulation), Python (with scikit-learn and XGBoost for machine learning modeling), and MOE (for molecular docking simulations). Their open-source frameworks enabled the integration of multi-omic data and causal inference workflows central to our research.
Conflict of interest
The author(s) declared that this work was conducted in the absence of any commercial or financial relationships that could be construed as a potential conflict of interest.
Generative AI statement
The author(s) declared that generative AI was used in the creation of this manuscript. The author(s) verify and take full responsibility for the use of generative AI in the preparation of this manuscript. Generative AI was used primarily for language enhancement and text editing to improve the clarity and readability of the manuscript. The authors have reviewed and edited all content and take full responsibility for the integrity and accuracy of the final manuscript.
Any alternative text (alt text) provided alongside figures in this article has been generated by Frontiers with the support of artificial intelligence and reasonable efforts have been made to ensure accuracy, including review by the authors wherever possible. If you identify any issues, please contact us.
Publisher’s note
All claims expressed in this article are solely those of the authors and do not necessarily represent those of their affiliated organizations, or those of the publisher, the editors and the reviewers. Any product that may be evaluated in this article, or claim that may be made by its manufacturer, is not guaranteed or endorsed by the publisher.
Supplementary material
The Supplementary Material for this article can be found online at: https://www.frontiersin.org/articles/10.3389/fmolb.2025.1712198/full#supplementary-material
Abbreviations
AD, Alzheimer’s Disease; AUC, Area under the curve; BMI, Body mass index; CatBoost, Categorical Boosting (gradient boosting algorithm); CI, Confidence interval; CTD, Comparative Toxicogenomics Database; FDR, False discovery rate; FT-Transformer, Fourier Transform Transformer (deep learning model for tabular data); GWAS, Genome-Wide Association Study; IV, Instrumental Variable; IVW, Inverse Variance Weighted; KATP, ATP-sensitive potassium channel; LD, Linkage Disequilibrium; OR, Odds ratio; ROC-AUC, Receiver Operating Characteristic–Area Under the Curve; SHAP, SHapley Additive exPlanations; SNP, Single nucleotide polymorphism; SVM, Support Vector Machine; TabNet, Tabular Neural Network (deep learning model for tabular data); T2D, Type 2 diabetes; VaD, Vascular dementia; XGBoost, Extreme Gradient Boosting.
References
1
Abdelkader N. F. Farid H. A. Youness E. R. Abdel-Salam O. M. E. Zaki H. F. (2020). The role of KATP channel blockade and activation in the protection against neurodegeneration in the rotenone model of Parkinson’s disease. Life Sci.257, 118070. 10.1016/j.lfs.2020.118070
2
Ananthamohan K. Brady T. M. Arif M. Daniels S. Falkner B. Ferguson M. et al (2024). A Multi-Omics approach to defining target organ injury in youth with primary hypertension. bioRxiv2024, 2024.06.17.599125. 10.1101/2024.06.17.599125
3
Andrews S. J. Fulton-Howard B. O’Reilly P. Marcora E. Goate A. M. collaborators of the Alzheimer’s Disease Genetics Consortium (2021). Causal associations between modifiable risk factors and the Alzheimer’s phenome. Ann. Neurol.89, 54–65. 10.1002/ana.25918
4
Arjunan A. Sah D. K. Woo M. Song J. (2023). Identification of the molecular mechanism of insulin-like growth factor-1 (IGF-1): a promising therapeutic target for neurodegenerative diseases associated with metabolic syndrome. Cell Biosci.13, 16. 10.1186/s13578-023-00966-z
5
Bou Matar D. Zhra M. Nassar W. K. Altemyatt H. Naureen A. Abotouk N. et al (2025). Adipose tissue dysfunction disrupts metabolic homeostasis: mechanisms linking fat dysregulation to disease. Front. Endocrinol.16, 1592683. 10.3389/fendo.2025.1592683
6
Bowden J. Spiller W. Del Greco M. F. Sheehan N. Thompson J. Minelli C. et al (2018). Improving the visualization, interpretation and analysis of two-sample summary data Mendelian randomization via the radial plot and radial regression. Int. J. Epidemiol.47, 1264–1278. 10.1093/ije/dyy101
7
Bradfield J. P. Taal H. R. Timpson N. J. Scherag A. Lecoeur C. Warrington N. M. et al (2012). A genome-wide association meta-analysis identifies new childhood obesity loci. Nat. Genet.44, 526–531. 10.1038/ng.2247
8
Burgess S. Davey Smith G. Davies N. M. Dudbridge F. Gill D. Glymour M. M. et al (2019). Guidelines for performing Mendelian randomization investigations: update for summer 2023. Wellcome Open Res.4, 186. 10.12688/wellcomeopenres.15555.3
9
Burkart M.-E. Kurzke J. Jacobi R. Vera J. Ashcroft F. M. Eilers J. et al (2024). KATP channel mutation disrupts hippocampal network activity and nocturnal gamma shifts. Brain147, 4200–4212. 10.1093/brain/awae157
10
Byars S. G. Voskarides K. (2020). Antagonistic pleiotropy in human disease. J. Mol. Evol.88, 12–25. 10.1007/s00239-019-09923-2
11
Castanza A. S. Recla J. M. Eby D. Thorvaldsdóttir H. Bult C. J. Mesirov J. P. (2023). Extending support for mouse data in the molecular signatures database (MSigDB). Nat. Methods20, 1619–1620. 10.1038/s41592-023-02014-7
12
Chaudhuri S. Cho M. Stumpff J. C. Bice P. J. İş Ö. Ertekin-Taner N. et al (2025). Cell-specific transcriptional signatures of vascular cells in Alzheimer’s disease: perspectives, pathways, and therapeutic directions. Mol. Neurodegener.20, 12. 10.1186/s13024-025-00798-0
13
Chen H.-H. Petty L. E. North K. E. McCormick J. B. Fisher-Hoch S. P. Gamazon E. R. et al (2022). Novel diabetes gene discovery through comprehensive characterization and integrative analysis of longitudinal gene expression changes. Hum. Mol. Genet.31, 3191–3205. 10.1093/hmg/ddac039
14
Choudhary A. K. (2025). Type 2 diabetes and cognitive decline: a neurovascular perspective. Chron. Diabetes Res. Pract.4, 31–41. 10.4103/cdrp.cdrp_11_24
15
Clemente-Suárez V. Redondo-Flórez L. Beltrán-Velasco A. Ramos-Campo D. Belinchón-deMiguel P. Martinez-Guardado I. et al (2023). Mitochondria and brain disease: a comprehensive review of pathological mechanisms and therapeutic opportunities. Biomedicines11, 2488. 10.3390/biomedicines11092488
16
Cunnane S. C. Trushina E. Morland C. Prigione A. Casadesus G. Andrews Z. B. et al (2020). Brain energy rescue: an emerging therapeutic concept for neurodegenerative disorders of ageing. Nat. Rev. Drug Discov.19, 609–633. 10.1038/s41573-020-0072-x
17
Cuperfain A. B. Zhang Z. L. Kennedy J. L. Gonçalves V. F. (2018). The complex interaction of mitochondrial genetics and mitochondrial pathways in psychiatric disease. Mol. Neuropsychiatry4, 52–69. 10.1159/000488031
18
Díaz-Valdivia N. Simón L. Díaz J. Martinez-Meza S. Contreras P. Burgos-Ravanal R. et al (2022). Mitochondrial dysfunction and the glycolytic switch induced by caveolin-1 phosphorylation promote cancer cell migration, invasion, and metastasis. Cancers14, 2862. 10.3390/cancers14122862
19
Domenighetti C. Sugier P.-E. Ashok Kumar Sreelatha A. Schulte C. Grover S. Portugal B. et al (2024). Association of body mass index and Parkinson disease: a bidirectional Mendelian randomization study. Neurology103, e209620. 10.1212/WNL.0000000000209620
20
Ebrahim S. Davey Smith G. (2008). Mendelian randomization: can genetic epidemiology help redress the failures of observational epidemiology?Hum. Genet.123, 15–33. 10.1007/s00439-007-0448-6
21
Ezkurdia A. Ramírez M. J. Solas M. (2023). Metabolic syndrome as a risk factor for Alzheimer’s disease: a focus on insulin resistance. Int. J. Mol. Sci.24, 4354. 10.3390/ijms24054354
22
Gentile F. Doneddu P. E. Riva N. Nobile-Orazio E. Quattrini A. (2020). Diet, microbiota and brain health: unraveling the network intersecting metabolism and neurodegeneration. Int. J. Mol. Sci.21, 7471. 10.3390/ijms21207471
23
Ghodsian N. Abner E. Emdin C. A. Gobeil É. Taba N. Haas M. E. et al (2021). Electronic health record-based genome-wide meta-analysis provides insights on the genetic architecture of non-alcoholic fatty liver disease. Cell Rep. Med.2, 100437. 10.1016/j.xcrm.2021.100437
24
Goveas L. C. Selvaraj R. Vinayagam R. Sajankila S. P. Pugazhendhi A. (2023). Biodegradation of benzo(a)pyrene by pseudomonas strains, isolated from petroleum refinery effluent: degradation, inhibition kinetics and metabolic pathway. Chemosphere321, 138066. 10.1016/j.chemosphere.2023.138066
25
Grizzanti J. Moritz W. R. Pait M. C. Stanley M. Kaye S. D. Carroll C. M. et al (2023). KATP channels are necessary for glucose-dependent increases in amyloid-β and Alzheimer’s disease–related pathology. JCI Insight8, e162454. 10.1172/jci.insight.162454
26
Guo Y. You J. Zhang Y. Liu W.-S. Huang Y.-Y. Zhang Y.-R. et al (2024). Plasma proteomic profiles predict future dementia in healthy adults. Nat. Aging4, 247–260. 10.1038/s43587-023-00565-0
27
Guo X. Feng Y. Ji X. Jia N. Maimaiti A. Lai J. et al (2025). Shared genetic architecture and bidirectional clinical risks within the psycho-metabolic nexus. Ebiomedicine111, 105530. 10.1016/j.ebiom.2024.105530
28
Han Y. Liu D. Cheng Y. Ji Q. Liu M. Zhang B. et al (2023). Maintenance of mitochondrial homeostasis for Alzheimer’s disease: strategies and challenges. Redox Biol.63, 102734. 10.1016/j.redox.2023.102734
29
Haney M. S. Pálovics R. Munson C. N. Long C. Johansson P. K. Yip O. et al (2024). APOE4/4 is linked to damaging lipid droplets in Alzheimer’s disease microglia. Nature628, 154–161. 10.1038/s41586-024-07185-7
30
Hemani G. Tilling K. Smith G. D. (2017). Orienting the causal relationship between imprecisely measured traits using GWAS summary data. PLOS Genet.13, e1007081. 10.1371/journal.pgen.1007081
31
Hemani G. Zheng J. Elsworth B. Wade K. H. Haberland V. Baird D. et al (2018). The MR-base platform supports systematic causal inference across the human phenome. Elife7, e34408. 10.7554/eLife.34408
32
Hong H. Fu Q. Gu P. Zhao J. Dai J. Xu K. et al (2025). Investigating the common genetic architecture and causality of metabolic disorders with neurodegenerative diseases. Diabetes Obes. Metab.27, 1337–1349. 10.1111/dom.16130
33
Horie N. C. Serrao V. T. Simon S. S. Gascon M. R. P. Dos Santos A. X. Zambone M. A. et al (2016). Cognitive effects of intentional weight loss in elderly obese individuals with mild cognitive impairment. J. Clin. Endocrinol. Metab.101, 1104–1112. 10.1210/jc.2015-2315
34
Huang L.-Y. Ou Y.-N. Yang Y.-X. Wang Z.-T. Tan L. Yu J.-T. (2023). Associations of cardiovascular risk factors and lifestyle behaviors with neurodegenerative disease: a mendelian randomization study. Transl. Psychiatry13, 267. 10.1038/s41398-023-02553-9
35
Huang H. Xiang R. Yan R. (2024). Linking APOE4/4 genotype to microglial lipid droplets and neurotoxicity in Alzheimer’s disease. Transl. Neurodegener.13, 1–4. 10.1186/s40035-024-00433-w
36
Ibeas K. Griñán‐Ferré C. Del Mar Romero M. Sebastián D. Bastías‐Pérez M. Gómez R. et al (2024). Cpt1a silencing in AgRP neurons improves cognitive and physical capacity and promotes healthy aging in Male mice. Aging Cell23, e14047. 10.1111/acel.14047
37
Jiang Y. Krantz S. Qin X. Li S. Gunasekara H. Kim Y.-M. et al (2022). Caveolin-1 controls mitochondrial damage and ROS production by regulating fission - fusion dynamics and mitophagy. Redox Biol.52, 102304. 10.1016/j.redox.2022.102304
38
Ju Y. Li S. Kong X. Zhao Q. (2024). Exploring fatty acid metabolism in Alzheimer’s disease: the key role of CPT1A. Sci. Rep.14, 31483. 10.1038/s41598-024-82999-z
39
Juul Rasmussen I. Luo J. Frikke-Schmidt R. (2024). Lipids, lipoproteins, and apolipoproteins: associations with cognition and dementia. Atherosclerosis398, 118614. 10.1016/j.atherosclerosis.2024.118614
40
Kang R.-R. Sun Q. Chen K.-G. Cao Q.-T. Liu C. Liu K. et al (2020). Resveratrol prevents benzo(a)pyrene-induced disruption of mitochondrial homeostasis via the AMPK signaling pathway in primary cultured neurons. Environ. Pollut.261, 114207. 10.1016/j.envpol.2020.114207
41
Karagiannis A. Gallopin T. Lacroix A. Plaisier F. Piquet J. Geoffroy H. et al (2021). Lactate is an energy substrate for rodent cortical neurons and enhances their firing activity. Elife10, e71424. 10.7554/eLife.71424
42
Kim M. Jee S.-C. Sung J.-S. (2024). Hepatoprotective effects of flavonoids against benzo[a]pyrene-induced oxidative liver damage along its metabolic pathways. Antioxidants13, 180. 10.3390/antiox13020180
43
Klein S. Gastaldelli A. Yki-Järvinen H. Scherer P. E. (2022). Why does obesity cause diabetes?Cell Metab.34, 11–20. 10.1016/j.cmet.2021.12.012
44
Kunkle B. W. Grenier-Boley B. Sims R. Bis J. C. Damotte V. Naj A. C. et al (2019). Genetic meta-analysis of diagnosed Alzheimer’s disease identifies new risk loci and implicates aβ, tau, immunity and lipid processing. Nat. Genet.51, 414–430. 10.1038/s41588-019-0358-2
45
Liang K. (2023). Mitochondrial CPT1A: insights into structure, function, and basis for drug development. Front. Pharmacol.14, 1160440. 10.3389/fphar.2023.1160440
46
Liberzon A. (2014). A description of the molecular signatures database (MSigDB) web site. Methods Mol. Biol. (Clift. N.J.)1150, 153–160. 10.1007/978-1-4939-0512-6_9
47
Mahajan A. Wessel J. Willems S. M. Zhao W. Robertson N. R. Chu A. Y. et al (2018). Refining the accuracy of validated target identification through coding variant fine-mapping in type 2 diabetes. Nat. Genet.50, 559–571. 10.1038/s41588-018-0084-1
48
Mahley R. W. (2016). Central nervous system lipoproteins: ApoE and regulation of cholesterol metabolism. Arterioscler. Thromb. Vasc. Biol.36, 1305–1315. 10.1161/ATVBAHA.116.307023
49
Manly J. J. Jones R. N. Langa K. M. Ryan L. H. Levine D. A. McCammon R. et al (2022). Estimating the prevalence of dementia and mild cognitive impairment in the US: the 2016 health and retirement study harmonized cognitive assessment protocol project. JAMA Neurol.79 (12), 1242–1249. 10.1001/jamaneurol.2022.3543
50
Maqoud F. Scala R. Hoxha M. Zappacosta B. Tricarico D. (2022). ATP-sensitive potassium channel subunits in neuroinflammation: noveldrug targets in neurodegenerative disorders. CNS Neurol. Disord. Drug Targets21, 130–149. 10.2174/1871527320666210119095626
51
Marrano N. Biondi G. Borrelli A. Rella M. Zambetta T. Di Gioia L. et al (2023). Type 2 diabetes and Alzheimer’s disease: the emerging role of cellular lipotoxicity. Biomolecules13, 183. 10.3390/biom13010183
52
Mayeda E. R. Tchetgen Tchetgen E. J. Power M. C. Weuve J. Jacqmin-Gadda H. Marden J. R. et al (2016). A simulation platform for quantifying survival bias: an application to research on determinants of cognitive decline. Am. J. Epidemiol.184, 378–387. 10.1093/aje/kwv451
53
Mbatchou J. Barnard L. Backman J. Marcketta A. Kosmicki J. A. Ziyatdinov A. et al (2021). Computationally efficient whole-genome regression for quantitative and binary traits. Nat. Genet.53, 1097–1103. 10.1038/s41588-021-00870-7
54
McKay E. C. Beck J. S. Khoo S. K. Dykema K. J. Cottingham S. L. Winn M. E. et al (2019). Peri-infarct upregulation of the oxytocin receptor in vascular dementia. J. Neuropathol. Exp. Neurol.78, 436–452. 10.1093/jnen/nlz023
55
Meikle P. J. Giles C. Cadby G. Huynh K. Mellett N. A. Olshansky G. et al (2020). Genome‐wide study of the human lipidome and links to Alzheimer’s disease risk: genome‐metabolome‐phenome: towards an integrated molecular atlas for Alzheimer’s disease. Alzheimer’s Dement.16, e045600. 10.1002/alz.045600
56
Meng B. Li Y. Ding Y. Xu X. Wang L. Guo B. et al (2021). Myeloid-derived growth factor inhibits inflammation and alleviates endothelial injury and atherosclerosis in mice. Sci. Adv.7, eabe6903. 10.1126/sciadv.abe6903
57
Mitchell R. Elsworth B. Mitchell R. Raistrick C. Paternoster L. Hemani G. et al (2019). MRC IEU UK biobank GWAS pipeline version 2. University of Bristol, Bridge. 10.5523/BRIS.PNOAT8CXO0U52P6YNFAEKEIGI
58
Muddapu V. R. Dharshini S. A. P. Chakravarthy V. S. Gromiha M. M. (2020). Neurodegenerative diseases – is metabolic deficiency the root cause?Front. Neurosci.14, 213. 10.3389/fnins.2020.00213
59
Munteanu C. Galaction A. I. Turnea M. Blendea C. D. Rotariu M. Poştaru M. (2024). Redox homeostasis, gut microbiota, and epigenetics in neurodegenerative diseases: a systematic review. Antioxidants13, 1062. 10.3390/antiox13091062
60
Pasdar Y. Rezaeian S. Mohammadi E. Khosravi Shadmani F. Shahnazi N. Najafi F. et al (2024). The interaction between general or abdominal obesity and hypertension on the risk of type 2 diabetes mellitus: a cross-sectional analysis in iranian adults from the RaNCD cohort study. BMC Public Health24, 752. 10.1186/s12889-024-18290-7
61
Pasqualetti G. Thayanandan T. Edison P. (2022). Influence of genetic and cardiometabolic risk factors in Alzheimer’s disease. Ageing Res. Rev.81, 101723. 10.1016/j.arr.2022.101723
62
Pinheiro F. I. Araújo-Filho I. Do Rego A. C. M. De Azevedo E. P. Cobucci R. N. Guzen F. P. (2024). Hepatopancreatic metabolic disorders and their implications in the development of Alzheimer’s disease and vascular dementia. Ageing Res. Rev.96, 102250. 10.1016/j.arr.2024.102250
63
Pinzi L. Rastelli G. (2019). Molecular docking: shifting paradigms in drug discovery. Int. J. Mol. Sci.20, 4331. 10.3390/ijms20184331
64
Pipatpolkai T. Usher S. Stansfeld P. J. Ashcroft F. M. (2020). New insights into KATP channel gene mutations and neonatal diabetes mellitus. Nat. Rev. Endocrinol.16, 378–393. 10.1038/s41574-020-0351-y
65
Procaccini C. Santopaolo M. Faicchia D. Colamatteo A. Formisano L. De Candia P. et al (2016). Role of metabolism in neurodegenerative disorders. Metabolism65, 1376–1390. 10.1016/j.metabol.2016.05.018
66
Qi G. Mi Y. Shi X. Gu H. Brinton R. D. Yin F. (2021). ApoE4 impairs neuron-astrocyte coupling of fatty acid metabolism. Cell Rep.34, 108572. 10.1016/j.celrep.2020.108572
67
Qiang Y.-X. You J. He X.-Y. Guo Y. Deng Y.-T. Gao P.-Y. et al (2024). Plasma metabolic profiles predict future dementia and dementia subtypes: a prospective analysis of 274,160 participants. Alzheimer’s Res. Ther.16, 16. 10.1186/s13195-023-01379-3
68
Readhead B. Haure-Mirande J.-V. Funk C. C. Richards M. A. Shannon P. Haroutunian V. et al (2018). Multiscale analysis of independent Alzheimer’s cohorts finds disruption of molecular, genetic, and clinical networks by human herpesvirus. Neuron99, 64–82.e7. 10.1016/j.neuron.2018.05.023
69
Rehman S. U. Shah S. A. Ali T. Chung J. I. Kim M. O. (2017). Anthocyanins reversed D-Galactose-Induced oxidative stress and neuroinflammation mediated cognitive impairment in adult rats. Mol. Neurobiol.54, 255–271. 10.1007/s12035-015-9604-5
70
Ritchie M. E. Phipson B. Wu D. Hu Y. Law C. W. Shi W. et al (2015). Limma powers differential expression analyses for RNA-sequencing and microarray studies. Nucleic Acids Res.43, e47. 10.1093/nar/gkv007
71
Sancho M. Klug N. R. Mughal A. Koide M. Huerta De La Cruz S. Heppner T. J. et al (2022). Adenosine signaling activates ATP-sensitive K+ channels in endothelial cells and pericytes in CNS capillaries. Sci. Signal.15, eabl5405. 10.1126/scisignal.abl5405
72
Sebastian M. J. Khan S. K. Pappachan J. M. Jeeyavudeen M. S. (2023). Diabetes and cognitive function: an evidence-based current perspective. World J. Diabetes14, 92–109. 10.4239/wjd.v14.i2.92
73
Shwe T. Pratchayasakul W. Chattipakorn N. Chattipakorn S. C. (2018). Role of D-galactose-induced brain aging and its potential used for therapeutic interventions. Exp. Gerontol.101, 13–36. 10.1016/j.exger.2017.10.029
74
Tareen S. H. K. Kutmon M. de Kok T. M. Mariman E. C. M. van Baak M. A. Evelo C. T. et al (2020). Stratifying cellular metabolism during weight loss: an interplay of metabolism, metabolic flexibility and inflammation. Sci. Rep.10, 1651. 10.1038/s41598-020-58358-z
75
Toledano A. Rodríguez-Casado A. Älvarez M. I. Toledano-Díaz A. (2024). Alzheimer’s disease, obesity, and type 2 diabetes: focus on common neuroglial dysfunctions (critical review and new data on human brain and models). Brain Sci.14, 1101. 10.3390/brainsci14111101
76
Tovar S. Paeger L. Hess S. Morgan D. A. Hausen A. C. Brönneke H. S. et al (2013). KATP-channel-dependent regulation of catecholaminergic neurons controls BAT sympathetic nerve activity and energy homeostasis. Cell Metab.18, 445–455. 10.1016/j.cmet.2013.08.006
77
Tyner J. W. (2017). Integrating functional genomics to accelerate mechanistic personalized medicine. Cold Spring Harb. Mol. Case Stud.3, a001370. 10.1101/mcs.a001370
78
Uzuner Odongo D. İlgün A. Bozkurt F. B. Çakır T. (2025). A personalized metabolic modelling approach through integrated analysis of RNA-seq-based genomic variants and gene expression levels in Alzheimer’s disease. Commun. Biol.8, 502. 10.1038/s42003-025-07941-z
79
Wang S. Ichinomiya T. Terada Y. Wang D. Patel H. H. Head B. P. (2021). Synapsin-promoted caveolin-1 overexpression maintains mitochondrial morphology and function in PSAPP Alzheimer’s disease mice. Cells10, 2487. 10.3390/cells10092487
80
Wang F. Jing Z. Wang Q. Li M. Lu B. Huo A. et al (2025a). Bidirectional mendelian randomization analysis of the association between mitochondrial proteins and neurodegenerative diseases. Brain Behav.15, e70283. 10.1002/brb3.70283
81
Wang Z. Yin Z. Sun G. Zhang D. Zhang J. (2025b). Genetic evidence for the liver-brain axis: lipid metabolism and neurodegenerative disease risk. Lipids Health Dis.24, 41. 10.1186/s12944-025-02455-3
82
Wee J. Sukudom S. Bhat S. Marklund M. Peiris N. J. Hoyos C. M. et al (2023). The relationship between midlife dyslipidemia and lifetime incidence of dementia: a systematic review and meta-analysis of cohort studies. Alzheimer’s Dement. (Amst. Neth.)15, e12395. 10.1002/dad2.12395
83
Weijie Z. Meng Z. Chunxiao W. Lingjie M. Anguo Z. Yan Z. et al (2024). Obesity-induced chronic low-grade inflammation in adipose tissue: a pathway to Alzheimer’s disease. Ageing Res. Rev.99, 102402. 10.1016/j.arr.2024.102402
84
Wiegers T. C. Davis A. P. Wiegers J. Sciaky D. Barkalow F. Wyatt B. et al (2025). Integrating AI-powered text mining from PubTator into the manual curation workflow at the comparative toxicogenomics database. Database J. Biol. Databases Curation2025, baaf013. 10.1093/database/baaf013
85
Xiao X. Bi M. Du X. Jiang H. (2023). The ATP-sensitive potassium channel: a therapeutic target for neurodegeneration?Expert Opin. Ther. Targets27, 517–521. 10.1080/14728222.2023.2240023
86
Xu J. Jackson C. W. Khoury N. Escobar I. Perez-Pinzon M. A. (2018). Brain SIRT1 mediates metabolic homeostasis and neuroprotection. Front. Endocrinol.9, 702. 10.3389/fendo.2018.00702
87
Xu J. Bankov G. Kim M. Wretlind A. Lord J. Green R. et al (2020). Integrated lipidomics and proteomics network analysis highlights lipid and immunity pathways associated with Alzheimer’s disease. Transl. Neurodegener.9, 36. 10.1186/s40035-020-00215-0
88
Xu Y. Wen L. Tang Y. Zhao Z. Xu M. Wang T. et al (2024). Sodium butyrate activates the KATP channels to regulate the mechanism of parkinson’s disease microglia model inflammation. Immun. Inflamm. Dis.12, e1194. 10.1002/iid3.1194
89
Yang L. G. March Z. M. Stephenson R. A. Narayan P. S. (2023). Apolipoprotein E in lipid metabolism and neurodegenerative disease. Trends Endocrinol. Metab.34, 430–445. 10.1016/j.tem.2023.05.002
90
Yin F. (2023). Lipid metabolism and Alzheimer’s disease: clinical evidence, mechanistic link and therapeutic promise. FEBS J.290, 1420–1453. 10.1111/febs.16344
91
Yuan Y. Cruzat V. F. Newsholme P. Cheng J. Chen Y. Lu Y. (2016). Regulation of SIRT1 in aging: roles in mitochondrial function and biogenesis. Mech. Ageing Dev.155, 10–21. 10.1016/j.mad.2016.02.003
92
Yuan Y. Zhao G. Zhao Y. (2025). Dysregulation of energy metabolism in Alzheimer’s disease. J. Neurol.272, 2. 10.1007/s00415-024-12800-8
93
Zeng Y. Cao S. Li N. Tang J. Lin G. (2023). Identification of key lipid metabolism-related genes in Alzheimer’s disease. Lipids Health Dis.22, 155. 10.1186/s12944-023-01918-9
94
Zhang M. Chen J. Yin Z. Wang L. Peng L. (2021). The association between depression and metabolic syndrome and its components: a bidirectional two-sample mendelian randomization study. Transl. Psychiatry11, 633. 10.1038/s41398-021-01759-z
95
Zhao T. Miao H. Song Z. Li Y. Xia N. Zhang Z. et al (2023). Metformin alleviates the cognitive impairment induced by benzo[a]pyrene via glucolipid metabolism regulated by FTO/FoxO6 pathway in mice. Environ. Sci. Pollut. Res.30, 69192–69204. 10.1007/s11356-023-27303-8
Summary
Keywords
Alzheimer’s disease, lipid metabolism, machine learning, metabolic syndrome, systems genetics
Citation
Li Y, Ni Z, Xia X-Y, Cheng N, Bo Y, He J, He Y, Meng X-Y, Wang X and Xu X (2026) Integrating causal human genetics and In vivo transcriptomics to uncover a shared lipid-centric architecture in metabolic and neurocognitive disease. Front. Mol. Biosci. 12:1712198. doi: 10.3389/fmolb.2025.1712198
Received
24 September 2025
Revised
30 November 2025
Accepted
15 December 2025
Published
27 January 2026
Volume
12 - 2025
Edited by
Matteo Becatti, University of Firenze, Italy
Reviewed by
Mustafa Mohammad, University of Delhi, India
Isha Mhatre-Winters, University of Georgia, United States
Updates
Copyright
© 2026 Li, Ni, Xia, Cheng, Bo, He, He, Meng, Wang and Xu.
This is an open-access article distributed under the terms of the Creative Commons Attribution License (CC BY). The use, distribution or reproduction in other forums is permitted, provided the original author(s) and the copyright owner(s) are credited and that the original publication in this journal is cited, in accordance with accepted academic practice. No use, distribution or reproduction is permitted which does not comply with these terms.
*Correspondence: Xuan Xu, xuxuan@ahmu.edu.cn; Xu Wang, wangxu@ahmu.edu.cn; Xiang-Yu Meng, mengxy_whu@163.com
†These authors have contributed equally to this work
Disclaimer
All claims expressed in this article are solely those of the authors and do not necessarily represent those of their affiliated organizations, or those of the publisher, the editors and the reviewers. Any product that may be evaluated in this article or claim that may be made by its manufacturer is not guaranteed or endorsed by the publisher.