 Alfred Kersch
 Richard Ganser
- Department of Applied Sciences and Mechatronics, Munich University of Applied Sciences, Munich, Germany
Fluorite-structured hafnium and zirconia require different, complementary characterization methods to identify the numerous metastable phases. This is because of the many possible positions of the oxygen ions, which are difficult to observe directly. Ab initio simulations are useful to probe the corresponding XRD, Raman, and infrared spectra for fingerprints. However, the predictive power of theoretical methods is limited both by model errors and by boundary conditions such as defects, stresses, and morphology that are difficult to detect. We first consider the calculation of Raman and infrared spectra of the most interesting undoped phases of HfO2 and ZrO2, compare the results with known results, and discuss the uncertainties. Next, we consider the possibilities of classifying the phases using X-ray diffraction. To this end, we introduce the effects of doping, which increases the uncertainty due to structural disorder. For illustration, we examine a large data set of doped structures obtained with ab initio calculations. To make an unbiased assignment of phases, we use machine learning methods with clusters. The limits of X-ray diffraction spectroscopy are reached when phase mixtures are present. Resolution of single-phase polycrystalline samples may only be possible here if these three characterization methods are used.
1 Introduction
HfO2 and ZrO2 thin films are very interesting for microelectronic and technical applications because of their metastable polar and ferroelectric Pca21 phase and other excellent properties [Schroeder et al. (2019)]. The applications range from dense nonvolatile memories [Mikolajick et al. (2018)] over thin-film piezoelectric transducers [Mart et al. (2021)] to thin-film pyroelectric devices [Lomenzo et al. (2020)]. The polymorphism of the phases in HfO2 and ZrO2 is still surprising, since only recently new or unconventional phases are observed [Wei et al. (2018); Cheng et al. (2022)] or found by simulations [Antunes et al. (2022); Du et al. (2021); Azevedo Antunes et al. (2021)]. Some experimental findings are still not consistent with the conventionally considered phases [Schroeder et al. (2022)], which are the monoclinic ground state m-phase (P21/c, no 14), the polar-orthorhombic oIII-phase (Pca21, no 29), the tetragonal t-phase (P42/nmc, no 137), and the cubic c-phase (
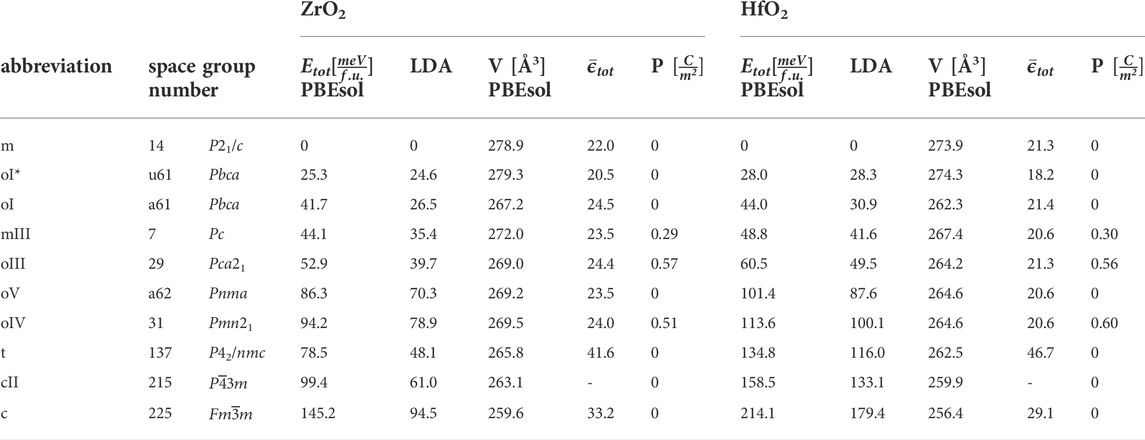
TABLE 1. DFT calculated total energies of low-energy crystal structures relative to the monoclinic phase, calculated with PBEsol and LDA, crystal volume per 24-atomic cell, averaged (electronic plus ionic) dielectric constant, and remanent polarization.
Whereas in the last years the research focus was on the polymorphism and the ferroelectric phases in HfO2, the polymorphism and ferroelectric phase in ZrO2 was less studied. In the theoretical works it turned out that low-energy metastable phases of HfO2 identified in density functional calculations also exist in ZrO2 with slightly lower values of total energy.
The number of inequivalent crystal structures increases with the number of atoms in the primitive cell. A systematic investigation of crystal structures up to 12-atomic cells has been carried out by Barabash (2017). Besides the conventional phases of 12-atomic cells, we consider the cubic cII-phase (
Our question is how these crystal phases can be distinguished experimentally with spectroscopic methods, especially in the typical polycrystalline mixed phase composition found in most applications.
2 Phonon spectroscopy
The oxygen positions in the crystal phases of Table 1 are very different, but difficult to detect with the direct method of X-ray spectroscopy because of the small cross-section. But the oxygen positions appear equally important than the metals in the optical phonon modes interacting with electromagnetic radiation. Phonon modes in HfO2 and ZrO2 are furthermore key properties and appear specifically in the phase transitions. To explore the stability of the phases, the calculation of all phonon modes in the first Brillouin zone is necessary, expressed in the phonon band structure diagram. The calculation of the phonon band structure for the most discussed phases P21/c, Pca21, Pbca, and P42/nmc for HfO2 was done in Fan et al. (2022) using the PBEsol density functional. The calculation for all further phases contained in Table 1 was done in Antunes et al. (2022) proving the dynamical stability except for the c-phase and the cII-phase.
In the interaction of the electromagnetic radiation with phonon modes, energy and momentum of the photon is transferred. But for visible or infrared light its momentum is very small. Therefore the interacting phonon modes have momenta very close to the Brillouin zone center. Phonon modes with very small momentum but finite energy are the optical modes. Therefore in simulation only the zone center optical phonons have to be calculated to model these processes. These optical modes are furthermore distinguished as Raman active modes and Infrared active modes. Raman and Infrared modes are complementary in centrosymmetric crystals and show the change of polarization and the change of polarizability, respectively. But this classification is not valid for noncentrosymmetric, polar phases because these are simultaneously Raman and Infrared (IR) active.
In ionic crystals like HfO2 and ZrO2 the IR modes have to be distinguished in transversal optical (TO) and longitudinal optical (LO) modes, refering to the direction of propagation of the interacting photon. These mode frequencies are subject to LO-TO splitting resulting from an effect of induced ionic polarization on the mode frequencies. The TO phonons correspond to oppositely-charged ions moving in adjacent planes parallel to each other, resulting in a Coulomb interaction which reduces the frequency. These phonons participate in the interaction with electromagnetic radiation which has a transversal electric field. The LO phonon modes correspond to ions with opposite effective charges moving in opposing directions along the wavevector q, causing long-range macroscopic electric fields in a polar crystal, which increases the frequency. These LO phonons do not couple with electromagnetic radiation. For further details see Gross and Marx (2014). In simulation the LO-TO splitting is calculated by adding the non-analytic induced ionic polarization contribution to the dynamical matrix, see Veithen et al. (2005).
2.1 Calculation of phonon modes
Firstly, the equilibrium crystal lattice and atomic positions were found by minimizing the forces on the atoms and stresses in the crystal cell. We performed ab initio calculations with the ABINIT implementation of the density functional theory (DFT) and the density functional perturbation theory (DFPT) implemented by Gonze (2020) based on projector augmented wave pseudo potentials from the GBRV library provided by Garrity et al. (2014). The local density approximation was chosen as it gives good values for vibrational frequencies in metal oxides. For the 3-, 6-, 12-, and 24-atomic cells the reciprocal spaces were sampled with a 10 × 10 × 10, 8 × 8 × 6, 6 × 6 × 6, and 3 × 6 × 6 grids of k-points and a cut-off energy of 40 Ha. The convergence criterion for ions was set to 10−4eV/Å. The relaxation was constrained with the symmetry finder of ABINIT. The lattice constants of the structures are documented in the Supplementary Section S1. The dielectric constant was obtained as second order perturbation with respect to the electric field, and the Raman tensor finally with the perturbation of the dielectric constant with respect to the atomic displacement. The LO-TO splitting from long-range electrostatic interaction was taken into account with the analytical formula implemented in ABINIT. For the calculation of vibrational properties, we have chosen LDA instead of other exchange-correlation functionals, following the benchmark results of He et al. (2014). For nonlocal or hybrid functionals a systematic evaluation is not known. The data from Table 1 have been compared with the results from other methods in the Supplementary Material of Antunes et al. (2022).
2.2 Raman active modes and mode intensity
Raman spectra of polycrystalline thin films are a superposition of contributions from several small crystallites (grains) in all orientations, in contrast to single crystals which impose selection rules, depending on orientation, propagation direction and polarization. In this work we limit ourselves to the Raman characteristics of polycrystalline films and therefore calculated the averaged intensity spectrum from crystalline results for all orientations and polarizations, as done in Caracas and Cohen (2006) and Romero (2020). Here the dependence of the splitting on the direction of the phonon was implemented with simply adding the intensity distributions from the three Cartesian directions, after applying some smearing of δ = 3cm−1. This procedure adds peaks of different frequency in three directions instead of integrating the directionally dependent contributions. The simplification, however, does not affect the peak position, only the peak shape. Improvements with proper integration have been proposed by Popov et al. (2020). Starting point for the calculation of the Raman intensity is the Raman tensor
Averaging about all orientations and polarizations gives the Raman mode intensity Im(ω) depending on Raman shift wavenumber ω as
where
A further result of the calculated Raman tensor
The calculation of the Raman spectrum for polycrystalline, ferroelectric ZrO2 has first been done in Materano et al. (2022) and for monocrystalline, ferroelectric HfO2 in Fan et al. (2022). The spectra for the other conventionally considered phases have been calculated earlier by Zhou et al. (2014).
As one of our major results, Figure 1 shows the calculated Raman Intensity spectra for ZrO2 and HfO2 for all the crystal phases in Table 1.
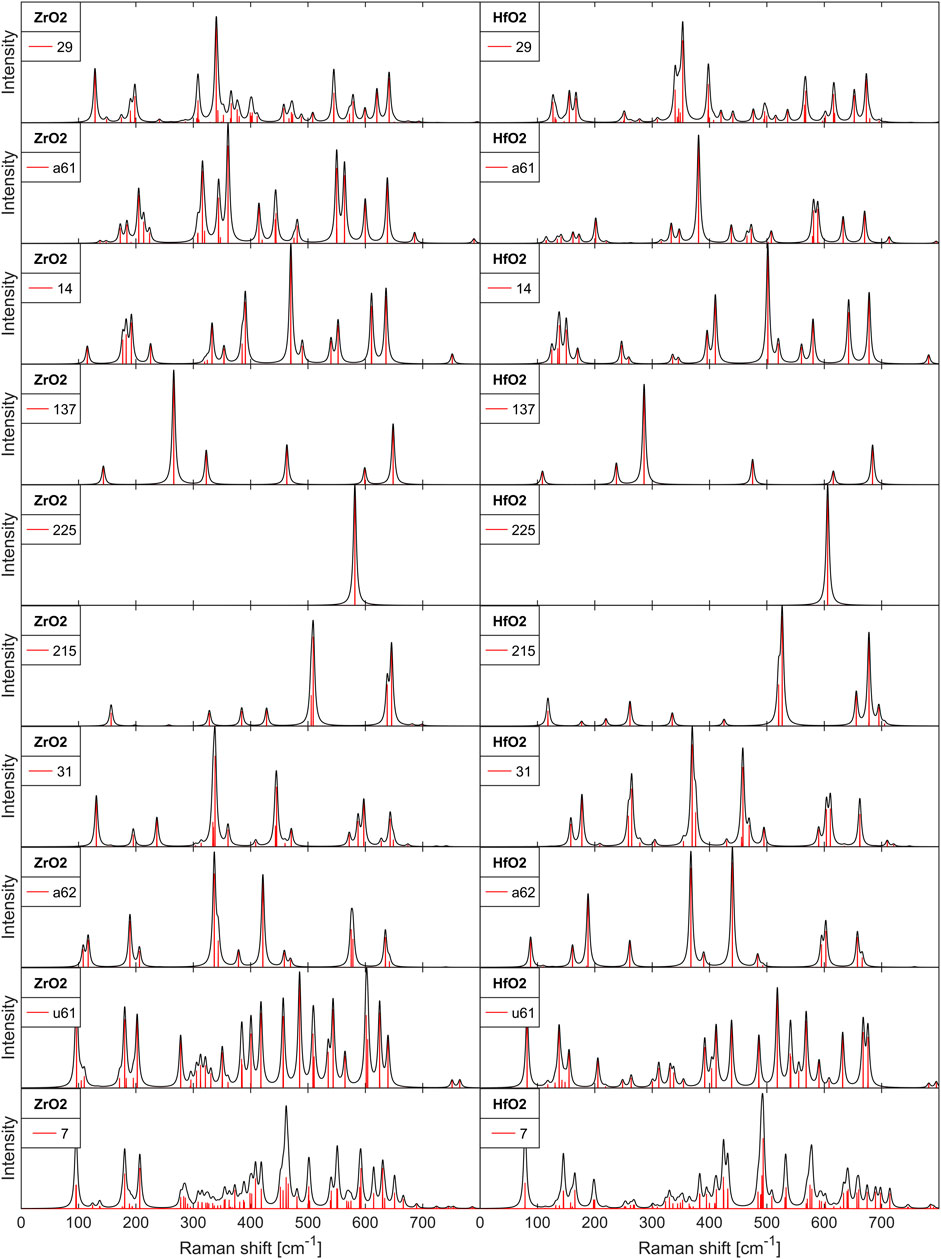
FIGURE 1. Raman intensity and Raman lines for undoped, polycrystalline ZrO2 and HfO2 films.
2.3 Infrared active modes
Infrared activation results in the materials dielectric response to an electromagnetic frequency ω. The response is based on the change of the polarization Pα with respect to the displacement τκ,β in direction β (Ω unit cell volume), given as the Born charge
The intensity of the response in form of an activated mode m with eigenvector
The quantum mechanical calculation of the interaction of transversal electromagnetic waves with the crystal ions yields resonance contributions to the dielectric constant for all TO modes with frequency
The damping coefficient γm smoothens the resonance peaks of ϵαβ and is typically phenomenologically choosen, we neglect it here. Typical for a resonant process, the dielectric constant shows a sign change at ωm, which is an anomalous dispersion. Increasing ω beyond the resonance, the dielectric function passes through a zero exactly at the associated LO mode which has a larger frequency
The imaginary part of the dielectric function is directly connected to the real part by the Kramers-Kroning relations. This imaginary part peaks exactly at the singularity of the anomalous dispersion and is closely related to the absorption, which is therefore maximal at
Figure 2 shows our calculated dielectric functions for ZrO2 and HfO2 for the crystal phases in Table 1.
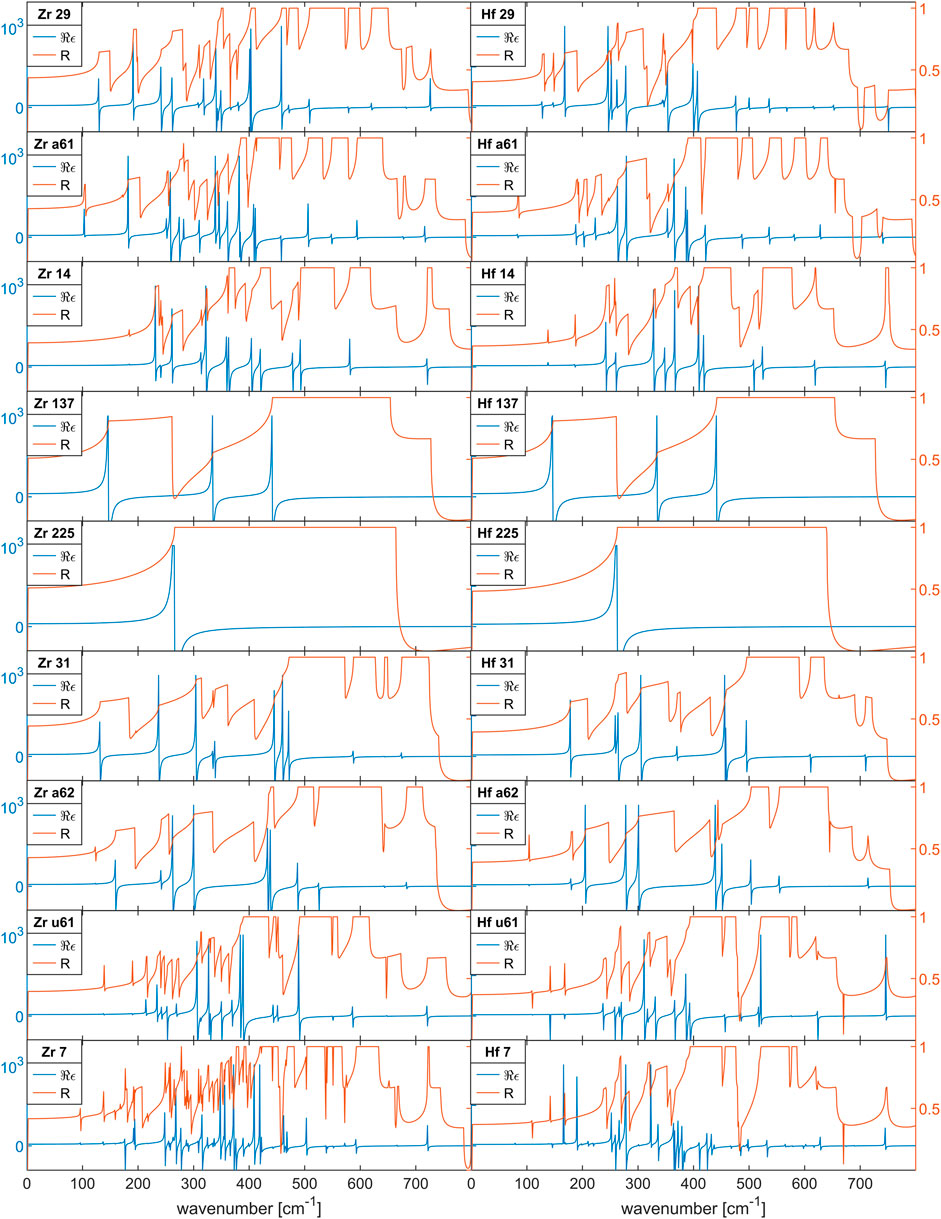
FIGURE 2. Dielectric functions for undoped, polycrystalline ZrO2 and HfO2 films. The real part of ϵ (blue line) indicates the TO modes as singularity and the LO modes as zeros, the polycristalline reflectivity (orange line) indicates TO/LO modes with steep increase/decrease.
2.4 Experimental signatures of Raman spectra
Raman spectroscopy has not been used widely for characterization of thin films, because thicker films are required for sufficient intensity, and specifically for the ferroelectric ZrO2 and HfO2 because in thicker films this phase is difficult to stabilize. Materano et al. (2022) performed the first Raman measurements on stacks of thin ZrO2 films with stabilizing interlayer, and compared the data to simulated polycrystalline spectra of m-, t- and oIII-phase to identify the ferroelectric phase. Thicker crystalline samples with ferroelectric HfO2 prepared with a special floating zone technique have been investigated recently in Fan et al. (2022) who compared the data with simulated oriented crystal spectra of c-, t-, oI- and oIII-phase. In past work, experimental data from ceramic samples of HfO2 and ZrO2 have been collected from Hirata et al. (1994), Arashi (1992). Quintard et al. (2002) and Zhou et al. (2014) compared data with simulated results.
In Figure 1 the Raman spectra of ZrO2 and HfO2 can directly be compared. There is an overall similarity with the trend of comparable mode frequencies of HfO2 being lower than in ZrO2 below about 400cm−1 and being higher above about 400cm−1. The order of the modes with frequency is mostly the same, but some major lines are crossing from ZrO2 to HfO2, for example the
The order of the phases in Figure 1 is also chosen so that the possibility of distinguishing some related phases can be easily assessed. The first two spectra are the ferroelectric oIII-phase (no 29) and the antipolar oI-phase (no a61). In a recent paper Cheng et al. (2022) could distinguish these phases using scanning transmission electron microscopy high-angle dark-field images (HAADF STEM). According to Figure 1 they could be distinguished with unique features of the Raman spectrum at very low and very high wavenumber. Next, the Raman spectrum of the m-phase may be compared to the oIII-phase. Both spectra are rather complex, but there are characteristic, unique peaks for the m-phase (no 14) at 400cm−1 and especially at 500cm−1. The Raman spectrum of the t-phase (no 137) is easy to identify because of few lines. Materano et al. (2022) found these lines very easily in their polycristalline films. Next is the c-phase (no 225) with a single Raman line. Interestingly, the Raman spectrum is very different to the t-phase (no 137) spectrum, although the crystal phases are closely related. This observation is reinforced by comparison with the cIII-phase (no 215), whose spectrum markedly differs from the spectrum of the c-phase (no 225). This is because of the different vibrational modes, although the observable metal positions are in both cases cubic. One more phase which has been intensively discussed and searched is the oIV-phase (no31), a further polar phase. Theory predicts an associated antipolar oV-phase (no a62) with reduced energy [see Azevedo Antunes et al. (2021) for the related citations], similar to oII-phase and oI-phase (no 29 and no a61). Again, the Raman spectra are similar, but some low-energy modes might be sufficient to distinguish them. The remaining phases are the nonpolar oI* (no u61) which was found experimentally with HAADF STEM Du et al. (2021), and another polar phase mIII (no 7) with energy below the ferroelectric oIII-phase, which was not identified so far. Both Raman spectra are so complex that it is unlikely to distinguish against other phases.
2.5 Experimental signatures of infrared spectra
Infrared reflectance and absorption spectroscopy can be performed with Fourier Transform Infrared Spectrometers (FTIR). Reflectance measurements need a sufficiently thick sample, which is available for crystalline samples. Fan et al. (2022) performed recently such experiments on relatively thick samples of different crystal phases of HfO2. Thin samples can be investigated with the Attenuated Total Reflection (ATR) spectroscopy, which can measure the absorptivity of very thin films. Govindarajan et al. (2007) could distinguish the t-phase from the m-phase in 7 nm doped HfO2 films, but was limited to a 600 − 900cm−1 wavelength range, because of absorption in the imaging optics. Depending on the apparatus such measurements are extendible to the interesting 100 − 900cm−1 wavelength range.
In Figure 2 the real part of the dielectric function and the reflectivity spectra of ZrO2 and HfO2 can be compared directly. Again, there is an overall similarity with the trend of comparable mode frequencies of HfO2 being lower than in ZrO2 below about 400cm−1 and being higher above about 400cm−1. The order of the modes with frequency is mostly the same, but the details are different and mode crossing is not obvious.
The order of the phases in Figure 2 is again chosen so that the possibility of distinguishing some of related phases can be easily assessed. The dielectric function of the cII-phase (no 215) is missing because the phonon calculation shows that this phase is unstable at T = 0K, which makes the calculation of the dielectric function impossible. As discussed before, the anomalous dispersion frequency can be identified with absorption lines. Regarding the discrimination of oII-phase (no 29) and oI-phase (no a61), this is possible with detection of the low energy TO-modes below 200cm−1. The t-phase (no 137) and the c-phase (no 225) show few absorption lines and extremely large LO-TO splitting, which are characteristic. The oIV-phase (no 31) and oV-phase (no a62) show very similar, complex optical functions, which differ in details. Finally the optical functions of oI*-phase (no u61) and mII-phase (no 7) are very complex and difficult to discriminate.
2.6 Phase identification
Phase identification of crystal phases with Raman or IR-spectra relies on accurate mode frequencies which are either measured or calculated. For the HfO2 and ZrO2 phases presently there is an uncertainty in experimental and in calculated data. The uncertainties in the experimental data [see Fan et al. (2022) and Materano et al. (2022)] are related to the difficulty of probe preparation or the limitation of film thickness. The uncertainty in the calculated data are related to limited accuracy of the available density functionals. The data listed in the Supplementary Section S2 compare different calculated data with experimental data. From the comparison, the agreement between the theoretical methods among each other and the experimental data is for most of the mode frequencies better than 20cm−1. This is sufficient to identify the conventionally considered phases in a phase mixture, but probably not sufficient to find a new phase.
When a reliable data base of mode frequencies is available, automatization of phase identification beyond the fitting of simple phase mixtures to data samples is conceivable, see e.g., Cui et al. (2019). We will turn our attention to such methods based on machine learning techniques in the next section.
3 XRD-spectroscopy
XRAY-diffraction spectroscopy is typically the first characterization methods for polycristalline thin films because it is relatively easy accessible and requires no special preparation. The reference data base is mostly obtained from experimental data, but also simulated data are possible. The uncertainty of calculated XRD-spectra is typically smaller than for calculated vibrational modes, because the accuracy of structural data is typically better than 1%, exceeding the accuracy of calculated mode frequencies. The special problem for HfO2 and ZrO2 thin films is the near unobservability of the oxygen position compared to the metal positions because of the very different scattering cross sections.
Before we start with the discussion about clustering methods for phase identification, we give an overview of the calculated XRD-spectra. The peak positions are related to the structural data of the crystal. Because of the obtained accuracy we prefer the PBEsol density functional for XRD-spectra, in contrast to the vibrational modes where we prefer the LDA. Figure 3 gives an overview of the XRD-spectra for the phases of Table 1. The comparison of the data for HfO2 and ZrO2 shows nearly identical spectra with very small difference in peak position because of slightly different unit cell sizes. More interesting are the differences among the different phases.
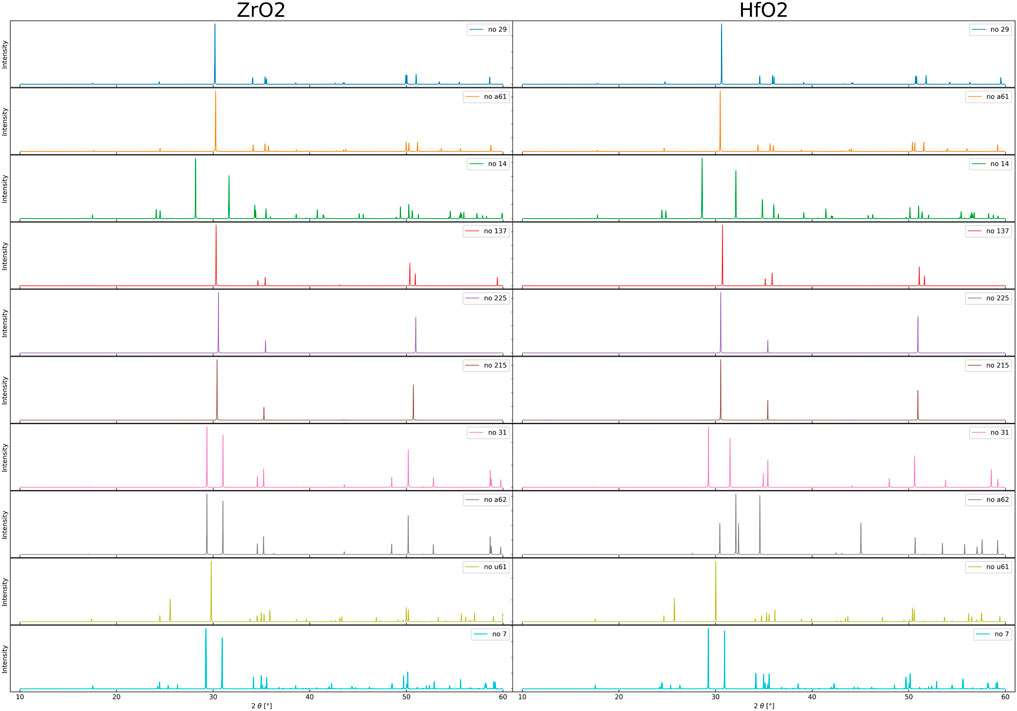
FIGURE 3. Displayed are the simulated XRD-spectra of undoped ZrO2 and HfO2 crystal phases. The data are based on structural results obtained from the PBEsol density functional. Due to their distinctive peaks and the widespread usage of XRD in experiments, we chose to base our clustering on XRD-spectra.
3.1 Clustering
With advances in high-throughput experiments to discover new materials, refined analytical methods that allow unbiased evaluation of data are needed. The task of this work is the identification of crystal phases in a phase mixture. A realistic assumption is that the characteristics are known with some uncertainty, either from an experimental condition such as stress or defects that have an unknown impact on the data, or from a theoretical model that has a modeling error. We must therefore allow the data to be standardized. A specific example of such a method is to allow some variation in crystal lattice size in order to be able to fit XRD data to the peak positions derived from lattice plane spacing.
We have created a data set consisting of 3,400 different crystal structures, half HfO2 and half ZrO2, made up of equal parts from the following initial structures: the t-phase (no 137), the m-phase (no 14), the nonpolar oI*-phase (no u61) and the polar orthorhombic oIII-phase (no 29). The cell sizes are 96 atomic, 2 × 2 × 2 12-atom unit cells and 48 atomic, 2 × 2 × 1 12-atom unit cells. The dopant levels are 3.15f.u.% and 6.25f.u.%, corresponding to one dopant per 96 and 48 atomic cells, respectively. To account for different dopant arrangements, three calculations with 48 atoms, each with the same phase and dopant, but in different directions, are used. The dopants are introduced either substitutionally (replacement of Hf or Zr atom) or interstitially at energetically favorable positions. The doping is therefore not ionically compensated for many of the dopants. All atoms up to the atomic number 85 unit are selected as dopants and placed either as interstitial atoms between metal ions or as a substitute for a metal ion. The data set was created to investigate piezoelectric strain effects and is described in detail in Falkowski and Kersch (2020). The structures are then relaxed using the ab initio code FHI-AIMS using the LDA pseudopotential. The force and energy convergence criteria are 10−4 eV/Å and 10−6 eV, respectively. The LDA functional was chosen for the data creation because of its robustness in structure relaxation. It is known that the LDA approximation systematically underestimates the lattice size about less that 1%. But as outlined in the next section the calculated data are subjected to a cell size standardization procedure to improve a possible inconsistency of the data related to inaccurate lattice size. Afterwards the standardized data are processed with machine learning tools but not compared to experiments. To compare the XRD of calculated undoped structures with experimental data, we have done the calculation with PBEsol and created the data shown in Figure 3. To compare the XRD of calculated doped structures with experimental data, their structures should be allowed to rescale within about 1% to take the inaccuracy of LDA and missing knowledge of the stress state into account.The placement of dopant atoms represents a significant perturbation of the crystal lattice. After relaxation, it is unclear whether the crystal structures remained in their original phase or changed to another phase. The new phase can be known, but without a representative data set or even a new, unknown phase. Due to the irregular shapes of the doped crystals, simple sorting algorithms fail in a robust clustering of the dataset, which motivates the application of machine learning methods.
The powder-XRD is generated using the python package xrayutilities Kriegner et al. (2013), in the range of 10°-60° in 0.1° degree steps, with each XRD-bin corresponding to one feature. The resulting feature space is therefore of size 500. In the first step for machine learning, each spectral area is normalized to 1 and each bin value is scaled relative to the highest and lowest values occurring for that bin in the data set using the MinMaxScaler of the sci-kit learn python-package Pedregosa et al. (2011). The generated XRD spectra vary significantly in spectral linewidth and position due to the cell shape expanding/contracting depending on the size of the selected dopant atom. To overcome this problem, a standardization procedure is applied. Each spectrum gets shifted in 0.1° increments up to ± 1° and for each shift the dot product of the shifted spectra with all other unshifted spectra is calculated returning an estimate of the overlap. The shift resulting in the highest overlap with the remaining dataset is kept and the procedure is repeated for the next spectra. At the end of several iterations an averaged spectrum is returned, which is more distinguishable for machine learning. The impact of this method is illustrated in Figure 4 with the XRD data before and Figure 5 after the cell size standardization. A similar algorithm has been described in Stanev et al. (2018). Further improvement of the clustering can be achieved by adding more known features, which is the reason for the addition of the remanent polarization in our dataset.
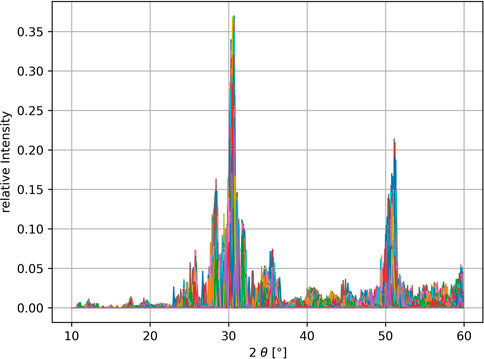
FIGURE 4. XRD raw data with normalized total intensities. Due to disturbed cell parameters, structures of the same crystal class have slightly shifted characteristic peaks, which is difficult for a clustering algorithm to detect.
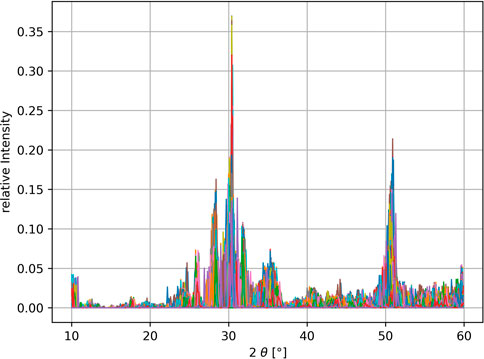
FIGURE 5. By shifting the spectra in a limited range of ± 1° in 0.1° steps and optimizing the overall overlap, the spectra are standardized to fit better into crystal classes.
The normalized and standardized data set consists of 501 features, representing the bins of the XRD spectra and the polarization. We then performed feature reduction by Principal Component Analysis (PCA), limiting the number of features to 30, see Long et al. (2009). The loadings of the six first principle components (PCs) were reconstructed using reverse PCA, returning the XRD-bins which contain the highest data variance, see Supplementary Section S3. In contrast to experimental phase composition estimation, which concentrates on the position of the main peak, which lies for the t-, oIII- and oI*-phase (no 137, no 29, no 61) close to 30°, the PCA utilizes peaks of lower magnitude. This can be understood from the strong influence of doping, which shifts the main peaks and therefore prevents phase separation by this peak alone. The PCA converges to about 95% of the explained variance, which indicates that the algorithm is appropriate for this data set.
With the expectation that most structures will retain their original shape with relatively few phase transitions and therefore resemble a high variance in cluster density, the Density-Based Spatial Clustering of Applications with Noise (DBSCAN) algorithm is chosen Yamashita et al. (2021). The algorithm parameters are selected so that small clusters can be detected, while larger clusters are not treated too strictly. Choosing a minimum size of about 10 clusters and an epsilon for cluster selection of about 0.6 leads to the discovery of a new cluster and an outlier cluster, containing all remaining structures, see Supplementary Section S3.
The algorithm successfully partitions the data set into the original groups as well as a newly formed group, which is identified as cII-phase (no 215). This new group contains no structure which is similar to the c-phase (no 225) with unperturbed oxygen position. This is not surprising because of the much lower energy of the cII-phase compared to the c-phase. Examination of the phase transitions reveals that mostly the t-phase (no 137) and the oIII-phase (no 29) decay into different crystal structures, while the m-phase (no 14) and oI*-phase (no u61) mostly remain in their initial configurations, as expected, due to their low energy. The t-phase (no 137) and the oIII-phase (no 29) transition almost exclusively into the outlier cluster, despite the low energy of the m-phase (no 14). This emphasizes the height of the formation energy between the t-phase (no 137) and oIII-phase (no 29) into the m-phase (no 14). This behaviour is visualized in the Sankey diagram Figure 6 which quantifies the accuracy of the method for phase identification for the data in average.
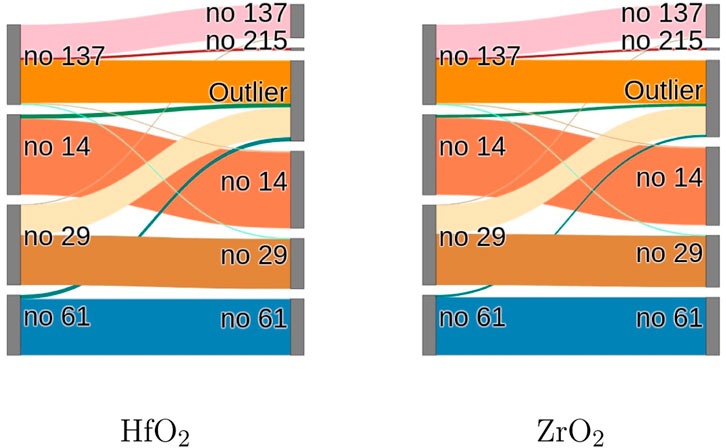
FIGURE 6. The Sankey diagrams for HfO2 and ZrO2 display on the left border the initial phases, which are subjected to doping and on the right border the detected clusters. This visualizes the phase-evolutions under doping for different crystal phases. In both material systems the m-phase (no 14) and the oI*-phase (no u61) are the most stable phases, according to their energies, whereas the oIII-phase (no 29) and the t-phase (no 137) are more prone to phase transitions.
The XRD-spectra belonging to the detected clusters are displayed in Figure 7, visualizing the homogeneity of the crystal clusters and clustering robustness. Dopants responsible for the transition from no 137 to the new no 215 cluster are Germanium, Gallium, Iron, Chromium, Boron, Arsenic, Aluminum, Titanium, Vanadium and Phosphorus with a concentration of 6.25%. With only 14 members, the no 215 cluster contains less than 1% of the data set emphasizing the capabilities of this clustering approach. The outlier cluster is highly heterogeneous, but a further detection of smaller clusters was not possible. This cluster consists of heavily disrupted structures as well as a number of energetic unfavourable phases created from phase transitions, but these are either too few to be reliably clustered and/or too irregular to be separated from noisy data. These resulting structures found here include no 31, no a62, no 7, and no a61 for HfO2. The corresponding XRD spectra of these phases are shown in the Supplementary Section S3. The dopants leading to the formation of these structures are As for no 7, Li, Os, B for no 62 and no 31, respectively.
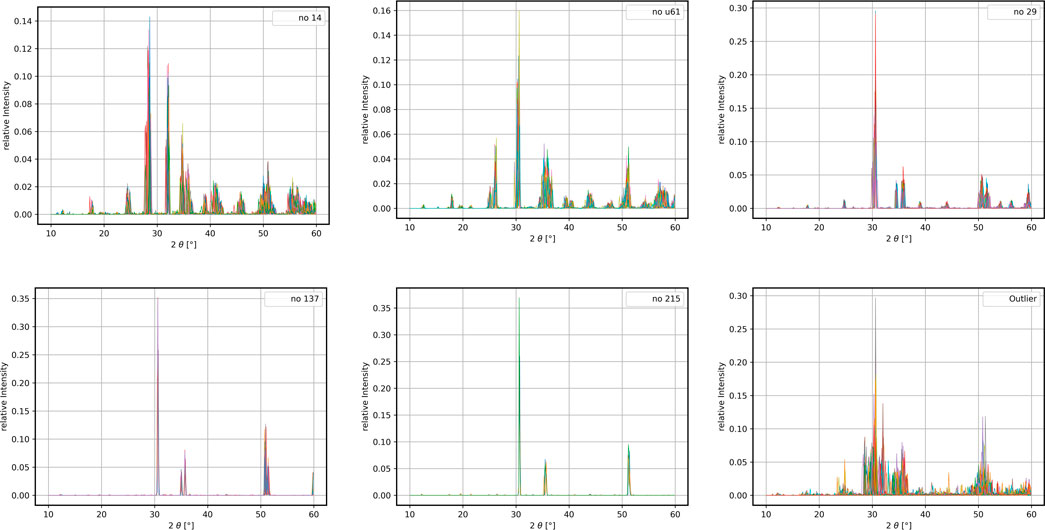
FIGURE 7. Displayed are the XRD-spectra of the initial ZrO2-structures, the emerged cluster no 215 and the highly heterogeneous outlier cluster. A closer investigation of the no 215 cluster reveals that 6.25% doping with Gallium, Germanium, Aluminum and Chromium leads to the transition from the no 137 to the no 215.
4 Conclusion
The aim of this work was the calculation of Raman, IR and XRD spectra for undoped and doped HfO2 and ZrO2 and the question of the possibility of detecting the many metastable crystal phases in this way. After introducing 10 low energy crystal phases with properties calculated with LDA and PBEsol density functional, we turned to the phonon modes of the materials. The interaction of the electromagnetic radiation with these modes leads to either Raman or infrared spectroscopy. We concentrated on polycrystalline, thin layers, where only mean values of this interaction becomes measurable. The Raman spectra and dielectric constant/reflectance spectra were calculated and given as a systematic overview. The spectra were examined and found to be distinguishable in many cases. However, some of the crystal phases have a very complex spectrum that seems unlikely to be clearly identified. According to previous experience, both the experimental and the theoretical data are subject to some uncertainties, so that a phase identification seems to be unambiguous only in effectively single phase films, but not in phase mixtures.
A more systematic analysis was performed for XRD spectral data. We have calculated all the XRD spectra for overview. Due to the poor visibility of the oxygen position, some of the spectra have different characteristics, while others are not very different. To investigate the possibility of identifying a phase with XRD from a phase mixture, we created a large dataset of doped HfO2 and ZrO2 structures lacking phase identification. The data were subjected to a clustering algorithm. After proper normalization, standardization, and feature reduction to about 30 features, we found mainly the classes representative of the starting structures, but also a new cluster representative of a further phase, and an outlier class containing essentially all other phases, but without the ability to group them further into new cluster. This is indicative that a phase identification for many of the discussed phases is not possible based on XRD alone.
The general conclusion of the work is that the chance of phase identification can be increased by simultaneous study of Raman, IR and XRD data, since unambiguous phase assignment by one method is possible only in special cases. Furthermore, the experimental and theoretical capabilities are already well developed, but there is still potential to improve the accuracy of the results to reduce the uncertainties in the identification.
Data availability statement
The raw data supporting the conclusions of this article will be made available by the authors, without undue reservation.
Author contributions
AK proposed the models and did the ab initio calculation. MT analyzed the clustering data. RG and MT performed the clustering. AK, RG, and MT discussed the concept of the paper. AK and RG wrote the paper.
Funding
RG received funding from the Deutsche Forschungsgemeinschaft (German Research Foundation) in the frame of the project “Zeppelin” (Project KE 1665/5-1).
Acknowledgments
The authors gratefully acknowledge the Leibniz Supercomputing Centre for funding this project by providing computing time on its Linux-Cluster.
Conflict of interest
The authors declare that the research was conducted in the absence of any commercial or financial relationships that could be construed as a potential conflict of interest.
Publisher’s note
All claims expressed in this article are solely those of the authors and do not necessarily represent those of their affiliated organizations, or those of the publisher, the editors and the reviewers. Any product that may be evaluated in this article, or claim that may be made by its manufacturer, is not guaranteed or endorsed by the publisher.
Supplementary Material
The Supplementary Material for this article can be found online at: https://www.frontiersin.org/articles/10.3389/fnano.2022.1026286/full#supplementary-material
References
Antunes, L. A., Ganser, R., Kuenneth, C., and Kersch, A. (2022). Characteristics of low-energy phases of hafnia and zirconia from density functional theory calculations. Phys. Rapid Res. Ltrs. 16, 2100636. doi:10.1002/pssr.202100636
Arashi, H. (1992). Pressure-induced phase transformation of hfo2. J. Am. Ceram. Soc. 75, 844–847. doi:10.1111/j.1151-2916.1992.tb04149.x
Aroyo, M. I., Perez-Mato, J. M., Capillas, C., Kroumova, E., Ivantchev, S., Madariaga, G., et al. (2006). Bilbao crystallographic server i: Databases and crystallographic computing programs. Z. fur Kristallogr. - Cryst. Mater. 221, 15–27. doi:10.1524/zkri.2006.221.1.15
Azevedo Antunes, L., Ganser, R., Alcala, R., Mikolajick, T., Schroeder, U., and Kersch, A. (2021). An unexplored antipolar phase in hfo2 from first principles and implication for wake-up mechanism. Appl. Phys. Lett. 119, 082903. doi:10.1063/5.0063808
Barabash, S. V. (2017). Prediction of new metastable $$\hbox {HfO}_{2}$$ HfO 2 phases: Toward understanding ferro- and antiferroelectric films. J. Comput. Electron. 16, 1227–1235. doi:10.1007/s10825-017-1077-5
Caracas, R., and Cohen, R. E. (2006). Theoretical determination of the Raman spectra of mgsio3 perovskite and post-perovskite at high pressure. Geophys. Res. Lett. 33, L12S05. doi:10.1029/2006GL025736
Cheng, Y., Gao, Z., Ye, K. H., Park, H. W., Zheng, Y., Zheng, Y., et al. (2022). Reversible transition between the polar and antipolar phases and its implications for wake-up and fatigue in hfo2-based ferroelectric thin film. Nat. Commun. 13, 645. doi:10.1038/s41467-022-28236-5
Cui, A., Jiang, K., Jiang, M., Shang, L., Zhu, L., Hu, Z., et al. (2019). Decoding phases of matter by machine-learning Raman spectroscopy. Phys. Rev. Appl. 12, 054049. doi:10.1103/PhysRevApplied.12.054049
Du, H., Groh, C., Jia, C.-L., Ohlerth, T., Dunin-Borkowski, R. E., Simon, U., et al. (2021). Multiple polarization orders in individual twinned colloidal nanocrystals of centrosymmetric hfo2. Matter 4, 986–1000. doi:10.1016/j.matt.2020.12.008
Falkowski, M., and Kersch, A. (2020). Optimizing the piezoelectric strain in zro2- and hfo2-based incipient ferroelectrics for thin-film applications: An ab initio dopant screening study. ACS Appl. Mat. Interfaces 12, 32915–32924. doi:10.1021/acsami.0c08310
Fan, S., Singh, S., Xu, X., Park, K., Qi, Y., Cheong, S. W., et al. (2022). Vibrational fingerprints of ferroelectric hfo2. npj Quantum Mat. 7, 32. doi:10.1038/s41535-022-00436-8
Garrity, K. F., Bennett, J. W., Rabe, K. M., and Vanderbilt, D. (2014). Pseudopotentials for high-throughput DFT calculations. Comput. Mater. Sci. 81, 446–452. doi:10.1016/j.commatsci.2013.08.053
Gonze, X., Amadon, B., Antonius, G., Arnardi, F., Baguet, L., Beuken, J. M., et al. (2020). The abinitproject: Impact, environment and recent developments. Comput. Phys. Commun. 248, 107042. doi:10.1016/j.cpc.2019.107042
Govindarajan, S., Böscke, T. S., Sivasubramani, P., Kirsch, P. D., Lee, B. H., Tseng, H.-H., et al. (2007). Higher permittivity rare Earth doped hfo2 for sub-45-nm metal-insulator-semiconductor devices. Appl. Phys. Lett. 91, 062906. doi:10.1063/1.2768002
Gross, R., and Marx, A. (2014). Festkörperphysik. Berlin, Germany: De Gruyter Oldenbourg. doi:10.1524/9783110358704
He, L., Liu, F., Hautier, G., Oliveira, M. J. T., Marques, M. A. L., Vila, F. D., et al. (2014). Accuracy of generalized gradient approximation functionals for density-functional perturbation theory calculations. Phys. Rev. B 89, 064305. doi:10.1103/PhysRevB.89.064305
Hirata, T., Asari, E., and Kitajima, M. (1994). Infrared and Raman spectroscopic studies of zro2 polymorphs doped with y2o3 or ceo2. J. Solid State Chem. 110, 201–207. doi:10.1006/jssc.1994.1160
Huang, L.-y., and Lambrecht, W. R. L. (2016). Vibrational spectra and nonlinear optical coefficients of rhombohedral CsGeX3 halide compounds with x = I, br, cl. Phys. Rev. B 94, 115202. doi:10.1103/PhysRevB.94.115202
Kriegner, D., Wintersberger, E., and Stangl, J. (2013). xrayutilities: a versatile tool for reciprocal space conversion of scattering data recorded with linear and area detectors. J. Appl. Cryst. 46, 1162–1170. doi:10.1107/S0021889813017214
Lomenzo, P. D., Jachalke, S., Stoecker, H., Mehner, E., Richter, C., Mikolajick, T., et al. (2020). Universal curie constant and pyroelectricity in doped ferroelectric hfo2 thin films. Nano Energy 74, 104733. doi:10.1016/j.nanoen.2020.104733
Long, C. J., Bunker, D., Li, X., Karen, V. L., and Takeuchi, I. (2009). Rapid identification of structural phases in combinatorial thin-film libraries using x-ray diffraction and non-negative matrix factorization. Rev. Sci. Instrum. 80, 103902. doi:10.1063/1.3216809
Mart, C., Kämpfe, T., Kühnel, K., Czernohorsky, M., Kolodinski, S., Wiatr, M., et al. (2021). Enhanced pyroelectric response at morphotropic and field-induced phase transitions in ferroelectric hafnium oxide thin films. Apl. Mater. 9, 051120. doi:10.1063/5.0051329
Materano, M., Reinig, P., Kersch, A., Popov, M., Deluca, M., Mikolajick, T., et al. (2022). Raman spectroscopy as a key method to distinguish the ferroelectric orthorhombic phase in thin zro2-based films. Phys. Rapid Res. Ltrs. 16, 2100589. doi:10.1002/pssr.202100589
Materlik, R., Künneth, C., and Kersch, A. (2015). The origin of ferroelectricity in Hf1−xZrxO2: A computational investigation and a surface energy model. J. Appl. Phys. 117, 134109. doi:10.1063/1.4916707
Mikolajick, T., Slesazeck, S., Park, M. H., and Schroeder, U. (2018). Ferroelectric hafnium oxide for ferroelectric random-access memories and ferroelectric field-effect transistors. MRS Bull. 43, 340–346. doi:10.1557/mrs.2018.92
Pedregosa, F., Varoquaux, G., Gramfort, A., Michel, V., Thirion, B., Grisel, O., et al. (2011). Scikit-learn: Machine learning in Python. J. Mach. Learn. Res. 12, 2825–2830. doi:10.48550/arXiv.1201.0490
Popov, M. N., Spitaler, J., Veerapandiyan, V. K., Bousquet, E., Hlinka, J., and Deluca, M. (2020). Raman spectra of fine-grained materials from first principles. npj Comput. Mat. 6, 121. doi:10.1038/s41524-020-00395-3
Quintard, P. E., Barbéris, P., Mirgorodsky, A. P., and Merle-Méjean, T. (2002). Comparative lattice-dynamical study of the Raman spectra of monoclinic and tetragonal phases of zirconia and hafnia. J. Am. Ceram. Soc. 85, 1745–1749. doi:10.1111/j.1151-2916.2002.tb00346.x
Ratnaparkhe, A., and Lambrecht, W. R. L. (2020). Calculated phonon modes, infrared, and Raman spectra in zngega2n4. J. Appl. Phys. 128, 075702. doi:10.1063/5.0017496
Romero, A. H., Allan, D. C., Amadon, B., Antonius, G., Applencourt, T., Baguet, L., et al. (2020). Abinit: Overview and focus on selected capabilities. J. Chem. Phys. 152, 124102. doi:10.1063/1.5144261
Schroeder, U., Hwang, C. S., and Funakubo, H. (Editors) (2019). Woodhead publishing series in electronic and optical materials (Sawston, United Kingdom: Woodhead Publishing).
Schroeder, U., Park, M. H., Mikolajick, T., and Hwang, C. S. (2022). The fundamentals and applications of ferroelectric hfo2. Nat. Rev. Mat. 7, 653–669. doi:10.1038/s41578-022-00431-2
Stanev, V., Vesselinov, V. V., Kusne, A. G., Antoszewski, G., Takeuchi, I., and Alexandrov, B. S. (2018). Unsupervised phase mapping of X-ray diffraction data by nonnegative matrix factorization integrated with custom clustering. npj Comput. Mat. 4, 43–10. doi:10.1038/s41524-018-0099-2
Veithen, M., Gonze, X., and Ghosez, P. (2005). Nonlinear optical susceptibilities, Raman efficiencies, and electro-optic tensors from first-principles density functional perturbation theory. Phys. Rev. B 71, 125107. doi:10.1103/PhysRevB.71.125107
Wei, Y., Nukala, P., Salverda, M., Matzen, S., Zhao, H. J., Momand, J., et al. (2018). A rhombohedral ferroelectric phase in epitaxially strained hf0.5zr0.5o2 thin films. Nat. Mat. 17, 1095–1100. doi:10.1038/s41563-018-0196-0
Yamashita, A., Nagata, T., Yagyu, S., Asahi, T., and Chikyow, T. (2021). Accelerating two-dimensional X-ray diffraction measurement and analysis with density-based clustering for thin films. Jpn. J. Appl. Phys. 60, SCCG04. doi:10.35848/1347-4065/ABF2D8
Keywords: HfO2, ZrO2, crystal phase, Raman, infrared, x-ray diffraction, machine learning, clustering
Citation: Kersch A, Ganser R and Trien M (2022) Simulation of XRD, Raman and IR spectrum for phase identification in doped HfO2 and ZrO2. Front. Nanotechnol. 4:1026286. doi: 10.3389/fnano.2022.1026286
Received: 23 August 2022; Accepted: 17 October 2022;
Published: 01 November 2022.
Edited by:
Rajamani Nagarajan, University of Delhi, IndiaReviewed by:
Marcelo Kuroda, Auburn University, United StatesAyana Ghosh, Oak Ridge National Laboratory (DOE), United States
Copyright © 2022 Kersch, Ganser and Trien. This is an open-access article distributed under the terms of the Creative Commons Attribution License (CC BY). The use, distribution or reproduction in other forums is permitted, provided the original author(s) and the copyright owner(s) are credited and that the original publication in this journal is cited, in accordance with accepted academic practice. No use, distribution or reproduction is permitted which does not comply with these terms.
*Correspondence: Alfred Kersch, YWxmcmVkLmtlcnNjaEBobS5lZHU=