 Anna Vorreuther
 Nektaria Tagalidou
 Mathias Vukelić
- 1Applied Neurocognitive Systems, Institute of Human Factors and Technology Management, University of Stuttgart, Stuttgart, Germany
- 2Applied Neurocognitive Systems, Fraunhofer Institute for Industrial Engineering, Stuttgart, Germany
Introduction: The EmotiBit photoplethysmography (PPG) device allows user-owned data collection for measures of cardiovascular activity (CVA) and electrodermal activity (EDA) in naturalistic settings. The aim of this study was to evaluate the validity of this device for collecting high-quality data while participants experience varying levels of cognitive workload.
Methods: Using a standardized criterion validity protocol, recordings of 15 participants performing a cognitive workload task were compared for the EmotiBit and a reference electrocardiography (ECG) device (BITalino PsychoBit). Multiple preprocessing pipelines and a signal quality check were implemented. Parameters of interest including heart rate (HR), heart rate variability (HRV) measures, skin conductance level (SCL), and skin conductance response (SCR) measures were assessed using Bland-Altman plot and ratio (BAr) analyses, as well as cross-correlations of the EDA signal time series of both devices.
Results: BAr results indicated good agreement between devices regarding HR with an average difference of 1–2 beats per minute (bpm). HRV measures yielded an insufficient BAr, albeit most data points lay within a priori boundaries of agreement. EDA measures yielded insufficient agreement for comparing SCL and SCR number and amplitude.
Discussion: The results are comparable to the validation of similar wearable PPG devices and extend the validation of the EmotiBit by assessing the acquired signals during varying levels of cognitive workload. While the device may be used to collect HR for scientific data analysis, its quality regarding HRV and EDA measures is not comparable to a standard ECG.
Significance: This study provides the first systematic validation following a standardized protocol of the EmotiBit PPG device relative to an ECG when considering recordings collected during cognitive workload induction.
1 Introduction
The introduction of consumer-grade wearable sensors has extended physiological monitoring beyond clinical applications to everyday, occupational, and consumer settings. These devices offer the potential to assess cardiovascular activity (CVA), cognitive workload, and stress in real-time, providing valuable insights for domains such as human performance, neuroergonomics, and adaptive work environments (Brandt-Rauf and Ayaz, 2024; Hogervorst et al., 2014). The most prominent way for mobile devices to assess physiological signals is photoplethysmography (PPG). This method non-invasively captures the blood volume changes in the microvascular tissue of the skin by detecting changes in light transmission from a light-emitting diode (LED) to a photodiode (Peláez and Villegas, 2007). PPG is well-suited for wearable devices as it is cost-effective in production and can be worn flexibly without gel or any other supporting material, unlike the electrodes utilized during electrocardiography (ECG). Although ECG is superior in detecting CVA and related phenomena and remains the standard in medical settings, PPG is considered sufficient for most consumer uses like measuring heart rate (HR), heart rate variability (HRV), or oxygen saturation (Huhn et al., 2022).
Wearable sensors are increasingly applied in neuroergonomics to unobtrusively monitor physiological correlates of mental effort, fatigue, and stress in naturalistic work environments. While some PPG wearables have medical certifications (e.g., Empatica series) and may thus be considered for clinical use cases, the data is not solely user-owned, and algorithms are usually not published. The importance of open-source PPG software and hardware is apparent for applications in science and a focus on data privacy. Open-source wearables like the EmotiBit attempt to bridge the gap between cost-effective consumer-grade affordability and high-quality research-grade data acquisition (e.g., Empatica series, BIOPAC series, BITalino series). Such devices enable customizable data pipelines, algorithmic transparency, and cost-effective large-scale data collection—critical aspects when monitoring cognitive states in real-world work environments (Langevin et al., 2021; van Lier et al., 2020).
The EmotiBit has already gained some popularity. Numerous studies utilized the EmotiBit in applied scenarios (Gao and Zhou, 2022; Lobosco, 2023; Morris et al., 2023; Olivaz and Kulgod, 2023; Pelc et al., 2023; Reyes-Consuelo et al., 2023; Rizzi et al., 2023). Guarducci et al. (2025) included the EmotiBit in a comprehensive technical review of wearables detailing software and hardware features. The developer team released a validation of the device utilizing simultaneous data collection with an ECG device (the Brain Products V-Amp) from participants watching videos in sitting and standing positions (Montgomery et al., 2024). A recently published study by Haratian (2024) focusing on utilizing body-sensing technologies to assess user experience and safety during human-robot interaction employed both Empatica and EmotiBit devices and compared the recorded HR and galvanic skin response (GSR) data. On a descriptive level focusing on mean values over time, they found that HR detection seemed similar in devices, whereas GSR recordings seemed to differ substantially with the EmotiBit not correctly capturing the changes. Prior validation work furthermore includes a study by Langevin et al. (2021). The authors validated the EmotiBit PPG data of CVA and electrodermal activity (EDA) with a reference ECG device during resting state recordings. They utilized a standardized validation protocol for physiological signals from wearable technology (van Lier et al., 2020). It focuses on signal comparison, employing cross-correlations and inspecting parameters of interest commonly derived from the physiological signals. While the EmotiBit has shown promise in resting-state evaluations of HR, this prior validation work revealed limitations in HRV and EDA measurement accuracy (Langevin et al., 2021). No studies to date have systematically validated the EmotiBit during cognitive workload induction against a reference device. Given the increasing use of wearable sensors in applied neuroergonomics and workload monitoring, assessing the EmotiBit under task-induced cognitive workload is essential to establish its reliability in applied contexts such as neuroergonomics.
This study aims to assess the validity of the EmotiBit wearable sensor for measuring cardiovascular activity (HR and HRV) and electrodermal activity (EDA) under task-induced cognitive workload, following the standardized protocol proposed by van Lier et al. (2020) and extending the validation studies of the Emotibit device (Langevin et al., 2021; Montgomery et al., 2024). We specifically evaluated the EmotiBit's PPG sensor performance compared to an ECG and EDA system (BITalino PsychoBit; Batista et al., 2017) across two workload levels, while positioning the sensor on the upper arm—a location more practical for field applications but potentially challenging for signal quality (Kasos et al., 2020).
2 Methods
2.1 Mobile multi-sensor wearable device
The EmotiBit (https://www.emotibit.com) is an open-source, mobile wearable capable of measuring physiological and movement data with 16 signals including PPG measurements, EDA, temperature, accelerometer, and gyroscope. We used the device built with the Arduino FeatherWing module (featherwing version “Adafruit Feather HUZZAH32,” hardware version “V05c”). The device can be attached at multiple different body locations through differently sized Velcro straps. All data are recorded on a built-in 32Gb-sized SD card and are thus 100% user-owned. Wireless data streaming options are also possible via a local network for live analysis and evaluation of signals' quality. The EmotiBit stores three distinct wavelengths as separate PPG signal streams. The wavelengths are those of green, red, and infrared light as measured by the MAX30101 sensor (see Figure 1). With an alternative open-source firmware version (“EmotiBit_stock_firmware_PPG_100Hz,” version 1.9.0; https://github.com/EmotiBit/EmotiBit_FeatherWing/releases), the sampling frequency of the PPG can be enhanced to 100 Hz as opposed to the default firmware with 25 Hz. The present study focuses exclusively on the PPG and EDA data, which were recorded at a sampling frequency of 100 Hz and 15 Hz, respectively. The recordings were performed with the corresponding oscilloscope and data parser software. Timestamps of experimental events and recorded data of the EmotiBit as well as the reference ECG device were synchronized using Lab Streaming Layer (LSL; Kothe et al., 2024; Kothe, 2025).
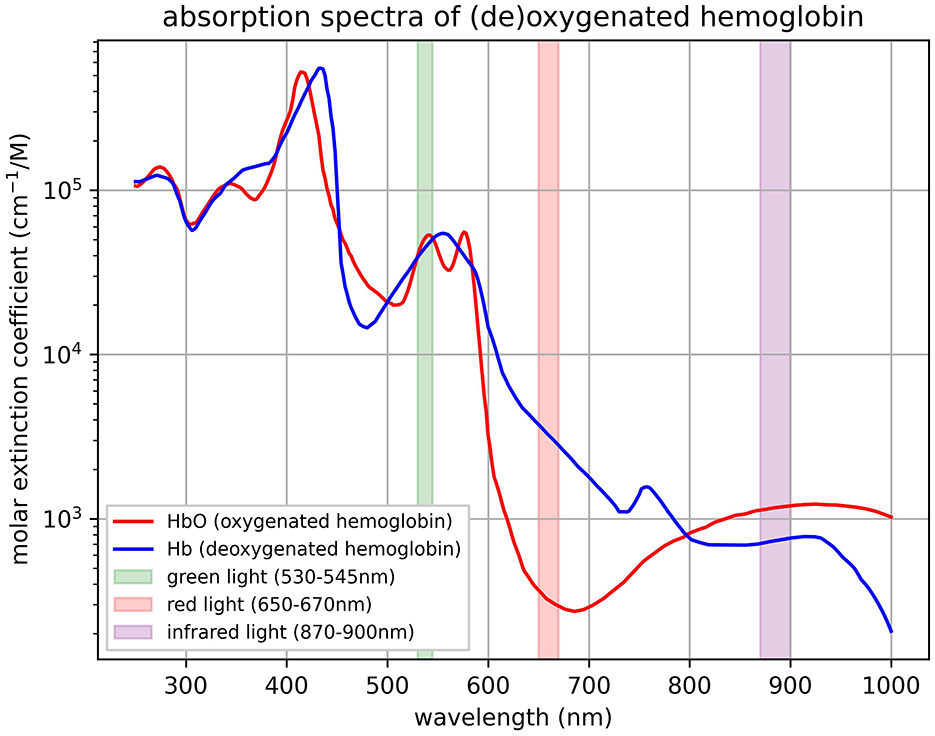
Figure 1. Light wavelengths of EmotiBit PPG sensor. The absorption spectra of oxygenated hemoglobin (HbO) and deoxygenated hemoglobin (Hb) represented by the molar extinction coefficient (cm−1/M) on a logarithmic scale is plotted against wavelength (nm) with highlighted bands corresponding to specific light wavelengths used in the MAX30101 sensor (values derived from SparkFun Photodetector (MAX30101) Hookup Guide - SparkFun Learn, 2025). The highlighted bands include the wavelengths measured of the green light spectrum (530–545 nm), the red light spectrum (650–670 nm), and the infrared light spectrum (870–900 nm) built into the sensor. Reproduced from Prahl (1999).
2.2 Reference device
The BITalino PsychoBit (BITalino [6.2] v5.2; https://www.pluxbiosignals.com/collections/bitalino/products/psychobit) is a data acquisition tool that is utilized in the measurement of various physiological parameters, including ECG, EDA, respiration, pulse rate, and light. In the present study, the BITalino PsychoBit was employed for the measurement of ECG and EDA. The ECG and EDA data were recorded at a sampling rate of 1,000 Hz using the corresponding recording software OpenSignals (version: 1.1; https://www.pluxbiosignals.com/pages/opensignals).
2.3 Participants
A total of 18 participants were recorded for this study (nine female, nine male; 48.67 ± 13.95 years old). They were recruited via the participants database of the research team. Three participants were excluded prior to analyses: for one participant, we experienced technical difficulties with the stimulus presentation; for two participants, the EmotiBit recording with LSL failed due to network issues. Thus, the data of 15 participants (46.87 ± 14.40 years; seven females, eight males) was used for analyses.
2.4 Experimental procedure
Following the recruitment, participants signed informed consent and were informed about the study's procedure. The study was approved by the ethics commission of the University of Tübingen (Germany) and conducted according to the Declaration of Helsinki (502/2023BO2; the preregistered study design can be found at https://doi.org/10.17605/OSF.IO/AUVDR). Firstly, the study commenced with a pre-test in the form of an adapted Wiener Matrices Test (WMT; Formann, 1979). After completing the WMT, the participants were equipped with the sensors. For this study, only the CVA and EDA activity will be reported. However, additional research questions involved electroencephalography (EEG) data of a 64-channel gel-based system and a commercial PPG-Sensor (Fitbit Sense 2). After all the sensors were set up, the main experiment and physiological data acquisition commenced. Participants completed an operation span task in two difficulty levels counterbalanced across participants. The task consisted of a calculation component interjected with a delayed recall component (Daneman and Carpenter, 1980; Scharinger et al., 2017; Turner and Engle, 1989). The recall component involved the memorization of sequences of individual digits of varying lengths, whilst the calculation component necessitated the performance of calculations (addition, subtraction, multiplication) within each round. The dual nature of this task is known to impose significant demands on cognitive processing and, by extension, on cognitive workload (Scharinger et al., 2017). For inducing two distinct difficulty levels—easy and hard runs— the complexity of the calculations was varied (one-digit vs. two-digit numbers) and the length of sequenced numbers presented per recall phase (two vs. four numbers in a row). In addition, an auditory oddball task was presented throughout both conditions (Squires et al., 1975). The participants were not instructed to respond to the auditory task but rather to listen to the sounds passively as an additional measure of attentional resources. Finally, the participants completed the second half of the WMT as a post-session measurement (see Figure 2).
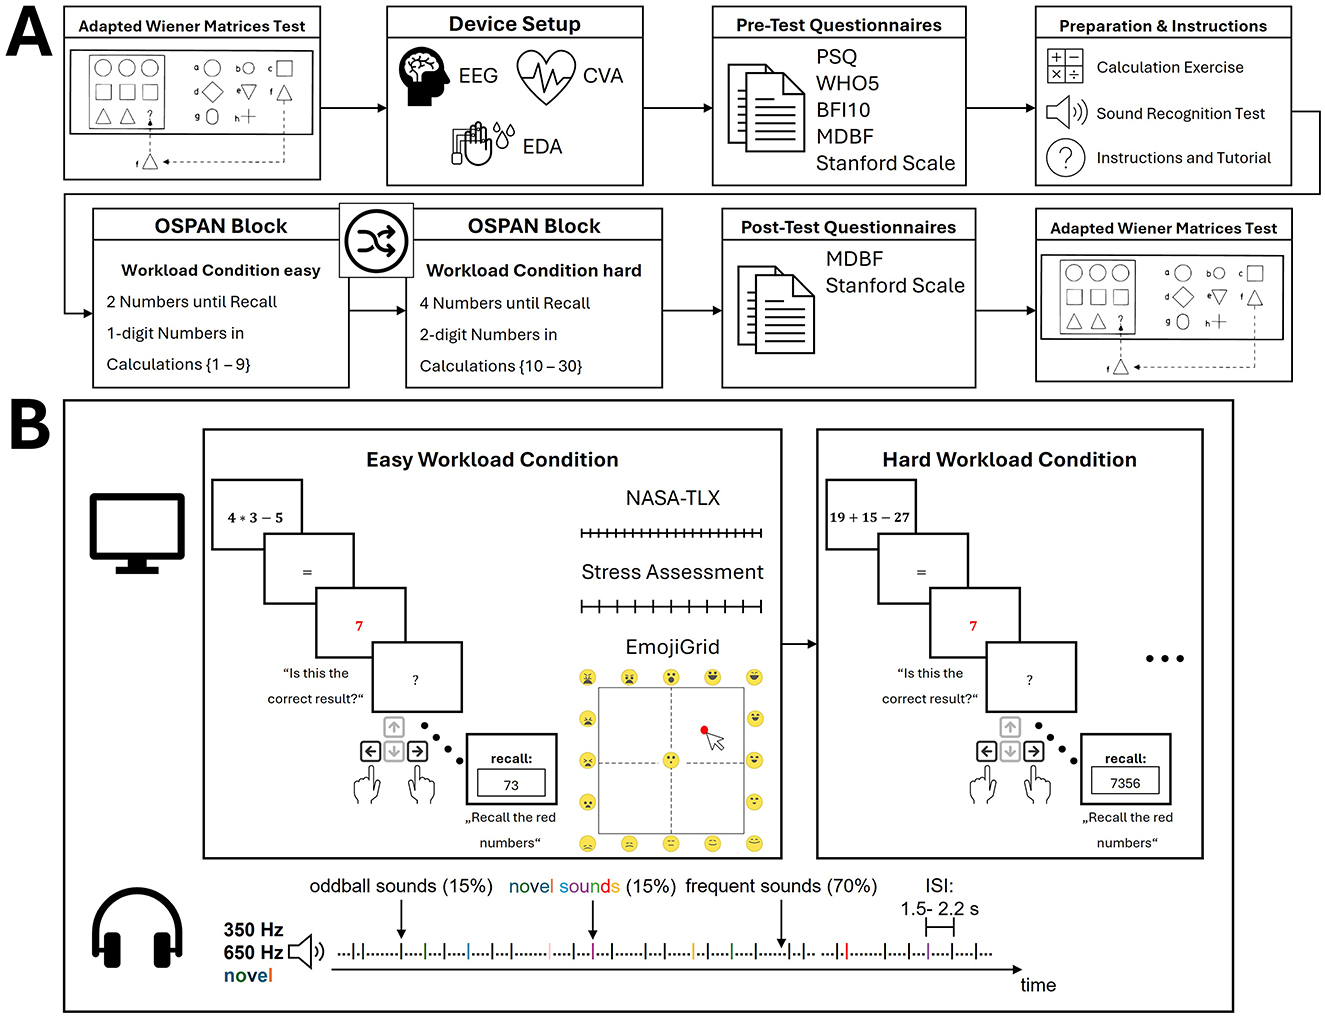
Figure 2. Experimental pocedure. (A) The timeline of the experimental procedure is illustrated with time estimates for each phase. The experimental block consisted of an operation span task with an easy and hard workload condition counterbalanced in order across participants. Note that the adapted Wiener Matrices Test had a fixed duration while the other time periods were dependent on the individual speed of completion. (B) The experimental blocks are illustrated for both workload conditions. During the visual OSPAN task, participants performed mental calculations and delayed recalls and responded with button presses (left or right) counterbalanced across participants. This was interjected with three types of questionnaires to assess current mental load, stress, and emotional state. An auditory implicit oddball task was presented and implicitly attended to with counterbalanced frequencies for oddball and frequent sounds and jittered inter-stimulus intervals. BFI10, Big Five Inventory-10 (Rammstedt et al., 2017); ISI, inter-stimulus interval; MDBF, German Multidimensional Mood State Questionnaire (Hinz et al., 2012); NASA-TLX, NASA Task Load Index (Hart and Staveland, 1988); OSPAN, operation span task; PSQ, Perceived Stress Questionnaire (Fliege et al., 2001); Stanford Scale, Stanford Sleepiness Scale (Hoddes et al., 1972); WHO5, WHO-5 WellBeing Index (Brähler et al., 2007).
2.5 Sensor positioning
The EmotiBit was positioned on the inner aspect of the left arm at the level of the biceps. The veins beneath the skin were identified and the EmotiBit was positioned above them for optimal signal detection (see Figure 3). This body location allows for comfortable placement without impeding natural movements. The PsychoBit ECG configuration comprised three electrodes: two positioned beneath the left and right clavicular bones and a reference electrode on the left elbow bone. The EDA sensors were adhered to the left palm (see Figure 3).
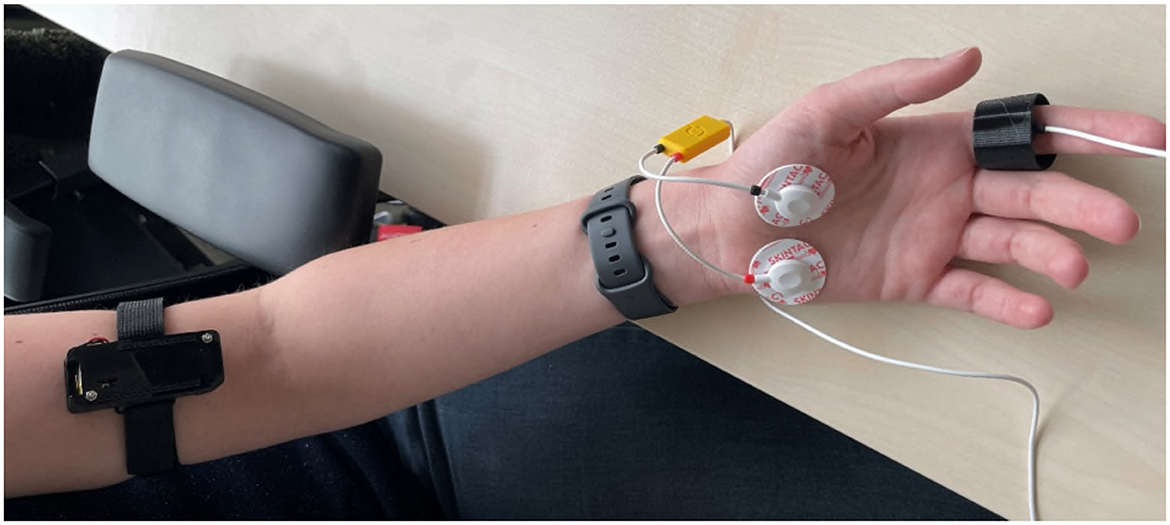
Figure 3. Picture of the sensor positioning at the arm. The EmotiBit device was placed on the upper arm and the PsychoBit EDA sensors were adhered to the left palm. Additionally, the PsychoBit pulse sensor was attached to the index finger and a consumer wearable (Fitbit Sense 2) was positioned above the wrist, albeit not reported in the present study.
2.6 Data analysis
We compared both the EDA and CVA as measured by the EmotiBit and PsychoBit. For analysis, the python library neurokit (version 0.2.10; Makowski et al., 2021) was primarily used and multiple configurations of preprocessing steps were tested. The conditions of the experimental task were assessed separately.
2.6.1 Preprocessing pipelines
To assess the comparability of the measures between devices, we implemented several preprocessing pipelines derived from previous studies for both EDA and CVA signals (for details, see Figure 4; Table 1).
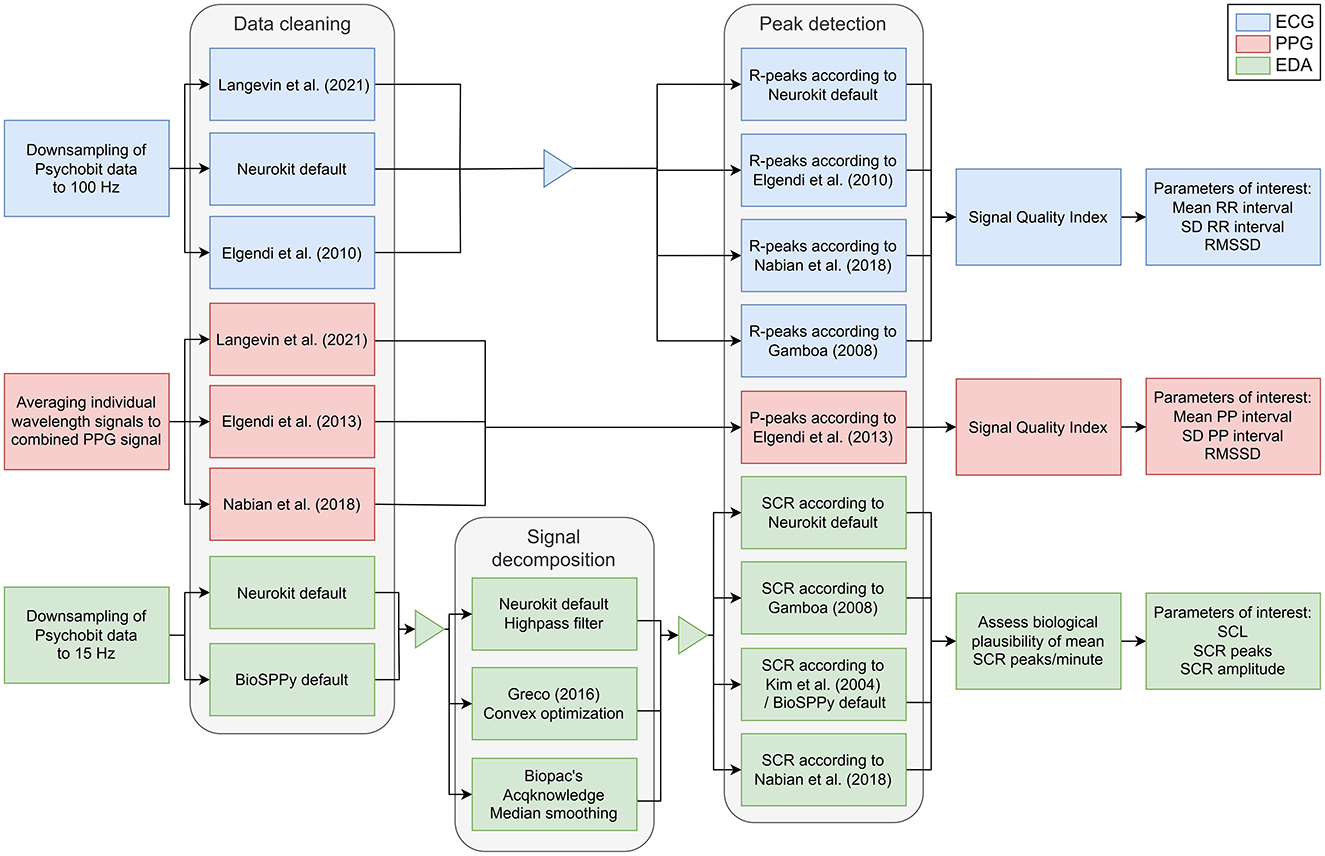
Figure 4. Processing pipelines for CVA and EDA signals. The processing pipelines are depicted for ECG (blue), PPG (red), and EDA (green) data. For data cleaning, signal decomposition of the EDA, and peak detection, various methods were tested. ECG, electrocardiography; EDA, electrodermal activity; PPG, photoplethysmography; RMSSD, root mean square difference of the successive differences; SCL, skin conductance level; SCR, skin conductance response; SD, standard deviation.
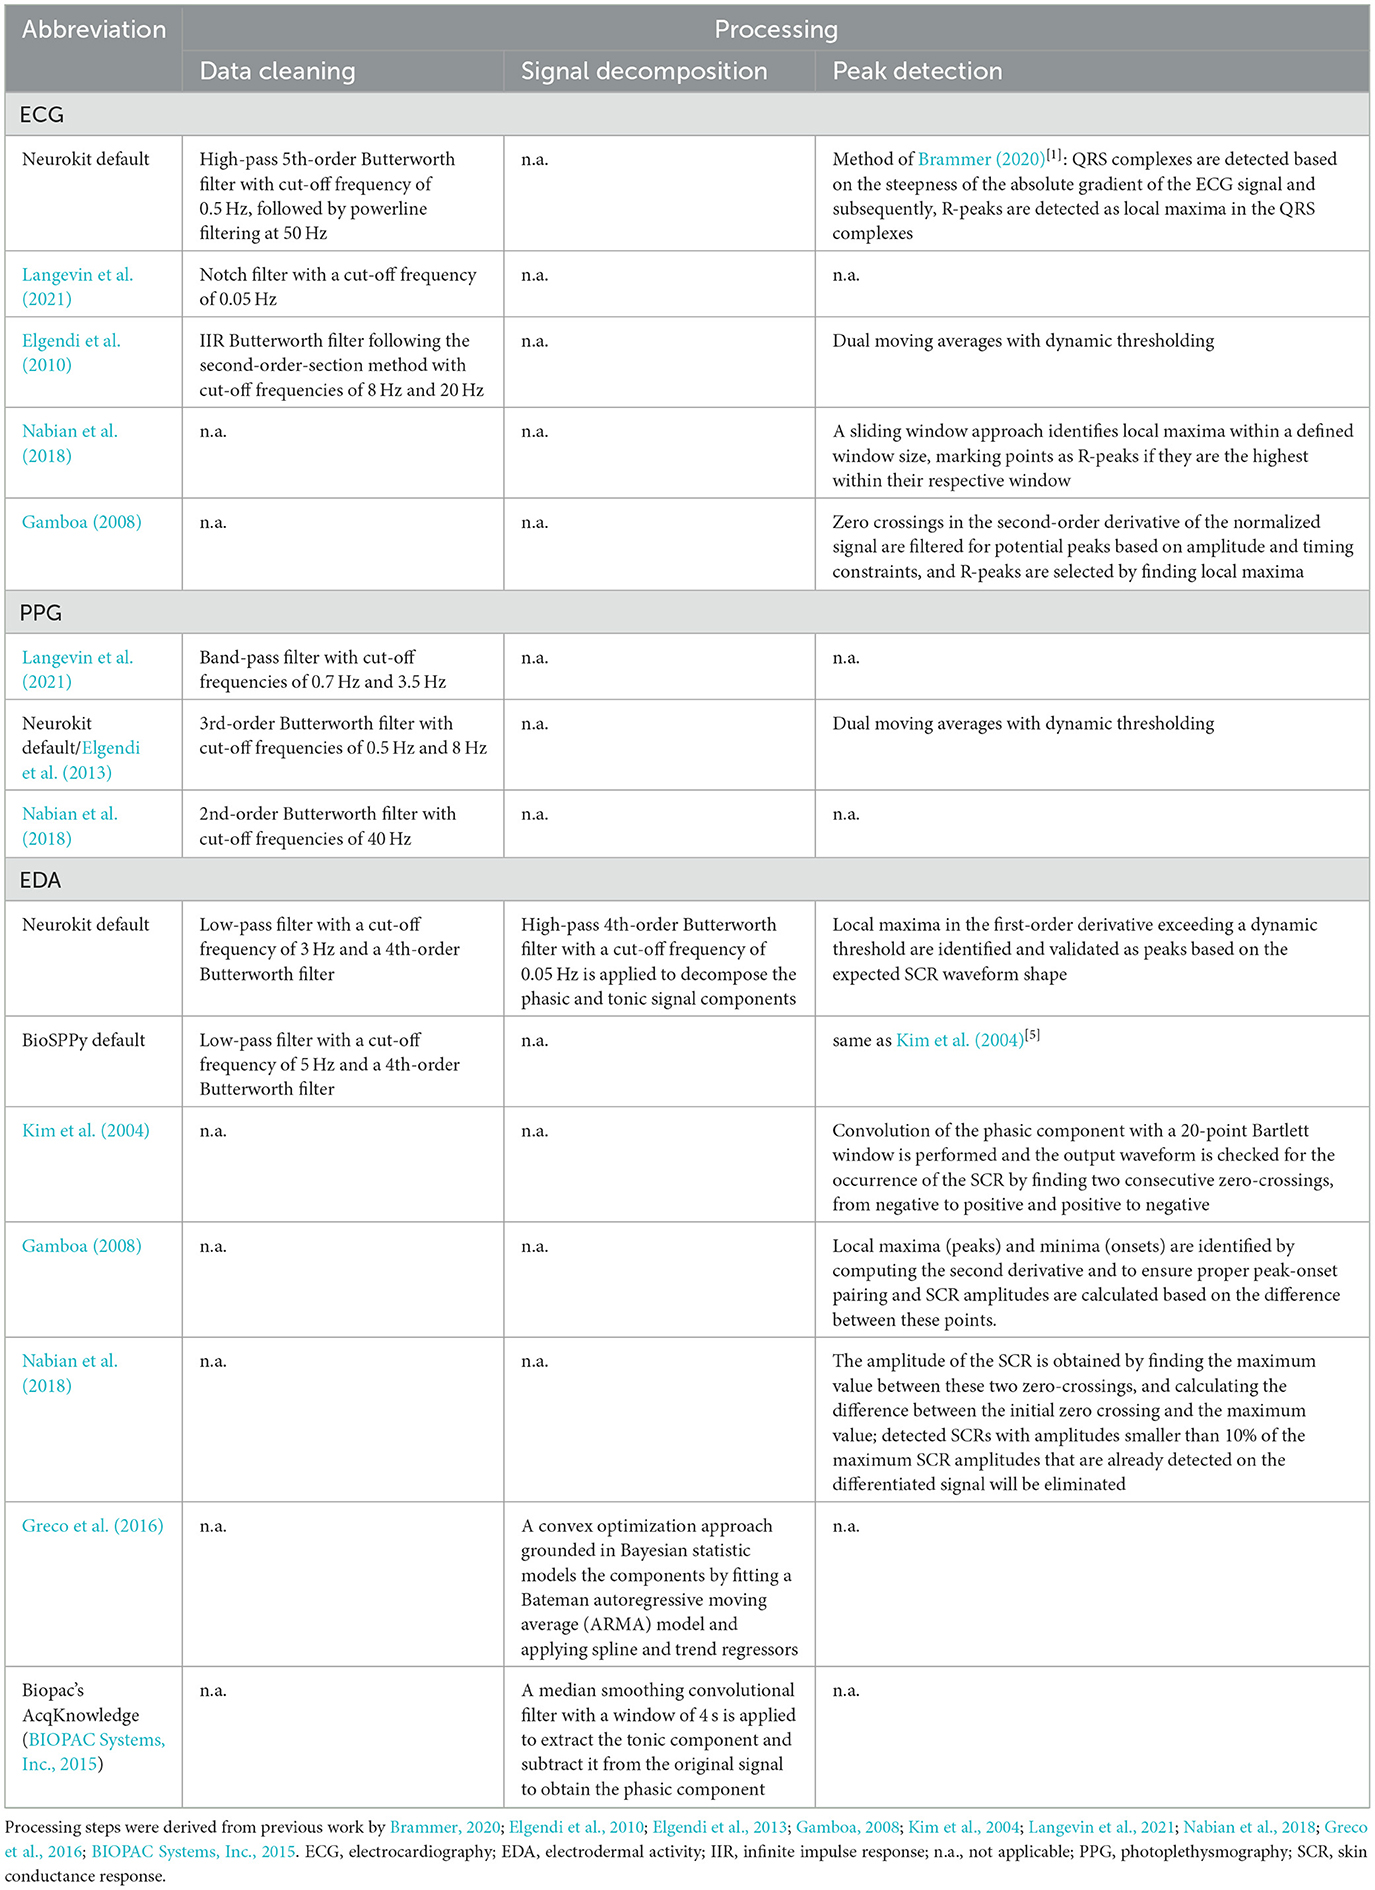
Table 1. Overview of processing configurations.
2.6.1.1 CVA
For the CVA signal, the PsychoBit ECG signal was downsampled to match the 100 Hz sampling frequency of the EmotiBit PPG and allow for accurate comparison. For comparative analysis with the ECG, we averaged the wavelengths to one PPG signal stream (Orphanidou et al., 2015). We followed various processing pipelines for the CVA data of both devices, as detailed in Figure 4 and Table 1. To ascertain the parameters of interest, the distances between two successive R-peaks from the QRS complexes (RR-interval) in the ECG signal were determined. Concurrently, the corresponding time intervals between the top of two peaks in the blood volume pulse signal (PP-interval) from the PPG signals were detected. The parameters of interest for subsequent comparative analysis were the following: (1) The mean RR/PP intervals which were converted to HR in beats per minute (bpm), (2) the standard deviation (SD) of RR/PP intervals, and (3) the root mean square of the successive differences (RMSSD) of RR/PP intervals, which is related to HR variability (Kim et al., 2018).
After preprocessing the signals were checked for quality by computing a signal quality index (SQI; Langevin et al., 2021; Orphanidou et al., 2015). The signals were epoched into 10 s time segments and sequentially checked for the biological plausibility of the measured signals. Each epoch was checked for the following rules: (1) The extrapolated HR is within the range of 30–180 bpm; (2) the maximum gap between two successive peaks is 3 s to ensure no more than one beat is missed; (3) within a 10 s epoch the HR is not expected to change more than 10% and thus the ratio of the maximum beat-to-beat interval to the minimum beat-to-beat interval within an epoch should be < 2.2.
Finally, the average correlation coefficient between each pulse peak within an epoch was calculated (Orphanidou et al., 2015). For each sample, the median beat-to-beat interval was calculated using all the detected pulse peaks. Individual pulse waves were extracted by taking a window of width equal to the median beat-to-beat interval centered on each peak. A template of the average pulse wave was obtained by taking the mean of all waves of the sample. The correlation coefficient of each individual pulse wave with the template was then calculated. The average correlation coefficient was obtained by averaging all correlation coefficients over the whole sample. If this coefficient was smaller than 0.66 for the ECG signal and 0.86 for the PPG signal (Langevin et al., 2021; Orphanidou et al., 2015) or the epoch did not pass the physiological rules, the epoch was labeled as “bad.” Epochs of sufficient quality were concatenated for computation of the parameters of interest, since the variance of especially HRV measures increases by short signal lengths (Fujita and Suzuki, 2019; Taoum et al., 2022). To allow for a balanced comparison of devices, the signals were trimmed to equal lengths based on the minimum number of good epochs per condition. That is, if the PPG signal retained fewer good epochs compared to the ECG signal, the ECG signal was cut to the length of the PPG signal.
2.6.1.2 EDA
For the EDA signal, we first down sampled the PsychoBit signal to match the 15 Hz sampling frequency of the EmotiBit. For the following steps, different configurations of preprocessing steps were tested. The resampled data was initially low-pass filtered with either a 3 Hz (neurokit default) or 5 Hz (BioSPPy default; Carreiras et al., 2015) cut-off frequency and a 4th-order Butterworth filter to remove noise and smooth the signal. Subsequently, the EDA was decomposed into the phasic and tonic components of the signal by applying three different signal decomposition methods (for details, see Table 1). The following parameters of interest were retrieved: (1) The mean and standard deviation of the skin conductance level (SCL) was calculated by averaging the tonic component of the data over each run; (2) the number of skin conductance responses (SCRs) per minute, and (3) their amplitudes as derived from the phasic signal component. The implemented approaches are detailed in Table 1.
Biologically plausible values for the number of SCRs are on average 1–3 per minute during resting state (Braithwaite et al., 2013) and 20–25 per minute during high-arousal states (Boucsein et al., 2012). Since the initial inspection of results revealed implausibly high SCR detection for some processing pipelines, a quality check was implemented based on the average SCRs per minute detected in the reference device. If the average across participants was higher than 30 responses per minute, an overestimation of SCR was assumed, and the pipeline was excluded from further analysis.
2.6.2 Signal comparison of EDA: cross-correlations
Data of both devices was processed using multiple different processing pipelines (for details, see Section 2.6.1). For an initial assessment of similarity, the cross-correlation between the z-scored, detrended signals of the two devices was determined for time lags from −8 to +8 samples, which corresponds to a time window of −0.53 s and 0.53 s at a sampling rate of 15 Hz (Langevin et al., 2021; van Lier et al., 2020). Note that due to the different sensing technology employed by PPG and ECG for HR measurement, the signal waveforms exhibit substantial disparities. Consequently, the time-series data of these two signals was not compared.
2.6.3 Parameter comparison: Bland-Altman plots
To compare the measurements of the EmotiBit PPG and the PsychoBit ECG as well as the EDA signals, a Bland-Altman ratio (BAr) was computed (Bland and Altman, 1986; Langevin et al., 2021; Orphanidou et al., 2015; Schäfer and Vagedes, 2013; van Lier et al., 2020). The primary focus was to assess the absolute agreement between the devices, for which Bland-Altman analyses and Bland-Altman ratios offer a direct and well-established framework. The ratio quantifies the relative agreement between two devices and is defined as
where the 95% CI of the standard deviation is divided by the average of the pairwise means (Apm). A BAr < 0.01 is considered as an excellent agreement, values between 0.01 and 0.1 are considered as a good agreement, values between 0.1 and 0.2 as a moderate agreement, and values >0.2 are defined as insufficient agreement. To visualize differences between methods in detail, Bland-Altman plots were created as well. The mean values of two measurements were plotted on the abscissa (the x-axis) and the difference between the two values on the ordinate (the y-axis). The 95% confidence intervals (CIs) of the differences were indicated to be interpreted as limits of agreement. To compare the signals of devices per condition, the mean values per participant were first log-transformed with base 10 (Euser et al., 2008). For each parameter, additional value boundaries depicting ±10% of the biological plausible values following previous work to add to the interpretability of observed values (see Supplementary Tables 5, 7) (Boucsein, 2012; Braithwaite et al., 2013; Langevin et al., 2021; O'Neal et al., 2016; van Lier et al., 2020). Note that these fixed thresholds do not account for the actual variability in the data and were thus not used for interpretation of signal comparability. Additionally, violin plots of the z-scored parameters of interest were created to visualize the distributions of data points across conditions and devices.
3 Results
3.1 CVA processing
Several processing pipelines were implemented before assessing the comparability of the devices. The pipelines were tested in various combinations, though not all were originally intended during development. Therefore, only pipelines successfully applied to all runs were included in the signal quality assessment (for an overview, see Supplementary Table 6). The SQI revealed which processing pipeline yielded the highest percentage of good epochs for both the ECG and PPG signals (see Supplementary Table 1). The pipeline applied the data cleaning method implemented by Elgendi et al. (2010) for ECG data and the method employed by Langevin et al. (2021) for PPG data. Peak detection was performed using the ECG method by Nabian et al. (2018) and the peak detection algorithm by Elgendi et al. (2013) for PPG (see Table 1). This yielded 97.76% of epochs rated with sufficient quality for ECG and 89.5% for PPG. The primary reason for ECG epoch rejection was an insufficient correlation between R-peaks (< 0.66) affecting 2.2% of epochs. For PPG, the main reason was a ratio of the maximum to the minimum beat-to-beat interval larger than 2.2 (9.1%).
3.2 EDA processing
Several processing pipelines consisting of data cleaning, signal decomposition, and peak detection for the EDA signals were implemented to comprehensively test the comparability of devices. The pipeline combinations were not all compatible (see Supplementary Table 3). No clear optimal choice for preprocessing emerged from cleaning, decomposition, and peak detection methods.
While the cross-correlations did not yield differentiable results for the various pipelines, the inspection of the SCR peaks revealed a gross overestimation of peaks per minute for several methods in either the reference device or the EmotiBit or both. According to Boucsein (2012), a realistic number of peaks per minute during high arousal states should be up to 25 peaks/minute, whereas some processing pipelines yielded more than 100 peaks/minute. The pipelines were thus not used for further parameter comparison, assuming that the results were inaccurate for both the reference device and EmotiBit. In the same line of reasoning, one pipeline yielded empty or close-to-zero values for the amplitudes of the SCRs and was also excluded for parameter comparison. Several processing pipelines resulted in the automatic exclusion of one or more runs due to the incompatibility of the methods used per step.
For illustration of the parameter comparison, the processing pipeline that resulted in the smallest standard deviation of differences between means of devices was chosen, i.e., the pipeline resulting in the most consistent differences between devices across runs (for an overview, see Supplementary Table 3). The difference in body location between devices during data collection likely caused differences in measurements larger than 10% of the range of plausible values (the definition of the boundaries). Therefore, we assumed that the least variance within differences reflected the most robust processing for signal comparison rather than the mean of the difference. Note that the chosen analysis pipeline is not necessarily the best-suited for other analyses, for instance, for investigating the effect of conditions on the EDA.
3.3 Parameter comparison: CVA
The Bland-Altman plots for CVA parameters of interest are shown in Figure 5. Detailed results for all processing pipelines can be found in Supplementary Tables 6, 7, including data on original scales (i.e., not log-transformed; see Supplementary Figure 1). The mean HR estimate from the EmotiBit PPG signal is close to the estimate of the PsychoBit ECG signal with an average difference of −0.1 ± 0.62 bpm with a 95% CI of [−1.31, 1.11] bpm for the easy workload condition and −0.31 ± 0.73 bpm with a 95% CI of [−1.73, 1.12] bpm for the hard workload condition. The corresponding BAr of the log-transformed data indicated excellent agreement (easy: BAr < 0.01, hard: BAr = 0.01; see Figure 5). The results of all runs are within the biologically plausible boundaries of ± 5 bpm (see Supplementary Table 7). The difference between the devices regarding the RR/PP interval SD were observed to be −26.36 ± 24.65 ms and a 95% CI of [−74.68, 21.95] ms for the easy workload condition, and −23.41 ± 28.46 ms with a 95% CI of [−79.18, 32.37] ms for the hard workload condition. The BAr of log-transformed data indicated a moderate agreement (easy: BAr = 0.17, hard: BAr = 0.19; see Figure 5) and the majority of runs lay within the agreement boundaries (86.36%). The RMSSD of the peak intervals of the EmotiBit PPG was on average −51.88 ± 41.49 ms lower than that of the PsychoBit ECG with a 95% CI of [−133.19, 29.44] ms for the easy, and −51.78 ± 52.54 ms with a 95% CI of [−154.76, 51.19] ms for the hard workload condition. The BAr of log-transformed data indicated insufficient agreement (easy: BAr = 0.29, hard: BAr = 0.36; see Figure 5).
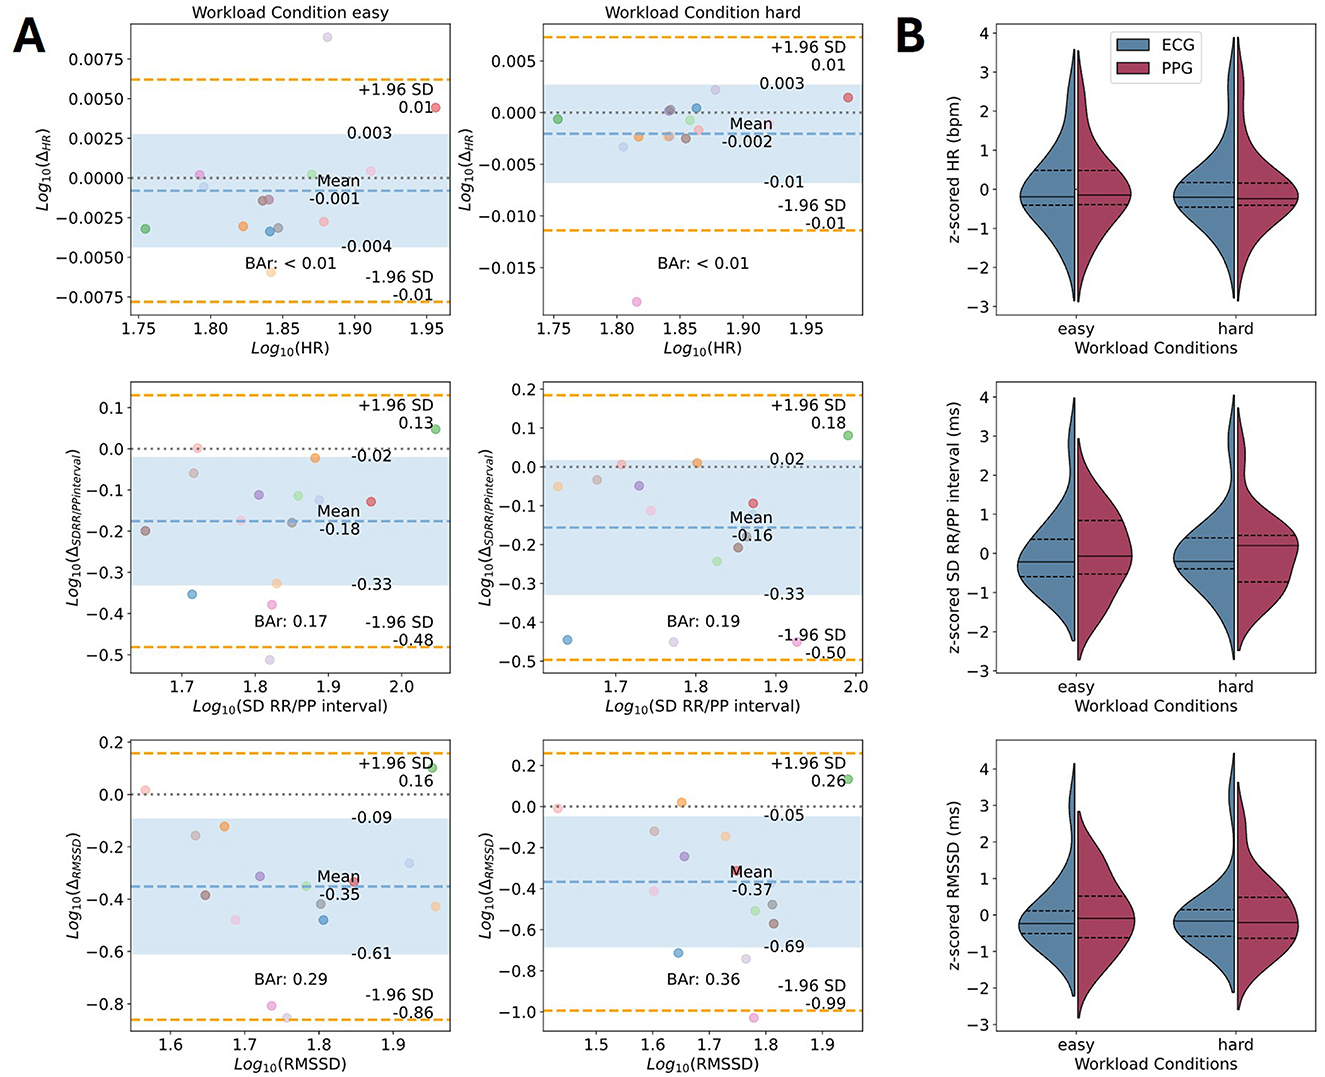
Figure 5. Device comparison of CVA parameters of interest. (A) Bland-Altman plots for the parameters' comparison of the CVA signals in terms of the log-transformed mean HR, the SD of the RR/PP intervals, and the RMSSD. Colored dots represent individual participants during the easy condition (left) and the hard condition (right). Each color corresponds to one participant. The x-axis corresponds to the average of the two measures for one parameter, and the y-axis shows the difference between the two measures. The theoretical difference of zero is marked as a gray dotted line. The observed mean difference is plotted as a dashed blue line with the standard deviations marked as blue areas. The orange lines represent the observed 95% confidence interval limits. The computed BAr is indicated within each plot. (B) Violin plots of z-scored parameters of interest per condition for ECG (blue) and EmotiBit PPG (red). The median (solid lines) and 1st and 3rd quartiles (dashed lines) for each measured parameter of interest are indicated per device. Bar, Bland-Altman ratio; Δ, Mean difference; ECG, Electrocardiography; HR, Heart rate; PPG, Photoplethysmography; RMSSD: Root mean square of successive differences; SCL, Skin conductance level; SCR, Skin conductance response; SD, Standard deviation.
3.4 Signal comparison: EDA
All tested processing pipelines resulted in cross-correlation coefficients ranging from 0.52 to 0.54 for the easy and 0.56 to 0.59 for the hard runs. In the case of the pipelines with the highest correlation coefficients, 5/15 runs obtained a cross-correlation higher than 0.8 for the easy condition of the task. For the hard condition of the task, 3/15 runs obtained a cross-correlation higher than 0.8 (see Figure 6). This is considered a very high correlation (Evans, 1996). Cross-correlation of the raw data of both devices yielded mean coefficients of 0.51 for easy and 0.55 for hard runs, respectively (see Figure 6).
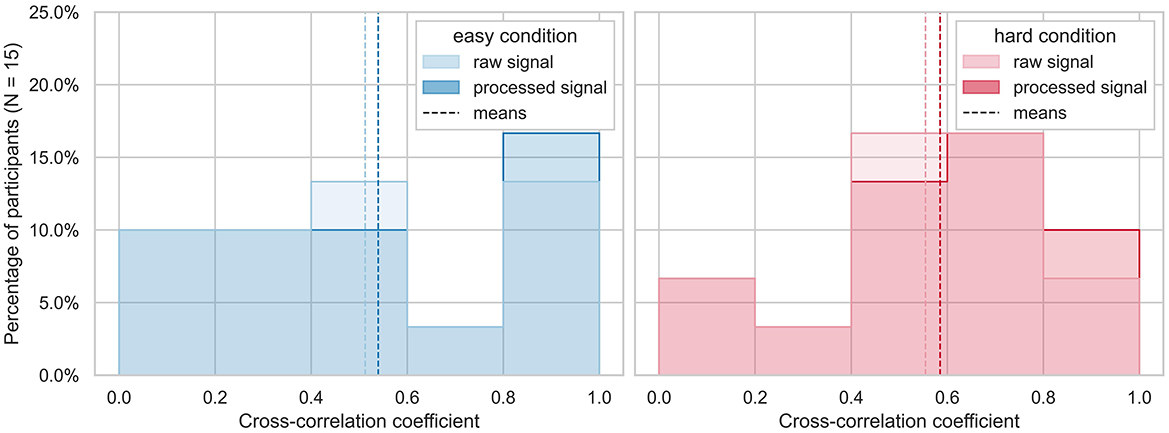
Figure 6. Highest cross-correlation coefficients across subjects. The highest cross-correlation of raw (top) and processed (bottom) EDA signals of is plotted as histogram devices between −8 and +8 sample time lags (corresponding to −0.53 to 0.53 s with a sampling rate of 15 Hz) is plotted for each run divided by easy (blue) and hard (red) condition of the workload task. The mean cross-correlations are indicated as dashed lines.
3.5 Parameter comparison: EDA
The results of the parameters comparison for the EDA data are illustrated through Bland-Altman plots (see Figure 7; for detailed results see Supplementary Figure 2, Supplementary Tables 4, 5). The pipeline underlying the presented Bland-Altman plots used the BioSSPy default filter parameters for data cleaning, the convex optimization approach introduced by Greco et al. (2016) for signal decomposition, and finally the peak detection by Nabian et al. (2018) as implemented in the Neurokit library (for details, see Table 1). The parameters that were compared between the devices were the mean SCL, the SCRs per minute, and the amplitude of the SCRs. The mean SCL estimate differed by −12.32 ± 3.76 μS for the EmotiBit and PsychoBit with a 95% CI of [−19.68, −4.96] μS in the easy workload condition and −13.57 ± 3.14 μS with a 95% CI of [−19.73, −7.41] μS in the hard workload condition. The BAr of log-transformed values indicated insufficient agreement (easy: BAr = 2.69, hard: BAr = 2.18; see Figure 7). The SCRs per minute derived from the EmotiBit differed on average by −1.6 ± 1.82 from the count of the PsychoBit with a 95% CI of [−5.17, 1.96] for the easy condition and −1.31 ± 1.53 SCRs with a 95% CI of [−4.3, 1.68] for the hard condition. The BAr agreement was insufficient (easy: BAr = 2.26, hard: BAr = 3.81). The amplitudes of the EmotiBit SCRs were on average estimated smaller than those of the PsychoBit (easy: −0.44 ± 0.28 μS, 95% CI of [−0.99, 0.12] μS; hard: −0.76 ± 0.51 μS, 95% CI of [−1.77, 0.24] μS). The BAr of log-transformed data implied insufficient agreement (easy: BAr = 1.38, hard: BAr = 1.63; see Figure 7).
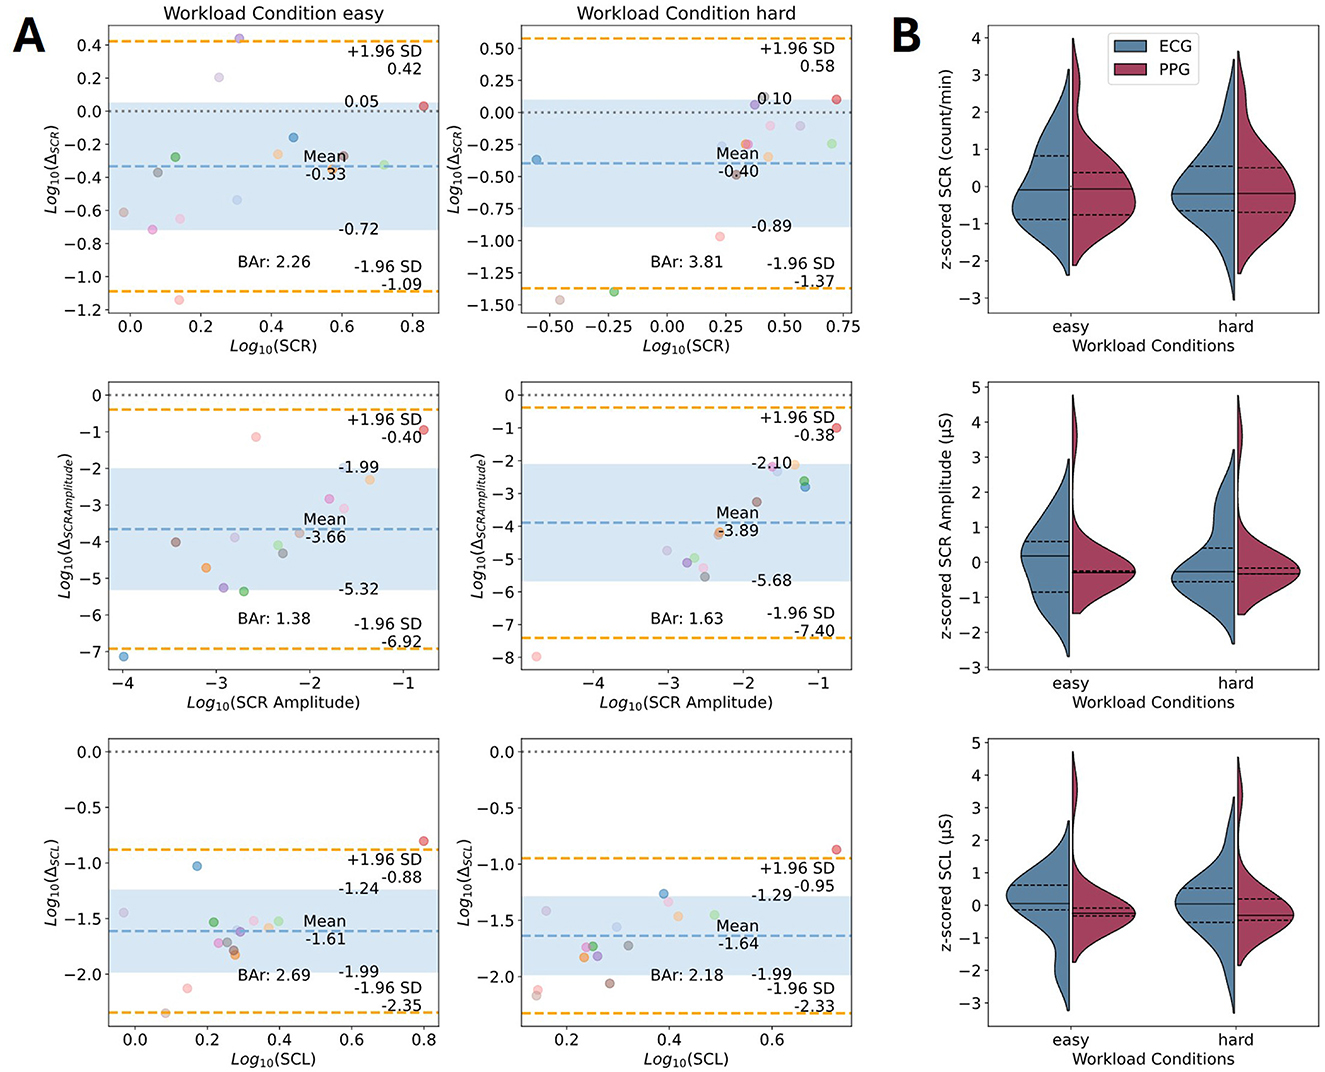
Figure 7. Device comparison of EDA parameters of interest. (A) Bland-Altman plots for the parameters' comparison of the EDA signals in terms of the log-transformed mean SCL, the number of SCRs per minute, and the mean amplitude of SCRs. Colored dots represent individual participants during the easy condition (left), and the hard condition (right). Each color corresponds to one participant. The x-axis corresponds to the average of the two measures for one parameter, and the y-axis shows the difference between the two measures. The theoretical difference of zero is marked as a gray dotted line. The observed mean difference is plotted as a dashed blue line with the standard deviations marked as blue areas. The orange lines represent the observed 95% confidence interval limits. The computed BAr is indicated within each plot. (B) Violin plots of z-scored parameters of interest per condition for ECG (blue) and EmotiBit PPG (red). The median (solid lines) and 1st and 3rd quartiles (dashed lines) for each measured parameter of interest are indicated per device. Abbeviations: Bar, Bland-Altman ratio; Δ, Mean difference; ECG, Electrocardiography; HR, Heart rate; PPG, Photoplethysmography; RMSSD, Root mean square of successive differences; SCL, Skin conductance level; SCR, Skin conductance response; SD, Standard deviation.
4 Discussion
The purpose of this study was to assess the validity of the EmotiBit wearable sensor for monitoring CVA and EDA during task-induced cognitive workload. We positioned the EmotiBit PPG on the upper arm, a realistically applicable site for hands-free monitoring in mobile work settings. Using a standardized validity assessment protocol (Langevin et al., 2021; van Lier et al., 2020), we compared PPG-derived HR and HRV measures as well as EDA indices against an ECG and palmar EDA system (BITalino PsychoBit) during two levels of cognitive workload.
4.1 CVA
Our results demonstrate excellent agreement between PPG-based HR estimates from the EmotiBit and ECG-based HR measures, with a Bland-Altman ratio (BAr) indicative of excellent criterion validity (see Figure 5). The 95% CIs indicated that the measures could differ by around one to two beats per minute at most. This applied to runs of both the easy and hard workload conditions. This is an important finding for applied neuroergonomics, as HR is a well-established physiological marker of mental effort and task engagement (Charles and Nixon, 2019; Da et al., 2019; Hughes et al., 2019; Jorna, 1992). Its non-invasive, wearable design allows for data collection in naturalistic settings, thus minimizing laboratory constraints and enhancing ecological validity. HR from the EmotiBit PPG can serve as a reliable surrogate for ECG in mobile workload monitoring systems, enabling real-time physiological assessments in operational environments such as safety-critical industries, remote work monitoring, and adaptive workstations. Furthermore, its integration with other biometric signals, such as temperature and motion, offers the possibility of multi-modal physiological research. In practical applications, such as fitness tracking and stress detection, the reliability of the EmotiBit ensures its efficacy as an alternative to ECG, which is often unwieldy and requires specialist equipment. We demonstrated the feasibility of using the Emotibit PPG device for measuring CVA. Nevertheless, the recorded sample of participants was relatively small, and thus robustness and generalizability of observed results is likely affected. We recommend that another research team should replicate our findings with a large and diverse sample to enhance the generalizability of findings.
Conversely, HRV metrics (SD and RMSSD) derived from PPG peak intervals showed moderate to insufficient BAr agreement with ECG (see Figure 5). The SDs of peak-to-peak intervals were in moderate agreement between devices, whereas the RMSSDs were of insufficient agreement. This result aligns with prior validation work of the EmotiBit (Langevin et al., 2021) as well as other PPG devices (O'Grady et al., 2024; Schäfer and Vagedes, 2013; Taoum et al., 2022). To be able to test the biological plausibility of the PPG signal in line with the established criterion validity method (Langevin et al., 2021; van Lier et al., 2020), all signal wavelengths (green, red, infrared) were averaged to create the standard PPG signal stream. The resulting signal might not be reliable to assess the HRV-related measures of SD and RMSSD of the PP intervals, similar to other PPG wearable devices (for a review, see Schäfer and Vagedes, 2013). However, the EmotiBit stores the recorded wavelength signals separately, thus allowing for separate analysis of the three signals if desired.
The green light spectrum is best suited for HRV-related measurements compared to red wavelengths (see Figure 1; Maeda et al., 2011). Red and infrared light spectra offer a more detailed insight into oxygenation levels of hemoglobin as they penetrate deeper into the tissue (Nitzan et al., 2014). For the same reason, this can introduce more noise and variability into the PPG signal compared to the ECG signal, especially in wearable devices (see Figure 8; Biswas et al., 2019). Therefore, it is recommended to use the EmotiBit PPG signal streams independently from each other, depending on the effect of interest.
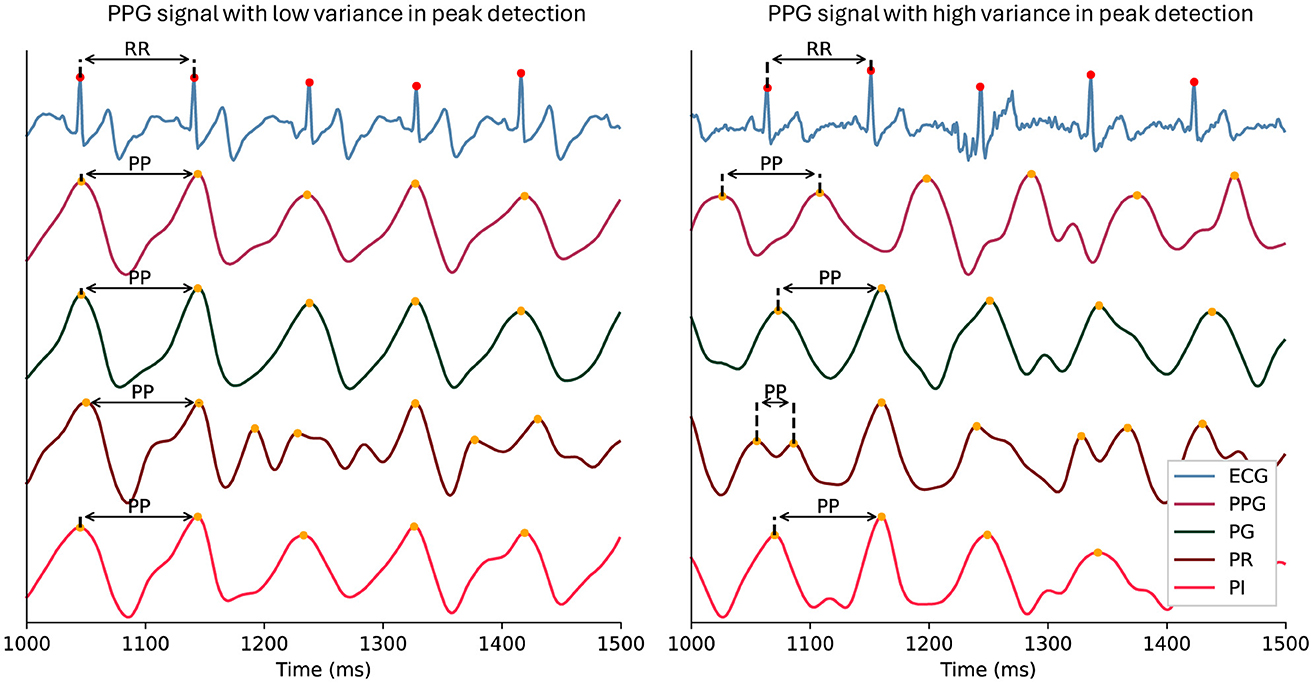
Figure 8. Example of peak detection in PPG signal streams. The figure illustrates the effect of averaging the three light wavelength signals of a PPG (PG, PR, PI) on the peak detection comparability to an ECG in the case of low variance between the signal streams (left) compared to high variance in the signal streams (right). In the left panel, an example of consistent peak-to-peak intervals across signals is highlighted with arrows. The right panel shows inconsistent peak-to-peak intervals across signals. ECG, Electrocardiography; PG: green PPG signal; PI, infrared PPG signal; PP, P-peak interval PPG, photoplethysmography; PR, red PPG signal; RR, R-peak interval.
4.2 EDA
Our findings indicate insufficient agreement between EmotiBit EDA (upper arm) and BITalino EDA (palm) for all EDA parameters (SCL, SCR count, SCR amplitude) as indicated by the BAr ratios being considerably larger than 0.2 regardless of the processing choices, thus indicating insufficient agreement (see Figure 7 and Supplementary Table 4). Our findings extend prior reports of EmotiBit's limited EDA performance (Haratian, 2024; Langevin et al., 2021) and are consistent with broader evidence on anatomical variations in sweat gland density (Baker, 2019). Given that the placement of the devices differed substantially, we expected mean signal differences to some extent. The palm has more sweat glands compared to the upper arm (Baker, 2019). Therefore, it is highly unlikely to observe no difference in signal level between the devices. The finding that the upper arm site proved suboptimal for capturing EDA reactivity relative to the palm reflects a broader challenge in the field of neuroergonomics: the data acquisition in naturalistic settings often prompts a trade-off decision between the comfortable, unobtrusive functionality of a device and optimal signal recording sites. It is recommended that future validation work systematically harmonize placement locations when possible. Although the quality of wearable sensors has improved in recent years (Huhn et al., 2022), emerging alternatives to body EDA sensors, such as facial thermal imaging, could offer a more reliable and accurate solution for workload detection in the wild (Gioia et al., 2022).
5 Conclusion
We evaluated the validity of utilizing the EmotiBit wearable sensor for cardiovascular and electrodermal measures during cognitive workload. We employed a standardized protocol for signal comparisons following an analysis of both signals using various processing pipelines. Our results pertaining to the CVA measures highlight that the EmotiBit can be employed with high biological plausibility in a natural setup and delivers reliable HR recordings, even under various workload conditions. However, when it comes to HRV and EDA measures, comparable measurement values were not observed, although the inherent differences between the measured body locations could be held accountable for this observed disagreement. While the EmotiBit HR monitoring is field-ready for workload detection and adaptive human-system interaction, observed HRV and EDA limitations necessitate algorithmic improvements or site-optimized solutions for high-resolution cognitive state monitoring. The trade-off between placement convenience and measurement fidelity remains an unresolved challenge when moving from laboratory ECG setups to consumer-oriented wearable solutions. Thus, research in the field of consumer neuroergonomics should focus on integrating high-quality multimodal physiological sensing with user comfort to advance real-time workload-adaptive environments.
Data availability statement
The data analyzed in this study is subject to the following licenses/restrictions: data and code pertaining to the study will be made available upon request. Requests to access these datasets should be directed to YW5uYS52b3JyZXV0aGVyQGlhdC51bmktc3R1dHRnYXJ0LmRl.
Ethics statement
The studies involving humans were approved by Ethics Commission of the University of Tübingen (No. 502/2023BO2). The studies were conducted in accordance with the local legislation and institutional requirements. The participants provided their written informed consent to participate in this study.
Author contributions
AV: Conceptualization, Data curation, Formal analysis, Investigation, Methodology, Project administration, Validation, Visualization, Writing – original draft, Writing – review & editing. NT: Conceptualization, Data curation, Funding acquisition, Investigation, Project administration, Resources, Validation, Writing – review & editing. MV: Conceptualization, Funding acquisition, Project administration, Resources, Supervision, Validation, Writing – review & editing.
Funding
The author(s) declare that financial support was received for the research and/or publication of this article. This work was supported by grants from the Federal Ministry of Education and Research Germany; project “proRotation – Beanspruchungsgerechte Rotationsplanung in Produktion und Logistik” (02L22B001). It was further supported by grants from the Ministry of Economic Affairs, Labor and Tourism Baden-Wuerttemberg; project: “KI-Fortschrittszentrum Lernende Systeme und Kognitive Robotik”. Additional support was provided by the Fraunhofer Internal Programs project “INSTANCE II – Immersive Industrial Innovation Ecosystems”.
Conflict of interest
The authors declare that the research was conducted in the absence of any commercial or financial relationships that could be construed as a potential conflict of interest.
The author(s) declared that they were an editorial board member of Frontiers, at the time of submission. This had no impact on the peer review process and the final decision.
Generative AI statement
The author(s) declare that Gen AI was used in the creation of this manuscript. The AI tools chatGPT (www.chatgpt.com) and deepL (www.deepl.com) were used for grammar and spelling checks.
Publisher's note
All claims expressed in this article are solely those of the authors and do not necessarily represent those of their affiliated organizations, or those of the publisher, the editors and the reviewers. Any product that may be evaluated in this article, or claim that may be made by its manufacturer, is not guaranteed or endorsed by the publisher.
Supplementary material
The Supplementary Material for this article can be found online at: https://www.frontiersin.org/articles/10.3389/fnrgo.2025.1585469/full#supplementary-material
References
Baker, L. B. (2019). Physiology of sweat gland function: the roles of sweating and sweat composition in human health. Temperature 6, 211–259. doi: 10.1080/23328940.2019.1632145
Batista, D., Silva, H., and Fred, A. (2017). Experimental characterization and analysis of the BITalino platforms against a reference device. Annu. Int. Conf. IEEE Eng. Med. Biol. Soc. 2017, 2418–2421. doi: 10.1109/EMBC.2017.8037344
BIOPAC Systems Inc. (2015). Phasic EDA: Methods for Computing Phasic Skin Conductance from Tonic | BIOPAC. Available online at: https://www.biopac.com/knowledge-base/phasic-eda-issue/ (accessed February 14, 2025).
Biswas, D., Simoes-Capela, N., van Hoof, C., and van Helleputte, N. (2019). Heart rate estimation from wrist-worn photoplethysmography: a review. IEEE Sens. J. 19, 6560–6570. doi: 10.1109/JSEN.2019.2914166
Bland, M., and Altman, D. (1986). Statistical methods for assessing agreement between two methods of clinical measurement. Lancet 327, 307–310. doi: 10.1016/S0140-6736(86)90837-8
Boucsein, W., Fowles, D. C., Grimnes, S., Ben-Shakhar, G., Roth, W. T., Dawson, M. E., et al. (2012). Publication recommendations for electrodermal measurements. Psychophysiology 49, 1017–1034. doi: 10.1111/j.1469-8986.2012.01384.x
Brähler, E., Mühlan, H., Albani, C., and Schmidt, S. (2007). Teststatistische prüfung und normierung der deutschen versionen des EUROHIS-QOL lebensqualität-index und des WHO-5 wohlbefindens-index'. Diagnostica 53, 83–96. doi: 10.1026/0012-1924.53.2.83
Braithwaite, J. J., Watson, D. G., Jones, R., and Rowe, M. (2013). A guide for analysing electrodermal activity (EDA) and skin conductance responses (SCRs) for psychological experiments. Psychophysiology 49, 1017–1034. doi: 10.1111/j.1469-8986.2012.01384.x
Brammer, J. (2020). biopeaks: a graphical user interface for feature extraction from heart- and breathing biosignals. J. Open Source Softw. 5:2621. doi: 10.21105/joss.02621
Brandt-Rauf, P. W., and Ayaz, H. (2024). Occupational Health and neuroergonomics: the future of wearable neurotechnologies at the workplace. J. Occup. Env. Med. 66, 456–460. doi: 10.1097/JOM.0000000000003080
Carreiras, C., Alves, A. P., Lourenço, A., Canento, F., Silva, H., and Fred, A. (2015). BioSPPy: Biosignal Processing in Python. Available online at https://github.com/PIA-Group/BioSPPy/ (accessed February 4, 2025).
Charles, R. L., and Nixon, J. (2019). Measuring mental workload using physiological measures: a systematic review. Appl. Ergon. 74, 221–232. doi: 10.1016/j.apergo.2018.08.028
Da, T., Tan, H., Wang, H., Zhang, X., Qu, X., and Zhang, T. (2019). A systematic review of physiological measures of mental workload. Int. J. Env. Res. Public Health 16:2716. doi: 10.3390/ijerph16152716
Daneman, M., and Carpenter, P. A. (1980). Individual differences in working memory and reading. J. Verbal Learn. Verbal Behav. 19, 450–466. doi: 10.1016/S0022-5371(80)90312-6
Elgendi, M., Jonkman, M., and DeBoer, F. (2010). Frequency Bands Effects on QRS Detection. Available online at https://www.scitepress.org/papers/2010/27427/27427.pdf
Elgendi, M., Norton, I., Brearley, M., Abbott, D., and Schuurmans, D. (2013). Systolic peak detection in acceleration photoplethysmograms measured from emergency responders in tropical conditions. PLoS ONE 8:e76585. doi: 10.1371/journal.pone.0076585
Euser, A. M., Dekker, F. W., and Le Cessie, S. (2008). A practical approach to Bland-Altman plots and variation coefficients for log transformed variables. J. Clin. Epidemiol. 61, 978–982. doi: 10.1016/j.jclinepi.2007.11.003
Evans, J. D. (1996). Straightforward Statistics for the Behavioral Sciences. Pacific Grove, CA: Brooks/Cole Publishing.
Fliege, H., Rose, M., Arck, P., Levenstein, S., and Klapp, B. F. (2001). Validierung des “Perceived Stress Questionnaire” (PSQ) an einer deutschen Stichprobe. Diagnostica 47, 142–152. doi: 10.1026//0012-1924.47.3.142
Fujita, D., and Suzuki, A. (2019). Evaluation of the possible use of PPG waveform features measured at low sampling rate. IEEE Access 7, 58361–58367. doi: 10.1109/ACCESS.2019.2914498
Gamboa, H. (2008). Multi-Modal Behavioral Biometrics Based on HCI and Electrophysiology. Available online at http://www.lx.it.pt/~afred/pub/thesishugogamboa.pdf (accessed February 4, 2025).
Gao, Q., and Zhou, J., (eds.). (2022). “Human aspects of IT for the aged population. design, interaction and technology acceptance,” in 8th International Conference, ITAP 2022, Held as Part of the 24th HCI International Conference, HCII 2022, Virtual Event, June 26–July 1, 2022, Proceedings, Part I (Vol. 13330) (Springer Nature).
Gioia, F., Greco, A., Callara, A. L., and Scilingo, E. P. (2022). Towards a Contactless stress classification using thermal imaging. Sensors 22:976. doi: 10.3390/s22030976
Greco, A., Valenza, G., Lanata, A., Scilingo, E. P., and Citi, L. (2016). cvxEDA: a convex optimization approach to electrodermal activity processing. IEEE Trans. BioMed. Eng. 63, 797–804. doi: 10.1109/TBME.2015.2474131
Guarducci, S., Jayousi, S., Caputo, S., and Mucchi, L. (2025). Key fundamentals and examples of sensors for human health: wearable, non-continuous, and non-contact monitoring devices. Sensors 25:556. doi: 10.3390/s25020556
Haratian, R. (2024). On-body sensing technologies and signal processing techniques in addressing safety of human machine collaboration. Human Intell. Syst. Integr. 6, 103–114. doi: 10.1007/s42454-024-00057-5
Hart, S. G., and Staveland, L. E. (1988). “Development of NASA-TLX (Task Load Index): results of empirical and theoretical research”. Adv. Psychol. 52, 139–183. doi: 10.1016/S0166-4115(08)62386-9
Hinz, A., Daig, I., Petrowski, K., and Brähler, E. (2012). Die Stimmung in der deutschen bevölkerung: referenzwerte für den mehrdimensionalen befindlichkeitsfragebogen MDBF. Psychother. Psychosom. Med. Psychol. 62, 52–57. doi: 10.1055/s-0031-1297960
Hoddes, E., Zarcone, V., Smythe, H., Phillips, R., and Dement, W. C. (1973). Quantification of sleepiness: a new approach. Psychophysiology 10, 431436.
Hogervorst, M. A., Brouwer, A.-M., and van Erp, J. B. F. (2014). Combining and comparing EEG, peripheral physiology and eye-related measures for the assessment of mental workload. Front. Neurosci. 8:322. doi: 10.3389/fnins.2014.00322
Hughes, A. M., Hancock, G. M., Marlow, S. L., Stowers, K., and Salas, E. (2019). Cardiac measures of cognitive workload: a meta-analysis. Human Factors 61, 393–414. doi: 10.1177/0018720819830553
Huhn, S., Axt, M., Gunga, H.-C., Maggioni, M. A., Munga, S., Obor, D., et al. (2022). The impact of wearable technologies in health research: scoping review. JMIR MHealth UHealth 10:e34384. doi: 10.2196/34384
Jorna, P. G. (1992). Spectral analysis of heart rate and psychological state: a review of its validity as a workload index. Biol. Psychol. 34, 237–257. doi: 10.1016/0301-0511(92)90017-o
Kasos, K., Kekecs, Z., Csirmaz, L., Zimonyi, S., Vikor, F., Kasos, E., et al. (2020). Bilateral comparison of traditional and alternate electrodermal measurement sites. Psychophysiology 57:e13645. doi: 10.1111/psyp.13645
Kim, H.-G., Cheon, E.-J., Bai, D.-S., Lee, Y. H., and Koo, B.-H. (2018). Stress and heart rate variability: a meta-analysis and review of the literature. Psychiat. Investig. 15, 235–245. doi: 10.30773/pi.2017.08.17
Kim, K. H., Bang, S. W., and Kim, S. R. (2004). Emotion recognition system using short-term monitoring of physiological signals. Med. Biol. Eng. Comput. 42, 419–427. doi: 10.1007/BF02344719
Kothe, C., Shirazi, S. Y., Stenner, T., Medine, D., Boulay, C., Grivich, M. I., et al. (2024). The lab streaming layer for synchronized multimodal recording. bioRxiv 2024.02.13.580071. doi: 10.1101/2024.02.13.580071
Kothe, C. A. (2025). LabStreamingLayer. GitHub Repository. Available online at: https://github.com/sccn/labstreaminglayer (accessed February 25, 2025).
Langevin, A., Bégin, W., Lavallière, M., Beaulieu, L.-D., Menelas, B.-D. J., Gaboury, S., et al. (2021). “Criterion validation of an open-source wearable physiological sensors device,” in Proceedings of the 9th International Conference on Sport Sciences Research and Technology Support – icSPORTS (SciTePress), 95–105.
Lobosco, E. (2023). The biophysical and emotional effects of dancing with a partner. UF J. Undergrad. Res. 25. doi: 10.32473/ufjur.25.133415
Maeda, Y., Sekine, M., and Tamura, T. (2011). The advantages of wearable green reflected photoplethysmography. J. Med. Syst. 35, 829–834. doi: 10.1007/s10916-010-9506-z
Makowski, D., Pham, T., Lau, Z. J., Brammer, J. C., Lespinasse, F., Pham, H., et al. (2021). NeuroKit2: a python toolbox for neurophysiological signal processing. Behav. Res. Methods 53, 1689–1696. doi: 10.3758/s13428-020-01516-y
Montgomery, S. M., Nair, N., Chen, P., and Dikker, S. (2024). Validating EmotiBit, an open-source multi-modal sensor for capturing research-grade physiological signals from anywhere on the body. Meas. Sens. 32:101075. doi: 10.1016/j.measen.2024.101075
Morris, C., Danry, V., and Maes, P. (2023). Wearable systems without experiential disruptions: exploring the impact of device feedback changes on explicit awareness, physiological synchrony, sense of agency, and device-body ownership. Front. Comput. Sci. 5:1289869. doi: 10.3389/fcomp.2023.1289869
Nabian, M., Yin, Y., Wormwood, J., Quigley, K. S., Barrett, L. F., and Ostadabbas, S. (2018). An open-source feature extraction tool for the analysis of peripheral physiological data. IEEE J. Trans. Eng. Health Med. 6:2800711. doi: 10.1109/JTEHM.2018.2878000
Nitzan, M., Romem, A., and Koppel, R. (2014). Pulse oximetry: fundamentals and technology update. Med. Devices 7, 231–239. doi: 10.2147/MDER.S47319
O'Grady, B., Lambe, R., Baldwin, M., Acheson, T., and Doherty, C. (2024). The validity of Apple Watch Series 9 and Ultra 2 for serial measurements of heart rate variability and resting heart rate. Sensors 24:6220. doi: 10.3390/s24196220
Olivaz, D., and Kulgod, A. (2023). A human-canine interface from sensors, haptics, and AI. TechRxiv. doi: 10.36227/techrxiv.24082260.v1
O'Neal, W. T., Chen, L. Y., Nazarian, S., and Soliman, E. Z. (2016). Reference ranges for short-term heart rate variability measures in individuals free of cardiovascular disease: the Multi-Ethnic Study of Atherosclerosis (MESA). J. Electrocardiol. 49, 686–690. doi: 10.1016/j.jelectrocard.2016.06.008
Orphanidou, C., Bonnici, T., Charlton, P., Clifton, D., Vallance, D., and Tarassenko, L. (2015). Signal-quality indices for the electrocardiogram and photoplethysmogram: derivation and applications to wireless monitoring. IEEE J. BioMed. Health Inform. 19, 832–838. doi: 10.1109/JBHI.2014.2338351
Peláez, E. A., and Villegas, E. R. (2007). “LED power reduction trade-offs for ambulatory pulse oximetry,” in Annual International Conference of the IEEE Engineering in Medicine and Biology Society (Lyon: IEEE), 2296–2299.
Pelc, M., Vilimkova Kahankova, R., Blaszczyszyn, M., Mikolajewski, D., Konieczny, M., Khoma, V., et al. (2023). Initial study on an expert system for spine diseases screening using inertial measurement unit. Sci. Rep. 13:10440. doi: 10.1038/s41598-023-36798-7
Prahl, S. (1999). Optical Absorption of Hemoglobin. Available online at: http://omlc.ogi.edu/spectra/hemoglobin/index.html (accessed February 4, 2025).
Rammstedt, B., Kemper, C. J., Klein, M. C., Beierlein, C., and Kovaleva, A. (2017). A short scale for assessing the big five dimensions of personality: 10 item big five inventory (BFI-10). Methods Data Anal. 7:17. doi: 10.12758/mda.2013.013
Reyes-Consuelo, M., Michaud, D., Proulx-Guimond, J., Kiss, J., Vincent, C., Edwards, G., et al. (2023). Virtual reality at workplace for autistic employees: preliminary results of physiological-based well-being experience. J. Biosens. Bioelectronics Res. doi: 10.47363/JBBER/2023
Rizzi, J., D'Antona, A., Proto, A., Piva, G., Lamberti, N., Bonfè, M., et al. (2023). A framework integrating augmented reality and wearable sensors for the autonomous execution of rehabilitation exercises. Electronics 12: 4958. doi: 10.3390/electronics12244958
Schäfer, A., and Vagedes, J. (2013). How accurate is pulse rate variability as an estimate of heart rate variability? A review on studies comparing photoplethysmographic technology with an electrocardiogram. Int. J. Cardiol. 166, 15–29. doi: 10.1016/j.ijcard.2012.03.119
Scharinger, C., Soutschek, A., Schubert, T., and Gerjets, P. (2017). Comparison of the working memory load in N-Back and working memory span tasks by means of EEG frequency band power and P300 amplitude. Front. Human Neurosci. 11:6. doi: 10.3389/fnhum.2017.00006
SparkFun Photodetector (MAX30101) Hookup Guide - SparkFun Learn (2025). Available online at: https://learn.sparkfun.com/tutorials/sparkfun-photodetector-max30101-hookup-guide/hardware-overview (accessed February 25, 2025).
Squires, N. K., Squires, K. C., and Hillyard, S. A. (1975). Two varieties of long-latency positive waves evoked by unpredictable auditory stimuli in man. Electroencephalogr. Clin. Neurophysiol. 38, 387–401. doi: 10.1016/0013-4694(75)90263-1
Taoum, A., Bisiaux, A., Tilquin, F., Le Guillou, Y., and Carrault, G. (2022). Validity of Ultra-Short-Term HRV analysis using PPG-A preliminary study. Sensors 22:7995. doi: 10.3390/s22207995
Turner, M. L., and Engle, R. W. (1989). Is working memory capacity task dependent? J. Mem. Lang. 28, 127–154. doi: 10.1016/0749-596X(89)90040-5
van Lier, H. G., Pieterse, M. E., Garde, A., Postel, M. G., Haan, H. A., de Vollenbroek-Hutten, M. M. R., et al. (2020). A standardized validity assessment protocol for physiological signals from wearable technology: methodological underpinnings and an application to the E4 biosensor. Behav. Res. Methods 52, 607–629. doi: 10.3758/s13428-019-01263-9
Keywords: photoplethysmography, electrocardiography, electrodermal activity, heart rate, skin conductance, cognitive workload
Citation: Vorreuther A, Tagalidou N and Vukelić M (2025) Validation of the EmotiBit wearable sensor for heart-based measures under varying workload conditions. Front. Neuroergon. 6:1585469. doi: 10.3389/fnrgo.2025.1585469
Received: 28 February 2025; Accepted: 20 May 2025;
Published: 18 June 2025.
Edited by:
Anne-Marie Brouwer, Netherlands Organisation for Applied Scientific Research, NetherlandsReviewed by:
Vincenzo Ronca, Sapienza University of Rome, ItalySimone Costantini, Politecnico di Milano, Italy
Copyright © 2025 Vorreuther, Tagalidou and Vukelić. This is an open-access article distributed under the terms of the Creative Commons Attribution License (CC BY). The use, distribution or reproduction in other forums is permitted, provided the original author(s) and the copyright owner(s) are credited and that the original publication in this journal is cited, in accordance with accepted academic practice. No use, distribution or reproduction is permitted which does not comply with these terms.
*Correspondence: Anna Vorreuther, YW5uYS52b3JyZXV0aGVyQGlhdC51bmktc3R1dHRnYXJ0LmRl