
- 1 Department of Neurology, University of Pittsburgh School of Medicine, Pittsburgh, PA, USA
- 2 Department of Neurology, Clínica Universidad de Navarra, Pamplona, Spain
Alzheimer’s disease (AD) is the most common form of dementia in the elderly, and it is characterized by progressive impairment in multiple cognitive domains of sufficient severity to interfere with individuals’ daily living activities. Historically, the diagnosis of AD has been based on the identification of a clinical syndrome, and accuracy studies of the current clinical criteria conducted in referral clinics have shown high sensitivity for AD. However, the identification of the disease is still not perfect, and there is growing evidence that the use of biomarkers will increase our ability to better indentify the underlying biology of AD, especially in its early stages. These biomarkers will improve the detection of the patients suitable for research studies and drug trials, and they will contribute to a better management of the disease in the clinical practice. In this review, we discuss the most studied biomarkers in AD: cerebrospinal fluid proteins, structural magnetic resonance imaging, functional neuroimaging techniques, and amyloid imaging.
Introduction
Alzheimer’s disease (AD) is the most frequent neurodegenerative disease (Ferri et al., 2005) and is characterized by a progressive dementia that occurs in middle or late life. The neuropathological hallmark of AD is the presence of cortical intracellular neurofibrillary tangles (NFT) and extracellular β-amyloid (Aβ) plaques (Braak and Braak, 1991), which leads to synapse dysfunction, neuronal cell loss and subsequent brain atrophy (Ballard et al., 2011). In the past few decades the knowledge of the key pathogenic mechanisms of the disease has improved, but they are still not completely understood (Querfurth and LaFerla, 2010). The natural history of AD could be divided in three different phases: the pre-clinical phase, where the pathogenic mechanisms of the disease have started but no symptoms can be identified; the prodromal phase, where mild cognitive symptoms appear, but there are not severe enough to meet dementia criteria; and the dementia phase (Dubois et al., 2007). On the other hand, mild cognitive impairment (MCI) is a clinical construct created to capture patients with subtle cognitive symptoms at risk for AD (Petersen et al., 2009). However, some subjects develop other types of dementias, do not progress, or even revert to normal cognition (Ganguli et al., 2004; Brooks and Loewenstein, 2010). Therefore, it is difficult to label MCI patients as having prodromal AD.
Currently, the most frequently used clinical diagnostic criteria for AD are the Diagnostic and Statistical Manual of Mental Disorders (DSM-IV-TR; APA, 2000) and the National Institute of Neurological Disorders and Stroke-Alzheimer Disease and Related Disorders (NINCDS–ADRDA; McKhann et al., 1984) working group. These criteria are fulfilled in a two-step diagnostic process. First, the dementia syndrome is established and then, criteria based on the clinical features of the AD type dementia are applied. The DSM-IV-TR criteria require the presence of impairment in multiple cognitive domains of sufficient severity to interfere with the individuals’ activities of daily living to diagnose dementia. Hence, the clinical diagnosis of AD is not possible until a patient reach the dementia phase of the disease. On the other hand, these criteria have shown to have good sensitivity and specificity to distinguish between patients with AD type dementia and non-demented subjects, but are less accurate to differentiate AD dementia from other primary dementias (Knopman et al., 2001; Ballard et al., 2011). In fact, up to 20% of patients clinically diagnosed with AD do not have AD pathology at autopsy (Mayeux et al., 1998; Lim et al., 1999).
A more accurate and earlier diagnosis of AD (e.g., in MCI patients that will progress to the AD dementia phase or ideally those subjects in the pre-clinical phase) could enable the administration of potential disease-modifying drugs that would have a great impact on patients’ life and profound implications for public health (Brookmeyer et al., 1998). In this context, there is a need of specific biological markers for AD diagnosis in the earliest stages. A biomarker is defined as a measureable feature that can be used to diagnose a physiologic or pathologic condition. The ideal biomarker of AD would be: (1) directed at the fundamental pathophysiology of the disease, (2) a marker of the presence of disease itself, (3) efficacious at prodromal, and even pre-clinical stages of AD, (4) an indicator of disease’s severity, (5) a marker of treatment effectiveness, and (6) inexpensive and non-invasive (Klunk, 1998). In the case of AD, different biomarkers have been described using diverse approaches. The development of cerebrospinal fluid (CSF) assays and neuroimaging techniques that can provide information about the presence of AD pathological changes has been a major step forward in the field. Consequently, biomarkers for AD are called to play a central role in the clinical characterization of the disease.
More recently, the NINCDS–ADRDA criteria have been revised by the National Institute on Aging and the Alzheimer’s Association (NIA–AA) workgroup to include the experience in research over the past 25 years (McKhann et al., 2011). The NIA–AA proposed a series of diagnostic classification from pre-clinical AD to MCI to full-blown AD, and introduced CSF and neuroimaging biomarkers as supportive features of the disease (Albert et al., 2011; McKhann et al., 2011; Sperling et al., 2011). However, the authors cautioned about the use of biomarkers, and stated that their use should be limited to research and drug trials. Nevertheless, the core clinical criteria for AD remained relatively intact in the new criteria.
This review will focus on the most widely studied and currently accepted sources of biomarkers in AD: CSF, magnetic resonance imaging (MRI), and Nuclear Medicine techniques, including amyloid imaging.
Biomarkers in CSF
Clinical studies employ mainly blood or CSF to search biochemical markers of neurodegenerative diseases. Typically, the CSF better reflects the brain neurochemistry, while biochemical values in plasma or serum may be affected by many non-neurological factors. CSF biomarker research has focused mainly on molecules related to the central neuropathological features of AD, such as Aβ, the main component of the senile neuritic plaques (SNP), and tau proteins that are part of the NFTs. Aβ is a 36–43 amino acid peptide originated from proteolysis of the amyloid protein precursor (Querfurth and LaFerla, 2010). SNPs are mainly composed by Aβ protein with 40 (Aβ40) or 42 (Aβ42) amino acids, and it seems that Aβ deposition begins with Aβ42, and during plaque maturation, they acquire Aβ40 (Iwatsubo et al., 1994). By contrast, NFTs are formed by tau proteins, a microtubule-associated stabilizing protein essential for axonal transport. Tau is hyperphosphorylated in AD, which tends to aggregate, leading to synaptic and neuronal dysfunction (Lee, 1996; Blennow et al., 2010; Querfurth and LaFerla, 2010). This process of NFTs formation starts in the entorhinal cortex, spreading to the hippocampus, and then to the rest of the brain. These neuropathological changes begin early, even decades before the onset of clinical symptoms of dementia (Braak and Braak, 1991), but the relative contributions of altered tau and amyloid metabolism to neurodegeneration remain under investigation. Nevertheless, NFTs are more robust associated with measures of synapse loss and cognitive impairment that SNPs (Gomez-Isla et al., 1997).
Typically, AD patients have lower levels of Aβ42 in the CSF compared to normal controls, Aβ40 tends to remain constant, and tau (t-tau) and phosphorylated tau (p-tau) increase (Arai et al., 1995; Blennow et al., 1995; Motter et al., 1995; Vigo-Pelfrey et al., 1995; Galasko et al., 1998; Kurz et al., 1998; Shoji et al., 1998; Hulstaert et al., 1999; Andreasen et al., 2001; Sunderland et al., 2003; Lewczuk et al., 2004; Schoonenboom et al., 2004; Shaw et al., 2009). The low CSF Aβ42 levels in this entity may represent the retention of the peptide into plaques, resulting in reduced availability to diffuse into the CSF. This is supported by the findings that Aβ42 in the CSF is inversely correlated with amyloid plaque load at autopsy (Strozyk et al., 2003; Tapiola et al., 2009) and as measured in vivo by amyloid imaging (Fagan et al., 2006; Forsberg et al., 2008; Tolboom et al., 2009). The increase in t-tau and p-tau in the CSF of AD patients may stem from release into CSF during neurodegeneration (Blennow et al., 1995), although the exact mechanism is not known. T-tau and p-tau concentrations in the CSF have been associated with NFT load at autopsy (Buerger et al., 2006a; Tapiola et al., 2009), as well as with cognitive decline and brain atrophy (Buerger et al., 2002; Hampel et al., 2005; Fjell et al., 2010; Vemuri et al., 2010b).
Low CSF Aβ42 and high t-tau or p-tau proteins have shown high accuracy for AD diagnosis (Galasko et al., 1998; Andreasen et al., 2001; Schoonenboom et al., 2004). Studies that compared AD patients with normal control subjects have demonstrated that low Aβ42 had 78–100% sensitivity and 47–81% specificity for AD diagnosis; high CSF t-tau levels had 70% sensitivity and 92% specificity and p-tau showed 77% sensitivity and 87% specificity. However, p-tau appears to be better than t-tau in the diagnosis of AD, and it has shown a positive predictive value of 90%, especially p-tau phosphorylated at threonine 181 (p-tau181; Hampel et al., 2004a; Mitchell, 2009). Figure 1 shows the t-tau levels in AD, frontotemporal dementia (FTD), and normal autopsied subjects, and Figure 2 shows the Aβ42 levels in the same population (Schoonenboom et al., 2004).
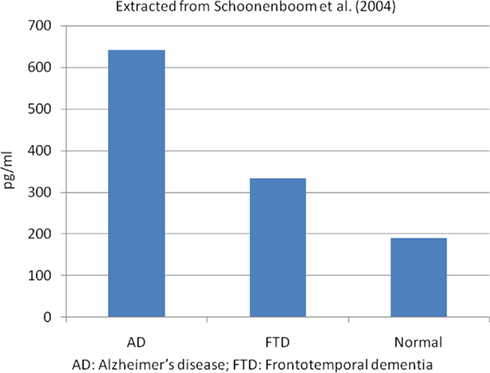
Figure 1. Mean CSF total tau levels in autopsied proven cases. Extracted from Schoonenboom et al. (2004). AD, Alzheimer’s disease; FTD, frontotemporal dementia.
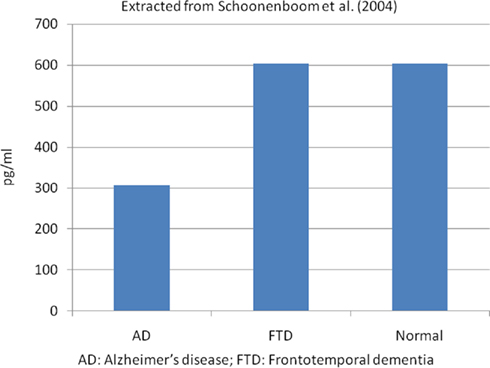
Figure 2. Mean CSF Aβ42 levels in autopsied proven cases. Extracted from Schoonenboom et al. (2004). AD, Alzheimer’s disease; FTD, frontotemporal dementia.
Because some studies found that Aβ42 and tau levels alone were not sufficient to differentiate AD from normal controls or other dementias, the Aβ42/tau ratio is used to improve the diagnosis of AD. A meta-analysis showed that the Aβ42/tau ratio had a sensitivity of 71% and specificity of 83% for AD (Hampel et al., 2004b); and a recent study showed that the “signature” of AD, based on the CSF Aβ42/p-tau181 ratio cutoffs, was present in 90% of the AD patients compared to 36% in the normal control group (De Meyer et al., 2010). Although, these CSF biomarkers seem to be useful to diagnose AD, they are not sensitive enough to assess disease progression (Sunderland et al., 1999; Vemuri et al., 2010b). Nevertheless, higher CSF t-tau and lower Aβ42 values have been associated with rapid cognitive decline, no response to cholinesterase inhibitor treatment and a higher mortality in patients with AD dementia (Wallin et al., 2010).
Cerebrospinal fluid biomarkers might have a role in the differential diagnosis of AD and other dementias. Patients with dementia with Lewy bodies (DLB), like AD patients, have lower levels of Aβ42 in the CSF compared to normal controls, reflecting that most of these subjects also present AD pathology. Nevertheless, shorter amyloid peptides (Aβ37, Aβ38, and Aβ40) appear to be slightly more elevated in AD dementia (Bibl et al., 2006). Consequently, the Aβ42/Aβ37 and Aβ42/Aβ38 ratios seemed to better discriminate AD from DLB (Bibl et al., 2006; Mulugeta et al., 2010). T-tau and p-tau levels are normal or high in DLB, but most studies have shown that these markers’ levels in DLB are definitely lower than those found in AD. Other proposed biomarker for the differentiation of AD from DLB was monomeric soluble α-synuclein, but the available studies in DLB patients showed conflicting results. Elevated, unchanged and decreased total α-synuclein levels have been reported in these patients compared to AD and control subjects (Mukaetova-Ladinska et al., 2010). In addition, there are limited data about oligomeric α-synuclein in CSF, although it could be potential biomarker for synucleinopathies (Tokuda et al., 2010). Possibly, the combination of all these markers will help to distinguish between AD and DLB in the future.
In FTD, CSF Aβ42 levels are lower than in control subjects but higher than in AD, while t-tau and p-tau levels are higher than in controls but lower that in AD patients (Hulstaert et al., 1999; Riemenschneider et al., 2002). Hence, t-tau/Aβ42 and p-tau/Aβ42 ratios could be a useful tool to distinguish AD from FTD (Bian et al., 2008; Cruz de Souza et al., 2011). Creutzfeldt–Jakob disease (CJD) is characterized by decreased CSF Aβ42 concentrations and very high t-tau levels, reflecting intense neuronal damage, while p-tau levels are normal (Kapaki et al., 2001; Riemenschneider et al., 2003; Buerger et al., 2006b). Current data suggest that p-tau levels could be the most relevant marker to differentiate AD from other types of dementias (Hampel et al., 2004b; Kapaki et al., 2007; Koopman et al., 2009).
Cerebrospinal fluid biomarkers may also be useful in predicting progression to AD in subjects with MCI (Andreasen et al., 1999; Hampel et al., 2004c; Ewers et al., 2007; Brys et al., 2009). Low CSF Aβ42 levels predicted conversion with 60–80% sensitivity and 65–100% specificity, while t-tau levels had 83–86% sensitivity and 56–90% specificity, and p-tau had 73–84% sensitivity and 47–88% specificity (Hampel et al., 2004b). However, the conversion to AD dementia in MCI subjects has shown significant variability among different CSF studies. Hansson et al. (2006) found high sensitivity (95%) and specificity (87%) for the conversion from MCI to AD dementia using a combination of t-tau and Aβ42/p-tau181 ratio cutoff values. By contrast, a multicenter CSF study found lower sensitivity (83%) and specificity (72%) for the conversion from MCI to AD than single-site studies, with a considerable inter-site assay variability that highlights a need for standardization of analytical techniques and subject selection (Mattsson et al., 2009). Other large multicenter studies have confirmed the high predictive value of these CSF biomarkers in the identification of cases with prodromal AD in the context of the MCI syndrome (Shaw et al., 2009; Visser et al., 2009).
The CSF biomarkers have been used to identify the pre-clinical stage of AD. Cross-sectional studies in normal control individuals carrying the ApoE4 allele showed lower CSF Aβ42 and higher p-tau181 levels (Peskind et al., 2006; Kester et al., 2009; Shaw et al., 2009; Vemuri et al., 2010a). Interestingly, CSF levels of Aβ42 correlated with brain volume in this group of subjects, while in MCI and AD dementia patients, whole-brain volume correlated with CSF t-tau and p-tau181 (Fagan et al., 2009). A longitudinal CSF study in normal controls found increased t-tau levels and no change in Aβ42 after a 1-year follow-up (Vemuri et al., 2010b). A few longitudinal studies have assessed which CSF biomarker or combination of biomarkers better predict AD dementia or cognitive decline. Fagan et al. (2007) demonstrated that CSF tau/Aβ42 ratios may predict future dementia in cognitively normal older subjects and two other studies showed that low levels of CSF Aβ42 predicted cognitive decline, as measured with the mini mental status examination (MMSE; Gustafson et al., 2007; Stomrud et al., 2007). Although there are studies that showed that CSF Aβ42 could predict prodromal AD, there was a wide SD in these subjects, which made difficult to determine individually who will progress to AD. Further studies are needed to assess changes in CSF markers over time and to determine the best CSF markers of change.
Structural Neuroimaging Markers
Structural neuroimaging techniques are normally performed during the clinical assessment of patients with dementia, mainly to rule out structural lesions, such as brain tumors, normal pressure hydrocephalus, or vascular lesions. The MRI has shown high sensitivity to detect brain atrophy caused by the neurodegenerative process (Bobinski et al., 2000). Several methods are used to analyze MRI data including visual inspection, volumetry, or region of interest (ROI) analysis (applying manual tracing, automated, or semi-automated techniques) and voxel based morphometry (VBM; Vemuri and Jack, 2010). There are benefits and limitations of these methods. The visual rating of the images and ROI analysis depend on the a priori choice of structures, while VBM is a whole-brain operator-independent analysis (Ashburner and Friston, 2000). However, VBM analysis only allows comparing groups of patients, and it is not useful to classify individual cases. Visual assessment of MRI scans is a fast method to assess brain atrophy but is not the most precise (Raji et al., 2010). Volumetry of the medial temporal lobe structures is the most common quantitative method used in AD. The traditional manual tracing is time-consuming, and consequently, automated or semi-automated methods that require no significant manual intervention have been developed. Other methods to analyze sequential MRIs are boundary shift integral (BSI) and tensor-based morphometry (TBM). BSI has been developed to quantify the global percentage of change in the brain surfaces between two scans, while TBM provides a three-dimension profile of brain atrophy (Vemuri and Jack, 2010).
Brain MRI studies have shown that AD patients have a widespread cortical volume loss, including the frontal lobes, the temporoparietal regions, precuneus, and mesial temporal lobes, with relative sparing of the sensorimotor, visual, and cerebellar regions (Du et al., 2001; Good et al., 2001; Thompson et al., 2001; Karas et al., 2003; Testa et al., 2004; Ishii et al., 2005; Dickerson et al., 2008; Burton et al., 2009). Longitudinal studies have suggested that atrophy stars in the medial temporal lobes and fusiform gyrus in the prodromal phase of the disease, then spreads out to the posterior temporal and parietal lobes, and by the time of the dementia phase, it involves the medial temporal lobes, temporoparietal cortex, and the frontal lobe (Whitwell et al., 2007). This pattern of atrophy progression on MRI appears to follow the distribution of NFT in the different Braak and Braak (1991) pathological stages (Whitwell et al., 2008). In AD, there is also a greater rate of brain atrophy over time compared with healthy elderly subjects (1.9–2.2% per year versus 0.5–0.7% per year; O’Brien et al., 2001; Sluimer et al., 2008a,b; Henneman et al., 2009). Hippocampal and whole-brain atrophy in AD correlated well with cognitive performance and measures of disease severity (Jack et al., 2008a; Ridha et al., 2008; Schott et al., 2008).
In amnestic MCI subjects as a group, MRI studies show a similar pattern of brain atrophy to that observed in AD (Jack et al., 2000; Chetelat et al., 2002; Karas et al., 2004; Bell-McGinty et al., 2005; Whitwell et al., 2008) and rates of whole-brain atrophy are around 1% per year, between AD and control subjects (Jack et al., 2004). Whole-brain atrophy rate in MCI is associated with impaired cognitive performance (Evans et al., 2010) and predicts progression to AD dementia (Spulber et al., 2008). Whole-brain techniques have also shown that higher rates of atrophy in specific areas such as the hippocampus, posterior cingulated gyrus, and superior parietal cortex were associated with incident AD in MCI cases (Chetelat et al., 2005), and hippocampal and basal forebrain volumes in normal subjects predicted future development of AD (Hall et al., 2008). Interestingly, a recent study showed that normal subjects with the AD CSF profile had increased rates of brain atrophy over time, suggesting they may be in the pre-clinical phase of the neurodegenerative process (Schott et al., 2010). Nevertheless, this observation requires a longer follow-up period to demonstrate that this particular group of subjects has a higher risk to develop AD dementia.
Because the most important clinical manifestation of AD is memory loss, the majority of the researchers have focused on the study of hippocampal atrophy as a marker of the disease. Different neuroimaging studies assessing the mesial temporal lobe structures have consistently shown smaller hippocampal volumes in AD patients compared to controls (Pennanen et al., 2004). Measures of hippocampal atrophy correlate well with the degree of cognitive impairment (Jack et al., 2000; Mortimer et al., 2004) and with AD pathology and hippocampal sclerosis in MRI-post-mortem studies (Jagust et al., 2008). Both normal aging and AD have gradual volume loss overtime, but as with whole-brain volume is greater in AD; the annual rate of hippocampal atrophy is 1.41% for healthy controls and 4.66% for AD patients (Barnes et al., 2009). Several studies have shown that hippocampal atrophy measured by MRI predicts conversion from MCI to AD (Jack et al., 1999; Visser et al., 1999, 2002; Geroldi et al., 2006; Devanand et al., 2007; Teipel et al., 2007). A recent meta-analysis showed that this measure could identify MCI converters with a sensitivity of 73% and a specificity of 81% (Yuan et al., 2009). Although decreased entorhinal cortical thickness has been proposed as a predictor of conversion from MCI to AD, measures of decrease hippocampal volume appeared to be a more robust predictor.
There are several limitations for the use of whole-brain or hippocampal volume as a sole biomarker for AD. One of the most important is that small brain volumes can also be seen in normal aging, and consequently, is difficult to separate cases with early AD from normal controls. On the other hand, the rate of change on whole-brain, entorhinal, and hippocampal volumes seemed to be good markers of neurodegeneration and they can be useful in determining the effects of AD therapies, but these techniques are labor intensive and limited to research studies.
Functional Neuroimaging Markers
Brain functional neuroimaging techniques – positron emission tomography (PET) and single photon emission computed tomography (SPECT) – allow a broad range of cerebral functions to be assessed in patients currently living with dementia. Actually, brain metabolism, brain perfusion, and different neurotransmitter systems can be measured with a great variety of PET and SPECT tracers. However, brain metabolism with the glucose analog 2-[18F]-fluoro-2-deoxy-d-glucose (18F-FDG) and brain perfusion with technetium-99m hexamethylpropylamine oxime (99mTc-HMPAO) are the two more widely employed techniques in the evaluation of patients with dementia, both in clinical practice and in research. Brain SPECT with 99mTc-HMPAO studies provide information of the regional cerebral blood flow, and 18F-FDG PET estimates the regional brain rate of glucose consumption, therefore providing information about the pattern of neuronal loss or synapse dysfunction in patients with dementia.
The pattern of SPECT hypoperfusion and PET hypometabolism usually seen AD involves the anterior medial temporal lobes, the posterior cingulate and posterior temporoparietal cortex (Kogure et al., 2000; Ishii et al., 2001; Alexander et al., 2002; Bradley et al., 2002). Nevertheless, SPECT seems to be less accurate than PET for the diagnosis of AD. One autopsy study found that this technique alone had a sensitivity of 63% and a specificity of 93% to diagnose AD (Jagust et al., 2001). On the other hand, SPECT seemed to be useful differentiating AD from other dementias. The sensitivity of this procedure discriminating AD from FTD was 71.5% and the specificity was 78.2%, while its sensitivity and specificity to differentiate AD from vascular dementia were 71.3 and 75.9%, respectively (Dougall et al., 2004). In MCI patients, SPECT has shown that can predict conversion to AD with a test accuracy of 82% (Huang et al., 2007).
Positron emission tomography studies in early AD have shown a pattern of reduced metabolism in the posterior cingulate (Minoshima et al., 1997) and mesial temporal cortices. As the disease progresses, there is a greater involvement of the parietotemporal and frontal cortices (Ishii et al., 2001; Silverman et al., 2001; Alexander et al., 2002; Drzezga et al., 2003). This progression of the areas of hypometabolism correlated with cognitive deterioration over time as measured by neuropsychological tests (Engler et al., 2006; Kadir et al., 2010) and dementia severity scales (Foster et al., 1984; Minoshima et al., 1995; Silverman et al., 2001; Mosconi et al., 2005). A meta-analysis showed that pooled 18F-FDG PET sensitivity and specificity to differentiate AD patients from normal subjects were 86% in both cases, but the variability was important between the studies (sensitivity from 61 to 100% and specificity from 54 to 100%; Patwardhan et al., 2004). PET also seems to be a good tool to differentiate AD from other forms of dementia. In an autopsy confirmed study, the presence of occipital hypometabolism was able to distinguish DLB from AD with 90% sensitivity and 80% specificity (Minoshima et al., 2001). This technique also has a high specificity and sensibility to differentiate AD and FTD (Koeppe et al., 2005; Foster et al., 2007; Panegyres et al., 2009).
18F-FDG PET appears to be a promising instrument to discriminate those patients with MCI who will progress to AD dementia. These patients show a medial temporal and posterior cingulate cortices hypometabolism compared with healthy controls (Chetelat et al., 2003; Anchisi et al., 2005; Drzezga et al., 2005). A recent meta-analysis has also shown that 18F-FDG PET performs slightly better than SPECT and structural MRI in identifying the prodromal phase of AD in patients with a clinical diagnosis of MCI (pooled sensitivity of 89% and specificity of 85%; Yuan et al., 2009). Interestingly, similar metabolic reductions in the same regions as those found in MCI and AD patients have been seen in asymptomatic subjects at risk of AD, i.e., in persons with subjective memory complains (Caselli et al., 2008), carriers of an apolipoprotein E ε4 (ApoE4) allele (Reiman et al., 1996, 2001, 2004, 2005), with abnormalities in the CSF markers (Petrie et al., 2009), or with a maternal history of AD (Mosconi et al., 2007, 2009). Furthermore, hippocampal hypometabolism during normal aging predicted cognitive decline years in advance of the clinical diagnosis (de Leon et al., 2001; Jagust et al., 2006; Mosconi et al., 2008). Taken together, these data indicate that 18F-FDG PET has high sensitivity to distinguish AD from controls and from other dementing entities, and also to identify subjects at high AD risk. Consequently, the PET AD pattern has been incorporated into the new clinical criteria for prodromal AD (Dubois et al., 2007), pre-clinical AD (Sperling et al., 2011), and MCI due to AD (Albert et al., 2011).
Molecular Neuroimaging Markers
The development of PET radiotracers that bind to brain amyloid has revolutionized the use of neuroimaging techniques in patients with dementia. These molecules allow the localization of AD pathology in vivo, and have helped to further our understanding of the underlying biology of AD. The most actively tested tracers are N-methyl-[11C]2-(4′-methylaminophenyl)-6-hydroxybenzothiazole (11C-PIB; Klunk et al., 2003), (E)-4-(2-(6-(2-(2-(2-(18)F-fluoroethoxy)ethoxy)ethoxy)pyridin-3-yl)vinyl)-N-methyl benzenamine (18F-AV-45; Choi et al., 2009) and 2-(1-96-(2-18F-fluoroethyl)(methyl)amino)-2-naphthyl)ethyldene) malono nitrile (18F-FDDNP; Small et al., 2006; Shin et al., 2008), but there are multiple 11C and 18F compounds under investigation such as trans-4-(N-methyl-amino)-4′-{2-[2-(2-[18F]fluoro-ethoxy)-ethoxy]-ethoxy}-stilbene (18F-BAY94-9172; Rowe et al., 2008), 4-N-[11C-methyl]amino-4′-hydroxystilbene (11C-SB-13; Verhoeff et al., 2004) and 2-(2-[2-dimethylaminothiazol-5-yl]ethenyl)-6-(2-[fluoro]ethoxy)benzoxazole (11C-BF-227; Kudo et al., 2007). While 11C have better affinity for fibrillar amyloid than 18F compounds, the former have a very short life, which limits its use to centers with an available cyclotron that can produce them. Among these tracers, 11C-PIB is the most widely used and best characterized. This thioflavin-T derived binds fibrillar Aβ with high affinity and its brain retention correlates well with levels of amyloid in AD brain tissue (Mathis et al., 2002, 2003; Klunk et al., 2004; Ikonomovic et al., 2008; Leinonen et al., 2008).
Positron emission tomography studies with 11C-PIB have demonstrated an increased retention of this tracer in frontal and parietotemporal cortices, as well as in the striatum of almost all AD patients compared with controls (Klunk et al., 2004; Edison et al., 2006; Rowe et al., 2007). However, it is important to note that a positive 11C-PIB PET scan can also be seen in other entities, often misdiagnosed as AD, such as DLB and cerebral amyloid angiopathy (Edison et al., 2008; Gomperts et al., 2008; Dierksen et al., 2010). 11C-PIB retention in AD correlates with rates of whole-brain atrophy (Archer et al., 2006), parietotemporal hypometabolism on 18F-FDG PET (Klunk et al., 2004; Edison et al., 2006; Engler et al., 2006), and decreased CSF Aβ42 levels (Fagan et al., 2006; Grimmer et al., 2009; Jagust et al., 2009). There are few longitudinal studies using amyloid ligands, and the observation time has been relatively short, because these techniques have only been available for research since 2004. Recent longitudinal studies in AD patients assessing amyloid load and progression of neurodegeneration using structural MRI or 18F-FDG PET found that 11C-PIB retention was relatively stable over time, while neurodegenerative markers worsen in parallel with cognitive decline (Engler et al., 2006; Jack et al., 2009; Scheinin et al., 2009; Kadir et al., 2010). These findings are consistent with the hypothesis that there is dissociation between the amyloid deposition and the neurodegenerative process, where amyloid accumulation precedes the clinical symptoms and reaches its maximum detectable level before the cognitive deficits are evident (Jack et al., 2010a). However, another recent study has shown increases of 11C-PIB retention in mild to moderate AD dementia, questioning this hypothesis and suggesting that Aβ deposition might slow down in the later stages of the disease, but it is still present (Villemagne et al., 2011).
In MCI patients, 11C-PIB PET shows a bimodal distribution with some subjects having a pattern of retention similar to AD patients and others similar to control subjects (Pike et al., 2007; Rowe et al., 2007; Jack et al., 2009; Wolk et al., 2009). In these patients, the Aβ burden is related to episodic memory impairment but not to other cognitive tasks (Pike et al., 2007). The PIB-positive MCI subjects are more likely to carry an ApoE4 allele and to progress to AD (Pike et al., 2007; Forsberg et al., 2008; Okello et al., 2009; Wolk et al., 2009; Jack et al., 2010b). Factors that seem to influence a shorter time to progression in PIB-positive subjects is the presence of hippocampal atrophy, higher 11C-PIB retention values and having an ApoE4 allele (Okello et al., 2009; Jack et al., 2010b; Koivunen et al., 2011). Longitudinal studies assessing changes in 11C-PIB retention in MCI patients are contradictory. Jack et al. (2009) rescanned MCI subjects after a single year, but only a minimal change has seen in this group of persons. However, Villemagne et al. (2011) have shown small but significant increases in 11C-PIB cortical retention in MCI patients from the baseline studies to scans to those performed from 20 months to 3 years later; other studies have reported similar results (Kadir et al., 2010; Koivunen et al., 2011).
In agreement with autopsy data (Price and Morris, 1999), approximately 20–30% of elderly cognitively normal subjects show some degree of 11C-PIB retention, mainly in the prefrontal cortex, posterior cingulate and precuneus regions (Mintun et al., 2006; Pike et al., 2007; Rowe et al., 2007; Aizenstein et al., 2008). In fact, the proportion of 11C-PIB-positive healthy control subjects increases with age (Morris et al., 2010). In these subjects, some studies have reported a strong relationship between impaired episodic memory performance and 11C-PIB binding that could be modified by cognitive reserve (Pike et al., 2007; Mormino et al., 2009; Rentz et al., 2010), but some others have not found this association (Mintun et al., 2006; Jack et al., 2008b; Stornadt et al., 2009). Studies directly relating structural MRI data to Aβ burden in control subjects has yield contradictory results. Some authors have reported reduced hippocampal volume (Mormino et al., 2009; Stornadt et al., 2009), a cortical thinning pattern consistent with early AD (Dickerson et al., 2008; Becker et al., 2010) and an increased rate of brain atrophy (Scheinin et al., 2009), while others have found brain atrophy only in 11C-PIB-positive subjects or in normal individuals with subjective cognitive impairment (Chetelat et al., 2010). There are only two longitudinal studies reporting progression of cognitively normal subjects scanned with 11C-PIB PET to symptomatic AD. In one study, Morris et al. (2009) reported that the relative risk of conversion from cognitive normal to AD was increased almost five-fold with a 11C-PIB-positive PET scan. Villemagne et al. (2011) performed serial 11C-PIB PET scans in a group of normal subjects and found that 25% of individuals with a positive scan developed MCI or AD dementia by 3 years. In addition, the authors also reported an increase in 11C-PIB brain retention in those control subjects with a positive baseline scan, suggesting a slow process of Aβ accumulation in the brain over time (Villemagne et al., 2011). These data are consistent with the hypothesis that amyloid imaging can detect Aβ accumulation in advance of the onset of dementia (Jack et al., 2010a), although more longitudinal studies are required to determinate the sequence of pathological events in the process from normalcy to AD. Figure 3 shows the spectrum of amyloid deposition in normal controls, MCI and AD cases, as measured with 11C-PIB PET (Mathis et al., 2007).
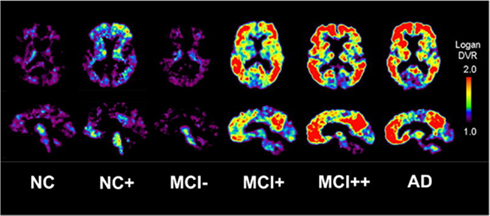
Figure 3. Transaxial and sagittal planes of 11C-PIB PET scans in a normal control (NC), a 11C-PIB-positive NC (NC+), 11C-PIB-negative MCI subject (MCI−), a 11C-PIB-positive MCI subject (MCI+), a highly 11C-PIB-positive MCI subject (MCI++), and a 11C-PIB-positive AD patient (AD). Reprinted from Mathis et al. (2007).
Although amyloid imaging is a relatively new technique, we can state that it accurately detects Aβ accumulation in the brain. However, it has been reported the case of a patient clinically diagnosed of mild AD with a negative 11C-PIB PET scan, where low levels of amyloid pathology at autopsy were found (Cairns et al., 2009). On the other hand, there are not reported cases of subjects with a positive amyloid PET without presence of Aβ at autopsy. These data suggests that 11C-PIB PET is a technique with high specificity and positive predictive value for early AD diagnosis. Nevertheless, having an 11C-PIB-positive scan does not mean to be at a pre-dementia stage of AD, and the prognostic value of increased Aβ load on PET has to be established with more extensive longitudinal studies. In this scenario, adding techniques that assess functional brain changes suggesting early AD could be of special interest. Definitely, the information obtained with current amyloid tracers will bring to light important issues in the biology of amyloid deposition in the transition from normal to AD.
Conclusion
In this review, several potential AD biomarkers in different modalities have been highlighted. Current data suggest that diagnosis of AD can be enhanced by use of these promising biomarkers to increase accuracy and identify early stages of the disease. Each of these biomarkers seems to indicate a specific process in AD, so that amyloid imaging and decreased CSF Aβ42 are indicators of brain amyloid burden, while CSF tau, brain atrophy and brain metabolism are biomarkers of the neurodegenerative process. Some authors have proposed a model of disease in which there is timing for the use of different biomarkers (Jack et al., 2010a). The AD pathologic cascade appears to have a sequential two stage process initiated by amyloid accumulation and followed by neuronal pathology. To validate this hypothesis and the right use of biomarkers in the clinical practice, it is necessary to determine the dynamics of the amyloid process with other biomarkers at the different stages of the disease. An early AD diagnosis could enable to administer treatments with potential disease-modifying effect before neurodegeneration becomes severe.
Conflict of Interest Statement
The authors declare that the research was conducted in the absence of any commercial or financial relationships that could be construed as a potential conflict of interest.
Acknowledgments
Mario Riverol is supported by a grant from Fundación Caja Madrid (Spain). Oscar L. López is supported in part by grants AG200098 and AG05133-27 from the National Institute on Aging.
References
Aizenstein, H. J., Nebes, R. D., Saxton, J. A., Price, J. C., Mathis, C. A., Tsopelas, N. D., Ziolko, S. K., James, J. A., Snitz, B. E., Houck, P. R., Bi, W., Cohen, A. D., Lopresti, B. J., DeKosky, S. T., Halligan, E. M., and Klunk, W. E. (2008). Frequent amyloid deposition without significant cognitive impairment among the elderly. Arch. Neurol. 65, 1509–1517.
Albert, M. S., Dekosky, S. T., Dickson, D., Dubois, B., Feldman, H. H., Fox, N. C., Gamst, A., Holtzman, D. M., Jagust, W. J., Petersen, R. C., Snyder, P. J., Carrillo, M. C., Thies, B., and Phelps, C. H. (2011). The diagnosis of mild cognitive impairment due to Alzheimer’s disease: recommendations from the National Institute on Aging and Alzheimer’s Association workgroup. Alzheimers Dement. 7, 270–279.
Alexander, G. E., Chen, K., Pietrini, P., Rapoport, S. I., and Reiman, E. M. (2002). Longitudinal PET evaluation of cerebral metabolic decline in dementia: a potential outcome measure in Alzheimer’s disease treatment studies. Am. J. Psychiatry 159, 738–745.
Anchisi, D., Borroni, E., Franceschi, M., Kerrouche, N., Kalbe, E., Beuthien-Beumann, B., and Cappa, S. (2005). Heterogeneity of brain glucose metabolism in mild cognitive impairment and clinical progression to Alzheimer’s disease. Arch. Neurol. 62, 1728–1733.
Andreasen, N., Minthon, L., Davidson, P., Vanmechelen, E., Vanderstichele, H., Winblad, B., and Blennow, K. (2001). Evaluation of CSF-tau and CSF-alpha beta 42 as diagnostic markers for Alzheimer disease in clinical practice. Arch. Neurol. 58, 373–379.
Andreasen, N., Minthon, L., Vanmechelen, E., Vanderstichele, H., Davidsson, P., Winblad, B., and Blennow, K. (1999). Cerebrospinal fluid tau and Abeta42 as predictors of development of Alzheimer’s disease in patients with mild cognitive impairment. Neurosci. Lett. 273, 5–8.
APA. (2000). Diagnostic and Statistical Manual of Mental Disorders DSM-IV-TR Fourth Edition (Text Revision). Washington, DC: American Psychiatric Association.
Arai, H., Terajima, M., Miura, M., Higuchi, S., Muramatsu, T., Machida, N., Seiki, H., Takase, S., Clark, C. M., and Lee, V. M. (1995). Tau in cerebrospinal fluid: a potential diagnostic marker in Alzheimer’s disease. Ann. Neurol. 38, 649–652.
Archer, H. A., Edison, P., Brooks, D. J., Barnes, J., Frost, C., Yeatman, T., Fox, N. C., and Rossor, M. N. (2006). Amyloid load and cerebral atrophy in Alzheimer’s disease: an 11C-PIB positron emission tomography study. Ann. Neurol. 60, 145–147.
Ashburner, J., and Friston, K. J. (2000). Voxel-based morphometry – the methods. Neurology 11, 805–821.
Ballard, C., Gauthier, S., Corbett, A., Brayne, C., Aarsland, D., and Jones, E. (2011). Alzheimer’s disease. Lancet 377, 1019–1031.
Barnes, J., Bartlett, J. W., van de Pol, L. A., Loy, C. T., Scahill, R. I., Frost, C., Thompson, P., and Fox, N. C. (2009). A meta-analysis of hippocampal atrophy rates in Alzheimer’s disease. Neurobiol. Aging 30, 1711–1723.
Becker, J. A., Hedden, T., Carmasin, J., Maye, J., Rentz, D. M., Putcha, D., Fischl, B., Greve, D. N., Marshall, G. A., Salloway, S., Marks, D., Buckner, R. L., Sperling, R. A., and Johnson, K. A. (2010). Amyloid-beta associated cortical thinning in clinically normal elderly. Ann. Neurol. 69, 1032–1042.
Bell-McGinty, S., Lopez, O. L., Meltzer, C. C., Scanlon, J. M., Whyte, E. M., DeKosky, S. T., and Becker, J. T. (2005). Differential cortical atrophy in subgroups of mild cognitive impairment. Arch. Neurol. 62, 1393–1397.
Bian, H., Van Swieten, J. C., Leight, S., Massimo, L., Wood, E., Forman, M., Moore, P., de Koning, I., Clark, C. M., Rosso, S., Trojanowski, J., Lee, V. M., and Grossman, M. (2008). CSF biomarkers in frontotemporal lobar degeneration with known pathology. Neurology 70, 1827–1835.
Bibl, M., Mollenhauer, B., Esselmann, H., Lewczuk, P., Klafki, H. W., Sparbier, K., Smirnov, A., Cepek, L., Trenkwalder, C., Ruther, E., Kornhuber, J., Otto, M., and Wiltfang, J. (2006). CSF amyloid-beta-peptides in Alzheimer’s disease, dementia with Lewy bodies and Parkinson’s disease dementia. Brain 129, 1177–1187.
Blennow, K., Hampel, H., Weiner, M., and Zetterberg, H. (2010). Cerebrospinal fluid and plasma biomarkers in Alzheimer disease. Nat. Rev. Neurol. 6, 131–144.
Blennow, K., Wallin, A., Agren, H., Spenger, C., Siegfried, J., and Vanmechelen, E. (1995). Tau protein in cerebrospinal fluid: a biochemical marker for axonal degeneration in Alzheimer disease? Mol. Chem. Neuropathol. 26, 231–245.
Bobinski, M., de Leon, M. J., Wegiel, J., Desanti, S., Convit, A., Saint Louis, L. A., Rusinek, H., and Wisniewski, H. M. (2000). The histological validation of post mortem magnetic resonance imaging-determined hippocampal volume in Alzheimer’s disease. Neuroscience 95, 721–725.
Braak, H., and Braak, E. (1991). Neuropathological stageing of Alzheimer-related changes. Acta Neuropathol. 82, 239–259.
Bradley, K. M., O’Sullivan, V. T., Soper, N. D. W., Nagy, Z., King, E. M.-F., Smith, A. D., and Shepstone, B. J. (2002). Cerebral perfusion SPET correlated with Braak pathological stage in Alzheimer’s disease. Brain 125, 1772–1781.
Brookmeyer, R., Gray, S., and Kawas, C. (1998). Projections of Alzheimer’s disease in the United States and the public health impact of delaying disease onset. Am. J. Public Health 88, 1337–1342.
Brooks, L. G., and Loewenstein, D. A. (2010). Assessing the progression of mild cognitive impairment to Alzheimer’s disease: current trends and future directions. Alzheimers Res. Ther. 2, 28.
Brys, M., Pirraglia, E., Rich, K., Rolstad, S., Mosconi, L., Switalski, R., Glodzik-Sobanska, L., De Santi, S., Zinkowski, R., Mehta, P., Pratico, D., Saint Louis, L. A., Wallin, A., Blennow, K., and de Leon, M. J. (2009). Prediction and longitudinal study of CSF biomarkers in mild cognitive impairment. Neurobiol. Aging 30, 682–690.
Buerger, K., Ewers, M., Pirttila, T., Zinkowski, R., Alafuzoff, I., Teipel, S. J., DeBernardis, J., Kerkman, D., McCulloch, C., Soininen, H., and Hampel, H. (2006a). CSF phosphorylated tau protein correlates with neocortical neurofibrillary pathology in Alzheimer’s disease. Brain 129, 3035–3041.
Buerger, K., Otto, M., Teipel, S. J., Zinkowski, R., Blennow, K., DeBernardis, J., Kerkman, D., Schroder, J., Schonknecht, P., Cepek, L., McCulloch, C., Moller, H. J., Wiltfang, J., Kretzschmar, H., and Hampel, H. (2006b). Dissociation between CSF total tau and tau protein phosphorylated at threonine 231 in Creutzfeldt-Jakob disease. Neurobiol. Aging 27, 10–15.
Buerger, K., Teipel, S. J., Zinkowski, R., Blennow, K., Arai, H., Engel, R., Hoffmann-Kiefer, K., McCulloch, C., Ptok, U., Heun, R., Andreasen, N., DeBernardis, J., Kerkman, D., Moeller, H.-J., Davies, P., and Hampel, H. (2002). CSF tau protein phosphorylated at threonine 231 correlates with cognitive decline in MCI subjects. Neurology 59, 627–629.
Burton, E. J., Barber, R., Mukaetova-Ladinska, E. B., Robson, J., Perry, R. H., Jaros, E., Kalaria, R. N., and O’Brien, J. T. (2009). Medial temporal lobe atrophy on MRI differentiates Alzheimer’s disease from dementia with Lewy bodies and vascular cognitive impairment: a prospective study with pathological verification of diagnosis. Brain 132, 195–203.
Cairns, N. J., Ikonomovic, M. D., Benzinger, T., Storandt, M., Fagan, A. M., Shah, A. R., Reinwald, L. T., Carter, D., Felton, A., Holtzman, D. M., Mintun, M. A., Klunk, W. E., and Morris, J. C. (2009). Absence of Pittsburgh compound B detection of cerebral amyloid beta in a patient with clinical, cognitive, and cerebrospinal fluid markers of Alzheimer disease: a case report. Arch. Neurol. 66, 1557–1562.
Caselli, R. J., Chen, K., Lee, W., Alexander, G. E., and Reiman, E. M. (2008). Correlating cerebral hypometabolism with future memory decline in subsequent converters to amnestic pre-mild cognitive impairment. Arch. Neurol. 65, 1231–1236.
Chetelat, G., Desgranges, B., de la Sayette, V., Viader, F., Eustache, F., and Baron, J.-C. (2002). Mapping gray matter loss with voxel-based morphometry in mild cognitive impairment. Neuroreport 13, 1939–1943.
Chetelat, G., Desgranges, B., de la Sayette, V., Viader, F., Eustache, F., and Baron, J.-C. (2003). Mild cognitive impairment. Can FDG-PET predict who is to rapidly convert to Alzheimer’s disease? Neurology 60, 1374–1377.
Chetelat, G., Landeau, B., Eustache, F., Mezenge, F., Viader, F., de la Sayette, V., Desgranges, B., and Baron, J. C. (2005). Using voxel-based morphometry to map the structural changes associated with rapid conversion in MCI: a longitudinal MRI study. Neuroimage 27, 934–946.
Chetelat, G., Villemagne, V. L., Bourgeat, P., Pike, K. E., Jones, G., Ames, D., Ellis, K. A., Szoeke, C., Martins, R. N., O’Keefe, G. J., Salvado, O., Masters, C. L., and Rowe, C. C. (2010). Relationship between atrophy and beta-amyloid deposition in Alzheimer disease. Ann. Neurol. 67, 317–324.
Choi, S. R., Golding, G., Zhuang, Z., Zhang, W., Lim, N., Hefti, F., Benedum, T. E., Kilbourn, M. R., Skovronsky, D., and Kung, H. F. (2009). Preclinical properties of 18F-AV-45: a PET agent for Abeta plaques in the brain. J. Nucl. Med. 50, 1887–1894.
Cruz de Souza, L., Lamari, F., Belliard, S., Jardel, C., Houillier, C., De Paz, R., Dubois, B., and Sarazin, M. (2011). Cerebrospinal fluid biomarkers in the differential diagnosis of Alzheimer’s disease from other cortical dementias. J. Neurol. Neurosurg. Psychiatr. 82, 240–246.
de Leon, M. J., Convit, A., Wolf, O. T., Tarshish, C. Y., DeSanti, S., Rusinek, H., Tsui, W., Kandil, E., Scherer, A. J., Roche, A., Imossi, A., Thorn, E., Bobinski, M., Caraos, C., Lesbre, P., Schlyer, D., Poirier, J., Reisberg, B., and Fowler, J. (2001). Prediction of cognitive decline in normal elderly subjects with 2-[18F]fluoro-deoxy-D-glucose/positron-emission tomography (FDG/PET). Proc. Natl. Acad. Sci. U.S.A. 98, 10966–10971.
De Meyer, G., Shapiro, F., Vanderstichele, H., Vanmechelen, E., Engelborghs, S., De Deyn, P. P., Coart, E., Hansson, O., Minthon, L., Zetterberg, H., Blennow, K., Shaw, L., and Trojanowski, J. Q. (2010). Diagnosis-independent Alzheimer disease biomarker signature in cognitively normal elderly people. Arch. Neurol. 67, 949–956.
Devanand, D. P., Pradhaban, G., Liu, X., Khandji, A., DeSanti, S., Segal, S., Rusineck, H., Pelton, G. H., Honig, L. S., Mayeux, R., Stren, Y., Tabert, M. H., and de Leon, M. J. (2007). Hippocampal and entorhinal atrophy in mild cognitive impairment. Prediction of Alzheimer disease. Neurology 68, 828–836.
Dickerson, B. C., Bakkour, A., Salat, D. H., Feczko, E., Pacheco, J., Greve, D. N., Grodstein, F., Wright, C. I., Blacker, D., Rosas, H. D., Sperling, R. A., Atri, A., Growdon, J. H., Hyman, B. T., Morris, J. C., Fischl, B., and Buckner, R. L. (2008). The cortical signature of Alzheimer’s disease: regionally specific cortical thinning relates to symptom severity in very mild to mild AD dementia and is detectable in asymptomatic amyloid-positive individuals. Cereb. Cortex 19, 497–510.
Dierksen, G. A., Skehan, M. E., Khan, M. A., Jeng, J., Nandigam, R. N., Becker, J. A., Kumar, A., Neal, K. L., Betensky, R. A., Frosch, M. P., Rosand, J., Johnson, K. A., Viswanathan, A., Salat, D. H., and Greenberg, S. M. (2010). Spatial relation between microbleeds and amyloid deposits in amyloid angiopathy. Ann. Neurol. 68, 545–548.
Dougall, N. J., Bruggink, S., and Ebmeier, K. P. (2004). Systematic review of the diagnostic accuracy of 99-m-Tc-HMPAO-SPECT in dementia. Psychiatry 12, 554–570.
Drzezga, A., Grimmer, T., Riemenschneider, M., Lautenschlager, N., Siebner, H., Alexopolous, P., Minoshima, S., Schwaiger, M., and Kurz, A. (2005). Prediction of individual clinical outcome in MCI by means of genetic assessment and (18)-FDG PET. J. Nucl. Med. 46, 1625–1632.
Drzezga, A., Lautenschlager, N., Siebner, H., Riemenschneider, M., Willoch, F., Minoshima, S., Schwaiger, M., and Kurz, A. (2003). Cerebral metabolic changes accompanying conversion of mild cognitive impairment into Alzheimer’s disease: a PET follow-up study. Eur. J. Nucl. Med. Mol. Imaging 30, 1104–11013.
Du, A. T., Schuff, N., Amend, D., Laakso, M. P., Hsu, Y. Y., Jagust, W. J., Yaffe, K., Framer, J. H., Reed, B., Norman, D., Chui, H. C., and Weiner, M. W. (2001). Magnetic resonance imaging of the entorhinal cortex and hippocampus in mild cognitive impairment and Alzheimer’s disease. J. Neurol. Neurosurg. Psychiatr. 71, 441–447.
Dubois, B., Feldman, H. H., Jacova, C., Dekosky, S. T., Barberger-Gateau, P., Cummings, J., Delacourte, A., Galasko, D., Gauthier, S., Jicha, G., Meguro, K., O’Brien, J., Pasquier, F., Robert, P., Rossor, M., Salloway, S., Stern, Y., Visser, P. J., and Scheltens, P. (2007). Research criteria for the diagnosis of Alzheimer’s disease: revising the NINCDS-ADRDA criteria. Lancet Neurol. 6, 734–746.
Edison, P., Archer, A., Hinz, R., Hammers, A., Pavese, N., Tai, Y. F., Hotton, G., Cutler, D., Fox, N. C., Kennedy, A., Rossor, M., and Brooks, D. J. (2006). Amyloid, hypometabolism, and cognition in Alzheimer disease. An [11C] PIB and [18F] FDG PET study. Neurology 67, 1–8.
Edison, P., Rowe, C. C., Rinne, J. O., Ng, S., Ahmed, I., Kemppainen, N., Villemagne, V. L., O’Keefe, G., Nagren, K., Chaudhury, K. R., Masters, C. L., and Brooks, D. J. (2008). Amyloid load in Parkinson’s disease dementia and Lewy body dementia measured with [11C]PIB positron emission tomography. J. Neurol. Neurosurg. Psychiatr. 79, 1331–1338.
Engler, H., Forsberg, A., Almkvist, O., Blomquist, G., Larsson, E., Savitcheva, I., Wall, A., Ringheim, A., Langstrom, B., and Nordberg, A. (2006). Two-year follow-up of amyloid deposition in patients with Alzheimer’s disease. Brain 129, 2856–2866.
Evans, M. C., Barnes, J., Nielsen, C., Kim, L. G., Clegg, S. L., Blair, M., Leung, K. K., Douiri, A., Boyes, R. G., Ourselin, S., and Fox, N. C. (2010). Volume changes in Alzheimer’s disease and mild cognitive impairment: cognitive associations. Eur. Radiol. 20, 674–682.
Ewers, M., Buerger, K., Teipel, S. J., Scheltens, P., Schroder, J., Zinkowski, R. P., Bouwman, F. H., Schonknecht, P., Schoonenboom, N. S., Andreasen, N., Wallin, A., DeBernardis, J. F., Kerkman, D. J., Heindl, B., Blennow, K., and Hampel, H. (2007). Multicenter assessment of CSF-phosphorylated tau for the prediction of conversion of MCI. Neurology 69, 2205–2212.
Fagan, A. M., Head, D., Shah, A. R., Marcus, D., Mintun, M., Morris, J. C., and Holtzman, D. M. (2009). Decreased cerebrospinal fluid Abeta(42) correlates with brain atrophy in cognitively normal elderly. Ann. Neurol. 65, 176–183.
Fagan, A. M., Mintun, M. A., Mach, R. H., Lee, S. Y., Dence, C. S., Shah, A. R., LaRossa, G. N., and Spinner, M. L. (2006). Inverse relation between in vivo amyloid imaging load and cerebrospinal fluid Abeta42 in humans. Ann. Neurol. 59, 512–519.
Fagan, A. M., Roe, C. M., Xiong, C., Mintun, M. A., Morris, J. C., and Holtzman, D. M. (2007). Cerebrospinal fluid tau/beta-amyloid12 ratio as a prediction of cognitive decline in nondemented older adults. Arch. Neurol. 64, 343–349.
Ferri, C. P., Prince, M., Brayne, C., Brodaty, H., Frataglioni, L., Ganguli, M., Hall, K., Hasegawa, K., Hendrie, H., Huang, Y., Jorm, A., Mathers, C., Menezes, P. R., Rimmer, E., and Scazufca, M. (2005). Global prevalence of dementia: a Delphi consensus study. Lancet 366, 2112–2117.
Fjell, A. M., Walhovd, K. B., Fennema-Notestine, C., McEvoy, L. K., Hagler, D. J., Holland, D., Brewer, J. B., and Dale, A. M. (2010). CSF biomarkers in prediction of cerebral and clinical change in mild cognitive impairment and Alzheimer’s disease. J. Neurosci. 30, 2088–2101.
Forsberg, A., Engler, H., Almkvist, O., Blomquist, G., Hagman, G., Wall, A., Ringheim, A., Langstrom, B., and Nordberg, A. (2008). PET imaging of amyloid deposition in patients with mild cognitive impairment. Neurobiol. Aging 29, 1456–1465.
Foster, N. L., Chase, T. N., Mansi, L., Brooks, R., Fedio, P., Patronas, N. J., and DiChiro, G. (1984). Cortical abnormalities in Alzheimer’s disease. Ann. Neurol. 16, 649–654.
Foster, N. L., Heidebrink, J. L., Clark, C. M., Jagust, W. J., Arnold, S. E., Barbas, N. R., DeCarli, C. S., Turner, R. S., Koeppe, R. A., Higdon, R., and Minoshima, S. (2007). FDG-PET improves accuracy in distinguishing frontotemporal dementia and Alzheimer’s disease. Brain 130, 2616–2635.
Galasko, D., Chang, L., Motter, R., Clark, C. M., Kaye, J., Knopman, D., Thomas, R., Kholodenko, D., Schenk, D., Lieberburg, I., Miller, B., Green, R., Basherad, R., Kertiles, L., Boss, M. A., and Seubert, P. (1998). High cerebrospinal fluid tau and low amyloid beta42 levels in the clinical diagnosis of Alzheimer disease and relation to apolipoprotein E genotype. Arch. Neurol. 55, 937–945.
Ganguli, M., Dodge, H. H., Shen, C., and DeKosky, S. T. (2004). Mild cognitive impairment, amnestic type: an epidemiologic study. Neurology 63, 115–121.
Geroldi, C., Rossi, R., Calvagna, C., Testa, C., Bresciani, L., Binetti, G., Zanetti, O., and Frisoni, G. B. (2006). Medial temporal atrophy but not memory deficit predicts progression to dementia in patients with mild cognitive impairment. J. Neurol. Neurosurg. Psychiatr. 77, 1219–1222.
Gomez-Isla, T., Hollister, R., West, H., Mui, S., Growdom, J. H., and Petersen, R. C. (1997). Neuronal loss correlates with but exceeds neurofibrillary tangles in Alzheimer’s disease. Ann. Neurol. 41, 17–24.
Gomperts, S. N., Rentz, D. M., Moran, E., Becker, J. A., Locascio, J. J., Klunk, W. E., Mathis, C. A., Elmaleh, D. R., Shoup, T., Fischman, A. J., Hyman, B. T., Growdon, J. H., and Johnson, K. A. (2008). Imaging amyloid deposition in Lewy body diseases. Neurology 71, 903–910.
Good, C. D., Scahill, R. T., Fox, N. C., Ashburner, J., Friston, K. J., Chan, D., Grum, W. R., Rossor, M. N., and Frackowiak, R. S. J. (2001). Automatic differentiation of anatomical patterns in the human brain. Validation with studies of degenerative dementias. Neuroimage 17, 29–46.
Grimmer, T., Riemenschneider, M., Forstl, H., Henriksen, G., Klunk, W. E., Mathis, C. A., Shiga, T., Wester, H. J., Kurz, A., and Drzezga, A. (2009). Beta amyloid in Alzheimer’s disease: increased deposition in brain is reflected in reduced concentration in cerebrospinal fluid. Biol. Psychiatry 65, 927–934.
Gustafson, D. R., Skoog, I., Rosengren, L., Zetterberg, H., and Blennow, K. (2007). Cerebrospinal fluid beta-amyloid 1-42 concentration may predict cognitive decline in older women. J. Neurol. Neurosurg. Psychiatr. 78, 461–464.
Hall, A. M., Moore, R. Y., Lopez, O. L., Kuller, L. H., and Becker, J. T. (2008). Basal forebrain atrophy is a presymptomatic marker for Alzheimer’s disease. Alzheimers Dement. 4, 271–279.
Hampel, H., Buerger, K., Zinkowski, R., Teipel, S. J., Goernitz, A., Andreasen, N., Sjoegren, M., DeBernardis, J., Kerkman, D., Ishiguro, K., Ohno, H., Vanmechelen, E., Vanderstichele, H., McCulloch, C., Moller, H. J., Davies, P., and Blennow, K. (2004a). Measurement of phosphorylated tau epitopes in the differential diagnosis of Alzheimer disease: a comparative cerebrospinal fluid study. Arch. Gen. Psychiatry 61, 95–102.
Hampel, H., Mitchell, A., Blennow, K., Frank, R. A., Brettschneider, S., Weller, L., and Moller, H. J. (2004b). Core biological marker candidates of Alzheimer’s disease – perspectives for diagnosis, prediction of outcome and reflection of biological activity. J. Neural Transm. 111, 247–272.
Hampel, H., Teipel, S. J., Fuchsberger, T., Andreasen, N., Wiltfang, J., Otto, M., Shen, Y., Dodel, R., Du, Y., Farlow, M., Moller, H. J., Blennow, K., and Buerger, K. (2004c). Value of CSF beta-amyloid1-42 and tau as predictors of Alzheimer’s disease in patients with mild cognitive impairment. Mol. Psychiatry 9, 705–710.
Hampel, H., Burger, K., Pruessner, J. C., Zinkowski, R., DeBernardis, J., Kerkman, D., Leinsinger, G., Evans, A. C., Davies, P., Muller, H.-J., and Teipel, S. J. (2005). Correlation of cerebrospinal fluid levels of tau protein phosphorylated at threonine 231 with rates of hippocampal atrophy in Alzheimer disease. Arch. Neurol. 62, 770–773.
Hansson, O., Zetterberg, H., Buchhave, P., Londos, E., Blennow, K., and Minthon, L. (2006). Association between CSF biomarkers and incipient Alzheimer’s disease in patients with mild cognitive impairment: a follow-up study. Lancet Neurol. 5, 228–234.
Henneman, W. J., Sluimer, J. D., Barnes, J., van der Flier, W. M., Sluimer, I. C., Fox, N. C., Scheltens, P., Vrenken, H., and Barkhof, F. (2009). Hippocampal atrophy rates in Alzheimer disease: added value over whole brain volume measures. Neurology 72, 999–1007.
Huang, C., Eidelberg, D., Habeck, C., Moeller, J., Svensson, L., Tarabula, T., and Julin, P. (2007). Imaging markers of mild cognitive impairment: multivariate analysis of CBF SPECT. Neurobiol. Aging 28, 1062–1069.
Hulstaert, F., Blennow, K., Ivanoiu, A., Schoonderwaldt, H. C., Riemenschneider, M., De Deyn, P. P., Bancher, C., Cras, P., Wiltfang, J., Mehta, P. D., Iqbal, K., Pottel, H., Vanmechelen, E., and Vanderstichele, H. (1999). Improved discrimination of AD patients using beta-amyloid(1-42) and tau levels in CSF. Neurology 52, 1555–1562.
Ikonomovic, M. D., Klunk, W. E., Abrahamson, E. E., Mathis, C. A., Price, J. C., Tsopelas, N. D., Lopresti, B. J., Ziolko, S., Bi, W., Paljug, W. R., Debnath, M. L., Hope, C. E., Isanski, B. A., Hamilton, R. L., and DeKosky, S. T. (2008). Post-mortem correlates of in vivo PiB-PET amyloid imaging in a typical case of Alzheimer’s disease. Brain 131, 1630–1645.
Ishii, K., Kawachi, T., Sasaki, H., Kono, A. K., Fukuda, T., Kojima, Y., and Mori, E. (2005). Voxel-based morphometric comparison between early- and late-onset mild Alzheimer’s disease and assessment of diagnostic performance of z score images. AJNR Am. J. Neuroradiol. 26, 333–340.
Ishii, K., Willoch, F., Minoshima, S., Drzezga, A., Ficaro, E. P., Cross, D. J., Kuhl, D. E., and Schwaiger, M. (2001). Statistical brain mapping of 18F-FDG PET in Alzheimer’s disease: validation of anatomic standardization for atrophied brains. J. Nucl. Med. 42, 548–557.
Iwatsubo, T., Odaka, A., Suzuki, N., Mizusawa, H., Nukina, N., and Ihara, Y. (1994). Visualization of A-beta-42(43) and A-beta-40 in senile plaques with end specific A-beta monoclonals: evidence that an initially deposited species as A-beta-42(43). Neuron 13, 45–53.
Jack, C., Petersen, R., Grundman, M., Jin, S., Gamst, A. C., Ward, C. P., Sencakova, D., Doody, R. S., and Thal, L. J. (2008a). Longitudinal MRI findings from the vitamin E and donepezil treatment study for MCI. Neurobiol. Aging 29, 1285–1295.
Jack, C. R. Jr., Lowe, V. J., Senjem, M. L., Weigand, S. D., Kemp, B. J., Shiung, M. M., Knopman, D. S., Boeve, B. F., Klunk, W. E., Mathis, C. A., and Petersen, R. C. (2008b). 11C PiB and structural MRI provide complementary information in imaging of Alzheimer’s disease and amnestic mild cognitive impairment. Brain 131, 665–680.
Jack, C. R. Jr., Knopman, D. S., Jagust, W. J., Shaw, L. M., Aisen, P. S., Weiner, M. W., Petersen, R. C., and Trojanowski, J. Q. (2010a). Hypothetical model of dynamic biomarkers of the Alzheimer’s pathological cascade. Lancet Neurol. 9, 119–128.
Jack, C. R. Jr., Wiste, H. J., Vemuri, P., Weigand, S. D., Senjem, M. L., Zeng, G., Bernstein, M. A., Gunter, J. L., Pankratz, V. S., Aisen, P. S., Weiner, M. W., Petersen, R. C., Shaw, L. M., Trojanowski, J. Q., and Knopman, D. S. (2010b). Brain beta-amyloid measures and magnetic resonance imaging atrophy both predict time-to-progression from mild cognitive impairment to Alzheimer’s disease. Brain 133, 3336–3348.
Jack, C. R. Jr., Lowe, V. J., Weigand, S. D., Wiste, H. J., Senjem, M. L., Knopman, D. S., Shiung, M. M., Gunter, J. L., Boeve, B. F., Kemp, B. J., Weiner, M., and Petersen, R. C. (2009). Serial PIB and MRI in normal, mild cognitive impairment and Alzheimer’s disease: implications for sequence of pathological events in Alzheimer’s disease. Brain 132, 1355–1365.
Jack, C. R., Petersen, R. C., Xu, Y., O’Brien, P. C., Smith, G. E., Ivnik, R. J., Boeve, B. F., Tangalos, E. G., and Kokmen, E. (2000). Rates of hippocampal atrophy correlate with change in clinical status in aging and AD. Neurology 55, 484–489.
Jack, C. R., Petersen, R. C., Xu, Y. C., O’Brien, P. C., Smith, G. E., Ivnik, R. J., Boeve, B. F., Waring, S. C., Tangalos, E. G., and Kokmen, E. (1999). Prediction of AD aith MRI-based hippocampal volume in mild cognitive impairment. Neurology 52, 1397–1403.
Jack, C. R., Shiung, M. M., Gunter, J. L., O’Brien, P. C., Weigand, S. D., Knopman, D. S., Boeve, B. F., Ivnik, R. J., Smith, G. E., Cha, R. H., Tangalos, E. G., and Petersen, R. C. (2004). Comparison of different MRI brain atrophy rate measures with clinical disease progression in AD. Neurology 62, 591–600.
Jagust, W., Thisted, R., Devous, M. D., Van Heertum, R., Mayberg, H., Jobst, K., Smith, A. D., and Borys, N. (2001). SPECT perfusion imaging in the diagnosis of Alzheimer’s disease: a clinical-pathologic study. Neurology 56, 950–956.
Jagust, W., Zheng, L., Harvey, D. J., Mack, W. J., Vinters, H. V., Weiner, M. W., Ellis, W. G., Zarrow, C., Mungas, D., and Reed, B. R. (2008). Neuropathological basis of magnetic resonance images in aging and dementia. Ann. Neurol. 63, 72–80.
Jagust, W. J., Gitcho, A., Sun, F., Kuczynski, B., Mungas, D., and Haan, M. (2006). Brain imaging evidence of preclinical Alzheimer’s disease in normal aging. Ann. Neurol. 59, 673–681.
Jagust, W. J., Landau, S. M., Shaw, L. M., Trojanowski, J. Q., Koeppe, R. A., Reiman, E. M., Foster, N. L., Petersen, R. C., Weiner, M. W., Price, J. C., and Mathis, C. A. (2009). Relationships between biomarkers in aging and dementia. Neurology 73, 1193–1199.
Kadir, A., Almkvist, O., Forsberg, A., Wall, A., Engler, H., Langstrom, B., and Nordberg, A. (2010). Dynamic changes in PET amyloid and FDG imaging at different stages of Alzheimer’s disease. Neurobiol. Aging. doi: 10.1016/j.neurobiolaging.2010.06.015. [Epub ahead of print].
Kapaki, E., Kilidireas, K., Paraskevas, G. P., Michalopoulou, M., and Patsouris, E. (2001). Highly increased CSF tau protein and decreased beta-amyloid (1-42) in sporadic CJD: a discrimination from Alzheimer’s disease? J. Neurol. Neurosurg. Psychiatr. 71, 401–403.
Kapaki, E. N., Paraskevas, G. P., Tzerakis, N. G., Sfagos, C., Seretis, A., Kararizou, E., and Vassilopoulos, D. (2007). Cerebrospinal fluid tau, phospho-tau181 and beta-amyloid1-42 in idiopathic normal pressure hydrocephalus: a discrimination from Alzheimer’s disease. Eur. J. Neurol. 14, 168–173.
Karas, G. B., Burton, E. J., Rombouts, S. A. R. B., van Schijndel, R. A., O’Brien, J. T., Scheltens, P. H., McKeith, I. G., Williams, D., Ballard, C., and Barkhof, F. (2003). A comprehensive study of gray metter loss in patients with Alzheimer’s disease using optimized voxel-based morphometry. Neuroimage 18, 895–907.
Karas, G. B., Scheltens, P., Rombouts, S. A. R. B., Visser, P. J., van Schijndel, R. A., Fox, N. C., and Barkhof, F. (2004). Global and local gray matter loss in mild cognitive impairment and Alzheimer’s disease. Neuroimage 23, 708–716.
Kester, M. I., Blankenstein, M. A., Bouwman, F. H., van Elk, E. J., Scheltens, P., and van der Flier, W. M. (2009). CSF biomarkers in Alzheimer’s disease and controls: associations with APOE genotype are modified by age. J. Alzheimers Dis. 16, 601–607.
Klunk, W. E., Engler, H., Nordberg, A., Wang, Y., Blomqvist, G., Holt, D. P., Bergström, M., Savitcheva, I., Huang, G., and Estrada, S. (2004). Imaging brain amyloid in Alzheimer’s disease with Pittsburgh compound-B. Ann. Neurol. 55, 306–319.
Klunk, W. E., Wang, Y., Huang, G. F., Debnath, M. L., Holt, D. P., Shao, L., Hamilton, R. L., Ikonomovic, M. D., DeKosky, S. T., and Mathis, C. A. (2003). The binding of 2-(4′-methylaminophenyl)benzothiazole to postmortem brain homogenates is dominated by the amyloid component. J. Neurosci. 23, 2086–2092.
Knopman, D. S., DeKosky, S. T., Cummings, J. L., Chui, H., Corey-Bloom, J., Relkin, N., Small, G. W., Miller, B., and Stevens, J. C. (2001). Practice parameter: diagnosis of dementia (an evidence-based review). Report of the Quality Standards Subcommittee of the American Academy of Neurology. Neurology 56, 1143–1153.
Koeppe, R. A., Gilman, S., Joshi, A., Liu, S., Little, R., Junck, L., Heumann, M., Frey, K. A., and Albin, R. L. (2005). 11C-DTBZ and 18F-FDG PET measures in differentiating dementias. J. Nucl. Med. 46, 936–944.
Kogure, D., Matsuda, H., Ohnishi, T., Kumihiro, T., Uno, M., and Takasaki, M. (2000). Longitudinal evaluation of early Alzheimer disease using brain perfusion SPECT. J. Nucl. Med. 41, 1155–1162.
Koivunen, J., Scheinin, N., Virta, J. R., Aalto, S., Vahlberg, T., Nagren, K., Helin, S., Parkkola, R., Viitanen, M., and Rinne, J. O. (2011). Amyloid PET imaging in patients with mild cognitive impairment: a 2-year follow-up study. Neurology 76, 1085–1090.
Koopman, K., Le Bastard, N., Martin, J. J., Nagels, G., De Deyn, P. P., and Engelborghs, S. (2009). Improved discrimination of autopsy-confirmed Alzheimer’s disease (AD) from non-AD dementias using CSF P-tau(181P). Neurochem. Int. 55, 214–218.
Kudo, Y., Okamura, N., Furumoto, S., Tashiro, M., Furukawa, K., Maruyama, M., Itoh, M., Iwata, R., Yanai, K., and Arai, H. (2007). 2-(2-[2-Dimethylaminothiazol-5-yl]ethenyl)-6-(2-[fluoro]ethoxy) benzoxazole: a novel PET agent for in vivo detection of dense amyloid plaques in Alzheimer’s disease patients. J. Nucl. Med. 48, 553–561.
Kurz, A., Riemenschneider, M., Buch, K., Willoch, F., Bartenstein, P., Muller, U., and Guder, W. (1998). Tau protein in cerebrospinal fluid is significantly increased at the earliest clinical stage of Alzheimer’s disease. Alzheimer Dis. Assoc. Disord. 12, 372–377.
Lee, V. M. Y. (1996). Regulation of tau phosphorylation in Alzheimer’s disease. Ann. N. Y. Acad. Sci. 777, 107–113.
Leinonen, V., Alafuzoff, I., Aalto, S., Suotunen, T., Savolainen, S., Nagren, K., Tapiola, T., Pirttila, T., Rinne, J., Jaaskelainen, J. E., Soininen, H., and Rinne, J. O. (2008). Assessment of beta-amyloid in a frontal cortical brain biopsy specimen and by positron emission tomography with carbon 11-labeled Pittsburgh compound B. Arch. Neurol. 65, 1304–1309.
Lewczuk, P., Esselmann, H., Otto, M., Maler, J. M., Henkel, A. W., Henkel, M. K., Eikenberg, O., Antz, C., Krause, W.-R., and Reulbach, U. (2004). Neurochemical diagnosis of Alzheimer’s dementia by CSF AB42, AB42/AB40 ratio and total tau. Neurobiol. Aging 25, 273–281.
Lim, A., Tsuang, D., Kukull, W., Nochlin, D., Leverena, J., McCormick, W., Bowen, J., Teri, L., Thompson, J., Peskind, E. R., Raskind, M., and Larson, E. B. (1999). Clinico-neuropathological correlation of Alzheimer’s disease in a community-based case series. J. Am. Geriatr. Soc. 47, 564–569.
Mathis, C. A., Bacskai, B. J., Kajdasz, S. T., McLellan, M. E., Frosch, M. P., Hyman, B. T., Holt, D. P., Wang, Y., Huang, G. F., Debnath, M. L., and Klunk, W. E. (2002). A lipophilic thioflavin-T derivative for positron emission tomography (PET) imaging of amyloid in brain. Bioorg. Med. Chem. Lett. 12, 295–298.
Mathis, C. A., Lopresti, B. J., and Klunk, W. E. (2007). Impact of amyloid imaging on drug development in Alzheimer’s disease. Nucl. Med. Biol. 34, 809–822.
Mathis, C. A., Wang, Y., Holt, D. P., Huang, G. F., Debnath, M. L., and Klunk, W. E. (2003). Synthesis and evaluation of 11C-labeled 6-substituted 2-arylbenzothiazoles as amyloid imaging agents. J. Med. Chem. 46, 2740–2754.
Mattsson, N., Zetterberg, H., Hansson, O., Andreasen, N., Parnetti, L., Jonsson, M., Herukka, S. K., van der Flier, W. M., Blankenstein, M. A., Ewers, M., Rich, K., Kaiser, E., Verbeek, M., Tsolaki, M., Mulugeta, E., Rosen, E., Aarsland, D., Visser, P. J., Schroder, J., Marcusson, J., de Leon, M., Hampel, H., Scheltens, P., Pirttila, T., Wallin, A., Jonhagen, M. E., Minthon, L., Winblad, B., and Blennow, K. (2009). CSF biomarkers and incipient Alzheimer disease in patients with mild cognitive impairment. JAMA 302, 385–393.
Mayeux, R., Saunders, A. M., Shea, S., Mirra, S., Evans, D., Roses, A. D., Hyman, B. T., Crain, B., Tang, M., and Phelps, C. H. (1998). Utility of the apolipoprotein E genotype in the diagnosis of Alzheiemer’s disease. N. Engl. J. Med. 338, 506–511.
McKhann, G., Drachman, D. A., Folstein, M. F., Katzman, R., Price, D. L., and Stadlan, E. (1984). Clinical diagnosis of Alzheimer’s disease: report of the NINCDS-ADRDA Work Group under the auspices of the Department of Health and Human Services Task Force on Alzheimer’s disease. Neurology 34, 939–944.
McKhann, G. M., Knopman, D. S., Chertkow, H., Hyman, B. T., Jack, C. R. Jr., Kawas, C. H., Klunk, W. E., Koroshetz, W. J., Manly, J. J., Mayeux, R., Mohs, R. C., Morris, J. C., Rossor, M. N., Scheltens, P., Carillo, M. C., Thies, B., Weintraub, S., and Phelps, C. H. (2011). The diagnosis of dementia due to Alzheimer’s disease: recommendations from the National Institute on Aging and the Alzheimer’s Association workgroup. Alzheimers Dement. 7, 263–269.
Minoshima, S., Foster, N. L., Sima, A. A., Frev, K. A., Albin, R. L., and Kuhl, D. E. (2001). Alzheimer’s disease versus dementia with Lewy bodies: cerebral metabolic distinction with autopsy confirmation. Ann. Neurol. 50, 358–365.
Minoshima, S., Frey, K. A., Koeppe, R. A., Foster, N. L., and Kuhl, D. E. (1995). A diagnostic approach in Alzheimer’s disease using three-dimensional stereotactic surface projections of fluorine-18-FDG PET. J. Nucl. Med. 36, 1238–1248.
Minoshima, S., Giordani, B., Berent, S., Frey, K. A., Foster, N. L., and Kuhl, D. E. (1997). Metabolic reduction in the posterior congulare cortex in very early Alzheimer’s disease. Ann. Neurol. 42, 85–94.
Mintun, M. A., Larossa, G. N., Sheline, Y. I., Denca, C. S., Lee, S. Y., Mach, R. H., Klunk, W. E., Mathis, C. A., DeKosky, S. T., and Morris, J. C. (2006). [11C]PIB in a nondemented population: potential antecedent marker of Alzheimer disease. Neurology 67, 446–452.
Mitchell, A. J. (2009). CSF phosphorylated tau in the diagnosis and prognosis of mild cognitive impairment and Alzheimer’s disease: a meta-analysis of 51 studies. J. Neurol. Neurosurg. Psychiatr. 80, 966–975.
Mormino, E. C., Kluth, J. T., Madison, C. M., Rabinovici, G. D., Baker, S. L., Miller, B. L., Koeppe, R. A., Mathis, C. A., Weiner, M. W., and Jagust, W. J. (2009). Episodic memory loss is related to hippocampal-mediated beta-amyloid deposition in elderly subjects. Brain 132, 1310–1323.
Morris, J. C., Roe, C. M., Grant, E. A., Head, D., Storandt, M., Goate, A., Fagan, A. M., Holtzman, D. M., and Mintun, M. A. (2009). Pittsburgh compound B imaging and prediction of progression from cognitive normality to symptomatic Alzheimer disease. Arch. Neurol. 66, 1469–1475.
Morris, J. C., Roe, C. M., Xiong, C., Fagan, A. M., Goate, A. M., Holtzman, D. M., and Mintun, M. A. (2010). APOE predicts amyloid-beta but not tau Alzheimer pathology in cognitively normal aging. Ann. Neurol. 67, 122–131.
Mortimer, J. A., Gosche, K. M., Riley, K. P., Markesbery, W. R., and Snowdon, D. A. (2004). Delayed recall, hippocampal volume and Alzheimer neuropathology. Neurology 62, 428–432.
Mosconi, L., Brys, M., Switalski, R., Mistur, R., Glodzik, L., Pirraglia, E., Tsui, W., De Santi, S., and de Leon, M. J. (2007). Maternal family history of Alzheimer’s disease predisposes to reduced brain glucose metabolism. Proc. Natl. Acad. Sci. U.S.A. 104, 19067–19072.
Mosconi, L., De Santi, S., Li, J., Tsui, W. H., Li, Y., Boppana, M., Laska, E., Rusinek, H., and de Leon, M. J. (2008). Hippocampal hypometabolism predicts cognitive decline from normal aging. Neurobiol. Aging 29, 676–692.
Mosconi, L., Mistur, R., Switalski, R., Brys, M., Glodzik, L., Rich, K., Pirraglia, E., Tsui, W., De Santi, S., and de Leon, M. J. (2009). Declining brain glucose metabolism in normal individuals with a maternal history of Alzheimer disease. Neurology 72, 513–520.
Mosconi, L., Tsui, E. H., De Santi, S., Li, J., Rusinek, H., Convit, A., Li, Y., Boppana, M., and de Leon, M. J. (2005). Reduced hippocampal metabolism in MCI and AD. Automated FDG-PET image analysis. Neurology 64, 1860–1867.
Motter, R., Vigo-Pelfrey, C., Kholodenko, D., Barbour, R., Johnson-Wood, K., Galasko, D., Chang, L., Miller, B., Clark, C., and Green, R. (1995). Reduction of beta-amyloid peptide42 in the cerebrospinal fluid of patients with Alzheimer’s disease. Ann. Neurol. 38, 643–648.
Mukaetova-Ladinska, E. B., Monteith, R., and Perry, E. K. (2010). Cerebrospinal fluid biomarkers for dementia with Lewy bodies. Int. J. Alzheimers Dis. 2010, 536538.
Mulugeta, E., Londos, E., Ballard, C., Alves, G., Zetterberg, H., Blennow, K., Skogseth, R., Minthon, L., and Aarsland, D. (2010). CSF amyloid {beta}38 as a novel diagnostic marker for dementia with Lewy bodies. J. Neurol. Neurosurg. Psychiatr. 82, 160–164.
O’Brien, J. T., Paling, S., Barber, R., Williams, E. D., Ballard, C., McKeith, I. G., Gholkar, A., Crum, W. R., Rossor, M. N., and Fox, N. C. (2001). Progressive brain atrophy on serial MRI in dementia with Lewy bodies, AD, and vascular dementia. Neurology 56, 1386–1388.
Okello, A., Koivunen, J., Edison, P., Archer, H. A., Turkheimer, F. E., Nagren, K., Bullock, R., Walker, Z., Kennedy, A., Fox, N. C., Rossor, M. N., Rinne, J. O., and Brooks, D. J. (2009). Conversion of amyloid positive and negative MCI to AD over 3 years: an 11C-PIB PET study. Neurology 73, 754–760.
Panegyres, P. K., Rogers, J. M., McCarthy, M., Campbell, A., and Wu, J. S. (2009). Fluorodeoxyglucose-positron emission tomography in the differential diagnosis of early-onset dementia: a prospective, community-based study. BMC Neurol. 9, 41. doi: 10.1186/1471-2377-9-41
Patwardhan, M. B., McCrory, D. C., Matchar, D. B., Samsa, G. P., and Rutschmann, O. T. (2004). Alzheimer disease: operating characteristics of PET-a meta-analysis. Radiology 231, 73–80.
Pennanen, C., Kivipelto, M., Tuomainen, S., Hartikainen, P., Hanninen, T., Laakso, M. P., Hallikainen, V., Vanhanen, M., Nissinen, A., Helkala, E.-L., Vainio, P., Vanninen, R., Partanen, K., and Soininen, H. (2004). Hippocampus and entorhinal cortex in mild cognitive impairment and early AD. Neurobiol. Aging 25, 303–310.
Peskind, E. R., Li, G., Shofer, J., Quinn, J. F., Kaye, J. A., Clark, C. M., Farlow, M. R., DeCarli, C., Raskind, M. A., Schellenberg, G. D., Lee, V. M., and Galasko, D. R. (2006). Age and apolipoprotein E*4 allele effects on cerebrospinal fluid beta-amyloid 42 in adults with normal cognition. Arch. Neurol. 63, 936–939.
Petersen, R. C., Roberts, R. O., Knopman, D. S., Boeve, B. F., Geda, Y. E., Ivnik, R. J., Smith, G. E., and Jack, C. R. Jr. (2009). Mild cognitive impairment: ten years later. Arch. Neurol. 66, 1447–1455.
Petrie, E. C., Cross, D. J., Galasko, D., Schellenberg, G. D., Raskind, M. A., Peskind, E. R., and Minoshima, S. (2009). Preclinical evidence of Alzheimer changes: convergent cerebrospinal fluid biomarker and fluorodeoxyglucose positron emission tomography findings. Arch. Neurol. 66, 632–637.
Pike, K. E., Savage, G., Villemagne, V. L., Ng, S., Moss, S. A., Maruff, P., Mathis, C. A., Klunk, W. E., Masters, C. L., and Rowe, C. C. (2007). Beta-amyloid imaging and memory in non-demented individuals: evidence for preclinical Alzheimer’s disease. Brain 130, 2837–2844.
Price, J. L., and Morris, J. C. (1999). Tangles and plaques in nondemented aging and “preclinical” Alzheimer’s disease. Ann. Neurol. 45, 358–368.
Raji, C. A., Lee, C., Lopez, O. L., Tsay, J., Boardman, J. F., Schwartz, E. D., Bartynski, W. S., Hefzy, H. M., Gach, H. M., Dai, W., and Becker, J. T. (2010). Initial experience in using continuous arterial spin-labeled MR imaging for early detection of Alzheimer disease. AJNR Am. J. Neuroradiol. 31, 847–855.
Reiman, E. M., Caselli, R. J., Chen, K., Alexander, G. E., Bandy, D., and Frost, J. (2001). Declining brain activity in cognitively normal apolipoprotein E epsilon 4 heterozygotes: a foundation for using positron emission tomography to efficiently test treatments to prevent Alzheimer’s disease. Proc. Natl. Acad. Sci. U.S.A. 98, 3334–3339.
Reiman, E. M., Caselli, R. J., Yun, L. S., Chen, K., Bandy, D., Minoshima, S., Thibodeau, S. N., and Osborne, D. (1996). Preclinical evidence of Alzheimer’s disease in persons homozygous for the epsilon 4 allele for apolipoprotein E. N. Engl. J. Med. 334, 752–758.
Reiman, E. M., Chen, K., Alexander, G. E., Caselli, R. J., Bandy, D., Osborne, D., Saunders, A. M., and Hardy, J. (2004). Functional brain abnormalities in young adults at genetic risk for late-onset Alzheimer’s dementia. Proc. Natl. Acad. Sci. U.S.A. 101, 284–289.
Reiman, E. M., Chen, K., Alexander, G. E., Caselli, R. J., Bandy, D., Osborne, D., Saunders, A. M., and Hardy, J. (2005). Correlations between apolipoprotein E epsilon4 gene dose and brain-imaging measurements of regional hypometabolism. Proc. Natl. Acad. Sci. U.S.A. 102, 8299–8302.
Rentz, D. M., Locascio, J. J., Becker, J. A., Moran, E. K., Eng, E., Buckner, R. L., Sperling, R. A., and Johnson, K. A. (2010). Cognition, reserve, and amyloid deposition in normal aging. Ann. Neurol. 67, 353–364.
Ridha, B. H., Anderson, V. M., Barnes, J., Boyes, R. G., Price, S. L., Rossor, M. N., Whitwell, J. L., Jenkins, L., Black, R. S., Grundman, M., and Fox, N. C. (2008). Volumetric MRI and cognitive measures in Alzheimer disease: comparison of markers of progression. J. Neurol. 255, 567–574.
Riemenschneider, M., Wagenpfeil, S., Diehl, J., Lautenschlager, N., Theml, T., Heldmann, B., Drzezga, A., Jahn, T., Forstl, H., and Kurz, A. (2002). Tau and A-beta-42 protein in CSF of patients with frontotemporal degeneration. Neurology 58, 1622–1628.
Riemenschneider, M., Wagenpfeil, S., Vanderstichele, H., Otto, M., Wiltfang, J., Kretzschmar, H., Vanmechelen, E., Forstl, H., and Kurz, A. (2003). Phospho-tau/total tau ratio in cerebrospinal fluid discriminates Creutzfeldt-Jakob disease from other dementias. Mol. Psychiatry 8, 343–347.
Rowe, C. C., Ackerman, U., Browne, W., Mulligan, R., Pike, K. L., O’Keefe, G., Tochon-Danguy, H., Chan, G., Berlangieri, S. U., Jones, G., Dickinson-Rowe, K. L., Kung, H. P., Zhang, W., Kung, M. P., Skovronsky, D., Dyrks, T., Holl, G., Krause, S., Friebe, M., Lehman, L., Lindemann, S., Dinkelborg, L. M., Masters, C. L., and Villemagne, V. L. (2008). Imaging of amyloid beta in Alzheimer’s disease with 18F-BAY94-9172, a novel PET tracer: proof of mechanism. Lancet Neurol. 7, 129–135.
Rowe, C. C., Ng, S., Ackermann, U., Gong, S. J., Pike, K., Savage, G., Cowie, T. F., Dickinson, K. L., Maruff, P., and Darby, D. (2007). Imaging beta-amyloid burden in aging and dementia. Neurology 68, 1718–1725.
Scheinin, N. M., Aalto, S., Koikkalainen, J., Lotjonen, J., Karrasch, M., Kemppainen, N., Viitanen, M., Nagren, K., Helin, S., Scheinin, M., and Rinne, J. O. (2009). Follow-up of [11C]PIB uptake and brain volume in patients with Alzheimer disease and controls. Neurology 73, 1186–1192.
Schoonenboom, N. S. M., Pijnenburg, Y. A. L., Muler, C., Rosso, S. M., Van Elk, E. J., Van Kamp, G. J., Van Swieten, J. C., and Scheltens, P. (2004). Amyloid beta (1-42) and phosphorylated tau in CSF as markers for early-onset Alzheimer disease. Neurology 62, 1580–1584.
Schott, J. M., Bartlett, J. W., Fox, N. C., and Barnes, J. (2010). Increased brain atrophy rates in cognitively normal older adults with low cerebrospinal fluid A beta1-42. Ann. Neurol. 68, 825–834.
Schott, J. M., Crutch, S. J., Frost, C., Warrington, E. K., Rossor, M. N., and Fox, N. C. (2008). Neuropsychological correlates of whole brain atrophy in Alzheimer’s disease. Neuropsychologia 46, 1732–1737.
Shaw, L. M., Vanderstichele, H., Knapik-Czajka, M., Clark, C. M., Aisen, P. S., Petersen, R. C., Blennow, K., Soares, H., Simon, A., Lewczuk, P., Dean, R., Siemers, E., Potter, W., Lee, V. M., and Trojanowski, J. Q. (2009). Cerebrospinal fluid biomarker signature in Alzheimer’s disease neuroimaging initiative subjects. Ann. Neurol. 65, 403–413.
Shin, J., Lee, S. Y., Kim, S. H., Kim, Y. B., and Cho, S. J. (2008). Multitracer PET imaging of amyloid plaques and neurofibrillary tangles in Alzheimer’s disease. Neuroimage 43, 236–244.
Shoji, M., Matsubara, E., Kanai, M., Watanabe, M., Nakamura, T., Tomidokoro, Y., Shizuka, M., Wakabayashi, K., Igeta, Y., Ikeda, Y., Mizushima, K., Amari, M., Ishiguro, K., Kawarabayasi, T., Harigaya, Y., Okamoto, K., and Hirai, S. (1998). Combination assay of CSF tau, A beta 1-40 and A beta 1-42(43) as a biochemical marker of Alzheimer disease. J. Neurol. Sci. 158, 134–140.
Silverman, D. H., Small, G. W., Chang, C. Y., Lu, C. S., DeAburto, K., Chen, W., Czernin, J., Rapoport, S. I., Petrini, P., and Alexander, G. E. (2001). Positron emission tomography in evaluation of dementia: regional brain metabolism and long-term outcome. JAMA 286, 2120–2127.
Sluimer, J. D., van der Flier, W. M., Karas, G. B., Fox, N. C., Scheltens, P., Barkhof, F., and Vrenken, H. (2008a). Whole-brain atrophy rate and cognitive decline: longitudinal MR study of memory clinic patients. Radiology 248, 590–598.
Sluimer, J. D., Vrenken, H., Blankenstein, M. A., Fox, N. C., Scheltens, P., Barkhof, F., and van der Flier, W. M. (2008b). Whole-brain atrophy rate in Alzheimer disease: identifying fast progressors. Neurology 70, 1836–1841.
Small, G. W., Kepe, V., Ercoli, L. M., Siddarth, P., Bookheimer, S. Y., Miller, K. J., Lavretsky, H., Burggren, A. C., Cole, G. M., Vinters, H. V., and Thompson, P. M. (2006). PET of brain amyloid and tau in mild cognitive impairment. N. Engl. J. Med. 355, 2652–2663.
Sperling, R. A., Aisen, P. S., Beckett, L. A., Bennett, D. A., Craft, S., Fagan, A. M., Iwatsubo, T., Jack, C. R., Kaye, J., Montine, T. J., Park, D. C., Reiman, E. M., Rowe, C. C., Siemers, E., Stern, Y., Yaffe, K., Carrillo, M. C., Thies, B., Morrison-Bogorad, M., Wagster, M. V., and Phelps, C. H. (2011). Toward defining the preclinical stages of Alzheimer’s disease: recommendations from the National Institute on Aging and the Alzheimer’s Association workgroup. Alzheimers Dement. 7, 280–292.
Spulber, G., Niskanen, E., Macdonald, S., Smilovici, O., Chen, K., Reiman, E. M., Jauhiainen, A. M., Hallikainen, M., Tervo, S., Wahlund, L. O., Vanninen, R., Kivipelto, M., and Soininen, H. (2008). Whole brain atrophy rate predicts progression from MCI to Alzheimer’s disease. Neurobiol. Aging 31, 1601–1605.
Stomrud, E., Hansson, O., Blennow, K., Minthon, L., and Londos, E. (2007). Cerebrospinal fluid biomarkers predict decline in subjective cognitive function over 3 years in healthy elderly. Dement. Geriatr. Cogn. Disord. 24, 118–124.
Stornadt, M., Mintun, M. A., Head, D., and Morris, J. C. (2009). Cognitive decline and brain volume loss as signatures of cerebral amyloid-beat peptide deposition identified with Pittsburgh compound B: cognitive decline associated with Abeta deposition. Arch. Neurol. 66, 1476–1481.
Strozyk, D., Blennow, K., White, L. R., and Launer, L. J. (2003). CSF Abeta 42 levels correlate with amyloid-neuropathology in a population-based autopsy study. Neurology 60, 652–656.
Sunderland, T., Linker, G., Mirza, N., Putnam, K. T., Friedman, D. L., Kimmel, L. H., Bergeson, J., Manetti, G. J., Zimmermann, M., Tang, B., Bartko, J. J., and Cohen, R. M. (2003). Decreased beta-amyloid1-42 and increased tau levels in cerebrospinal fluid of patients with Alzheimer disease. JAMA 289, 2094–2103.
Sunderland, T., Wolozin, B., Galasko, D., Levy, J., Dukoff, R., Bahro, M., Lasser, R., Motter, R., Lehtimaki, T., and Seubert, P. (1999). Longitudinal stability of CSF tau levels in Alzheimer patients. Biol. Psychiatry 46, 750–755.
Tapiola, T., Alafuzoff, I., Herukka, S. K., Parkkinen, L., Hartikainen, P., Soininen, H., and Pirttila, T. (2009). Cerebrospinal fluid {beta}-amyloid 42 and tau proteins as biomarkers of Alzheimer-type pathologic changes in the brain. Arch. Neurol. 66, 382–389.
Teipel, S. J., Born, C., Ewers, M., Bokde, A. L. W., Reiser, M. F., Moller, H.-J., and Hampel, H. (2007). Multivariate deformation based analysis of brain atrophy to predict Alzheimer’s disease in mild cognitive impairment. Neuroimage 28, 3–24.
Testa, C., Laakso, M. P., Sabattoli, F., Rossi, R., Beltramello, A., Soininen, H., and Frisoni, G. B. (2004). A comparison between the accuracy of voxel-based morphometry and hippocampal volumetry in Alzheimer’s disease. J. Magn. Reson. Imaging 19, 274–282.
Thompson, P. M., Mega, M. S., Woods, R. P., Zoumalan, C. I., Lindschield, C. J., Blanton, R. E., Moussai, J., Holmes, C. J., Cummings, J. L., and Toga, A. W. (2001). Cortical change in Alzheimer’s disease detected with a disease-specific population-based brain atlas. Cereb. Cortex 11, 1–16.
Tokuda, T., Qureshi, M. M., Ardah, M. T., Varghese, S., Shehab, S. A., Kasai, T., Ishigami, N., Tamaoka, A., Nakagawa, M., and El-Agnaf, O. M. (2010). Detection of elevated levels of alpha-synuclein oligomers in CSF from patients with Parkinson disease. Neurology 75, 1766–1772.
Tolboom, N., van der Flier, W. M., Yaqub, M., Boellaard, R., Verwey, N. A., Blankenstein, M. A., Windhorst, A. D., Scheltens, P., Lammertsma, A. A., and van Berckel, B. N. (2009). Relationship of cerebrospinal fluid markers to 11C-PiB and 18F-FDDNP binding. J. Nucl. Med. 50, 1464–1470.
Vemuri, P., and Jack, C. R. Jr. (2010). Role of structural MRI in Alzheimer’s disease. Alzheimers Res Ther 2, 23.
Vemuri, P., Wiste, H. J., Weigand, S. D., Knopman, D. S., Shaw, L. M., Trojanowski, J. Q., Aisen, P. S., Weiner, M., Petersen, R. C., and Jack, C. R. Jr. (2010a). Effect of apolipoprotein E on biomarkers of amyloid load and neuronal pathology in Alzheimer disease. Ann. Neurol. 67, 308–316.
Vemuri, P., Wiste, H. J., Weigand, S. D., Knopman, D. S., Trojanowski, J. Q., Shaw, L. M., Bernstein, M. A., Aisen, P. S., Weiner, M., Petersen, R. C., and Jack, C. R. Jr. (2010b). Serial MRI and CSF biomarkers in normal aging, MCI, and AD. Neurology 75, 143–151.
Verhoeff, N. P., Wilson, A. A., Takeshita, S., Trop, L., Hussey, D., Singh, K., Kung, H. F., Kung, M. P., and Houle, S. (2004). In-vivo imaging of Alzheimer disease beta-amyloid with [11C] SB-13 PET. Am. J. Geriatr. Psychiatry 12, 584–595.
Vigo-Pelfrey, C., Seubert, P., Barbour, R., Blomquist, C., Lee, M., Lee, D., Coria, F., Chang, L., Miller, B., and Lieberburg, I. (1995). Elevation of microtubule-associated protein tau in the cerebrospinal fluid of patients with Alzheimer disease. Neurology 45, 788–793.
Villemagne, V. L., Pike, K. E., Chetelat, G., Ellis, K. A., Mulligan, R. S., Bourgeat, P., Ackermann, U., Jones, G., Szoeke, C., Salvado, O., Martins, R., O’Keefe, G., Mathis, C. A., Klunk, W. E., Ames, D., Masters, C. L., and Rowe, C. C. (2011). Longitudinal assessment of Abeta and cognition in aging and Alzheimer disease. Ann. Neurol. 69, 181–192.
Visser, P. J., Scheltens, P., Verhey, F. R. J., Schmand, B., Launer, L. J., Jolles, J., and Jonker, C. (1999). Medial temporal lobe atrophy and memory dysfunction as predictors for dementia in subjects with mild cognitive impairment. J. Neurol. 246, 477–485.
Visser, P. J., Verhey, F., Knol, D. L., Scheltens, P., Wahlund, L. O., Freund-Levi, Y., Tsolaki, M., Minthon, L., Wallin, A. K., Hampel, H., Burger, K., Pirttila, T., Soininen, H., Rikkert, M. O., Verbeek, M. M., Spiru, L., and Blennow, K. (2009). Prevalence and prognostic value of CSF markers of Alzheimer’s disease pathology in patients with subjective cognitive impairment or mild cognitive impairment in the DESCRIPA study: a prospective cohort study. Lancet Neurol. 8, 619–627.
Visser, P. J., Verhey, F. R. J., Hofman, P. A. M., Scheltens, P., and Jolles, J. (2002). Medial temporal lobe atrophy predicts Alzheimer’s disease in patients with minor cognitive impairment. J. Neurol. Neurosurg. Psychiatry 72, 491–497.
Wallin, A. K., Blennow, K., Zetterberg, H., Londos, E., Minthon, L., and Hansson, O. (2010). CSF biomarkers predict a more malignant outcome in Alzheimer disease. Neurology 74, 1531–1537.
Whitwell, J. L., Przybelski, S. A., Weigand, S. D., Knopman, D., Boeve, B. F., Petersen, R., and Jack, C. (2007). 3D maps from multiple MRI illustrate changing atrophy patterns as subjects progress from mild cognitive impairment to Alzheimer’s disease. Brain 130, 1777–1786.
Whitwell, J. L., Shiung, M. M., Przybelski, S. A., Weigand, S. D., Knopman, D. S., Boeve, B. F., Petersen, R. C., and Jack, C. R. Jr. (2008). MRI patterns of atrophy associated with progression to AD in amnestic mild cognitive impairment. Neurology 70, 512–520.
Wolk, D. A., Price, J. C., Saxton, J., Snitz, B., James, J. A., Lopez, O. L., Aizenstein, H. J., Weissfeld, L. A., Mathis, C. A., Klunk, W., and Dekosky, S. T. (2009). Amyloid imaging in mild cognitive impairment subtypes. Ann. Neurol. 65, 557–568.
Yuan, Y., Gu, Z. X., and Wei, W. S. (2009). Fluorodeoxyglucose-positron-emission tomography, single-photon emission tomography, and structural MR imaging for prediction of rapid conversion to Alzheimer disease in patients with mild cognitive impairment: a meta-analysis. AJNR Am. J. Neuroradiol. 30, 404–410.
Keywords: Alzheimer’s disease, mild cognitive impairment, biomarker, cerebrospinal fluid, magnetic resonance imaging, positron emission tomography
Citation: Riverol M and López OL (2011) Biomarkers in Alzheimer’s Disease. Front. Neur. 2:46. doi: 10.3389/fneur.2011.00046
Received: 23 December 2010;
Accepted: 02 July 2011;
Published online: 14 July 2011.
Edited by:
Lea T. Grinberg, University of California, USAReviewed by:
Miguel Pappolla, Medical University of South Carolina, USAMichael Ewers, University of California San Francisco and VA Medical Center San Francisco, USA
Copyright: © 2011 Riverol and López. This is an open-access article subject to a non-exclusive license between the authors and Frontiers Media SA, which permits use, distribution and reproduction in other forums, provided the original authors and source are credited and other Frontiers conditions are complied with.
*Correspondence: Oscar L. López, Neuropsychology Research Program, 830 Oxford Building, 3501 Forbes Avenue, Pittsburgh, PA 15213, USA. e-mail:bG9wZXpvbEB1cG1jLmVkdQ==