 Kevin J. Black
 Haley K. Acevedo1
- 1Department of Psychiatry, Washington University in St. Louis, St. Louis, MO, United States
- 2Departments of Neurology, Radiology and Neuroscience, Washington University in St. Louis, St. Louis, MO, United States
We propose a novel pharmacological fMRI (phMRI) method for objectively quantifying disease severity in Parkinson disease (PD). It is based on the clinical observation that the benefit from a dose of levodopa wears off more quickly as PD progresses. Biologically this has been thought to represent decreased buffering capacity for dopamine as nigrostriatal cells die. Buffering capacity has been modeled based on clinical effects, but clinical measurements are influenced by confounding factors. The new method proposes to measure the effect objectively based on the timing of the known response of several brain regions to exogenous levodopa. Such responses are robust and can be quantified using perfusion MRI. Here we present simulation studies based on published clinical dose-response data and an intravenous levodopa infusion. Standard pharmacokinetic-pharmacodynamic methods were used to model the response. Then the effect site rate constant ke was estimated from simulated response data plus Gaussian noise. Predicted time – effect curves sampled at times consistent with phMRI differ substantially based on clinical severity. Estimated ke from noisy input data was recovered with good accuracy. These simulation results support the feasibility of levodopa phMRI hysteresis mapping to measure the severity of dopamine denervation objectively and simultaneously in all brain regions with a robust imaging response to exogenous levodopa.
Introduction
The intensity and duration of the effect after injection appear to correlate with the degree of akinesia, the action of L-DOPA lasting longer the less pronounced the akinesia.
—Hirschmann and Mayer (translated) (1).
Parkinson disease (PD) is characterized by progressive death of cells projecting from the substantia nigra to the striatum. One of the most important unmet needs in PD is to find objective, quantitative in vivo biomarkers of disease severity. Biomarkers of nigrostriatal denervation are sought for several important reasons, including as surrogate markers of disease progression in treatment trials (2, 3). Putative imaging biomarkers of disease progression include striatal [18F]fluorodopa PET or [123I]ioflupane SPECT. Unfortunately, these techniques do not accurately quantify nigrostriatal cell loss (4). Presynaptic dopaminergic imaging of the midbrain does (5); nevertheless, alternative methods would be welcome.
Here we describe a novel potential biomarker, based on the common clinical observation that the benefit from a dose of levodopa wears off more quickly as PD progresses. Early in the course of disease, a small dose of levodopa provides benefit long after the plasma levodopa concentration has declined substantially from its peak. The body responds as if the levodopa in the plasma filled a reservoir and then slowly leaked out to produce benefit. With disease progression, even though the same amount of levodopa circulates in the blood, the benefit wears off much faster, as if the reservoir had become leakier. Biologically, the reservoir may represent the diminishing buffering capacity of ascending dopaminergic axons as midbrain dopamine neurons die off (6). This wearing off of benefit has been quantified by a mathematical model that postulates a central effect compartment (reservoir) whose concentration of levodopa directly determines the clinical benefit. The buffering capacity in this model can be characterized by a single number, the effect site rate constant ke, which can be computed from serial measurements of both plasma concentration and clinical status (7). On average, patients with more severe PD and longer disease duration have a larger (“leakier”) ke when modeled this way (Figure 1) (8–13). In fact, ke can be the strongest predictor of the kinetics of response to levodopa in PD (9, 12). Dopamine buffering capacity as measured by ke also correlates significantly with nigrostriatal denervation as measured by DOPA uptake (14) or dopamine transporter imaging (15). Unfortunately, the clinical measurements used to determine ke are influenced by confounding factors such as patient fatigue and motivation, which likely add variance to the measurement. A direct, objective brain measure of response to levodopa may reduce this added variance.
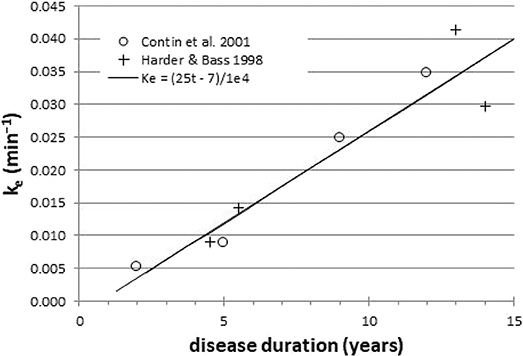
Figure 1. Across groups of PD patients, ke is a surrogate for disease duration (r = 0.95). Data redrawn from Harder and Baas (8) and Contin et al. (9).
The effect of levodopa on the brain can be seen by measuring movement, but also by measuring regional cerebral blood flow (rCBF), reflecting regional brain activity (16–19). Crucially, using quantitative techniques, levodopa has no direct vascular effects after adequate carbidopa pretreatment (16–18). Levodopa's regional CBF effects reflect its regional effects on glucose metabolism and are prominent in pons and midbrain, thalamus, middle frontal gyrus, insula, putamen and cingulate cortex (17, 19). Drug effects on rCBF in PD can be quantified without ionizing radiation using arterial spin labeling (ASL) perfusion MRI (20–22). The midbrain rCBF response to levodopa is robust whether measured with [15O]water PET (16–19) or with perfusion MRI (22).
Here we show, using simulated data based on published results in human PD patients, that quantifying dopamine buffering capacity ke is likely to be feasible with existing technology.
Methods
Pharmacokinetics
Measuring ke with levodopa phMRI would be infeasible if one had to repeatedly image a subject until a dose of levodopa wore off completely, perhaps for several hours in early PD. Fortunately, with faster wearing-off as PD progresses, there is also faster “wearing-on” or onset of drug effect (10, 23–25). In fact, with a completely unrelated drug that also shows equilibration delay, giving the drug as a rapid intravenous (i.v.) infusion followed by a slow maintenance infusion allowed estimating the ke just as precisely from the first 20 min of data as from 3 h of data (7). Fortunately we have used exactly this approach to dose levodopa in PD: a fast i.v. loading dose followed by a slow maintenance infusion (26) (Figure 2). This infusion method allows us to transiently achieve plasma levodopa concentrations of 1,500–3,500 ng/mL, so we can measure ke from both the rapid rise and fall of plasma levels.
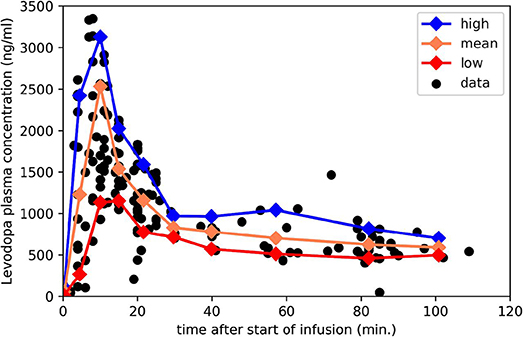
Figure 2. Plasma levodopa concentrations in PD patients following the “final dose” intravenous infusion method in Black et al. (26). The 3 lines mark the mean, 90th and 10th percentile for samples collected in the corresponding intervals. Redrawn from data reported in Black et al. (26).
For present purposes, likely time – concentration curves Cp(t) in people with PD were taken from this infusion protocol, which aims to produce a steady-state levodopa concentration of 600 ng/ml, and consists of a 10-min loading dose at 0.6426 mg/kg followed by a maintenance infusion at 2.882 × 10⁻⁵ mg/kg/min × (140 yr–age)/yr (26). For a 65-year-old 70-kg person that means 45 mg over 10 min followed by 0.15 mg/min, for a total dose over 150 min of 66 mg. That i.v. dose is bioequivalent to 78 mg oral levodopa (27), though of course i.v. dosing leads to much higher transient peak plasma concentrations.
Using those data, we aggregated individual data points by time bins and plotted the mean, to estimate the most likely Cp(t), and the 10th and 90th percentile, to deal with a range of metabolic rates in patients (Figure 2); see mpdp1.ipynb at https://bitbucket.org/kbmd/hysteresis). The NumPy and matplotlib libraries in Python were used for simulations and data visualization (Python Programming Language, RRID:SCR_008394; NumPy, RRID:SCR_008633; MatPlotLib, RRID:SCR_008624) (28, 29).
Modeling the Effect Compartment
Holford and Sheiner describe the theoretical background for the effect compartment model (30). A later paper by Sheiner's group simplifies the modeling with the assumption that Ce = Cp at steady state, leading to the definition of the effect compartment concentration curve by the simpler differential equation Ce′ = ke(Cp–Ce) (31).
If we use piecewise linear interpolation to estimate Cp(t) between blood samples [as did Unadkat et al. (31)], Ce can be computed in closed form. We can write Cp as Cp(t–ti) = Cp(ti) + mi(t–ti) on the interval [ti, ti+1], where mi = [Cp(ti+1)–Cp(ti)]/ [ti+1-ti]. We need a value for the effect site concentration before the infusion starts, Ce(t0). For the purposes of this report, we can reasonably assume Ce(t0) = Cp(t0), which will be approximately true if at the time of the first blood draw patients have refrained from taking oral levodopa for 8–10 h, since is <5 h, and usually <2.5 h [see Table 4 in Contin et al. (9)].
The solution to this initial value problem is
defined on the interval (ti, ti+1] (32).
Predicting Effect From Levodopa Concentrations in PD
To test this method, one needs to estimate a reasonable variety of time: effect curves in PD. Not only ke but also the concentration–effect curve changes with disease severity. Contin et al. showed that a sigmoid Emax model reasonably fit the data from a wide range of PD severity (9). We adopt their measurements of EC50, n (the Hill coefficient) and ke for a variety of disease severity groups; namely, means for Hoehn and Yahr (33) stages I through IV in addition to the mildest and most severely affected individual subjects in the Contin et al. report (their Table 4). These parameters and the sigmoid Emax model are combined to create time–effect curves that we could expect from a brain region whose activity changes reliably with increased dopamine release in the brain with administration of exogenous levodopa. Note that the dopamine receptor may be “upstream” (e.g., posterior putamen) to the dopa-responsive region (e.g., motor cortex); dopamine receptors are not needed in the dopa-responsive region itself. The simulated data use a baseline CBF of 50 ml/hg/min and maximal effect was set at 35 ml/hg/min, consistent with a ~70% rCBF increase in midbrain after a relatively large levodopa-carbidopa dose (22).
Adding Noise
The brain imaging time–effect curves assessed by any real brain imaging method will not be perfect, noise-free estimates, but will be contaminated by variability from biological or instrumentation issues. To test how well we can expect to recover ke (and the other pharmacodynamic parameters) from a real experiment, we add noise to the simulated data described in the previous paragraph. We added Gaussian noise with a coefficient of variation (CoV) of 12.9%; this value was chosen based on the CoV in a cortical gray matter region across sixteen 34-s CBF images in 11 adults with PD scanned with a pCASL sequence while fixating a crosshair (unpublished data, K. J. Black and colleagues) (34, 35). For this study, all methods were carried out in accordance with relevant guidelines. The experimental protocol was approved by the Washington University Human Research Protection Office (ID # 201703122). All participants provided informed consent.
Parameter Estimation
We simultaneously estimated ke, EC50, and n from the data, given the model, using the lmfit package in Python (ampgo followed by emcee modules) (36).
Accuracy
The accuracy of the method was tested by comparing the estimated ke to the input ke. Secondary similar analyses were done for EC50 and n.
Results
Predicted Levodopa Time: Concentration Curves in Effect Compartment
Figure 3 shows the expected concentration over time in the effect compartment, depending on the severity of PD. One can easily appreciate the faster exchange between plasma and the effect compartment when ke is high (i.e., when the equilibration half-life is short).
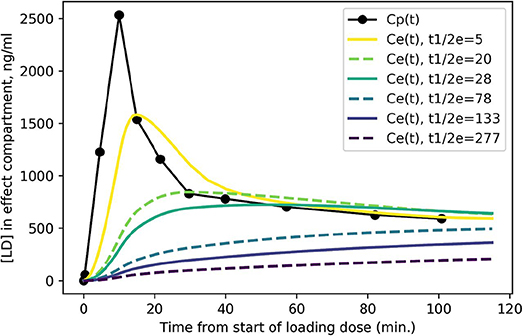
Figure 3. Predicted levodopa concentration in the effect compartment at various disease severity levels. Curves are labeled by = ln 2/ke from more severe PD ( = 5 min.) to milder PD ( = 277 min.).
Time: Effect Curves by Disease Severity
We modeled the expected rCBF response in midbrain to the rapid i.v. infusion, based on published levodopa pharmacokinetics in PD (26) and published mean pharmacodynamic parameters for Hoehn & Yahr stages I, II, III, and IV (8, 9). The predicted signals are quite distinct, assuming a typical Cp(t) time:plasma curve (Figure 4A). If a given subject's pharmacokinetics produce higher plasma levels, the distinctions are still fairly clear (Figure 4B). Of course, if an individual's plasma levels are low, an effect may not be evident, especially in more severe PD (Figure 4C).
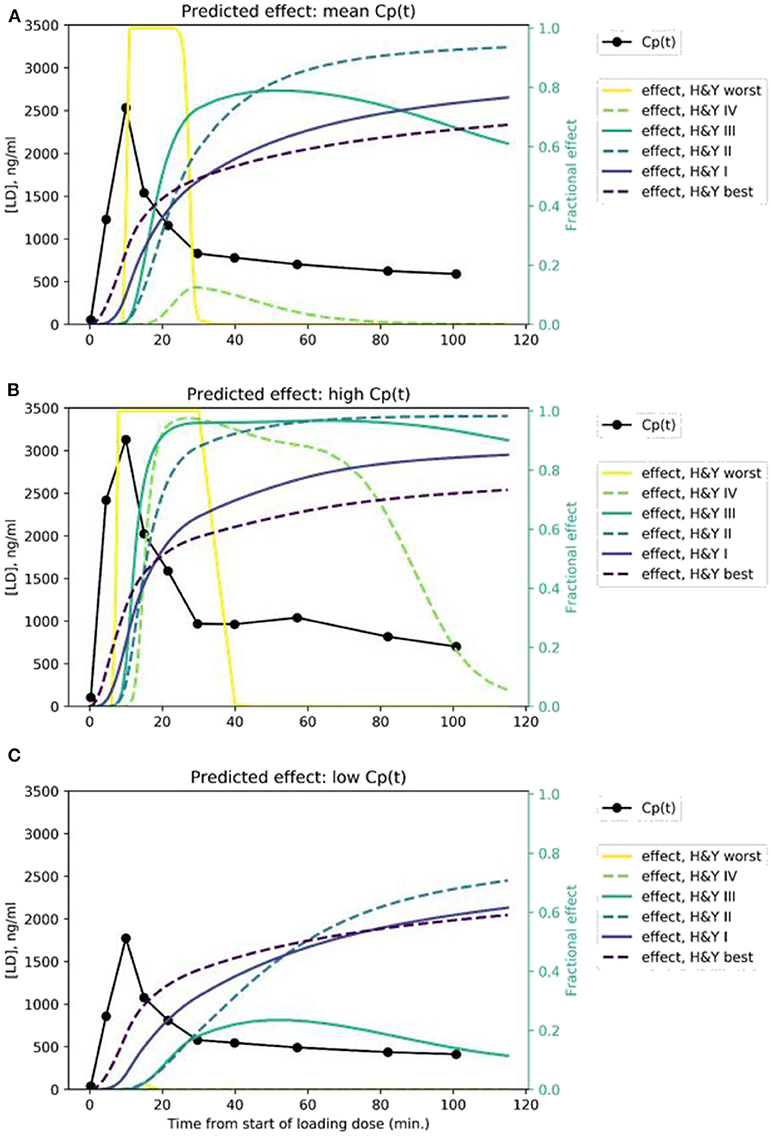
Figure 4. Predicted time:effect curves at various disease severity levels assuming (A) mean, (B) high, and (C) low Cp(t) in response to the levodopa infusion.
Accuracy
ke estimated from time: effect curves in the presence of noise was generally accurate (Figure 5; see also Supplementary Table 1). More advanced disease led to more distinct predicted time–activity curves (see Figure 4A), reflected in more accurate results (Figures 5A–C).
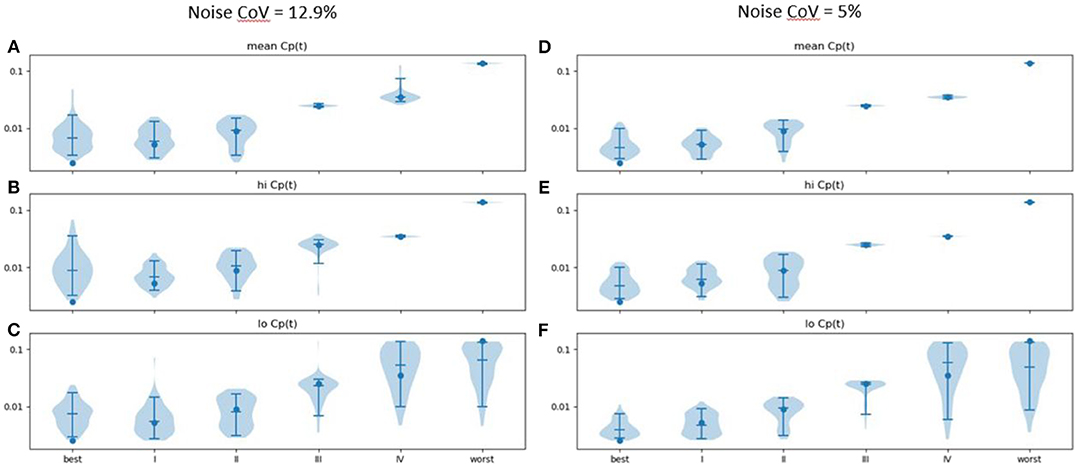
Figure 5. Estimated ke (vertical axis) across 100 sets of noise added to the time: effect curve computed for the ke, EC50, and n for various severities of PD as reported in Contin et al. (9) (horizontal axis), assuming (A) mean, (B) high and (C) low Cp(t) in response to the levodopa infusion. Noise CoV = 12.9%. Width of plot is proportional to frequency of output of the given magnitude. Filled circle: input n. Horizontal lines note the 5, 50, and 95th percentiles. At right, similar results are shown for noise CoV = 5% for (D) mean, (E) high, and (F) low Cp(t) responses to the LD infusion.
Results were more accurate if the noise was reduced from a CoV of 12.9 to 5% (Figures 5D–F; see also Supplementary Table 2). Similar plots for EC50 and n are provided as Supplementary Figures 1-2.
In an attempt to improve further the accuracy, we examined the effect of spreading the levodopa infusion over twice the time. We hypothesized that the limited temporal resolution of the perfusion MR method, combined with the relatively small timing difference in onset of action in mild vs. very mild PD, limited discrimination at the milder end of the severity range. Results are shown in Figure 6. Similar plots for EC50 and n are provided as Supplementary Figures 3, 4.
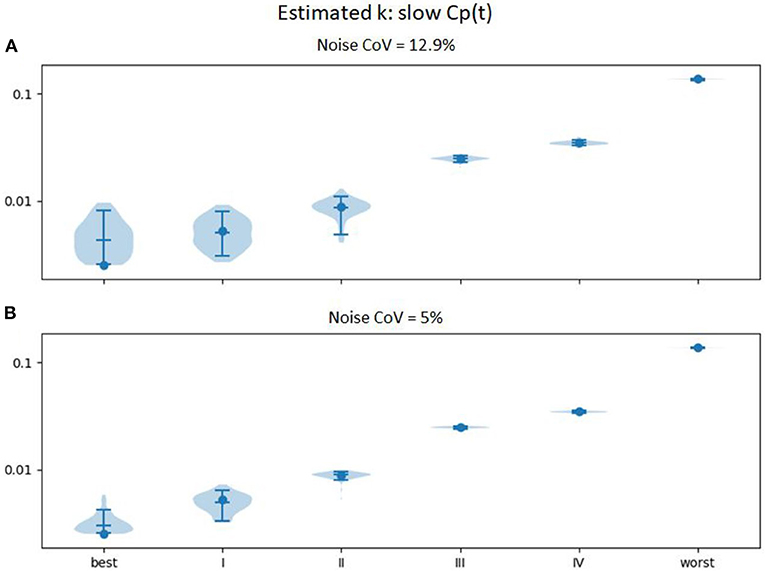
Figure 6. Estimated ke (vertical axis) across 100 sets of noise added to the time:effect curve computed for the ke, EC50, and n for various severities of PD as reported in Contin et al. (9) (horizontal axis), with Cp(t) estimated for an levodopa infusion twice as long (at half the rate, so that the total infused dose is equivalent). (A) noise CoV = 12.9%; (B) noise CoV = 5%.
Discussion
We present a novel brain imaging method for objectively quantifying disease severity in Parkinson disease (PD), which we refer to as dopamine buffering capacity imaging, or more precisely, levodopa phMRI hysteresis mapping. The temporally distinct time: effect curves predicted in Figure 4 suggest that even with some imperfection in the rCBF signal, we can expect to derive a reasonably accurate ke for a brain region that responds to exogenous levodopa with a clear dose-response curve.
Demonstrating efficacy for potential disease-modifying therapies in PD has been difficult. Delayed start designs and similar approaches that rely on change in clinical severity over time require years to complete, large patient groups, and even then have not yet been successful (37). A validated biomarker would be of great value in improving this situation (2). The Michael J. Fox Foundation for Parkinson's Research designates “the identification, development and use of biomarkers to diagnose and track Parkinson's disease” as a priority area, noting that a successful biomarker “would mean better disease management for patients” and “improve and speed clinical development of disease-modifying therapies” (38). In simulated data based on published results and reasonable assumptions, levodopa phMRI hysteresis mapping appears likely to fill that need.
Of course one does not need an MRI machine to tell if a drug is improving movement in PD, and the present proposal draws on previous studies using pharmacokinetic-pharmacodynamic (PK-PD) modeling of tapping speed or UPDRS score response to levodopa challenge. However, the assessment of drug response using brain imaging is novel, and provides several potential advantages. The rCBF response is objective, rater-independent, and does not require subject movement. Furthermore, buffering capacity is measured simultaneously in all levodopa-responsive brain regions rather than just the motor system, potentially informing pathophysiological research on the increasingly recognized non-motor symptoms of PD (39). The only assumption is that regional brain activity somewhere in the brain corresponds temporally to clinical severity.
Chan, Nutt, and Holford have subsequently extended the PK-PD model with the aim of better modeling long-term changes with disease progression in PD (40, 41). Their revised model includes factors intended to account for clinical observations like morning benefit and the long-duration response, and in their data ke (reported as Teqf = ln 2/ke) did not change significantly over time. However, as they note, other factors could explain the difference in results, and their more complicated model was made possible by a very large set of longitudinal data. While the extended model may be ideal for optimal understanding of physiology from clinical PK-PD data, it is not essential for the present purpose of identifying a biomarker of nigrostriatal denervation in PD. In other words, if ke as derived from the model we use correlates highly with disease severity, it will serve its intended purpose just fine.
Every step of this method has been proven individually: i.v. levodopa has been used safely for over 50 years (42); the infusion method described for the simulated data has been used in over 100 subjects [(20, 26) and Black et al. unpublished data]; levodopa concentration can be quantified accurately in plasma (43); the response to levodopa can be measured by ASL fMRI (20–22); midbrain has a robust rCBF response to single, clinically sensible doses of levodopa (16–19, 22), and software exists for estimating PK-PD parameters from fMRI data on a voxel-by-voxel or regional level (36, 44). In other words, every part of the method described here is well proven; it is their combination and interpretation as a disease severity measure that is novel.
Foreseeable Obstacles and Possible Solutions
Some potential difficulties in implementing dopamine buffering capacity imaging are foreseeable, but can be mitigated. These include a need for high temporal resolution, uncertain optimal dosing, head movement during MRI, and variable attention and alertness during the scans.
Temporal Resolution
Prior data showing robust rCBF responses to levodopa averaged data across a group and over several scans in the pre- and on-drug conditions, i.e., with a time resolution of about 30 min. Measuring dopamine buffering capacity in individual subjects pushes the envelope, requiring measuring response to levodopa in single subjects and at a time resolution of 1–2 min or better. Fortunately, current pCASL methods allow an unbiased whole-brain measure of blood flow in about 5–35 s. However, these images are statistically noisy. If estimated ke proves less accurate with individual subject data than these simulations predict, additional information contained in the data may strengthen prediction of disease severity. Specifically, from the plasma levodopa concentration curve and the MRI response data one computes not only ke but also EC50 and n, which also change with disease severity (9). Possibly combining all three parameter estimates may more accurately measure disease severity.
Optimal Dosing
Subjects with more advanced disease will show little response if they also happen to have low plasma levodopa levels. Solutions could include higher dosing for more severely affected individuals, though this choice could increase the risk of dyskinesias in the scanner that could affect comfort or head movement. Alternatively, if needed, one could estimate the optimal dose for each subject with, say, a single small test dose of i.v. levodopa with a pre- and post-drug blood sample, on a day prior to the scan day.
Head Movement
In our experience, most PD patients do well holding the head still during an MRI session. However, acquiring a single CBF image can take 6–34 s (34), an interval long enough that head movement on the scale of mm may be non-trivial. Participants with levodopa-induced dyskinesias may have additional head movement. Within-frame head movement adds to variance and may bias quantitative estimates. Solutions may include more rigid head fixation, shorter repetition times (TRs), prospective motion correction, or removing or underweighting CBF images compromised by movement (45).
Attention/Alertness
In initial pilot studies, we find that several factors combine to make continued alertness throughout the scan period difficult: PD patients often have insomnia, the scans are long and repetitive, and levodopa contributes to sleepiness. Solutions may include adding an attention task (though that will change resting brain activity), study staff repeatedly awakening the participant, or monitoring for alertness and removing or accounting statistically for frames during which the participant appears asleep.
Next Steps
The simplest first step to validating this method is correlative in nature. Specifically, one would enroll people with a wide variety of PD severity and compare regional ke values, most likely in midbrain or posterior putamen, to clinical measures of disease severity such as off-period UPDRS scores (46). More definitive validation of dopamine buffering imaging may include longer-term or autopsy studies in patients, necropsy studies in animals with graded nigrostriatal lesions, or comparison to the recently validated midbrain [11C]DTBZ PET approach (5). If these studies are successful, the dopamine buffering capacity imaging method will beg for further application as a surrogate marker of disease severity in PD.
Data Availability Statement
The data generated for this study can be found with the code used to generate it, at [https://bitbucket.org/kbmd/hysteresis/].
Ethics Statement
The studies involving human participants were reviewed and approved by Washington University Human Research Protection Office. The patients/participants provided their written informed consent to participate in this study.
Author Contributions
KB designed the study, generated the test data, and wrote the initial draft. HA and JK performed simulation testing and revised the text. All authors gave final approval for publication.
Funding
Supported in part by the National Institutes of Health (R01NS044598). Resting pCASL data acquisition was funded by the Michael J. Fox Foundation for Parkinson's Research and carried out in the East Building MIR Facility of the Washington University Medical Center. The funders had no role in study design, analysis, decision to publish, or preparation of the manuscript.
Conflict of Interest
KB and JK have intellectual property rights in the method described herein (U.S. patent 11,583,896 and application US2018/0286498A1).
The remaining author declares that the research was conducted in the absence of any commercial or financial relationships that could be construed as a potential conflict of interest.
Acknowledgments
Resting pCASL data acquisition used a sequence kindly supplied by Dr. Danny J. J. Wang. This manuscript has been released as a preprint at bioRxiv (47).
Supplementary Material
The Supplementary Material for this article can be found online at: https://www.frontiersin.org/articles/10.3389/fneur.2020.00370/full#supplementary-material
References
1. Hirschmann J, Mayer K. Zur beeinflussung der akinese und anderer extrapyramidal-motorischer störungen mit L-dopa (L-dihydroxyphenylalanin) [on the control of akinesia and other extrapyramidal motor disorders with L-dopa (L-dihydroxyphenylalanine)]. Dtsch Med Wochenschr. (1964) 89:1877–80. doi: 10.1055/s-0028-1113210
2. Gwinn K, David KK, Swanson-Fischer C, Albin R, Hillaire-Clarke CS, Sieber B-A, et al. Parkinson's disease biomarkers: perspective from the NINDS Parkinson's disease biomarkers program. Biomark Med. (2017) 11:451–73. doi: 10.2217/bmm-2016-0370
3. Ryman SG, Poston KL. MRI biomarkers of motor and non-motor symptoms in Parkinson's disease. Parkinson Relat Disord. (2019) S1353-8020:30429–8. doi: 10.1016/j.parkreldis.2019.10.002
4. Karimi M, Tian L, Brown CA, Flores HP, Loftin SK, Videen TO, et al. Validation of nigrostriatal positron emission tomography measures: critical limits. Ann Neurol. (2013) 73:390–6. doi: 10.1002/ana.23798
5. Brown CA, Karimi MK, Tian L, Flores H, Su Y, Tabbal SD, et al. Validation of midbrain positron emission tomography measures for nigrostriatal neurons in macaques. Ann Neurol. (2013) 74:602–10. doi: 10.1002/ana.23939
6. Marsden CD, Parkes JD. “On-off” effects in patients with Parkinson's disease on chronic levodopa therapy. Lancet. (1976) 1:292–6. doi: 10.1016/S0140-6736(76)91416-1
7. Sheiner LB, Stanski DR, Vozeh S, Miller RD, Ham J. Simultaneous modeling of pharmacokinetics and pharmacodynamics: application to D-tubocurarine. Clin Pharmacol Ther. (1979) 25:358–71. doi: 10.1002/cpt1979253358
8. Harder S, Baas H. Concentration-response relationship of levodopa in patients at different stages of Parkinson's disease. Clin Pharmacol Ther. (1998) 64:183–91. doi: 10.1016/S0009-9236(98)90152-7
9. Contin M, Riva R, Martinelli P, Albani F, Avoni P, Baruzzi A. Levodopa therapy monitoring in patients with Parkinson disease: a kinetic-dynamic approach. Ther Drug Monit. (2001) 23:621–29. doi: 10.1097/00007691-200112000-00005
10. Nutt JG, Woodward WR, Carter JH, Gancher ST. Effect of long-term therapy on the pharmacodynamics of levodopa. Relation to on-off phenomenon. Arch Neurol. (1992) 49:1123–30. doi: 10.1001/archneur.1992.00530350037016
11. Contin M, Riva R, Martinelli P, Cortelli P, Albani F, Baruzzi A. Longitudinal monitoring of the levodopa concentration-effect relationship in Parkinson's disease. Neurology. (1994) 44:1287–92. doi: 10.1212/WNL.44.7.1287
12. Nutt JG, Holford NH. The response to levodopa in Parkinson's disease: imposing pharmacological law and order. Ann Neurol. (1996) 39:561–73. doi: 10.1002/ana.410390504
13. Triggs EJ, Charles BG, Contin M, Martinelli P, Cortelli P, Riva R, et al. Population pharmacokinetics and pharmacodynamics of oral levodopa in Parkinsonian patients. Eur J Clin Pharmacol. (1996) 51:59–67. doi: 10.1007/s002280050161
14. Dietz M, Harder S, Graff J, Künig G, Vontobel P, Leenders KL, et al. Levodopa pharmacokinetic-pharmacodynamic modeling and 6-[18F]levodopa positron emission tomography in patients with Parkinson's disease. Clin Pharmacol Ther. (2001) 70:33–41. doi: 10.1067/mcp.2001.116328
15. Contin M, Martinelli P, Riva R, Dondi M, Fanti S, Pettinato C, et al. Assessing dopaminergic function in Parkinson's disease: levodopa kinetic-dynamic modeling and SPECT. J Neurol. (2003) 250:1475–81. doi: 10.1007/s00415-003-0257-3
16. Hershey T, Black KJ, Stambuk MK, Carl JL, McGee-Minnich LA, Perlmutter JS. Altered thalamic response to levodopa in Parkinson's patients with dopa-induced dyskinesias. Proc Natl Acad Sci USA. (1998) 95:12016–21. doi: 10.1073/pnas.95.20.12016
17. Hershey T, Black KJ, Carl JL, Perlmutter JS. Dopa-induced blood flow responses in nonhuman primates. Exp Neurol. (2000) 166:342–9. doi: 10.1006/exnr.2000.7522
18. Hershey T, Black KJ, Carl JL, McGee-Minnich L, Snyder AZ, Perlmutter JS. Long term treatment and disease severity change brain responses to levodopa in Parkinson's disease. J Neurol Neurosurg Psychiatry. (2003) 74:844–51. doi: 10.1136/jnnp.74.7.844
19. Black KJ, Hershey T, Hartlein JM, Carl JL, Perlmutter JS. Levodopa challenge neuroimaging of levodopa-related mood fluctuations in Parkinson's disease. Neuropsychopharmacology. (2005) 30:590–601. doi: 10.1038/sj.npp.1300632
20. Black KJ, Koller JM, Campbell MC, Gusnard DA, Bandak SI. Quantification of indirect pathway inhibition by the adenosine A2a antagonist SYN115 in Parkinson disease. J Neurosci. (2010) 30:16284–92. doi: 10.1523/JNEUROSCI.2590-10.2010
21. Stewart SB, Koller JM, Campbell MC, Black KJ. Arterial spin labeling versus BOLD in direct challenge and drug-task interaction pharmacological fMRI. PeerJ. (2014) 2:e687. doi: 10.7717/peerj.687
22. Chen Y, Pressman P, Simuni T, Parrish TB, Gitelman DR. Effects of acute levodopa challenge on resting cerebral blood flow in Parkinson's disease patients assessed using pseudo-continuous arterial spin labeling. PeerJ. (2015) 3:e1381. doi: 10.7717/peerj.1381
23. Contin M, Riva R, Martinelli P, Procaccianti G, Cortelli P, Avoni P, et al. Response to a standard oral levodopa test in Parkinsonian patients with and without motor fluctuations. Clin Neuropharmacol. (1990) 13:19–28. doi: 10.1097/00002826-199002000-00002
24. Sohn YH, Metman LV, Bravi D, Linfante I, Aotsuka A, Mouradian MM, et al. Levodopa peak response time reflects severity of dopamine neuron loss in Parkinson's disease. Neurology. (1994) 44:755–7. doi: 10.1212/WNL.44.4.755
25. Nutt JG, Carter JH, Lea ES, Sexton GJ. Evolution of the response to levodopa during the first 4 years of therapy. Ann Neurol. (2002) 51:686–93. doi: 10.1002/ana.10189
26. Black KJ, Carl JL, Hartlein JM, Warren SL, Hershey T, Perlmutter JS. Rapid intravenous loading of levodopa for human research: clinical results. J Neurosci Methods. (2003) 127:19–29. doi: 10.1016/S0165-0270(03)00096-7
27. Robertson DR, Wood ND, Everest H, Monks K, Waller DG, Renwick AG, et al. The effect of age on the pharmacokinetics of levodopa administered alone and in the presence of carbidopa. Br J Clin Pharmacol. (1989) 28:61–9. doi: 10.1111/j.1365-2125.1989.tb03506.x
28. Oliphant TE. Guide to NumPy. 2nd edn. Austin, TX: Continuum Press (2015). Available online at: https://www.amazon.com/Guide-NumPy-Travis-Oliphant-PhD/dp/151730007X/
29. Hunter JD. Matplotlib: a 2D graphics environment. Comput Sci Eng. (2007) 9:90–5. doi: 10.1109/MCSE.2007.55
30. Holford NH, Sheiner LB. Understanding the dose-effect relationship: clinical application of pharmacokinetic-pharmacodynamic models. Clin Pharmacokinet. (1981) 6:429–53. doi: 10.2165/00003088-198106060-00002
31. Unadkat JD, Bartha F, Sheiner LB. Simultaneous modeling of pharmacokinetics and pharmacodynamics with nonparametric kinetic and dynamic models. Clin Pharmacol Ther. (1986) 40:86–93. doi: 10.1038/clpt.1986.143
32. Maxima. wxMaxima, a Computer Algebra System. (2014). Available online at: https://wxmaxima-developers.github.io/wxmaxima/help.html (accessed May 31, 2019).
33. Hoehn MM, Yahr MD. Parkinsonism: onset, progression and mortality. Neurology. (1967) 17:427–42. doi: 10.1212/WNL.17.5.427
34. Wang DJJ, Alger JR, Qiao JX, Hao Q, Hou S, Fiaz R, et al. The value of arterial spin-labeled perfusion imaging in acute ischemic stroke: comparison with dynamic susceptibility contrast-enhanced MRI. Stroke. (2012) 43:1018–24. doi: 10.1161/STROKEAHA.111.631929
35. Kilroy E, Apostolova L, Liu C, Yan L, Ringman J, Wang DJJ. Reliability of two-dimensional and three-dimensional pseudo-continuous arterial spin labeling perfusion MRI in elderly populations: comparison with 15O-water positron emission tomography. J Magn Reson Imaging. (2014) 39:931–9. doi: 10.1002/jmri.24246
36. Newville M, Otten R, Nelson A, Ingargiola A, Stensitzki T, Allan DB, et al. LMFIT: Non-Linear Least-Square Minimization and Curve-Fitting for Python. (2019). Available online at: https://zenodo.org/record/2620617 (accessed May 31, 2019).
37. Hurley D. FDA committee: rasagiline rejected as “disease modifying” for Parkinson disease. Neurology Today. (2011) 11:1. doi: 10.1097/01.NT.0000407898.33659.0c
38. The Michael J. Fox Foundation For Parkinson's Research. Biomarkers Priority Area. (2018). Availble online at: http://www.webcitation.org/74c3hP06K (accessed December 11, 2018).
39. Kehagia AA. Neuropsychiatric symptoms in Parkinson's disease: beyond complications. Front Psychiatry. (2016) 7:110. doi: 10.3389/fpsyt.2016.00110
40. Chan PLS, Nutt JG, Holford NHG. Pharmacokinetic and pharmacodynamic changes during the first four years of levodopa treatment in Parkinson's disease. J Pharmacokinet Pharmacodyn. (2005) 32:459–84. doi: 10.1007/s10928-005-0055-x
41. Holford NHG, Chan PLS, Nutt JG, Kieburtz K, Shoulson I, Parkinson Study Group. Disease progression and pharmacodynamics in Parkinson disease - evidence for functional protection with levodopa and other treatments. J Pharmacokinet Pharmacodyn. (2006) 33:281–311. doi: 10.1007/s10928-006-9012-6
42. Siddiqi SH, Abraham NK, Geiger CL, Karimi M, Perlmutter JS, Black KJ. The human experience with intravenous levodopa. Front Pharmacol. (2015) 6:307. doi: 10.3389/fphar.2015.00307
43. Karimi M, Carl JL, Loftin S, Perlmutter JS. Modified high-performance liquid chromatography with electrochemical detection method for plasma measurement of levodopa, 3-O-methyldopa, dopamine, carbidopa and 3,4-dihydroxyphenyl acetic acid. J Chromatogr B Analyt Technol Biomed Life Sci. (2006) 836:120–23. doi: 10.1016/j.jchromb.2006.03.027
44. Koller JM, Vachon MJ, Bretthorst GL, Black KJ. Rapid quantitative pharmacodynamic imaging with Bayesian estimation. Front Neurosci. (2016) 10:144. doi: 10.3389/fnins.2016.00144
45. Tanenbaum AB, Snyder AZ, Brier MR, Ances BM. A method for reducing the effects of motion contamination in arterial spin labeling magnetic resonance imaging. J Cereb Blood Flow Metab. (2015) 35:1697–702. doi: 10.1038/jcbfm.2015.124
46. Fahn S, Elton R, UPDRS program members. Unified Parkinson's disease rating scale. In: Fahn S, Marsden CD, Goldstein M, Calne DB, editors. Recent Developments in Parkinson's Disease, Vol. 2. Florham Park, NJ: Macmillan Healthcare Information (1987). p. 153–63, 293–304.
Keywords: phMRI, drug discovery and development, pharmacological biomarkers, levodopa, pharmacodynamics, hysteresis, pharmacokinetic-pharmacodynamic modeling, ASL
Citation: Black KJ, Acevedo HK and Koller JM (2020) Dopamine Buffering Capacity Imaging: A Pharmacodynamic fMRI Method for Staging Parkinson Disease. Front. Neurol. 11:370. doi: 10.3389/fneur.2020.00370
Received: 18 February 2020; Accepted: 14 April 2020;
Published: 06 May 2020.
Edited by:
Edward Ofori, Arizona State University, United StatesReviewed by:
Konstantinos Kalafatakis, University of Ioannina, GreeceBo Gao, Affiliated Hospital of Guizhou Medical University, China
Copyright © 2020 Black, Acevedo and Koller. This is an open-access article distributed under the terms of the Creative Commons Attribution License (CC BY). The use, distribution or reproduction in other forums is permitted, provided the original author(s) and the copyright owner(s) are credited and that the original publication in this journal is cited, in accordance with accepted academic practice. No use, distribution or reproduction is permitted which does not comply with these terms.
*Correspondence: Kevin J. Black, a2V2aW5Ad3VzdGwuZWR1