 Maria Marcella Laganà1†
 Alice Pirastru1*†
 Laura Pelizzari1
 Federica Rossetto1
 Sonia Di Tella1
 Niels Bergsland1,2
 Raffaello Nemni1,3
 Mario Meloni1
 Francesca Baglio1
- 1IRCCS, Fondazione Don Carlo Gnocchi ONLUS, Milan, Italy
- 2Department of Neurology, Buffalo Neuroimaging Analysis Center, School of Medicine and Biomedical Sciences, University at Buffalo, State University of New York, Buffalo, NY, United States
- 3Department of Pathophysiology and Transplantation, Università degli Studi di Milano, Milan, Italy
Parkinson's disease (PD) is a multisystem neurological condition affecting different neurotransmitter pathways characterized by aberrant functional connectivity (FC) and perfusion alteration. Since the FC, measuring neuronal activity, and cerebral blood flow (CBF) are closely related through the neurovascular coupling (NVC) mechanism, we aim to assess whether FC changes found in PD mirror perfusion ones. A multimodal MRI study was implemented by acquiring resting state functional MRI (rsfMRI) and arterial spin labeling (ASL) datasets on a group of 26 early PD (66.8 ± 8 years, 22 males, median [interquartile range] Hoehn and Yahr = 1.5 [1]) and 18 age- and sex-matched healthy controls (HCs). In addition, a T1-weighted MPRAGE was also acquired in the same scan session. After a standard preprocessing, resting state networks (RSNs) and CBF maps were extracted from rsfMRI and ASL dataset, respectively. Then, by means of a dual regression algorithm performed on RSNs, a cluster of FC differences between groups was obtained and used to mask CBF maps in the subsequent voxel-wise group comparison. Furthermore, a gray matter (GM) volumetric assessment was performed within the FC cluster in order to exclude tissue atrophy as a source of functional changes. Reduced FC for a PD patient with respect to HC group was found within a sensory-motor network (SMN, pFWE = 0.01) and visual networks (VNs, primary pFWE = 0.022 and lateral pFWE = 0.01). The latter was accompanied by a decreased CBF (primary pFWE = 0.037, lateral pFWE = 0.014 VNs), while no GM atrophy was detected instead. The FC alteration found in the SMN of PD might be likely due to a dopaminergic denervation of the striatal pathways causing a functional disconnection. On the other hand, the changes in connectivity depicted in VNs might be related to an altered non-dopaminergic system, since perfusion was also reduced, revealing a compromised NVC. Finally, the absence of GM volume loss might imply that functional changes may potentially anticipate neurodegeneration. In this framework, FC and CBF might be proposed as early functional biomarkers providing meaningful insights in evaluating both disease progression and therapeutic/rehabilitation treatment outcome.
Introduction
Parkinson's disease (PD) is one of the most frequent neurodegenerative disorders affecting over four million people worldwide (1). PD is clinically characterized by both motor symptoms, such as tremor, bradykinesia, and rigidity, and non-motor ones, including cognitive impairment, neuropsychiatric symptoms, and autonomic dysfunction (2, 3). From a neuropathological point of view, PD can be considered as a multisystem brain disorder (4, 5) affecting different neurotransmitter pathways. The dopaminergic denervation of striatal pathways is considered the cardinal signature of PD, and it is often linked to motor symptoms (5). The other pathophysiological feature of PD is the progressive deposition of α-synuclein in cholinergic and monoaminergic brain neurons, concurrent with the evolution of Lewy body pathology (6).
The scientific community has shown a great interest in trying to identify non-invasive imaging biomarkers that may improve our understanding of the mechanisms underlying PD. In this framework, both resting state functional magnetic resonance imaging (rsfMRI) and arterial spin labeling (ASL) have provided considerable insights into the neural correlates of PD, detecting functional connectivity (FC) and cerebral blood flow (CBF) alterations, respectively.
FC alterations in PD have been extensively reported both in terms of increased and decreased connectivity (7, 8). Increased blood oxygen level dependent (BOLD) signal was found in primary and secondary motor cortices and the middle frontal gyrus of PD patients (9). On the other hand, decreased FC was observed in the supplementary motor area (SMA) (10) and between temporal regions and left occipital cortex and left lingual gyrus (11). Furthermore, reduced FC in posterior cortical regions has been associated with global cognitive decline (12), while the disruption of anticorrelation patterns between the occipito-parietal areas and the default mode network correlated with visuospatial deficits in PD (13).
Besides FC changes, perfusion alterations were also observed in PD (14, 15). Perfusion was found to be reduced in pre-SMA (16). Reduced CBF was also reported in occipital and parietal cortices (14, 17), precuneus and cuneus (17), and frontal cortex (16) bilaterally. Hypoperfusion was hypothesized to be related to the alteration of cholinergic, serotoninergic, and noradrenergic neurotransmitter pathways in PD (16, 18, 19). Although several studies reported no perfusion changes in PD (18, 20, 21), in Pelizzari et al. (21), the resulting CBF correlated with symptoms severity, while Al-Bachari et al. (18) revealed a prolonged arterial arrival time confirming an aberrant neurovascular status of PD.
Since BOLD signal reflects changes in the venous oxygenation level (22), rsfMRI contrast is closely dependent on CBF (23). The neuronal activity and cerebral perfusion are strictly related by means of the physiological mechanism known as neurovascular coupling (NVC), which enables the prompt adaptation of brain perfusion to the (local) metabolic demand. Evidence of injury to both neural innervations and capillaries were reported in idiopathic PD (19), suggesting that the neurovascular unit is affected at different levels in PD. For these reasons, cross-talk between observed FC and CBF alterations in PD cannot be excluded.
In order to better understand the relationship between neural activity and perfusion alterations in PD, we conducted a multimodal MRI study by concurrently assessing FC and CBF by means of rsfMRI and ASL, respectively. We aimed to investigate whether the FC changes found in PD reflect perfusion alterations. Gray matter (GM) volume was also assessed to exclude atrophy as a confounding factor of functional and perfusion changes.
Methods
Demographic and Clinical Evaluation
Twenty-six PD patients and 18 age and sex-matched healthy controls (HC) were enrolled in this study. The inclusion criteria for the PD patients were as follows: (1) a diagnosis of idiopathic PD according to the Movement Disorder Society Clinical Diagnostic Criteria for PD (24); (2) absence of neuropsychiatric disorders beside PD diagnosis at clinical evaluation; (3) absence of neurovascular diseases at clinical evaluation, documented also with previous MRI/CT examination; (4) Positive DaTscan; (5) mild to moderate stage of the disease with a scoring between stages 1 and 3 of the Modified Hoehn and Yahr (H&Y) Scale (25); (6) stable drug therapy with either L-Dopa or dopamine agonists; (7) freezing assessed with UPDRS part II lower than 2; and (8) time spent with dyskinesias assessed with UPDRS part IV lower than 2. HC were included after assessing the absence of any neurological and/or neuropsychiatric disorder and/or neurovascular diseases.
All participants were right-handed.
For PD patients, the clinical evaluation included the quantification of the disease stage with H&Y and the assessment of the symptom severity with UPDRS motor part III (UPDRS III) performed by an experienced neurologist. Moreover, PD patients were classified as either tremor dominant or akinetic-rigid (26). Drug administration was recorded, and levodopa equivalent daily dose (LEDD) was calculated as suggested in Tomlinson et al. (27).
The global cognitive level of all the participants was assessed with the Montreal Cognitive Assessment (MoCA) test.
The study was performed in accordance with the principles of the Helsinki Declaration and by previous approval from the IRCSS Fondazione Don Carlo Gnocchi Ethics Committee. Written informed consent was signed by each participant.
MRI Acquisition
All the subjects underwent a magnetic resonance imaging (MRI) examination performed on a 1.5T Siemens Avanto scanner (Erlangen, Germany) equipped with a 12-channel head coil. The acquisition comprised: (1) a 3D high-resolution magnetization-prepared rapid gradient echo (MPRAGE) T1-weighted image [repetition time (TR) = 1,900 ms, echo time (TE) = 3.3 ms, inversion time (TI) = 1,100 ms, matrix size = 192 × 256 × 176, resolution = 1 mm3 isotropic]; (2) a multi-echo resting state fMRI (ME-rsfMRI) sequence (TR = 2,570 ms, TE = 15/34/54 ms, matrix size = 64 × 64 × 31, resolution = 3.75 × 3.75 × 4.5 mm3, 200 volumes); (3) a double-echo GRE field map (TR = 528 ms, TE = 4.76/9.52 ms, matrix size = 100 × 100 × 42, resolution = 3.2 × 3.2 × 3.3 mm3); and (4) a 3D gradient and spin echo (GRASE) multidelay pseudo-continuous arterial spin labeling (pCASL) with background suppression sequence [TR/TE = 3,500/22.58 ms, labeling duration = 1,500 ms, 5 post-labeling delays (PLD) = 700/1200/1700/2200/2700 ms, 12 pairs of tag/control volumes, matrix size = 64 × 64 × 32, resolution = 3.5 × 3.5 × 5 mm3, distance between the center of imaging slices and labeling plane = 90 mm].
MRI Analysis
The image processing was performed by means of FMRIB Software Library (FSL, http://www.fmrib.ox.ac.uk/fsl) toolboxes 5.0.6 if not otherwise specified.
The pipeline of MRI processing is schematized in Figure 1.
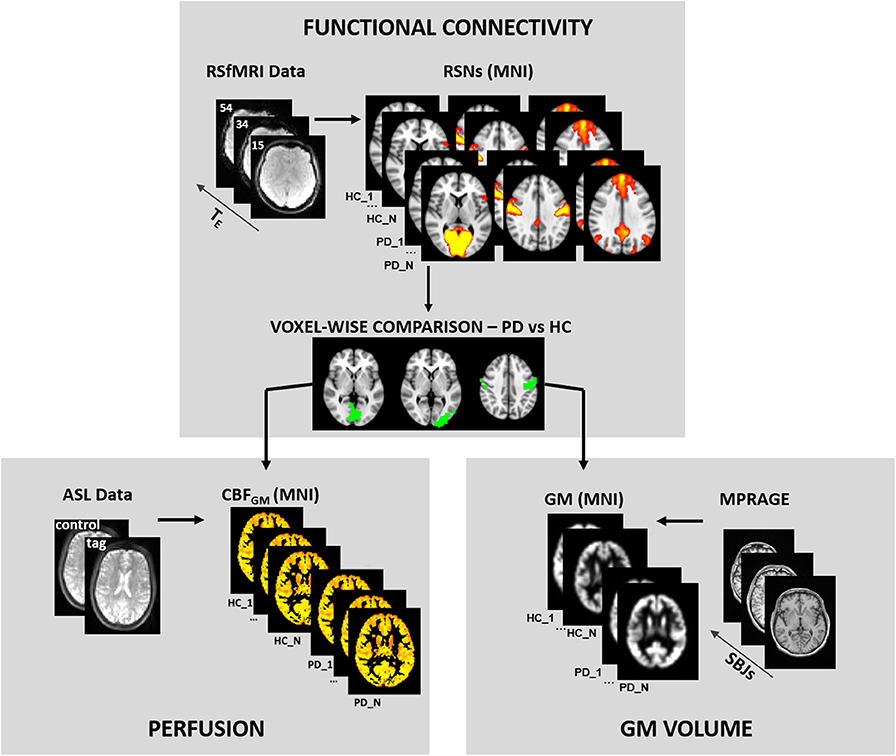
Figure 1. MRI analysis pipeline. The figure shows the pipeline of MRI analyses. Briefly, the preprocessing is shown in each panel for the different modalities. The functional results of the comparison between healthy control (HC) and Parkinson's disease (PD) groups were used as masks of the statistical analysis of perfusion and gray matter maps.
Pre-processing of MRI Data
3D-T1 MPRAGE
The MPRAGE, which was used as an anatomical reference for registration purposes, was skull-stripped by means of bet toolbox (28), then the SIENAX algorithm (29) was run in order to segment the brain tissues in GM, white matter (WM), and cerebrospinal fluid. A voxel-based morphometry (VBM) analysis (30) was then carried out. Specifically, a symmetrical study-specific template was created in MNI standard space; then, using a non-linear registration, individual GM images were aligned to the study-specific template. Finally, the GM images were spatially smoothed with σ = 3.
rsfMRI Dataset
Movement parameters were estimated for each subject-specific ME-rsfMRI dataset by means of FEAT (31). Subjects presenting with relative movement <0.5 mm were excluded from the study. The first 10 volumes (out of 200) were discarded to allow for magnetization stabilization.
The rsfMRI dataset was then preprocessed with the ME-Independent Component Analysis (ICA) algorithm (32, 33). After standard preprocessing comprising motion correction and realignment, the MEICA algorithm performed the estimation of an optimal combination of the three echoes together with a denoising step, based on the TE dependencies, of the ICA-derived components. The denoised volume was then aligned with the subjects' MPRAGE by means of a linear transformation performed using a Boundary-Based registration (BBR) (34, 35). The BBR simultaneously performed the registration and the distortion correction using the acquired field map.
MPRAGE images were normalized to the Montreal Neurological Institute (MNI) atlas using the advanced normalization tools (ANTs; http://stnava.github.io/ANTs) (36) and subsequently used to align the functional data to standard space.
ASL Dataset
The preprocessing of the pCASL dataset included realignment and motion correction of the original tag and control volumes, using ANT's software package. The group of 12 tag and control volumes acquired with the same delay was then separately averaged. The estimation and calibration of cerebral blood flow maps were performed by means of oxford_asl and asl_calib tools (37) respectively, by setting the required parameters as follows: T1 of brain tissue = 1.2 s, T1 of blood = 1.36 s, tagging efficiency = 0.8 accordingly (38, 39). Partial volume correction was performed using GM and WM masks derived from the MPRAGE and registered to the ASL space and considering GM perfusion as 2.5 that of WM, as described in Marshall et al. (40). Then, corrected CBF maps were non-linearly registered to the MNI standard space and smoothed with a Gaussian kernel (σ = 3).
Group Level Analyses
For group analysis, the rsfMRI datasets were then decomposed in spatial independent components (IC) by means of the MELODIC toolbox (41) setting the dimensionality to 20. The derived IC were visually classified in order to detect the well-defined Smith's resting state networks (RSN) described in Smith et al. (42). Dual regression (43, 44), one on the group spatial maps and one on the subject's time series, was run on the group ICA derived from the functional dataset and allowed to derive subject-specific spatial maps. Then the comparison between the PD and HC groups was implemented through a randomize tool (45) using threshold-free cluster enhancement (TFCE) with 5,000 permutations. Furthermore, in the PD patient group, a partial correlation (age and sex as covariates) between z-values extracted from the clusters of significant FC differences and UPDRS III was performed.
In order to understand if the FC changes were accompanied by perfusion or volumetric alterations, we also performed a voxel-wise analysis of CBF and GM volume, comparing PD and HC in the areas of FC differences. The statistics were carried out by means of the randomize tool with 5,000 permutations and cluster detection with TFCE (45), and were restricted within the cluster of significant FC difference between the two groups (Figure 1), using them as masks. The percentage of the altered FC cluster that reported CBF differences was also computed. Finally, in the PD group patients, to test the effect of levodopa treatment on our perfusion results, we assessed the correlation between the CBF values of the significant cluster and LEDD.
Results
Sample Demographic and Neuropsychological Evaluation
Demographic data and neuropsychological scores are reported in Table 1 for the two groups. PD patients and HCs were age- and sex-matched at the group level; the clinical phenotype of patients was tremor-dominant in 54% and akinetic-rigid in 46%. Five patients were treated with antidepressant (mirtazapine or escitalopram or duloxetine), and only three patients were taking low dose of benzodiazepine (prazepam or alprazolam). The overall cognitive performance was in the range of normality for both HC and PD. However, the comparison between the MoCA total score of HC and PD revealed a significant reduction in PD (26.4 vs. 24.8, p = 0.025) and in the subscores of visuospatial (p = 0.002) and memory (p < 0.001) functions (Table 1). None of the enrolled subjects was excluded for excessive movements.
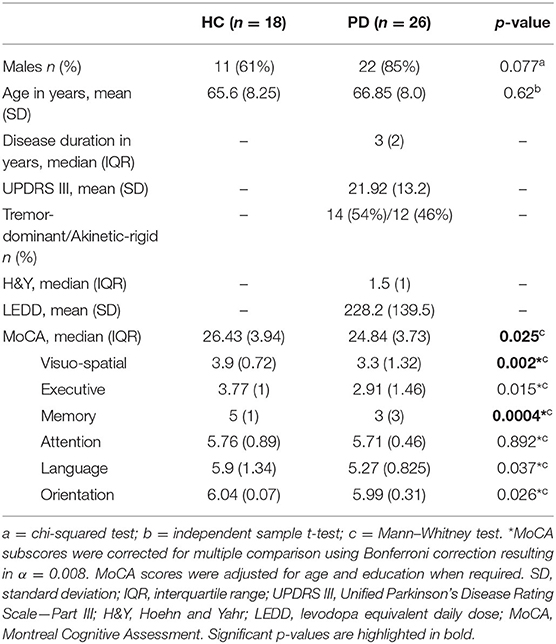
Table 1. Demographic characteristic of HC and PD groups.
Functional Connectivity Results
Eleven ICs out of 20 were classified as RSN according to Beckmann et al. (46) and are reported in Supplementary Figure 1.
Significantly lower FC was observed for PD patients within the sensory-motor network (pFWE = 0.01) and within the primary (pFWE = 0.022) and lateral (pFWE = 0.01) visual RSNs (Figure 2A). The maximum peak, the extension, and the localization of the clusters of significant FC difference are reported in Table 2.
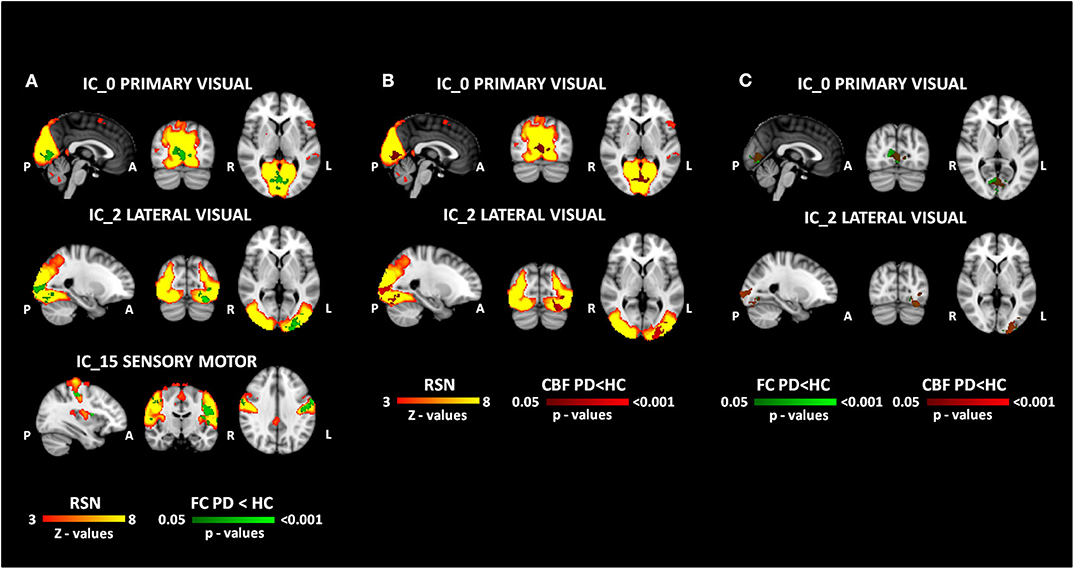
Figure 2. MRI results. The results of functional and perfusion MRI analyses are reported in the figure. (A) The functional changes (FC HC > FC PD in green) within the resting state networks (red-yellow). (B) The perfusion changes (CBF HC > CBF PD in red) overlapped to the functional network (red-yellow). (C) The overlap between functional (green) and perfusion (red) clusters of significant differences. All the reported p-values are FWE corrected.
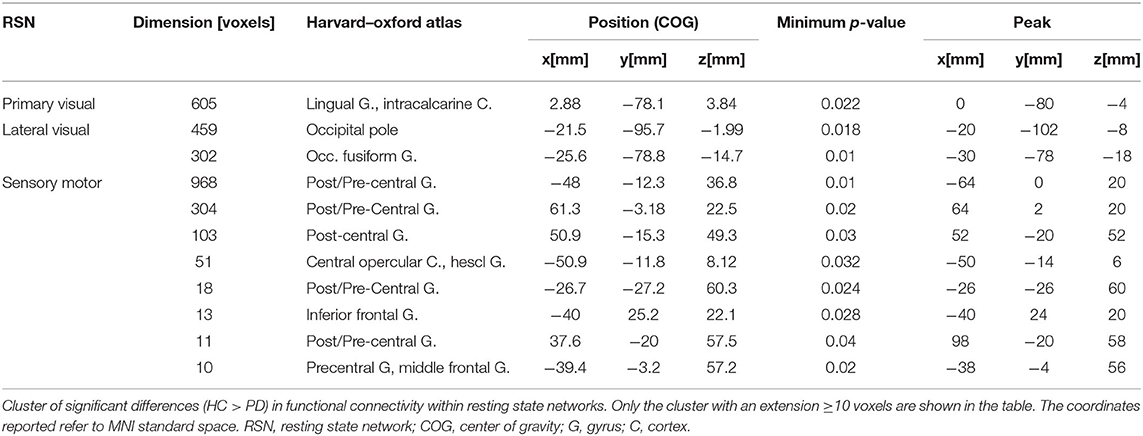
Table 2. Functional connectivity differences.
Furthermore, the partial correlation showed a negative trend (p = 0.06, r = −0.38) between the z-values of the sensory-motor network and the UPDRS III score for PD patients.
Perfusion Results
Perfusion alterations were found both within primary (pFWE = 0.037) and lateral (pFWE = 0.014) visual networks, whereas no difference in CBF was detected in the sensory-motor one (Figure 2B). The maximum peak, the extension, and the localization of the clusters of CBF significant difference are reported in Table 3. The percentage of the overlap resulted in 46% and 74% of voxels for primary and lateral visual components, respectively (Figure 2C). The alteration in CBF did not correlate with any clinical variable, and no significant relationship between the CBF values of the significant CBF clusters and LEDD variables was found (r = 0.063, p = 0.763 for primary visual network and r = 0.141, p = 0.502 for the lateral visual one).

Table 3. Perfusion differences.
VBM Results
No GM atrophy was found concurrent with the functional alteration for our cohort of early PD patients when compared to HC.
Discussion
The present work aimed to study the relationship between changes in FC and altered perfusion reported in PD. To do so, we concurrently assessed FC and CBF in a cohort of early PD patients and HC by means of rsfMRI and ASL, respectively. FC changes were found in the sensory-motor and visual cortices of our PD patients. Interestingly, the FC alterations within the visual cortex were also accompanied by altered CBF.
The significant FC reduction that we observed in the SMN extended between pre- and post-central gyri and also comprised part of the middle frontal gyrus. Consistently, other studies using an ICA-based approach had previously evidenced changes in FC specific to the SMN in resting conditions. Canu et al. showed a decreased connectivity within the SMA and primary motor cortex, belonging to the SMN, in PD compared to HC (47), confirming previous findings of reduced SMA FC (48). Moreover, the aberrant FC pattern that we detected in our sample was linked to symptom severity measured using MDS-UPDRS III. We hypothesized that the altered SMN FC might be related to a disconnection of the striatal pathways following dopaminergic denervation. In fact, paralleling the neuropathological progression of PD, decreased FC between cortical and subcortical motor areas involving the dopaminergic corticostriatal loop has been reported (49).
In this study a significant FC decrease was also observed in primary (lingual gyrus and intracalcarine cortex) and lateral (inferior lateral occipital cortex, specifically occipital pole, and fusiform gyrus) VNs. The key regions of the primary visual areas are related to visual awareness, whereas the secondary visual network is involved in visual experience (50). Our findings point to dysfunction not only of the primary visual system but also of higher visual processing areas in the extrastriate cortex. The decreased activity of the primary visual network is probably due to specific PD-associated retinopathy targeting the striate visual areas (51). The functional alteration of the extrastriate visual pathways is supported by the significantly lower visuospatial performances (as assessed using MoCA subscales) that were found in our PD patients with respect to HC.
Similar FC changes have already been reported in literature (11, 52). Interestingly, the decreased connectivity within the primary and lateral VNs was accompanied by a significant CBF reduction. Our perfusion results are in line with previous studies quantitatively investigating vascular alteration in PD by means of ASL (16, 17, 53) or other modalities (14). Specifically, Melzer and colleagues reported preserved perfusion in post- and pre-central gyri, while perfusion was reduced in the posterior parieto-occipital cortex, similarly to Syrimi et al. (53). Abe et al. (14) also found reduced CBF in the same region by means of single-photon emission computed tomography.
The functional and perfusion changes were extensively concurrent in the visual RSN, with an overlap ranging from 46% to 74% in our PD sample. The hypoperfusion that we found in occipital areas concurrently to a decrease in FC may be indicative of a possible impairment of the NVC mechanism in PD. It has been previously proposed that CBF reductions might be due to modifications of non-dopaminergic transmitter systems (specifically cholinergic, serotoninergic, and noradrenergic) and their neurovascular innervation of the neocortex (16, 18, 19, 54). Contextually, Shimada et al. (55) reported an alteration of the cholinergic system in PD patients without dementia, which was most significant in the medial occipital cortex. According to Braak staging (56), neuronal cholinergic degeneration occurs at the same stage of nigral pathology, which characterizes relatively early phases of the disease. Thus, we hypothesize that structural and microstructural changes in the noradrenergic and cholinergic system nuclei at this stage of the pathology may be the cause of the alteration of the coupling between neural activity and blood flow observed in visual areas of our early PD patients [H&Y median (IQR), 1.5 (1)].
Furthermore, the FC and CBF alterations in VNs were not accompanied by local GM atrophy, suggesting that functional changes occur prior to tissue loss. Evidence from recent studies reporting CBF reductions at the early stage of the disease in cortical regions without manifested pathology (16, 57) supports this hypothesis. Moreover, Fernandez-Seara et al. (16) demonstrated that there is not a direct correspondence between GM atrophy and hypoperfusion, with the latter being more extensive throughout the brain.
One of the main drawbacks regarding FC studies in PD is the heterogeneity of the results presented in the literature, likely due to clinically variegated samples of patients and different methodological approaches. For these reasons, in the present study, we used a well-established data-driven ICA-approach together with a dual regression analysis. This method investigates all the GM voxels and exploits the simultaneous analysis of several subjects, thus increasing the signal-to-noise ratio (58). This study is not without limitations. First, a 1.5T field scanner was employed for data acquisition. Despite being extensively used in the clinical setting, 1.5T MRI has relatively low signal-to-noise ratio. For this reason, both the rsfMRI and ASL sequences were set to partially mitigate this problem. Specifically, a multi-echo rsfMRI sequence was employed to improve the image contrast and to reduce image distortions by means of an optimal combination of the volumes acquired at three different echo times (32). For what concerns the ASL sequence, a pseudocontinuous acquisition scheme was used, together with a background suppressed 3D gradient and spin echo readout, aiming to enhance both SNR and signal tagging efficiency, as recommended by international guidelines (59). Another limitation of the study is the relatively small size of the sample, which may have prevented us from showing significant correlations between clinical and neuroimaging parameters. Furthermore, levodopa and benzodiazepines/antidepressants may interfere with fMRI (60, 61) and CBF analysis (62, 63). However, a group of clinically homogeneous patients, under stable pharmacological treatment, was considered, and when we tested the effect of levodopa treatment on our perfusion results, no significant relationship between the variables was found. Finally, only MoCA scores and subscales were available for our sample, so the addition of more precise neuropsychological tests should be considered.
Altogether, our results suggest that MRI-derived measures, such as FC and CBF, may constitute valuable biomarkers to detect early neurovascular dysfunction occurring in PD prior to structural modification in terms of GM atrophy. Since FC and CBF provide complementary information about the neurovascular unit physiology, concurrently assessing both of them is crucial. Multimodal longitudinal studies are warranted to better understand the evolution of neurovascular dysfunction along with PD disease progression and to monitor treatment-related changes due to pharmacological and/or rehabilitative interventions.
Data Availability Statement
The datasets generated for this study are available on request to the corresponding author.
Ethics Statement
The studies involving human participants were reviewed and approved by Fondazione Don Carlo Gnocchi Local Ethics Committee. The patients/participants provided their written informed consent to participate in this study.
Author Contributions
ML, AP, and FB contributed to the conception and design of the study. AP, NB, and LP performed the MRI data analysis. AP and ML performed the statistical analyses. AP wrote the first draft of the manuscript. FR and SD performed the neuropsychological evaluation. RN, FB, and MM recruited subjects and performed the clinical evaluation. All authors participated in reviewing the work, providing important intellectual content, and approving the final form.
Funding
This study was funded by the Italian Ministry of Health (Ricerca Corrente 2018–2020).
Conflict of Interest
The authors declare that the research was conducted in the absence of any commercial or financial relationships that could be construed as a potential conflict of interest.
Acknowledgments
We acknowledge the receipt of multidelay pCASL sequence from the University of Southern California's Stevens Neuroimaging and Informatics Institute. We also acknowledge the Regents of the University of California, on behalf of its Los Angeles campus, as a source of portions of the Licensed Technology. Finally, we acknowledge that Dr. DJJ Wang and SIEMENS Healthineers helped in setting the sequence on our scanner.
Supplementary Material
The Supplementary Material for this article can be found online at: https://www.frontiersin.org/articles/10.3389/fneur.2020.00831/full#supplementary-material
References
1. Foffani G, Obeso JA. A cortical pathogenic theory of Parkinson's disease. Neuron. (2018) 99:1116–28. doi: 10.1016/j.neuron.2018.07.028
2. Kalia LV, Lang AE. Parkinson's disease. Lancet. (2015) 386:896–912. doi: 10.1016/S0140-6736(14)61393-3
3. Marras C, Chaudhuri KR. Nonmotor features of Parkinson's disease subtypes. Mov Disord. (2016) 31:1095–102. doi: 10.1002/mds.26510
4. Poewe W, Seppi K, Tanner CM, Halliday GM, Brundin P, Volkmann J, et al. Parkinson disease. Nat Rev Dis Primers. (2017) 3:17013. doi: 10.1038/nrdp.2017.13
5. Papagno C, Trojano L. Cognitive and behavioral disorders in Parkinson's disease: an update. I: cognitive impairments. Neurol Sci. (2018) 39:215–23. doi: 10.1007/s10072-017-3154-8
6. Jahanshahi M, Obeso I, Rothwell JC, Obeso JA. A fronto-striato-subthalamic-pallidal network for goal-directed and habitual inhibition. Nat Rev Neurosci. (2015) 16:719–32. doi: 10.1038/nrn4038
7. Tessitore A, Giordano A, De Micco R, Russo A, Tedeschi G. Sensorimotor connectivity in Parkinson's disease: the role of functional neuroimaging. Front Neurol. (2014) 5:180. doi: 10.3389/fneur.2014.00180
8. Tessitore A, Cirillo M, De Micco R. Functional connectivity signatures of Parkinson's disease. J Parkinsons Dis. (2019) 9:637–52. doi: 10.3233/JPD-191592
9. Kwak Y, Peltier SJ, Bohnen NI, Muller ML, Dayalu P, Seidler RD. L-DOPA changes spontaneous low-frequency BOLD signal oscillations in Parkinson's disease: a resting state fMRI study. Front Syst Neurosci. (2012) 6:52. doi: 10.3389/fnsys.2012.00052
10. Wu T, Wang L, Chen Y, Zhao C, Li K, Chan P. Changes of functional connectivity of the motor network in the resting state in Parkinson's disease. Neurosci Lett. (2009) 460:6–10. doi: 10.1016/j.neulet.2009.05.046
11. Luo C, Guo X, Song W, Chen Q, Yang J, Gong Q, et al. The trajectory of disturbed resting-state cerebral function in Parkinson's disease at different hoehn and yahr stages. Hum Brain Mapp. (2015) 36:3104–16. doi: 10.1002/hbm.22831
12. Olde Dubbelink KT, Schoonheim MM, Deijen JB, Twisk JW, Barkhof F, Berendse HW. Functional connectivity and cognitive decline over 3 years in Parkinson disease. Neurology. (2014) 83:2046–53. doi: 10.1212/WNL.0000000000001020
13. Baggio HC, Segura B, Sala-Llonch R, Marti MJ, Valldeoriola F, Compta Y, et al. Cognitive impairment and resting-state network connectivity in Parkinson's disease. Hum Brain Mapp. (2015) 36:199–212. doi: 10.1002/hbm.22622
14. Abe Y, Kachi T, Kato T, Arahata Y, Yamada T, Washimi Y, et al. Occipital hypoperfusion in Parkinson's disease without dementia: correlation to impaired cortical visual processing. J Neurol Neurosurg Psychiatry. (2003) 74:419–22. doi: 10.1136/jnnp.74.4.419
15. Teune LK, Renken RJ, De Jong BM, Willemsen AT, Van Osch MJ, Roerdink JB, et al. Parkinson's disease-related perfusion and glucose metabolic brain patterns identified with PCASL-MRI and FDG-PET imaging. Neuroimage Clin. (2014) 5:240–4. doi: 10.1016/j.nicl.2014.06.007
16. Fernandez-Seara MA, Mengual E, Vidorreta M, Aznarez-Sanado M, Loayza FR, Villagra F, et al. Cortical hypoperfusion in Parkinson's disease assessed using arterial spin labeled perfusion MRI. Neuroimage. (2012) 59:2743–50. doi: 10.1016/j.neuroimage.2011.10.033
17. Melzer TR, Watts R, Macaskill MR, Pearson JF, Rueger S, Pitcher TL, et al. Arterial spin labelling reveals an abnormal cerebral perfusion pattern in Parkinson's disease. Brain. (2011) 134:845–55. doi: 10.1093/brain/awq377
18. Al-Bachari S, Parkes LM, Vidyasagar R, Hanby MF, Tharaken V, Leroi I, et al. Arterial spin labelling reveals prolonged arterial arrival time in idiopathic Parkinson's disease. Neuroimage Clin. (2014) 6:1–8. doi: 10.1016/j.nicl.2014.07.014
19. Iadecola C. The neurovascular unit coming of age: a journey through neurovascular coupling in health and disease. Neuron. (2017) 96:17–42. doi: 10.1016/j.neuron.2017.07.030
20. Pelizzari L, Lagana MM, Di Tella S, Rossetto F, Bergsland N, Nemni R, et al. Combined assessment of diffusion parameters and cerebral blood flow within basal ganglia in early Parkinson's disease. Front Aging Neurosci. (2019) 11:134. doi: 10.3389/fnagi.2019.00134
21. Pelizzari L, Lagana MM, Rossetto F, Bergsland N, Galli M, Baselli G, et al. Cerebral blood flow and cerebrovascular reactivity correlate with severity of motor symptoms in Parkinson's disease. Ther Adv Neurol Disord. (2019) 12:1756286419838354. doi: 10.1177/1756286419838354
22. Gagnon L, Sakadzic S, Lesage F, Musacchia JJ, Lefebvre J. Quantifying the microvascular origin of BOLD-fMRI from first principles with two-photon microscopy and an oxygen-sensitive nanoprobe. J Neurosci. (2015) 35:3663–75. doi: 10.1523/JNEUROSCI.3555-14.2015
23. Kim T, Kim SG. Quantitative MRI of cerebral arterial blood volume. Open Neuroimag J. (2011) 5:136–45. doi: 10.2174/1874440001105010136
24. Postuma RB, Berg D, Stern M, Poewe W, Olanow CW, Oertel W, et al. MDS clinical diagnostic criteria for Parkinson's disease. Mov Disord. (2015) 30:1591–601. doi: 10.1002/mds.26424
25. Goetz CG, Poewe W, Rascol O, Sampaio C, Stebbins GT, Counsell C, et al. Movement disorder society task force report on the hoehn and yahr staging scale: status and recommendations. Mov Disord. (2004) 19:1020–8. doi: 10.1002/mds.20213
26. Rajput AH, Voll A, Rajput ML, Robinson CA, Rajput A. Course in Parkinson disease subtypes: A 39-year clinicopathologic study. Neurology. (2009) 73:206–12. doi: 10.1212/WNL.0b013e3181ae7af1
27. Tomlinson CL, Stowe R, Patel S, Rick C, Gray R, Clarke CE. Systematic review of levodopa dose equivalency reporting in Parkinson's disease. Mov Disord. (2010) 25:2649–53. doi: 10.1002/mds.23429
28. Smith SM. Fast robust automated brain extraction. Hum Brain Mapp. (2002) 17:143–55. doi: 10.1002/hbm.10062
29. Smith SM, Zhang Y, Jenkinson M, Chen J, Matthews PM, Federico A, et al. Accurate, robust, and automated longitudinal and cross-sectional brain change analysis. Neuroimage. (2002) 17:479–89. doi: 10.1006/nimg.2002.1040
30. Douaud G, Smith S, Jenkinson M, Behrens T, Johansen-Berg H, Vickers J, et al. Anatomically related grey and white matter abnormalities in adolescent-onset schizophrenia. Brain. (2007) 130:2375–86. doi: 10.1093/brain/awm184
31. Woolrich MW, Ripley BD, Brady M, Smith SM. Temporal autocorrelation in univariate linear modeling of FMRI data. Neuroimage. (2001) 14:1370–86. doi: 10.1006/nimg.2001.0931
32. Kundu P, Inati SJ, Evans JW, Luh WM, Bandettini PA. Differentiating BOLD and non-BOLD signals in fMRI time series using multi-echo EPI. Neuroimage. (2012) 60:1759–70. doi: 10.1016/j.neuroimage.2011.12.028
33. Kundu P, Brenowitz ND, Voon V, Worbe Y, Vertes PE, Inati SJ, et al. Integrated strategy for improving functional connectivity mapping using multiecho fMRI. Proc Natl Acad Sci USA. (2013) 110:16187–92. doi: 10.1073/pnas.1301725110
34. Jenkinson M, Bannister P, Brady M, Smith S. Improved optimization for the robust and accurate linear registration and motion correction of brain images. Neuroimage. (2002) 17:825–41. doi: 10.1006/nimg.2002.1132
35. Greve DN, Fischl B. Accurate and robust brain image alignment using boundary-based registration. Neuroimage. (2009) 48:63–72. doi: 10.1016/j.neuroimage.2009.06.060
36. Avants BB, Tustison NJ, Song G, Cook PA, Klein A, Gee JC. A reproducible evaluation of ANTs similarity metric performance in brain image registration. Neuroimage. (2011) 54:2033–44. doi: 10.1016/j.neuroimage.2010.09.025
37. Chappell M, Groves A, Whitcher B, Woolrich M. Variational bayesian inference for a nonlinear forward model. IEEE Trans Signal Process. (2009) 57:223–36. doi: 10.1109/TSP.2008.2005752
38. Wang DJ, Alger JR, Qiao JX, Gunther M, Pope WB, Saver JL, et al. Multi-delay multi-parametric arterial spin-labeled perfusion MRI in acute ischemic stroke - comparison with dynamic susceptibility contrast enhanced perfusion imaging. Neuroimage Clin. (2013) 3:1–7. doi: 10.1016/j.nicl.2013.06.017
39. Lagana MM, Mendozzi L, Pelizzari L, Bergsland NP, Pugnetti L, Cecconi P, et al. Are cerebral perfusion and atrophy linked in multiple sclerosis? Evidence for a multifactorial approach to assess neurodegeneration. Curr Neurovasc Res. (2018) 15:282–91. doi: 10.2174/1567202616666181123164235
40. Marshall O, Chawla S, Lu H, Pape L, Ge Y. Cerebral blood flow modulation insufficiency in brain networks in multiple sclerosis: a hypercapnia MRI study. J Cereb Blood Flow Metab. (2016) 36:2087–95. doi: 10.1177/0271678X16654922
41. Beckmann CF, Smith SM. Probabilistic independent component analysis for functional magnetic resonance imaging. IEEE Trans Med Imaging. (2004) 23:137–52. doi: 10.1109/TMI.2003.822821
42. Smith SM, Fox PT, Miller KL, Glahn DC, Fox PM, Mackay CE, et al. Correspondence of the brain's functional architecture during activation and rest. Proc Natl Acad Sci USA. (2009) 106:13040–5. doi: 10.1073/pnas.0905267106
43. Nickerson LD, Smith SM, Ongur D, Beckmann CF. Using dual regression to investigate network shape and amplitude in functional connectivity analyses. Front Neurosci. (2017) 11:115. doi: 10.3389/fnins.2017.00115
44. Beckmann CF, Mackay CE, Filippini N, Smith SM. Group comparison of resting-state FMRI data using multi-subject ICA and dual regression. Neuroimage. (2009) 47:S148. doi: 10.1016/S1053-8119(09)71511-3
45. Winkler AM, Ridgway GR, Webster MA, Smith SM, Nichols TE. Permutation inference for the general linear model. Neuroimage. (2014) 92:381–97. doi: 10.1016/j.neuroimage.2014.01.060
46. Beckmann CF, Deluca M, Devlin JT, Smith SM. Investigations into resting-state connectivity using independent component analysis. Philos Trans R Soc Lond B Biol Sci. (2005) 360:1001–13. doi: 10.1098/rstb.2005.1634
47. Canu E, Agosta F, Sarasso E, Volonte MA, Basaia S, Stojkovic T, et al. Brain structural and functional connectivity in Parkinson's disease with freezing of gait. Hum Brain Mapp. (2015) 36:5064–78. doi: 10.1002/hbm.22994
48. Esposito F, Tessitore A, Giordano A, De Micco R, Paccone A, Conforti R, et al. Rhythm-specific modulation of the sensorimotor network in drug-naive patients with Parkinson's disease by levodopa. Brain. (2013) 136:710–25. doi: 10.1093/brain/awt007
49. Filippi M, Elisabetta S, Piramide N, Agosta F. Functional MRI in idiopathic Parkinson's disease. Int Rev Neurobiol. (2018) 141:439–67. doi: 10.1016/bs.irn.2018.08.005
50. Furman M. Visual network. In: Faingold CL, Blumenfeld H, editors. Neuronal Networks in Brain Function, CNS Disorders, and Therapeutics. Amsterdam: Elsevier; 1Academic Press (2014). p. 247–59. doi: 10.1016/B978-0-12-415804-7.00019-8
51. Diederich NJ, Fénelon G, Stebbins G, Goetz CG. Hallucinations in Parkinson disease. Nat Rev Neurol. (2009) 5:331. doi: 10.1038/nrneurol.2009.62
52. Ma LY, Chen XD, He Y, Ma HZ, Feng T. Disrupted brain network hubs in subtype-specific Parkinson's disease. Eur Neurol. (2017) 78:200–9. doi: 10.1159/000477902
53. Syrimi ZJ, Vojtisek L, Eliasova I, Viskova J, Svatkova A, Vanicek J, et al. Arterial spin labelling detects posterior cortical hypoperfusion in non-demented patients with Parkinson's disease. J Neural Transm. (2017) 124:551–7. doi: 10.1007/s00702-017-1703-1
54. Toussay X, Basu K, Lacoste B, Hamel E. Locus coeruleus stimulation recruits a broad cortical neuronal network and increases cortical perfusion. J Neurosci. (2013) 33:3390–401. doi: 10.1523/JNEUROSCI.3346-12.2013
55. Shimada H, Hirano S, Shinotoh H, Aotsuka A, Sato K, Tanaka N, et al. Mapping of brain acetylcholinesterase alterations in lewy body disease by PET. Neurology. (2009) 73:273–8. doi: 10.1212/WNL.0b013e3181ab2b58
56. Braak H, Del Tredici K, Rub U, De Vos RA, Jansen Steur EN, Braak E. Staging of brain pathology related to sporadic Parkinson's disease. Neurobiol Aging. (2003) 24:197–211. doi: 10.1016/S0197-4580(02)00065-9
57. Borghammer P, Chakravarty M, Jonsdottir KY, Sato N, Matsuda H, Ito K, et al. Cortical hypometabolism and hypoperfusion in Parkinson's disease is extensive: probably even at early disease stages. Brain Struct Funct. (2010) 214:303–17. doi: 10.1007/s00429-010-0246-0
58. Cole DM, Smith SM, Beckmann CF. Advances and pitfalls in the analysis and interpretation of resting-state FMRI data. Front Syst Neurosci. (2010) 4:8. doi: 10.3389/fnsys.2010.00008
59. Alsop DC, Detre JA, Golay X, Günther M, Hendrikse J, Hernandez-Garcia L, et al. Recommended implementation of arterial spin-labeled perfusion MRI for clinical applications: a consensus of the ISMRM perfusion study group and the European consortium for ASL in dementia. Magn Reson Med. (2015) 73:102–16. doi: 10.1002/mrm.25197
60. Harris JJ, Reynell C. How do antidepressants influence the BOLD signal in the developing brain? Dev Cogn Neurosci. (2017) 25:45–57. doi: 10.1016/j.dcn.2016.12.003
61. Frodl T, Scheuerecker J, Schoepf V, Linn J, Koutsouleris N, Bokde AL, et al. Different effects of mirtazapine and venlafaxine on brain activation: an open randomized controlled fMRI study. J Clin Psychiatry. (2011) 72:448–57. doi: 10.4088/JCP.09m05393blu
62. Chen Y, Pressman P, Simuni T, Parrish TB, Gitelman DR. Effects of acute levodopa challenge on resting cerebral blood flow in Parkinson's disease patients assessed using pseudo-continuous arterial spin labeling. PeerJ. (2015) 3:e1381. doi: 10.7717/peerj.1381
Keywords: Parkinson's disease, resting state fMRI, arterial spin labeling, functional connectivity, cerebral blood flow, neurovascular coupling
Citation: Laganà MM, Pirastru A, Pelizzari L, Rossetto F, Di Tella S, Bergsland N, Nemni R, Meloni M and Baglio F (2020) Multimodal Evaluation of Neurovascular Functionality in Early Parkinson's Disease. Front. Neurol. 11:831. doi: 10.3389/fneur.2020.00831
Received: 20 March 2020; Accepted: 03 July 2020;
Published: 26 August 2020.
Edited by:
Yulin Ge, Langone Medical Center, New York University, United StatesReviewed by:
Maria Salsone, National Research Council (CNR), ItalyKonstantinos Kalafatakis, University of Ioannina, Greece
Copyright © 2020 Laganà, Pirastru, Pelizzari, Rossetto, Di Tella, Bergsland, Nemni, Meloni and Baglio. This is an open-access article distributed under the terms of the Creative Commons Attribution License (CC BY). The use, distribution or reproduction in other forums is permitted, provided the original author(s) and the copyright owner(s) are credited and that the original publication in this journal is cited, in accordance with accepted academic practice. No use, distribution or reproduction is permitted which does not comply with these terms.
*Correspondence: Alice Pirastru, YXBpcmFzdHJ1QGRvbmdub2NjaGkuaXQ=
†These authors have contributed equally to this work