 Daniel Gregor Schulze1,2,3*
 Kristian Bernhard Nilsen1,3Rikke Munk Killingmo4John Anker Zwart2,3Margreth Grotle3,4
- 1Department of Neurology, Oslo University Hospital and University of Oslo, Oslo, Norway
- 2Institute of Clinical Medicine, University of Oslo, Oslo, Norway
- 3Department of Research, Innovation and Education, Division of Clinical Neuroscience, Oslo University Hospital, Oslo, Norway
- 4Oslo Metropolitan University, Oslo, Norway
Background: Self-reported measures are often used in research and clinical practice to diagnose carpal tunnel syndrome (CTS) and guide therapeutic choices. We aimed to assess the clinical utility of the Norwegian versions of two self-reported outcome measures for symptom severity assessment, the 6-item CTS (CTS-6), and Boston-CTS (BCTQ), and of one diagnostic measure, the hand-diagram, by evaluating measurement properties including discriminative ability for severity assessment (CTS-6, BCTQ), and diagnosis of CTS (hand-diagram).
Methods: We performed forward and backward translation and cultural adaptation of the Norwegian CTS-6 and BCTQ. Following COSMIN guidelines, we investigated internal consistency, reliability, construct validity, and discriminative ability for distinguishing between severity levels of CTS in patients with confirmed CTS for the CTS-6 and BCTQ and reliability and discriminative ability for diagnosing CTS for the hand-diagram.
Results: Two hundred and fifty-one patients referred for diagnostic work-up for CTS with nerve conduction studies (NCS) participated. The CTS-6 and BCTQ had acceptable internal consistency (Crohnbach's α = 0.82 and 0.86, respectively), reliability (ICC = 0.86 and 0.90; SEM = 0.24 and 0.20; SDC95% = 0.68 and 0.55, respectively), construct validity (all eight pre-defined hypotheses confirmed) and discriminative ability to distinguish between severity levels of CTS [Area under the curve (AUC) = 0.75, 95% CI 0.64–0.85]. The hand-diagram had acceptable reliability (Cohen's kappa = 0.69) and discriminative ability to diagnose CTS (sensitivity = 0.72, specificity = 0.90).
Conclusion: Our findings support the clinical utility of the CTS-6 and BCTQ for symptom severity assessment and of the hand-diagram for diagnostic screening.
Introduction
Carpal tunnel syndrome (CTS) is characterized by paresthesia, numbness and pain in the median nerve distribution (1). Nerve conduction studies (NCS) contribute to diagnosing CTS by demonstrating reduced conduction velocity of the median nerve (2). Treatment is often based on clinical and NCS severity (3, 4). Due to a CTS prevalence of ca. 3–5% (5) and limited access to NCS, several measures (6, 7) have been developed for diagnostic screening and for severity assessment. The 6-item CTS from Atroshi et al. (CTS-6) (8, 9) and Boston carpal tunnel questionnaire (BCTQ) (10) are widely used for severity assessment, and the hand-diagram (11, 12) for diagnostic screening. These instruments are not currently available in Norwegian. Single measurement properties have been described for other language versions of these instruments (13, 14), but few studies follow systematic guidelines, as for instance provided by the COSMIN group (15). Thus, it can be challenging to choose from among the available instruments (16, 17) and measures may not be used as designed or for their intended purpose, greatly hampering their utility. An example is that several studies used the BCTQ for diagnostic purposes (18). Thus, a study of the measurement properties of these instruments according to the COSMIN guidelines, together with a delineation of their respective discriminative abilities for diagnosis (hand-diagram) and severity assessment [CTS-6 and (BCTQ)], could give a good estimate of their utility and help clinicians and researchers to choose the appropriate instrument (19).
The main objective of this study was to systematically investigate internal consistency, reliability, construct validity and discriminative ability for severity assessment of the Norwegian versions of the CTS-6, BCTQ, and reliability and discriminative ability of the hand-diagram for diagnosing CTS according to the COSMIN guidelines (20).
Methods
Design
The study was carried out in two stages. First, we translated and cross-culturally adapted the CTS-6 and BCTQ. Then, we used a cross-sectional design to test the measurement properties of the CTS-6, BCTQ, and hand-diagram against NCS as external criteria. Additionally, we performed a test–retest assessment with an interval of 4 days.
Following COSMIN recommendations (21), we aimed for a sample size of 200 patients, consisting of 100 patients with confirmed CTS and 100 patients for whom CTS could not be confirmed. Internal consistency and the discriminative ability to distinguish severity levels of CTS (both analyses applied to the CTS-6 and BCTQ) was tested in the sample with confirmed CTS, while construct validity (applied to the CTS-6 and BCTQ) and discriminative ability for diagnosis of CTS (applied to the hand-diagram) were tested in the entire sample. For test–retest reliability, we invited the first fifty included patients with confirmed CTS to complete a retest questionnaire 4 days after the baseline questionnaire. According to Norwegian law, this study was categorized as a quality improvement project and not a medical research project. The Study was accordingly approved by the local Data Protection Official (PVO 2015/14753) and not the Regional Ethical Committee. All participants provided written consent.
Participants
We recruited patients who had been referred for diagnostic work-up of suspected CTS with NCS to the clinical neurophysiology lab at Oslo University Hospital. We included patients referred from both primary and secondary health services. Patients > 18 years of age with sufficient knowledge of the Norwegian language were eligible. Exclusion criteria were patient withdrawal or more than 50% missing items in the questionnaire. Written informed consent was obtained from all patients.
Procedures and Measures
The participants filled out the CTS-6, BCTQ, hand-diagram, and sociodemographic background variables 2 days before the consultation. Those participating in test–retest reliability assessment were asked to fill out the CTS-6, BCTQ, and hand-diagram again 2 days after the consultation and return them by mail. We chose an interval of 4 days in order to minimize bias from memory or from a change in clinical symptoms. For each questionnaire, patients were asked to state for which hand they had answered.
Translation and Cross-Cultural Adaptation
The translation and cross-cultural adaptation was conducted according to international guidelines (22), including forward translation performed by a native speaker of Norwegian and backward translations performed by native speakers of English and Swedish. Based on the translations, an expert committee developed a pre-final version. Following a review by 10 patients with musculoskeletal disorders recruited from our out-patient clinic, a final version was developed. The Norwegian versions of the CTS-6 and BCTQ are provided in Supplementary Materials 1, 2.
Measures
The CTS-6 (8) was developed from the BCTQ as a brief symptom scale for patients with confirmed CTS. It was designed to measure severity of the cardinal symptoms of CTS. The questionnaire consists of six items covering presence and intensity of numbness, paresthesia, and pain during day and night, whether the patient is woken by these symptoms, and, if so, how often. Each question is answered on a scale ranging from “1” (best) to “5” (worst). The total score is calculated as the mean of all answers, with a minimum score of “1” and a maximum score of “5.” One missing item is allowed.
The BCTQ (10) was designed as a self-reported measure of symptom severity and functional impairment of CTS, with two respective subscales. Only the symptom severity scale was used in the present study. This scale consists of 11 items covering presence, frequency, duration and severity of numbness, paresthesia and pain, both day and night, and impairment of fine motor skills, with five possible answers ranging from “1” (best) to “5” (worst). The total score is calculated as the mean of all answers, with a minimum score of “1” and a maximum score of “5.” One missing item is allowed.
The hand-diagram (11) was developed as a rapid screening tool for CTS in the general population. It consists of a diagram of the palmar and dorsal hand, and patients record in which areas of the hand and arm they experience numbness, tingling, pain and loss of sensation. There are four different probability scores according to presence and distribution of symptoms: (1) Classic CTS is defined by tingling, numbness, decreased sensation with or without pain in at least two of the three radial digits. Symptoms in the palm and dorsum of the hand are not allowed, wrist pain or radiation proximal to the wrist is allowed. (2) Probable CTS is defined by the same pattern as classic CTS, except that palmar symptoms are allowed unless confined to the ulnar aspect. (3) Possible CTS is defined by tingling, numbness, decreased sensation, and/or pain in at least one of the three radial digits. (4) Unlikely CTS is defined by the absence of symptoms in the three radial digits.
Nerve Conduction Studies
We performed bilateral motor and sensory NCS of the median and ulnar nerves on a Natus key-point classic EMG machine (Alpine Bio-med, Denmark). For both motor and sensory NCS, we used pre-gelled, disposable surface electrodes (Alpine biomed, Skovlunde, Denmark) with a 3 mm inter-electrode distance. For stimulation we used a handheld stimulation bar with felt tips (diameter 7.5 mm) soaked in saline solution and with fixed inter-electrode distance. Electrodes were placed on predefined anatomic landmarks and distances between stimulation and recording sites were measured prior to performing NCS. Before conducting the NCS, we measured skin temperature with a handheld infrared thermographic scanner (Exergen Corporation, Watertown, MA, USA). Skin temperature was kept over 30 degrees at all times. All amplitudes were recorded using supramaximal stimulation. Motor and sensory amplitudes were measured from baseline to peak. Sensory latencies were calculated based on the peak of the negative deflection, motor latencies at onset of the negative peak. We performed orthodromic sensory NCS of the median nerve (branches to the palm and to the second, third, and fourth fingers), ulnar nerve (branches to the palm and to the fourth and fifth fingers) and radial nerve (superficial branch at the laterodorsal side of the hand). Distances between stimulation and recording electrodes in the fourth finger were equal in the median and ulnar nerves to allow for comparison of the sensory latency. NCS findings were classified according to the scale suggested by Padua (23). Minimal CTS is characterized by a significant difference between sensory latency in the median/ulnar nerves at two sites (≥0.5 ms in the fourth digit and in the palm); mild CTS by sensory conduction velocities of the median nerve below the lower normal limit; moderate CTS by motor distal latency above the normal limit in addition to sensory involvement; severe CTS by additionally absent sensory responses (amplitude <0.2 mV); and extreme CTS by absence of both motor and sensory responses.
Diagnosing CTS
In order to provide a CTS diagnosis certain clinical (1, 2) and NCS criteria had to be met: A diagnosis of CTS was present if NCS showed at least minimal CTS according to Padua (23) and two of the following classical symptoms of CTS (2) were present: numbness and/or paresthesia in the median nerve distribution, alleviation of symptoms by shaking the limb, weakness in the hand and presence of symptoms during the night. Further, there should be no alternative or more plausible explanation for these symptoms. In cases of bilateral disease, analyses were applied to the most symptomatic side.
Statistical Analysis
The analysis was performed on SPSS V24 software (SPSS Inc., Chicago, IL). P < 0.05 were considered significant. We substituted up to 50% missing items with the mean of the remaining answers. Floor and ceiling effects were defined as >15% of patients reporting the lowest or highest possible total score, and end-effects as >15% of patients reporting the highest or lowest possible score for a single item.
Internal Consistency
Internal consistency was assessed by Cronbach's α. COSMIN regards values of >0.70 and <0.95 as acceptable.
Test–Retest Reliability
Test–retest reliability was tested with relative and absolute reliability measures. Relative reliability was assessed with intra-class correlation (ICC2.1, two way random, absolute agreement) (24), with values of ≥0.70 regarded as acceptable. Absolute reliability was tested with the standard error of measurement (SEM, calculated as standard deviation of the difference/√2) (24), the smallest detectable change [SDC 95%, calculated as SEM × √2 × 1.96 (24)] and the limits of agreement (calculated as mean difference ± standard deviation of the difference × 1.96) (25). For ordinal variables (the hand-diagram), Cohen's quadratic weighted kappa was used (26). Kappa values were categorized as follows (21, 27): poor (0–0.20), fair (0.21–0.40), moderate (0.41–0.60), good (0.61–0.80), and very good (0.81–1.00).
Construct Validity
Construct validity was assessed for the CTS-6 and BCTQ by testing eight pre-defined hypotheses concerning the CTS-6, the BCTQ, and concurrent measurements based on existing literature (2, 8, 10, 11, 28–32). Hypotheses one, three, four, five, six, and seven were tested in the sample with confirmed CTS, and hypotheses two and eight in the whole sample. Since the CTS-6 and BCTQ measure the same construct, parallel hypotheses were created.
Discriminative Ability
Discriminative ability of the CTS-6 and BCTQ was assessed by receiver operating characteristics (ROC) curves for the ability to distinguish between minimal to mild and moderate to severe CTS grades. An area under the curve (AUC) of at least 0.70 is considered adequate (21). We used the coordinates of the ROC curve to calculate the scores with optimal sensitivity and specificity and positive and negative likelihood ratios. We assessed the discriminative ability of the hand-diagram by calculating sensitivity, specificity, and positive and negative likelihood ratios directly from 2 × 2 tables for the diagnostic ability to discriminate between patients who had or had not been diagnosed with CTS.
Results
We collected data from April 2016 to January 2018. Out of 293 invited patients, 42 either declined to participate or did not speak Norwegian. Of the 251 remaining patients, 128 were diagnosed with CTS (based on predefined clinical symptoms and NCS findings). Of the 123 patients who were not diagnosed with CTS, 10 did not fulfill the clinical criteria, 15 did not fulfill the NCS criteria and 98 did not fulfill either of these criteria. These patients were diagnosed with one of the following conditions: polyneuropathy, ulnar nerve neuropathy, cervical disk herniation, tendinitis, or radial nerve neuropathy. Internal consistency and the discriminative ability to distinguish between severity levels of CTS (applied to the CTS-6 and BCTQ) was tested in the sample with confirmed CTS, while construct validity and discriminative ability for diagnosis of CTS (applied to the hand-diagram) were tested in the entire sample. Fifty-four patients with confirmed CTS participated in test–retest analysis. Sample characteristics are given in Table 1. There were no significant differences between the samples regarding age, sex distribution, educational level, or proportion of patients with Norwegian as their mother tongue.
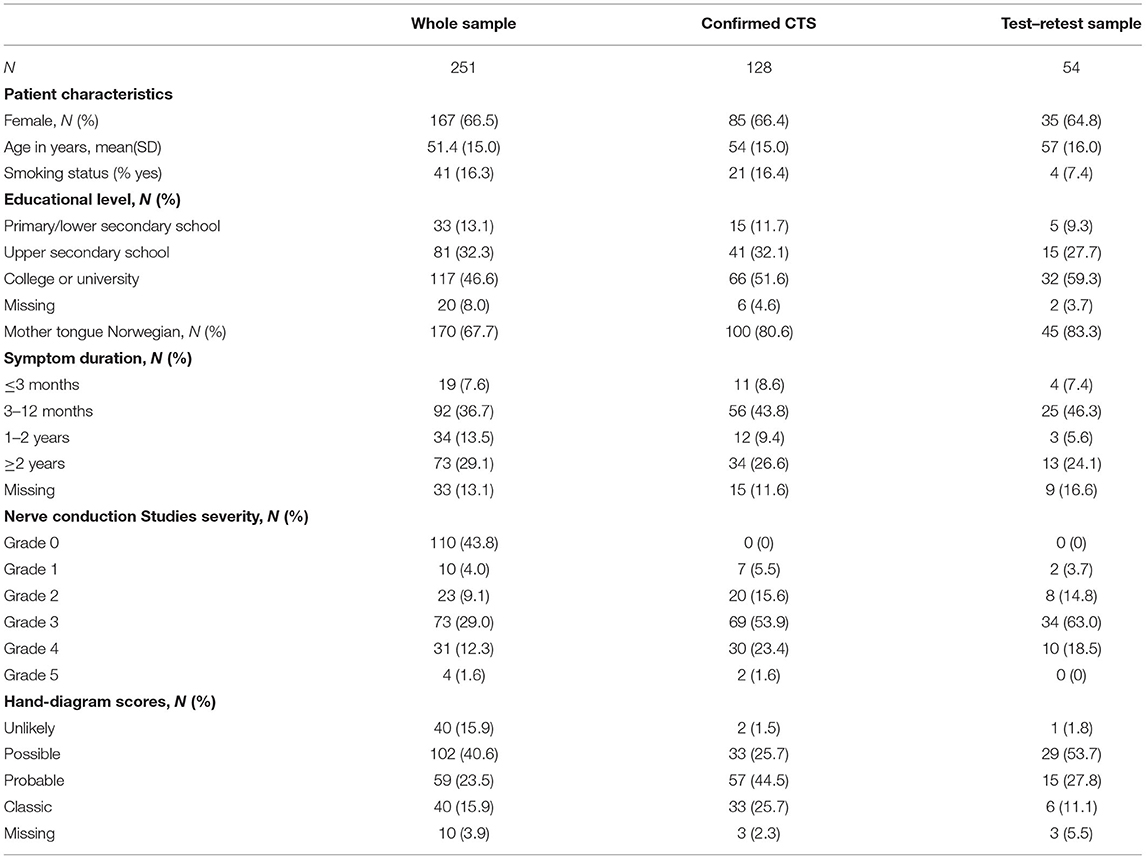
Table 1. Sample characteristics of the whole sample (both confirmed and non-confirmed carpal tunnel syndrome [CTS]), of the sample with confirmed CTS alone and of the test–retest sample.
Data Quality
The total scores were normally distributed in the CTS-6 and BCTQ. There was little missing data for the CTS-6 and BCTQ (Tables 2A,B). Neither of the outcome measures showed floor or ceiling effects, but there were end effects in four items of the CTS-6 and in eight of the 11 items in the BCTQ (defined as >15% of patients reporting the lowest or highest possible score for a single item). Ten patients had missing data in the hand-diagram. The distribution of hand-diagram scores is presented in Table 1.
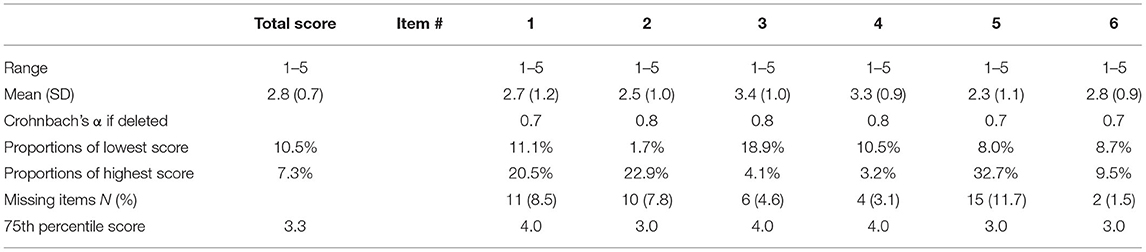
Table 2A. Missing data, data distribution, end effects and total item correlation of the 6-item CTS.
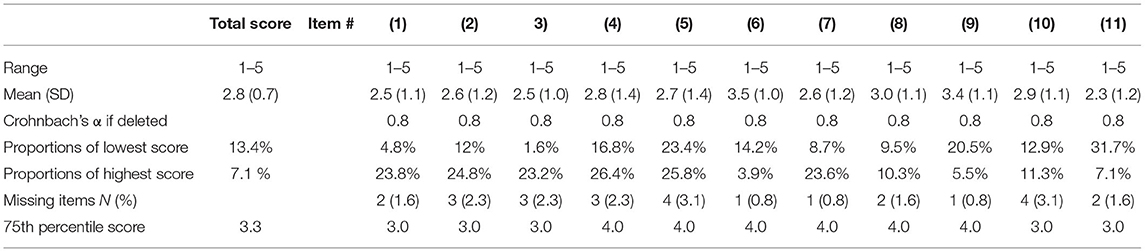
Table 2B. Missing data, data distribution, end effects and total item correlation of the Boston Carpal Tunnel Questionnaire (BCTQ).
Internal Consistency and Test–Retest Reliability
Cronbach's α was 0.82 for the CTS-6 and 0.86 for the BCTQ. There was no difference between the test and the re-test total scores for the CTS-6 and BCTQ (Table 3). Both the SEM and the SDC were lower for the BCTQ than for the CTS-6. The agreement and test–retest reliability were acceptable for all three instruments.
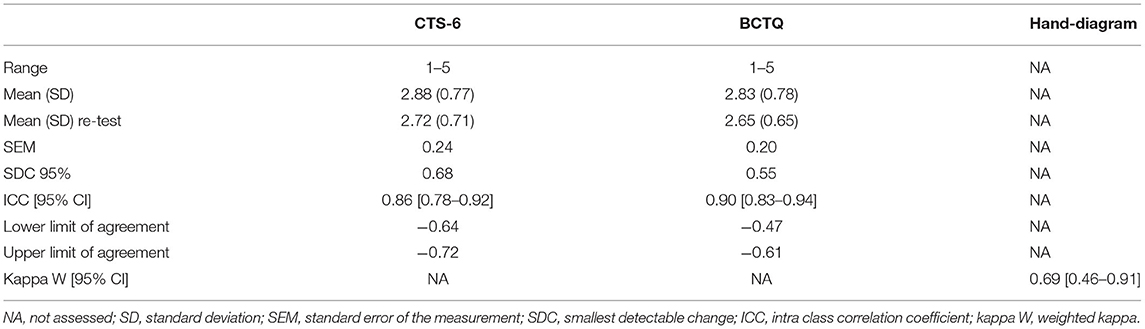
Table 3. Test–retest reliability and agreement for the 6-item CTS (CTS-6), the Boston Carpal Tunnel Questionnaire (BCTQ), and the hand-diagram.
Construct Validity
All pre-defined hypotheses for the correlation between the CTS-6, the BCTQ and the external criteria were confirmed (Table 4). As expected, the total CTS-6 and BCTQ scores (Figures 1A,B) were significantly different between NCS severity groups.
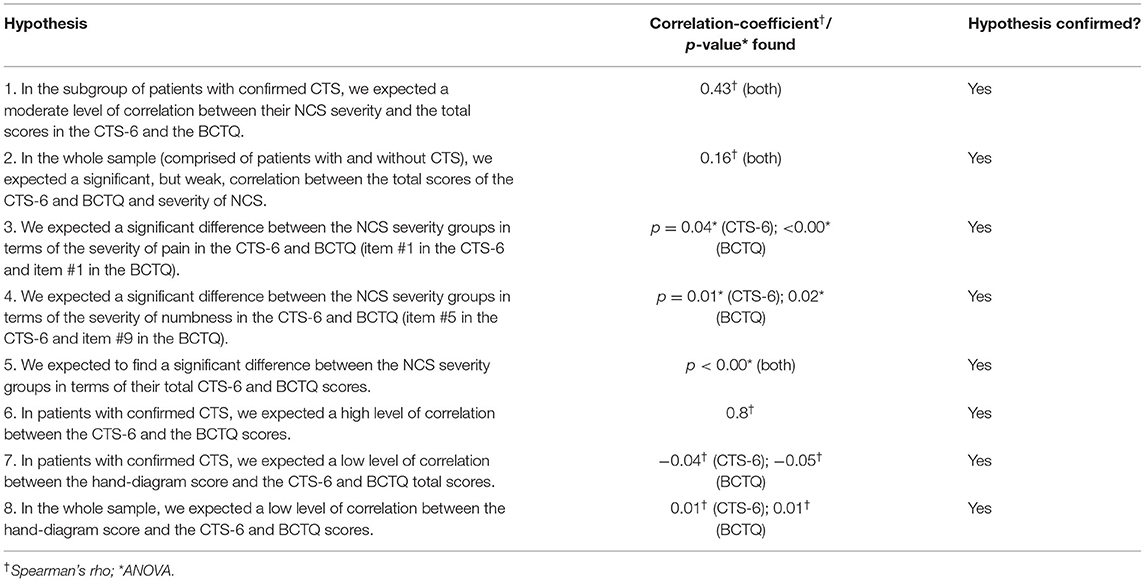
Table 4. Construct validity by testing pre-defined hypotheses for the correlation between the 6-item CTS, the Boston Carpal Tunnel Questionnaire and the external measure.
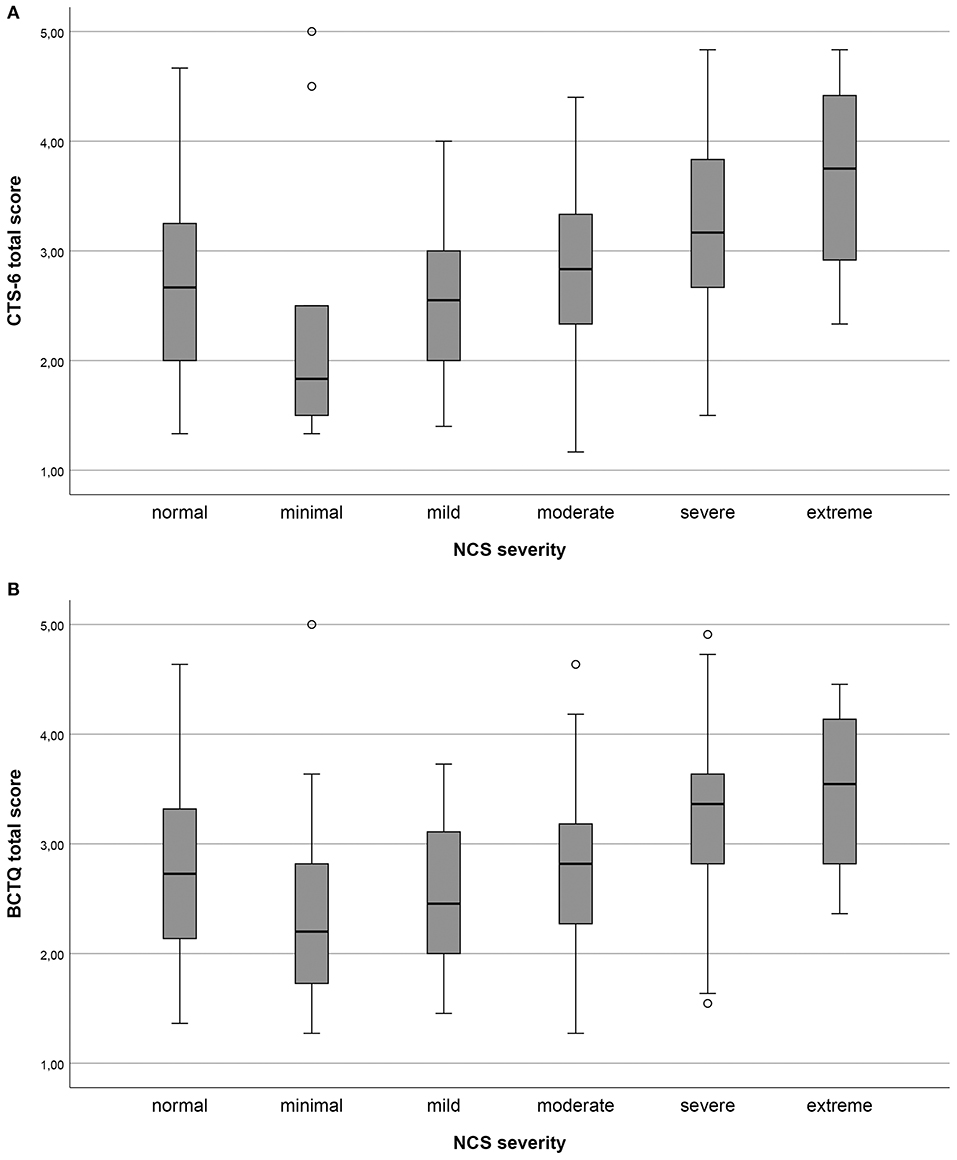
Figure 1. (A,B) Total scores of the 6-item CTS (CTS-6) and Boston-CTS (BCTQ), respectively, in the different nerve conduction study (NCS) severity groups of carpal tunnel syndrome (CTS) graded according to Padua. Minimal CTS ≥ 0.5 ms difference between median/ulnar nerves sensory latency; mild CTS, sensory conduction velocities of the median nerve below the lower normal limit; moderate CTS, motor distal latency above the normal limit in addition to sensory conduction velocities of the median nerve below lower normal limit; severe CTS, absent sensory amplitudes in addition to motor distal latency above the normal limit; and extreme CTS, absence of sensory and motor responses.
Discriminative Ability
Table 5 shows the results of the discriminative ability testing. Using a score of “probable” as the cut-off for CTS, the hand-diagram showed a high specificity and positive likelihood ratio and good sensitivity in detecting CTS. For the CTS-6 and BCTQ scores of 2.55 and 2.47, respectively, yielded the highest combination of sensitivity and specificity for detecting moderate to severe CTS. Both showed an acceptable to good ability to discriminate between severity levels of CTS.
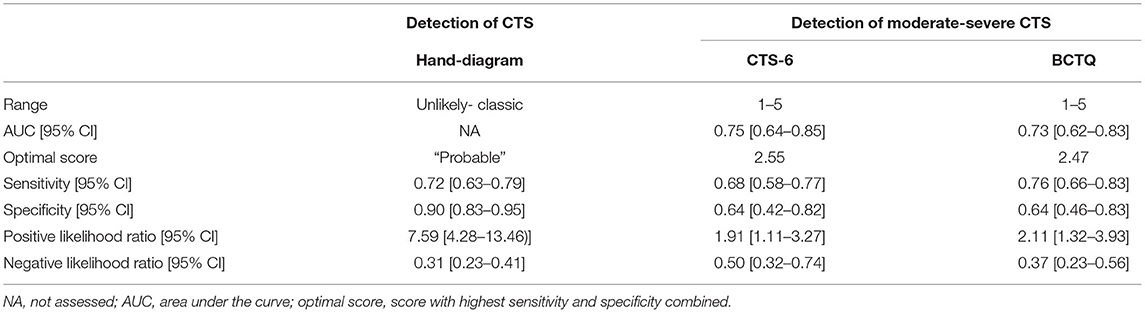
Table 5. Discriminative ability of the 6-item CTS (CTS-6) and the Boston Carpal Tunnel Questionnaire (BCTQ) for detection of moderate to severe CTS in patients with confirmed CTS and of the hand-diagram for detection of CTS in the whole sample.
Discussion
The Norwegian versions of the CTS-6, BCTQ and hand-diagram showed good measurement properties when assessed in a sample of patients referred for diagnostic work-up for CTS with NCS. The results support the utility of the CTS-6 and BCTQ for symptom severity assessment and of the hand-diagram for diagnostic screening.
The age and gender distribution, as well as the distribution of NCS severity levels, in the present study correspond to previous reports (5, 23, 33). The response rate was high and there were generally few missing items, corresponding to previous studies (29, 34). We did not find floor or ceiling effects in the total scores. However, we found end effects for items concerning numbness and tingling in the CTS-6 and BCTQ, especially in patients with moderate to severe NCS findings (see Figure 1). This group is often considered for surgery (3, 4). End effects can indicate that single items are not differentiated enough, which may make it difficult to measure changes in these items. In turn, this might reduce the utility of the two outcome measures for post-operative follow-up (21).
According to the COSMIN criteria, test–retest reliability of the CTS-6 and BCTQ was very good for both absolute and relative reliability measures, comparable (21, 35) to other translated versions of the CTS-6 (9, 36) and BCTQ (34, 37). Internal consistency was very good for the CTS-6 and BCTQ and comparable to the original version and Spanish versions of the CTS-6. An artificially high Cronbach's α can be found in questionnaires with a large number of items, which is unlikely in our study (21).
All pre-defined hypotheses were confirmed, which supports good construct validity of the CTS-6 and BCTQ. We chose to use NCS as external criteria as they are an objective measurement of nerve function and frequently used to diagnose CTS (38). We found a moderate level of correlation between the NCS severity and the total scores of the CTS-6 and BCTQ in the sample with confirmed CTS, corresponding with previous reports (39). In contrast, the correlation between NCS severity and symptom severity in the whole population was significant, but rather low. This result confirms that the two outcome measures are not specific for CTS and is in accordance with the literature (28, 31, 40). In addition, the correlation between NCS severity and clinical symptom severity in CTS varies in different studies (29, 39, 41–43). This variation might be due to the use of different methods in the studies. For instance, the result would be different if correlation to clinical sum scores or to severity of single symptoms was assessed (28, 30). In our study, pain and numbness intensities, as measured by the CTS-6 and BCTQ, differed between the NCS severity grades, in keeping with previous reports (41). These findings support the notion that NCS and clinical severity assessment are complementary (28, 44) and, consequently, indicate that the CTS-6 and BCTQ should only be used in patients with confirmed CTS.
The high level of correlation between the CTS-6 and BCTQ was expected, as the CTS-6 is derived from the BCTQ. Likewise, the low level of correlation between the CTS-6 and the hand-diagram was expected, as the hand-diagram is designed for diagnostic purposes and not symptom severity assessment in contrast to the CTS-6 and BCTQ. This suggests that the BCTQ would not perform well when used for diagnostic purposes (18) when compared to diagnostic measures.
The hand-diagram had a very good ability to distinguish between patients with and without CTS. This ability is likely due to its measurement of how closely pain and numbness follow the median nerve distribution, which is a classic sign of CTS (1, 31, 32, 45). The CTS-6 and BCTQ showed good sensitivity and acceptable specificity for distinguishing moderate to severe CTS from minimal and mild CTS, as previously reported (29). This finding highlights the clinical utility of the CTS-6 and BCTQ in guiding treatment decisions, as patients with moderate to severe NCS findings often benefit from surgery, and patients with milder severity grades may benefit from conservative treatment (4, 46).
A limitation in this study is that we only assessed the symptom-severity subscale of the BCTQ, and not the functional-impairment subscale. We made this decision because the CTS-6 does not contain a functional impairment subscale. The functional-impairment subscale of the BCTQ should be scored independently form the symptom severity scale (47). Also, we did not test the responsiveness of the CTS-6 and BCTQ, i.e., their ability to detect clinically important changes over time. This knowledge would be necessary to assess the interpretability of the two outcome measures and their utility for follow-up analysis. Because the clinical criteria for CTS partially overlapped with single items in the measures, incorporation bias cannot be ruled out. Incorporation bias is what happens when the test which is being evaluated is integrated into the reference standard. In this case, it may have led to an overestimation of sensitivity of the hand-diagram. Incorporation bias is difficult to avoid and is nearly always present in studies evaluating clinical diagnostic methods, nevertheless, its potential effect should be addressed (48). The items in question are central symptoms of CTS and it is hard to diagnose CTS without asking about paresthesia in the median nerve distribution. We tried to minimize the effect of this type of bias by using a reference standard comprised not only of clinical criteria, but of a combination of clinical criteria and NCS findings. Further, we addressed the problem of bilateral disease by applying the analyses to the most symptomatic side. A limitation is that a Martin-Gruber anastomosis might have been present in some individuals in the sample. Presence of Martin–Gruber anastomosis in patients with CTS might lead to confusing NCS findings (49, 50). Due to the anastomosing fibers bypassing the carpal tunnel, the proximal motor latency (measured at the cubital fossa) and the motor conduction velocity of the median nerve in the forearm can be mistakenly interpreted as normal. As the distal motor latency is usually not impacted by a Martin–Gruber anastomosis, a mismatch between pathological distal motor latency and seemingly normal proximal motor latency can be observed (51, 52). The effect of a Martin Gruber anastomosis on the NCS findings in CTS can be subtle and is not always easy to recognize. This could potentially lead to underestimation of pathology in the median nerve motor conduction velocity in the forearm and in the proximal motor latency in patients with CTS.
It is important to note that the findings of this study are valid in the context of a population referred to NCS with suspected CTS, which is a somewhat select group. However, from a pragmatic standpoint, this sample represents the population in which the studied instruments are likely to be used. It is, for instance, possible to use the hand-diagram to assess a pre-test probability before performing NCS and adapting the scheduled NCS protocol thereafter.
Some major strengths of the present study are that we examined all quality criteria proposed by COSMIN within our design and that we recruited more patients than recommended (21).
Conclusion
The Norwegian versions of the CTS-6 and BCTQ as well as the hand-diagram showed acceptable to good measurement properties when applied to patients referred to NCS. The hand-diagram provided a clear estimate of pretest probability prior to performing NCS, and the NCS protocol may be adjusted accordingly (53). The CTS-6 and BCTQ provided complementary information to NCS in severity assessment and can be used to guide the therapeutic approach in patients with diagnosed CTS.
Data Availability Statement
The datasets presented in this article are not readily available because of local data protection restrictions. Requests to access the anonymized datasets should be directed to Daniel Gregor Schulze (ZC5nLnNjaHVsemVAc3R1ZG1lZC51aW8ubm8=).
Ethics Statement
The studies involving human participants were reviewed and approved by local data protection official of Oslo university hospital (PVO 2015/14753). The patients/participants provided their written informed consent to participate in this study.
Author Contributions
DS: data analysis and first draft of the manuscript. DS, KN, JZ, RK, and MG: conception and design of the study, data collection, analysis, and manuscript revision. All authors read and approved the submitted version.
Conflict of Interest
The authors declare that the research was conducted in the absence of any commercial or financial relationships that could be construed as a potential conflict of interest.
Publisher's Note
All claims expressed in this article are solely those of the authors and do not necessarily represent those of their affiliated organizations, or those of the publisher, the editors and the reviewers. Any product that may be evaluated in this article, or claim that may be made by its manufacturer, is not guaranteed or endorsed by the publisher.
Acknowledgments
The author thank the staff and the physicians at the clinical neurophysiology lab for their help in acquiring data, especially Ms. Mona Nyang for her invaluable help with data collection.
Supplementary Material
The Supplementary Material for this article can be found online at: https://www.frontiersin.org/articles/10.3389/fneur.2021.683807/full#supplementary-material
Abbreviations
CTS, carpal tunnel syndrome; NCS, nerve conduction studies; AUC, area under the curve; ROC, receiver operating characteristics.
References
2. Padua L, Coraci D, Erra C, Pazzaglia C, Paolasso I, Loreti C, et al. Carpal tunnel syndrome: clinical features, diagnosis, and management. Lancet Neurol. (2016) 15:1273–84. doi: 10.1016/S1474-4422(16)30231-9
3. Kanatani T, Nagura I, Harada Y, Sumi M. The role of electrophysiological severity scales for decision-making with regard to surgery in idiopathic carpal tunnel syndrome. Kobe J Med Sci. (2017) 63:E68–e72.
4. Bland JDP. Do nerve conduction studies predict the outcome of carpal tunnel decompression? Muscle Nerve. (2001) 24:935–40. doi: 10.1002/mus.1091
5. Atroshi I, Gummesson C, Johnsson R, Ornstein E, Ranstam J, Rosen I. Prevalence of carpal tunnel syndrome in a general population. Jama. (1999) 282:153–8. doi: 10.1001/jama.282.2.153
6. Bland JD, Weller P, Rudolfer S. Questionnaire tools for the diagnosis of carpal tunnel syndrome from the patient history. Muscle Nerve. (2011) 44:757–62. doi: 10.1002/mus.22158
7. Kamath V, Stothard J. A clinical questionnaire for the diagnosis of carpal tunnel syndrome. J Hand Surg Br. (2003) 28:455–9. doi: 10.1016/S0266-7681(03)00151-7
8. Atroshi I, Lyren PE, Gummesson C. The 6-item CTS symptoms scale: a brief outcomes measure for carpal tunnel syndrome. Qual Life Res. (2009) 18:347–58. doi: 10.1007/s11136-009-9449-3
9. Atroshi I, Lyren PE, Ornstein E, Gummesson C. The six-item CTS symptoms scale and palmar pain scale in carpal tunnel syndrome. J Hand Surg Am. (2011) 36:788–94. doi: 10.1016/j.jhsa.2011.02.021
10. Levine DW, Simmons BP, Koris MJ, Daltroy LH, Hohl GG, Fossel AH, et al. A self-administered questionnaire for the assessment of severity of symptoms and functional status in carpal tunnel syndrome. J Bone Joint Surg Am. (1993) 75:1585–92. doi: 10.2106/00004623-199311000-00002
11. Katz JN, Stirrat CR. A self-administered hand diagram for the diagnosis of carpal tunnel syndrome. J Hand Surg Am. (1990) 15:360–3. doi: 10.1016/0363-5023(90)90124-A
12. Calfee RP, Dale AM, Ryan D, Descatha A, Franzblau A, Evanoff B. Performance of simplified scoring systems for hand diagrams in carpal tunnel syndrome screening. J Hand Surg Am. (2012) 37:10–7. doi: 10.1016/j.jhsa.2011.08.016
13. Dale AM, Strickland J, Symanzik J, Franzblau A, Evanoff B. Reliability of hand diagrams for the epidemiologic case definition of carpal tunnel syndrome. J Occup Rehabil. (2008) 18:233–48. doi: 10.1007/s10926-008-9139-y
14. Hamzeh HH, Alworikat NA. Cross cultural adaptation, reliability and construct validity of the Boston Carpal Tunnel Questionnaire in standard Arabic language. Disabil Rehabil. (2019) 43:1–6. doi: 10.1080/09638288.2019.1629651
15. Multanen J, Ylinen J, Karjalainen T, Kautiainen H, Repo JP, Hakkinen A. Reliability and validity of the finnish version of the Boston carpal tunnel questionnaire among surgically treated carpal tunnel syndrome patients. Scand J Surg. (2019) 109:343–50. doi: 10.1177/1457496919851607
16. Sambandam SN, Priyanka P, Gul A, Ilango B. Critical analysis of outcome measures used in the assessment of carpal tunnel syndrome. Int Orthop. (2008) 32:497–504. doi: 10.1007/s00264-007-0344-7
17. Szabo RM. Outcomes assessment in hand surgery: when are they meaningful? J Hand Surg Am. (2001) 26:993–1002. doi: 10.1053/jhsu.2001.29487
18. Dabbagh A, MacDermid JC, Yong J, Macedo LG, Packham TL. Diagnosing carpal tunnel syndrome: diagnostic test accuracy of scales, questionnaires, and hand symptom diagrams-a systematic review. J Orthop Sports Phys Ther. (2020) 50:622–31. doi: 10.2519/jospt.2020.9599
19. McMillan CR, Binhammer PA. Which outcome measure is the best? Evaluating responsiveness of the Disabilities of the Arm, Shoulder, and Hand Questionnaire, the Michigan Hand Questionnaire and the Patient-Specific Functional Scale following hand and wrist surgery. Hand (New York, NY). (2009) 4:311–8. doi: 10.1007/s11552-009-9167-x
20. Mokkink LB, Terwee CB, Patrick DL, Alonso J, Stratford PW, Knol DL, et al. The COSMIN checklist for assessing the methodological quality of studies on measurement properties of health status measurement instruments: an international Delphi study. Qual Life Res. (2010) 19:539–49. doi: 10.1007/s11136-010-9606-8
21. Terwee CB, Bot SD, de Boer MR, van der Windt DA, Knol DL, Dekker J, et al. Quality criteria were proposed for measurement properties of health status questionnaires. J Clin Epidemiol. (2007) 60:34–42. doi: 10.1016/j.jclinepi.2006.03.012
22. Beaton DE, Bombardier C, Guillemin F, Ferraz MB. Guidelines for the process of cross-cultural adaptation of self-report measures. Spine. (2000) 25:3186–91. doi: 10.1097/00007632-200012150-00014
23. Padua L, LoMonaco M, Gregori B, Valente EM, Padua R, Tonali P. Neurophysiological classification and sensitivity in 500 carpal tunnel syndrome hands. Acta Neurol Scand. (1997) 96:211–7. doi: 10.1111/j.1600-0404.1997.tb00271.x
24. de Vet HC, Terwee CB, Knol DL, Bouter LM. When to use agreement versus reliability measures. J Clin Epidemiol. (2006) 59:1033–9. doi: 10.1016/j.jclinepi.2005.10.015
25. Bland JM, Altman DG. Statistical methods for assessing agreement between two methods of clinical measurement. Lancet (London, England). (1986) 1:307–10. doi: 10.1016/S0140-6736(86)90837-8
26. Lydersen S. [Cohen's kappa - a measure of agreement between observers]. Tidsskr Nor Laegeforen. (2018) 138. doi: 10.4045/tidsskr.17.0962
27. Kirkwood BR, Sterne JAC. Essential Medical Statistics, 2nd Edn. Malden, MA.: Blackwell Science (2003).
28. Schrijver HM, Gerritsen AA, Strijers RL, Uitdehaag BM, Scholten RJ, de Vet HC, et al. Correlating nerve conduction studies and clinical outcome measures on carpal tunnel syndrome: lessons from a randomized controlled trial. J Clin Neurophysiol. (2005) 22:216–21.
29. Bougea A, Zambelis T, Voskou P, Katsika PZ, Tzavara C, Kokotis P, et al. Reliability and validation of the greek version of the Boston carpal tunnel questionnaire. Hand (N Y). (2017) 3:593–99. doi: 10.1177/1558944717725379
30. Ortiz-Corredor F, Calambas N, Mendoza-Pulido C, Galeano J, Diaz-Ruiz J, Delgado O. Factor analysis of carpal tunnel syndrome questionnaire in relation to nerve conduction studies. Clin Neurophysiol. (2011) 122:2067–70. doi: 10.1016/j.clinph.2011.02.030
31. Nora DB, Becker J, Ehlers JA, Gomes I. What symptoms are truly caused by median nerve compression in carpal tunnel syndrome? Clin Neurophysiol. (2005) 116:275–83. doi: 10.1016/j.clinph.2004.08.013
32. Nora DB, Becker J, Ehlers JA, Gomes I. Clinical features of 1039 patients with neurophysiological diagnosis of carpal tunnel syndrome. Clin Neurol Neurosurg. (2004) 107:64–9. doi: 10.1016/j.clineuro.2004.08.003
33. McDiarmid M, Oliver M, Ruser J, Gucer P. Male and female rate differences in carpal tunnel syndrome injuries: personal attributes or job tasks? Environ Res. (2000) 83:23–32. doi: 10.1006/enrs.2000.4042
34. Lue YJ, Lu YM, Lin GT, Liu YF. Validation of the Chinese version of the Boston Carpal Tunnel Questionnaire. J Occup Rehabil. (2014) 24:139–45. doi: 10.1007/s10926-013-9438-9
35. Atkinson G, Nevill AM. Statistical methods for assessing measurement error (reliability) in variables relevant to sports medicine. Sports Med. (1998) 26:217–38. doi: 10.2165/00007256-199826040-00002
36. Rosales RS, Martin-Hidalgo Y, Reboso-Morales L, Atroshi I. Reliability and construct validity of the Spanish version of the 6-item CTS symptoms scale for outcomes assessment in carpal tunnel syndrome. BMC Musculoskelet Disord. (2016) 17:115. doi: 10.1186/s12891-016-0963-5
37. Rosales RS, Delgado EB, Diez de la Lastra-Bosch I. Evaluation of the Spanish version of the DASH and carpal tunnel syndrome health-related quality-of-life instruments: cross-cultural adaptation process and reliability. J Hand Surg Am. (2002) 27:334–43. doi: 10.1053/jhsu.2002.30059
38. Deniz FE, Oksuz E, Sarikaya B, Kurt S, Erkorkmaz U, Ulusoy H, et al. Comparison of the diagnostic utility of electromyography, ultrasonography, computed tomography, and magnetic resonance imaging in idiopathic carpal tunnel syndrome determined by clinical findings. Neurosurgery. (2012) 70:610–6. doi: 10.1227/NEU.0b013e318233868f
39. Green TP, Tolonen EU, Clarke MR, Pathak P, Newey ML, Kershaw CJ, et al. The relationship of pre- and postoperative median and ulnar nerve conduction measures to a self-administered questionnaire in carpal tunnel syndrome. Neurophysiol Clin. (2012) 42:231–9. doi: 10.1016/j.neucli.2012.02.133
40. Leite JC, Jerosch-Herold C, Song F. A systematic review of the psychometric properties of the Boston Carpal Tunnel Questionnaire. BMC musculoskeletal disorders. (2006) 7:78. doi: 10.1186/1471-2474-7-78
41. Mondelli M, Reale F, Sicurelli F, Padua L. Relationship between the self-administered Boston questionnaire and electrophysiological findings in follow-up of surgically-treated carpal tunnel syndrome. J Hand Surg Br. (2000) 25:128–34. doi: 10.1054/jhsb.2000.0361
42. Fowler JR, Munsch M, Huang Y, Hagberg WC, Imbriglia JE. Pre-operative electrodiagnostic testing predicts time to resolution of symptoms after carpal tunnel release. J Hand Surg-Eur Vol. (2016) 41:137–42. doi: 10.1177/1753193415576248
43. Schulze DG, Nordby KC, Cvancarova Småstuen M, Clemm T, Grotle M, Zwart JA, et al. Impact of technical variations on the ring-finger test for carpal tunnel syndrome. Clin Neurophysiol Pract. (2020) 5:23–9. doi: 10.1016/j.cnp.2019.11.005
44. Padua L, Padua R, Lo Monaco M, Aprile I, Tonali P. Multiperspective assessment of carpal tunnel syndrome: a multicenter study. Italian CTS Study Group. Neurology. (1999) 53:1654–9. doi: 10.1212/WNL.53.8.1654
45. Caliandro P, La Torre G, Aprile I, Pazzaglia C, Commodari I, Tonali P, et al. Distribution of paresthesias in Carpal Tunnel Syndrome reflects the degree of nerve damage at wrist. Clin Neurophysiol. (2006) 117:228–31. doi: 10.1016/j.clinph.2005.09.001
46. Sonoo M, Menkes DL, Bland JDP, Burke D. Nerve conduction studies and EMG in carpal tunnel syndrome: do they add value? Clin Neurophysiol Pract. (2018) 3:78–88. doi: 10.1016/j.cnp.2018.02.005
47. Jerosch-Herold C, Bland JDP, Horton M. Is it time to revisit the Boston Carpal Tunnel Questionnaire? New insights from a Rasch model analysis. Muscle Nerve. (2021) 63:484–9. doi: 10.1002/mus.27173
48. Worster A, Carpenter C. Incorporation bias in studies of diagnostic tests: how to avoid being biased about bias. Cjem. (2008) 10:174–5. doi: 10.1017/S1481803500009891
49. Gutmann L. Median–ulnar nerve communications and carpal tunnel syndrome. J Neurol Neurosurg Psychiatry. (1977) 40:982–6. doi: 10.1136/jnnp.40.10.982
50. Martin SP, Schauer KT, Czyrny JJ, Ablove RH. Electrophysiological findings in common median-ulnar nerve interconnections and their clinical implications. J Hand Surg. (2019) 44:884–94. doi: 10.1016/j.jhsa.2019.04.010
51. Iyer V, Fenichel GM. Normal median nerve proximal latency in carpal tunnel syndrome: a clue to coexisting Martin-Gruber anastomosis. J Neurol Neurosurg Psychiatry. (1976) 39:449–52. doi: 10.1136/jnnp.39.5.449
52. Rubin DI, Dimberg EL. Martin-Gruber anastomosis and carpal tunnel syndrome: [corrected] morphologic clues to identification. Muscle Nerve. (2010) 42:457–8. doi: 10.1002/mus.21751
Keywords: clinical utility, Norwegian, 6-item CTS, hand-diagram, carpal tunnel syndrome, Boston CTS questionnaire, COSMIN checklist
Citation: Schulze DG, Nilsen KB, Killingmo RM, Zwart JA and Grotle M (2021) Clinical Utility of the 6-Item CTS, Boston-CTS, and Hand-Diagram for Carpal Tunnel Syndrome. Front. Neurol. 12:683807. doi: 10.3389/fneur.2021.683807
Received: 22 March 2021; Accepted: 28 June 2021;
Published: 27 July 2021.
Edited by:
Vera Bril, University of Toronto, CanadaReviewed by:
Elena Abati, University of Milan, ItalyVincenzo Di Stefano, University of Palermo, Italy
Copyright © 2021 Schulze, Nilsen, Killingmo, Zwart and Grotle. This is an open-access article distributed under the terms of the Creative Commons Attribution License (CC BY). The use, distribution or reproduction in other forums is permitted, provided the original author(s) and the copyright owner(s) are credited and that the original publication in this journal is cited, in accordance with accepted academic practice. No use, distribution or reproduction is permitted which does not comply with these terms.
*Correspondence: Daniel Gregor Schulze, ZC5nLnNjaHVsemVAc3R1ZG1lZC51aW8ubm8=; Z3Jlc2NoQG91cy1oZi5ubw==