 Silvia Leoncini1,2
 Cinzia Signorini3
 Lidia Boasiako1,2
 Valeria Scandurra4
 Joussef Hayek4Lucia Ciccoli3Marcello Rossi5
 Roberto Canitano4
 Claudio De Felice1,2*
- 1Rett Syndrome Trial Center, Child Neuropsychiatry Unit, University Hospital Azienda Ospedaliera Universitaria Senese, Siena, Italy
- 2Neonatal Intensive Care Unit, University Hospital Azienda Ospedaliera Universitaria Senese, Siena, Italy
- 3Department of Molecular and Developmental Medicine, University of Siena, Siena, Italy
- 4Child Neuropsychiatry Unit, University Hospital, Azienda Ospedaliera Universitaria Senese, Siena, Italy
- 5Respiratory Pathophysiology and Rehabilitation Unit, University Hospital, Azienda Ospedaliera Universitaria Senese, Siena, Italy
Background: Breathing abnormalities are common in Rett syndrome (RTT), a pervasive neurodevelopmental disorder almost exclusively affecting females. RTT is linked to mutations in the methyl-CpG-binding protein 2 (MeCP2) gene. Our aim was to assess the clinical relevance of apneas during sleep-wakefulness cycle in a population with RTT and the possible impact of apneas on circulating oxidative stress markers.
Methods: Female patients with a clinical diagnosis of typical RTT (n = 66), MECP2 gene mutation, and apneas were enrolled (mean age: 12.5 years). Baseline clinical severity, arterial blood gas analysis, and red blood cell count were assessed. Breathing was monitored during the wakefulness and sleep states (average recording time: 13 ± 0.5 h) with a portable polygraphic screening device. According to prevalence of breath holdings, the population was categorized into the wakefulness apnea (WA) and sleep apnea (SA) groups, and apnea-hypopnea index (AHI) was calculated. The impact of respiratory events on oxidative stress was assessed by plasma and intra-erythrocyte non-protein-bound iron (P-NPBI and IE-NPBI, respectively), and plasma F2-isoprostane (F2-IsoP) assays.
Results: Significant prevalence of obstructive apneas with values of AHI > 15 was present in 69.7% of the population with RTT. The group with SA showed significantly increased AHI values > 15 (p = 0.0032), total breath holding episodes (p = 0.007), and average SpO2 (p = 0.0001) as well as lower nadir SpO2 (p = 0.0004) compared with the patients with WAs. The subgroups of patients with WA and SA showed no significant differences in arterial blood gas analysis variables (p > 0.089). Decreased mean cell hemoglobin (MCH) (p = 0.038) was observed in the group with WAs. P-NPBI levels were significantly higher in the group with WA than in that with SAs (p = 0.0001). Stepwise multiple linear regression models showed WA being related to nadir SpO2, average SpO2, and P-NPBI (adjusted R2 = 0.613, multiple correlation coefficient = 0.795 p < 0.0001), and P-NPBI being related to average SpO2, blood PaCO2, red blood cell mean corpuscular volume (MCV), age, and topiramate treatment (adjusted R2 = 0.551, multiple correlation coefficient = 0.765, p < 0.0001).
Conclusion: Our findings indicate that the impact of apneas in RTT is uneven according to the sleep-wakefulness cycle, and that plasma redox active iron represents a potential novel therapeutic target.
Introduction
Sleep disorders are variably prevalent in rare genetic syndromes (1) such as Rett syndrome (RTT, OMIM #312750) (2, 3), a pervasive neurodevelopmental disorder affecting almost exclusively females (1:10,000) and mainly linked to mutations in the gene encoding methyl-CpG-binding protein 2 (MeCP2) (4). Although a rare disorder, RTT represents a leading cause of severe cognitive impairment in the female gender (5).
Affected individuals commonly show a period of apparent early normal development, followed by regression of hand and/or communication skills, and subsequent development of hand stereotypies, while gait is often abnormal in those who are learning to walk (6).
Wide variability in clinical phenotypes of patients with RTT is observed and often related to specific MECP2 mutations (7, 8). It is currently evident that RTT is a multisystemic disease (9) with associated comorbidities often being linked to genotype-phenotype correlations (10).
In particular, sleep problems in RTT have been largely investigated using questionnaires (11–13) and performing polysomnography (14–19), electroencephalogram spectral analysis (20), or actigraphy (3). Breathing abnormalities are considered as a hallmark feature in RTT (21, 22).
Although breathing abnormalities in RTT have been reported to disappear during sleep, there are, indeed, indications of respiratory abnormalities that occur during both wakefulness and sleep (14, 23–27). Awake breathing dysfunction follows an age-dependent pattern, it occurs in vast majority of patients with RTT, and it is related to function, quality of life, and risk for cardiac dysrhythmia (28).
Earlier findings indicate that breathing disturbances in RTT can be linked to oxidative stress (OS) (29–32), abnormal erythrocyte shapes (33), pulmonary gas exchange abnormalities (32), and a pulmonary radiological picture partially mimicking that of respiratory bronchiolitis-associated interstitial lung disease (RB-ILD) (34). However, to date, no evidence exists regarding a potential differential impact of breath holding on circulating pro-oxidant molecules and acid-base balance/blood gas analysis during the sleep-wakefulness cycle in girls with RTT.
The aim of this study was to assess the clinical relevance of apneas during the sleep-wakefulness cycle in a population with RTT and the possible impact of apneas on circulating oxidative stress markers.
Materials and Methods
Participants
A total of (n = 66) female patients with a clinical diagnosis of typical RTT and proven MECP2 gene mutation were recruited (mean age: 12.6 ± 7.6 years; range: 2–32 years). RTT diagnosis and inclusion/exclusion criteria were based on the revised nomenclature consensus (6). To evaluate the clinical impact on illness severity, the Rett Clinical Severity Score (RCSS) was assessed (35). Corresponding z-scores for head circumference and body mass index were calculated on the basis of validated RTT-specific growth charts (36). Pain sensitivity was rated as either delayed or reduced response in 53 (81%) of the 66 of examined females with RTT. To take into account the possible influence of presence of scoliosis and epilepsy on respiratory dysfunction, data regarding coronal Cobb angle, presence of epilepsy, seizure frequency, and antiepileptic drug (AED) therapy were recorded. Scoliosis severity was rated as mild (Cobb angle 10–20°), moderate (Cobb angle < 40°), or severe (≥ 40°) according to Killian et al. (37). A routine clinical ENT evaluation was performed, and tonsillar size grading was categorized according to Brodsky (38). Clinical stage distribution was stage II (n = 10), stage III (n = 38), and stage IV (n = 18). All the patients were admitted to the Rett Syndrome National Reference Center of the University Hospital of Azienda Ospedaliera Universitaria Senese (Siena, Italy). Given the specific aim of the study, subjects with clinically evident inflammatory conditions, either acute or chronic, and individuals on anti-inflammatory drugs or undergoing supplementation with known antioxidants were excluded. At the time of examination, all the patients were neither on ventilatory assistance nor oxygen supplementation.
All the examined subjects were on a typical Mediterranean diet. The study was approved by the Ethical Committee of Siena University Hospital (Azienda Ospedaliera Universitaria Senese, Siena, Italy). Informed consent was provided by the parents/legal guardians.
Clinical Severity
Clinical severity was assessed by Rett Clinical Severity Score (RCSS) (35), a validated RTT-specific scale designed to assess the severity of key symptoms and consists of 13 items providing a rating of core symptoms of RTT on a Likert scale of either 0–4 or 0–5 with a maximum total score of 58. RCSS was rated by two experienced clinicians (JH and CDF). To reduce interobserver variability, the average score of the two physicians was used for data analysis.
Cardiorespiratory Monitoring
In order to analyze the occurrence of apneas and hypopneas, breathing monitoring was carried out on the patients with RTT during wakefulness and sleep state using a portable polygraphic screening device for a mean recording time of 13 ± 0.5 h for each state (SOMNOwatchTM plus; SOMNOmedics, Randersacker, Germany; importer for Italy Linde Medicalesrl). The monitoring included nasal airflow, arterial oxygen saturation by pulse oximetry, and respiratory efforts by abdominal and thoracic bands. Breathing patterns were analyzed for presence of apneas and hypopneas according to standardized definitions by the American Academy of Sleep Medicine (39) and the American Academy of Pediatrics (40).
Apneas were defined as > 90% airflow decrease for 10 s, and hypopneas were defined as > 50% airflow reduction for ~10 s associated with decrease of 3% in oxygen saturation (40). Apneas were categorized as obstructive (i.e., cessation of airflow for 10 s with persistent respiratory effort), central (i.e., cessation of airflow for 10 s with no respiratory effort), or mixed (apneas that begin as central but end up as obstructive). Apnea-hypopnea index (AHI) was the expression of the number of obstructive and central apneas and hypopneas per hour of sleep and calculated by dividing the total number of events by total sleep time. An AHI > 15 was considered clinically significant, and all records were reviewed and interpreted by an expert pneumologist (MR).
Blood Gas Analysis (BGA) and Acid-Base Balance
Arterial blood for gas analyses was obtained from either the humeral or the radial artery prior to cardiorespiratory recording. Partial arterial pressure of oxygen (PaO2) and carbon dioxide (PaCO2), and pH were determined by a commercially available blood gas analyzer (ABL520 radiometer; Copenhagen, Denmark). In order to account for low PaCO2 values often observed in patients with RTT, standard PaO2 was calculated according to the formula by Sorbini et al. (41) [i.e., PaO2 = 1.66 × PaCO2 + PaCO2 – 66.4].
Patterns of BGA were categorized by a pneumologist (MR) with longstanding expertise on BGA interpretation as follows: normal acid-base balance, acute respiratory alkalosis, compensated respiratory acidosis, fully compensated respiratory alkalosis, partially compensated respiratory alkalosis, compensated respiratory alkalosis and metabolic acidosis, or mixed respiratory alkalosis/metabolic acidosis.
Blood Cell Count
All routine clinical analytes were assayed on a Sysmex XT-2100 system (42). Mean corpuscular volume (MCV), mean cell hemoglobin (MCH), mean cell hemoglobin concentration (MCHC), and red cell distribution width (RDW) were measured with an electric resistance detecting method (impedance technology) and by hydrodynamic focusing. Hemoglobin (Hb) was measured photocolorimetrically using a cyanide-free method.
Oxidative Stress (OS) Markers
Blood Sampling
Blood was collected in heparinized tubes and all procedure were carried out within 2 h after sample collection. Blood samples were centrifuged at 2,400 × g for 15 min at 4°C; platelet-poor plasma was saved, and buffy coats were removed by aspiration. RBCs were washed twice with a physiologic solution (150 mM NaCl). An aliquot of packed erythrocytes was resuspended in a Ringer solution (125 mM NaCl, 5 mM KCl, 1 mM MgSO4, and 32 mM N-2 hydroxyethylpiperazine-N2-ethanesulfonic acid, HEPES, 5 mM glucose, and 1 mM CaCl2), pH 7.4 as a 50% (vol/vol) suspension for the determination of intra-erythrocyte NPBI. Plasma was used for the NPBI assay and lipid peroxidation markers (F2-isoprostanes).
Intra-Erythrocyte and Plasma Non-protein-bound Iron (IE- and P-NPBI)
Non-protein-bound iron (NPBI) is considered not only an OS marker but also a pro-oxidant factor. In particular, IE-NPBI is a critical marker of hypoxia. IE-NPBI (nmol/ml erythrocyte suspension) was determined as a desferrioxamine- (DFO) iron complex (ferrioxamine), as previously reported (30). P-NPBI (nmol/ml) was determined as the above reported for IE-NPBI (30).
Plasma F2-Isoprostanes (F2-IsoPs)
A series of prostaglandin F2-like compounds (F2-IsoPs) generated by non-enzymatic oxidation of membrane phospholipid-bound arachidonic acid are considered specific and reliable markers for evaluation of in vivo OS conditions. A gas chromatography/negative ion chemical ionization tandem mass spectrometry (GC/NICI-MS/MS) analysis with prior derivatization steps were carried out. To quantify F2-IsoP amounts, the measured ions of 15-F2t-IsoPs (one of the most represented isomers of F2-IsoPs and also known as 8-epi-PGF2α) and internal standard PGF2α-d4 were determined [product ions at m/z 299 and m/z 303 whose precursors ions were m/z 569 and m/z 573, respectively (43)].
Analysis of Statistical Data
All variables were tested for normal distribution (D'Agostino-Pearson test), and data were presented as means ± standard deviation or medians and interquartile range for continuous normally distributed and non-Gaussian variables, respectively. Differences between RTT and control groups were evaluated by independent-sample t-test (continuous normally distributed data), Mann-Whitney rank sum test (continuous non-normally distributed data), chi-square statistics (categorical variables with minimum number of cases per cell ≥ 5), or Fisher's test (categorical variables with minimum number of cases per cell 0.5 was accepted to indicate good discrimination). Relationships between variables in univariate analysis were tested by linear regression analysis or Spearman's rank correlation. Analysis of variance was performed by one-way ANOVA or Kruskal-Wallis test, as appropriate. To test independent predictor variables for a dependent variable, stepwise multiple regression analysis models (significance entry criterion p < 0.05, with removal criterion p > 0.1) were tested considering normal distribution of residuals by Kolmogorov-Smirnov test. The MedCalc version 20.013 statistical software package (MedCalc Software Ltd., Ostend, Belgium; https://www.medcalc.org; 2021) was used for data analysis, and a two-tailed p < 0.05 was considered to indicate statistical significance.
Results
Baseline Data
Demographics, Biometrics, and Clinical Features
Demographics, biometrics, and clinical features of the examined patients with RTT are shown in Table 1. Mean patient's age was 12.5 ± 7.4 years (pediatric patients, n = 50, 75.8% vs. adult patients, n = 16, 24.2%; chi-square 17.515, DF = 1, contingency coefficient 0.458, p < 0.0001).
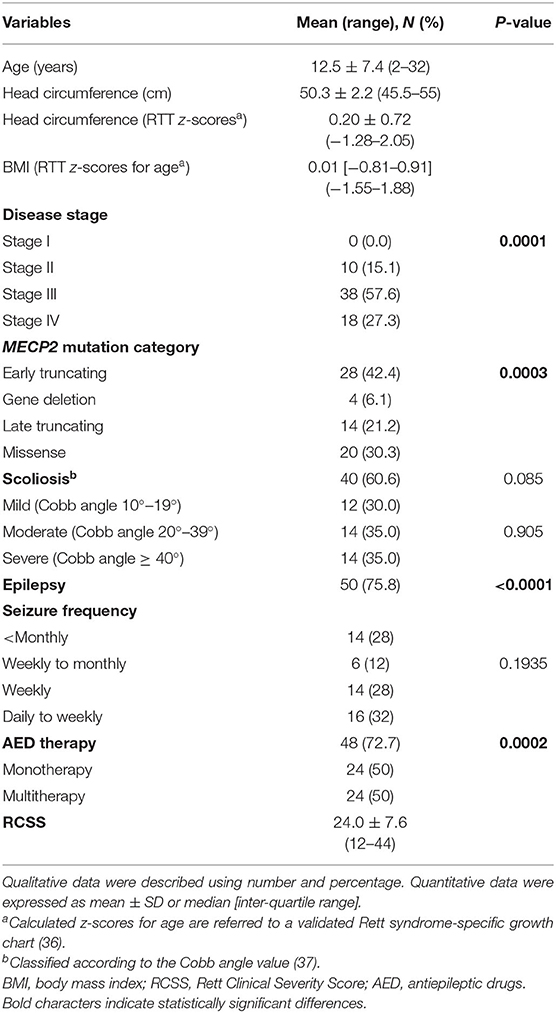
Table 1. Demographic and clinical characteristics of the examined patients with Rett syndrome (RTT) (n = 66).
After RTT curve-specific BMI z-score categorization into low (< −1.881, i.e., <3rd percentile), normal (−1.881 < z-score <1.881), and high (>1.881, i.e., > 97th percentile) range groups, a significant difference was observed with 6.1% in the high-range group (n = 4) and 93.9% in the normal range (n = 62) without patients in the low-range group. (chi-square 50.97, DF = 1, contingency coefficient 0.66, p > 0.0001) (data not shown).
No difference was observed for the presence of scoliosis (40 of the 66 patients with RTT have scoliosis vs. 26 who have no scoliosis, chi-square 2.97, DF = 1, contingency coefficient 0.208, p = 0.0848) or for its degree [mild (n = 12, 30%), moderate (n = 14, 35%), and severe (n = 14, 35%) (chi-square 0.2, DF = 2, contingency coefficient 0.071, p = 0.071)].
A total of 9 out of the 66 patients with RTT (22%; mean age 10.1 ± 3.4 yrs) exhibited tonsillar hypertrophy on clinical examination (n = 4 tonsil size grading scale 1+, i.e., tonsils occupying <25% of the lateral dimension of the oropharynx, as measured between the anterior tonsillar pillars; and n = 5 tonsil size grading scale 2+, i.e., tonsils occupying 26–50% of the lateral dimension of the oropharynx) (38).
Of the examined patient's population (n = 66), 75.8% (50/66) exhibited seizures vs. 24.2% (16/66) with no seizures. Among the patients with RTT with seizures, 28% (14/50) had seizure frequency < monthly, 12% (6/50) weekly to monthly, 28% (14/50) weekly, and 32% (16/50) daily to weekly.
A total of 48 out of the 66 patients were on AEDs (p = 0.002): 24/48 were on monotherapy and 24/48 were on multi-therapy. Among the AED-treated patients, 42/48 (87.5%) were on carbamazepine (CBZ), 8/48 (16.7%) on valproic acid (VPA), 10/48 (20.8%) on topiramate (TPM), 4/48 (8.3%), on levetiracetam (LEVET), 2/48 (4.2%), on clobazam (CLB), and 8/48 (16.7%) on phenobarbital (PB).
Significant differences in the distribution of clinical disease stages (significant excess of patients in stage III, i.e., 57.6%, chi-square 18.909, DF = 2, contingency coefficient 0.472, p = 0.0001) and MECP2 mutation category (significant excess in early truncating mutations, i.e., 42.4%, chi-square 18.606, DF = 3, contingency coefficient 0.469, p = 0.0003) were observed.
Based on the MECP2 genotype, the patients with RTT harbored the following MECP2 pathogenic mutations: R106W (3%), T158M (12.1%), R168X (6.1%), R255X (12.1%), R270X (12.1%), R294X (6.1%), C-terminal deletions (18.2%), large deletions (6.1%), and non-hotspot mutations (24.2%).
An MECP2 genotype-related distribution of scoliosis frequency was observed (chi-square 21.818, DF = 8, p = 0.0053) with the highest frequency in patients with RTT with non-hotspot-type mutations (24.2%), C-terminal deletions (18.2%), R255X (12.1%), R270X (12.1%), and T158M (12.1%). The lowest frequency of scoliosis was observed in patients with late truncating deletions (6.1%), R168X (6.1%), R294X (6.1%), and R106W (3%).
Cardiorespiratory Monitoring and Arterial Blood Gas Analysis
Baseline cardiorespiratory monitoring data are shown in Table 2. The patients with RTT displayed an excess in obstructive apneas (80.3%) compared to the central and mixed ones (chi-square 66.091, DF = 2, contingency coefficient 0.707, p < 0.0001). Significant prevalence of AHI values > 15 was observed in 69.7% of the whole population with RTT (chi-square 10.242, DF = 1, contingency coefficient 0.367, p = 0.0014).
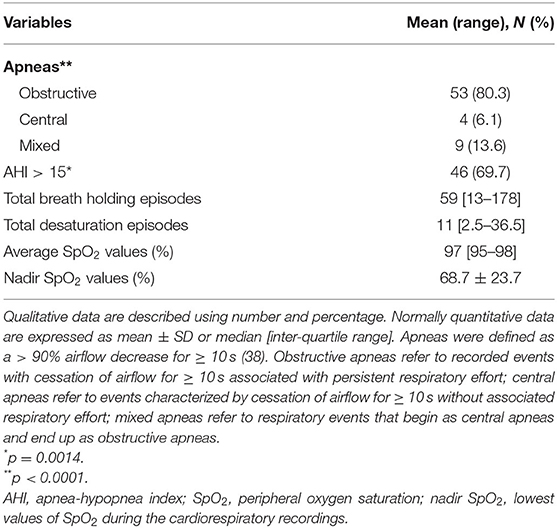
Table 2. Baseline cardiorespiratory monitoring of the examined patients with RTT (n = 66).
No significant difference was observed in total breath holding episodes as a function of disease stage (Kruskal-Wallis test p = 0.1409). Total breath holding episodes are statistically different as a function of MECP2 genotype distribution (Kruskal-Wallis test p = 0.0329). Highest number of total breath holding episodes were recorded in patients harboring both R270X mutations [134 (inter-quartile range, IQR, 65–274)] and C-terminal deletions [13.5 (IQR 1–194)], while lowest breath holding number was recorded in patients with other non-hotspot mutation types [30.5 (IQR 21–44)] and T158M [32.5 (IQR 10.5–108.5)] (Supplementary Figure 1). Total breath holding episodes were positively related to disease severity (r = 0.307, p = 0.0121) (Supplementary Figure 2).
Total desaturation episodes were significantly different as a function of disease stage (stage II median 11.5, stage III 7.5, and stage IV 40; Kruskal-Wallis p = 0.00001) with highest values in stages II and IV (stages II and III vs. stage IV, Conover test p <0.05) (Supplementary Figure 1). No significant differences were observed in MECP2 genotype distribution for total desaturation episodes (Kruskal-Wallis test p = 0.6219). Total desaturation episodes were positively correlated to disease severity (r = 0.6193, p < 0.0001) (Supplementary Figure 2).
No significant difference was observed in average SpO2 values as a function of disease stage (Kruskal-Wallis test p = 0.581). An MECP2 genotype-related distribution of average SpO2 was observed (Kruskal-Wallis test p = 0.0423), with the highest values in patients with R168X mutations [99 (IQR 99–99)], R294X mutations [97.5 (IQR 97–98)], and other non-hotspot-type mutations [97 (IQR 96–98.5)]. In contrast, the lowest values of average SpO2 were observed in patients with R255X mutations [95.5 (IQR 94–96.5)], large deletions [94.5 (IQR 93–97)], and R106W mutations [94 (IQR up to 94)] (Supplementary Figure 1). Average SpO2 values were negatively correlated to age (r = −0.2645, p = 0.032) (Supplementary Figure 2), while no correlation was observed between average SpO2 values and clinical severity (r = −0.141, p = 0.259).
No significant difference was observed in nadir SpO2 values as a function of disease stage (Kruskal-Wallis test p = 0.6274). Nadir SpO2 (i.e., lowest values of SpO2 reached during cardiorespiratory recordings) values were unevenly distributed according to MECP2 genotype (Kruskal-Wallis test p = 0.0062). Nadir SpO2 values close to physiological range were recorded in patients with R106W mutations [89 (IQR up to 89)], other non-hotspot-type mutations [87 (IQR 86–94)], and C-terminal deletions [85.5 (IQR 78–90)], whereas values farther from the physiological range were observed in patients harboring R255X mutations [58.5 (IQR 33–84.5)], large deletions [53 (IQR 48–63)], and R270X mutations [45 (IQR 31.5–72)] (Supplementary Figure 1). A non-significant correlation was observed between nadir SpO2 values and clinical severity (r = −0.175, p = 0.16).
Arterial Blood Gas Analysis
Results of the blood gas analyses are shown in Table 3. Baseline hypoxia (i.e., standard PaO2 < 75 mmHg) and hypocapnia (i.e., blood PaCO2 < 35 mmHg) were present in n = 16 and n = 24 of the patients with RTT, respectively (standard PaO2: chi-square 17.515, DF = 1, contingency coefficient 0.458, p < 0.0001; PaCO2: chi-square 4.909, DF = 1, contingency coefficient 0.263, p = 0.0267) (Figure 1). Interestingly, no significant relationships were observed between average SpO2 and blood PaO2 or standard PaO2 (r = −0.069, p = 0.5831 and r = −0.038, p = 0.7641, respectively). No significant difference was detected (p =0.172) concerning normalized respiratory rate (z-scores for age) as a function of hypocapnia. Interestingly, blood standard PaO2 values were significantly decreased in RTT patients with hypocapnia compared to patients with normocapnia (Mann-Whitney test, p = 0.0001) (Supplementary Figure 3).
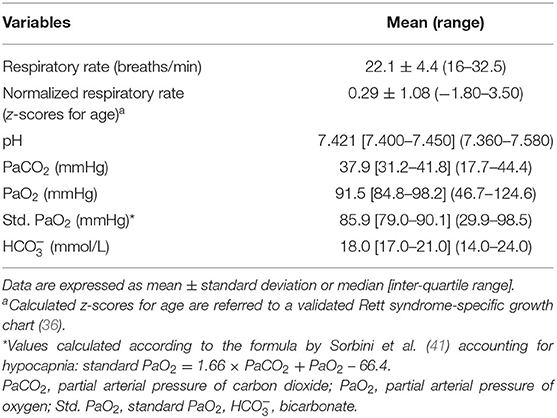
Table 3. Baseline respiratory and arterial blood gas analysis of the examined patients with RTT (n = 66).
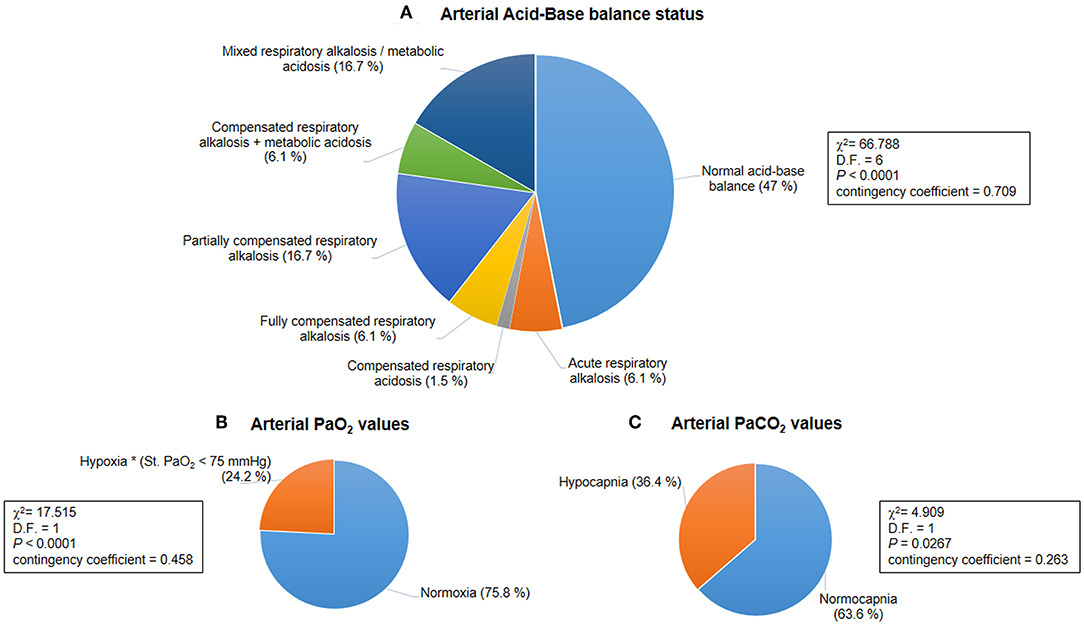
Figure 1. Baseline acid-base balance and gas analysis status for the whole population with Rett syndrome (RTT) (n = 66). (A) Distribution of patterns of the arterial acid-base balance status was significantly different (p < 0.0001). (B) A hypoxic condition (i.e., arterial blood Std. PaO2 < 75 mmHg) was observed in 24.2% of the whole population with RTT (p < 0.0001). (C) Hypocapnia (i.e., arterial blood PaCO2 < 35 mmHg) was present in 36.4% of all the examined patients with RTT (p = 0.0267). PaO2, partial arterial pressure of oxygen; PaCO2, partial arterial pressure of carbon dioxide.
Significant positive correlations were observed for standard PaO2, blood and disease severity (r = 0.247, p = 0.045 and r = 0.261, p = 0.0344, respectively) (Supplementary Figure 2).
Based on BGA pattern interpretation (Figure 1), n = 31 of the patients with RTT presented normal acid-base balance, whereas n = 35 showed altered BGA patterns. In particular, the following patterns were observed: acute respiratory alkalosis (n = 4), compensated respiratory acidosis (n = 1), fully compensated respiratory alkalosis (n = 4), partially compensated alkalosis (n = 11), compensated respiratory alkalosis and metabolic acidosis (n = 4), and mixed respiratory alkalosis/metabolic acidosis (n = 11). The distribution of the patterns was statistically significant (chi-square 66.788, DF = 6, contingency coefficient 0.709, p < 0.0001).
Significant differences were observed for blood pH, PaCO2, and values as a function of BGA pattern (Kruskal-Wallis test p = 0.000017, p < 0.000001, and p = 0.002515, respectively) (Figure 2).
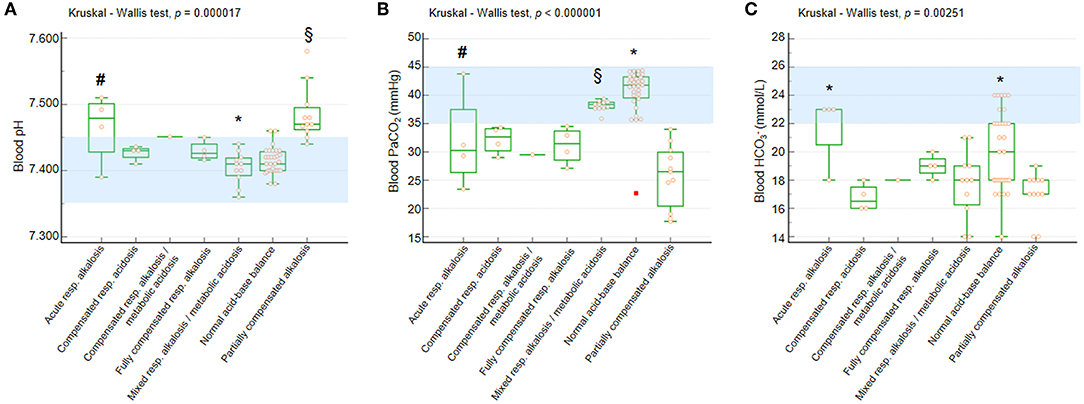
Figure 2. Blood pH, PaCO2, and in the whole population with RTT as a function of acid-base balance patterns. (A) Blood pH. Post-hoc analysis (Conover test): *p < 0.05 vs. all the other categories with the single exception of normal acid-base balance. §vs. compensated respiratory alkalosis + metabolic acidosis, fully compensated respiratory alkalosis, mixed respiratory alkalosis/metabolic acidosis, and normal acid-base balance. #vs. normal acid-base balance. (B) Blood PaCO2. Post-hoc analysis (Conover test):*p < 0.05 vs. all the other categories. §vs. compensated respiratory alkalosis + metabolic acidosis, fully compensated respiratory alkalosis, and partially compensated respiratory alkalosis. #vs. partially compensated respiratory alkalosis and normal acid-base balance. (C) Blood . Post-hoc analysis (Conover test): *p < 0.05 vs. compensated respiratory alkalosis + metabolic acidosis, mixed respiratory alkalosis/metabolic acidosis, and partially compensated respiratory alkalosis. §vs. compensated respiratory alkalosis + metabolic acidosis and partially compensated respiratory alkalosis. PaCO2, partial arterial pressure of carbon dioxide; , arterial bicarbonate. Data are shown as box and whisker plots. Bars represent medians and inter-quartile ranges. Red rectangle indicates outlier data point. Normal range values (consensus definitions) are highlighted in light blue.
All the patients showed blood pH within the reference range with the exception of girls with acute respiratory alkalosis and partially compensated alkalosis (Figure 2A). Only patients with normal acid-base balance and mixed respiratory alkalosis/metabolic acidosis showed blood PaCO2 levels within the normal range, whereas the other categories showed median values below the lower normal limit (Figure 2B).
The patients showed reduced blood levels with the exception of those with acute respiratory alkalosis (Figure 2C).
According to prevalence of breath holding, the RTT population was subsequently categorized into two main apnea subgroups i.e., wakefulness apnea (WA) or sleep apnea (SA).
Distribution of normalized respiratory rate (i.e., z-scores) as a function of acid-base balance status is shown (Supplementary Figure 4A), as well as an exploratory study on the relationships between normalized respiratory rate (z-scores) and arterial blood gas parameters in the whole population with RTT (Supplementary Figures 4B–E). Although no significant differences were detectable, higher normalized respiratory rate was observed in patients with acute respiratory alkalosis (p = 0.052).
Red Blood Cell Parameters
Baseline hematological variables are shown in Table 4. Overall, a condition of apparently asymptomatic anemia was found to be present in 19 (28.8%) of the whole population (chi-square 42.818, DF = 2, contingency coefficient 0.627, p < 0.0001). The degree of anemia was found to be mild in 8 patients (12.1% of the whole population and 42.1% of the anemic patients) and moderate in 11 patients (16.7% of the whole population and 57.9% of the anemic patients with RTT). A total of 13 girls of pediatric age and 6 adult patients showed Hb levels below the WHO cut-off diagnostic criteria for anemia laboratory diagnosis (44) (chi-square 1.046, DF = 2, contingency coefficient 0.593, p = 0.528).
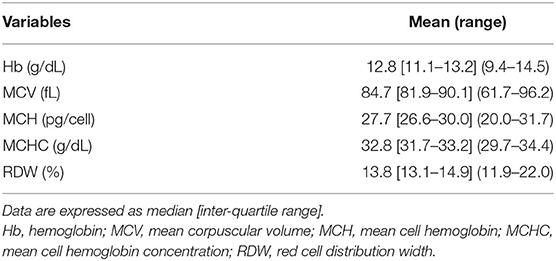
Table 4. Baseline red blood cell count variables of patients with RTT (n = 66).
No significant differences were observed in the frequency of asymptomatic anemia (n = 19) vs. non-anemic patients (n = 47) as a function of RTT curve-specific BMI z-score category (anemic patients with RTT: high BMI range group n = 2 and normal BMI range group n = 17) (chi-square 0.92, DF = 1, contingency coefficient 0.117, p = 0.337). As it concerns the degree of anemia, no significant differences were observed (mild anemia: n = 2 high BMI range group vs. n = 6 normal BMI range group; moderate anemia: all the patients (n = 11) were within the normal BMI range group) (chi-square 2.912, DF = 1, contingency coefficient 0.365, p = 0.088).
The distribution of anemic vs. non-anemic patients as a function of scoliosis was significantly asymmetric; indeed, scoliosis was observed in 16/19 (84.2%) anemic patients vs. 24/47 (51.1%) non-anemic patients (chi-square 6.132, DF = 1, contingency coefficient 0.292, p = 0.0133). When the degree of anemia is considered, no significant difference was observed between the groups (mild anemia group: 6/8 patients presented scoliosis vs. moderate anemia group: 10/11) (chi-square 0.835, DF = 1, contingency coefficient 0.361, p = 0.205).
Wakefulness Apnea (WA) vs. Sleep Apneas (SA)
Demographics, Biometrics, and Clinical Features
Demographics, biometrics, and clinical features of the WA (n = 17) and SA (n = 49) subgroups are shown in Table 5. Mean age of the WA subgroup was 14.7 ± 9.2 years (pediatric patients, n = 11, 64.7%, vs. adult patients, n = 6, 35.3%), whereas the mean age of the SA subgroup was 11.8 ± 6.6 years (pediatric patients, n = 39, 79.6%, vs. adult patients, n = 10, 20.4%). No significant difference was observed in the WA and SA subgroups (chi-square 1.5, DF = 1, contingency coefficient 0.149, p = 0.2207).
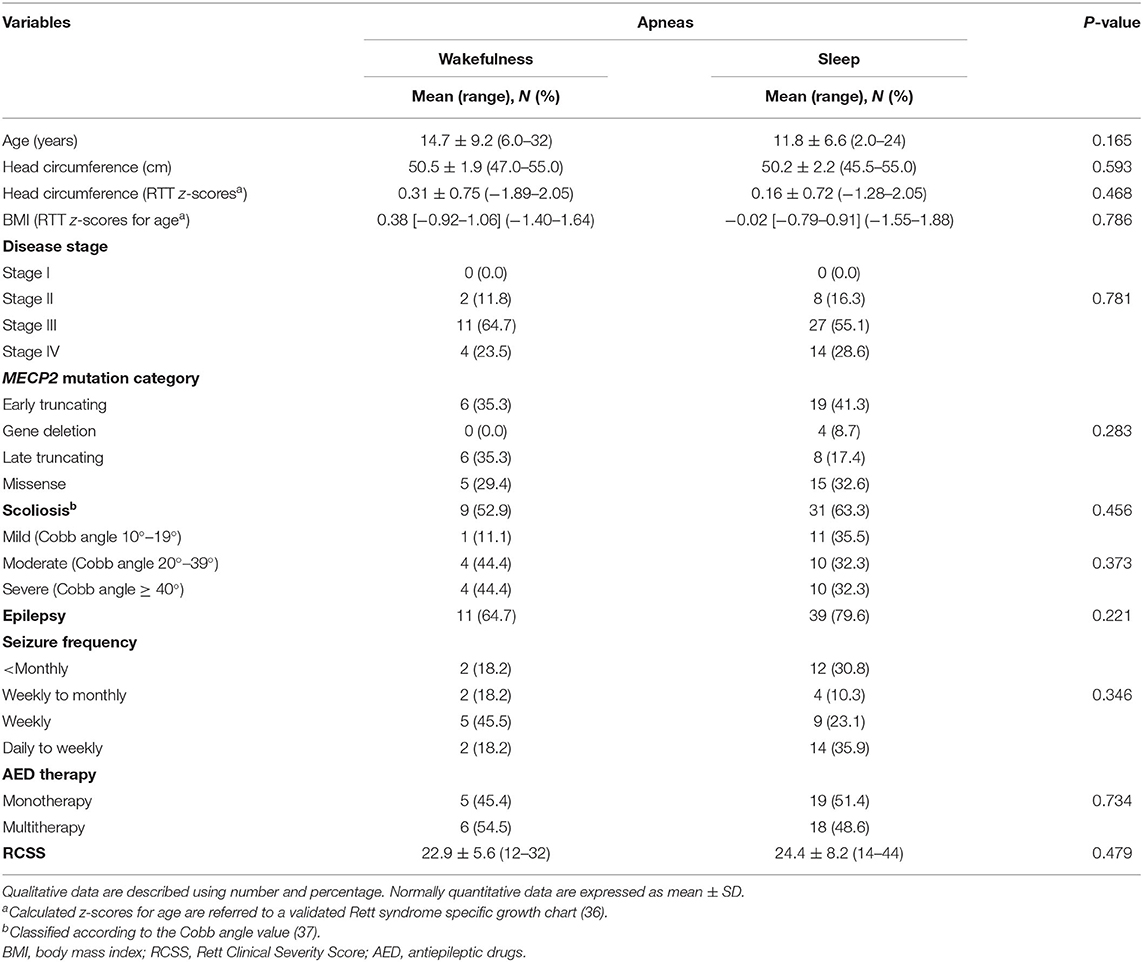
Table 5. Demographic and clinical characteristics of the examined population with RTT as a function of wakefulness (n = 17) vs. sleep apneas (n = 49).
After RTT curve-specific BMI z-score categorization (low-, normal-, and high-range groups), no significant difference was observed between the patients with WA and SA [WA: normal, 100% (n = 17); SA: high, 8.2 (n = 4), and 91.8% (n = 45) normal; chi-square 1.455, DF = 1, contingency coefficient 0.147, p = 0.2277]. There was no significant difference in the distribution of tonsillar hypertrophy between the WA and SA subgroups (WA: n = 1 and SA: n = 8, Fisher test p = 0.4275).
Based on MECP2 genotype classification, no statistical difference was observed between the WA and SA subgroups (p = 0.0809). In particular, patients from the WA subgroup harbored the following MECP2 pathogenic mutations: R106W (11.8%), T158M (11.8%), R168X (8.2%), R255X (11.8%), R270X (11.8%), R294X (8.2%), C-terminal deletions (35.3%), and other mutation types (17.6%). MECP2 genotype distribution in the SA subgroup was as follows: T158M (12.2%), R255X (12.2%), R270X (12.2%), large deletions (8.2%), C-terminal deletions (12.2%), and other non-hotspot mutation types (26.5%). No significant differences in the distribution of clinical disease stages and MECP2 mutation category were observed in the WA and SA subpopulations (p = 0.781 and p = 0.283, respectively).
Cardiorespiratory Monitoring
Cardiorespiratory monitoring data are shown in Table 6. In both subgroups, the patients with RTT showed an excess in obstructive apneas (94.1% in the WA subgroup vs. 75.5% in the SA subgroup) compared to the central (0% in the WA subgroup vs. 8.2% in the SA subgroup) and mixed ones (5.9% in the WA subgroup vs. 16.3% in the SA subgroup) (intergroup difference p = 0.2297).
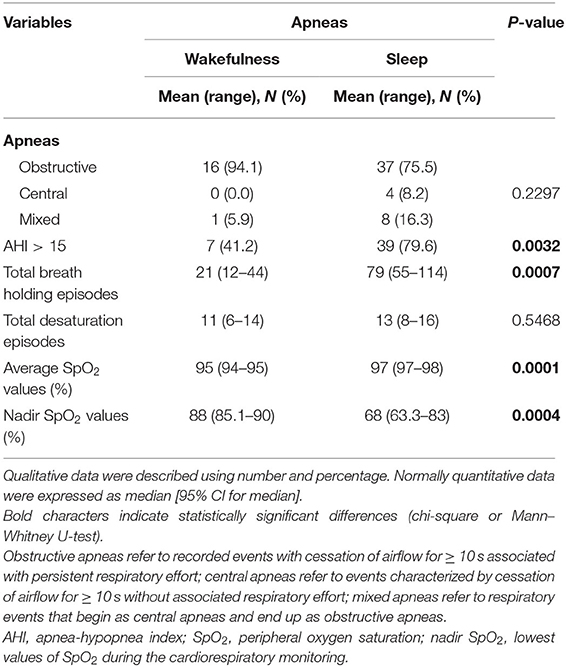
Table 6. Cardiorespiratory monitoring of the examined population with RTT as a function of wakefulness (n = 17) vs. sleep apneas (n = 49).
The SA group showed significantly increased AHI values > 15 (p = 0.0032), total breath holding episodes (p = 0.007), and average SpO2 (p = 0.0001) as well as nadir SpO2 (p = 0.0004) compared with the patients with WA. Paradigmatic examples of the distribution pattern for respiratory events in the subpopulations with WA and SA-RTT are shown in Supplementary Figure 5.
Blood Gas Analysis
Blood gas analysis results are shown in Table 7. No differences were observed for blood pH, PaCO2, and PaO2 between the patients with WA and those with SA (p ≥ 0.089). No difference was observed for frequency of hypoxia (i.e., standard PaO2 < 75 mmHg) (n = 5 in the WA subgroup and n = 11 in the SA subgroup; chi-square 0.328, DF = 1, contingency coefficient 0.07, p = 0.567). In contrast, a significant difference was observed regarding frequency of hypocapnia (n = 10 in the WA subgroup, n = 14 in the SA subgroup; chi-square 4.916, DF = 1, contingency coefficient 0.263, p = 0.027). Based on BGA pattern interpretation (Figure 3), no significant difference between the WA and SA subgroups was observed (p = 0.5691).
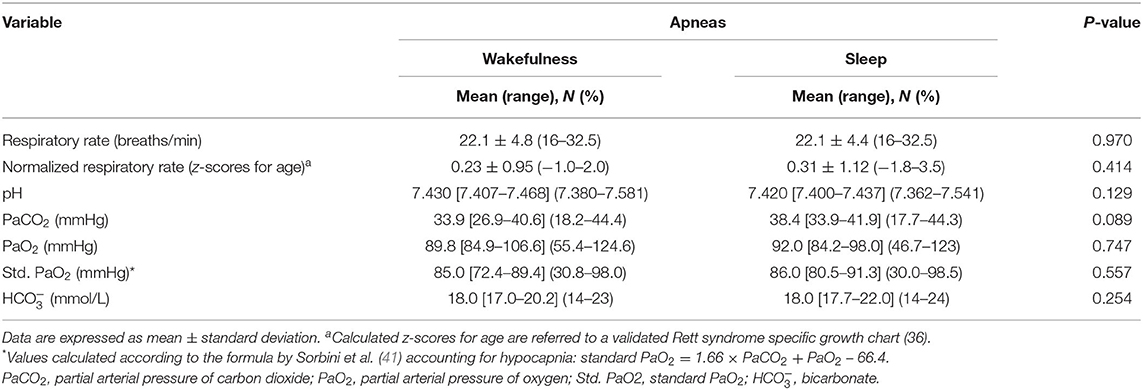
Table 7. Respiratory and arterial blood gas analysis data of the examined patients with RTT as a function of wakefulness (n = 17) vs. sleep apneas (n = 49).
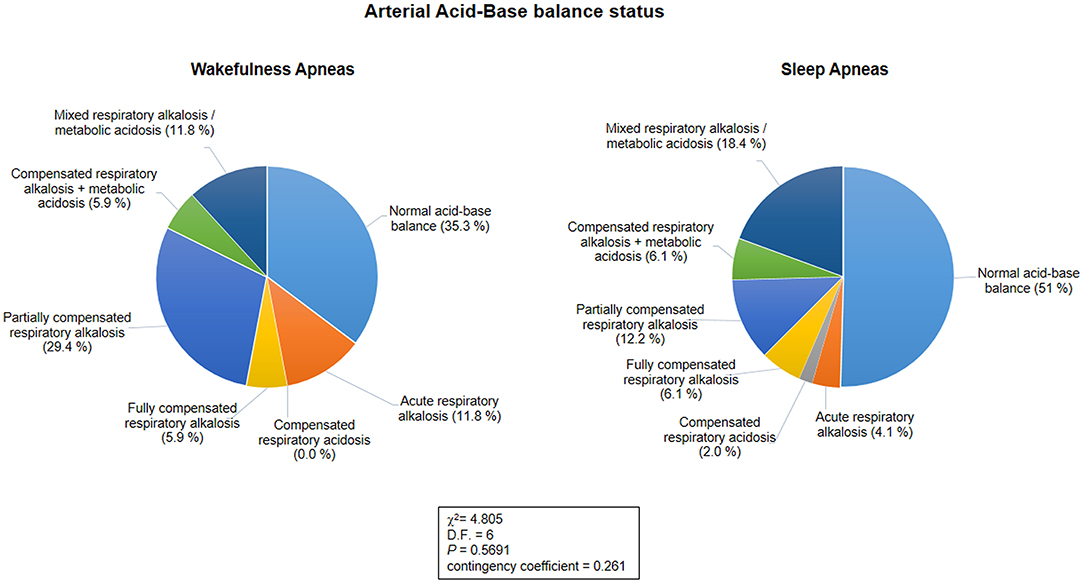
Figure 3. Arterial acid-base balance status as a function of the sleep-wakefulness cycle (n = 66). No statistical differences were observed in arterial acid-base balance patterns between the wakefulness and sleep apnea subpopulations (p = 0.5691).
Red Blood Cell Parameters
Hematological variables are shown in Table 8. No difference was observed between the WA and SA subgroups concerning Hb, MCV, and MCHC (p ≥ 0.083). Decreased MCH values were observed in the patients with WA compared to the patients with SA (p = 0.038). Although not statistically significant, the WA subgroup showed higher RDW values than the patients with SA (p = 0.064). Likewise, no statistically significant differences between the two subgroups in degree of anemia were detectable (WA subgroup: n = 4 mild, n = 3 moderate, vs. SA subgroup: n = 4 mild, n = 8 moderate; chi-square 0.974, DF = 1, contingency coefficient 0.221, p = 0.324).
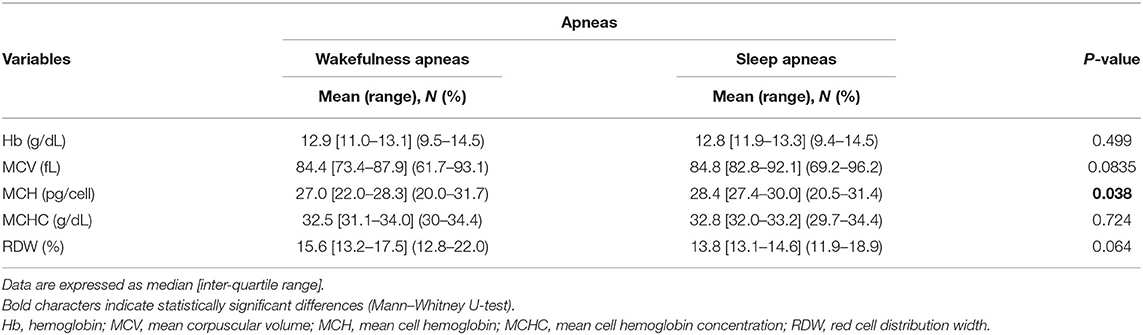
Table 8. Red blood cell count variables in data of the examined patients with RTT as a function of wakefulness (n = 17) vs. sleep apneas (n = 49).
Circulating OS Markers
The patients with RTT showed higher levels of pro-oxidant free redox iron (i.e., NPBI) in plasma and erythrocyte suspension compared to the normal range. In particular, P-NPBI distribution was non-gaussian. Given the well-recognized risks linked to data transformation (45), an analysis of the effects of log-transformation was performed (Supplementary Figure 6), indicating correction of normality.
In the whole RTT population, plasma NPBI, and intra-erythrocyte NPBI levels were 0.9 [IQR 0.7–1.2] (0.5–2.2 nmol/ml) and 1.53 ± 0.55 (0.8–3 nmol/ml) erythrocyte suspension, respectively. Likewise, plasma F2-IsoPs levels were found to be elevated: 57.4 [IQR 49.7–64.3] (26–135 pg/ml). In Figure 4, data ranges from an unpublished personal laboratory data set (SL, CS, and LC) of n = 45 healthy female control subjects with mean age comparable to that of the study group patients are used for comparison (data not shown).
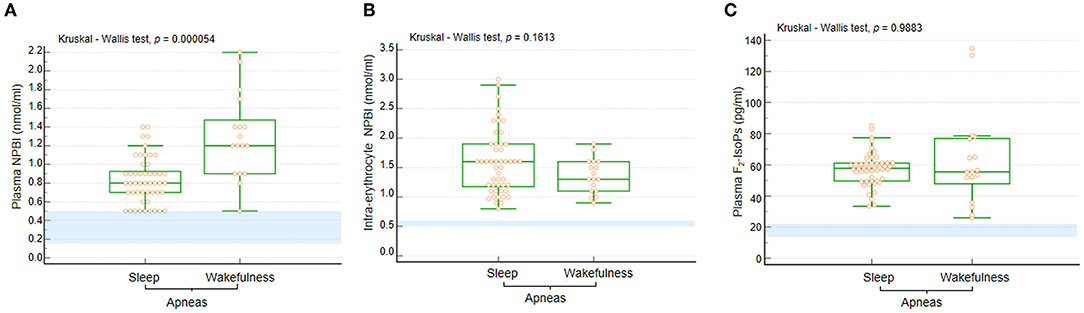
Figure 4. (A) Plasma NPBI levels were increased when apneas were predominant in wakefulness compared to those occurring in sleep. No statistically significant differences were observed for (B) IE-NPBI and (C) plasma F2-IsoP levels between wakefulness and sleep. Data are shown as bar graphs. Dots represent data points. Bars represent medians and intervals inter-quartile ranges. P-NPBI, plasma non-protein-bound iron; IE-NPBI, intra-erythrocyte non-protein-bound iron; F2-IsoPs, F2-isoprostanes. Normal range values are highlighted in light blue for comparison (data from an unpublished personal laboratory data set, authors: SL, CS, and LC; n = 45 healthy female control subjects with mean age comparable to that of the study group patients; individual data not shown).
Levels of P-NPBI were significantly different according to disease stage (Kruskal-Wallis test, p = 0.049), with highest values observed in disease stages III (median 0.9 [IQR 0.7–1.2]) and IV patients (median 0.9 [IQR 0.8–1.2]) (Supplementary Figure 7). In contrast, no significant difference was observed in P-NPBI levels in the whole RTT population as a function of presence of anemia (non-anemic, median 0.9 [IQR 0.7–1.2]) vs. anemic, median 0.9 [IQR 0.72–1.1], Mann-Whitney U-test p = 0.8249).
Values of P-NPBI were positively correlated to age (r = 0.363, p = 0.0027), blood PaO2 values (r = 0.2707, p = 0.0279), and RDW (r = 0.422, p = 0.0004) (Figure 5). In contrast, P-NPBI values are inversely correlated to average SpO2 values (r = −0.367, p = 0.0024), blood pH (r = 0.291, p =0.018), blood PaCO2 values (r = −0.412, p = 0.0006), MCV (r = −0.454, p = 0.0001), and MCH (r = −0.364, p = 0.0027) (Figure 5).
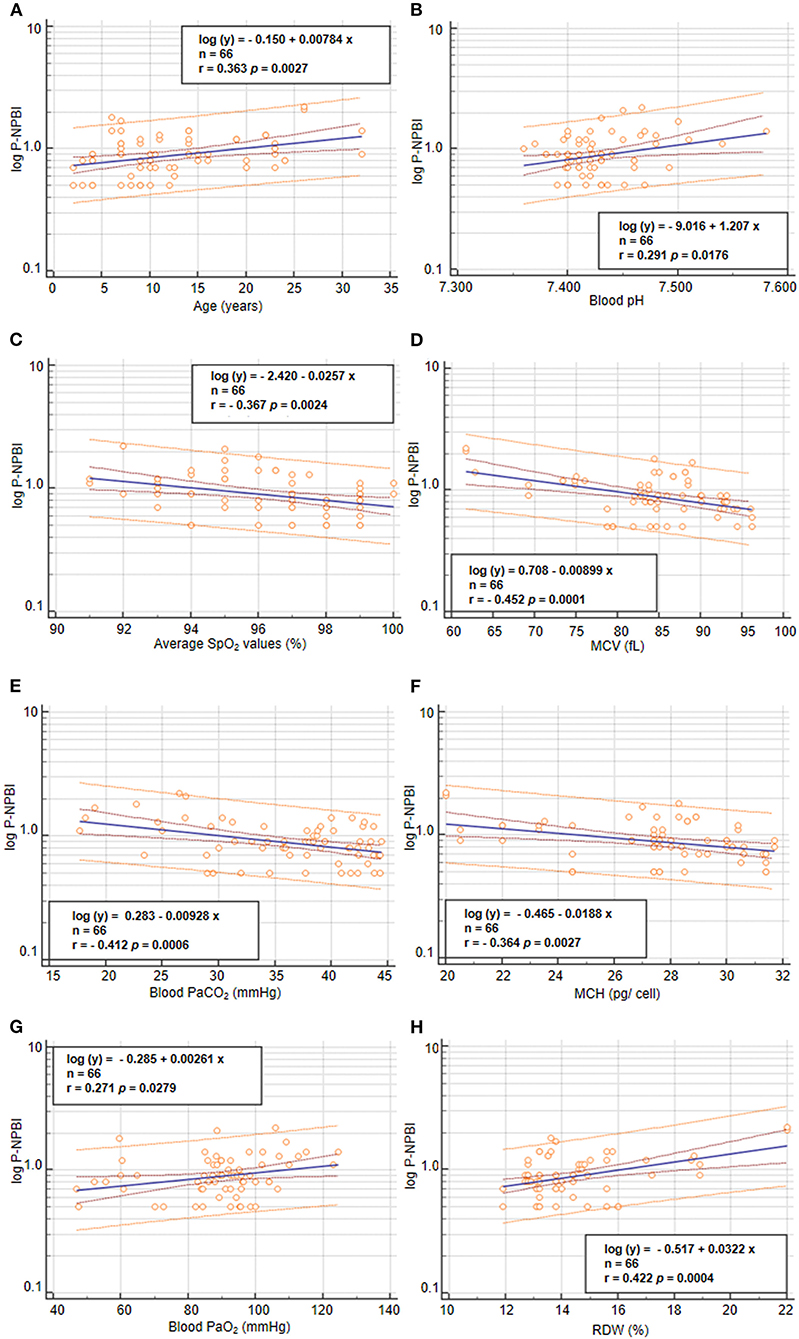
Figure 5. Correlations between P-NPBI and (A) age, (B) blood pH, (C) average SpO2, (D) MCV, (E) blood PaCO2, (F) MCH, (G) blood PaO2, and (H) RDW in the population with RTT (n = 66). P-NPBI concentrations are log-transformed to fit normal distribution. P-NPBI, plasma non-protein-bound-iron; SpO2, peripheral oxygen saturation; MCV, mean corpuscular volume; PaCO2, partial arterial pressure of carbon dioxide; MCH, mean cell hemoglobin content; PaO2, partial arterial pressure of oxygen; RDW, red cell distribution width. Inner dashed lines represent 95% confidence interval of regression. Outer lines represent 95% confidence interval of the predicted values.
Circulating levels of OS markers in the WA and SA subgroups are shown in Figure 4. In particular, P-NPBI levels were significantly elevated in the WA subgroup compared to the SA subgroup (p = 0.000054), whereas no significant differences were observed for IE-NPBI and plasma F2-IsoPs levels (p = 0.1813 and p = 0.9883, respectively).
WA vs. SA as a Function of Epilepsy and AED Therapy
Based on presence of epilepsy and seizure frequency, no statistical differences were observed between the WA and SA subgroups (p = 0.2207 and p = 0.3462, respectively). In particular, 11/17 (64.7%) patients with RTT from the WA subgroup (WAepi+) vs. 39/49 (79.6%) patients with RTT from the SA subgroup (SAepi+) exhibited seizures. Among the WAepi+group, 2/11 (18.2%) had seizure frequency < monthly, 2/11 (18.2%) weekly to monthly, 5/11 (45.5%) weekly, and 2/11 (18.2%) daily to weekly.
Seizure frequency in the SAepi+ subgroup was as follows: 12/39 (30.8%) had seizure frequency of less than monthly, 4/39 (10.3%) weekly to monthly, 9/39 (23.1%) weekly, and 14/39 (35.9%) daily to weekly.
No statistical difference was observed for AED treatment (i.e., mono vs. multitherapy) between the WA and SA groups (RTT patients with WA: n = 5 AED mono- and n = 6 AED multi-therapy vs. RTT patients with SA: n = 19 AED mono- and n = 18 AED multi-therapy, p = 0.734).
In the WAepi+ group, the AED-treated patients were 10/11 (90.9%) on CBZ, 1/11 (9.1%) VPA, 4/11 (36.4%) TPM, and 2/11 (18.2%) PB. None in the WAepi+ group was on LEVET or CLB therapy. On the other hand, for the SAepi+group, 37/39 (94.9%) patients with RTT were on AED therapy, whereas 2/39 (5.1%) had no AED specific treatment. In particular, 32/37 (94.9%) were on CBZ, 7/37 (18.9%) VPA, 6/37 (16.2%) TPM, 4/37 (10.8%) LEVET, 2/37 (5.4%) CLB, and 6/37 (16.2%) PB. No significant differences were observed regarding AED therapy between the WAepi+and SAepi+ groups (p ≥ 0.1518).
Significant differences were observed for cardiorespiratory monitoring variables in patients with WA- and SA-RTT as a function of seizures, but with the single exception of total desaturation episodes (Kruskal -Wallis test, p = 0.1962). AHI >15 (chi-square test, p = 0.0099), total breath holding episodes (Mann-Whitney U-test, p = 0.0066), average SpO2 values (Mann-Whitney U-test, p = 0.0009), and nadir SpO2 values (Mann-Whitney U-test, p = 0.0028) being statistically different. Indeed, statistical differences for AHI > 15 were observed in the WAepi−vs. SAepi+groups (p = 0.0164) and in the WAepi+vs. SAepi+groups (p = 0.014). Statistical differences were observed for total breath holding episodes in non-epileptic patients with RTT (median 18.5 episodes in WAepi−vs. 59 in the SAepi−group) and epileptic patients with RTT (median 34 in WAepi+vs. 86 in SAepi+group) as well as WAepi− vs. SAepi+groups (Conover test, p < 0.05). Similar results were also observed for average SpO2 values in epileptic patients with RTT (median 94% in WAepi+vs. 97% in the SAepi+group). Statistical differences were also observed between WAepi− vs. SAepi+ (median 95% vs. 97%), and WAepi+ vs. SAepi− (median 94 vs. 96.5%) (Conover test, p < 0.05). For nadir SpO2, values close to physiological range were recorded in both the WAepi−and WAepi+ subgroups (median 85.5 and 89%, respectively), which were statistically different from that observed in the SAepi+ group (72%, Conover test p < 0.05).
No statistical differences were observed in the populations with WA and SA for normalized respiratory rate (Mann-Whitney U-test, p = 0.837), blood pH (Mann-Whitney U-test, p = 0.4860), PaCO2 (Mann-Whitney U-test, p = 0.3828), PaO2 (Mann-Whitney U-test, p = 0.8198), standard PaO2 (Mann-Whitney U-test, p = 0.7327), (Mann-Whitney U-test, p = 0.5253), and BGA pattern interpretation (chi-squared test, p = 0.5746) as a function of seizures.
As it concerns red blood cell parameters, no statistical differences were observed for all the examined variables (i.e., Hb p = 0.461, MCV p = 0.122, MCH p = 0.069, MCHC p = 0.605, and RDW p = 0.399, Mann-Whitney U-test) in the populations with WA and SA as a function of seizures.
Significant differences were observed in the WA and SA groups for two circulating OS markers, P-NPBI (Mann-Whitney U-test, p = 0.00036) and plasma F2-IsoP levels (Mann-Whitney U-test, p = 0.0056) but not for IE-NPBI (Mann-Whitney U-test, p = 0.5321) (Supplementary Figures 8–10). In particular, P-NPBI levels were significantly higher in the WAepi− and WAepi+ groups than in the SAepi− and SAepi+groups (Conover test p < 0.05). Statistical differences were observed in patients with non-epileptic RTT (median 1.4 nmol/ml in WAepi− vs. 0.8 in the SAepi− subgroup) and in epileptic patients (median 1.2 nmol/ml in WAepi+ vs. 0.8 in the SAepi+ group). A statistical difference was observed for plasma F2-IsoP levels in the SA group (median 69.65 pg/ml in SAepi− vs. 56.7 pg/ml in the SAepi+ group) as well as in the WAepi+ group vs. the SAepi− group (Conover test, p < 0.05).
ROC Curve and Stepwise Multiple Regression Models
Receiver operating characteristic (ROC) curves indicated that total breath holding episodes, average SpO2 values, nadir SpO2 values, and P-NPBI values significantly discriminate WA from SA in RTT (Figure 6A). Furthermore, average SpO2 values, PaCO2 values, MCV values, MCH values, and age were able to discriminate higher circulating P-NPBI (Figure 6B).
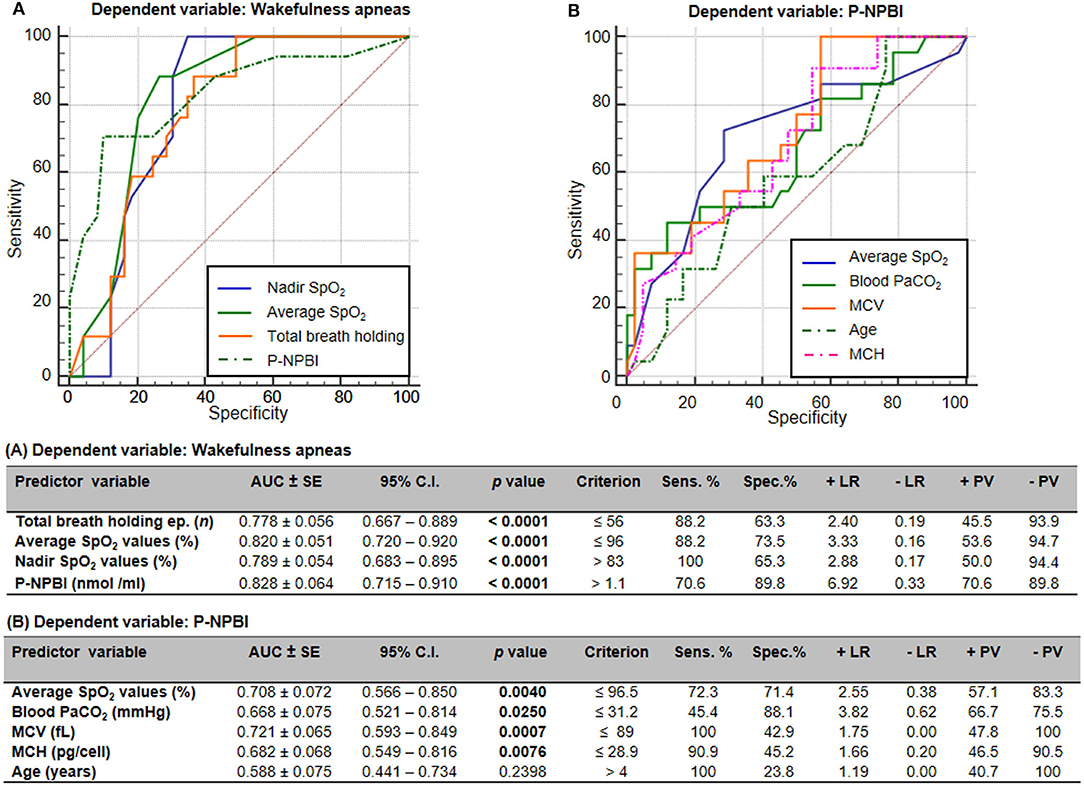
Figure 6. Receiver operating characteristic (ROC) curves analysis for (A) wakefulness apneas and (B) P-NPBI as classifying variables. AUC, area under the curve; SE, standard error; Sens, sensitivity; Spec, specificity; +LR, positive likelihood ratio; –LR, negative likelihood ratio; +PV, positive predictive value; –PV, negative predictive value; SpO2, peripheral oxygen saturation; P-NPBI, plasma non-protein-bound iron; PaCO2, partial arterial pressure of carbon dioxide; MCV, mean corpuscular volume; MCH, mean cell hemoglobin. Bold characters indicate statistically significant differences.
A multiple stepwise linear regression model (WA as the dependent variable) showed as predictor variables nadir SpO2, average SpO2, and P-NPBI (adjusted R2 = 0.613 multiple correlation coefficient = 0.795, p < 0.0001; variable not included in the model: total breath holding episodes) (Figure 7A).
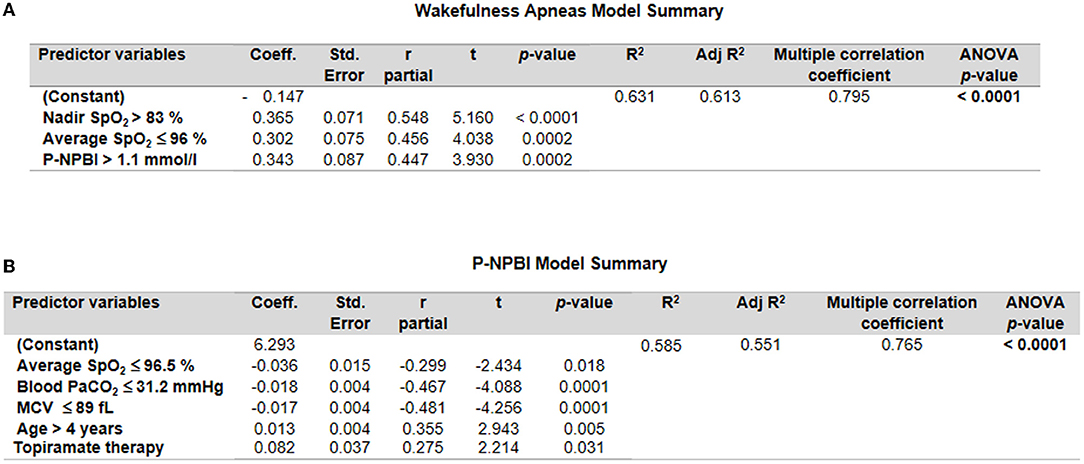
Figure 7. Multiple stepwise regression analysis models for (A) wakefulness apneas and (B) P-NPBI as dependent variables in the examined patients with RTT. Cut-off values were calculated by ROC curve analysis.
An additional multiple stepwise linear regression model was investigated by selecting P-NPBI as the dependent variable. Although the red blood cell variable MCV was not statistically different between the WA and SA subgroups, this variable was selected among the possible predictor variables given the statistical significance of the ROC curve analysis (p = 0.0007). The model identified average SpO2, PaCO2, MCV, age, and topiramate therapy as significant predictors (adjusted R2 = 0.551, multiple correlation coefficient = 0.765, p < 0.0001) (Figure 7B).
Discussion
Sleep disorders (1–3), breathing abnormalities (14–20), and redox imbalance (29–32) are widely recognized features of RTT. Awake breathing dysfunction is recognized as one of the most prevalent comorbidities of RTT, even more frequently than epilepsy (28). Sleep research with several RTT animal models (i.e., mice, cynomolgus monkeys, and Drosophila) indicates compromised sleep quality with highly fragmented sleep and distinct differences in daily sleep/wake cycle and circadian rhythm, thus mimicking the sleep abnormalities observed in patients with RTT (46). Breathing abnormalities in RTT models have been linked to non-rapid eye movement sleep (46). Previous clinical studies with patients with RTT indicate that sleep problems are reported in 80% cases, consisting of irregular sleep/wake patterns with increased sleep latencies or delayed/advanced sleep onset, excessive daytime sleep, and frequent nocturnal awakening (11, 47, 48). In addition, case studies showed that frequent arousals and low sleep efficiencies are characteristics of RTT (16). Many of these sleep problems in RTT appear to be consistent with an underlying problem in the circadian regulation of sleep.
In this study, where RTT patients with symptomatic respiratory dysfunction were selected exclusively, we investigated the relationships of breath holding episodes recorded during the sleep-wakefulness cycle with clinical variables, MECP2 mutation type, cardiorespiratory monitoring, blood gas balance, red blood cell parameters, and circulating oxidative stress markers.
In our RTT cohort, an excess of patients of pediatric age, disease stage III, and early truncating mutations were related to clinically evident breathing abnormalities either during sleep or wakefulness.
Although about half of our patients were in stage III of the disease, our observations confirm that breathing abnormalities are already present during the pediatric age. As previously reported, awake breathing abnormalities have been reported to follow an age-dependent pattern, with hyperventilation and breath holding starting by age 5 in two-thirds of the RTT patients, often remitting over the lifespan (28). The RTT-specific BMI z-scores of our population with documented breath holding episodes showed a normal distribution, thus supporting prior observations (28). It has been suggested that individuals with a normal weight for RTT are more likely to experience breath holding episodes. Nevertheless, subjects with both normal and high body mass index for RTT appear to be equally likely prone to hyperventilation (28).
To date, a large number of clinical and experimental studies have been focusing on breathing disorders in RTT (49) variably featuring breath holding episodes, apneas, apneusis, hyperventilation, rapid shallow breathing, and spontaneous Valsalva maneuvers (50). The wide spectrum of respiratory disorders detectable in patients with RTT has been historically credited to brainstem immaturity and/or cardiorespiratory autonomic dysautonomia (50, 51). However, as the pathogenesis of the respiratory dysfunction in RTT appears far from being completely understood, alternative or complementary hypotheses can be formulated (30).
Highly irregular respiratory rhythm, particularly during daytime, is considered a key symptom of RTT (22, 23, 50). Cumulating evidence indicates a predominantly hyperventilatory pattern with breath holding/obstructive apneas or Valsalva breathing against closed airways during wakefulness (23, 52, 53). Breath holding/obstructive apneas in RTT patients are often confused with central apneas, where distinct neurological mechanisms exist (14–16, 24, 26, 50, 54–59). Furthermore, a high incidence of Obstructive Sleep Apnea Syndrome (OSAS) with large variability in severity has been reported in patients with RTT and respiratory disturbances (15, 16, 19).
In this study, the whole RTT population examined showed high prevalence of obstructive apneas compared to the central and mixed ones, thus confirming our prior observations (32). OSAS are relatively common in the general pediatric population, with estimated prevalence between 1 and 4% (60, 61). Adenotonsillar hypertrophy is a widely recognized as a major significant contributor to OSAS for otherwise healthy children (62), with the American Academy of Pediatrics indicating adenotonsillectomy as a first-line treatment for pediatric OSAS (63). According to latest guidelines, the general incidence of OSAS in the pediatric population is about 2% (63). OSAS are more common in males than in females (60), and in most children around 2–8 years of age because of the relative size of the lymphatic tissue of the upper airways (64). However, OSAS related to adenotonsillar hypertrophy do not seem to be a specific feature of RTT (18).
Although drug-induced sleep endoscopy (DISE) is certainly a quite promising diagnostic procedure for investigating upper airway mechanics during sleep in pediatric and adult populations showing obstructive sleep apneas (65, 66), this technique was, unfortunately, not performed on our RTT population because of lack of local ethical approval. This point may be a possible study limitation, although we should stress that causes of apneas and upper airway mechanics during sleep were not a primary focus of this study.
While some authors report sleep-related breathing disorders as non-clinically relevant (14), impaired sleep structure and breathing patterns have been characterized in RTT patients by polysomnography and EEG studies (16, 18–20, 58, 67). On the other hand, disorders of respiratory control during wakefulness are well-recognized (14, 23, 28). The results of this study confirm the occurrence of breath holding episodes in the patients with RTT at different ages and disease stages either during the awake or the sleeping state. However, the lack of simultaneous EEG recording during the cardiorespiratory monitoring could represent a methodological limitation to the present study. The link between respiratory dysfunction and disease severity indicates its clinical relevance.
Dysregulation of autonomic circuits is a key feature of RTT (68–70), with diurnal variation in the autonomic regulation and shift toward sympathetic activation and/or parasympathetic inactivation (71).
Although the small sample size prevents general conclusions, our findings suggest a link between specific types of MECP2 mutations (i.e., R255X, large deletions, and R106W) and cardiorespiratory monitoring findings. In particular, our observation of a positive link between recorded total breath holding episodes and R270X MECP2 mutations appears in line with prior observations by Carroll et al. (71) of major alterations in amplitude and phase of autonomic balance diurnal patterns observed in patients with RTT with early truncating MECP2 mutations. In contrast, a prior natural history study on a large RTT cohort has evidenced breathing dysfunction not being related to specific mutations with the presence of MECP2 mutation as the only genetic factor being associated with breathing dysfunction (28). A possible explanation of the discordance with our findings could be related to either our different selection criteria (i.e., inclusion of patients with clinical evidence of breathing disturbances) or sample size effects. However, rather than examining the natural course of respiratory abnormalities in the disease, our primary aim was to assess the clinical relevance of apneas during the sleep-wakefulness cycle in the population with RTT and their possible clinical impact.
Our observation of an inverse relationship between average SpO2 and age confirms the existence of an age-dependent pattern (28), even if in our selected cohort breathing dysfunction does not fade with advancing age and/or disease stage.
The majority of RTT patients suffer from severe cardiorespiratory symptoms (57, 72–74), possibly accounting for a fraction with a 300-fold increased risk of sudden death (68, 75) and a likelihood of survival of 70% at age 45 years (76). Respiratory-related reflexes appear to be exaggerated (77, 78), lacking distinct forms of reflex plasticity (79). There is growing evidence that a progressively developing neurochemical dysfunction and balance of neuronal excitation and inhibition skewed toward hyperexcitability in cardiorespiratory pontomedullary brain stem areas (79–83) could cause the reported deficits (84).
Accordingly, several studies with Mecp2-mutant rodent models report increased excitability of neurons from cranial nerve V (85, 86). More recently, a study on the hypoglossal nucleus (XII) and dorsal motor nucleus of vagus (DMNV, X) cranial nerves demonstrates dual synaptic GABAA-ergic and glycinergic synaptic inhibitions, thus suggesting that these neurons rely more on glycinergic synaptic inhibition and possibly contribute to the breathing abnormalities observed in mouse models of RTT (87). Likewise, similar results are found by Yoshikawa (88) and Yamanouchi (89), reporting cortical hyperexcitability in patients with RTT. Furthermore, a neuropathological study (90) on a small population of patients with RTT with mean age of 10.8 ± 6.3 years suggests serotonin transporter abnormality in the DMNV, possibly underlying the autonomic dysfunction observed in RTT.
Interestingly, in the examined population with RTT, no clinical signs related to dysfunction(s) of cranial nerves, in particular V, VII, and XII, were detectable on a careful independent neurological examination by three expert MDs (JH, RC, and CDF), which is in line with prior observations by Armstrong (91).
Respiratory disturbances in RTT could also lead to potentially life-threatening systemic hypoxia. Our prior observations indicate that pulmonary gas exchange abnormalities can play a role in determination of systemic hypoxia in girls with RTT (30, 32), with terminal bronchioles as a likely major target in the disease (34).
Although of key importance in order to objectify the respiratory dysfunction linked to the disease, arterial blood gas measurements are unusually reported in patients with RTT (30, 32, 55, 92).
The relationship between hypoxia and MECP2 loss of function is certainly complex. Experimental studies on mouse models of the disease indicate that Mecp2 is necessary for survival (93) and a correct hypoxia response (94). Arterial blood gas analysis data on our RTT population indicate the co-existence of a chronic hyperventilation condition with subsequent hypocapnia and respiratory alkalosis.
In particular, a baseline hypoxia in about one quarter of RTT patients exhibiting clinical evidence of apneas/breath holdings was observed. These findings are in line with our prior data indicating a state of subclinical hypoxia in the majority of patients with RTT (30, 32).
Several studies have attempted to evaluate the role of hypoxia using RTT experimental models (31, 78, 93–103). Exposure to hypoxic conditions has been induced in experimental models (i.e., mice, rats, cell cultures, and/or histologic brainstem/hippocampal sections). However, the degree, nature of hypoxic noxae (i.e., reduced inspired/environmental fraction of oxygen, CO2- or chemically-induced hypoxia), and duration of hypoxic challenge are extremely variable (94–97, 99, 100). Therefore, comparing the findings appears to be quite difficult. Nevertheless, exaggerated response/susceptibility to hypoxia seems a consistently shared feature (78, 84, 98, 99, 101, 103, 104). In addition, more than one-third of our patients with RTT showed hypocapnia. Therefore, chronic hypoxia with hypocapnia seems to be a common shared feature among patients with clinically evident breathing disturbances. These findings indicate a role for compensatory hyperventilation following a chronic hypoxia condition.
It is well-known that to maintain O2 and CO2 homeostasis in the blood and tissues, the respiratory central pattern generator must respond to chemosensory cues. Under conditions of chronic intermittent hypoxia, repeated peripheral chemoreceptor input, as mediated by the nucleus of the solitary tract, induces plastic changes in respiratory circuits altering baseline respiratory and sympathetic motor outputs, and resulting in chemoreflex sensitization, active expiration, and arterial hypertension (104). Interestingly, respiratory depression follows hypocapnia in RTT mouse models (95). This phenomenon would likely account for our findings on individuals with RTT of depressed respiratory rate z-scores despite the presence of marked hypoxia.
Respiratory alkalosis is likely to be compensated by renal excretion of , i.e., via compensatory metabolic acidosis according to the Henderson and Hasselbalch Equation modifying hemoglobin affinity for O2 because of Bohr and Haldane effects (105, 106). This compensatory mechanism is likely to account for the observed decrease in detectable in the overwhelming majority of the examined patients with RTT.
In contrast, arterial hypertension is not usually observed in patients with RTT. Indeed, in our personal extended database, mean systolic blood pressure and diastolic blood pressure values correspond to 0.95 ± 0.1 (value range 0.81–1.24) and 0.92 ± 0.12 (0.73–1.18) multiple of medians compared to age- and gender-matched healthy control subjects (individual data not shown). In line with the well-known cardiac autonomic dysfunction (68, 70, 71), resting awake heart rate values were found to be increased, corresponding to 1.1 [0.98–1.30] (0.90–1.74) multiple of medians for age- and gender-matched healthy population (individual data not shown; JH, CDF, VS, RC, personal observation).
Erythrocytes appear to be key cells in RTT (33, 107, 108). We have previously reported the high prevalence of atypical shape for circulating red blood cells (i.e., leptocytosis) (33) with increased 4-hydroxynonenal protein adducts in erythrocyte cytoskeleton plasma membrane proteins (108). Despite significant alterations in antioxidant defense capability, erythrocytes from patients with RTT do not show intrinsic differences in terms of neither Hb-binding affinity nor in O2 exchange processes compared to control erythrocytes (109).
In this cohort of patients with RTT, asymptomatic anemia was detected in about one-third of the whole population. Among the selected RBC variables, Hb and MCHC appear to be significantly decreased compared to a general population with RTT (Hb 13.2 ± 1 g/d, p =0.036; MCHC 33.8 ± 1.09 g/dl, p = 0.0003; individual data not shown; JH, CDF, VS, RC, personal unpublished observations).
These data are in apparent contrast with prior research on an RTT mouse model (Mecp2/y mice) where increased hematocrit and elevated hypoxia-inducible factor (HIF)-1 expression levels throughout the brain have been reported as signs of systemic adaptation to intermittent hypoxic episodes (98). Nevertheless, iron-deficiency anemia has been reported in about one-eighth of the general population with RTT (110), a proportion apparently not different from ours (Fisher's test, p = 0.109).
The origin of anemia in RTT could be related to reduced iron intake (111, 112) with consequently reduced iron stores (113).
Accumulating evidence reveals that the lungs are a key organ in iron homeostasis. Regulation of iron homeostasis in mammalian lung is tightly controlled (iron content range: 0.4–0.9 mg/g lung tissue) (114) in order to maintain proper lung function and to adapt to changes in iron needs (115).
Iron's critical role is explained by its potential to fluctuate between oxidation states, mainly between divalent ferrous (Fe2+) and trivalent ferric (Fe3+) iron (116). However, this chemical property as a transition metal makes free iron very reactive and potentially toxic. Iron catalyzes the production of reactive oxygen species (ROS) via the Fenton and Haber-Weiss reactions (116). Exposure to these highly reactive radicals damages lipids, nucleic acids, and proteins, causing cell and, thus, tissue damage.
Our data confirm increased circulating OS marker levels, and are in line with prior studies (30, 32, 109). OS markers comprised two forms of redox active-iron, i.e., P-NPBI and IE-NPBI, thus confirming prior findings (30, 32). Although the possible role of epileptic activity in OS status (117–119) remains a fascinating subject of investigation, some studies report controversial findings. In our study, a relationship between increased P-NPBI levels and TPM, a widely used AED with multiple mechanisms of action (120), was observed. Some prior studies report a protective effect of TPM on oxidative injury (121–123), while other reports suggest no effects on OS status (124, 125). To date, no information on the effects of TPM on circulating redox active iron is available. Its pharmacological properties include modulatory effects on Na+ channels, GABA-A receptors, and glutamate receptors of the α-amino-3-hydroxy-5-methyl-4-isoxazolepropionic acid (AMPA)/kainate type (126). This favorable combination of mechanisms of action makes TPM an ideal candidate for antiepileptogenesis in the clinical field. Intriguingly, TPM is also used in prophylaxis of chronic migraine (127), a condition in which iron overload in the periaqueductal gray matter (128), red nucleus, and basal ganglia structures has been reported (127, 129). Overall, our findings, combined with the findings of published literature, suggest a hitherto unrecognized link between TPM and free redox active iron. This point is in need of further exploration.
Although autonomic dysregulation in RTT has been the focus of extensive investigation during the sleep-awake cycle (27, 71), little is known on possible differential effects of RTT-related breathing abnormalities during the sleep-wakefulness cycle on acid-base balance, erythrocyte variables, and pro-oxidant status.
Our data indicate that breathing abnormalities are prevalent both in the sleep and wakefulness states in a population with RTT with clinically evident apneas. Overall AHI > 15, higher total breath holding episodes, and lower nadir SpO2 were more likely in the subpopulation with predominant SA, whereas lower average SpO2 was related to WA. These findings indicate that the autonomic dysregulation in RTT is closely linked to the sleep-wakefulness cycle, which is in line with recent observations by Ramirez et al. (27). While no significant relationships were observed with acid-base, and baseline respiratory rate (z-scores), slightly lower MCH content was correlated to patients with respiratory abnormalities mainly linked to the awake state. Although no plausible explanation is available to date, these findings stimulate a more in-depth investigation on the relationship between iron status and breathing disturbances in patients with RTT.
In addition, for the first time, our study indicates a different impact of wakefulness apnea episodes on plasma free redox-active iron compared to sleep apneas in patients with RTT. In this study, a stepwise multiple linear regression model indicated a significant relationship between P-NPBI and average SpO2, blood PaCO2, red blood cell MCV, age, topiramate therapy. In addition, WA was also related to circulating P-NPBI.
While iron is essential for aerobic life, poor or altered iron handling leads to adverse effects related to oxidant production, altered redox signaling, and altered cellular fate, including remodeling. Unfortunately, lack of cooperation in RTT hampers more in-depth studies on the redox active pulmonary pool (i.e., bronchoalveolar lavage fluid). However, a specific pro-oxidant pool of iron (i.e., free or loosely bound ions, which are redox-active/catalytic for damaging oxidant production) is also measurable in exhaled breath condensate (130). It has been previously demonstrated that retention of iron in the airways and lungs may contribute to manifestations of OS and damage in chronic obstructive pulmonary disease (131), acute respiratory distress syndrome (132), and coronavirus disease-2019 (COVID-19) (132).
Overall, our data indicate that this redox-active iron form is a relevant molecular factor in the pathophysiology of respiratory abnormalities in RTT, and suggest that plasma redox-active iron could represent a potential novel therapeutic target by deepening our current understanding of the apparently unique respiratory pathophysiology of patients affected by this rare neurodevelopmental disorder.
Data Availability Statement
The raw data supporting the conclusions of this article will be made available by the authors, without undue reservation.
Ethics Statement
The studies involving human participants were reviewed and approved by Ethical Committee of Siena University Hospital (Azienda Ospedaliera Universitaria Senese, Siena, Italy). Written informed consent to participate in this study was provided by the participants' legal guardian/next of kin.
Author Contributions
CDF and SL: conceptualization and writing of the original draft. JH and LC: funding acquisition. JH: subject enrollment. JH, RC, and CDF: collection of clinical information. JH and CDF: RCSS severity scoring assessment. MR: evaluation and interpretation of the cardiorespiratory/polygraphy data. SL: P-NPBI and IE-NPBI assays. CS: plasma F2-IsoP assays. LC: supervision of the oxidative stress laboratory procedures. LB and VS: clinical database. CDF: data analysis. LC, CS, and MR: draft of sections of the manuscript. All the authors contributed to manuscript revision, read, and approved the submitted version.
Funding
This study was partly funded by the Tuscany Region (Italy), Bando Salute 2009: Antioxidants—omega-3 polyunsaturated Fatty Acids, lipoic acid—supplementation in Rett syndrome: A novel approach to therapy, RT No. 142.
Conflict of Interest
The authors declare that the research was conducted in the absence of any commercial or financial relationships that could be construed as a potential conflict of interest.
Publisher's Note
All claims expressed in this article are solely those of the authors and do not necessarily represent those of their affiliated organizations, or those of the publisher, the editors and the reviewers. Any product that may be evaluated in this article, or claim that may be made by its manufacturer, is not guaranteed or endorsed by the publisher.
Acknowledgments
We dedicate this study to all the girls with Rett syndrome, and we sincerely thank their families for the kind participation and continued support. We wish to dedicate this study in memory of Francesca, a girl with Rett syndrome who suffered from major breathing dysfunction and who just recently passed away, once again reminding us about the sneaky yet violent clinical nature of Rett syndrome, as once parents effectively put it. We are grateful to Ingrid Iacona (professional nurse, Respiratory Pathophysiology and Rehabilitation Unit, University Hospital, AOUS) for the help in blood sample collection for arterial gas analysis, and Roberto Faleri (Medical Central Library, University of Siena) for the valuable online bibliographic assistance. This study is also in memoriam of Mario Comporti (Siena, Italy 1935–2014), international pioneer in the exploration of oxidative stress in pathology.
Supplementary Material
The Supplementary Material for this article can be found online at: https://www.frontiersin.org/articles/10.3389/fneur.2022.833239/full#supplementary-material
References
1. Agar G, Brown C, Sutherland D, Coulborn S, Oliver C, Richards C. Sleep disorders in rare genetic syndromes: a meta-analysis of prevalence and profile. Mol Autism. (2021) 12:18. doi: 10.1186/s13229-021-00426-w
2. Boban S, Leonard H, Wong K, Wilson A, Downs J. Sleep disturbances in Rett syndrome: impact and management including use of sleep hygiene practices. Am J Med Genet A. (2018) 176:1569–77. doi: 10.1002/ajmg.a.38829
3. Merbler AM, Byiers BJ, Garcia JJ, Feyma TJ, Symons FJ. The feasibility of using actigraphy to characterize sleep in Rett syndrome. J Neurodev Disord. (2018) 10:8. doi: 10.1186/s11689-018-9227-z
4. Amir RE, Van den Veyver IB, Wan M, Tran CQ, Francke U, Zoghbi HY. Rett syndrome is caused by mutations in X-linked MECP2, encoding methyl-CpG-binding protein 2. Nat Genet. (1999) 23:185–8. doi: 10.1038/13810
5. Christodoulou J, Grimm A, Maher T, Bennetts B. RettBASE: the IRSA MECP2 variation database-a new mutation database in evolution. Hum Mutat. (2003) 21:466–72. doi: 10.1002/humu.10194
6. Neul JL, Kaufmann WE, Glaze DG, Christodoulou J, Clarke AJ, Bahi-Buisson N, et al. Rett syndrome: revised diagnostic criteria and nomenclature. RettSearch Consortium Ann Neurol. (2010) 68:944–50. doi: 10.1002/ana.22124
7. Bebbington A, Anderson A, Ravine D, Fyfe S, Pineda M, de Klerk N, et al. Investigating genotype-phenotype relationships in Rett syndrome using an international data set. Neurology. (2008) 70:868–75. doi: 10.1212/01.wnl.0000304752.50773.ec
8. Cuddapah VA, Pillai RB, Shekar KV, Lane JB, Motil KJ, Skinner SA, et al. Methyl-CpG-binding protein 2 (MECP2) mutation type is associated with disease severity in Rett syndrome. J Med Genet. (2014) 51:152–8. doi: 10.1136/jmedgenet-2013-102113
9. Henriksen MW, Breck H, von Tetzchner S, Paus B, Skjeldal OH. Medical issues in adults with Rett syndrome—a national survey. Dev Neurorehabil. (2020) 23:106–12. doi: 10.1080/17518423.2019.1646341
10. Leonard H, Cobb S, Downs J. Clinical and biological progress over 50 years in Rett syndrome. Nat Rev Neurol. (2017) 13:37–51. doi: 10.1038/nrneurol.2016.186
11. Young D, Nagarajan L, de Klerk N, Jacoby P, Ellaway C, Leonard H. Sleep problems in Rett syndrome. Brain Dev. (2007) 29:609–16. doi: 10.1016/j.braindev.2007.04.001
12. Leven Y, Wiegand F, Wilken B. Sleep quality in children and adults with Rett syndrome. Neuropediatrics. (2020) 51:198–205. doi: 10.1055/s-0040-1701693
13. Mendoza J, Downs J, Wong K, Leonard H. Determinants of quality of life in Rett syndrome: new findings on associations with genotype. J Med Genet. (2021) 58:637–44. doi: 10.1136/jmedgenet-2020-107120
14. Marcus CL, Carroll JL, McColley SA, Loughlin GM, Curtis S, Pyzik P, et al. Polysomnographic characteristics of patients with Rett syndrome. J Pediatr. (1994) 125:218–24. doi: 10.1016/S0022-3476(94)70196-2
15. Hagebeuk EE, Bijlmer RP, Koelman JH, Poll-The BT. Respiratory disturbances in Rett syndrome: don't forget to evaluate upper airway obstruction. J Child Neurol. (2012) 27:888–92. doi: 10.1177/0883073811429859
16. Carotenuto M, Esposito M, D'Aniello A, Rippa CD, Precenzano F, Pascotto A, et al. Polysomnographic findings in Rett syndrome: a case-control study. Sleep Breath. (2013) 17:93–8. doi: 10.1007/s11325-012-0654-x
17. Bassett E, Heinle R, Johnston D. Sleep apnea in patients with Rett syndrome: roles for polysomnography and adenotonsillectomy. J Child Neurol. (2016) 31:1633–4. doi: 10.1177/0883073816671439
18. Amaddeo A, De Sanctis L, Arroyo JO, Khirani S, Bahi-Buisson N, Fauroux B. Polysomnographic findings in Rett syndrome. Eur J Paediatr Neurol. (2019) 23:214–21. doi: 10.1016/j.ejpn.2018.09.003
19. Sarber KM, Howard JJM, Dye TJ, Pascoe JE, Simakajornboon N. Sleep-disordered breathing in pediatric patients with Rett syndrome. J Clin Sleep Med. (2019) 15:1451–7. doi: 10.5664/jcsm.7974
20. Ammanuel S, Chan WC, Adler DA, Lakshamanan BM, Gupta SS, Ewen JB, et al. Heightened delta power during slow-wave-sleep in patients with Rett syndrome associated with poor sleep efficiency. PLoS ONE. (2015) 10:e0138113. doi: 10.1371/journal.pone.0138113
21. Rett A. Cerebral atrophy associated with hyperammonemia. In: Vinkin, PJ Bruyn GW, editors, Handbook of Clinical Neurology. Amsterdam:North Holland Publishing Company. (1977). p. 305–29.
22. Hagberg B. Clinical manifestations and stages of Rett syndrome. Ment Retard Dev Disabil Res Rev. (2002) 8:61–5. doi: 10.1002/mrdd.10020
23. Julu PO, Kerr AM, Apartopoulos F, Al-Rawas S, Engerström IW, Engerström L, et al. Characterisation of breathing and associated central autonomic dysfunction in the Rett disorder. Arch Dis Child. (2001) 85:29–37. doi: 10.1136/adc.85.1.29
24. Lugaresi E, Cirignotta F, Montagna P. Abnormalbreathing in the Rett syndrome. Brain Dev. (1985) 7:329–33. doi: 10.1016/S0387-7604(85)80039-5
25. Kerr AM, Julu PO. Recent insights into hyperventilation from the study of Rett syndrome. Arch Dis Child. (1999) 80:384–7. doi: 10.1136/adc.80.4.384
26. Rohdin M, Fernell E, Eriksson M, Albåge M, Lagercrantz H, Katz-Salamon M. Disturbances in cardiorespiratory function during day and night in Rett syndrome. Pediatr Neurol. (2007) 37:338–44. doi: 10.1016/j.pediatrneurol.2007.06.009
27. Ramirez JM, Karlen-Amarante M, Wang JJ, Bush NE, Carroll MS, Weese-Mayer DE, et al. The pathophysiology of Rett syndrome with a focus on breathing dysfunctions. Physiology. (2020) 35:375–90. doi: 10.1152/physiol.00008.2020
28. Tarquinio DC, Hou W, Neul JL, Berkmen GK, Drummond J, Aronoff E, et al. The course of awake breathing disturbances across the lifespan in Rett syndrome. Brain Dev. (2018) 40:515–29. doi: 10.1016/j.braindev.2018.03.010
29. Sierra C, Vilaseca MA, Brandi N, Artuch R, Mira A, Nieto M, et al. Oxidative stress in Rett syndrome. Brain Dev. (2001) 23 Suppl 1:S236–9. doi: 10.1016/S0387-7604(01)00369-2
30. De Felice C, Ciccoli L, Leoncini S, Signorini C, Rossi M, Vannuccini L, et al. Systemic oxidative stress in classic Rett syndrome. Free Radic Biol Med. (2009) 47:440–8. doi: 10.1016/j.freeradbiomed.2009.05.016
31. Grosser E, Hirt U, Janc OA, Menzfeld C, Fischer M, Kempkes B, et al. Oxidative burden and mitochondrial dysfunction in a mouse model of Rett syndrome. Neurobiol Dis. (2012) 48:102–14. doi: 10.1016/j.nbd.2012.06.007
32. De Felice C, Rossi M, Leoncini S, Chisci G, Signorini C, Lonetti G, et al. Inflammatory lung disease in Rett syndrome. Mediators Inflamm. (2014) 2014:560120. doi: 10.1155/2014/560120
33. Ciccoli L, De Felice C, Paccagnini E, Leoncini S, Pecorelli A, Signorini C, et al. Morphological changes and oxidative damage in Rett Syndrome erythrocytes. Biochim Biophys Acta. (2012) 1820:511–20. doi: 10.1016/j.bbagen.2011.12.002
34. De Felice C, Guazzi G, Rossi M, Ciccoli L, Signorini C, Leoncini S, et al. Unrecognized lung disease in classic Rett syndrome: a physiologic and high-resolution CT imaging study. Chest. (2010) 138:386–92. doi: 10.1378/chest.09-3021
35. Neul JL, Fang P, Barrish J, Lane J, Caeg EB, Smith EO, et al. Specific mutations in methyl-CpG-binding protein 2 confer different severity in Rett syndrome. Neurology. (2008) 70:1313–21. doi: 10.1212/01.wnl.0000291011.54508.aa
36. Tarquinio DC, Motil KJ, Hou W, Lee HS, Glaze DG, Skinner SA, et al. Growth failure and outcome in Rett syndrome: specific growth references. Neurology. (2012) 79:1653–61. doi: 10.1212/WNL.0b013e31826e9a70
37. Killian JT, Lane JB, Lee HS, Skinner SA, Kaufmann WE, Glaze DG, et al. Scoliosis in Rett syndrome: progression, comorbidities, and predictors. Pediatr Neurol. (2017) 70:20–5. doi: 10.1016/j.pediatrneurol.2017.01.032
38. Brodsky L. Modern assessment of tonsils and adenoids. Pediatr Clin North Am. (1989) 36:1551–69. doi: 10.1016/S0031-3955(16)36806-7
39. Iber C, Ancoli-Israel S, Chesson AL, Quan SF. The AASMManual for the Scoring of Sleep and Associated Events. 1st ed. Westcester, IL: American Academy of Sleep Medicine (2007).
40. Section on Pediatric Pulmonology Subcommittee Subcommittee on Obstructive Sleep Apnea Syndrome American American Academy of Pediatrics. Clinical practice guideline: diagnosis and management of childhood obstructive sleep apnea syndrome. Pediatrics. (2002) 109:704–12. doi: 10.1542/peds.109.4.704
41. Sorbini CA, Grassi V, Solinas E, Muiesan G. Arterial oxygen tension in relation to age in healthy subjects. Respiration. (1968) 25:3–13. doi: 10.1159/000192549
42. Hill VL, Simpson VZ, Higgins JM, Hu Z, Stevens RA, Metcalf JA, et al. Evaluation of the performance of the Sysmex XT-2000i hematology analyzer with whole bloods stored at room temperature. Lab Med. (2009) 40:709–18. doi: 10.1309/T0FJYP2RBXEHX4
43. De Felice C, Della Ragione F, Signorini C, Leoncini S, Pecorelli A, Ciccoli L, et al. Oxidative brain damage in Mecp2-mutant murine models of Rett syndrome. Neurobiol Dis. (2014) 68:66–77. doi: 10.1016/j.nbd.2014.04.006
44. WHO. Haemoglobin Concentrations for the Diagnosis of Anaemia and Assessment of Severity. Vitamin and Mineral Nutrition Information System. Geneva: World Health Organization; WHO/NMH/NHD/MNM/11.1. (2011). Available online at: http://www.who.int/vmnis/indicators/haemoglobin.pdf (accessed December 5, 2021).
45. Feng C, Wang H, Lu N, Chen T, He H, Lu Y, et al. Log-transformation and its implications for data analysis. Shanghai Arch Psychiatry. (2014) 26:105–9. doi: 10.3969/j.issn.1002-0829.2014.02.009
46. Zhang X, Lin JS, Spruyt K. Sleep problems in Rett syndrome animal models: a systematic review. J Neurosci Res. (2021) 99:529–44. doi: 10.1002/jnr.24730
47. Glaze DG, Frost JD Jr, Zoghbi HY, Percy AK. Rett's syndrome: characterization of respiratory patterns and sleep. Ann Neurol. (1987) 21:377–82. doi: 10.1002/ana.410210410
48. Nomura Y. Early behavior characteristics and sleep disturbance in Rett syndrome. Brain Dev. (2005) 27:S35–42. doi: 10.1016/j.braindev.2005.03.017
49. Ramirez JM, Ward CS, Neul JL. Breathing challenges in Rett syndrome: lessons learned from humans and animal models. Respir PhysiolNeurobiol. (2013) 189:280–7. doi: 10.1016/j.resp.2013.06.022
50. Julu PO, Engerström IW, Hansen S, Apartopoulos F, Engerström B, Pini G, et al. Cardiorespiratory challenges in Rett's syndrome. Lancet. (2008) 371:1981–3. doi: 10.1016/S0140-6736(08)60849-1
51. Voituron N, Zanella S, Menuet C, Lajard AM, Dutschmann M, Hilaire G. Early abnormalities of post-sigh breathing in a mouse model of Rett syndrome. Respir Physiol Neurobiol. (2010) 170:173–82. doi: 10.1016/j.resp.2009.12.009
52. Weese-Mayer DE, Lieske SP, Boothby CM, Kenny AS, Bennett HL, Silvestri JM, et al. Autonomic nervous system dysregulation: breathing and heart rate perturbation during wakefulness in young girls with Rett syndrome. Pediatr Res. (2006) 60:443–9. doi: 10.1203/01.pdr.0000238302.84552.d0
53. Weese-Mayer DE, Lieske SP, Boothby CM, Kenny AS, Bennett HL, Ramirez JM. Autonomic dysregulation in young girls with Rett Syndrome during nighttime in-home recordings. Pediatr Pulmonol. (2008) 43:1045–60. doi: 10.1002/ppul.20866
54. Cirignotta F, Lugaresi E, Montagna P. Breathing impairment in Rettsyndrome. Am J Med Genet Suppl. (1986) 1:167–73. doi: 10.1002/ajmg.1320250519
55. Southall DP, Kerr AM, Tirosh E, Amos P, Lang MH, Stephenson JB. Hyperventilation in the awake state: potentially treatable component of Rett syndrome. Arch Dis Child. (1988) 63:1039–48. doi: 10.1136/adc.63.9.1039
56. Schlüter B, Aguigah G, Buschatz D, Trowitzsch E, Aksu F. Polysomnographic recordings of respiratory disturbances in Rett syndrome. J Sleep Res. (1995) 4:203–7. doi: 10.1111/j.1365-2869.1995.tb00216.x
57. Stettner GM, Huppke P, Gärtner J, Richter DW, Dutschmann M. Disturbances of breathing in Rett syndrome: results from patients and animal models. Adv Exp Med Biol. (2008) 605:503–7. doi: 10.1007/978-0-387-73693-8_88
58. d'Orsi G, Demaio V, Scarpelli F, Calvario T, Minervini MG. Central sleep apnoea in Rett syndrome. Neurol Sci. (2009) 30:389–91. doi: 10.1007/s10072-009-0108-9
59. d'Orsi G, Trivisano M, Luisi C, Demaio V, Di Claudio MT, Pascarella MG, et al. Epileptic seizures, movement disorders, and breathing disturbances in Rett syndrome: diagnostic relevance of video-polygraphy. Epilepsy Behav. (2012) 25:401–7. doi: 10.1016/j.yebeh.2012.08.033
60. Lumeng JC, Chervin RD. Epidemiology of pediatric obstructive sleep apnea. Proc Am Thorac Soc. (2008) 5:242–52. doi: 10.1513/pats.200708-135MG
61. Gulotta G, Iannella G, Vicini C, Polimeni A, Greco A, de Vincentiis M, et al. Risk factors for obstructive sleep apnea syndrome in children: state of the art. Int J Environ Res Public Health. (2019) 16:3235. doi: 10.3390/ijerph16183235
62. Wilcox LJ, Bergeron M, Reghunathan S, Ishman SL. An updated review of pediatric drug-induced sleep endoscopy. Laryngoscope Invest Otolaryngol. (2017) 2:423–31. doi: 10.1002/lio2.118
63. Marcus CL, Brooks LJ, Draper KA, Gozal D, Halbower AC, Jones J, et al. Diagnosis and management of childhood obstructive sleep apnea syndrome. Pediatrics. (2012) 130:576–84. doi: 10.1542/peds.2012-1671
64. Tan HL, Gozal D, Kheirandish-Gozal L. Obstructive sleep apnea in children: a critical update. Nat Sci Sleep. (2013) 25:109–23. doi: 10.2147/NSS.S51907
65. Arganbright JM, Lee JC, Weatherly RA. Pediatric drug-induced sleep endoscopy: an updated review of the literature. World J Otorhinolaryngol Head Neck Surg. (2021) 7:221–7. doi: 10.1016/j.wjorl.2021.05.002
66. Van den Bossche K, Van de Perck E, Wellman A, Kazemeini E, Willemen M, Verbraecken J, et al. Comparison of drug-induced sleep endoscopy and natural sleep endoscopy in the assessment of upper airway pathophysiology during sleep: protocol and study design. Front Neurol. (2021) 12:768973. doi: 10.3389/fneur.2021.768973
67. Hagebeuk EE, van den Bossche RA, de Weerd AW. Respiratory and sleep disorders in female children with atypical Rett syndrome caused by mutations in the CDKL5 gene. Dev Med Child Neurol. (2013) 55:480–4. doi: 10.1111/j.1469-8749.2012.04432.x
68. Guideri F, Acampa M, Hayek C, Zappella M, Di Perri T. Reduced heart rate variability in patients affected with Rett syndrome. A possible explanation for sudden death. Neuropediatrics. (1999) 30:146–8. doi: 10.1055/s-2007-973480
69. Jian L, Archer HL, Ravine D, Kerr A, de Klerk N, Christodoulou J, et al. pR270X MECP2 mutation and mortality in Rett syndrome. Eur J Hum Genet. (2005) 13:1235–8. doi: 10.1038/sj.ejhg.5201479
70. Guideri F, Acampa M, DiPerri T, Zappella M, Hayek Y. Progressive cardiac dysautonomia observed in patients affected by classic Rett syndrome and not in the preserved speech variant. J Child Neurol. (2001) 16:370–3. doi: 10.1177/088307380101600512
71. Carroll MS, Ramirez JM, Weese-Mayer DE. Diurnal variation in autonomic regulation among patients with genotyped Rett syndrome. J Med Genet. (2020) 57:786–93. doi: 10.1136/jmedgenet-2019-106601
72. Katz DM, Dutschmann M, Ramirez JM, Hilaire G. Breathing disorders in Rett syndrome: progressive neurochemical dysfunction in the respiratory network after birth. Respir Physiol Neurobiol. (2009) 168:101–8. doi: 10.1016/j.resp.2009.04.017
73. Ogier M, Katz DM. Breathing dysfunction in Rett syndrome: understanding epigenetic regulation of the respiratory network. Respir PhysiolNeurobiol. (2008) 164:55–63. doi: 10.1016/j.resp.2008.04.005
74. De Felice C, Maffei S, Signorini C, Leoncini S, Lunghetti S, Valacchi G, et al. Subclinical myocardial dysfunction in Rett syndrome. Eur Heart J Cardiovasc Imaging. (2012) 13:339–45. doi: 10.1093/ejechocard/jer256
75. Anderson A, Wong K, Jacoby P, Downs J, Leonard H. Twenty years of surveillance in Rett syndrome: what does this tell us? Orphanet J Rare Dis. (2014) 9:87. doi: 10.1186/1750-1172-9-87
76. Tarquinio DC, Hou W, Neul JL, Kaufmann WE, Glaze DG, Motil KJ, et al. The changing face of survival in Rett syndrome and MECP2-related disorders. Pediatr Neurol. (2015) 53:402–11. doi: 10.1016/j.pediatrneurol.2015.06.003
77. Roux JC, Dura E, Villard L. Tyrosine hydroxylase deficit in the chemoafferent and the sympathoadrenergicpathways of the Mecp2 deficient mouse. Neurosci Lett. (2008) 447:82–6. doi: 10.1016/j.neulet.2008.09.045
78. Voituron N, Zanella S, Menuet C, Dutschmann M, Hilaire G. Early breathing defects after moderate hypoxia or hypercapnia in a mouse model of Rett syndrome. Respir Physiol Neurobiol. (2009) 168:109–18. doi: 10.1016/j.resp.2009.05.013
79. Stettner GM, Huppke P, Brendel C, Richter DW, Gärtner J, Dutschmann M. Breathing dysfunctions associated with impaired control of postinspiratory activity in Mecp2-/y knockout mice. J Physiol. (2007) 579:863–76. doi: 10.1113/jphysiol.2006.119966
80. Abdala AP, Dutschmann M, Bissonnette JM, Paton JF. Correction of respiratory disorders in a mouse model of Rett syndrome. Proc Natl Acad Sci USA. (2010) 107:18208–13. doi: 10.1073/pnas.1012104107
81. Kline DD, Ogier M, Kunze DL, Katz DM. Exogenous brain-derived neurotrophic factor rescues synaptic dysfunction in Mecp2-null mice. J Neurosci. (2010) 30:5303–10. doi: 10.1523/JNEUROSCI.5503-09.2010
82. Medrihan L, Tantalaki E, Aramuni G, Sargsyan V, Dudanova I, Missler M, et al. Early defects of GABAergic synapses in the brain stem of a MeCP2 mouse model of Rett syndrome. J Neurophysiol. (2008) 99:112–21. doi: 10.1152/jn.00826.2007
83. Taneja P, Ogier M, Brooks-Harris G, Schmid DA, Katz DM, Nelson SB. Pathophysiology of locus ceruleus neurons in a mouse model of Rett syndrome. J Neurosci. (2009) 29:12187–95. doi: 10.1523/JNEUROSCI.3156-09.2009
84. Kron M, Zimmermann JL, Dutschmann M, Funke F, Müller M. Altered responses of MeCP2-deficient mouse brain stem to severe hypoxia. J Neurophysiol. (2011) 105:3067–79. doi: 10.1152/jn.00822.2010
85. Johnson CM, Zhong W, Cui N, Wu Y, Xing H, Zhang S, et al. Defects in brainstem neurons associated with breathing and motor function in the Mecp2R168X/Y mouse model of Rett syndrome. Am J Physiol Cell Physiol. (2016) 311:C895–909. doi: 10.1152/ajpcell.00132.2016
86. Oginsky MF, Cui N, Zhong W, Johnson CM, Jiang C. Hyperexcitability of mesencephalic trigeminal neurons and reorganization of ion channel expression in a Rett syndrome model. J Cell Physiol. (2017) 232:1151–64. doi: 10.1002/jcp.25589
87. Xing H, Cui N, Johnson CM, Faisthalab Z, Jiang C. Dual synaptic inhibitions of brainstem neurons by GABA and glycine with impact on Rett syndrome. J Cell Physiol. (2021) 236:3615–28. doi: 10.1002/jcp.30098
88. Yoshikawa H, Kaga M, Suzuki H, Sakuragawa N, Arima M. Giant somatosensory evoked potentials in the Rett syndrome. Brain Dev. (1991) 13:36–9. doi: 10.1016/S0387-7604(12)80295-6
89. Yamanouchi H, Kaga M, Arima M. Abnormal cortical excitability in Rett syndrome. Pediatr Neurol. (1993) 9:202–6. doi: 10.1016/0887-8994(93)90085-Q
90. Paterson DS, Thompson EG, Belliveau RA, Antalffy BA, Trachtenberg FL, Armstrong DD, et al. Serotonin transporter abnormality in the dorsal motor nucleus of the vagus in Rett syndrome: potential implications for clinical autonomic dysfunction. J Neuropathol Exp Neurol. (2005) 64:1018–27. doi: 10.1097/01.jnen.0000187054.59018.f2
91. Armstrong DD. Neuropathology of Rett syndrome. J Child Neurol. (2005) 20:747–53. doi: 10.1177/08830738050200082401
92. Pertile N, Vergerio A, Galliani E, Turrin A, Caddia V, Rasori E. Sindrome di Rett: descrizione di un caso con anomalie del pattern respiratorio [Rett's syndrome: description of a case with abnormal respiratory pattern]. Pediatr Med Chir. (1992) 14:647–50.
93. Ward CS, Arvide EM, Huang TW, Yoo J, Noebels JL, Neul JL. MeCP2 is critical within HoxB1-derived tissues of mice for normal lifespan. J Neurosci. (2011) 31:10359–70. doi: 10.1523/JNEUROSCI.0057-11.2011
94. Ward CS, Huang TW, Herrera JA, Samaco RC, McGraw CM, Parra DE, et al. Loss of MeCP2 Function Across Several Neuronal Populations Impairs Breathing Response to Acute Hypoxia. Front Neurol. (2020) 11:593554. doi: 10.3389/fneur.2020.593554
95. Bissonnette JM, Knopp SJ. Separate respiratory phenotypes in methyl-CpG-binding protein 2 (Mecp2) deficient mice. Pediatr Res. (2006) 59:513–8. doi: 10.1203/01.pdr.0000203157.31924.4a
96. Bissonnette JM, Knopp SJ. Effect of inspired oxygen on periodic breathing in methy-CpG-binding protein 2 (Mecp2) deficient mice. J Appl Physiol. (1985) (2008) 104:198–204. doi: 10.1152/japplphysiol.00843.2007
97. Russell JC, Blue ME, Johnston MV, Naidu S, Hossain MA. Enhanced cell death in MeCP2 null cerebellar granule neurons exposed to excitotoxicity and hypoxia. Neuroscience. (2007) 150:563–74. doi: 10.1016/j.neuroscience.2007.09.076
98. Fischer M, Reuter J, Gerich FJ, Hildebrandt B, Hägele S, Katschinski D, et al. Enhanced hypoxia susceptibility in hippocampal slices from a mouse model of Rett syndrome. J Neurophysiol. (2009) 101:1016–32. doi: 10.1152/jn.91124.2008
99. Kron M, Müller M. Impaired hippocampal Ca2+ homeostasis and concomitant K+ channel dysfunction in a mouse model of Rett syndrome during anoxia. Neuroscience. (2010) 17:300–15. doi: 10.1016/j.neuroscience.2010.08.031
100. Vermehren-Schmaedick A, Jenkins VK, Knopp SJ, Balkowiec A, Bissonnette JM. Acute intermittent hypoxia-induced expression of brain-derived neurotrophic factor is disrupted in the brainstem of methyl-CpG-binding protein 2 null mice. Neuroscience. (2012) 206:1–6. doi: 10.1016/j.neuroscience.2012.01.017
101. Janc OA, Müller M. The free radical scavenger Trolox dampens neuronal hyperexcitability, reinstates synaptic plasticity, and improves hypoxia tolerance in a mouse model of Rett syndrome. Front Cell Neurosci. (2014) 8:56. doi: 10.3389/fncel.2014.00056
102. Bissonnette JM, Schaevitz LR, Knopp SJ, Zhou Z. Respiratory phenotypes are distinctly affected in mice with common Rett syndrome mutations MeCP2 T158A and R168X. Neuroscience. (2014) 267:166–76. doi: 10.1016/j.neuroscience.2014.02.043
103. Festerling K, Can K, Kügler S, Müller M. Overshooting subcellular redox-responses in Rett-mouse hippocampus during neurotransmitter stimulation. Cells. (2020) 9:2539. doi: 10.3390/cells9122539
104. Barnett WH, Abdala AP, Paton JF, Rybak IA, Zoccal DB, Molkov YI. Chemoreception and neuroplasticity in respiratory circuits. Exp Neurol. (2017) 287:153–64. doi: 10.1016/j.expneurol.2016.05.036
105. Arroyo JP, Schweickert AJ. Back to Basics in Physiology. Cambridge, MA: Academic Press-Elsevier (2015).
107. Signorini C, De Felice C, Leoncini S, Durand T, Galano JM, Cortelazzo A, et al. Altered erythrocyte membrane fatty acid profile in typical Rett syndrome: effects of omega-3 polyunsaturated fatty acid supplementation. Prostaglandins Leukot Essent Fatty Acids. (2014) 91:183–93. doi: 10.1016/j.plefa.2014.08.002
108. Cortelazzo A, De Felice C, Guerranti R, Leoncini R, Barducci A, Leoncini S, et al. Erythrocyte cytoskeletal-plasma membrane protein network in Rett syndrome: effects of omega-3 polyunsaturated fatty acids. Curr Proteomics. (2016) 12:217–26. doi: 10.2174/157016461204160119153511
109. Ciaccio C, Di Pierro D, Sbardella D, Tundo GR, Curatolo P, Galasso C, et al. Oxygen exchange and energy metabolism in erythrocytes of Rett syndrome and their relationships with respiratory alterations. Mol Cell Biochem. (2017) 426:205–13. doi: 10.1007/s11010-016-2893-9
110. Prior C, Nunes A, Rios M, Sequeiros J, Maciel P, Gomes L, et al. Trastornosnutricionales y gastrointestinales en elsíndrome de Rett: importancia de la intervencióntemprana [Nutrition and gastrointestinal disorders in Rettsyndrome: Importance of early intervention]. An Pediatr. (2010) 72:191–8. doi: 10.1016/j.anpedi.2009.02.007
111. Thommessen M, Kase BF, Heiberg A. Growth and nutrition in 10 girls with Rett syndrome. Acta Paediatr. (1992) 81:686–90. doi: 10.1111/j.1651-2227.1992.tb12334.x
112. Schwartzman F, Vítolo MR, Schwartzman JS, Morais MB. Eating practices, nutritional status and constipation in patients with Rett syndrome. Arq Gastroenterol. (2008) 45:284–9. doi: 10.1590/S0004-28032008000400005
113. Killian W, Riederer P, Linkesch W. Serum iron status in Rett syndrome. Brain Dev. (1987) 9:523–4. doi: 10.1016/S0387-7604(87)80077-3
114. Cloonan SM, Mumby S, Adcock IM, Choi AMK, Chung KF, Quinlan GJ. The “iron”-y of iron overload and iron deficiency in chronic obstructive pulmonary disease. Am J Respir Crit Care Med. (2017) 196:1103–12. doi: 10.1164/rccm.201702-0311PP
115. Neves J, Haider T, Gassmann M, Muckenthaler MU. Iron homeostasis in the lungs-a balance between health and disease. Pharmaceuticals. (2019) 12:5. doi: 10.3390/ph12010005
116. Papanikolaou G, Pantopoulos K. Iron metabolism and toxicity. Toxicol Appl Pharmacol. (2005) 202:199–211. doi: 10.1016/j.taap.2004.06.021
117. Geronzi U, Lotti F, Grosso S. Oxidative stress in epilepsy. Expert Rev Neurother. (2018) 18:427–34. doi: 10.1080/14737175.2018.1465410
118. Vezzani A, Balosso S, Ravizza T. Neuroinflammatory pathways as treatment targets and biomarkers in epilepsy. Nat Rev Neurol. (2019) 15:459–72. doi: 10.1038/s41582-019-0217-x
119. Yang N, Guan QW, Chen FH, Xia QX, Yin XX, Zhou HH, et al. Antioxidants targeting mitochondrial oxidative stress: promising neuroprotectants for epilepsy. Oxid Med Cell Longev. (2020) 2020:6687185. doi: 10.1155/2020/6687185
120. Faught E. Topiramate in the treatment of partial and generalized epilepsy. Neuropsychiatr Dis Treat. (2007) 3:811–21. doi: 10.2147/NDT.S512
121. Cárdenas-Rodríguez N, Coballase-Urrutia E, Huerta-Gertrudis B, García-Cruz ME, Pedraza-Chaverri J, Coria-Jiménez R, et al. Antioxidant activity of topiramate: an antiepileptic agent. Neurol Sci. (2013) 34:741–7. doi: 10.1007/s10072-012-1127-5
122. Yürekli VA, Naziroglu M. Selenium and topiramate attenuates blood oxidative toxicity in patients with epilepsy: a clinical pilot study. Biol Trace Elem Res. (2013) 152:180–6. doi: 10.1007/s12011-013-9616-9
123. Motaghinejad M, Motevalian M, Falak R, Heidari M, Sharzad M, Kalantari E. Neuroprotective effects of various doses of topiramate against methylphenidate-induced oxidative stress and inflammation in isolated rat amygdala: the possible role of CREB/BDNF signaling pathway. J Neural Transm (Vienna). (2016) 123:1463–77. doi: 10.1007/s00702-016-1619-1
124. Cesarone MR, Dugall M, Hu S, Belcaro G, Hosoi M, Scipione V, et al. Episodic primary migraine headache: supplementary prophylaxis with Pycnogenol® prevents attacks and controls oxidative stress. Panminerva Med. (2020) 62:102–8. doi: 10.23736/S0031-0808.19.03745-5
125. Gündüz ZB, Aktas F, Vatansev H, Solmaz M, Erdogan E. Effects of amantadine and topiramate on neuronal damage in rats with experimental cerebral ischemia-reperfusion. Adv Clin Exp Med. (2021) 30:1013–23. doi: 10.17219/acem/138327
126. Rogawski MA, Löscher W. The neurobiology of antiepileptic drugs. Nat Rev Neurosci. (2004) 5:553–64. doi: 10.1038/nrn1430
127. Mathew NT. Pathophysiology of chronic migraine and mode of action of preventive medications. Headache. (2011) 51:84–92. doi: 10.1111/j.1526-4610.2011.01955.x
128. Domínguez C, López A, Ramos-Cabrer P, Vieites-Prado A, Pérez-Mato M, Villalba C, et al. Iron deposition in periaqueductal gray matter as a potential biomarker for chronic migraine. Neurology. (2019) 92:e1076–85.
129. Kim JH, Suh SI, Seol HY, Oh K, Seo WK, Yu SW, et al. Regional grey matter changes in patients with migraine: a voxel-based morphometry study. Cephalalgia. (2008) 28:598–604. doi: 10.1111/j.1468-2982.2008.01550.x
130. Mumby S, Chung KF, McCreanor JE, Moloney ED, Griffiths MJ, Quinlan GJ. Pro-oxidant iron in exhaled breath condensate: a potential excretory mechanism. Respir Med. (2011)105:1290–5. doi: 10.1016/j.rmed.2011.03.021
131. Mumby S, Saito J, Adcock IM, Chung KF, Quinlan GJ. Decreased breath excretion of redox active iron in COPD: a protective failure? Eur Respiratory J. (2016) 47:1267–70. doi: 10.1183/13993003.01710-2015
Keywords: Rett syndrome, sleep-wakefulness cycle, respiratory dysfunction, oxidative stress, non-protein-bound iron
Citation: Leoncini S, Signorini C, Boasiako L, Scandurra V, Hayek J, Ciccoli L, Rossi M, Canitano R and De Felice C (2022) Breathing Abnormalities During Sleep and Wakefulness in Rett Syndrome: Clinical Relevance and Paradoxical Relationship With Circulating Pro-oxidant Markers. Front. Neurol. 13:833239. doi: 10.3389/fneur.2022.833239
Received: 10 December 2021; Accepted: 02 February 2022;
Published: 29 March 2022.
Edited by:
Karen Spruyt, Institut National de la Santé et de la Recherche Médicale (INSERM), FranceReviewed by:
Maurizio Elia, IRCCS Oasi Maria SS, ItalyRosa Peraita- Adrados, Complutense University of Madrid, Spain
Copyright © 2022 Leoncini, Signorini, Boasiako, Scandurra, Hayek, Ciccoli, Rossi, Canitano and De Felice. This is an open-access article distributed under the terms of the Creative Commons Attribution License (CC BY). The use, distribution or reproduction in other forums is permitted, provided the original author(s) and the copyright owner(s) are credited and that the original publication in this journal is cited, in accordance with accepted academic practice. No use, distribution or reproduction is permitted which does not comply with these terms.
*Correspondence: Claudio De Felice, Yy5kZWZlbGljZUBhby1zaWVuYS50b3NjYW5hLml0; Z2VuaWVudGVAZ21haWwuY29t