Abstract
Background:
Brain atrophy represents a final common pathway for pathological processes in patients with cerebral small vessel disease (CSVD) and is now recognized as a strong independent predictor of clinical status and progression. The mechanism underlying brain atrophy in patients with CSVD is not yet fully comprehended. This study aims to investigate the association of morphologic features of intracranial distal arteries (A2, M2, P2 and more distal) with different brain structures [gray matter volume (GMV), white matter volume (WMV), and cerebrospinal fluid volume (CSFV)]. Furthermore, we also examined whether a correlation existed between these cerebrovascular characteristics and GMV in different brain regions.
Method:
A total of 39 participants were eventually enrolled. The morphologic features of intracranial distal arteries based on TOF-MRA were extracted and quantified using the intracranial artery feature extraction technique (iCafe). The brain 3D-T1 images were segmented into gray matter (GM), white matter (WM), and cerebrospinal fluid (CSF) using the “Segment” tool in CAT12 for the voxel-based morphometry (VBM) analysis. Univariable and multivariable linear regression models were used to investigate the relationship between these cerebrovascular features and different brain structures. Partial correlation analysis with a one-tailed method was used to evaluate the relationship between these cerebrovascular features and GMV in different brain regions.
Results:
Our findings indicate that both distal artery length and density were positively correlated with GM fraction in CSVD patients, regardless of whether univariable or multivariable linear regression analyses were performed. In addition, distal artery length (β = −0.428, p = 0.007) and density (β = −0.337, p = 0.036) were also found to be negative associated with CSF fraction, although this relationship disappeared after adjusting for potential confounders. Additional adjustment for the effect of WMHs volume did not change these results. In subgroup anasysis, we found that participants in the highest distal artery length tertile had significantly higher GM fraction and lower CSF fraction level than participants in the lowest distal artery length tertile. In partial correlation analysis, we also found that these cerebrovascular characteristics associated with regional GMV, especially subcortical nuclear.
Conclusion:
The morphologic features of intracranial distal arteries, including artery length, density and average tortuosity, measured from 3D-TOF MRA, are associated with generalized or focal atrophy indexes of CSVD.
Introduction
The neuroimaging features of cerebral small vessel disease (CSVD) comprise a range of abnormalties, such as small subcortical infarcts, lacunes, white matter hyperintensities (WMHs), enlarged perivascular spaces, cerebral microbleeds (CMBs), and brain atrophy (1). Brain atrophy represents a final common pathway for pathological processes and is now recognized as a strong independent predictor of clinical status and progression in patients with CSVD (2–4). The impact of vascular lesions associated with CSVD on clinical status is, to some extent, influenced by alterations in brain atrophy and cortical morphology (5, 6). Brain volume, which is another imaging indicator of brain atrophy, has been found to be associated with cognition, gait abnormality and disability scales (7–9). In addition, in statistical models, brain volume regularly outperform other lesion-based magnetic resonance imaging (MRI) markers of CSVD for predicting cognitive outcomes (10). Structural MRI can provide morphological information that reveals the cortical and subcortical deformation in response to pathological changes. Voxel-based morphometry (VBM) is a well proven neuroimaging analysis technique that enables investigation of focal differences in brain volume, using the statistical approach of statistical parametric mapping (SPM) (11).
The mechanism underlying brain atrophy in patients with CSVD is not yet fully comprehended. Neuropathological hallmarks of atrophy include neuronal loss, cortical thinning, subcortical vascular pathology with white matter rarefaction and shrinkage, arteriolosclerosis, venous collagenosis, and secondary neurodegenerative changes (12–14). There is no direct pathological study avaliable to elucidate the histological foundation of brain volume changes in patients with CSVD. Brain atrophy may be a direct result of microvascular lesions. Furthermore, brain atrophy may also be secondary to other processes, such as white matter tract disruption with secondary atrophy and focal cortical thinning in brain regions connected to subcortical infarcts (3, 15, 16). Therefore, evaluating the association between vascular injury and brain atrophy in CSVD holds significant value for further mechanism study. A major hurdle is that the microvascular lesions involved are too minute to be directly and quantitatively measured. Therefore, discovering an alternative quantitative marker of cerebrovascular injury is of immense importance.
Three dimensional time-of-flight (3D-TOF) magnetic resonance angiography (MRA) is the most common angiography technology in clinical practice, extensively employed for the evaluation of head and neck arteries (17). The advancement of image processing technology has enabled the extraction of cerebral vascular features based on 3D-TOF MRA. It differs from the blood flow information of the proximal arteries or brain parenchyma, as it mainly focuses on the distal arteries (A2, M2, P2 and more distal). Recently developed and validated, the intracranial artery feature extraction technique (iCafe) can effectively evaluate the morphometry and intensity features of all vascular regions identified in the brain, based on 3D-TOF MRA images (18). The reproducibility analysis of iCafe demonstrated outstanding agreement for both inter-scan and intra-operator evaluations, and good agreement for inter-operator evaluations, indicating the quantitative measurements of intracranial arteries are highly reliable (19). Furthermore, Gould et al. (20) discovered that the vascular features of distal arteries on 3D-TOF MRA, such as vessel length and the number of branches, may serve as surrogate markers of blood flow. Moreover, these vascular features may also be affected by other factors, such as wall thickening-induced luminal narrowing in the distal arteries (21). Therefore, these vascular features may provide distinctive information regarding blood flow and luminal narrowing in distal arteries. Chronic hypertension is one of the most important risk factors for CSVD (22). Studies on essential hypertension suggest that structural alterations of small and large vessels are closely interdependent (23–26), implying that the hypothesis that small vessel pathological changes may be associated with those in large vessels. These studies provide a theoretical basis for the hypothesis that the morphologic features of intracranial distal arteries are associated with brain atrophy in CSVD.
In this study, we aimed to use iCafe to quantify the morphologic features of intracranial distal arteries, including artery length, density and average tortuosity, measured from 3D-TOF MRA and investigate their relationship with different brain structures [gray matter volume (GMV), white matter volume (WMV), and cerebrospinal fluid volume (CSFV)]. Furthermore, we also examined whether a correlation existed between these cerebrovascular characteristics and GMV in different brain regions. Our study updated the method for evaluating the morphological characteristics of intracranial arteries in CSVD, providing valuable information to clarify the relationship between vascular health indicators and brain atrophy, and offering new evidence for a possible vascular origin of brain atrophy.
Materials and methods
Participants
Seventy-four participants diagnosed with CSVD were consecutively recruited from the outpatients and inpatients of the Department of Neurology between June 2022 and December 2022. Following the inclusion and exclusion criteria, we enrolled thirty-nine participants in the study. The specific screening process is illustrated in Figure 1. Ethical approval was obtained from the ethics committee of Jincheng People’s Hospital and written informed consent was obtained from all participants. WMHs was defined as hyperintense on T2-weighted or FLAIR sequences and can appear as isointense or hypointense (although often not as hypointense as CSF) on T1-weighted sequences (1). WMHs were graded using the Modified Fazekas Scale and recorded as 0 = no, 1 = punctate, 2 = beginning, and 3 = confluent (27). Participants with WMHs of a Modified Fazekas scale≥2 were considered as having CSVD, with or without lacunar infarction (LI), perivascular spaces and microbleeds. Demographic data and vascular risk factors, including age, gender, body mass index (BMI), hypertension, diabetes mellitus, heart disease, history of smoking and past history of stroke or transient ischemic attack (TIA) were recorded. Metabolic markers including cholesterol, low-density lipoproteins, glycosylated hemoglobin and homocysteine levels were also collected.
Figure 1

Flowchart of screened, excluded, and included cerebral small vessel disease (CSVD) participants among the outpatients and inpatients in the Department of Neurology between June 2022 to December 2022.
The inclusion criteria for this study were as follows: (a) age between 50–80 years; (b) meeting the diagnostic criteria of CSVD (as described above) (1); and (c) all participants had to sign the informed consent form prior to study entry. The exclusion criteria were as follows: (a) acute cerebral infarction in recent 3 months; (b) cerebral infarctions>20 mm in diameter; (c) leukoencephalopathy of non-vascular origin (e.g., immunological demyelination, metabolic, toxic or infectious diseases); (d) intracranial or extracranial large artery stenosis of >50%; (e) intracranial hemorrhage; (f) history of hydrocephalus, cerebral tumor or space occupying lesions; (g) hereditary CSVD; (h) severe systemic disease; (i) other neurological and psychiatric diseases, such as Alzheimer’s Disease (AD), Parkinson’s disease (PD), neurological infection, epilepsy, schizophrenia and bipolar disorder; (j) formal contraindications or refusal to undergo cerebral MRI and (k) left-handedness.
MRI protocol and image processing
All participants underwent MRI using a standard protocol. Scans were obtained using a 3.0T Philips Intera scanner (Ingenia 3.0T, Philips Medical Systems, The Netherlands) at the Imaging Department of Jincheng People’s Hospital. The protocol included the following sequences: T1-weighted [repetition time (TR) = 1800 ms, echo time (TE) = 20 ms, flip angle (FA) = 90°, slices = 20, the field of view (FOV) = 230 × 185 mm2, acquisition matrix =328 × 199, thickness = 5.5 mm, voxel size =0.7 × 0.88 × 5.5 mm3],T2-weighted (TR = 4,000 ms, TE = 107 ms, FA = 90°, slices = 20, FOV = 230 × 230 mm2, acquisition matrix = 384 × 384, thickness = 5 mm, voxel size = 0.6 × 0.6 × 5 mm3), FLAIR (TR = 11,000 ms, TE = 120 ms, FA = 90°, slices = 20, FOV = 230 × 187 mm2, acquisition matrix = 356 × 115, thickness = 5.5 mm, voxel size = 0.65 × 1 × 5.5 mm3), TOF-MRA (TR = 23 ms, TE = 3.5 ms, FA = 18°, slices = 140, FOV = 200 × 200 mm2, acquisition matrix = 444 × 294, thickness = 1.2 mm, voxel size = 0.45 × 0.68 × 1.2 mm3), 3D-T1(TR =7.9 ms, TE = 3.5 ms, FA = 8°, slices = 360, FOV = 256 × 256 mm2, acquisition matrix = 256 × 256, thickness = 1 mm, voxel size =1 × 1 × 1 mm3).
Image preprocessing and VBM analysis were performed using SPM12 program1 on the MATLAB R2021b platform. The image preprocessing steps performed were based on a standard protocol.2 Using the “Segment” tool in CAT12, the brain 3D-T1 images of every participant were skull-stripped and segmented into white matter (WM), grey matter (GM) and cerebrospinal fluid (CSF), which were used to determine regional GM, WM and CSF volumes, and to calculate total intracranial volume (TIV = GM + WM + CSF). Segmented GM maps were warped to the standard diffeomorphic anatomical registration through exponentiated lie (DARTEL) algebra template and normalized to the Montreal Neurological Institute (MNI) space (28). Normalized GM maps were then modulated to obtain the volume of GM tissue corrected for individual brain sizes and smoothed with an 8-mm full width at half maximum isotropic Gaussian kernel. Finally, the GM of the whole brain was divided into 170 regions using the automated anatomical labelling 3(AAL3) atlas (29).
WMHs volumes were automatically estimated using the lesion prediction algorithm (LPA) provided by the lesion segmentation tool (LST) toolbox (30)3 for SPM 12 (Figure 2). The detection of WMHs lesions only utilized FLAIR images.
Figure 2

Axial FLAIR image of a CSVD participant (A) and associated probabilistic lesion volume map (B) generated by the LST-LPA.
All the brain MRA images were processed using iCafe. Arteries in 3D-TOF MRA were traced using an open-curve active contour model (31) and reconstructed as radius-varying tubes. To address the artery tracing problems caused by artery boundary blurring due to pulsation and global image quality deterioration due to the motion during MRA scan, an artery trace refinement algorithm was used to correct centerline deviations and erroneous radius estimations along the traces (32). Subsequently arteries were labeled as one of the 24 anatomical types, allowing for comprehensive regional-based arterial features to be extracted, such as artery length, volume and tortuosity of intracranial distal arteries (A2, M2, P2 and more distal) (18, 33). The process was illustrated in Figure 3. The distal artery group consisted of the M2 and M3+ segments of the MCA, the A2+ segments of the ACA and the P2+ segments of the PCA. Artery length refers to the end-to-end distance of the centerline of an artery. Density is defined as the ratio of arterial volume and brain parenchymal volume. Tortuosity is the ratio between artery length and the Euclidean distance of the 2 terminal points of an individual artery segment. Cheng and Li, who have extensive experience in neuroimaging analysis, conducted these analyses above.
Figure 3

An example of iCafe processed 3D-TOF MRA of CSVD participant in maximum intensity projection (MIP) (A–D). The different intracranial arteries are indicated with different colors in the vessel tracing results (D).
Statistical analyses
Continuous variables with normal distribution were presented as mean ± standard deviation (SD). Variables with non-normal distribution were presented as median (interquartile ranges), while categorical variables were presented as frequencies (percentages). The normality of continuous variables was assessed by the Shapiro–Wilk test.
To examine the associations between morphologic features of intracranial distal arteries (artery length, density, and average tortuosity) and different brain structures (GMV, WMV, and CSFV), univariable linear regression was performed with different brain structures as the dependent variable and these cerebrovascular characteristics as the independent variable. Subsequently, multivariable linear regressions that include potential confounders were performed. To identify other confounders, univariable linear regression between each clinical variable and different brain structures was performed, and only the clinical variables with a p < 0.1 were chosen as confounders. To mitigate the influence of brain size, the distal artery length was normalized with the cube root of total brain volume (TBV), while the WMHs volume was normalized with TBV.
Furthermore, the participants were stratified into three groups according to the tertile of the distal artery length: 1st tertile, 2nd tertile and 3rd tertile. Subgroup analysis was performed to compare clinical characteristics and imaging features between participants in the two extreme tertiles (i.e., lowest and highest tertiles) of distal artery length distribution. Categorical variables were compared using Fishers exact tests, while continuous variables were compared using t-tests or Wilcoxon rank-sum tests, as appropriate.
Partial correlation analysis with a one-tailed approach was employed to evaluate the relationship between the morphologic features of intracranial distal arteries and GMV in different brain regions. Age, gender and total intracranial volume (TIV) were regarded as covariates in partial correlation analysis. The false discovery rate (FDR) statistics were calculated for each p-value, and those with adjusted p-values of <0.05 were regarded significant.
Results
Baseline characteristics
A total of 39 participants, aged between 50 to 80 years old, with a mean age of 68.08 years (SD = 6.56), were enrolled in the study and all participants successfully completed the MR imaging. Clinical data were collected upon admission, and laboratory data were collected within 24 h of admission. The data are tabulated in Table 1.
Table 1
| Baseline characteristics | CSVD (n = 39) |
|---|---|
| Age (years) | 68.08 (6.56) |
| Male sex, No. (%) | 28 (71.8) |
| BMI | 23.51 (4.59) |
| Medical history | |
| Hypertension | 28 (71.8) |
| Diabetes | 11 (28.2) |
| Coronary artery disease | 9 (23.1) |
| Smoking history | 8 (20.5) |
| History of stroke or TIA | 19 (48.7) |
| Laboratory findings | |
| Total cholesterol, mmol/L | 3.5 (0.94) |
| Homocysteine, μmol/L | 17.4 (20.35) |
| Low-density lipoproteins, mmol/L | 2.08 (0.85) |
| Glycosylated hemoglobin (%) | 5.8 (0.78) |
| Imaging features | |
| Normalized WMHs volumes (10−2) | 3.29 (2.95) |
| GM fraction (%) | 39.56 (3.07) |
| WM fraction (%) | 34.3 (5.01) |
| CSF fraction (%) | 26.9 (4.53) |
Baseline characteristics of the participants.
Values represented as mean (SD), number (%), or median (IQR). BMI, body mass index; TIA, transient ischemic attack.
Association between the morphologic features of intracranial distal arteries and different brain structures
Our study analyzed brain structures using the GM fraction (calculated by dividing GMV by TIV), WM fraction (calculated by dividing WMV by TIV), and CSF fraction (calculated by dividing CSFV by TIV). Distal vascular features were evaluated using artery length, density, and average tortuosity. Tables 2–4 present the results of univariable and multivariable linear regression analyses investigating the associations between intracranial distal vascular features and different brain structures. The results of the univariate linear regression model showed that distal artery length (β = 0.535, p < 0.001) (Table 2) and density (β = 0.507, p = 0.001) (Table 3) had a significant correlation with GM fraction. Furthermore, age (p = 0.022) and history of stroke or TIA (p = 0.045) exhibited p-values of less than 0.1 in the univariable linear regression analysis for association with GM fraction and were thus included as confounding factors in the multivariable linear regression model. After adjusting for these clinical confounding factors, the associations between distal artery length (β = 0.418, p = 0.007) (model 1 in Table 2) and density (β = 0.431, p = 0.005) (model 1 in Table 3) and GM fraction remained statistically significant. Additional adjustment for the effect of WMHs volume did not change these results (model 2 in Tables 2, 3). The univariate linear regression model also revealed correlations between distal artery length (β = −0.428, p = 0.007) (Table 2) and density (β = −0.337, p = 0.036) (Table 3) and CSF fraction. However, these associations disappeared after adjusting for age (p = 0.002), smoking history (p = 0.023), and history of stroke or TIA (p = 0.007). No significant associations were found between distal artery length (Table 2) and density (Table 3) and WM fraction in either the univariable or multivariable regression analysis. Furthermore, no significant correlations between average tortuosity and different brain structures were found in the statistical analysis (Table 4).
Table 2
| Brain structure | Univariable linear regression | Multivariable linear regression | |||||||
|---|---|---|---|---|---|---|---|---|---|
| Model 1 | Model 2 | ||||||||
| β | p | Adjusted R2 | β | p | Adjusted R2 | β | p | Adjusted R2 | |
| GM fraction | 0.535 | <0.001 | 0.267 | 0.418 | 0.007 | 0.311 | 0.418 | 0.008 | 0.3 |
| WM fraction | 0.099 | 0.549 | −0.017 | −0.105 | 0.524 | 0.149 | −0.103 | 0.534 | 0.139 |
| CSF fraction | −0.428 | 0.007 | 0.1613 | −0.205 | 0.145 | 0.397 | −0.207 | 0.141 | 0.398 |
Univariable and multivariable linear regression analyses of distal artery length and brain structures (N = 39).
GM, gray matter; WM, white matter; CSF, cerebrospinal fluid. Model 1 was adjusted for clinical confounding factors; model 2 was model 1 plus adjustment for WMHs volume. Bold values: significant p-values (p < 0.05).
Table 3
| Brain structure | Univariable linear regression | Multivariable linear regression | |||||||
|---|---|---|---|---|---|---|---|---|---|
| Model 1 | Model 2 | ||||||||
| β | p | Adjusted R2 | β | p | Adjusted R2 | β | p | Adjusted R2 | |
| GM fraction | 0.507 | 0.001 | 0.237 | 0.431 | 0.005 | 0.325 | 0.426 | 0.006 | 0.307 |
| WM fraction | 0.008 | 0.959 | −0.027 | −0.137 | 0.4 | 0.157 | −0.163 | 0.326 | 0.155 |
| CSF fraction | −0.337 | 0.036 | 0.090 | −0.217 | 0.118 | 0.402 | −0.2 | 0.157 | 0.394 |
Univariable and multivariable linear regression analyses of distal artery density and brain structures (N = 39).
GM, gray matter; WM, white matter; CSF, cerebrospinal fluid. Model 1 was adjusted for clinical confounding factors; model 2 was model 1 plus adjustment for WMHs volume. Bold values: significant p-values (p < 0.05).
Table 4
| Brain structure | Univariable linear regression | Multivariable linear regression | |||||||
|---|---|---|---|---|---|---|---|---|---|
| Model 1 | Model 2 | ||||||||
| β | p | Adjusted R2 | β | p | Adjusted R2 | β | p | Adjusted R2 | |
| GM fraction | 0.169 | 0.304 | 0.002 | 0.135 | 0.369 | 0.169 | 0.12 | 0.444 | 0.149 |
| WM fraction | −0.033 | 0.842 | −0.026 | −0.043 | 0.782 | 0.141 | −0.083 | 0.606 | 0.136 |
| CSF fraction | −0.092 | 0.577 | −0.018 | −0.082 | 0.539 | 0.364 | −0.049 | 0.722 | 0.358 |
Univariable and multivariable linear regression analyses of average tortuosity and brain structures (N = 39).
GM, gray matter; WM, white matter; CSF, cerebrospinal fluid. Model 1 was adjusted for clinical confounding factors; model 2 was model 1 plus adjustment for WMHs volume.
Subgroup analysis between participants at extreme Tertile of the distal artery length levels
The subgroup analysis comparing different brain structures between the extreme tertile of the distal artery length levels revealed that participants in the highest distal artery length tertile had significantly higher GM fraction level and lower CSF fraction than participants in the lowest distal artery length levels (Table 5).
Table 5
| Baseline characteristics | 1st tertile group | 3rd tertile group | p |
|---|---|---|---|
| Number | 13 | 13 | |
| Age (years) | 68.69 (7.24) | 66 (4.51) | 0.156 |
| Male sex, No. (%) | 10 (76.9) | 7 (53.8) | 0.411 |
| BMI | 21.22 (8.41) | 23.6 (2.37) | 0.920 |
| Medical history | |||
| Hypertension, No. (%) | 10 (76.9) | 10 (76.9) | 1 |
| Diabetes, No. (%) | 5 (38.5) | 2 (15.4) | 0.378 |
| Coronary artery disease, No. (%) | 2 (15.4) | 2 (15.4) | 1 |
| Smoking history, No. (%) | 2 (15.4) | 4 (30.8) | 0.645 |
| History of stroke or TIA, No. (%) | 8 (61.5) | 4 (30.8) | 0.238 |
| Laboratory findings | |||
| Total cholesterol, mmol/L | 3.29 (1.16) | 3.85 (1.02) | 0.264 |
| Homocysteine, μmol/L | 30.66 (14.37) | 14.2 (11.95) | 0.019 |
| low-density lipoproteins, mmol/L | 2.09 (0.57) | 2.47 (0.83) | 0.186 |
| Glycosylated hemoglobin (%) | 5.9 (0.68) | 5.8 (0.88) | 0.579 |
| Imaging features | |||
| Normalized WMHs volumes (10−2) | 3.62 (1.62) | 3.13 (1.55) | 0.448 |
| GM fraction (%) | 37.69 (3.4) | 40.98 (1.96) | 0.006 |
| WM fraction (%) | 33.57 (3.64) | 34.02 (2.84) | 0.727 |
| CSF fraction (%) | 28.74 (5.25) | 25 (2.97) | 0.035 |
Subgroup analysis between participants in extreme tertile of the distal artery length and different brain structures.
Bold values: significant p-values (p < 0.05).
Association between the morphologic features of intracranial distal arteries and GMV in different brain regions
To evaluate the associations between intracranial distal vascular features and GMV in different brain regions, partial correlation analysis with a one-tailed method was performed, controlling for gender, age and TIV. The AAL3 atlas was used to label statistically significant areas in the result reporting. The correlation analysis results are shown in Tables 6, 7, and the corresponding GM regions images are shown in Figures 4, 5. However, we did not find distal artery density related GM regions at our statistical cut off of FDR <0.05. No brain regions correlated negatively with these cerebrovascular characteristics.
Table 6
| Hemisphere | Region | Full names | R | p-value |
|---|---|---|---|---|
| Left | CAU | Caudate nucleus | 0.616 | 0.005 |
| PUT | Lenticular nucleus, putamen | 0.560 | 0.016 | |
| IPG | Inferior parietal gyrus, excluding supramarginal and angular gyri | 0.540 | 0.018 | |
| MFG | Middle frontal gyrus | 0.524 | 0.018 | |
| CERCRU2 | Crus II of cerebellar hemisphere | 0.523 | 0.018 | |
| Nacc | Nucleus accumbens | 0.512 | 0.020 | |
| PCUN | Precuneus | 0.463 | 0.043 | |
| Right | Nacc | Nucleus accumbens | 0.478 | 0.039 |
| tPuA | Thalamus, pulvinar anterior | 0.467 | 0.043 |
GM regions significantly positively correlated with distal artery length in patients with CSVD after adjusting for gender, age and TIV (p < 0.05, FDR correction).
Table 7
| Hemisphere | Region | Full names | R | p-value |
|---|---|---|---|---|
| Left | tMDm | Thalamus, mediodorsal medial magnocellular | 0.600 | 0.002 |
| tMDl | Thalamus, mediodorsal lateral parvocellular | 0.569 | 0.005 | |
| tVL | Thalamus, ventral lateral | 0.561 | 0.005 | |
| CER7b | Lobule VIIB of cerebellar hemisphere | 0.524 | 0.011 | |
| tPuM | Thalamus, pulvinar medial | 0.505 | 0.015 | |
| tPuL | Thalamus, pulvinar lateral | 0.502 | 0.015 | |
| TPOsup | Temporal pole: superior temporal gyrus | 0.495 | 0.015 | |
| CERCRU2 | Crus II of cerebellar hemisphere | 0.475 | 0.019 | |
| INS | Insula | 0.470 | 0.021 | |
| tPuA | Thalamus, pulvinar anterior | 0.467 | 0.021 | |
| SPG | Superior parietal gyrus | 0.460 | 0.021 | |
| CER8 | Lobule VIII of cerebellar hemisphere | 0.459 | 0.021 | |
| tLGN | Thalamus, lateral geniculate | 0.440 | 0.028 | |
| tVPL | Thalamus, ventral posterolateral | 0.422 | 0.033 | |
| tLP | Thalamus, lateral posterior | 0.421 | 0.033 | |
| ITG | Inferior temporal gyrus | 0.412 | 0.037 | |
| tIL | Thalamus, intralaminar | 0.410 | 0.037 | |
| ACCsub | Anterior cingulate cortex, subgenual | 0.409 | 0.037 | |
| tVA | Thalamus, ventral anterior | 0.395 | 0.042 | |
| ANG | Angular gyrus | 0.392 | 0.043 | |
| tAV | Thalamus, anteroventral nucleus | 0.384 | 0.046 | |
| IPG | Inferior parietal gyrus, excluding supramarginal and angular gyri | 0.383 | 0.046 | |
| Right | tMDm | Thalamus, mediodorsal medial magnocellular | 0.628 | 0.002 |
| tMDl | Thalamus, mediodorsal lateral parvocellular | 0.617 | 0.002 | |
| tPuM | Thalamus, pulvinar medial | 0.603 | 0.002 | |
| tPuL | Thalamus, pulvinar lateral | 0.538 | 0.009 | |
| TPOsup | Temporal pole: superior temporal gyrus | 0.495 | 0.015 | |
| tVL | Thalamus, ventral lateral | 0.490 | 0.016 | |
| tLP | Thalamus, lateral posterior | 0.481 | 0.018 | |
| CERCRU2 | Crus II of cerebellar hemisphere | 0.461 | 0.021 | |
| CER9 | Lobule IX of cerebellar hemisphere | 0.455 | 0.021 | |
| CERCRU1 | Crus I of cerebellar hemisphere | 0.438 | 0.028 | |
| CER7b | Lobule VIIB of cerebellar hemisphere | 0.429 | 0.032 | |
| INS | Insula | 0.423 | 0.033 | |
| tVPL | Thalamus, ventral posterolateral | 0.405 | 0.039 | |
| tAV | Thalamus, anteroventral nucleus | 0.403 | 0.039 | |
| tPuI | Thalamus, pulvinar inferior | 0.399 | 0.041 | |
| CER8 | Lobule VIII of cerebellar hemisphere | 0.395 | 0.042 | |
| PHG | Thalamus, parahippocampal gyrus | 0.385 | 0.046 |
GM regions significantly positively correlated with average tortuosity of distal arteries in patients with CSVD after adjusting for gender, age, and TIV (p < 0.05, FDR correction).
Figure 4

Images showing GM regions where distal artery length is positively associated with GMV (p < 0.05, FDR correction).
Figure 5
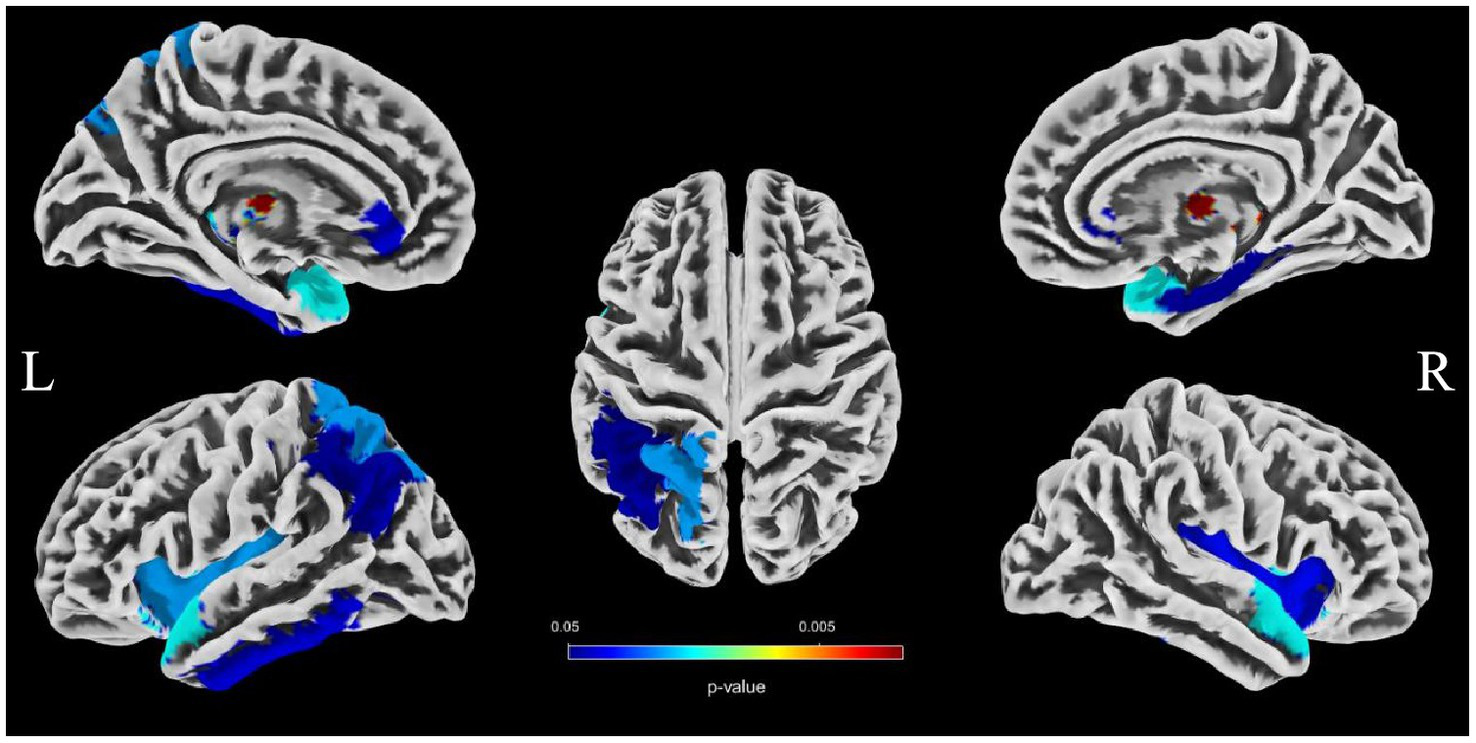
Images showing regions where average tortuosity of distal arteries is positively associated with GMV (p < 0.05, FDR correction).
Discussion
Brain atrophy is a condition characterized by the loss of neurons and their connections, which can either be generalized or focal. Focal cerebral atrophy and the associated damage can affect specific areas of brain tissue, leading to corresponding functional impairments (34). Brain atrophy is also a crucial MRI marker in CSVD. Many studies reported an association between CSVD and brain atrophy, including global atrophy, corpus callosum atrophy, central atrophy (increased ventricular size and atrophy of the basal ganglia), mesencephalic atrophy, and hippocampal atrophy, as well as focal cortical thinning in brain regions connected to subcortical infarcts (3, 15, 16). Hippocampal and medial temporal lobe atrophy could contribute to cognitive impairment even in the absence of Alzheimer pathology (9, 35, 36). Alternatively, medial temporal lobe atrophy might associate with executive function impairment (37). A combined continuous measure of four imaging findings, including WMHs, lacunar, cerebral GM, and hippocampal volumes, had the greatest independent predictive value for both cognitive and functional outcome in older individuals with≤7 years follow-up (38). In additional that the CSVD-induced thalamic atrophy could mediate the effects of CSVD on slower walking speed in the elderly (8). Our study investigated the associations between distal arterial morphological features and brain atrophy indicators in CSVD. The results indicate that both distal artery length and density were positively correlated with GM fraction in CSVD patients, regardless of whether univariable or multivariable linear regression analyses were performed. In addition, distal artery length and density were also found to be negative associated with CSF fraction, although this relationship disappeared after adjusting for potential confounders. In further subgroup analysis, we also found that participants in the highest distal artery length tertile had significantly higher GM fraction and lower CSF fraction than participants in the lowest distal artery length levels. However, we did not find a significant association between average tortuosity and different brain structures. These results strongly suggested an intricate relationship between distal arterial features and different brain structures. To further investigate the relationship between distal arterial features and local changes in GMV, we divided GM into 170 regions using the AAL3. The study findings indicate a clear association between distal arterial morphologic features and regional GMV, as presented in Tables 6, 7. The corresponding GM regions images are depicted in Figures 4, 5. The parahippocampal gyrus (PHG), angular gyrus (ANG), anterior cingulate cortex (ACC), and insula (INS) are predominantly involved in emotion, cognition, and memory functions. Reduced GMV in these regions may lead to corresponding functional impairment. Furthermore, reductions in GMV in cerebellar structures are linked to symptoms of dizziness and unsteady gaits in patients with CSVD. A significant proportion of these GM nuclei are subcortical nuclear (caudate, putamen, pallidum, and thalamus), which play vital roles in motor control functions. Atrophy of these regions has been associated with worse walking performance in CSVD patients (8, 39, 40). The potential reason may be related with the following factors. The deep nuclei are vulnerable to direct ischemic or hemorrhagic damage associated with CSVD due to their surrounding small perforating arteries from the middle and posterior cerebral arteries (41, 42). Compared to larger arteries, the morphological characteristics of the distal arteries we studied may be more relevant to changes in these perforating arteries. Currently, there are limited studies on the association between cerebrovascular structure and CSVD. In a community-based cohort study, Zhang et al. (43) found that the detailed structural alterations in cerebral vessel radius, tortuosity, and density were correlated with WMHs. A cross-sectional study investigation conducted on young adults has revealed that there exists an inverse correlation between brain vessel density and WMHs lesion counts. This finding suggests that the vascular morphology of an individual might influence their white matter resilience and potential to withstand risk exposures (44). In another study, it was observed that an increase in carotid lumen diameter is associated with a higher prevalence of lacunar infarcts and WMHs volume (45). This could serve as a compensatory mechanism to counteract the increase in stiffness and thickness of the arterial wall, thereby maintaining arterial compliance in the normal values (46–48). All of aforementioned studies were restricted to the entire cerebral artery or the larger artery, while our investigation specifically targets the smaller artery. As widely recognized, CSVD encompasses a range of conditions characterized by pathological changes primarily affecting small blood vessels with a diameter ranging from 40-200 μm in the brain. Nonetheless, we were unable to quantitatively evaluate these vessels directly. Inadequate perfusion of small arteries may lead to decreased blood flow in the upstream arteries, resulting in morphological alterations in vascular features as observed on 3D-TOF MRA (25). These features are mainly derived from the distal arteries (A2, M2, P2 and more distal). In this study, as anticipated, we found that distal arterial morphologic features on 3D-TOF MRA are associated with total or regional brain volumes/atrophy of CSVD. This finding provides valuable information to clarify the relationship between vascular health indicators and brain atrophy, and offers new evidence for a possible vascular origin of brain atrophy.
The intracranial artery features observed on MRA should not be considered as an accurate representation of the true vascular morphology within the brain. Rather, they serve as proxies for various factors that affect the visibility and luminal signal of distal arteries (such as A2, M2, P2 and more distal) on MRA scans (21). These factors include, but are not limited to, brain blood flow, as well as wall thickening-induced luminal narrowing (20, 49, 50). Additionally, most non-contrast MRA techniques rely to some extent on blood flow for imaging purposes (17). A lower velocity and longer travel distance of blood flow spins result in a greater number of radiofrequency (RF) pulses experienced by the spins, leading to increased magnetization saturation and reduced visibility of arteries (49, 50). This may result in a decrease in calculated artery length and artery density, and consequently exhibit a lower mean artery tortuosity. To date, quantifying the morphologic features of intracranial distal arteries remain very complex and challenging. The iCafe has been developed and applied as a potent tool to tackle this issue. As per the research conducted by Gould et al. (20), the length of visible intracranial arteries measured by iCafe based on TOF MRA can be employed as a promising surrogate imaging marker for brain blood flow. In another study, it was discovered that the length of intracranial arteries and the number of branches observed on TOF MRA were linked to Montreal Cognitive Assessment (MoCA) scores. These findings were not influenced by carotid stenosis, age, systolic blood pressure, use of anti-hypertensive drugs, or cerebral blood flow (CBF), indicating that they could offer supplementary insights into cerebrovascular health beyond conventional blood flow measurements (21). As commonly acknowledged, advanced age and hypertension are the primary risk factors for CSVD. Through the utilization of the iCafe, Chen et al. (18) conducted a study that demonstrated a negative correlation between older age and the visibility of distal artery vascularity, as evidenced by quantitative assessments of the number of branches, average artery order, and average tortuosity in a substantial sample of older adults. Additionally, in a community-based study, high blood pressure (BP) was found to be linked to decreased vessel density and branch numbers, which could signify inadequate perfusion of small arteries, thereby contributing to the development of small vessel disease (43). These studies suggested that cerebrovascular morphological indicators closely related to advanced age and hypertension were appropriate for evaluating CSVD. Our study highlights the close association between distal arterial morphological features and generalized or focal brain atrophy indicators in CSVD, which has yet to be reported. As previously suggested, our study updated the method for evaluating the morphological characteristics of intracranial arteries in CSVD, contributing to the limited research on the link between vascular health indicators and brain atrophy, offering new evidence for a possible vascular origin of brain atrophy. Given its non-invasive and clinically valuable nature, the morphological features of intracranial distal arteries based on 3D TOF-MRA will be promising indicators for widespread application in CSVD.
There are also certain limitations to this study. Firstly, the sample size is relatively small, which may lead to insufficient power for observing some potential links between the morphological characteristics of intracranial distal arteries and measures of brain atrophy. Secondly, the TOF sequence did not encompass over the whole brain, and some very distal branches, especially that of the ACA, were not measurable. This could have potentially affected the accuracy involving the vessel length, volume and tortuosity. Thirdly, current vessel tracing with the tool iCafe is still time consuming (approximately 2 h per case) due to the need for manual corrections, which could limit its clinical utility. Fourthly, the inclusion of participants with undetected hereditary cerebrovascular disease may result in differences in cerebrovascular morphology compared to other participants. Fifthly, while no other clinical diagnosis of neurological disorders were identified among all participants, subclinical pathologies related to neurodegenerative diseases cannot be excluded. The relationship between these subclinical pathologies and cerebrovascular morphologic features is not clearly identified. Sixthly, we did not adjust our analyses for other MRI markers of CSVD, including cerebral microbleeds, lacunes, or subcortical infarct.
Conclusion
The morphologic features of intracranial distal arteries, including artery length, density and average tortuosity, measured from 3D-TOF MRA, are associated with generalized or focal brain atrophy indexes. Our study updated the method for evaluating the morphological characteristics of intracranial arteries in CSVD, providing valuable information to clarify the relationship between vascular health indicators and brain atrophy, and offering new evidence for a possible vascular origin of brain atrophy.
Publisher’s note
All claims expressed in this article are solely those of the authors and do not necessarily represent those of their affiliated organizations, or those of the publisher, the editors and the reviewers. Any product that may be evaluated in this article, or claim that may be made by its manufacturer, is not guaranteed or endorsed by the publisher.
Statements
Data availability statement
The original contributions presented in the study are included in the article/supplementary material, further inquiries can be directed to the corresponding author.
Ethics statement
The studies involving human participants were reviewed and approved by Ethics committee of Jincheng People’s Hospital, China. The patients/participants provided their written informed consent to participate in this study.
Author contributions
JT put forward research ideas, revised the manuscript, and provided expert opinion. HL and CL took the responsibility of communicating with the patient’s family and obtaining the authorization in this study. CL, HL, and DZ collected the clinical characteristics data. LJ and LX provided statistical support, reviewed the manuscript, and provided expert opinion. HC and HL collected and analyzed the brain MRI data and also conducted the statistical analysis. HC designed and conceptualized the study, analyzed the data, wrote, and revised and edited the manuscript. All authors contributed to the article and approved the submitted version.
Conflict of interest
The authors declare that the research was conducted in the absence of any commercial or financial relationships that could be construed as a potential conflict of interest.
References
1.
Wardlaw JM Smith EE Biessels GJ Cordonnier C Fazekas F Frayne R et al . Neuroimaging standards for research into small vessel disease and its contribution to ageing and neurodegeneration. Lancet Neurol. (2013) 12:822–38. doi: 10.1016/S1474-4422(13)70124-8
2.
Jokinen H Lipsanen J Schmidt R Fazekas F Gouw AA van der Flier WM et al . Brain atrophy accelerates cognitive decline in cerebral small vessel disease: the LADIS study. Neurology. (2012) 78:1785–92. doi: 10.1212/WNL.0b013e3182583070
3.
Nitkunan A Lanfranconi S Charlton RA Barrick TR Markus HS . Brain atrophy and cerebral small vessel disease: a prospective follow-up study. Stroke. (2011) 42:133–8. doi: 10.1161/STROKEAHA.110.594267
4.
Chabriat H Herve D Duering M Godin O Jouvent E Opherk C et al . Predictors of clinical worsening in cerebral autosomal dominant arteriopathy with subcortical infarcts and Leukoencephalopathy: prospective cohort study. Stroke. (2016) 47:4–11. doi: 10.1161/STROKEAHA.115.010696
5.
Ter Telgte A van Leijsen EMC Wiegertjes K Klijn CJM Tuladhar AM de Leeuw FE . Cerebral small vessel disease: from a focal to a global perspective. Nat Rev Neurol. (2018) 14:387–98. doi: 10.1038/s41582-018-0014-y
6.
Rizvi B Narkhede A Last BS Budge M Tosto G Manly JJ et al . The effect of white matter hyperintensities on cognition is mediated by cortical atrophy. Neurobiol Aging. (2018) 64:25–32. doi: 10.1016/j.neurobiolaging.2017.12.006
7.
Peters N Holtmannspotter M Opherk C Gschwendtner A Herzog J Samann P et al . Brain volume changes in CADASIL: a serial MRI study in pure subcortical ischemic vascular disease. Neurology. (2006) 66:1517–22. doi: 10.1212/01.wnl.0000216271.96364.50
8.
Su N Liang X Zhai FF Zhou LX Ni J Yao M et al . The consequence of cerebral small vessel disease: linking brain atrophy to motor impairment in the elderly. Hum Brain Mapp. (2018) 39:4452–61. doi: 10.1002/hbm.24284
9.
Sun W Huang L Cheng Y Qin R Xu H Shao P et al . Medial temporal atrophy contributes to cognitive impairment in cerebral small vessel disease. Front Neurol. (2022) 13:858171. doi: 10.3389/fneur.2022.858171
10.
De Guio F Duering M Fazekas F De Leeuw FE Greenberg SM Pantoni L et al . Brain atrophy in cerebral small vessel diseases: extent, consequences, technical limitations and perspectives: the HARNESS initiative. J Cereb Blood Flow Metab. (2020) 40:231–45. doi: 10.1177/0271678X19888967
11.
Ashburner J Friston KJ . Voxel-based morphometry—the methods. NeuroImage. (2000) 11:805–21. doi: 10.1006/nimg.2000.0582
12.
Bobinski M de Leon MJ Wegiel J Desanti S Convit A Saint Louis LA et al . The histological validation of post mortem magnetic resonance imaging-determined hippocampal volume in Alzheimer’s disease. Neuroscience. (2000) 95:721–5. doi: 10.1016/s0306-4522(99)00476-5
13.
Jagust WJ Zheng L Harvey DJ Mack WJ Vinters HV Weiner MW et al . Neuropathological basis of magnetic resonance images in aging and dementia. Ann Neurol. (2008) 63:72–80. doi: 10.1002/ana.21296
14.
Black S Gao F Bilbao J . Understanding white matter disease: imaging-pathological correlations in vascular cognitive impairment. Stroke. (2009) 40:S48–52. doi: 10.1161/STROKEAHA.108.537704
15.
Aribisala BS Valdes Hernandez MC Royle NA Morris Z Munoz Maniega S Bastin ME et al . Brain atrophy associations with white matter lesions in the ageing brain: the Lothian birth cohort 1936. Eur Radiol. (2013) 23:1084–92. doi: 10.1007/s00330-012-2677-x
16.
Appelman AP Exalto LG van der Graaf Y Biessels GJ Mali WP Geerlings MI . White matter lesions and brain atrophy: more than shared risk factors? A systematic review. Cerebrovasc Dis. (2009) 28:227–42. doi: 10.1159/000226774
17.
Edelman RR Koktzoglou I . Noncontrast MR angiography: an update. J Magn Reson Imaging. (2019) 49:355–73. doi: 10.1002/jmri.26288
18.
Chen L Sun J Hippe DS Balu N Yuan Q Yuan I et al . Quantitative assessment of the intracranial vasculature in an older adult population using iCafe. Neurobiol Aging. (2019) 79:59–65. doi: 10.1016/j.neurobiolaging.2019.02.027
19.
Chen L Mossa-Basha M Sun J Hippe DS Balu N Yuan Q et al . Quantification of morphometry and intensity features of intracranial arteries from 3D TOF MRA using the intracranial artery feature extraction (iCafe): a reproducibility study. Magn Reson Imaging. (2019) 57:293–302. doi: 10.1016/j.mri.2018.12.007
20.
Gould A Chen Z Geleri DB Balu N Zhou Z Chen L et al . Vessel length on SNAP MRA and TOF MRA is a potential imaging biomarker for brain blood flow. Magn Reson Imaging. (2021) 79:20–7. doi: 10.1016/j.mri.2021.02.012
21.
Chen Z Gould A Geleri DB Balu N Chen L Chu B et al . Associations of intracranial artery length and branch number on non-contrast enhanced MRA with cognitive impairment in individuals with carotid atherosclerosis. Sci Rep. (2022) 12:7456. doi: 10.1038/s41598-022-11418-y
22.
Wardlaw JM Smith C Dichgans M . Mechanisms of sporadic cerebral small vessel disease: insights from neuroimaging. Lancet Neurol. (2013) 12:483–97. doi: 10.1016/S1474-4422(13)70060-7
23.
Muiesan ML Salvetti M Rizzoni D Paini A Agabiti-Rosei C Aggiusti C et al . Pulsatile hemodynamics and microcirculation: evidence for a close relationship in hypertensive patients. Hypertension. (2013) 61:130–6. doi: 10.1161/HYPERTENSIONAHA.111.00006
24.
Laurent S Briet M Boutouyrie P . Large and small artery cross-talk and recent morbidity-mortality trials in hypertension. Hypertension. (2009) 54:388–92. doi: 10.1161/HYPERTENSIONAHA.109.133116
25.
Laurent S Boutouyrie P . The structural factor of hypertension: large and small artery alterations. Circ Res. (2015) 116:1007–21. doi: 10.1161/CIRCRESAHA.116.303596
26.
Hainsworth AH Markus HS . Do in vivo experimental models reflect human cerebral small vessel disease? A systematic review. J Cereb Blood Flow Metab. (2008) 28:1877–91. doi: 10.1038/jcbfm.2008.91
27.
Fazekas F Kleinert R Offenbacher H Schmidt R Kleinert G Payer F et al . Pathologic correlates of incidental MRI white matter signal hyperintensities. Neurology. (1993) 43:1683–9. doi: 10.1212/wnl.43.9.1683
28.
Ashburner J . A fast diffeomorphic image registration algorithm. NeuroImage. (2007) 38:95–113. doi: 10.1016/j.neuroimage.2007.07.007
29.
Rolls ET Huang CC Lin CP Feng J Joliot M . Automated anatomical labelling atlas 3. NeuroImage. (2020) 206:116189. doi: 10.1016/j.neuroimage.2019.116189
30.
Schmidt P. Bayesian inference for structured additive regression models for large-scale problems with applications to medical imaging. Dissertation. LMU München (2017).
31.
Wang Y Narayanaswamy A Tsai CL Roysam B . A broadly applicable 3-D neuron tracing method based on open-curve snake. Neuroinformatics. (2011) 9:193–217. doi: 10.1007/s12021-011-9110-5
32.
Chen L Shaw DWW Dager SR Corrigan NM Chu B Kleinhans NM et al . Quantitative assessment of the intracranial vasculature of infants and adults using iCafe (intracranial artery feature extraction). Front Neurol. (2021) 12:668298. doi: 10.3389/fneur.2021.668298
33.
Chen L Mossa-Basha M Balu N Canton G Sun J Pimentel K et al . Development of a quantitative intracranial vascular features extraction tool on 3D MRA using semiautomated open-curve active contour vessel tracing. Magn Reson Med. (2018) 79:3229–38. doi: 10.1002/mrm.26961
34.
Grajauskas LA Siu W Medvedev G Guo H D'Arcy RCN Song X . MRI-based evaluation of structural degeneration in the ageing brain: pathophysiology and assessment. Ageing Res Rev. (2019) 49:67–82. doi: 10.1016/j.arr.2018.11.004
35.
O’Sullivan M Ngo E Viswanathan A Jouvent E Gschwendtner A Saemann PG et al . Hippocampal volume is an independent predictor of cognitive performance in CADASIL. Neurobiol Aging. (2009) 30:890–7. doi: 10.1016/j.neurobiolaging.2007.09.002
36.
Kim HJ Ye BS Yoon CW Noh Y Kim GH Cho H et al . Cortical thickness and hippocampal shape in pure vascular mild cognitive impairment and dementia of subcortical type. Eur J Neurol. (2014) 21:744–51. doi: 10.1111/ene.12376
37.
Yamanaka T Uchida Y Sakurai K Kato D Mizuno M Sato T et al . Anatomical links between white matter Hyperintensity and medial temporal atrophy reveal impairment of executive functions. Aging Dis. (2019) 10:711–8. doi: 10.14336/AD.2018.0929
38.
Jokinen H Koikkalainen J Laakso HM Melkas S Nieminen T Brander A et al . Global burden of small vessel disease-related brain changes on MRI predicts cognitive and functional decline. Stroke. (2020) 51:170–8. doi: 10.1161/STROKEAHA.119.026170
39.
Rosano C Aizenstein HJ Studenski S Newman AB . A regions-of-interest volumetric analysis of mobility limitations in community-dwelling older adults. J Gerontol A. (2007) 62:1048–55. doi: 10.1093/gerona/62.9.1048
40.
Rosano C Aizenstein H Brach J Longenberger A Studenski S Newman AB . Special article: gait measures indicate underlying focal gray matter atrophy in the brain of older adults. J Gerontol A. (2008) 63:1380–8. doi: 10.1093/gerona/63.12.1380
41.
Pantoni L . Cerebral small vessel disease: from pathogenesis and clinical characteristics to therapeutic challenges. Lancet Neurol. (2010) 9:689–701. doi: 10.1016/S1474-4422(10)70104-6
42.
Gold G Kovari E Herrmann FR Canuto A Hof PR Michel JP et al . Cognitive consequences of thalamic, basal ganglia, and deep white matter lacunes in brain aging and dementia. Stroke. (2005) 36:1184–8. doi: 10.1161/01.STR.0000166052.89772.b5
43.
Zhang B Wang Y Wang B Chu YH Jiang Y Cui M et al . MRI-based investigation of association between cerebrovascular structural alteration and white matter Hyperintensity induced by high blood pressure. J Magn Reson Imaging. (2021) 54:1516–26. doi: 10.1002/jmri.27815
44.
Williamson W Lewandowski AJ Forkert ND Griffanti L Okell TW Betts J et al . Association of cardiovascular risk Factors with MRI indices of cerebrovascular structure and function and white matter Hyperintensities in young adults. JAMA. (2018) 320:665–73. doi: 10.1001/jama.2018.11498
45.
Brisset M Boutouyrie P Pico F Zhu Y Zureik M Schilling S et al . Large-vessel correlates of cerebral small-vessel disease. Neurology. (2013) 80:662–9. doi: 10.1212/WNL.0b013e318281ccc2
46.
Safar ME Blacher J Mourad JJ London GM . Stiffness of carotid artery wall material and blood pressure in humans: application to antihypertensive therapy and stroke prevention. Stroke. (2000) 31:782–90. doi: 10.1161/01.str.31.3.782
47.
Wikstrand J Wiklund O . Frontiers in cardiovascular science. Quantitative measurements of atherosclerotic manifestations in humans. Arterioscler Thromb. (1992) 12:114–9. doi: 10.1161/01.atv.12.1.114
48.
Benetos A Laurent S Hoeks AP Boutouyrie PH Safar ME . Arterial alterations with aging and high blood pressure. A noninvasive study of carotid and femoral arteries. Arterioscler Thromb. (1993) 13:90–7. doi: 10.1161/01.atv.13.1.90
49.
Xiong Y Zhang Z He L Ma Y Han H Zhao X et al . Intracranial simultaneous noncontrast angiography and intraplaque hemorrhage (SNAP) MRA: analyzation, optimization, and extension for dynamic MRA. Magn Reson Med. (2019) 82:1646–59. doi: 10.1002/mrm.27855
50.
Zhang Q Chen Z Chen S Liu X Ning J Han Y et al . Angiographic contrast mechanism comparison between simultaneous non-contrast angiography and intraPlaque hemorrhage (SNAP) sequence and time of flight (TOF) sequence for intracranial artery. Magn Reson Imaging. (2020) 66:199–207. doi: 10.1016/j.mri.2019.09.001
Summary
Keywords
cerebral small vessel disease, brain atrophy, intracranial distal arteries, morphologic features, voxel-based morphometry
Citation
Cheng H, Teng J, Jia L, Xu L, Yang F, Li H, Ling C, Liu W, Li J, Li Y, Guo Z, Geng X, Guo J and Zhang D (2023) Association between morphologic features of intracranial distal arteries and brain atrophy indexes in cerebral small vessel disease: a voxel-based morphometry study. Front. Neurol. 14:1198402. doi: 10.3389/fneur.2023.1198402
Received
01 April 2023
Accepted
24 May 2023
Published
15 June 2023
Volume
14 - 2023
Edited by
Siti Balqis Samdin, Xiamen University Malaysia, Malaysia
Reviewed by
Thomas Lindner, University of Hamburg, Germany; Yuto Uchida, Johns Hopkins Medicine, United States
Updates
Copyright
© 2023 Cheng, Teng, Jia, Xu, Yang, Li, Ling, Liu, Li, Li, Guo, Geng, Guo and Zhang.
This is an open-access article distributed under the terms of the Creative Commons Attribution License (CC BY). The use, distribution or reproduction in other forums is permitted, provided the original author(s) and the copyright owner(s) are credited and that the original publication in this journal is cited, in accordance with accepted academic practice. No use, distribution or reproduction is permitted which does not comply with these terms.
*Correspondence: Junfang Teng, zdytjf@163.com
Disclaimer
All claims expressed in this article are solely those of the authors and do not necessarily represent those of their affiliated organizations, or those of the publisher, the editors and the reviewers. Any product that may be evaluated in this article or claim that may be made by its manufacturer is not guaranteed or endorsed by the publisher.