Abstract
Objective:
This study aimed to explore the factors associated with hemorrhagic transformation (HT) in acute ischemic stroke patients after intravenous thrombolysis (IVT), with a specific focus on the relationship with the post-thrombolysis fibrinogen-to-albumin ratio (FAR).
Methods:
The clinical records of 569 acute ischemic stroke (AIS) patients admitted to our department from 2020 to 2023 were retrospectively analyzed. All eligible patients were stratified into HT and non-HT (NHT) groups. Propensity score matching (PSM) was performed between the two groups. Receiver operating characteristic (ROC) curves were used to assess the predictive performance of the FAR, determining the optimal predictive value.
Results:
Ultimately, 142 patients were included, with 71 in the HT group and 71 in the NHT group. After propensity score matching, a significant association was observed between the FAR and HT (OR = 1.40, 95% CI, 1.187–1.645; p <0.001). The ROC curve analysis indicated that the FAR predicted HT after intravenous thrombolysis, with an area under the curve (AUC) value of 0.751 (95% CI, 0.669–0.831; p <0.001) and an optimal cutoff value of 0.0918. The corresponding sensitivity and specificity were 78.9 and 60.9%, respectively.
Conclusion:
In ischemic stroke patients undergoing IVT, the FAR may serve as a promising biochemical marker for predicting HT following treatment.
1 Introduction
In 2022, the World Stroke Organization (WSO) highlighted in its report (1) that stroke remains the second leading cause of death worldwide, with acute ischemic stroke (AIS) accounting for 87% of all stroke cases. Currently, evidence-based management of AIS involves intravenous thrombolysis and/or mechanical thrombectomy within therapeutic time windows. Among these approaches, intravenous thrombolytic therapy with recombinant tissue plasminogen activator (rt-PA) is the preferred method for treating ischemic strokes, significantly improving neurological prognosis (2). However, hemorrhagic transformation (HT) following AIS recanalization is one of the most clinically consequential complications (3), often leading to unfavorable outcomes. The incidence of HT varies from high to low (4–6). Previous research suggests that HT may be somewhat promoted by early blood–brain barrier disruption (7, 8), and this further exacerbates neurological damage in patients and leads to poor prognosis. These findings highlight the critical need for early risk stratification tools and novel neuroprotective strategies.
One factor contributing to the blood–brain barrier dysregulation is fibrinogen (FIB). Elevated levels of fibrinogen may also increase the risk of stroke, leading to poorer outcomes (9). The antioxidant, anti-apoptotic, and anti-inflammatory properties of albumin (ALB) have neuroprotective functions, helping maintain normal blood–brain barrier permeability. Compelling data from multicenter cohorts have shown (10) that hypoalbuminemia is associated with poor prognosis in AIS patients. Therefore, the fibrinogen-to-albumin ratio (FAR), which integrates both anti-inflammatory and pro-inflammatory indicators, has been developed and may be related to the occurrence of HT to a certain extent. It could potentially serve as a predictor of bleeding after thrombolysis. This novel systemic inflammation index has already established strong prognostic validity in oncology (11), cardiovascular medicine (12), and respiratory pathophysiology (13). Nevertheless, significant knowledge gaps remain regarding the predictive value of the FAR for post-thrombolysis HT in neurovascular contexts, particularly in terms of optimal threshold determination and evidence-based cutoff values. We hypothesize that the FAR could serve as a prognostic predictor of HT. Therefore, the goal of this research was to investigate the relationship between the FAR and HT.
2 Materials and methods
2.1 Study population
A retrospective cohort analysis was conducted on ischemic stroke patients who received alteplase (rt-PA) thrombolysis at our hospital between December 2020 and December 2023. All patients met the diagnostic criteria and indications for AIS outlined in the guidelines (14). The exclusion criteria included the following: (1) Intravascular therapy after intravenous thrombolysis (including intravascular thrombolysis and arterial thrombolysis); (2) missing or incomplete clinical and laboratory data; and (3) active malignancies, immune-mediated disorders, or acute infectious diseases. The study involving human participants was reviewed and approved by the Ethics Committee of the First Affiliated Hospital of Jinzhou Medical University. Due to the retrospective nature of this study, the First Affiliated Hospital of Jinzhou Medical University was exempt from the requirement for written consent.
2.2 Data collection
Data were retrospectively collected for each patient before intravenous thrombolysis and were immediately recorded following the clinical and radiological diagnosis of AIS. Baseline clinical characteristics included sex (male/female), age (years), smoking status, and alcohol use history. Clinical data included the National Institutes of Health Stroke Scale (NIHSS) score, systolic and diastolic blood pressure at admission, and medical history, including hypertension, coronary artery disease, diabetes, and bleeding diathesis. Laboratory data obtained from blood tests conducted before intravenous thrombolysis included the following components: white blood cells (WBC), monocytes (MN), eosinophils (EO), basophils (BA), neutrophils (NE), lymphocytes (LY), total protein (TP), albumin (ALB), globulin (GLB), fibrinogen (FIB), triglycerides (TG), cholesterol (CHO), low-density lipoprotein (LDL), and high-density lipoprotein (HDL). Stroke severity was assessed by a trained neurologist upon admission using the NIHSS score (15). The FAR was calculated using the formula: FAR = FIB/ALB.
2.3 Dosage and treatment regimen
A dose of 0.9 mg/kg (with a maximum of 90 mg) was administered over 60 min, with 10% of the total dose given as a bolus within 1 min.
2.4 Primary clinical outcome
The main clinical outcome was HT, which was confirmed through CT or MRI. HT subtypes were classified according to the European Cooperative Acute Stroke Study II (ECASS II) criteria (16) into two categories: parenchymal hemorrhage (PH) and hemorrhagic infarction (HI).
2.5 Statistical method
Statistical analyses were performed using SPSS 26.0 software (IBM, Armonk, NY). Continuous data with normal distribution were expressed as mean ± standard deviation (SD), while continuous data with non-normal distribution were expressed as median and quartile spacing [M (P25, P75)]. Intergroup comparisons were performed using Student’s t-test for parametric data and the Mann–Whitney U-test for non-parametric distributions. Count data were expressed as frequency and percentage [n (%)], and comparisons of categorical variables between the groups were performed using either a chi-squared test or Fisher’s exact test, as appropriate. Data normality was verified using the Kolmogorov–Smirnov test. A two-tailed α-level of 0.05 was considered to indicate statistical significance.
The patients were prospectively stratified into HT and non-HT (NHT) groups. Following the identification of HT-associated predictors, 1:1 propensity score matching (PSM) was implemented with a caliper width of 0.02 to mitigate confounding biases, thereby achieving quasi-randomized trial equivalency in baseline characteristics. Receiver operating characteristic (ROC) curves were used to determine the area under the curve (AUC), sensitivity, and specificity of the FAR in predicting HT after intravenous thrombolysis. The optimal cutoff value for the FAR was determined by calculating the maximum Youden’s index.
3 Results
A total of 2,636 AIS patients were initially screened. After applying the predefined exclusion criteria and accounting for missing data, 1,546 patients were excluded, leaving 569 eligible participants for preliminary analysis. Subsequently, PSM analysis was performed, and 142 patients were selected for statistical analysis. There were 71 cases in the HT group and 71 cases in the NHT group. A detailed flowchart of this process is displayed in Figure 1.
Figure 1

Flow diagram. AIS, acute ischemic stroke; HT, Hemorhagicnon-Hemorrhagic transformation; PSM, Propensity score matching.
In this study, 78 patients (13.7%) developed HT after thrombolysis. The baseline characteristics and laboratory parameters are presented in Table 1. Statistically significant differences between the two groups were observed in the following variables: age, coronary artery disease, NIHSS score, RBC count, FIB level, ALB level, and FAR. Consequently, when using the FAR as a predictive biomarker for early post-thrombolysis HT, potential confounding factors must be taken into account. This means that, both in research and clinical practice, it is essential to not only focus on the FAR but also to adjust for variables such as age, history of coronary artery disease, and early NIHSS score in order to enhance the predictive accuracy of HT risk assessment.
Table 1
| Variable | HT (N = 78) | NHT (N = 491) | p-value |
|---|---|---|---|
| Male, n (%) | 55 (70.5%) | 336 (68.4%) | 0.713 |
| Age, median (P25, P75) | 74 (69, 80) | 67 (59, 75) | <0.001* |
| Hypertension, n (%) | 46 (58.9%) | 291 (59.2%) | 0.961 |
| Coronary heart disease, n (%) | 20 (25.6%) | 72 (14.6%) | 0.014* |
| Diabetes, n (%) | 16 (20.5%) | 123 (25.0%) | 0.386 |
| Smoking, n (%) | 40 (51.2%) | 221 (45.0%) | 0.302 |
| Alcoholism, n (%) | 27 (34.6%) | 167 (34.0%) | 0.917 |
| Bleeding gums, n (%) | 8 (10.2%) | 47 (9.5%) | 0.849 |
| SBP, mmHg, median (P25, P75) | 173 (147, 194) | 167 (145, 186) | 0.086 |
| DBP, mmHg, median (P25, P75) | 92 (85, 105) | 94 (84, 105) | 0.715 |
| Blood glucose, mmol/L, median (P25, P75) | 98.1 (6.1, 10.6) | 8.2 (6.7, 10.5) | 0.394 |
| NIHSS score, median (P25, P75) | 14.5 (9.75, 18) | 10.0 (5, 14) | <0.001* |
| TOAST classification | 0.629 | ||
| Intracranial atherosclerosis | 50 (64.1%) | 276 (56.2%) | |
| Cardioembolism | 13 (16.6%) | 97 (19.7%) | |
| Arterial occlusive type | 10 (12.8%) | 80 (16.3%) | |
| Unexplained type | 5 (6.4%) | 38 (7.7%) | |
| Platelet, mean ± SD | 4.46 ± 0.52 | 4.61 ± 0.51 | 0.021* |
| WBC, median (P25, P75) | 8.27 (6.57, 9.70) | 7.71 (6.39, 9.98) | 0.575 |
| Monocyte, median (P25, P75) | 0.42 (0.33, 0.58) | 0.42 (0.32, 0.54) | 0.837 |
| Eosinophil, median (P25, P75) | 0.16 (0.08, 0.37) | 0.14 (0.07, 0.50) | 0.802 |
| Basophil, median (P25, P75) | 0.05 (0.03, 0.26) | 0.04 (0.03, 0.20) | 0.166 |
| Neutrophil, median (P25, P75) | 5.55 (4.27, 6.27) | 5.09 (3.81, 6.68) | 0.160 |
| Lymphocyte, median (P25, P75) | 1.81 (1.26, 2.47) | 1.88 (1.33, 2.57) | 0.208 |
| Fibrinogen, median (P25, P75) | 3.80 (2.92, 4.73) | 3.45 (3.00, 3.92) | 0.011* |
| Total protein, median (P25, P75) | 71.3 (67.5, 74.1) | 71.8 (67.8, 75.7) | 0.498 |
| Albumin, median (P25, P75) | 40.8 (38.7, 42.8) | 41.9 (39.6, 43.7) | 0.050 * |
| FAR, median (P25, P75) | 0.096 (0.0807, 0.116) | 0.081 (0.072, 0.095) | <0.001* |
| Globulin, median (P25, P75) | 30.9 (28.2, 32.8) | 30.9 (27.2, 33.2) | 0.617 |
| Triglyceride, median (P25, P75) | 1.35 (0.80, 1.77) | 1.43 (1.00, 2.12) | 0.071 |
| Cholesterol, median (P25, P75) | 4.77 (4.12, 5.34) | 4.71 (3.99, 5.29) | 0.755 |
| Low-density lipoprotein, median (P25, P75) | 2.84 (2.27, 3.28) | 2.71 (2.16, 3.28) | 0.463 |
| High-density lipoprotein, median (P25, P75) | 1.21 (0.96, 1.37) | 1.17 (0.99, 1.35) | 0.889 |
Baseline characteristics and laboratory results of patients with HT.
SBP, systolic blood pressure; DBP, diastolic blood pressure; NIHSS, National Institutes of Health Stroke Scale, WBC, white blood cells; NIHSS, National Institutes of Health Stroke Scale; FAR, fibrinogen-to-albumin ratio. Differences marked with * are statistically significant (p < 0.05).
A total of 142 patients were selected for statistical analysis using propensity score matching, with 71 patients assigned to the HT group and 71 assigned to the NHT group. No significant differences were observed between the two groups regarding confounding factors for HT, particularly age, coronary heart disease, initial NIHSS score, RBC count, FIB level, and ALB level. However, the FAR demonstrated a statistically significant difference between the two groups (OR, 1.40; 95% CI, 1.187–1.645; p < 0.001) (Table 2).
Table 2
| Variable | HT (N = 71) | NHT (N = 71) | OR(95% CI) | P-value |
|---|---|---|---|---|
| Male, n (%) | 49 (69.0%) | 21 (29.5%) | NA | 0.855 |
| Age, median (P25, P75) | 72 ± 7 | 72 ± 8 | NA | 0.504 |
| Hypertension, n (%) | 40 (56.3%) | 37 (52.1%) | NA | 0.613 |
| Coronary heart disease, n (%) | 16 (22.5%) | 19 (26.7%) | NA | 0.559 |
| Diabetes, n (%) | 16 (22.5%) | 19 (26.7%) | NA | 0.559 |
| Smoking, n (%) | 34 (47.8%) | 32 (45.2%) | NA | 0.736 |
| Alcoholism, n (%) | 23 (32.3%) | 22 (30.9%) | NA | 0.857 |
| Bleeding gums, n (%) | 8 (11.2%) | 7 (9.8%) | NA | 0.785 |
| SBP, mmHg, median (P25, P75) | 172 ± 34 | 166 ± 35 | NA | 0.288 |
| DBP, mmHg, median (P25, P75) | 91 (84, 104) | 93 (85, 103) | NA | 0.956 |
| Blood glucose, mmol/L, median (P25, P75) | 8.2 (6.6, 11.2) | 8.2 (6.4, 10.6) | NA | 0.579 |
| NIHSS score, median (P25, P75) | 14 (7, 18) | 12 (7, 19) | NA | 0.686 |
| TOAST classification | 0.898 | |||
| Intracranial atherosclerosis | 45 (63.4%) | 49 (69.0%) | ||
| Cardioembolism | 11 (15.5%) | 9 (12.7%) | ||
| Arterial occlusive type | 10 (14.1%) | 8 (11.3%) | ||
| Unexplained type | 5 (7.0%) | 5 (7.0%) | ||
| RBC, median (P25, P75) | 4.46 ± 0.52 | 4.41 ± 0.60 | NA | 0.541 |
| WBC, median (P25, P75) | 8.26 (6.61, 9.76) | 7.18 (5.91, 8.86) | NA | 0.092 |
| Monocyte, median (P25, P75) | 0.41 (0.33, 0.58) | 0.41 (0.30, 0.50) | NA | 0.299 |
| Eosinophil, median (P25, P75) | 0.16 (0.06, 0.40) | 0.13 (0.07, 1.00) | NA | 0.906 |
| Basophil, median (P25, P75) | 0.05 (0.03, 0.30) | 0.05 (0.02, 0.30) | NA | 0.802 |
| Neutrophil, median (P25, P75) | 5.55 (4.24, 6.85) | 4.79 (3.60, 6.55) | NA | 0.256 |
| Lymphocyte, median (P25, P75) | 1.81 (1.30, 2.52) | 1.76 (1.17, 2.27) | NA | 0.237 |
| Fibrinogen, median (P25, P75) | 3.70 (2.83, 4.74) | 3.48 (2.78, 4.03) | NA | 0.124 |
| Total protein, median (P25, P75) | 71.3 (67.6, 73.8) | 70.7 (65.6, 74.2) | NA | 0.412 |
| Albumin, median (P25, P75) | 40.7 (38.7, 42.1) | 41.7 (38.8, 43.5) | NA | 0.427 |
| FAR, median (P25, P75) | 0.101 (0.093, 0.117) | 0.083 (0.069, 0.100) | 1.401 (1.187–1.654) | <0.001* |
| Globulin, median (P25, P75) | 30.4 ± 3.66 | 29.52 ± 4.57 | NA | 0.109 |
| Triglyceride, median (P25, P75) | 1.43 (0.90, 1.77) | 1.29 (0.99, 1.76) | NA | 0.576 |
| Cholesterol, median (P25, P75) | 4.67 ± 0.97 | 4.51 ± 1.3 | NA | 0.407 |
| Low-density lipoprotein, median (P25, P75) | 2.79 (2.27, 3.24) | 2.79 (2.16, 3.30) | NA | 0.846 |
| High-density lipoprotein, median (P25, P75) | 1.17 ± 0.24 | 1.18 ± 0.27 | NA | 0.829 |
Baseline characteristics and laboratory results of patients with HT after propensity score matching.
SBP, systolic blood pressure; DBP, diastolic blood pressure; NIHSS, National Institutes of Health Stroke Scale, WBC, white blood cells; NIHSS, National Institutes of Health Stroke Scale; FAR, fibrinogen-to-albumin ratio. Differences marked with * are statistically significant (p < 0.05).
The ROC curve shown in Figure 2 indicates that the FAR has significant predictive value for patient prognosis. The area under the curve (AUC) was 0.75 (95% CI, 0.669–0.831; p<0.001), with an optimal cutoff value of 0.0918, yielding a sensitivity of 78.9% and a specificity of 69.0% for the FAR.
Figure 2
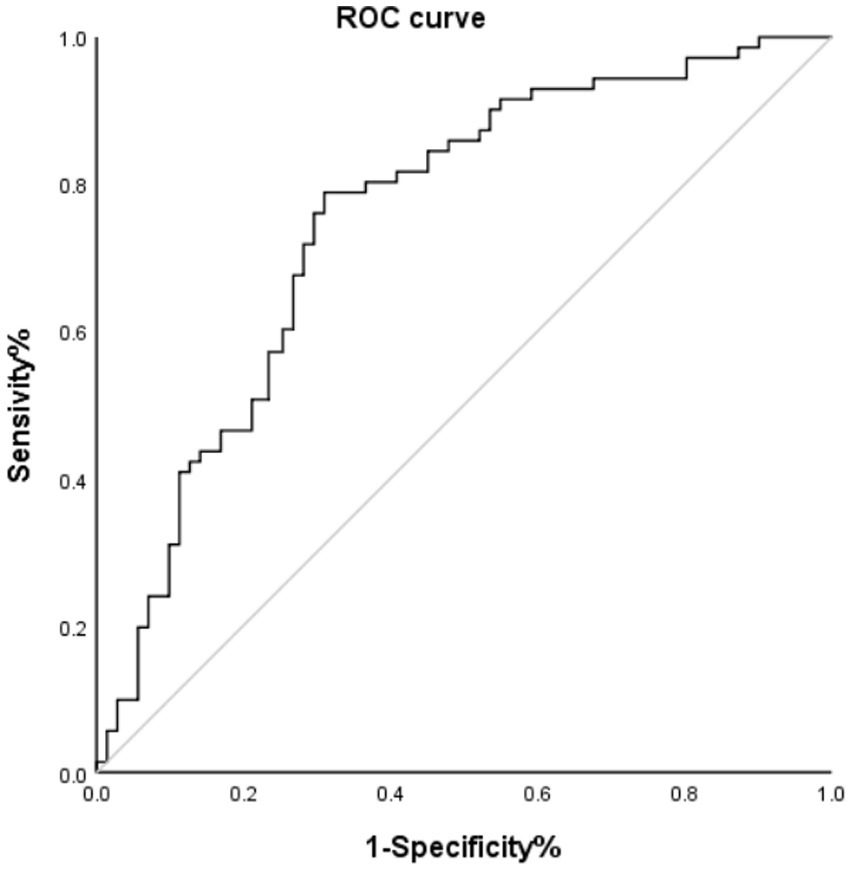
ROC curve of HT and FAR. AUC, area under the curve.
Of the 71 HT patients, 36 were diagnosed with HI and 35 with PH. Figure 3 illustrates the distribution of NHT and the FAR within HT classification. The FAR in the HI group was significantly higher than that in the NHT group (p <0.001), and similarly, the FAR in the PH group was also elevated compared to the NHT group (p = 0.002).
Figure 3

FAR violin plot. FAR, fibrinogen-to-albumin ratio; Hl, hemorrhagic infarct; HT, hemorrhagic transformation; PH, parenchymal hematoma.
Using the optimal cutoff value of 0.0918 for the FAR, the patients were stratified into a high-FAR cohort (≥ 0.0918) and a low-FAR cohort (< 0.0918). Table 3 summarizes the clinical and laboratory characteristics between these two cohorts. After adjusting for the aforementioned confounding factors, we observed that a high FAR was independently associated with HT (OR, 3.453; 95% CI, 1.539–7.743; p = 0.003).
Table 3
| Variable | Univariate analysis | Multivariate analysis | ||
|---|---|---|---|---|
| OR(95% CI) | P-value | OR(95% CI) | P-value | |
| Male, n (%) | 1.175 (0.800–1.725) | 0.411 | NA | |
| Age, median (P25, P75) | 1.034 (1.017–1.052) | <0.001* | 0.993 (0.964–1.020) | 0.617 |
| Hypertension, n (%) | 0.973 (0.481–1.881) | 0.920 | NA | |
| Coronary heart disease, n (%) | 1.290 (0.810–2.055) | 0.283 | NA | |
| Diabetes, n (%) | 1.203 (0.803–1.800) | 0.370 | NA | |
| Smoking, n (%) | 1.035 (0.727–1.473) | 0.849 | NA | |
| Alcoholism, n (%) | 0.822 (0.565–1.1978) | 0.307 | NA | |
| Bleeding gums, n (%) | 0.772 (0.415–1.438) | 0.415 | NA | |
| SBP, mmHg, median (P25, P75) | 0.998 (0.993–1.004) | 0.515 | NA | |
| DBP, mmHg, median (P25, P75) | 1.002 (0.992–1.012) | 0.723 | NA | |
| Blood glucose, mmol/L, median (P25, P75) | 1.030 (0.986–1.077) | 0.184 | NA | |
| NIHSS score, median (P25, P75) | 1.037 (1.014–1.061) | 0.002* | 1.003 (0.966–1.042) | 0.856 |
| TOAST classification | 0.141 | NA | ||
| Intracranial atherosclerosis | 1.278 (0.386–3.061) | |||
| Cardioembolism | 1.331 (0.502–3.517) | |||
| Arterial occlusive type | 1.363 (0.494–3.756) | |||
| Unexplained type | 1.094 (0.303–4.016) | |||
| RBC, median (P25, P75) | 0.491 (0.350–0.690) | <0.001* | 0.978 (0.554–1.724) | 0.938 |
| WBC, median (P25, P75) | 1.040 (0.982–1.101) | 0.183 | NA | |
| Monocyte, median (P25, P75) | 1.071 (0.810–1.415) | 0.632 | NA | |
| Eosinophil, median (P25, P75) | 0.976 (0.849–1.121) | 0.728 | NA | |
| Basophil, median (P25, P75) | 0.697 (0.289–1.683) | 0.422 | NA | |
| Neutrophil, median (P25, P75) | 1.045 (0.982–1.112) | 0.168 | NA | |
| Lymphocyte, median (P25, P75) | 0.930 (0.796–1.085) | 0.355 | NA | |
| Fibrinogen, median (P25, P75) | 11.778 (7.608–18.232) | <0.001* | 15.670 (9.220–26.632) | <0.001* |
| Total protein, median (P25, P75) | 0.971 (0.945–0.997) | 0.027* | 1.006 (0.879–1.152) | 0.928 |
| Albumin, median (P25, P75) | 0.753 (0.703–0.806) | <0.001* | 0.692 (0.579–0.826) | <0.001* |
| HT, n (%) | 3.488 (2.136–5.696) | <0.001* | 3.453 (1.539–7.743) | 0.003* |
| Globulin, median (P25, P75) | 1.059 (1.024–1.096) | 0.001* | 1.009 (0.872–1.168) | 0.904 |
| Triglyceride, median (P25, P75) | 0.901 (0.800–1.015) | 0.086 | NA | |
| Cholesterol, median (P25, P75) | 1.089 (0.939–1.262) | 0.258 | NA | |
| Low-density lipoprotein, median (P25, P75) | 1.213 (1.006–1.470) | 0.053 | NA | |
| High-density lipoprotein, median (P25, P75) | 0.491 (0.264–0.913) | 0.025* | 1.665 (0.676–4.099) | 0.267 |
Baseline characteristics and laboratory results of patients in the low (≤0.0918) and high (>0.0918) FAR groups.
SBP, systolic blood pressure; DBP, diastolic blood pressure; NIHSS, National Institutes of Health Stroke Scale; WBC, white blood cells; NIHSS, National Institutes of Health Stroke Scale; FAR, fibrinogen-to-albumin ratio. Differences marked with * are statistically significant (p < 0.05).
4 Discussion
Multiple pathophysiological mechanisms contribute to the occurrence of HT in patients with AIS who receive IVT. However, previous studies have rarely focused on the prognostic potential of serum biomarkers. Our study revealed that the baseline FAR was significantly higher in patients with HT after intravenous thrombolysis compared to those without HT (p < 0.001). After adjusting for potential confounding variables using PSM, the FAR remained an independent predictor of HT. Our study identified the optimal threshold value of the FAR for predicting the occurrence of HT as 0.0918 (with a sensitivity of 78.9% and specificity of 69.0%). Currently, studies exploring the association between the FAR and HT after intravenous thrombolysis in stroke patients appear to be limited to those by Ruan et al. (17) and Yang et al. (18). However, both studies have methodological limitations. Although they attempted to control for confounding factors to some extent, they might still have overlooked important variables, which limits the veracity and reliability of their findings. In contrast, our study used PSM analysis to balance the effects of confounding factors and to simulate the effects of randomized controlled trials, thereby enhancing the accuracy of the results. Furthermore, our ROC curve also showed better sensitivity, specificity, and AUC values. Collectively, these findings highlight the FAR as a clinically actionable biomarker for stratifying the risk of HT in IVT-eligible AIS populations.
FIB, a dual-function protein involved in acute inflammatory responses and coagulation cascades, plays a critical role in platelet aggregation, fibrin formation, and dissolution. Elevated levels of FIB are known to disrupt the blood–brain barrier (19, 20), leading to neuroinflammation and neuronal damage. Conversely, the use of FIB-reducing treatments in AIS patients has shown promise in reducing neurological impairment and enhancing quality of life (21, 22). FIB plays a role in systemic inflammatory responses by regulating fibrin production and activating signaling pathways upon binding to microglia/macrophage receptors, thereby promoting inflammation. This, in turn, is associated with blood–brain barrier breakdown and brain injury (15, 23, 24). Mechanistically, ischemic stroke induces the upregulation of pro-inflammatory cytokines, particularly interleukin-6 (IL-6), which stimulates fibrinogen overexpression (25, 26). Concomitantly, increased levels of FIB and the activation of extracellular matrix proteolytic enzymes, particularly matrix metalloproteinases, contribute to extracellular matrix degradation and disrupt tight endothelial cell connections (26, 27). Ultimately, as a key component of the perivascular extracellular matrix, FIB modulates cerebrovascular endothelial cell permeability, thereby increasing blood–brain barrier permeability (28).
In contrast to prothrombotic biomarkers, ALB exhibits a neuroprotective effect that mitigates the risk of HT. First, ALB acts as a specific inhibitor of endothelial cell apoptosis and a major antioxidant, reducing the permeability of the blood–brain barrier. Second, it curtails the inflammatory response by suppressing the adhesion of white blood cells in microcirculation. Third, due to its high molecular weight, serum albumin decreases the blood–brain barrier permeability (29). In summary, ALB plays a vital role in the protection of the nervous system (30, 31). Yang et al. (18) proposed that ALB serves as a protective factor against HT following intravenous thrombolysis (OR, 0.907; 95% confidence interval, 0.859–0.957; p < 0.001). Multicenter studies have shown that elevated ALB levels are associated with favorable nerve recovery, reduced cerebral infarction volume, and alleviated cerebral edema (32, 33).
The FAR, an emerging thromboinflammatory biomarker, has been proposed and documented (34). Mechanistically, the synergistic combination of FIB and ALB outperforms individual biomarkers in predicting post-thrombolysis HT, due to their counterregulatory biological interactions. An increase in the FAR signifies either heightened FIB levels or reduced ALB levels. The interplay between ALB and FIB may inhibit FIB activity, mitigating fibrin accumulation (35). This suppression cascade indirectly diminishes the likelihood of FIB transforming into fibrin, thereby reducing the probability of inflammatory factor release and, consequently, decreasing the risk of blood–brain barrier damage. Our results corroborate seminal findings (17), indicating that an elevated FAR before thrombolysis is independently correlated with the occurrence of HT and increases the risk of HT. A higher FAR signifies an intensified inflammatory state, leading to the breakdown of blood–brain barrier and a higher incidence of HT. Individuals with a higher FAR exhibit higher 90-day mortality rates and poorer functional recovery.
This study has several limitations that warrant consideration. First, as a retrospective single-center analysis, the design was inherently vulnerable to confirmation bias and potential selection bias, which might have affected the generalizability of the findings. Second, the FAR exhibits temporal variability, and since it was measured only once in the included studies, this might have introduced observational inaccuracies. Third, the analysis incorporated only a limited panel of laboratory parameters, potentially overlooking other clinically relevant biomarkers that could modulate outcomes. Fourth, individual variations in the FAR may arise from environmental factors and heterogeneous physiological responses, complicating the standardized interpretation of the results. Fifth, neurofunctional prognosis must also be considered. To address these limitations, it is necessary for further prospective studies to thoroughly evaluate the dynamic changes in the FAR and its predictive value for HT.
5 Conclusion
In conclusion, the FAR emerges as a valuable predictor of HT following intravenous thrombolysis in patients with ischemic stroke. An elevated FAR is strongly associated with an augmented risk of HT following intravenous thrombolysis.
Statements
Data availability statement
The studies involving humans were approved by the Ethics Committee of the First Affiliated Hospital of Jinzhou Medical University. The studies were conducted in accordance with the local legislation and institutional requirements. Written informed consent for participation was not required from the participants or the participants’ legal guardians/next of kin in accordance with the national legislation and institutional requirements.
Ethics statement
The studies involving humans were approved by the First64 Affiliated Hospital of Jinzhou Medical University. The studies were conducted in accordance with the local legislation and institutional requirements. Written informed consent for participation was not required from the participants or the participants’ legal guardians/next of kin in accordance with the national legislation and institutional requirements.
Author contributions
X-YL: Conceptualization, Data curation, Investigation, Methodology, Project administration, Supervision, Writing – original draft, Writing – review & editing. H-YJ: Data curation, Investigation, Software, Supervision, Writing – review & editing. GW: Conceptualization, Data curation, Investigation, Methodology, Supervision, Writing – review & editing.
Funding
The author(s) declare that no financial support was received for the research and/or publication of this article.
Conflict of interest
The authors declare that the research was conducted in the absence of any commercial or financial relationships that could be construed as a potential conflict of interest.
Publisher’s note
All claims expressed in this article are solely those of the authors and do not necessarily represent those of their affiliated organizations, or those of the publisher, the editors and the reviewers. Any product that may be evaluated in this article, or claim that may be made by its manufacturer, is not guaranteed or endorsed by the publisher.
References
1.
Feigin VL Brainin M Norrving B Martins S Sacco RL Hacke W et al . World stroke organization (WSO): global stroke fact sheet 2022. Int J Stroke. (2022) 17:18–29. doi: 10.1177/17474930211065917
2.
Ma G Pan Z Kong L Du G . Neuroinflammation in hemorrhagic transformation after tissue plasminogen activator thrombolysis: potential mechanisms, targets, therapeutic drugs and biomarkers. Int Immunopharmacol. (2021) 90:107216. doi: 10.1016/j.intimp.2020.107216
3.
Liu C Xie J Sun S Li H Li T Jiang C et al . Hemorrhagic transformation after tissue plasminogen activator treatment in acute ischemic stroke. Cell Mol Neurobiol. (2022) 42:621–46. doi: 10.1007/s10571-020-00985-1
4.
Lindley RI Wardlaw JM Sandercock PA Rimdusid P Lewis SC Signorini DF et al . Frequency and risk factors for spontaneous hemorrhagic transformation of cerebral infarction. J Stroke Cerebrovasc Dis. (2004) 13:235–46. doi: 10.1016/j.jstrokecerebrovasdis.2004.03.003
5.
Bracard S Ducrocq X Mas JL Soudant M Oppenheim C Moulin T et al . Mechanical thrombectomy after intravenous alteplase versus alteplase alone after stroke (THRACE): a randomised controlled trial. Lancet Neurol. (2016) 15:1138–47. doi: 10.1016/S1474-4422(16)30177-6
6.
Hao Y Yang D Wang H Zi W Zhang M Geng Y et al . Predictors for symptomatic intracranial hemorrhage after endovascular treatment of acute ischemic stroke. Stroke. (2017) 48:1203–9. doi: 10.1161/STROKEAHA.116.016368
7.
Kim EY Na DG Kim SS Lee KH Ryoo JW Kim HK . Prediction of hemorrhagic transformation in acute ischemic stroke: role of diffusion-weighted imaging and early parenchymal enhancement. AJNR Am J Neuroradiol. (2005) 26:1050–5. PMID:
8.
Jin R Yang G Li G . Molecular insights and therapeutic targets for blood-brain barrier disruption in ischemic stroke: critical role of matrix metalloproteinases and tissue-type plasminogen activator. Neurobiol Dis. (2010) 38:376–85. doi: 10.1016/j.nbd.2010.03.008
9.
Pikija S Trkulja V Mutzenbach JS McCoy MR Ganger P Sellner J . Fibrinogen consumption is related to intracranial clot burden in acute ischemic stroke: a retrospective hyperdense artery study. J Transl Med. (2016) 14:250. doi: 10.1186/s12967-016-1006-6
10.
Cho YM Choi IS Bian RX Kim JH Han JY Lee SG . Serum albumin at admission for prediction of functional outcome in ischaemic stroke patients. Neurol Sci. (2008) 29:445–9. doi: 10.1007/s10072-008-1024-0
11.
Fang L Yan FH Liu C Chen J Wang D Zhang CH et al . Systemic inflammatory biomarkers, especially fibrinogen to albumin ratio, predict prognosis in patients with pancreatic cancer. Cancer Res Treat. (2021) 53:131–9. doi: 10.4143/crt.2020.330
12.
Liang Y Wang W Que Y Guan Y Xiao W Fang C et al . Prognostic value of the fibrinogen/albumin ratio (FAR) in patients with operable soft tissue sarcoma. BMC Cancer. (2018) 18:942. doi: 10.1186/s12885-018-4856-x
13.
Hizli O Cayir S Coluk Y Kayabasi S Yildirim G . The novel indicators of moderate to severe sleep apnea: fibrinogen to albumin ratio vs. CRP to albumin ratio. Eur Arch Otorrinolaringol. (2021) 278:851–5. doi: 10.1007/s00405-019-05770-5
14.
Warner JJ Harrington RA Sacco RL Elkind M . Guidelines for the early management of patients with acute ischemic stroke: 2019 update to the 2018 guidelines for the early management of acute ischemic stroke. Stroke. (2019) 50:3331–2. doi: 10.1161/STROKEAHA.119.027708
15.
Kim JT Park MS Choi KH Kim BJ Han MK Park TH et al . Clinical outcomes of posterior versus anterior circulation infarction with low National Institutes of Health stroke scale scores. Stroke. (2017) 48:55–62. doi: 10.1161/STROKEAHA.116.013432
16.
Hacke W Kaste M Fieschi C von Kummer R Davalos A Meier D et al . Randomised double-blind placebo-controlled trial of thrombolytic therapy with intravenous alteplase in acute ischaemic stroke (ECASS II). Second European-Australasian acute stroke study investigators. Lancet. (1998) 352:1245–51. doi: 10.1016/s0140-6736(98)08020-9
17.
Ruan Y Yuan C Liu Y Zeng Y Cheng H Cheng Q et al . High fibrinogen-to-albumin ratio is associated with hemorrhagic transformation in acute ischemic stroke patients. Brain Behav. (2021) 11:e01855. doi: 10.1002/brb3.1855
18.
Yang M Tang L Bing S Tang X . Association between fibrinogen-to-albumin ratio and hemorrhagic transformation after intravenous thrombolysis in ischemic stroke patients. Neurol Sci. (2023) 44:1281–8. doi: 10.1007/s10072-022-06544-4
19.
Machlus KR Cardenas JC Church FC Wolberg AS . Causal relationship between hyperfibrinogenemia, thrombosis, and resistance to thrombolysis in mice. Blood. (2011) 117:4953–63. doi: 10.1182/blood-2010-11-316885
20.
Davalos D Akassoglou K . Fibrinogen as a key regulator of inflammation in disease. Semin Immunopathol. (2012) 34:43–62. doi: 10.1007/s00281-011-0290-8
21.
Guo Y Zuo YF Wang QZ Tang BS Li FK Sun Y . Meta-analysis of defibrase in treatment of acute cerebral infarction. Chin Med J. (2006) 119:662–8. doi: 10.1097/00029330-200604020-00010
22.
Chen J Sun D Liu M Zhang S Ren C . Defibrinogen therapy for acute ischemic stroke: 1332 consecutive cases. Sci Rep. (2018) 8:9489. doi: 10.1038/s41598-018-27856-6
23.
Petersen MA Ryu JK Akassoglou K . Fibrinogen in neurological diseases: mechanisms, imaging and therapeutics. Nat Rev Neurosci. (2018) 19:283–301. doi: 10.1038/nrn.2018.13
24.
Davalos D Ryu JK Merlini M Baeten KM Le Moan N Petersen MA et al . Fibrinogen-induced perivascular microglial clustering is required for the development of axonal damage in neuroinflammation. Nat Commun. (2012) 3:1227. doi: 10.1038/ncomms2230
25.
Armulik A Genové G Mäe M Nisancioglu MH Wallgard E Niaudet C et al . Pericytes regulate the blood-brain barrier. Nature. (2010) 468:557–61. doi: 10.1038/nature09522
26.
Wang W Li M Chen Q Wang J . Hemorrhagic transformation after tissue plasminogen activator reperfusion therapy for ischemic stroke: mechanisms, models, and biomarkers. Mol Neurobiol. (2015) 52:1572–9. doi: 10.1007/s12035-014-8952-x
27.
Muradashvili N Tyagi N Tyagi R Munjal C Lominadze D . Fibrinogen alters mouse brain endothelial cell layer integrity affecting vascular endothelial cadherin. Biochem Biophys Res Commun. (2011) 413:509–14. doi: 10.1016/j.bbrc.2011.07.133
28.
Lominadze D Dean WL Tyagi SC Roberts AM . Mechanisms of fibrinogen-induced microvascular dysfunction during cardiovascular disease. Acta Physiol (Oxf). (2010) 198:1–13. doi: 10.1111/j.1748-1716.2009.02037.x
29.
Idicula TT Waje-Andreassen U Brogger J Naess H Thomassen L . Serum albumin in ischemic stroke patients: the higher the better. The Bergen Stroke Study. Cerebrovasc Dis. (2009) 28:13–7. doi: 10.1159/000215938
30.
Park H Hong M Jhon GJ Lee Y Suh M . Repeated oral administration of human serum albumin Protects from the cerebral ischemia in rat brain following MCAO. Exp Neurobiol. (2017) 26:151–7. doi: 10.5607/en.2017.26.3.151
31.
Prajapati KD Sharma SS Roy N . Current perspectives on potential role of albumin in neuroprotection. Rev Neurosci. (2011) 22:355–63. doi: 10.1515/RNS.2011.028
32.
Palesch YY Hill MD Ryckborst KJ Tamariz D Ginsberg MD . The ALIAS pilot trial: a dose-escalation and safety study of albumin therapy for acute ischemic stroke--II: neurologic outcome and efficacy analysis. Stroke. (2006) 37:2107–14. doi: 10.1161/01.STR.0000231389.34701.b5
33.
Ginsberg MD Hill MD Palesch YY Ryckborst KJ Tamariz D . The ALIAS pilot trial: a dose-escalation and safety study of albumin therapy for acute ischemic stroke--I: physiological responses and safety results. Stroke. (2006) 37:2100–6. doi: 10.1161/01.STR.0000231388.72646.05
34.
Acharya P Jakobleff WA Forest SJ Chinnadurai T Mellas N Patel SR et al . Fibrinogen albumin ratio and ischemic stroke during venoarterial extracorporeal membrane oxygenation. ASAIO J. (2020) 66:277–82. doi: 10.1097/MAT.0000000000000992
35.
Galanakis DK . Anticoagulant albumin fragments that bind to fibrinogen/fibrin: possible implications. Semin Thromb Hemost. (1992) 18:44–52. doi: 10.1055/s-2007-1002409
Summary
Keywords
ischemic stroke, intravenous thrombolysis, hemorrhagic transformation, fibrinogen, albumin
Citation
Liu X-Y, Jia H-Y and Wang G (2025) Predictive value of the fibrinogen-to-albumin ratio for hemorrhagic transformation following intravenous thrombolysis in ischemic stroke: a retrospective propensity score-matched analysis. Front. Neurol. 16:1465508. doi: 10.3389/fneur.2025.1465508
Received
16 July 2024
Accepted
16 April 2025
Published
01 May 2025
Volume
16 - 2025
Edited by
Asaf Honig, Soroka Medical Center, Israel
Reviewed by
Mohamed Hamed, Mansoura University, Egypt
Yao Yu, The Affiliated Hospital of Qingdao University, China
Updates
Copyright
© 2025 Liu, Jia and Wang.
This is an open-access article distributed under the terms of the Creative Commons Attribution License (CC BY). The use, distribution or reproduction in other forums is permitted, provided the original author(s) and the copyright owner(s) are credited and that the original publication in this journal is cited, in accordance with accepted academic practice. No use, distribution or reproduction is permitted which does not comply with these terms.
*Correspondence: Gang Wang, wangg12023@163.com
Disclaimer
All claims expressed in this article are solely those of the authors and do not necessarily represent those of their affiliated organizations, or those of the publisher, the editors and the reviewers. Any product that may be evaluated in this article or claim that may be made by its manufacturer is not guaranteed or endorsed by the publisher.