Abstract
Background:
Myelin oligodendrocyte glycoprotein antibody-associated disease (MOGAD) is an inflammatory demyelinating disease of the central nervous system with a serious, debilitating presentation, including residual disability after relapses.
Objectives:
To evaluate the economic impacts of MOGAD and analogous conditions, including direct costs, indirect costs and cost drivers.
Design:
Systematic literature search and narrative review.
Data sources and methods:
Search strings were designed to capture any study reporting health economic impacts of MOGAD or analogous autoimmune diseases of the nervous system. The costs of diagnostic tests and short- and long-term interventions were considered, and studies from both patient and institutional (public and private) perspectives were included. Searches were conducted using medical subject headings (MeSH) in PubMed in July 2023. Retrieved publications were screened initially based on title and abstract, then based on the full text. Data were extracted manually; findings are reported descriptively. All cost data were adjusted to 2024 US Dollars using the CCEMG-EPPI-Centre Cost Converter.
Results:
Results from 40 studies of MOGAD and analogous autoimmune neurological conditions were extracted. In the only study that included patients with MOGAD (a cost investigation from Germany in which 166 patients had neuromyelitis optica spectrum disorder and 46 had MOGAD), the mean annualised cost of illness was $94,688 (direct medical costs 43%, direct non-medical costs 34%, indirect costs 23%). Across the conditions assessed, the annual total cost of illness per patient ranged widely, from $3,690 to $507,117 (among studies that reported types of cost, the range for direct costs was $1,981–$148,388; for indirect costs, $0–$942,707). The study that included patients with MOGAD identified the need for care, number of acute attacks, unemployment and disability as independent predictors of cost. Additional cost drivers (from all the conditions) included treatments (e.g., intravenous immunoglobulin), hospitalisation, disease severity, relapses and refractory disease.
Conclusion:
Our search identified only one study that specifically examined costs associated with MOGAD. Results from this and studies of analogous autoimmune conditions suggest that inflammatory demyelinating diseases of the central nervous system including MOGAD are costly for the individual patient and place considerable burden on healthcare systems. Further evidence is needed for increased insight into the economic burden of MOGAD.
Introduction
Myelin oligodendrocyte glycoprotein antibody-associated disease (MOGAD) is an inflammatory demyelinating disease of the central nervous system (CNS) (1, 2). MOGAD has some symptom overlap with other neuroinflammatory disorders such as multiple sclerosis (MS) and neuromyelitis optica spectrum disorder (NMOSD) but there are important differences between these diseases in pathophysiology, prognosis and treatment response (1–4). Accurate and timely diagnosis of MOGAD is therefore needed to ensure that patients receive optimal therapy and minimise the risk of hospitalisation due to potentially preventable disease symptoms. This requires a standardised approach with thorough consideration of the clinical presentation and history along with the findings of serological tests and intracranial and spinal imaging (3–6). Knowledge and understanding of MOGAD have increased in recent years, allowing the development of an antibody test, unique international classification of diseases code (ICD-10-CM code G37.81) and updated diagnostic criteria (1, 2, 7, 8). Although ICD coding is not universally implemented, these developments should help enable gradual improvement in the patient pathway to diagnosis and treatment, which at present can be lengthy and challenging (9). Already they have paved the way for increased attention to the management of MOGAD. Understanding the direct and indirect costs associated with the disease and its treatment will benefit healthcare systems and will be important for determining the cost-effectiveness of future candidate treatments.
Despite being a rare disease, MOGAD is expected to represent a substantial economic burden; it has a serious debilitating presentation, with residual disability after relapses. Patients may present with one or more of optic neuritis, myelitis, acute disseminated encephalomyelitis (ADEM), cerebral mono-focal or multifocal deficits, brainstem or cerebellar syndromes or cerebral cortical encephalitis (1, 2, 10). Symptomatic attacks may be attributable to inflammation of the optic nerve, spinal cord or brain (11). Symptoms include loss of vision, eye pain, headaches, confusion, muscular stiffness or weakness, changes in bowel, bladder or sexual function, and seizures (11). Unlike MS, neurological deterioration in MOGAD does not usually progress without relapses, suggesting there is potential for effective treatment to reduce the accumulation of disability (1, 7).
The economic burden is likely to differ according to the nature of the clinical manifestation, the nerve region(s) impacted and the severity, number and frequency of attacks. Misdiagnoses and delayed treatment also play a role, as the heterogeneous presentations of MOGAD are not well recognised. The mean age of MOGAD onset is 28–30 years; however, approximately 30% of individuals with MOGAD are children (10). As a result, disability and sight loss can last for decades and the full economic impact is not known (1, 2).
There are currently no approved treatments for MOGAD. Clinical trials focused specifically on patients with MOGAD are currently ongoing. At present, treatment approaches to MOGAD in clinical practice are similar to those applied to other inflammatory demyelinating diseases. Case reports show that high-dose methylprednisolone (MP), intravenous immunoglobulin (IVIg) and plasma exchange are used to manage acute attacks, while methotrexate, azathioprine, corticosteroids, rituximab, IVIg and mycophenolate mofetil may be considered for maintenance therapy (2, 12, 13).
Given the current lack of evidence relating specifically to MOGAD, data from other antibody-mediated diseases where immunosuppression is commonly used to reduce inflammation and prevent relapse might provide greater insight. This decision was based on international recognition of extrapolation from related diseases as an acceptable approach to facilitate the approval of new medicines for rare diseases (14–17). We conducted a systematic literature search and here provide a narrative review of the economic impact of MOGAD. We included publications on autoimmune neurological conditions with similar clinical presentations or where similar treatments are used.
Methods
A systematic literature search was designed to gather information on the health economic impacts of MOGAD and analogous conditions. This narrative review aligned with the Preferred Reporting Items for Systematic Reviews and Meta-Analysis (PRISMA) guidelines (18).
Eligibility criteria
We selected any publication that presented the health economic impacts of MOGAD or analogous conditions as selected by the review team for inclusion (see author contributions for detail). Analogous conditions were selected based on comparison with MOGAD in terms of (a) clinical presentation, (b) treatments used in management, (c) pathophysiology and (d) incidence/prevalence; that is, they were autoimmune diseases of the nervous system with sufficient similarity in clinical presentation or management to MOGAD. Publications on MS were not included because of the higher prevalence and more mature treatment landscape of MS compared with MOGAD. Publications that did not specify a monetary amount but described predictors of cost (i.e., cost drivers) were eligible for inclusion. Exclusion criteria were as follows: non-English full text; lack of cost data for MOGAD or analogous condition (e.g., cost estimates spanning multiple neuroimmunological conditions); and data derived from cost modelling (e.g., Markov models) rather than true cost calculations. For hospitalisation costs, data relating to diagnostic costs alone were not included. Studies without annualised estimates were only included if drivers of cost were extractable.
Information sources
The search was performed in PubMed on 14 July 2023 using medical subject headings (MeSH) and keywords for journals published between 2000 and 2022.
Search strategy
The complete search strings, which include terms for cost analysis, economics, expenditure and expenses, are shown in Supplementary Table 1.
Selection process
A reviewer (LL) undertook initial screening of the titles and abstracts; any uncertainty when applying the eligibility criteria was mediated by two other independent reviewers. The same reviewer (LL) then screened the full-text publications, with the references of included studies further assessed for inclusion eligibility. Data (cost estimates and driver data) were manually extracted after eligibility screening was completed.
Data collection process and data items
Economic impacts included cost considerations from the patient or institutional (public or private) perspective, and costs associated with all stages of the patient journey. Diagnostic work-up, short-term interventions to aid recovery from an attack (e.g., hospitalisation, plasma exchange) and the management of long-term disability (e.g., carer costs, loss of income, support group services) were all considered. Reported costs were divided into direct costs, which denote those related to managing the condition in both the acute and the chronic setting, and indirect costs. The exhaustive list of considerations for direct costs included hospitalisation fees, post-discharge specialist fees, travel expenses for patients and caregivers, medication/diagnostic fees, at-home health services and support groups. For indirect costs, this study included morbidity (i.e., loss of productivity) and mortality (i.e., premature death from the illness). Mean annual costs per patient were extracted from each publication. Median costs were used where means were not available, and simple calculations were performed where needed to determine the annual cost per patient (e.g., when data were presented as monthly costs), and p-values for relevant comparisons were also extracted. No new statistical analyses were conducted. To ensure comparability, all reported costs were adjusted to 2024 US Dollars using the CCEMG-EPPI-Centre Cost Converter (19). The International Monetary Fund was used as the source dataset for purchasing power parities. If a cost year range was provided, the latter year was used for standardisation. If no cost year was provided, the publication year was used for standardisation. If the reporting country using Euros was not specified or if a pan-Europe study was conducted, Belgium was selected as the original study country. We referred to PRISMA in the reporting of our literature search, although owing to the range of conditions and study designs included, the literature search findings are summarised as a narrative review, and therefore not all PRISMA items were relevant.
Results
Literature search results
The search yielded 512 records, of which 443 were excluded during screening of the titles and abstracts. Of the remaining 69 records, 29 were excluded after full-text review with reasons presented in Figure 1. Results from the remaining 40 studies were extracted and tabulated.
Figure 1
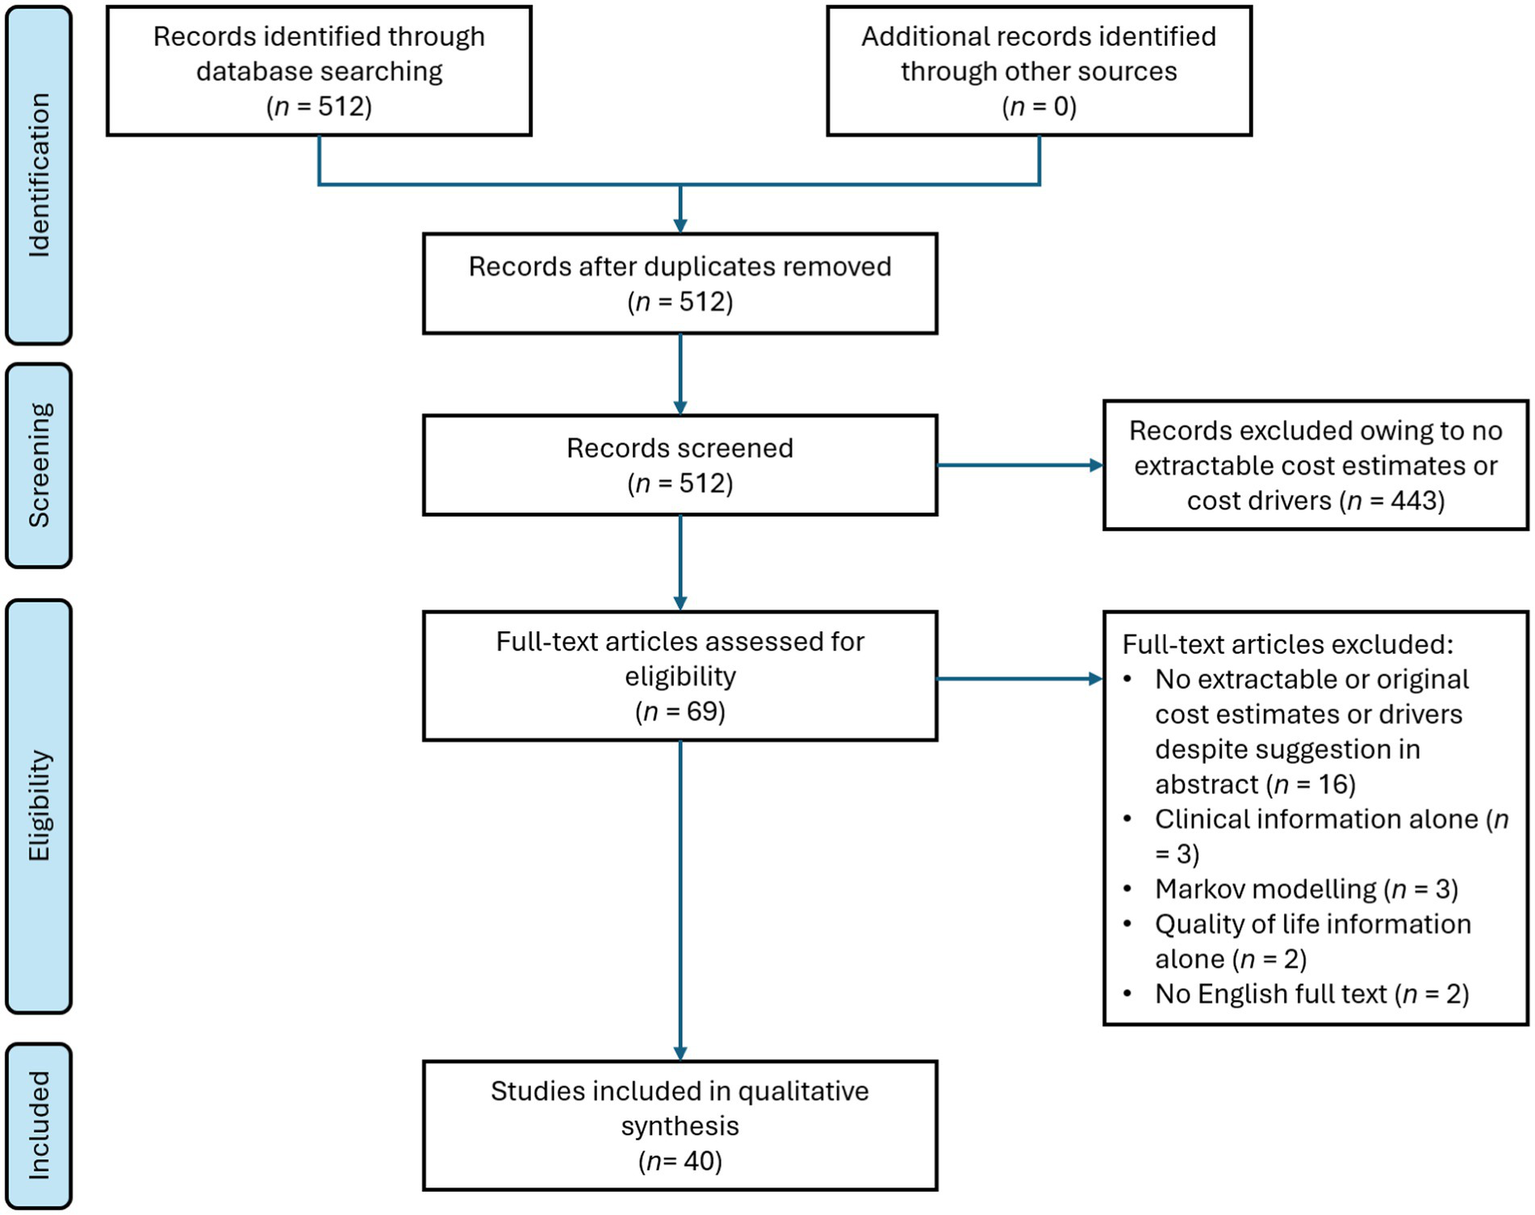
Flow chart of the systematic literature search in this study.
Information on the methods, size and scope of the 40 included studies is provided in Figure 2 and Supplementary Table 2. In total, 76,255 patients were included, with all except four studies involving <2,000 patients (the four exceptions included 2,805, 3,341, 5,473 and 54,778 patients) (20–23). Most studies (n = 23) were cost analyses or cost-of-illness studies, four were cost minimisation analyses and there were four healthcare resource use studies. Fourteen of the studies were retrospective and 18 were non-comparative; there were four case–control studies but no randomised controlled trials. All studies except two were from a single country, and the countries with the largest numbers of studies were the USA, China, Germany and the UK. There were three studies each from India, Italy and the Netherlands, and additional countries in South America, Europe and Asia were represented by one or two studies only (the two international studies are included in these numbers). Most studies (n = 32) were from countries classified by the World Bank as high income; five were from countries with upper-middle incomes, two were from lower-middle income countries and one international study included countries of all four income levels (24).
Figure 2
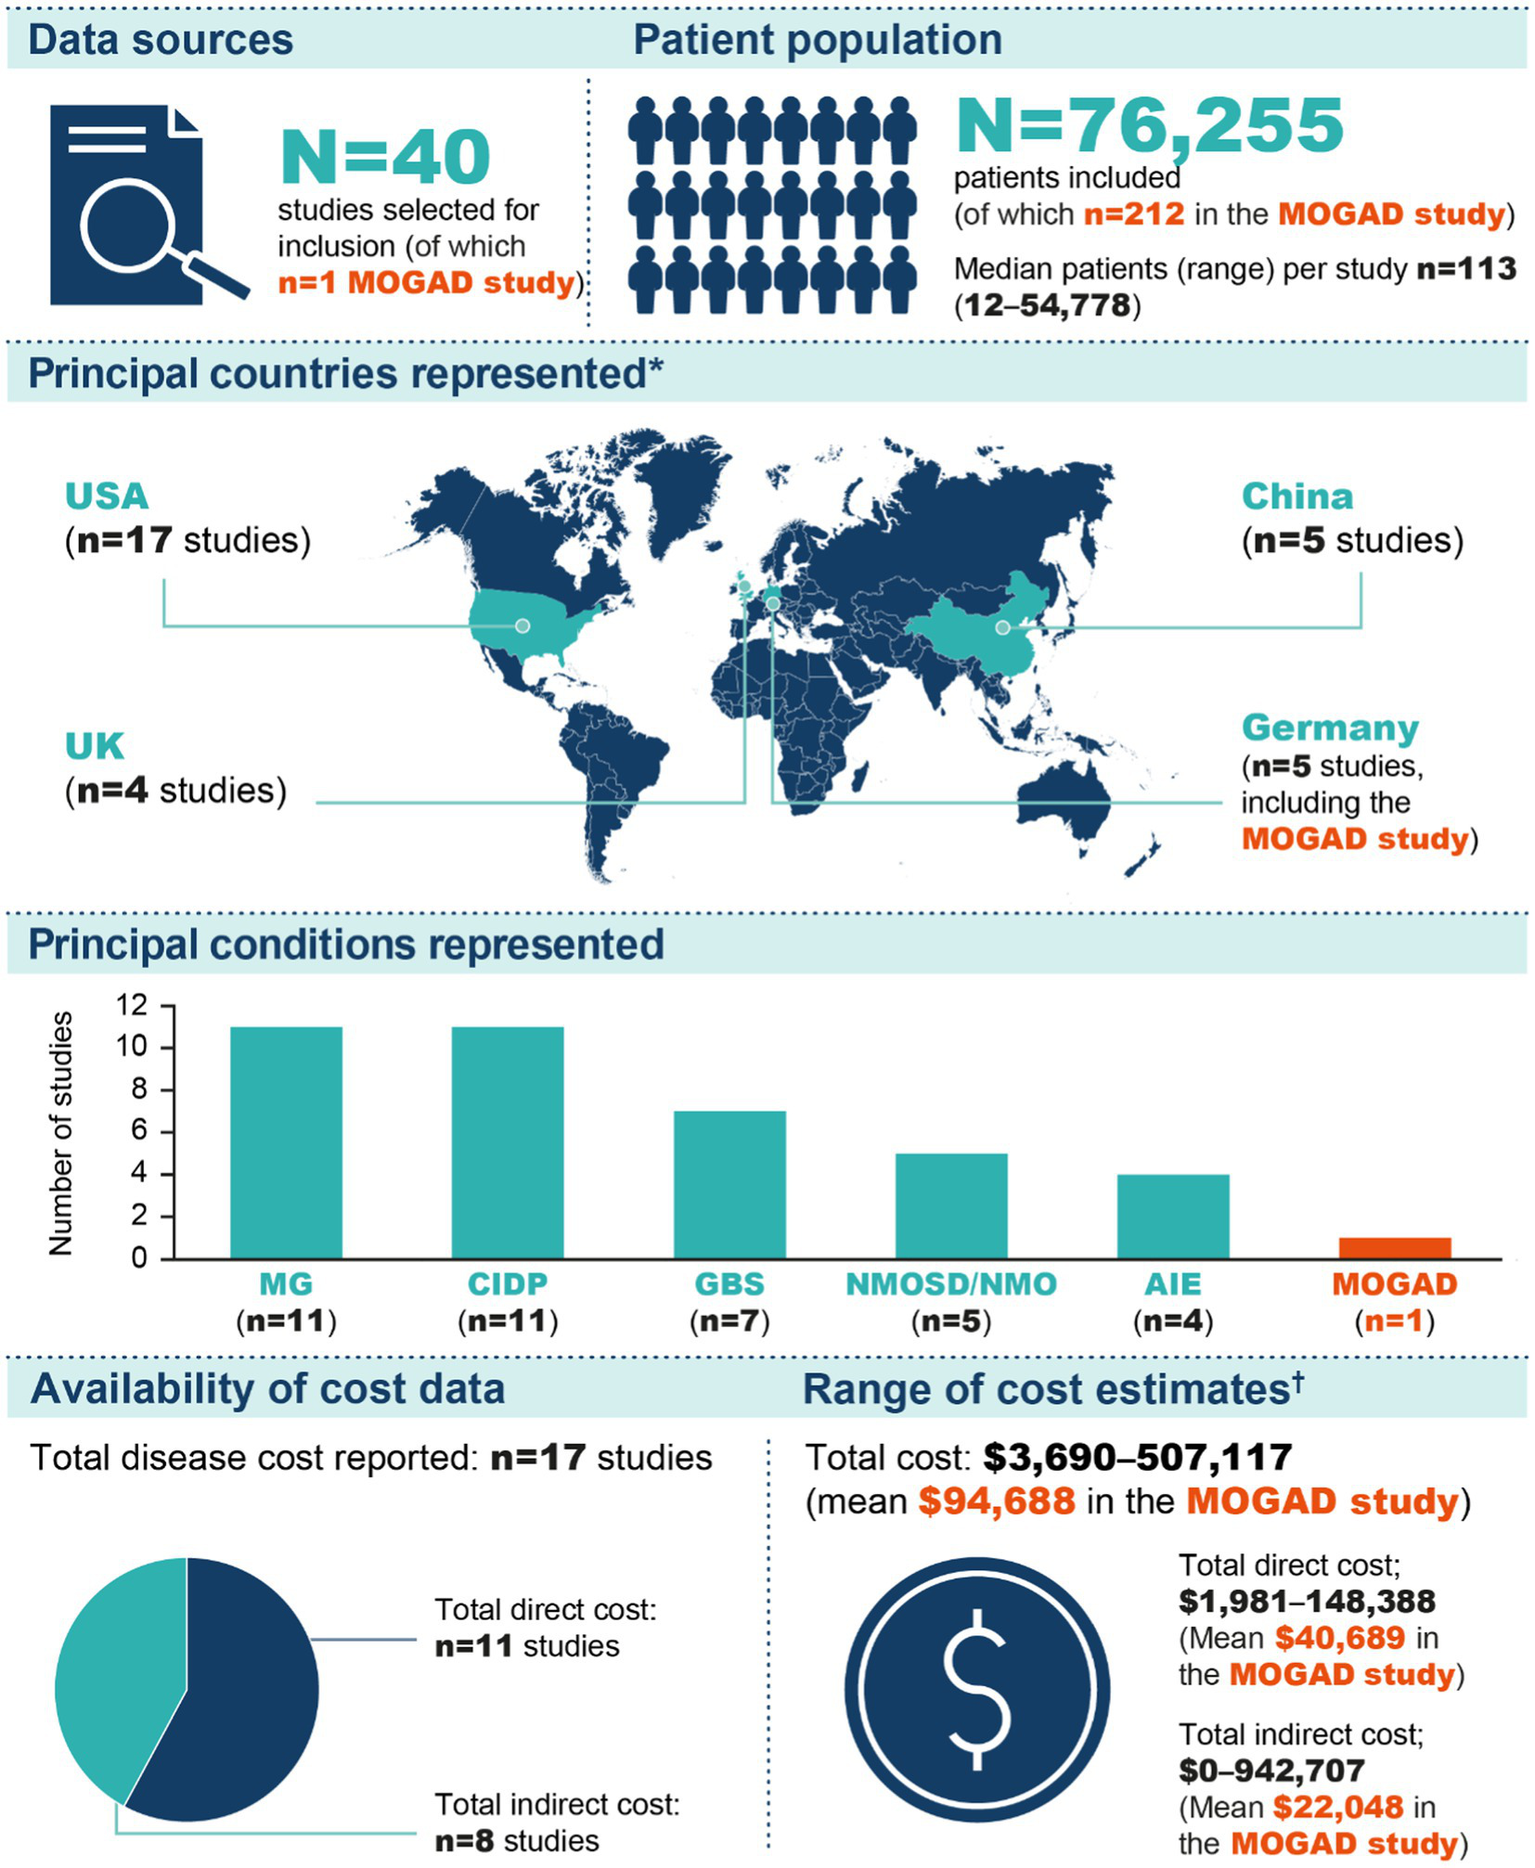
Summarised results of the literature search. *The numbers shown include one study conducted in Belgium, Czech Republic, Greece, Italy, Netherlands, Spain and the UK (52) and one study conducted on a global basis (40); all other studies were conducted in a single country. †The three cost categories shown are not mutually exclusive (i.e., numerous studies contributed data to more than one category). AIE, autoimmune encephalitis; CIDP, chronic inflammatory demyelinating polyneuropathy; GBS, Guillain–Barré syndrome; MG, myasthenia gravis; MOGAD, myelin oligodendrocyte glycoprotein antibody-associated disease; NMO, neuromyelitis optica; NMOSD, neuromyelitis optica spectrum disorder.
The conditions represented by the 40 included studies were chronic inflammatory demyelinating polyneuropathy (CIDP; n = 11), myasthenia gravis (MG; n = 11), Guillain–Barré syndrome (n = 7), NMOSD (n = 5) and autoimmune encephalitis (n = 4) (Figures 2, 3). MOGAD was described in only one study (25). Seventeen studies provided an estimate of the total cost of disease, and total direct and indirect costs were reported in 11 and 8 studies, respectively. One study was published in 2023, eight in 2022, three in 2021, six in 2020 and four in 2019. Fifteen studies were from 2010–2018, and the remaining three were published before 2010.
Figure 3
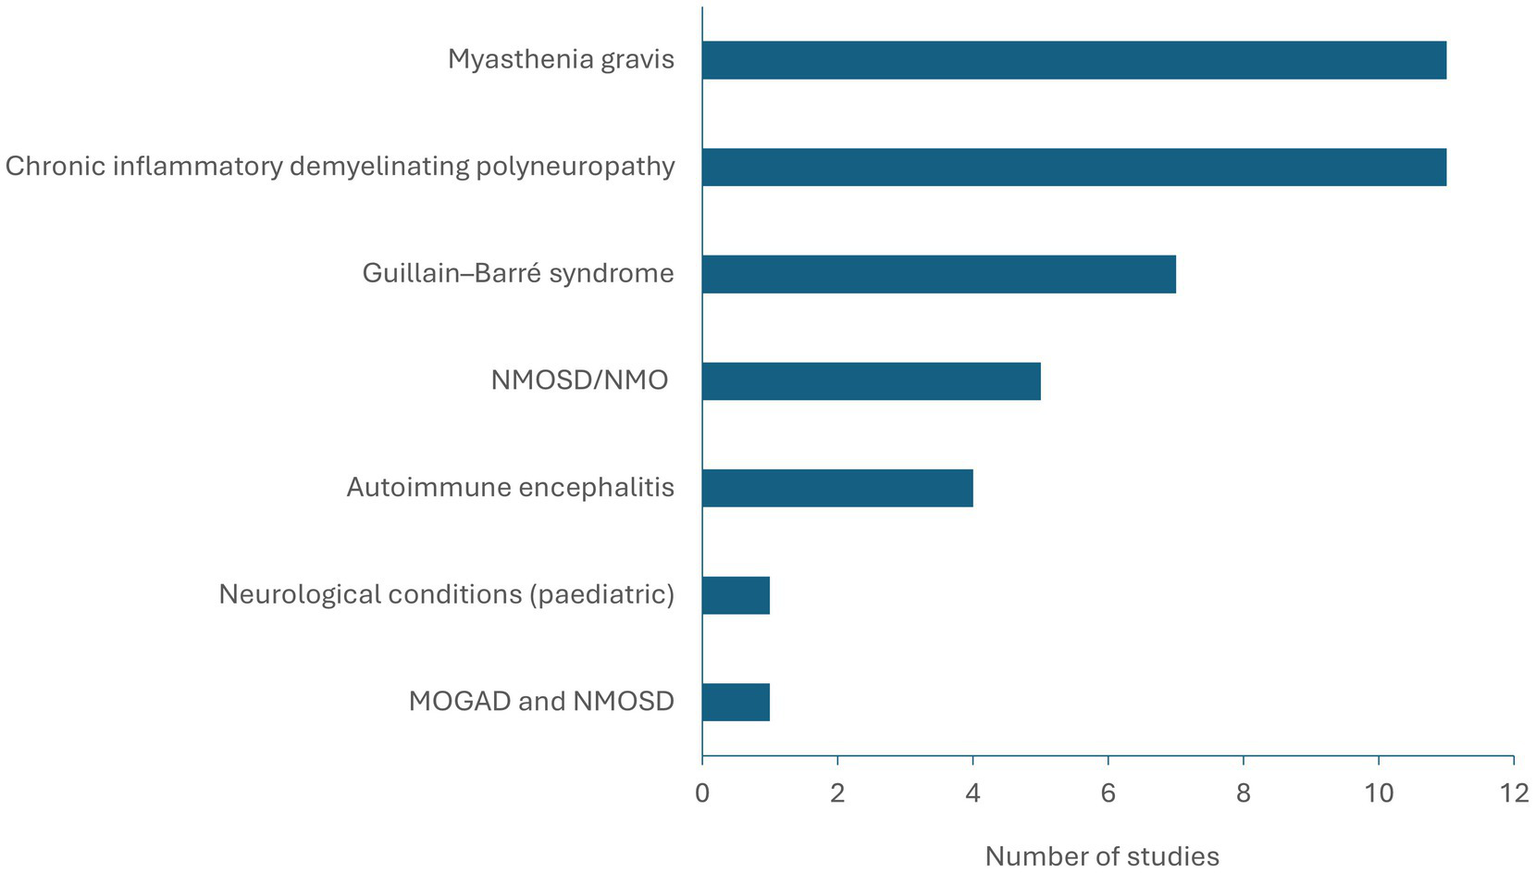
Representation of MOGAD and analogues within the literature (n = 40 studies). MOGAD, myelin oligodendrocyte glycoprotein antibody-associated disease; NMO, neuromyelitis optica; NMOSD, neuromyelitis optica spectrum disorder.
Cost estimates
Tables 1–4 report cost estimates, grouped by disease. Studies reported different measures (i.e., not all studies reported total costs, direct costs or indirect costs) in different ways (most cost estimates were reported as means, but some were reported as medians; medians tended to be lower). The variability observed across the estimates can be attributed to the range of diseases and countries included in this review; there were generally not enough studies focusing on a given disease or from a given country to draw strong conclusions about specific diseases or countries.
Table 1
| Disease | Citation | Number of patients with the disease(s) of interest | Study type | Total costs* | Cost drivers | Additional notes |
|---|---|---|---|---|---|---|
| CIDP | Divino et al., 2018 (51) | 790 | Cost analysis (case–control study, retrospective) | [Cost of illness over 2 years] $148,399 (SD $228,494) in patients with CIDP; $19,883 ($72,321) in controls [Cost for CIDP therapy over 2 years] $76,055 (SD $174,630) in patients with CIDP; not applicable in controls |
Medications, outpatient ancillary, radiology and inpatient care | In patients with CIDP, mean 2-year costs for ‘outpatient surgery’ and ‘outpatient ancillary, radiology and healthcare common procedure coding system drugs’ were $4,087 (SD $10,425) and $97,418 ($198,831), respectively* |
| CIDP | Mahdi-Rogers et al., 2014 (55) | 43 | Cost-of-illness study (patient survey, non-comparative) | [Cost of illness] $48,372 (95% CI: $32,576–$66,611) | NR | None |
| CIDP | McCrone et al., 2003 (52) | 25 | Cost–utility analysis (comparison of prednisolone vs. IVIg therapy) | [6-week total cost] $2,611 (SD $6,041) for patients treated with prednisolone and $9,456 ($1,121) for those treated with IVIg† | IVIg (more expensive than prednisolone) | None |
| CIDP | Mengel et al., 2018 (53) | 108 | Cost-of-illness study (patient survey, non-comparative) | [3-month total cost] $19,609 (95% CI: $16,626–$22,765) | IVIg (67% of the total cost) Reduced health-related quality of life and depressive symptoms (independent predictors for higher total costs) |
None |
| Guillain–Barré syndrome | Frenzen, 2008 (20) | [Pan-US, patients hospitalised] 5,473 | Cost analysis (non-comparative) | [Cost of illness, USA-wide] $2.776 billion (95% CI: $2.542–$3.010) Cost per patient: $507,117 (95% CI: $442,587–$571,647) |
NR | None |
| Guillain–Barré syndrome | Oliveira et al., 2022 (58) | 46 | Cost-of-illness study (patient survey, non-comparative) | [Median cost of illness, from symptom onset until 6 months post-discharge, total period ~6.5 months] $1,999 (IQR: $892–$4,423) | NR | Costs shift during each section of the patient-care journey |
| Guillain–Barré syndrome | Tsai et al., 2007 (33) | 24 | Cost-effectiveness study (retrospective; includes comparison of IVIg vs. plasma exchange therapy) | Length of hospitalisation had a strong relationship with total cost (Pearson correlation coefficient 0.907) Total costs were higher for patients on ventilators than those not requiring ventilators (p = 0.008) |
None | |
| MOGAD‡ and NMOSD | Hümmert et al., 2022 (25) | 212 | Analysis of costs and HRQoL (patient survey, non-comparative) | [Cost of illness] $94,688 (95% CI: $81,418–$108,546) | Drivers: informal care (28% of total cost), indirect costs (23%) and medication (16%) Independent predictors: need for care, number of acute attacks, unemployment and disability measured by the Expanded Disability Scale Score Cost was positively correlated with disease severity, but neither antibody status nor disease duration influenced total cost |
No cost difference between MOGAD and NMOSD stratified by serostatus and disease duration was found, apart from higher outpatient diagnostic test for MOGAD |
| Myasthenia gravis | Fan et al., 2020 (59) | 69 | HRQoL study (cross-sectional, non-comparative) | Patients paid a median of $180 per month to ease problems related to myasthenia gravis, despite medical insurance coverage | NR | Financial burden (ratio of myasthenia gravis expenditure to total income) was negatively associated with total SF-36 score (p < 0.01) |
| Myasthenia gravis | Guptill et al., 2012 (60) | 113 | Cost analysis (includes comparison of costs for IVIg vs. plasma exchange therapy) | [Cost of illness] $27,234 (95% CI: $14,629–$39,840), compared with $6,090 ($4,880–$7,300) in matched controls (p < 0.001) | NR | Home health costs were significantly greater in patients with myasthenia gravis than in controls |
| Myasthenia gravis | Harris et al., 2020 (56) | 782 | Healthcare resource utilisation study (retrospective, non-comparative) | NR | Refractory disease | Refractory myasthenia gravis was correlated to worse activities of daily living and increased healthcare resource use |
| Myasthenia gravis | Ignatova et al., 2022 (27) | 54 | Cost-of-illness study (patient survey, non-comparative) | [Median] $5,870 (IQR: $1,250–$13,843)†,§ | Disease severity, relapses (significant predictors of cost) | None |
| Myasthenia gravis | Schepelmann et al., 2010 (54) | 107 patients with amyotrophic lateral sclerosis (n = 46), myasthenia gravis (n = 41) or facioscapulohumeral muscular dystrophy (n = 20) | Patient questionnaires and diaries (non-comparative) | [Total annual cost of myasthenia gravis from societal perspective] $27,231 (95% CI: $19,071–$39,851) | Considering all 3 diseases of the study, the main components of costs were the expenditures of health insurance and the loss of productivity of patients and their caregivers. For myasthenia gravis, disease severity and assistance in ADL were identified as independent cost-driving factors | [For patients with all 3 diseases of the study – amyotrophic lateral sclerosis, myasthenia gravis and facioscapulohumeral muscular dystrophy] Average total cost due to comorbidities unrelated to neuromuscular disease was $10,856 |
| Myasthenia gravis | Sonkar et al., 2017 (30) | 66 | Cost analysis (prospective, non-comparative) | [Median, n = 66] $4,449 (range: $330–$38,569) | Severity of disease and treatment with IVIg or plasma exchange were identified as determinants of cost | The predictors of cost were severe myasthenia gravis (r = 0.43; p < 0.0001), myasthenic crisis (r = 0.54; p = 0.0001), mechanical ventilation (r = 0.36; p = 0.003) and hospitalisation or ICU admission (r = 0.54; p = 0.0001) |
| Myasthenia gravis | Ting et al., 2023 (61) | 1,498 | Analysis of healthcare resource utilisation and costs (retrospective study of insurance claims data, non-comparative) | Among patients with myasthenia gravis, the mean all-cause total healthcare cost was $128,288 per patient during 2 years of follow-up, with $105,733 and $22,554 attributed to medical and pharmacy costs, respectively | NR | None |
| NMOSD | Hughes et al., 2022 (36) | 117 patients and 74 informal carers | Analysis of health utilities and costs (patient survey, non-comparative) | [Total patient cost per patient during 3 months preceding questionnaire completion] $10,295 (95% central range: $3,837–$22,256) | Extent of disability | Patient costs (self-reported, including private medication and house adjustment costs) during the 3 months preceding questionnaire completion were $1,289 (95% central range: $397–$2,766) |
Summary of publications with extractable cost estimates and cost drivers: total costs.
*Cost data were standardised according to the cost year stated in the reference manuscript. If a cost year range was provided, the latest date was taken. If no cost year was provided, the cost year was set to the publication year. †If the reporting country using Euros was not specified or if a pan-Europe study was conducted, Belgium was selected. ‡Patients with MOGAD diagnosed according to Jarius et al. (34). §Costs are reported in Euros with no information pertaining to the conversion from local currency at the time of analysis. Standardised costs (USD) shown are mean annual cost per patient unless otherwise indicated. The study by Mahdi-Rogers et al. (55) included three different diseases (CIDP, multifocal motor neuropathy and paraproteinaemic demyelinating neuropathy), but here we have extracted data for CIDP only. The study by Schepelmann et al. (54) included three different diseases (amyotrophic lateral sclerosis, facioscapulohumeral muscular dystrophy and myasthenia gravis), but here we have extracted data for myasthenia gravis only. Please see Supplementary Table 2 for further details of the studies included in this table. ADL, activities of daily living; CI, confidence interval; CIDP, chronic inflammatory demyelinating polyneuropathy; HRQoL, health-related quality of life; ICU, intensive care unit; IQR, interquartile range; IVIg, intravenous immunoglobulin; MOGAD, myelin oligodendrocyte glycoprotein antibody-associated disease; NMOSD, neuromyelitis optica spectrum disorder; SD, standard deviation; USD, US dollars.
Table 2
| Disease | Citation | Number of patients with the disease(s) of interest | Study type | Total direct costs* | Medical or healthcare costs* | Medication costs* | Immunoglobulin costs* | Hospital costs* | Outpatient healthcare costs* |
|---|---|---|---|---|---|---|---|---|---|
| Autoimmune encephalitis | Cai et al., 2022 (62) | 78 | Cost-efficiency analysis (retrospective, comparison of IV methylprednisolone monotherapy vs IV methylprednisolone plus IVIg combination therapy) | NR | NR | NR | IVIg monotherapy $13,729 (IQR: $10,585–$15,409) | NR | NR |
| Autoimmune encephalitis | Cohen et al., 2019 (26) | 63 | Cost analysis (retrospective; includes comparison of antibody-positive vs. antibody-negative patients) | NR | NR | NR | NR | [Median] $93,039 (IQR: $47,032–$216,602) overall; $109,187 ($57,282–$267,222) for antibody-positive patients vs. $70,721 ($40,480–$194,808) for antibody-negative patients (p = 0.21) | NR |
| Autoimmune encephalitis | Li et al., 2020 (63) | 208 | Cost analysis (retrospective, non-comparative) | $29,191 (SD $28,973) | [Medical cost] $27,406 (SD $27,262) | [Treatment cost] $14,525 (SD $11,050) | [Immunotherapy cost] $11,852 (SD $8,743) | [Inpatient cost] $26,921 (SD $27,141) | $485 (SD $1,353) |
| Autoimmune encephalitis | Sharp et al., 2021 (64) | 58 patients in 2018 and 53 patients during the first 7 months of 2019 | Cost analysis (relating to autoimmune encephalopathy testing panels; costs compared before and after implementing an algorithm for ordering panels) | NR | NR | NR | NR | NR | NR |
| CIDP | Allen et al., 2020 (65) | 289 | Hypothetical cost analysis (reported within a review article; includes comparison of low-dose SCIg, high-dose SCIg and IVIg) | NR | NR | NR | Low-dose SCIg $9,906; high-dose SCIg $19,790; comparative cost for IVIg $10,966 (applicable to both high- and low-dose settings) | NR | NR |
| CIDP | Darbà & Marsà, 2022 (23) | 2,805 | Cost analysis [retrospective; includes comparison of two different time periods (2004–2015 vs. 2015–2016)] | NR | NR | NR | NR | [Mean medical cost per hospital admission] $7,521 ($6,531 for ≤4 days and $8,740 for >4 days) | $7,821 |
| CIDP | Divino et al., 2018 (51) | 790 | Cost analysis (case-control study, retrospective) | NR | [Direct medical costs over 2 years, inclusive of outpatient pharmacy and medical claims] $76,055 (SD $174,630) (mean value represents 51.2% of mean total cost) | NR | NR | [Inpatient care over 2 years] $20,866 (SD $84,861) in patients with CIDP; $3,651 ($22,014) in controls | NR |
| CIDP | Guptill et al., 2014 (28) | 73 | Analysis of costs and healthcare resource use (retrospective, non-comparative) | [Health plan paid cost] $74,116 (95% CI: $47,443–$100,789) | [Medical cost] $32,604 (95% CI: $14,860–$50,349) | NR | IVIg $38,022 overall (90% of overall pharmacy cost) and $140,566 per patient (SE $23,993) who received this treatment | NR | NR |
| CIDP | Le Masson et al., 2018 (66) | 24 | Cost minimisation analysis (before and after analysis with prospective data collection; comparison of home- vs. hospital-administered IVIg) | [Total treatment cost] $73,696 (SD $39,923) with home treatment and $140,388 ($78,186) with hospital treatment | NR | NR | [For patients receiving hospital IVIg] $6,882 per year (SD $2,143) [For patients receiving home IVIg] $7,608 (SD $2,461) per year, plus additional cost of $754 for nursing, dispensing, infusion pump, pump supplies and IVIg transportation |
[For patients receiving hospital IVIg] $10,480 (SD $5,264) [For patients receiving home IVIg] $820 (SD $335) |
NR |
| CIDP | Mahdi-Rogers et al., 2014 (55) | 43 | Cost-of-illness study (patient survey, non-comparative) | $35,636 (95% CI: $22,278–$51,269) | Estimated UK-wide annual treatment cost: $38,304,679 | NR | IVIg: $22,664 | $6,358 (SD $9,446) Estimated UK-wide cost $10,611,940 |
NR |
| CIDP | McCrone et al., 2003 (52) | 25 | Cost–utility analysis (comparison of prednisolone vs. IVIg therapy) | NR | NR | NR | IVIg $8,600 (SD $0)† | [6-week inpatient cost] $1,849 (SD $4,980) for patients treated with prednisolone and $0 ($0) for those treated with IVIg† | [6-week outpatient cost] $123 (SD $293) for patients treated with prednisolone and $257 ($605) for those treated with IVIg† |
| CIDP | Mengel et al., 2018 (53) | 108 | Cost-of-illness study (patient survey, non-comparative) | [3-month direct cost] $16,304 (95% CI: $13,756–$18,947) (mean represents 83% of the mean total cost) | NR | [3-month cost for all drugs] $13,664 (95% CI: $11,344–$16,092) | 3-month cost of IVIg $13,161 (95% CI: $9,101–$15,602) | [3-month cost for inpatient care, based on a rate of $848 per patient per day] $1,248 (95% CI: $801–$1,729) | [3-month cost] $265 (95% CI: $232–$298) |
| CIDP | Perraudin et al., 2020 (67) | Not applicable (modelling study) | Cost minimalisation analysis (comparison of hospital-based IVIg vs. home-based SCIg) | NR | NR | NR | [Estimated total costs for treatment over 48 weeks] Hospital-based IVIg $105,236; home-based SCIg $80,671 | NR | NR |
| CIDP | Piscitelli et al., 2021 (68) | 12 | Cost analysis (retrospective; comparison of SCIg vs. IVIg) | NR | NR | NR | [Estimated total costs for treatment of 12 patients over 1 year] IVIg $588,059; SCIg $1,000,087 | NR | NR |
| CIDP | Rajabally & Afzal, 2019 (69) | 39 | Retrospective study (review of hospital patient records; comparison of different dosing methods for IVIg) | NR | NR | NR | [IVIg] Cost when administered according to an individualised, outcome-measured, dose-modifying protocol $98,573 (drug cost $67,773, infusion-related cost $30,800) Corresponding total values for standard dosing by dosing weight and standard dosing by recorded weight $110,281 and $122,879, respectively |
NR | NR |
| Guillain–Barré syndrome | Frenzen, 2008 (20) | [Pan-US, patients hospitalised] 5,473 | Cost analysis (non-comparative) | [Direct medical cost, USA-wide] $394 million (95% CI: $337 million – $452 million) (point estimate represents 14% of the total cost of illness) [Direct medical cost per patient] $72,023 ($59,557–$84,489) |
[Direct medical cost, USA-wide] $394 million (95% CI: $337 million – $452 million) [Direct medical cost, per patient] $72,023 ($59,557–$84,489) |
NR | NR | NR | NR |
| Guillain–Barré syndrome | Maheshwari et al., 2018 (70) | 40 | Cost minimisation analysis (includes comparison of IVIg vs. plasmapheresis therapy) | NR | [Annual health system cost] mean $514 per patient treated (total cost of $228,128 incurred for 4,441 patients) | NR | Out-of-pocket cost for IVIg: $5,698 | NR | NR |
| Guillain–Barré syndrome | Oliveira et al., 2022 (58) | 46 | Cost minimisation analysis (includes comparison of IVIg vs. plasmapheresis therapy) | [Median total direct cost, from symptom onset until 6 months post-discharge, total period ~6.5 months] $1,286 (IQR: $221–$2,215) (median value represents 58% of the median total cost of illness) | [Median direct medical cost, from symptom onset until 6 months post-discharge, total period ~6.5 months] $232 (IQR: $35–$698) | [Median cost of medication] From symptom onset to admission $0 For the 6-month period following discharge $23 (IQR: $0–$127) |
NR | NR | NR |
| Guillain–Barré syndrome | Rumalla et al., 2017 (22) | 54,778 | Retrospective study (review of data from the US Nationwide Inpatient Sample, comparison of patients with Guillain–Barré syndrome with vs. without hyponatraemia) | NR | NR | NR | NR | [Total hospital cost] $74,204 (SD $70,452) for patients with Guillain–Barré syndrome with hyponatraemia, vs. $46,892 ($57,491) for patients with Guillain–Barré syndrome without hyponatraemia (p < 0.0001) | NR |
| Guillain–Barré syndrome | Tsai et al., 2007 (33) | 24 | Cost-effectiveness study (retrospective; includes comparison of IVIg vs. plasma exchange therapy) | NR | NR | NR | Except for the costs of the drugs used in IVIg, treatment of Guillain–Barré syndrome with IVIg was more cost-effective (p = 0.057) than with plasma exchange in total length of hospitalisation and the cost of procedures and hospitalisation | Each additional day of hospitalisation increased costs by $456 | NR |
| Guillain–Barré syndrome | van Leeuwen et al., 2016 (71) | 87 | Analysis of resource use and costs (non-comparative) | NR | NR | NR | NR | [Median cost for hospital admission] $24,554 (IQR: $18,303–$38,612) | NR |
| Guillain–Barré syndrome | Winters et al., 2011 (31) | Not applicable (modelling study) | Cost minimisation analysis (comparison of IVIg vs. plasma exchange) | NR | NR | NR | IVIg (5 infusions) $14,188 | NR | NR |
| MOGAD‡ and NMOSD | Hümmert et al., 2022 (25) | 212 | Analysis of costs and HRQoL (patient survey, non-comparative) | $72,640 (77% of the total cost) | [Direct medical cost] $40,689 (95% CI: $36,129–$68,091) (mean value represents 43% of the mean total cost) | [Including apheresis] $15,554 (95% CI: $12,560–$19,149) | [Immunotherapy] $12,329 (95% CI: $9,729–$15,921) | [Inpatient hospital care] $8,263 (95% CI: $6,205–$10,514) | [Outpatient consultations] $941 (95% CI: $734–$1,175) |
| Myasthenia gravis | Fan et al., 2020 (59) | 69 | HRQoL study (cross-sectional, non-comparative) | NR | NR | NR | NR | NR | NR |
| Myasthenia gravis | Guptill et al., 2011 (29) | 1,288 | Cost analysis (includes comparison of costs for IVIg vs. plasma exchange therapy) | NR | NR | [Average claims-based cost per patient with myasthenia gravis] $34,337 (SD $66,244) [Total US pharmacy cost related to myasthenia gravis] $12.9 million |
US cost for IVIg $11.0 million (85% of pharmacy cost) Mean cost per IVIg infusion $6,408 (SD $7,287) |
US cost for hospital-based treatment of patients with myasthenia gravis $11,702,970 | NR |
| Myasthenia gravis | Guptill et al., 2012 (60) | 113 | Cost analysis (case-control study) | NR | NR | NR | NR | NR | NR |
| Myasthenia gravis | Harris et al., 2020 (56) | 782 | Healthcare resource utilisation study (retrospective, non-comparative) | NR | NR | NR | NR | NR | NR |
| Myasthenia gravis | Ignatova et al., 2022 (27) | 54 | Cost-of-illness study (patient survey, non-comparative) | [Median] $1,981 (IQR: $1,149–$7,651)† | NR | [Median for drugs] $1,118 (IQR: $643–$1,131)† | NR | [Median] $0† | NR |
| Myasthenia gravis | Mandawat et al., 2010 (32) | 1,606 (908 patients with myasthenia gravis and 698 patients with myasthenia gravis crisis) | Economic outcomes study (retrospective, comparison of patients with myasthenia gravis with vs. without crisis) | NR | NR | NR | NR | [Patients with myasthenia gravis] Inpatient cost was $37,398 (IQR: $35,011) for patients receiving plasma exchange vs. $29,630 ($29,382) for those receiving IVIg (p < 0.001) [Patients with myasthenia gravis with crisis] Inpatient cost was $75,466 (IQR: $91,644) for patients receiving plasma exchange vs. $47,584 ($48,869) for those receiving IVIg (p < 0.0001) |
NR |
| Myasthenia gravis | Qi et al., 2022 (72) | 1,225 | IVIg utilisation study (retrospective, comparison of chronic vs. intermittent users of IVIg) | NR | [Medical cost] $197,408 for patients using IVIg chronically vs. $79,326 for those with intermittent IVIg use (p < 0.001) | NR | NR | NR | NR |
| Myasthenia gravis | Schepelmann et al., 2010 (54) | 107 patients with amyotrophic lateral sclerosis (n = 46), myasthenia gravis (n = 41) or facioscapulohumeral muscular dystrophy (n = 20) | Patient questionnaires and diaries (non-comparative) | [From societal perspective] $21,566 (95% CI: $15,063–$33,697) | NR | [Drugs] $3,279 (95% CI: $2,732–$4,299) | [Immuno-modulation] $1,093 (95% CI: $510–$1,348) | $15,264 (95% CI: $8,980–$26,921) | $2,095 (95% CI: $1,676–$2,605) |
| Myasthenia gravis | Sonkar et al., 2017 (30) | 66 | Cost analysis (prospective, non-comparative) | [Median, n = 66] $3,322 (range: $330–$32,482) | NR | NR | NR | [Median, n = 50] $3,232 (range: $269–$31,146) | [Median, n = 16] $1,481 (range $330–$4,271) |
| Myasthenia gravis | Ting et al., 2023 (61) | 1,498 | Analysis of healthcare resource utilisation and costs (retrospective study of insurance claims data, non-comparative) | NR | [Mean total myasthenia gravis-related medical cost over 2 years] $71,245 [Mean total myasthenia gravis-related healthcare cost over 2 years] $83,114 |
NR | [Mean IVIg-specific outpatient cost over 2 years] Whole cohort (n = 1,498) $22,953, patients on chronic IVIg (n = 114) $163,430 [Mean IVIg-specific inpatient cost over 2 years] Whole cohort (n = 1,498) $2,364, patients on chronic IVIg (n = 114) $1,986 |
[Mean total myasthenia gravis-related inpatient cost over 2 years] $24,614 [Mean total myasthenia gravis-related inpatient treatment cost over 2 years] $5,720 |
[Mean total myasthenia gravis-related outpatient cost over 2 years] $46,631 [Mean total myasthenia gravis-related outpatient treatment cost over 2 years] $27,338 |
| Neuro-immunological conditions (paediatric) | Nosadini et al., 2016 (73) | 196 | Retrospective study (chart review; includes comparison of immunoglobulin costs for patients with different neuroimmunological conditions) | NR | NR | NR | [IVIg cost per patient over the 14-year study period] Overall cohort (n = 196) $17,064 (range $701–$335,986), monophasic inflammatory demyelinating CNS diseases (n = 22) $3,630, relapsing inflammatory demyelinating CNS diseases (n = 7) $25,233, acute demyelinating neuropathy (Guillain–Barré syndrome) (n = 55) $4,337, chronic demyelinating neuropathies (n = 9) $81,209, myasthenia gravis (n = 12) $23,802 | NR | NR |
| NMOSD | Beekman et al., 2019 (38) | 193 | Cost analysis (performed within a study of patient experience and quality of life, non-comparative) | NR | NR | [Prescription medications] $2,253 | NR | $8,705 | NR |
| NMOSD | Exuzides et al., 2021 (37) | 162 | Cost analysis (case-control study) | NR | NR | NR | [Median cost of IVIg among patients claiming for this treatment] $29,247 (IQR: $6,515–$51,611) | $34,893 (SD $173,986) in patients with NMOSD; $1,827 ($12,921) in non-NMOSD controls | $29,881 (SD $42,590) in patients with NMOSD; $5,718 ($31,762) in non-NMOSD controls |
| NMO | Holroyd et al., 2019 (40) | 60 physicians | Analysis of availability and affordability of neuromyelitis optica testing and treatment (physician survey, non-comparative) | NR | [Treatment] $5,248 | NR | NR | NR | NR |
| NMOSD | Hughes et al., 2022 (36) | 117 patients and 74 informal carers | Analysis of health utilities and costs (patient survey, non-comparative) | NR | NR | [During the 3 months preceding questionnaire completion] $1,111 (95% central range: $381–$2,671) | NR | [Inpatient stays during the 3 months preceding questionnaire completion] $7,239 (95% central range: $932–$16,882) | $582 (95% central range: $449–$769) |
| NMOSD | Knapp et al., 2022 (39) | 130 | Cost analysis (based on health insurance data, comparison of patients with active disease vs. inactive disease vs. controls) | NR | [Healthcare cost] $18,189 in patients with NMOSD vs. $6,575 in non-NMOSD controls (p < 0.001) | NR | NR | $9,083 in patients with NMOSD vs. $2,730 in non-NMOSD controls (p < 0.001) | [Outpatient care costs] $1,241 in patients with NMOSD vs. $1,171 in non-NMOSD controls (p < 0.001) [Outpatient prescription costs] $4,699 in patients with NMOSD vs. $1,462 in non-NMOSD controls |
Summary of publications with extractable cost estimates: direct costs.
*Cost data were standardised according to the cost year stated in the reference manuscript. If a cost year range was provided, the latest date was taken. If no cost year was provided, the cost year was set to the publication year. †If the reporting country using Euros was not specified or if a pan-Europe study was conducted, Belgium was selected. ‡Patients with MOGAD diagnosed according to Jarius et al. (34). Costs shown are mean annual cost per patient unless otherwise indicated. Study by Mahdi-Rogers et al. (55) included three different diseases (CIDP, multifocal motor neuropathy and paraproteinaemic demyelinating neuropathy), but here we have extracted data for CIDP only. The study by Schepelmann et al. (54) included three different diseases (amyotrophic lateral sclerosis, facioscapulohumeral muscular dystrophy and myasthenia gravis), but here we have extracted data for myasthenia gravis only. The publication by Allen et al. (65) is a review, retained because cost data therein appear to be original. Data inconsistencies were encountered in the publication by Winters et al. (31); for these, values from tables within the publication, rather than the main text, were selected for inclusion here. Please see Supplementary Table 2 for further details of the studies included in this table. CI, confidence interval; CIDP, chronic inflammatory demyelinating polyneuropathy; CNS, central nervous system; HRQoL, health-related quality of life; IgG, immunoglobulin G; IQR, interquartile range; IV, intravenous; IVIg, intravenous immunoglobulin; MOGAD, myelin oligodendrocyte glycoprotein antibody-associated disease; NMO, neuromyelitis optica; NMOSD, neuromyelitis optica spectrum disorder; NR, not reported; SCIg, subcutaneous immunoglobulin; SD, standard deviation.
Table 3
| Disease | Citation | Number of patients with the disease(s) of interest | Study type | Hospitalisation rate | Direct cost drivers* | Additional notes* |
|---|---|---|---|---|---|---|
| Autoimmune encephalitis | Cai et al., 2022 (62) | 78 | Cost-efficiency analysis (retrospective, comparison of IV methylprednisolone monotherapy vs. IV methylprednisolone plus IVIg combination therapy) | NR | NR | Costs for IVMP monotherapy and combination therapy with IVMP + IVIg were $3,251 (IQR: $2,916–$8,264) and $13,939 ($11,781–$18,411), respectively |
| Autoimmune encephalitis | Cohen et al., 2019 (26) | 63 | Cost analysis (retrospective; includes comparison of antibody-positive vs. antibody-negative patients) | [Study conducted in a population of inpatients] Median length of stay was 15 days and 27 patients (43%) were admitted to the ICU | NR | No difference in hospital cost between patients with cell surface or intracellular antibody autoimmune encephalitis. Compared with patients with herpes simplex encephalitis, those with autoimmune encephalitis had a longer hospital stay (median 3× longer) and longer stay in ICU (2×). Contributors to longer hospital stay and thus cost were treatment (specifically plasmapheresis lasting ≥7 days), delays in establishing diagnosis and refractoriness to first-line treatment |
| Autoimmune encephalitis | Li et al., 2020 (63) | 208 | Cost analysis (retrospective, non-comparative) | NR | Length of stay in hospital | Mean direct non-medical cost was $1,785 (SD $2,009). Cost of LGI1/CASPR2 autoimmune encephalitis was significantly less than that of NMDA/GABAB autoimmune encephalitis |
| Autoimmune encephalitis | Sharp et al., 2021 (64) | 58 patients in 2018 and 53 patients during the first 7 months of 2019 | Cost analysis (relating to autoimmune encephalopathy testing panels; costs compared before and after implementing an algorithm for ordering panels) | NR | NR | [2018] Cost for ordering 77 autoimmune encephalitis testing panels (for use in 58 patients) was $168,107 [2019, before implementing an algorithm for ordering panels] Based on data from the first 7 months, cost for ordering 95 panels for the whole year was estimated to exceed $216,174 [Effect of implementing the algorithm] There was a 43% decrease in the total number of panels ordered, the true-positive rate increased >3-fold and estimated annual cost saving was $30,024 |
| CIDP | Allen et al., 2020 (65) | 289 | Hypothetical cost analysis (reported within a review article; includes comparison of low-dose SCIg, high-dose SCIg and IVIg) | NR | NR | None |
| CIDP | Darbà & Marsà, 2022 (23) | 2,805 | Cost analysis (retrospective; includes comparison of two different time periods (2004–2015 vs. 2015–2016)) | Hospitalisation rate in 2018 was 12.1 per 100,000 patients. Mean length of hospital stay 8.1 days (95% CI: 7.7–8.5 days) | NR | The hospitalisation rate increased significantly between 2004 and 2015 and decreased between 2015 and 2016, coinciding with implementation of new ICD coding |
| CIDP | Divino et al., 2018 (51) | 790 | Cost analysis (case-control study, retrospective) | NR | NR | None |
| CIDP | Guptill et al., 2014 (28) | 73 | Analysis of costs and healthcare resource use (retrospective, non-comparative) | NR | The mean pharmacy cost was $41,512 (95% CI: $22,379–$60,643) (mean value represents 57% of the mean total health plan cost) | None |
| CIDP | Le Masson et al., 2018 (66) | 24 | Cost minimisation analysis (before and after analysis with prospective data collection; comparison of home- vs. hospital-administered IVIg) | [For patients receiving hospital IVIg] Mean 2.8 hospital days per year (SD 1.1 days) [For patients receiving home IVIg] Mean 0.08 (SD 0.5) hospital days per year |
NR | None |
| CIDP | Mahdi-Rogers et al., 2014 (55) | 43 | Cost-of-illness study (patient survey, non-comparative) | [6-month usage data] Outpatient services, 62.8% of patients; inpatient or day-case services, 39.5% | The cost of IVIg was the major component of the total healthcare cost | None |
| CIDP | McCrone et al., 2003 (52) | 25 | Cost–utility analysis (comparison of prednisolone vs. IVIg therapy) | NR | NR | None |
| CIDP | Mengel et al., 2018 (53) | 108 | Cost-of-illness study (patient survey, non-comparative) | NR | Medication costs (detail not reported) | The 3-month direct cost of $16,304 (95% CI: $13,756–$18,947) consisted of $15,479 ($12,965–$18,085) of health insurance costs and $825 ($204–$1,737) of out-of-pocket costs |
| CIDP | Perraudin et al., 2020 (67) | Not applicable (modelling study) | Cost minimalisation analysis (comparison of hospital-based IVIg vs. home-based SCIg) | NR | NR | In this comparison of SCIg vs. IVIg, IgG was the major cost driver |
| CIDP | Piscitelli et al., 2021 (68) | 12 | Cost analysis (retrospective; comparison of SCIg vs. IVIg) | NR | NR | This was a comparison of SCIg vs. IVIg |
| CIDP | Rajabally & Afzal, 2019 (69) | 39 | Retrospective study (review of hospital patient records; comparison of different dosing methods for IVIg) | NR | NR | This was a comparison of different dosing methods for IVIg |
| Guillain–Barré syndrome | Frenzen, 2008 (20) | [Pan-US, patients hospitalised] 5,473 | Cost analysis (non-comparative) | Annual number of hospitalisations (community hospitals) in the USA due to Guillain–Barré syndrome: 6,008 (95% CI: 5,510–6,506) | Community hospital admissions | USA-wide annual outpatient care due to Guillain–Barré syndrome: 19,728 physician visits (95% CI: 0–103,506), 147,182 physical therapy visits (0–309,820) and 7,821 occupational therapy visits (0–29,553) |
| Guillain–Barré syndrome | Maheshwari et al., 2018 (70) | 40 | Cost minimisation analysis (includes comparison of IVIg vs. plasmapheresis therapy) | For patients admitted to a tertiary care hospital, average length of stay in ward was 7.4 days | NR | Out-of-pocket cost for IVIg was higher ($5,698) than for plasmapheresis ($2,704), but the clinical efficacy of these treatments was the same |
| Guillain–Barré syndrome | Oliveira et al., 2022 (58) | 46 | Cost minimisation analysis (includes comparison of IVIg vs. plasmapheresis therapy) | NR | NR | Non-medical costs accounted for 57.9% of the total direct cost Within direct non-medical expenses, travel was the highest cost during symptom onset/hospitalisation, which changes through the 6-month post-discharge period |
| Guillain–Barré syndrome | Rumalla et al., 2017 (22) | 54,778 | Retrospective study (review of data from the US Nationwide Inpatient Sample, comparison of patients with Guillain–Barré syndrome with vs. without hyponatraemia) | Mean length of stay 16.07 days (SD 15.40 days) for Guillain–Barré patients with hyponatraemia, vs. 10.41 days (13.73) for Guillain–Barré patients without hyponatraemia (p < 0.0001) | NR | Incidence of hyponatraemia in this cohort of patients with Guillain–Barré syndrome was 11.8% |
| Guillain–Barré syndrome | Tsai et al., 2007 (33) | 24 | Cost-effectiveness study (retrospective; includes comparison of IVIg vs. plasma exchange therapy) | NR | Ventilator requirement | None |
| Guillain–Barré syndrome | van Leeuwen et al., 2016 (71) | 87 | Analysis of resource use and costs (non-comparative) | Median hospital stay was 17 days (IQR: 11–26 days) (all study participants were admitted to hospital) | NR | This was a hospital-based study. Hospital admission cost was highly associated with disease severity (measured by maximal Guillain–Barré syndrome disability score), ranging from $3,959 (IQR: $1,298–$6,205) for patients with a score of 1 to $96,465 ($73,418–$111,468) for patients with a score of 5 |
| Guillain–Barré syndrome | Winters et al., 2011 (31) | Not applicable (modelling study) | Cost minimisation analysis (comparison of IVIg vs. plasma exchange) | NR | NR | This study was performed to compare direct costs of IVIg and plasma exchange Cost of plasmapheresis (5 procedures): $6,373 |
| MOGAD‡ and NMOSD | Hümmert et al., 2022 (25) | 212 | Analysis of costs and HRQoL (patient survey, non-comparative) | NR | Direct medical costs driven by medication (38% of direct medical costs), then inpatient hospital care costs (20%), and formal care costs ($5,840 [95% CI: $2,872–$10,161], 14%) Direct non-medical costs driven by informal care ($26,162 [95% CI: $21,041–$31,590], 82% of the total direct non-medical cost) Direct medical and non-medical costs increased with disease severity |
Direct non-medical cost was $31,951 (95% CI: $25,052–$39,138) (mean value represents 34% of the mean total cost) |
| Myasthenia gravis | Fan et al., 2020 (59) | 69 | HRQoL study (cross-sectional, non-comparative) | NR | NR | 73.9% of the patients consulted a doctor >12 times per year |
| Myasthenia gravis | Guptill et al., 2011 (29) | 1,288 | Cost analysis (includes comparison of costs for IVIg vs. plasma exchange therapy) | NR | NR | Mean cost per plasma exchange session (for comparison with the IVIg infusion cost) was $1,304 (SD $1,608) US costs for non-steroidal immunosuppressives (9.3% of total pharmacy cost), cholinesterase inhibitors (5.7%) and corticosteroids (0.2%) were $1,201,264, $736,258 and $258,336, respectively |
| Myasthenia gravis | Guptill et al., 2012 (60) | 113 | Cost analysis (case-control study) | Among the 113 patients, 14 had a total of 38 inpatient hospital admissions, and 83 had a total of 578 outpatient hospital visits during the analysis year | The mean annual pharmacy cost, including outpatient but not inpatient IVIg, was $12,156 (95% CI: $2,303–$22,010) for patients with myasthenia gravis and $820 ($646–$994) for controls (p < 0.001) | None |
| Myasthenia gravis | Harris et al., 2020 (56) | 782 | Healthcare resource utilisation study (retrospective, non-comparative) | 6-month probability of hospitalisation decreased over time, from ~20–30% at baseline to ~15–20% at 4 years | NR | None |
| Myasthenia gravis | Ignatova et al., 2022 (27) | 54 | Cost-of-illness study (patient survey, non-comparative) | NR | Medications | None |
| Myasthenia gravis | Mandawat et al., 2010 (32) | 1,606 (908 patients with myasthenia gravis and 698 patients with myasthenia gravis crisis) | Economic outcomes study (retrospective, comparison of patients with myasthenia gravis with vs. without crisis) | [Patients with myasthenia gravis without crisis] Length of stay 6 days (IQR: 5 days) for patients receiving plasma exchange vs. 4 days (3 days) for those receiving IVIg (p < 0.001) [Patients with myasthenia gravis crisis] Length of stay 10 days (IQR: 11 days) for patients receiving plasma exchange vs. 5 days (5 days) for those receiving IVIg (p < 0.0001) |
NR | The rate of clinical complications was 30.1% in patients with myasthenia gravis crisis on plasmapheresis and 14.8% in those on IVIg (p < 0.001) |
| Myasthenia gravis | Qi et al., 2022 (72) | 1,225 | IVIg utilisation study (retrospective, comparison of chronic vs. intermittent users of IVIg) | NR | NR | This was a study of IVIg utilisation. During the first year following IVIg initiation, 42.4% of IVIg initiators (n = 519) received ≥6 IVIg treatment courses and were therefore classified as chronic users, whereas 57.6% (n = 706) received 1–5 courses and were classified as intermittent users |
| Myasthenia gravis | Schepelmann et al., 2010 (54) | 107 patients with amyotrophic lateral sclerosis (n = 46), myasthenia gravis (n = 41) or facioscapulohumeral muscular dystrophy (n = 20) | Patient questionnaires and diaries (non-comparative) | [For patients with all 3 diseases of the study; 12 months retrospective + 4 months prospective] 41/107 patients (38.3%) were hospitalised and 10/107 (9.3%) were treated at rehabilitation clinics due to neuromuscular diseases | NR | None |
| Myasthenia gravis | Sonkar et al., 2017 (30) | 66 | Cost analysis (prospective, non-comparative) | 50 patients were admitted, and the median duration of hospitalisation was 7.5 days (range: 3–116 days) | NR | None |
| Myasthenia gravis | Ting et al., 2023 (61) | 1,498 | Analysis of healthcare resource utilisation and costs (retrospective study of insurance claims data, non-comparative) | NR | Factors that were statistically significantly associated with high healthcare resource utilisation costs included use of high-dose steroids (p < 0.01 vs. no use of high-dose steroids), use of chronic IVIg as second-line therapy (≥6 cycles in Year 1, p < 0.01 vs. acute use only or no use) or being in either the 1 or ≥4 exacerbation(s) groups (p < 0.02 vs. no exacerbation in Year 1) | [Mean total myasthenia gravis-related pharmacy cost over 2 years] $11,869 Study authors do not classify costs as direct or indirect |
| Neuro-immunological conditions (paediatric) | Nosadini et al., 2016 (73) | 196 | Retrospective study (chart review; includes comparison of immunoglobulin costs for patients with different neuroimmunological conditions) | NR | NR | This study provides costs for IVIg only. |
| NMOSD | Beekman et al., 2019 (38) | 193 | Cost analysis (performed within a study of patient experience and quality of life, non-comparative) | NR | NR | Cost for caregiver/support services was $4,036 |
| NMOSD | Exuzides et al., 2021 (37) | 162 | Cost analysis (case-control study) | NR | NR | ED visit costs were $2,882 (SD $9,333) in patients with NMOSD and $490 ($3,097) in non-NMOSD controls. 12% of patients with NMOSD required plasmapheresis or IVIg, costing a median of $2,022 (IQR: $680–$4,584), and $29,247 ($6,515–$51,611), respectively |
| NMO | Holroyd et al., 2019 (40) | 60 physicians | Analysis of availability and affordability of neuromyelitis optica testing and treatment (physician survey, non-comparative) | NR | NR | Average cost of an AQP4-Ab test was $287. AQP4-Ab and MOG-Ab testing was available in 68% and 38% of countries, respectively. Low-income countries had poor availability of both AQP4-Ab (2/13) and MOG-Ab (1/13) testing vs. high-income countries (15/15 and 13/15) |
| NMOSD | Hughes et al., 2022 (36) | 117 patients and 74 informal carers | Analysis of health utilities and costs (patient survey, non-comparative) | 9% of patients reported hospitalisation during the 3 months preceding questionnaire completion; mean duration of hospitalisation 12.5 days (range: 1–90 days) | Extent of disability | None |
| NMOSD | Knapp et al., 2022 (39) | 130 | Cost analysis (based on health insurance data, comparison of patients with active disease vs. inactive disease vs. controls) | NR | Active vs. inactive disease | None |
Summary of publications with extractable cost drivers: direct costs.
*Cost data were standardised according to the cost year stated in the reference manuscript. If a cost year range was provided, the latest date was taken. If no cost year was provided, the cost year was set to the publication year. †Patients with MOGAD diagnosed according to Jarius et al. (34). Study by Mahdi-Rogers et al. (55) included three different diseases (CIDP, multifocal motor neuropathy and paraproteinaemic demyelinating neuropathy), but here we have extracted data for CIDP only. The study by Schepelmann et al. (54) included three different diseases (amyotrophic lateral sclerosis, facioscapulohumeral muscular dystrophy and myasthenia gravis), but here we have extracted data for myasthenia gravis only. The publication by Allen et al. (65) is a review, retained because cost data therein appear to be original. Data inconsistencies were encountered in the publication by Winters et al. (31); for these, values from tables within the publication, rather than the main text, were selected for inclusion here. Please see Supplementary Table 2 for further details of the studies included in this table. AQP4-Ab, aquaporin-4 antibody; CASPR2, contactin-associated protein 2; CI, confidence interval; CIDP, chronic inflammatory demyelinating polyneuropathy; ED, emergency department; GABAB, γ-aminobutyric acid type B; HRQoL, health-related quality of life; ICD, International Classification of Diseases; ICU, intensive care unit; IgG, immunoglobulin G; IQR, interquartile range; IVIg, intravenous immunoglobulin; IVMP, intravenous methylprednisolone; LGI1, leucine-rich glioma-inactivated 1; MOG-Ab, myelin oligodendrocyte glycoprotein antibody; MOGAD, myelin oligodendrocyte glycoprotein antibody-associated disease; NMDA, N-methyl D-aspartate; NMO, neuromyelitis optica; NMOSD, neuromyelitis optica spectrum disorder; NR, not reported; SCIg, subcutaneous immunoglobulin; SD, standard deviation.
Table 4
| Disease | Citation | Number of patients with the disease(s) of interest | Study type | Total indirect costs | Care requirements | Care costs | Unemployment rate | Lost productivity costs | Disability rate | Disability costs | Other indirect costs | Indirect cost drivers | Additional notes |
|---|---|---|---|---|---|---|---|---|---|---|---|---|---|
| Autoimmune encephalitis | Li et al., 2020 (63) | 208 | Cost analysis (retrospective, non-comparative) | NR | NR | [Professional care cost, classified by the authors as a direct cost] $899 (SD $1,735) | NR | NR | NR | NR | NR | NR | None |
| CIDP | Mahdi-Rogers et al., 2014 (55) | 43 | Cost-of-illness study (patient survey, non-comparative) | $12,736 (SD $25,141) | NR | [Social services] $5,677 (SD $11,163) (UK-wide estimate $9,477,418) | NR | $12,736 (SD $25,141) (UK-wide estimate $21,254,605) | NR | NR | NR | NR | None |
| CIDP | McCrone et al., 2003 (52) | 25 | Cost–utility analysis (comparison of prednisolone vs. IVIg therapy) | NR | NR | [6-week informal care cost] $279 (SD $535) for patients treated with prednisolone and $599 ($1,105) for those treated with IVIg† | NR | NR | NR | NR | NR | NR | None |
| CIDP | Mengel et al., 2018 (53) | 108 | Cost-of-illness study (patient survey, non-comparative) | [3-month indirect cost] $3,305 (95% CI: $2,194–$4,606) (mean represents 17% of the mean total cost) | NR | NR | NR | [3-month costs] Premature retirement $1,635 (95% CI: $817–$2,452), unemployment $327 ($163–$654), sick leave $490 ($114–$1,026), reduced labour time $375 ($31–$791) | NR | [3-month cost] $478 (95% CI: $151–$955) | NR | NR | None |
| Guillain–Barré syndrome | Frenzen, 2008 (20) | [Pan-US, patients hospitalised] 5,473 | Cost analysis (non-comparative) | [USA-wide] $2.380 billion (95% CI: $2.154 billion – $2,607 billion) (point estimate represents 86% of the cost of illness) [Per patient] $942,707 ($817,574–$1,067,840) |
NR | NR | Projected annual number of patients in the USA not returning to work within 5 years of the onset of illness: 574 (95% CI: 512–636) | [USA-wide] $712 million (95% CI: $687 million – $738 million) (86% of the cost of illness) [Per patient] $296,379 ($265,831–$326,927) |
NR | NR | [Cost for premature death, USA-wide] $1,669 billion (95% CI: $1,444 billion – $1,894 billion) (point estimate represents 86% of the cost of illness) [Cost for premature death, per patient] $6,757,397 ($5,516,566–$7,998,228) |
Premature deaths | Nearly 30% of the indirect costs were due to lost productivity. Premature deaths accounted for the remainder of indirect costs and represented 60% of the total cost of Guillain–Barré syndrome. Annual number of deaths caused by Guillain–Barré syndrome in the USA: 247 (95% CI: 216–278) |
| Guillain–Barré syndrome | Oliveira et al., 2022 (58) | 46 | Cost-of-illness study (patient survey, non-comparative) | [Median total indirect cost, from symptom onset until 6 months post-discharge, total period ~6.5 months] $260 (IQR: $0–$2,165) | NR | NR | NR | [Median cost for lack of income] $0 (for the patient, accompanying person and due to premature death in each of the following 3 periods: from symptom onset to hospitalisation, during hospitalisation, and 6 months’ post-discharge) | NR | NR | NR | NR | None |
| Guillain–Barré syndrome | Rumalla et al., 2017 (22) | 54,778 | Retrospective study (review of data from the US Nationwide Inpatient Sample, comparison of patients with Guillain–Barré syndrome with vs. without hyponatraemia) | NR | NR | NR | NR | NR | Moderate to severe disability was present in 15.6% of Guillain–Barré patients with hyponatraemia, compared with 5.1% of patients with patients with Guillain–Barré syndrome without hyponatraemia (p < 0.0001) | NR | NR | NR | None |
| MOGAD‡ and NMOSD | Hümmert et al., 2022 (25) | 212 | Analysis of costs and HRQoL (patient survey, non-comparative) | $22,048 (95% CI: $16,927–$27,391) (mean value represents 23% of the mean total cost) | NR | Formal care (classified here as a direct medical cost) $5,840 (95% CI: $2,872–$10,161) Informal care (classified here as a direct non-medical cost) $26,162 ($21,041–$31,590) |
NR | [Loss of salary for employed] $5,035 (95% CI: $2,913–$7,658) [Loss of salary for unemployed] $7,324 ($4,523–$10,792) [Loss of salary as an indicator for productivity loss, days of sick leave] $8,181 ($4,814–$12,127) [Loss of salary, working time reduction] $1,508 ($4,444–$2,967) |
EDSS score 0–3.0, 3.5–6.0 and 6.5–8.5 in 101 (26%), 70 (50%) and 33 (11%) patients, respectively | Total cost increased with disability measured by EDSS, from $55,617 (95% CI: $45,410–$66,656) for mildly affected patients (EDSS score 0–3.0) to $206,127 ($162,035–$254,841) for severely affected patients (EDSS score 6.5–8.5). Direct medical costs, direct non-medical costs and indirect costs also increased markedly with disease severity | NR | Major drivers were loss of salary as an indicator for productivity loss, days of sick leave (37% of indirect costs) and unemployment ($7,324 [95% CI: $4,523–$10,792], 33%) | Care costs classified here as direct rather than indirect costs |
| Myasthenia gravis | Ignatova et al., 2022 (27) | 54 | Cost-of-illness study (patient survey, non-comparative) | [Median] $0 | Most patients reported reliance on informal carers | [Median for professional caregiver] $0 (IQR: $0–$0) [Median for informal caregiver] $0 ($0–$0) |
NR | [Median] $0 (IQR: $0–$0) | NR | NR | NR | NR | Reported social services and professional caregiver costs were very low because most patients reported reliance on informal caregivers |
| Myasthenia gravis | Lin et al., 2020 (21) | 3,341 | Cost analysis (retrospective, non-comparative) | NR | NR | NR | NR | NR | NR | NR | NR | NR | Out-of-pocket expenses increased during the study, and out-of-pocket expenses outside scope of basic medical insurance reimbursement increased from 12.6 to 18.7% of total expenses |
| Myasthenia gravis | Schepelmann et al., 2010 (54) | 107 patients with amyotrophic lateral sclerosis (n = 46), myasthenia gravis (n = 41) or facioscapulohumeral muscular dystrophy (n = 20) | Patient questionnaires and diaries (non-comparative) | [From societal perspective] $5,082 (95% CI: $1,821–$12,787) | 20.6% of all study participants (patients with amyotrophic lateral sclerosis, myasthenia gravis or facioscapulo-humeral muscular dystrophy) received formal care | [Informal care] $1,658 (95% CI: $219–$7,413) | NR | [Premature retirement cost for myasthenia gravis] $3,042 (95% CI: $1,530–$10,728) | NR | [Temporary disability] $383 (95% CI: $91–$1,239) | NR | NR | [For patients with all 3 diseases in the study] Average number of days per year in which patients were absent from work was 23 ± 19 (range: 2–60) |
| Myasthenia gravis | Sonkar et al., 2017 (30) | 66 | Cost analysis (prospective, non-comparative) | [Median, n = 66] $370 (range: $94–$16,320) | NR | NR | NR | NR | NR | NR | NR | NR | None |
| NMOSD | Beekman et al., 2019 (38) | 193 | Cost analysis (performed within a study of patient experience and quality of life, non-comparative) | NR | NR | NR | NR | [Lost income] $78,063 (largest cost, but data from only 3 patients) | NR | NR | NR | NR | None |
| NMOSD | Hughes et al., 2022 (36) | 117 patients and 74 informal carers | Analysis of health utilities and costs (patient survey, non-comparative) | NR | NR | [Daily cost of informal care, calculated by the proxy good method or the opportunity cost method] $264 (95% central range: $33–$439) or $493 ($467–$518) | 47 patients (40%) had left the workforce, including 16 (14%) due to their long-term illness and retirement | Of 13 patients (11%) in paid employment, 7 reported an average of 30 days of absence due to sickness during the 3 months before questionnaire completion | EDSS score ≤4.0, 4.5–6.5, 7.0–7.5 and 8.0–9.5 in 29 (26%), 56 (50%), 14 (13%) and 12 (11%) patients, respectively | Total cost during the 3 months preceding questionnaire completion increased with disability measured by EDSS, from $1,029 (95% central range: $698–$1,487) for the lowest EDSS category (≤4) to $59,900 ($5,288–$180,464) for the highest (EDSS 8.0–9.5). Cost for inpatient stay also increased markedly with disability, from $42 ($0–$165) to $47,513 ($0–$131,357) for the lowest and highest categories, respectively | The average 12-month cost for home adaptations was $8,867 (95% central range: $5,992–$11,739) | NR | 15% of patients purchased items for home adaptations, wheelchairs and mobility scooters, public liability insurance, medication and private prescriptions during the 12 months preceding questionnaire completion |
| NMOSD | Knapp et al., 2022 (39) | 130 | Cost analysis (based on health insurance data, comparison of patients with active disease vs. inactive disease vs. controls) | NR | NR | NR | NR | NR | NR | NR | Rehabilitation $742 Aids and remedies $2,424 |
NR | None |
Summary of publications with extractable cost estimates and cost drivers: indirect costs.
*Cost data were standardised according to the cost year stated in the reference manuscript. If a cost year range was provided, the latest date was taken. If no cost year was provided, the cost year was set to the publication year. †If the reporting country using Euros was not specified or if a pan-Europe study was conducted, Belgium was selected. ‡Patients with MOGAD diagnosed according to Jarius et al. (34). Costs shown are mean annual cost per patient unless otherwise indicated. The study by Mahdi-Rogers et al. (55) included three different diseases (CIDP, multifocal motor neuropathy and paraproteinaemic demyelinating neuropathy), but here we have extracted data for CIDP only. The study by Schepelmann et al. (54) included three different diseases (amyotrophic lateral sclerosis, facioscapulohumeral muscular dystrophy and myasthenia gravis), but here we have extracted data for myasthenia gravis only. Please see Supplementary Table 2 for further details of the studies included in this table. CI, confidence interval; CIDP, chronic inflammatory demyelinating polyneuropathy; EDSS, Expanded Disability Status Scale; HRQoL, health-related quality of life; IQR, interquartile range; IVIg, intravenous immunoglobulin; MOGAD, myelin oligodendrocyte glycoprotein antibody-associated disease; NMOSD, neuromyelitis optica spectrum disorder; SD, standard deviation; USD, US dollars.
Reported annual total cost of illness per patient, across all conditions assessed, ranged widely. The lowest annual total cost reported was a median of $3,690, based on conversion of the ~6.5 month reported cost to a full year in a Brazilian Federal District study of patients with Guillain–Barré syndrome (GBS), whereas the highest was a mean of $507,117 in a US study of GBS. Details of estimates of total annual costs are given in Table 1; for total direct costs, the corresponding low was a median of $1,981 to a high of mean $148,388 (Tables 2, 3) and for total indirect costs it was a median of $0 to a mean of $942,707 (Table 4). In most studies, direct costs appeared to comprise most (>70%) of the overall cost, although one study was an exception in this regard: a USA-wide study of GBS reported total direct medical cost as 14% of the total cost; the remaining 86% was attributable to indirect costs (20).
Reported costs for specific types of direct and indirect cost were similarly variable between studies, depending on country and disease. For example, reported costs for hospitalisation ranged from ~$0 to $93,039 (both medians) (26, 27). IVIg was an important contributor to direct medical costs in several diseases, accounting for 90% of the overall pharmacy cost in a study of CIDP and an estimated 85% of the total pharmacy cost in MG (28, 29). Several studies reported plasma exchange as less expensive or more cost-effective than IVIg (29–31), although others associated IVIg with reduced hospital stays and lower hospitalisation costs (32, 33).
In the only study of MOGAD (a cost investigation from Germany), most patients (n = 166) had NMOSD and 46 had MOGAD (25). The mean annualised cost of MOGAD/NMOSD was $94,688 (95% confidence interval, $81,418–$108,546), comprising direct medical costs (43%), direct non-medical costs (34%) and indirect costs (23%). Within direct medical costs, immunotherapy and inpatient hospital care were the significant drivers; those for direct non-medical costs and indirect costs were informal care and loss of salary, respectively. Need for care, number of acute attacks, unemployment, and disability measured by the Expanded Disability Status Scale (EDSS) were identified as independent predictors for cost of illness. The cost data were reported for NMOSD and MOGAD combined, as the authors found no cost differences between the two diseases stratified by disease duration and serostatus apart from in outpatient diagnostic tests (higher for MOGAD, but this was a small contributor to the overall cost of disease [<1%]). Although this study was performed prior to the publication of the 2023 MOGAD diagnostic guidelines, MOGAD was diagnosed according to international recommendations and MOG antibody positivity on a cell-based assay (34). Although studies comparing the 2023 MOGAD diagnostic criteria and the 2018 international recommendations published by Jarius et al. are sparse, one multicentre, retrospective study has found comparable sensitivity and specificity (35). One NMOSD study provided a total cost of illness with a mean annualised cost for the UK (calculated from the reported 3-month value) of $41,180 (36). In an NMOSD study from the USA, the median annual cost for IVIg was $29,247, the mean hospital cost was $34,893 and the mean cost for outpatient healthcare was $29,881 (37). Annual direct costs in NMOSD reported by other studies were $8,705 and $9,083 (mean hospital costs) (38, 39), $18,189 (mean healthcare cost) (39) and $5,248 (mean treatment cost; in this study, the term neuromyelitis optica [NMO] was used in preference to NMOSD) (40).
The authors of the MOGAD/NMOSD study compared the total cost of illness with that of MS and reported that it was higher for MOGAD/NMOSD ($94,688 vs. $65,495) despite disease severity and patient age being higher in the MS cohort (25). Our review did not include any studies focused specifically on MS.
Cost drivers
Cost drivers were explored in numerous studies and found to include treatment (e.g., IVIg), hospitalisation, disease severity, relapses, refractory disease, active disease, disability, loss of productivity and premature death (Tables 1–4).
Discussion
This narrative review confirms that data on cost of illness and health economic data for MOGAD are limited. We identified only one study with relevant cost data for MOGAD (25). This scenario is unsurprising given that MOGAD was only recently (October 2023) recognised as a separate entity within the ICD (8). The scarcity of economic data relating specifically to MOGAD supports our approach of examining data from analogous/proxy conditions; such methodology has been used by other groups to increase the robustness of economic modelling in rare diseases and is recognised by regulatory authorities in Europe and the USA (14–17).
Our results suggest that MOGAD and analogous conditions are associated with a range of direct and indirect costs likely to make them costly for the individual and place considerable burden on healthcare systems. As observed by Hümmert et al., the evaluation of disease-related cost is important for patients, their families and their physicians (25). It should also be a key consideration in decision-making by policy makers in the context of newly emerging treatment options for MOGAD (25). The aim of our study was to determine the overall economic impact of MOGAD. Therefore, we sought estimates of direct costs (those associated with healthcare) and indirect costs (those associated with reduced productivity) as well as the total cost. The long-term overall care requirements and effects of residual disability attributable to MOGAD are challenging to measure accurately (41–44). It is also important to note that the available economic evidence predates the new diagnostic criteria for MOGAD. Reported costs for other conditions may therefore have been affected by the inclusion of patients with MOGAD receiving an incorrect, non-MOGAD diagnosis. Unfortunately, no direct estimates of the economic impact of diagnostic insufficiencies were identified in our review. However, it is likely that an inaccurate or late diagnosis would result in delayed or inadequate treatment, slow/partial recovery between attacks and possible suboptimal management of residual disability – all of which have the potential to increase the economic burden of MOGAD. Previous studies have shown that diagnostic insufficiencies are common. It is estimated that only approximately 60% of patients receive their first consultation in less than 6 months after diagnosis, with 15% waiting over seven years; in addition, historically over half of patients have received an alternative (incorrect) diagnosis before confirmation of MOGAD (9, 45).
The extent to which results from different studies are comparable may be questioned. Costs may differ between studies according to the classification of specific elements as direct or indirect costs. Few studies provided a full and clear breakdown of either the elements included or their relative contributions to direct or indirect costs. Differences between countries in state funding can also have an effect, with costs that are borne by individual patients, their carers or their insurance companies in some countries being borne by the state healthcare system (and therefore wider society) in other countries.
In our review, the best insight into MOGAD came from a patient survey performed by Hümmert et al. in Germany (25). Economic data were reported for the whole population (n = 212: 46 patients with MOGAD and 166 with NMOSD), with the authors reporting little difference between the two diseases. Comparability of treatment costs for the two diseases may have been coincidental, considering the likelihood of differences in prescribing. For example, rituximab and inebilizumab are established options for patients with NMOSD but less likely to be used in MOGAD (rituximab has been shown to have reduced efficacy in MOGAD vs. NMOSD, and there are no ongoing clinical trials of inebilizumab in MOGAD) (46, 47). Additionally, maintenance therapy is usually commenced following a relapse in MOGAD; however, there is evidence that initiating maintenance therapy early, from the first attack, may substantially reduce the risk of relapse in MOGAD (48, 49), which may potentially reduce the economic burden of MOGAD.
Outpatient costs were higher with MOGAD vs. NMOSD, but Hümmert et al. attributed this to a difference in disease duration (25). Severity of disease, use of medications such as IVIg, hospitalisation costs and reduced productivity were all identified as major cost drivers (25). The authors also reported ‘need for care’, number of prior acute attacks, unemployment and disability measured using EDSS as statistically significant predictors of cost (25). An association between EDSS-measured disability and cost has also been observed in MS, consistent with the relationship between these conditions (50). Of note, Hümmert et al. observed that the cost of MOGAD/NMOSD was higher than the cost associated with MS; however, a full comparison of costs between these conditions will only be possible after MOGAD treatment guidelines and evidence are better established.
Studies in the other diseases included in our review reported findings that appeared consistent with the results of Hümmert et al. Although the NMOSD/NMO studies (36–40) reported generally lower costs than the study of MOGAD/NMOSD (25), methodological differences mean that cost variations are to be expected. Studies in CIDP and MG suggested similar drivers to those identified for MOGAD/NMOSD (30, 51–55). Studies in NMOSD, MG, CIDP and MOGAD/NMOSD reported that reduced quality of life and increased disability were associated with greater costs (36, 53, 54).
Our review suggested that a relapse can have a major impact on cost. In particular, the German study of NMOSD reported that the hospitalisation cost was >20-fold higher during the active phase (defined as the 30-day period following a relapse or period of hospitalisation for NMOSD) compared with the inactive phase (all other times) (39). Delays in diagnosis and treatment-refractory presentation may also increase the disease cost by increasing the risk of disability accrual (26, 56).
The principal limitation of this study is the sparsity of MOGAD-specific data. No study examined MOGAD alone, and only one study provided data for a mixed population of patients with NMOSD and patients with MOGAD (the majority of whom had NMOSD). Owing to differences between MOGAD and the analogous diseases included in our review, the applicability of data from other diseases to MOGAD may be questioned (variability in clinical presentation between different patients with MOGAD should also be considered here). Despite the limited quantity of available evidence and the disparate nature of studies in our review, some examples of overlap between studies in the patient populations are possible (e.g., where more than one study of one condition was conducted in a country). We acknowledge small sample sizes within studies as a further limitation. Comparisons between studies may be confounded by differences in a range of aspects such as disease severity, management approaches (for instance, novel treatments may be available for some conditions and not others) and definitions of direct vs. indirect costs. Direct costs do not differentiate between short-term treatment used to aid recovery from an attack and long-term treatments administered to prevent attacks or manage residual disability. In addition, financial structures differ considerably between countries. Most studies in our review were conducted in high-income countries, and the economic impact of MOGAD could differ in countries with lower income levels. Information from the included studies provides minimal insight into the costs of diagnosis, and there were no estimates of the economic impact of diagnostic delay or misdiagnosis. This may be related to the fact that specific testing for MOGAD became available only recently. These limitations are consistent with those typically encountered with rare diseases. In this context, Pearson et al. identified limitations in natural history and epidemiological data as key challenges in estimating the economic impact of treatment (57).
In conclusion, informal care, drugs (mainly immunotherapies) and indirect costs such as loss of income/employment are likely to be key cost contributors in the management of MOGAD. However, insight into the economic burden of MOGAD is limited by the fact that only one study has provided data from patients with this disease, and even in that study most patients had NMOSD. Further research on the economic burden of MOGAD is urgently needed.
Statements
Data availability statement
The original contributions presented in the study are included in the article/Supplementary material, further inquiries can be directed to the corresponding author.
Author contributions
LL: Conceptualization, Data curation, Formal analysis, Investigation, Methodology, Writing – original draft, Writing – review & editing. JB: Conceptualization, Data curation, Formal analysis, Methodology, Writing – review & editing. CH: Conceptualization, Data curation, Formal analysis, Funding acquisition, Writing – review & editing. HK: Conceptualization, Data curation, Formal analysis, Funding acquisition, Methodology, Supervision, Writing – review & editing.
Funding
The author(s) declare that financial support was received for the research and/or publication of this article. This study was funded by UCB. The funder was not involved in the study design, collection, analysis, interpretation of data, the writing of this article, or the decision to submit it for publication.
Acknowledgments
Medical writing support was provided by Niall Harrison of Apollo, OPEN Health Communications, and Ken Sutor, a contract writer working on behalf of OPEN Health Communications, and was funded by UCB. The authors thank Margarita Lens of UCB for publication and editorial support.
Conflict of interest
LL, HK, and JB have received research funding from UCB. CH was an employee of UCB at the time of the study.
Generative AI statement
The authors declare that no Gen AI was used in the creation of this manuscript.
Publisher’s note
All claims expressed in this article are solely those of the authors and do not necessarily represent those of their affiliated organizations, or those of the publisher, the editors and the reviewers. Any product that may be evaluated in this article, or claim that may be made by its manufacturer, is not guaranteed or endorsed by the publisher.
Supplementary material
The Supplementary material for this article can be found online at: https://www.frontiersin.org/articles/10.3389/fneur.2025.1506465/full#supplementary-material
References
1.
Al-Ani A Chen JJ Costello F . Myelin oligodendrocyte glycoprotein antibody-associated disease (MOGAD): current understanding and challenges. J Neurol. (2023) 270:4132–50. doi: 10.1007/s00415-023-11737-8
2.
Ambrosius W Michalak S Kozubski W Kalinowska A . Myelin oligodendrocyte glycoprotein antibody-associated disease: current insights into the disease pathophysiology, diagnosis and management. Int J Mol Sci. (2020) 22:100. doi: 10.3390/ijms22010100
3.
Rosenthal JF Hoffman BM Tyor WR . CNS inflammatory demyelinating disorders: MS, NMOSD and MOG antibody associated disease. J Investig Med. (2020) 68:321–30. doi: 10.1136/jim-2019-001126
4.
Shahriari M Sotirchos ES Newsome SD Yousem DM . MOGAD: how it differs from and resembles other neuroinflammatory disorders. AJR Am J Roentgenol. (2021) 216:1031–9. doi: 10.2214/ajr.20.24061
5.
Cortese R Prados Carrasco F Tur C Bianchi A Brownlee W De Angelis F et al . Differentiating multiple sclerosis from AQP4-neuromyelitis optica spectrum disorder and MOG-antibody disease with imaging. Neurology. (2023) 100:e308–23. doi: 10.1212/wnl.0000000000201465
6.
Xie H Shao Y Du J Song Y Li Y Duan R et al . Comparative analysis of clinical and imaging data between patients with myelin oligodendrocyte glycoprotein antibody disease and patients with aquaporin 4 antibody-positive neuromyelitis optica spectrum disorder. J Neurol. (2022) 269:1641–50. doi: 10.1007/s00415-021-10749-6
7.
Banwell B Bennett JL Marignier R Kim HJ Brilot F Flanagan EP et al . Diagnosis of myelin oligodendrocyte glycoprotein antibody-associated disease: International MOGAD Panel. Lancet Neurol. (2023) 22:268–82. doi: 10.1016/s1474-4422(22)00431-8
8.
ICD List . (2023). ICD List free resource for ICD-10-CM and ICD-10-PCS coding. Available online at: https://icdlist.com/ (Accessed October 4, 2024)
9.
Santoro JD Gould J Panahloo Z Thompson E Lefelar J Palace J . Patient pathway to diagnosis of myelin oligodendrocyte glycoprotein antibody-associated disease (MOGAD): findings from a multinational survey of 204 patients. Neurol Ther. (2023) 12:1081–101. doi: 10.1007/s40120-023-00474-9
10.
Hor JY Fujihara K . Epidemiology of myelin oligodendrocyte glycoprotein antibody-associated disease: a review of prevalence and incidence worldwide. Front Neurol. (2023) 14:1260358. doi: 10.3389/fneur.2023.1260358
11.
Mayo Clinic . (2024). Myelin oligodendrocyte glycoprotein antibody-associated disease (MOGAD). Available online at: https://www.mayoclinic.org/diseases-conditions/mogad/symptoms-causes/syc-20560476 (Accessed October 4, 2024)
12.
Jurynczyk M Messina S Woodhall MR Raza N Everett R Roca-Fernandez A et al . Clinical presentation and prognosis in MOG-antibody disease: a UK study. Brain. (2017) 140:3128–38. doi: 10.1093/brain/awx276
13.
Sechi E Cacciaguerra L Chen JJ Mariotto S Fadda G Dinoto A et al . Myelin oligodendrocyte glycoprotein antibody-associated disease (MOGAD): a review of clinical and MRI features, diagnosis, and management. Front Neurol. (2022) 13:885218. doi: 10.3389/fneur.2022.885218
14.
European Commission . (2024). Innovative designs, extrapolation, simulation methods and evidence – tools for rare diseases addressing regulatory needs. Available online at: https://cordis.europa.eu/project/id/101136365 (Accessed October 4, 2024)
15.
Garczarek U Muehlemann N Richard F Yajnik P Russek-Cohen E . Bayesian strategies in rare diseases. Ther Innov Regul Sci. (2023) 57:445–52. doi: 10.1007/s43441-022-00485-y
16.
Mishra S Venkatesh MP . Rare disease clinical trials in the European Union: navigating regulatory and clinical challenges. Orphanet J Rare Dis. (2024) 19:285. doi: 10.1186/s13023-024-03146-5
17.
National Library of Medicine . (2024). Regulatory processes for rare disease drugs in the United States and European Union: flexibilities and collaborative opportunities. Available online at: https://www.ncbi.nlm.nih.gov/books/NBK609394/. (Accessed January, 2025)
18.
Page MJ McKenzie JE Bossuyt PM Boutron I Hoffmann TC Mulrow CD et al . The PRISMA 2020 statement: an updated guideline for reporting systematic reviews. BMJ. (2021) 372:n71. doi: 10.1136/bmj.n71
19.
EPPI . (2024). CCEMG–EPPI Centre cost converter (v.1.7 last update: January 2024). Available online at: https://eppi.ioe.ac.uk/costconversion/ (Accessed March, 2025)
20.
Frenzen PD . Economic cost of Guillain–Barré syndrome in the United States. Neurology. (2008) 71:21–7. doi: 10.1212/01.wnl.0000316393.54258.d1
21.
Lin T-Y Zhang X-Y Fang P-Q Min R . Out-of-pocket expenses for myasthenia gravis patients in China: a study on patients insured by basic medical insurance in China, 2013–2015. Orphanet J Rare Dis. (2020) 15:13. doi: 10.1186/s13023-019-1289-9
22.
Rumalla K Reddy AY Letchuman V Mittal MK . Hyponatremia in Guillain–Barré syndrome. J Clin Neuromuscul Dis. (2017) 18:207–17. doi: 10.1097/cnd.0000000000000157
23.
Darbà J Marsà A . Chronic inflammatory demyelinating polyneuropathy in Spain: a retrospective analysis of hospital incidence and medical costs. Expert Rev Pharmacoecon Outcomes Res. (2022) 22:665–70. doi: 10.1080/14737167.2022.2000862
24.
World Bank . (2024). World Bank country classifications by income level for 2024–2025. Available online at: https://blogs.worldbank.org/en/opendata/world-bank-country-classifications-by-income-level-for-2024-2025 (Accessed October 4, 2024)
25.
Hümmert MW Schöppe LM Bellmann-Strobl J Siebert N Paul F Duchow A et al . Costs and health-related quality of life in patients with NMO spectrum disorders and MOG-antibody-associated disease: CHANCE (NMO) study. Neurology. (2022) 98:e1184–96. doi: 10.1212/wnl.0000000000200052
26.
Cohen J Sotoca J Gandhi S Yeshokumar AK Gordon-Lipkin E Geocadin RG et al . Autoimmune encephalitis: a costly condition. Neurology. (2019) 92:e964–72. doi: 10.1212/WNL.0000000000006990
27.
Ignatova V Kostadinov K Vassileva E Muradyan N Stefanov G Iskrov G et al . Socio-economic burden of myasthenia gravis: a cost-of-illness study in Bulgaria. Front Public Health. (2022) 10:822909. doi: 10.3389/fpubh.2022.822909
28.
Guptill JT Bromberg MB Zhu L Sharma BK Thompson AR Krueger A et al . Patient demographics and health plan paid costs in chronic inflammatory demyelinating polyneuropathy. Muscle Nerve. (2014) 50:47–51. doi: 10.1002/mus.24109
29.
Guptill JT Marano A Krueger A Sanders DB . Cost analysis of myasthenia gravis from a large U.S. insurance database. Muscle Nerve. (2011) 44:907–11. doi: 10.1002/mus.22212
30.
Sonkar KK Bhoi SK Dubey D Kalita J Misra UK . Direct and indirect cost of myasthenia gravis: a prospective study from a tertiary care teaching hospital in India. J Clin Neurosci. (2017) 38:114–7. doi: 10.1016/j.jocn.2016.11.003
31.
Winters JL Brown D Hazard E Chainani A Andrzejewski C Jr . Cost-minimization analysis of the direct costs of TPE and IVIg in the treatment of Guillain-Barré syndrome. BMC Health Serv Res. (2011) 11:101. doi: 10.1186/1472-6963-11-101
32.
Mandawat A Kaminski HJ Cutter G Katirji B Alshekhlee A . Comparative analysis of therapeutic options used for myasthenia gravis. Ann Neurol. (2010) 68:797–805. doi: 10.1002/ana.22139
33.
Tsai CP Wang KC Liu CY Sheng WY Lee TC . Pharmacoeconomics of therapy for Guillain–Barré syndrome: plasma exchange and intravenous immunoglobulin. J Clin Neurosci. (2007) 14:625–9. doi: 10.1016/j.jocn.2006.03.020
34.
Jarius S Paul F Aktas O Asgari N Dale RC de Seze J et al . MOG encephalomyelitis: international recommendations on diagnosis and antibody testing. J Neuroinflammation. (2018) 15:134. doi: 10.1186/s12974-018-1144-2
35.
Cai MT Hua Y Lai QL Su SY Shen CH Qiao S et al . Performance of the 2023 diagnostic criteria for MOGAD: real-world application in a Chinese multicenter cohort of pediatric and adult patients. BMC Med. (2025) 23:40. doi: 10.1186/s12916-025-03875-9
36.
Hughes DA Bourke S Jones A Bhatt R Huda S Mutch K et al . Health utilities and costs for neuromyelitis optica spectrum disorder. Orphanet J Rare Dis. (2022) 17:159. doi: 10.1186/s13023-022-02310-z
37.
Exuzides A Sheinson D Sidiropoulos P Gholizadeh S Magrini F Surinach A et al . The costs of care from a US claims database in patients with neuromyelitis optica spectrum disorder. J Neurol Sci. (2021) 427:117553. doi: 10.1016/j.jns.2021.117553
38.
Beekman J Keisler A Pedraza O Haramura M Gianella-Borradori A Katz E et al . Neuromyelitis optica spectrum disorder: patient experience and quality of life. Neurol Neuroimmunol Neuroinflamm. (2019) 6:e580. doi: 10.1212/nxi.0000000000000580
39.
Knapp RK Hardtstock F Wilke T Maywald U Deiters B Schneider S et al . Evaluating the economic burden of relapses in neuromyelitis optica spectrum disorder: a real-world analysis using German claims data. Neurol Ther. (2022) 11:247–63. doi: 10.1007/s40120-021-00311-x
40.
Holroyd K Vogel A Lynch K Gazdag B Voghel M Alakel N et al . Neuromyelitis optica testing and treatment: availability and affordability in 60 countries. Mult Scler Relat Disord. (2019) 33:44–50. doi: 10.1016/j.msard.2019.05.013
41.
Deschamps R Pique J Ayrignac X Collongues N Audoin B Zéphir H et al . The long-term outcome of MOGAD: an observational national cohort study of 61 patients. Eur J Neurol. (2021) 28:1659–64. doi: 10.1111/ene.14746
42.
Dyer SM Crotty M Fairhall N Magaziner J Beaupre LA Cameron ID et al . A critical review of the long-term disability outcomes following hip fracture. BMC Geriatr. (2016) 16:158. doi: 10.1186/s12877-016-0332-0
43.
Grand TS Ren S Hall J Åström DO Regnier S Thokala P . Issues, challenges and opportunities for economic evaluations of orphan drugs in rare diseases: an umbrella review. PharmacoEconomics. (2024) 42:619–31. doi: 10.1007/s40273-024-01370-2
44.
Lourida I Bennett HQ Beyer F Kingston A Jagger C . The impact of long-term conditions on disability-free life expectancy: a systematic review. PLOS Glob Public Health. (2022) 2:e0000745. doi: 10.1371/journal.pgph.0000745
45.
Levy M Zappacosta S Narduzzi S Khellaf M Unsworth M Trenholm E et al . The patient journey in myelin oligodendrocyte glycoprotein antibody disease (MOGAD): results from cross-sectional patient and physician surveys. Neurology. (2024) 103:S64–5. doi: 10.1212/01.wnl.0001051416.97564.fa
46.
Bai P Zhang M Yuan J Zhu R Li N . A comparison of the effects of rituximab versus other immunotherapies for MOG-IgG-associated central nervous system demyelination: a meta-analysis. Mult Scler Relat Disord. (2021) 53:103044. doi: 10.1016/j.msard.2021.103044
47.
Barreras P Vasileiou ES Filippatou AG Fitzgerald KC Levy M Pardo CA et al . Long-term effectiveness and safety of rituximab in neuromyelitis optica spectrum disorder and MOG antibody disease. Neurology. (2022) 99:e2504–16. doi: 10.1212/wnl.0000000000201260
48.
Deschamps R Guillaume J Ciron J Audoin B Ruet A Maillart E et al . Early maintenance treatment initiation and relapse risk mitigation after a first event of MOGAD in adults: the MOGADOR2 study. Neurology. (2024) 103:e209624. doi: 10.1212/wnl.0000000000209624
49.
Whittam DH Karthikeayan V Gibbons E Kneen R Chandratre S Ciccarelli O et al . Treatment of MOG antibody associated disorders: results of an international survey. J Neurol. (2020) 267:3565–77. doi: 10.1007/s00415-020-10026-y
50.
Dillon P Heer Y Karamasioti E Muros-Le Rouzic E Marcelli G Di Maio D et al . The socioeconomic impact of disability progression in multiple sclerosis: a retrospective cohort study of the German NeuroTransData (NTD) registry. Mult Scler J Exp Transl Clin. (2023) 9:20552173231187810. doi: 10.1177/20552173231187810
51.
Divino V Mallick R DeKoven M Krishnarajah G . The economic burden of CIDP in the United States: a case-control study. PLoS One. (2018) 13:e0206205. doi: 10.1371/journal.pone.0206205
52.
McCrone P Chisholm D Knapp M Hughes R Comi G Dalakas MC et al . Cost-utility analysis of intravenous immunoglobulin and prednisolone for chronic inflammatory demyelinating polyradiculoneuropathy. Eur J Neurol. (2003) 10:687–94. doi: 10.1046/j.1351-5101.2003.00701.x
53.
Mengel D Fraune L Sommer N Stettner M Reese JP Dams J et al . Costs of illness in chronic inflammatory demyelinating polyneuropathy in Germany. Muscle Nerve. (2018) 58:681–7. doi: 10.1002/mus.26315
54.
Schepelmann K Winter Y Spottke AE Claus D Grothe C Schröder R et al . Socioeconomic burden of amyotrophic lateral sclerosis, myasthenia gravis and facioscapulohumeral muscular dystrophy. J Neurol. (2010) 257:15–23. doi: 10.1007/s00415-009-5256-6
55.
Mahdi-Rogers M McCrone P Hughes RA . Economic costs and quality of life in chronic inflammatory neuropathies in southeast England. Eur J Neurol. (2014) 21:34–9. doi: 10.1111/ene.12245
56.
Harris L Allman PH Sheffield R Cutter G . Longitudinal analysis of disease burden in refractory and nonrefractory generalized myasthenia gravis in the United States. J Clin Neuromuscul Dis. (2020) 22:11–21. doi: 10.1097/cnd.0000000000000301
57.
Pearson I Rothwell B Olaye A Knight C . Economic modeling considerations for rare diseases. Value Health. (2018) 21:515–24. doi: 10.1016/j.jval.2018.02.008
58.
Oliveira AFM Gallo LG Bastos MM Abrahão AA Garcia KKS de Carvalho JKS et al . Costs of Guillain–Barré syndrome in the Brazilian Federal District: the patients’ perspective. Trans R Soc Trop Med Hyg. (2022) 116:310–21. doi: 10.1093/trstmh/trab118
59.
Fan X Xing C Yang L Wang J Feng L . Fatigue, self-efficacy and psychiatric symptoms influence the quality of life in patients with myasthenia gravis in Tianjin, China. J Clin Neurosci. (2020) 79:84–9. doi: 10.1016/j.jocn.2020.06.023
60.
Guptill JT Sharma BK Marano A Soucy A Krueger A Sanders DB . Estimated cost of treating myasthenia gravis in an insured U.S. population. Muscle Nerve. (2012) 45:363–6. doi: 10.1002/mus.22327
61.
Ting A Story T Lecomte C Estrin A Syed S Lee E . A real-world analysis of factors associated with high healthcare resource utilization and costs in patients with myasthenia gravis receiving second-line treatment. J Neurol Sci. (2023) 445:120531. doi: 10.1016/j.jns.2022.120531
62.
Cai MT Lai QL Zheng Y Fang GL Shen CH Xu YF et al . First-line immunotherapy of neuronal surface antibody-mediated autoimmune encephalitis: assessment of therapeutic effectiveness and cost-efficiency. Mult Scler Relat Disord. (2022) 66:104071. doi: 10.1016/j.msard.2022.104071
63.
Li A Gong X Guo K Lin J Zhou D Hong Z . Direct economic burden of patients with autoimmune encephalitis in western China. Neurol Neuroimmunol Neuroinflamm. (2020) 7:e891. doi: 10.1212/NXI.0000000000000891
64.
Sharp CN Fletcher A Muluhngwi P Snyder J Linder MW Jortani SA . A shared diagnostic stewardship approach toward improving autoimmune encephalopathy send-out testing utilization. J Appl Lab Med. (2021) 6:387–96. doi: 10.1093/jalm/jfaa123
65.
Allen JA Gelinas DF Freimer M Runken MC Wolfe GI . Immunoglobulin administration for the treatment of CIDP: IVIG or SCIG?J Neurol Sci. (2020) 408:116497. doi: 10.1016/j.jns.2019.116497
66.
Le Masson G Sole G Desnuelle C Delmont E Gauthier-Darnis M Puget S et al . Home versus hospital immunoglobulin treatment for autoimmune neuropathies: a cost minimization analysis. Brain Behav. (2018) 8:e00923. doi: 10.1002/brb3.923
67.
Perraudin C Bourdin A Vicino A Kuntzer T Bugnon O Berger J . Home-based subcutaneous immunoglobulin for chronic inflammatory demyelinating polyneuropathy patients: a Swiss cost-minimization analysis. PLoS One. (2020) 15:e0242630. doi: 10.1371/journal.pone.0242630
68.
Piscitelli E Massa M De Martino BM Serio CS Guglielmi G Colacicco G et al . Economic evaluation of subcutaneous versus intravenous immunoglobulin therapy in chronic inflammatory demyelinating polyneuropathy: a real-life study. Eur J Hosp Pharm. (2021) 28:e115–9. doi: 10.1136/ejhpharm-2020-002430
69.
Rajabally YA Afzal S . Clinical and economic comparison of an individualised immunoglobulin protocol vs. standard dosing for chronic inflammatory demyelinating polyneuropathy. J Neurol. (2019) 266:461–7. doi: 10.1007/s00415-018-9157-4
70.
Maheshwari A Sharma RR Prinja S Hans R Modi M Sharma N et al . Cost-minimization analysis in the Indian subcontinent for treating Guillain Barre syndrome patients with therapeutic plasma exchange as compared to intravenous immunoglobulin. J Clin Apher. (2018) 33:631–7. doi: 10.1002/jca.21646
71.
van Leeuwen N Lingsma HF Vanrolleghem AM Sturkenboom MC van Doorn PA Steyerberg EW et al . Hospital admissions, transfers and costs of Guillain–Barré syndrome. PLoS One. (2016) 11:e0143837. doi: 10.1371/journal.pone.0143837
72.
Qi CZ Hughes T Gelinas D Li Y Goyal A Brauer E et al . Real-world utilization patterns of intravenous immunoglobulin in adults with generalized myasthenia gravis in the United States. J Neurol Sci. (2022) 443:120480. doi: 10.1016/j.jns.2022.120480
73.
Nosadini M Mohammad SS Suppiej A Sartori S Dale RC . Intravenous immunoglobulin in paediatric neurology: safety, adherence to guidelines, and long-term outcome. Dev Med Child Neurol. (2016) 58:1180–92. doi: 10.1111/dmcn.13159
Summary
Keywords
central nervous system, economic burden, disease costs, inflammatory demyelinating disease, MOGAD
Citation
Lee L, Byrnes J, Hope C and Kim H (2025) A narrative review of the economic burden of myelin oligodendrocyte glycoprotein antibody-associated disease and analogous conditions. Front. Neurol. 16:1506465. doi: 10.3389/fneur.2025.1506465
Received
05 October 2024
Accepted
09 April 2025
Published
30 May 2025
Volume
16 - 2025
Edited by
Omid Mirmosayyeb, University at Buffalo, United States
Reviewed by
Thanos Tsaktanis, University of Erlangen Nuremberg, Germany
Mohammad Yazdan Panah, Shahrekord University of Medical Sciences, Iran
Roberto Carlos Lyra Da Silva, Rio de Janeiro State Federal University, Brazil
Updates
Copyright
© 2025 Lee, Byrnes, Hope and Kim.
This is an open-access article distributed under the terms of the Creative Commons Attribution License (CC BY). The use, distribution or reproduction in other forums is permitted, provided the original author(s) and the copyright owner(s) are credited and that the original publication in this journal is cited, in accordance with accepted academic practice. No use, distribution or reproduction is permitted which does not comply with these terms.
*Correspondence: Leonard Lee, leonard.lee@griffith.edu.au
Disclaimer
All claims expressed in this article are solely those of the authors and do not necessarily represent those of their affiliated organizations, or those of the publisher, the editors and the reviewers. Any product that may be evaluated in this article or claim that may be made by its manufacturer is not guaranteed or endorsed by the publisher.