Abstract
Rationale and objectives:
Only a few studies examined the correlation between cerebrovascular reactivity (CVR) and other physiological parameters such as cerebral blood flow (CBF), oxygen extraction fraction (OEF) and cerebral metabolic rate of oxygen (CMRO2). In this study, these baseline parameters were measured using 3D MRI with whole brain coverage for the investigation of global and regional correlation between each other to enhance understanding of brain function and improve tumor diagnosis.
Materials and methods:
All measurement were performed at 3 T. CVR was derived from a breath-holding task. Baseline CBF was measured by pseudo-continuous arterial spin labeling. Baseline OEF was measured with a gradient-echo sampling of spin-echo pulse sequence. T1 weighted anatomical image (T1W) was measured using MPRAGE sequence. CVR was calculated using customized written programs. CBF was quantified by using ASLtbx. For OEF analysis, a feedforward artificial neural network was used. CMRO2 was calculated based on smoothed and normalized CBF and OEF. General linear regression analysis was used to examine the relations between CVR and other parameters in five lobes of gray matter including frontal, parietal, temporal, occipital and insula lobes in individual healthy subjects. Spearman correlation was performed to check the regional correlations in an Automated Anatomical Labeling (AAL) atlas.
Results:
Fifteen healthy volunteers and five patients with brain tumors were included. In the healthy subjects, five lobes had a positive correlation between CBF and CVR (p < 0.05). Similarly, in five lobes positive correlations between CMRO2 and CVR were found (p < 0.05), as well as significant inter- and intra-subject correlations (p < 0.001). However, there were no significant correlations between OEF and other parameters.
Conclusion:
Our findings demonstrate that CVR is strongly associated with CBF and CMRO₂ at both global and regional levels in healthy brains, but not with OEF. These results provide new insight into the complex interplay between vascular reactivity, perfusion, and metabolism and underscore the potential of combined CVR-CBF-CMRO2 imaging for assessing brain health and pathology.
Introduction
Cerebrovascular reactivity (CVR) is an index of the brain vessels’ dilatory capacity, and is typically measured using hypercapnic gas inhalation or breath-holding as a vasoactive challenge (1–3). Research indicates that the baseline vascular state is associated with CVR. During task-induced and resting states, changes in CVR were shown to be modulated by the vascular and metabolic baseline states (4–9). The vascular and metabolic baseline states includes cerebral blood flow (CBF), oxygen extraction fraction (OEF) and cerebral metabolic rate of oxygen (CMRO2).
Measurements of these parameters have been performed in the analysis of brain metastases (10), calibrated fMRI (11), or for the effect of acetazolamide administration using 15O PET (12). However, a limited number of studies have investigated the correlation, particularly the regional correlation, of CVR with other physiological parameters such as OEF and CMRO2 (13, 14). Previous research (7) has shown a significant association between task-related fMRI responses and underlying physiological factors at rest, such as CVR and baseline venous blood oxygenation (Yv). Another study (6) explored similar physiological influences on resting-state fMRI metrics, revealing their significant impact on both resting-state functional activity (RSFA) and functional connectivity (FC) measurements. Additionally, other reports showed a positive correlation between baseline cerebral blood flow (CBF) and CVR, both between- and within-subjects (15–17). Whole brain physiological parameters such as global CBF, global venous oxygenation (Yv), RSFA, and CVR have been measured and studied (6, 7). Baseline Yv was determined in the superior sagittal sinus using the T2-Relaxation-Under-Spin-Tagging (TRUST) technique (8), CVR was measured using inhalation of 5% CO2 gas, RSFA was eventually obtained, and whole brain baseline cerebral blood flow (CBF) was measured using phase contrast (7). It was shown that the fMRI signal amplitude was positively correlated with CVR and RSFA, but negatively correlated with baseline Yv. Furthermore, among the physiological modulators themselves, significant correlations were observed between baseline Yv and baseline CBF, and between CVR and RSFA, suggesting that some of the modulators may partly be of similar physiological origins.
Regional correlations among these physiological parameters may help to elucidate the metabolic demands of different brain areas. Additionally, they may shed light on how these areas respond to changes in blood flow and oxygen supply. In this study, these baseline physiological parameters were measured using MRI covering the full brain. We calculated regional and global correlations between breathing task-derived CVR and baseline CBF, OEF, and CMRO2 in healthy volunteers and in patients with tumors. Our main objective was to investigate correlations among CVR, CBF, OEF, and CMRO2 in healthy individuals across lobes of gray matter, as well as to assess their variations between and within subjects. Additionally, we included a small cohort of brain tumor patients to evaluate the feasibility of the method in a clinical setting and to identify potential correlations among individual parameters within the tumor region, as previously described (18).
Methods
Fifteen healthy volunteers (7 female, 8 male, aged 30 ± 5 years) were examined prospectively using a 20-channel head coil on a 3 T scanner (Magnetom Prisma, Siemens Healthineers, Erlangen, Germany). All participants provided written informed consent, and the study was approved by the institutional ethics committee. Additionally, five patients with brain tumors were measured using a 64-channel head coil on the same scanner.
To measure CVR, breath-hold (BH) respiratory challenges were integrated into a standard clinical brain imaging protocol: for block-designed BH tasks, 110 measurements were obtained, which include five and a half BH/FB (free breathing) cycles with 20 measurements (34 s) per full cycle and 10 measurements (17 s) per half cycle. The duration of breath hold time and free breathing time were both 17 s. To measure baseline CBF, a pseudo-continuous arterial spin labeling (pCASL) sequence with 3D gradient- and spin-echo imaging (GRASE) readout was applied before BH tasks. Presaturation before labeling and background suppression during a postlabeling delay (PLD) were added. Baseline OEF was determined based on a gradient-echo sampling of spin-echo (GESSE) pulse sequence (19). The baseline CMRO2 was then calculated from CBF and OEF. Specific sequence parameters and data analysis are as follows.
CVR (2D gradient-echo EPI): FOV = 220 × 220 × 118 mm3, matrix size = 64 × 64 × 28, resolution = 3.4 × 3.4 × 3.5 mm3, slice gap = 0.7 mm, in-plane iPAT factor = 2, multiband factor = 2, bandwidth = 1776 Hz/px, TE = 27.08 ms, TR = 1700 ms. Total acquisition time = 3.12 min. Preprocessing including motion correction and slice timing correction was performed with SPM12 (Wellcome Trust Centre for NeuroImaging, UK) and postprocessing was implemented using customized programs written in MATLAB (MathWorks, Natick, MA, USA). In conventional CVR analysis, measurements of end-tidal CO2 (Et-CO2) are required and used in a linear regression equation (20). Since we did not have Et-CO2 measurements available, CVR was estimated by replacing Et-CO2 with the mean signal of gray matter (21). Motion correction using SPM including realignment and reslicing and nuisance regression was performed to remove the motion corruption induced by the breath-holding task.
Baseline CBF (3D pCASL GRASE): FOV = 220 × 220 × 120 mm3 matrix size = 64 × 64 × 24, resolution = 3.4 × 3.4 × 5 mm3, slice and plane partial Fourier = 6/8, slice oversampling = 16.7%, FA = 120°, segments = 2, Bandwidth = 2,298 Hz/px, labeling duration = 1.8 s, PLD = 1.8 s, TE = 17.18 ms, TR = 4,500 ms. This sequence had 20 tag and 20 control volumes and one M0 volume, for a total scan time of approximately 7 min. CBF was calculated using ASLtbx (22). A labeling efficiency of 0.86 was assumed in the calculation.
Baseline OEF (GESSE): FOV = 256 × 192 × 117 mm3, partial Fourier = 6/8, matrix size = 128 × 96 × 30, resolution = 2 × 2 × 3 mm3, slice gap = 0.9 mm, TE = 51 ms; TR = 105 ms, number of total echoes = 64, number of echoes before echo center = 20, averages = 3, acquisition time was about 10 min. For OEF analysis, a feedforward ANN (artificial neural network) was used because of its high capability for nonlinear regression problems (23). Here, an ANN was chosen for its robust curve-fitting, good resilience to noise and outliers, and superior computational speed compared to conventional least-squares regression (LSR) methods. The ANN consisted of a 64-dimensional input layer, two hidden layers (32 and 10-dimensional), and a 4-dimensional output layer. Itwas implemented using the Neural Network Toolbox provided by MATLAB. The ANN was trained based on the full quantitative BOLD (qBOLD) model (24). Thereby, artificial GESSE signals with a known ground truth were simulated for plausible ranges of the input variables SSE, R2, λ, and OEF. To reduce overfitting artifacts, noise was added to the simulated GESSE signals before the actual ANN training (23) was initialized.
T1 weighted anatomical image (T1W): FOV = 230 × 230 × 176 mm3, matrix size = 320 × 320 × 176, resolution = 0.4 × 0.4 × 1 mm3, in-plane iPAT factor = 2, slice partial Fourier = 6/8, TE = 2.63 ms, TR = 1700 ms, TI = 900 ms, FA = 8°, Bandwidth = 2,298 Hz/px, acquisition time was about 5 min.
The CVR and CBF maps were smoothed using a Gaussian kernel with full width at half maximum of 4 mm. Next, all images were coregistered to the T1W and normalized to the Montreal Neurological Institute (MNI) standard brain space for healthy subjects.
Baseline CMRO2: After smoothing and normalization of CBF and OEF into MNI space, CMRO2 was calculated as (25):
The oxygenated heme molar concentration in arterioles [H]a was assumed to be 7.377 μmol/mL (24).
Statistical analyses
General linear regression analysis was used to examine the relations between CVR and other parameters in five lobes of gray matter including frontal, parietal, temporal, occipital and insula lobes in individual healthy subjects. Parameter maps were averaged across healthy subjects to compute group-level histograms in the whole brain, gray matter (GM) and white matter (WM). Spearman correlation was performed to check the regional correlations in an Automated Anatomical Labeling (AAL) atlas with 116 indexes. In order to extract the top 12 (i.e., 10% of 116) correlation regions, AASL regions with the lowest p-value were selected and plotted. For the patients, tumor regions of interest (ROIs) were manually selected based on the gadolinium contrast enhanced T1 weighted images (CET1W). A correlation matrix was generated to compare voxel-wise Spearman correlations between parameters within these ROIs.
Results
Normalized and averaged maps of CVR, CBF, OEF and CMRO2 are presented in Figure 1. In the CVR maps, an increased value can be noticed at the location of large draining veins such as the superior sagittal sinus and the transverse sinus. The CBF and CMRO2 maps demonstrate a similar contrast, although with a different value range. OEF was homogeneous across most of the brain, but not at the center of the brain such as within the thalamus and putamen regions.
Figure 1

Normalized and averaged maps of CVR, CBF, OEF, and CMRO2. The distribution of CBF is similar to CMRO2, since the OEF is very homogeneous. The distribution of CVR is different from CBF and CMRO2, especially in large draining veins.
After linear regression, a positive correlation between CBF in five lobes and CVR across subjects was found (p < 0.05). Positive correlations between CMRO2 in the same regions and CVR across subjects were also found (p < 0.05). CBF and CMRO2 were almost perfectly correlated (p < 0.001, r2 = 1.0). However, correlations between OEF and other parameters were not significant. (p = 0.58 for OEF-CVR, p = 0.15 for OEF-CBF, p = 0.27 for OEF-CMRO2). Specific results are presented in Figure 2.
Figure 2
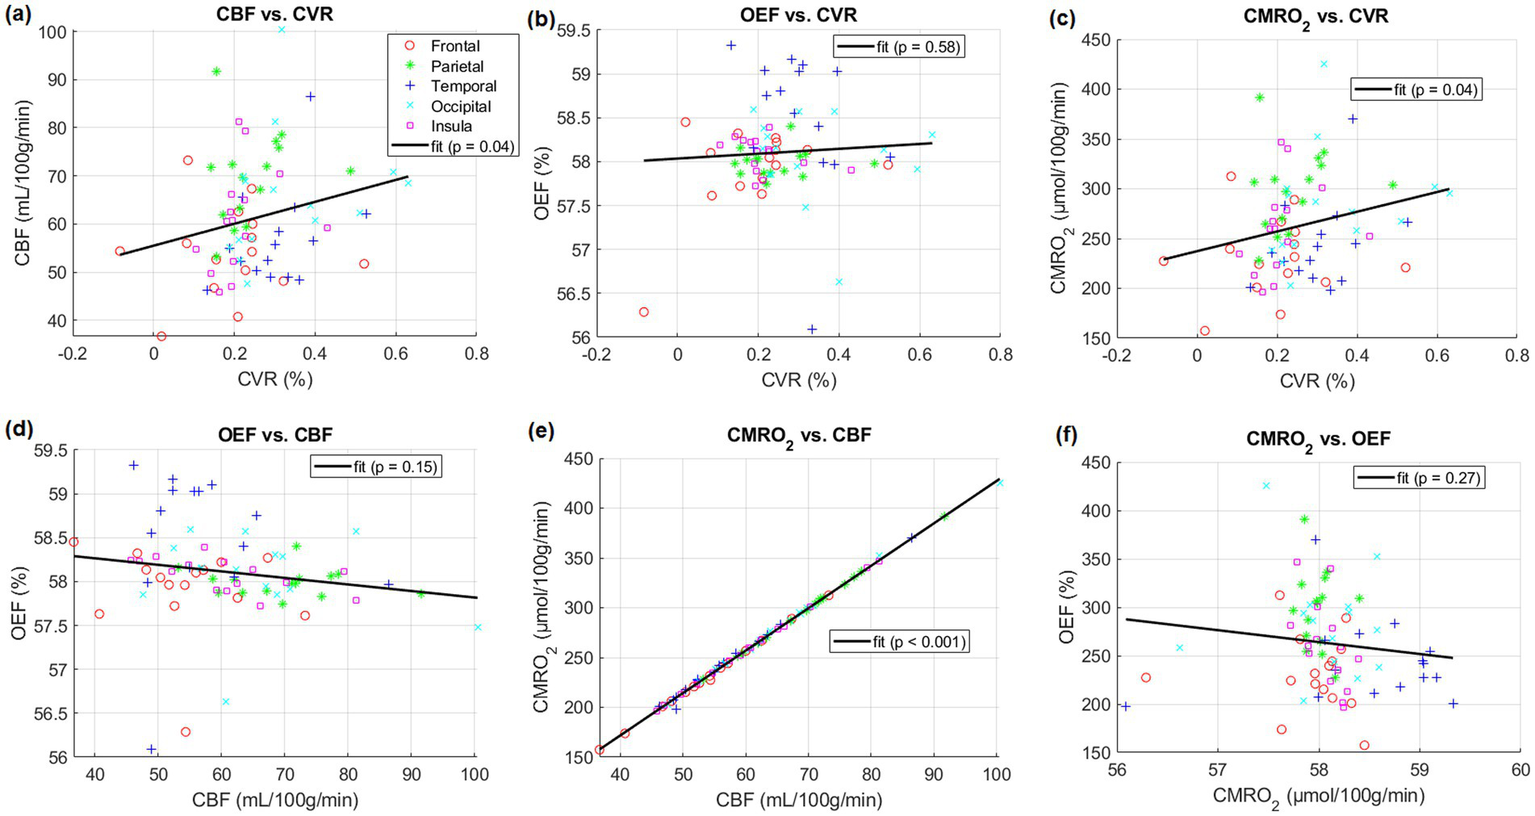
Comparisons between different physiological parameters averaged in listed five lobes of gray matter including frontal, parietal, temporal, occipital and insula lobes of individual subjects, respectively. Linear regressions and their parameters are included.
The histogram of CVR exhibited two peaks (GM and WM) in the intensity distribution (Figure 3). CBF and CMRO2 histograms were similarly distributed but showed a wider distribution. However, the histograms of OEF were very different and had a strong peak at the same location (≈57.8) both in the whole brain as well as within each of GM and WM separately.
Figure 3

Histograms of CVR, CBF, OEF and CMRO2 maps, averaged for all heathy participants and individual subject (subject 1–15 as thin lines), in their whole brain, gray matter and white matter, respectively.
Figure 4 shows the Spearman correlation coefficients r between each pair among CVR, CBF, OEF and CMRO2. We saw strong positive correlations for CVR vs. OEF and CMRO2 in the white matter areas, especially for CVR vs. CMRO2 in the occipital region. On the other hand, some areas showed a strong negative correlation, e.g., CVR vs. OEF in the fronto-insular region or CBF vs. OEF in the insular region. A strong correlation between CBF and CMRO2 was found in the whole brain except for parts of the frontal region.
Figure 4

Correlation coefficients (r) between different parameters across subjects after using Spearman correlation. Correlation coefficients r is mapped to color as shown; −log10(p) is mapped to transparency. The range of -log10(p) was set to 0–1.3, corresponding to a p-value threshold of p < 0.05.
The correlations r of top 12 AAL regions with lowest p-value are shown in Figure 5. Due to the high correlation between CBF and CMRO2, all 116 AAL regions were selected (Figure 5E).
Figure 5
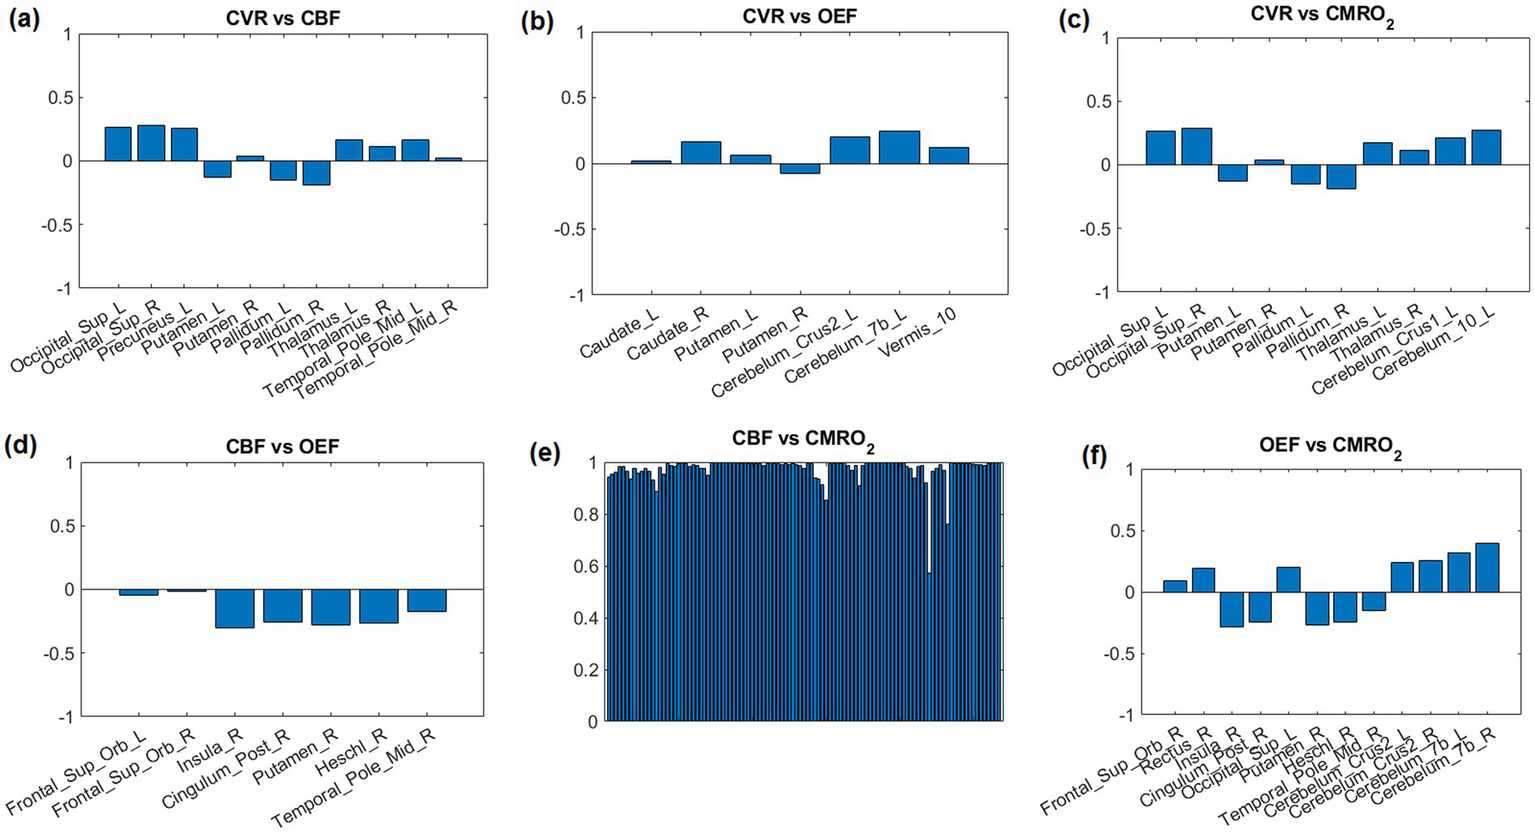
Correlation coefficients between parameter pairs are shown for the top 12 regions with the lowest average p-values. Due to the high correlation between CBF and CMRO2, all 116 AAL regions were selected (E).
The first patient with a brain tumor (melanoma) is presented in Figure 6. The primary tumor was located at the right nuchal. ROI with abnormal CET1W were selected and different parameter maps within this ROI were overlaid. The regions with high CBF showed lower OEF.
Figure 6
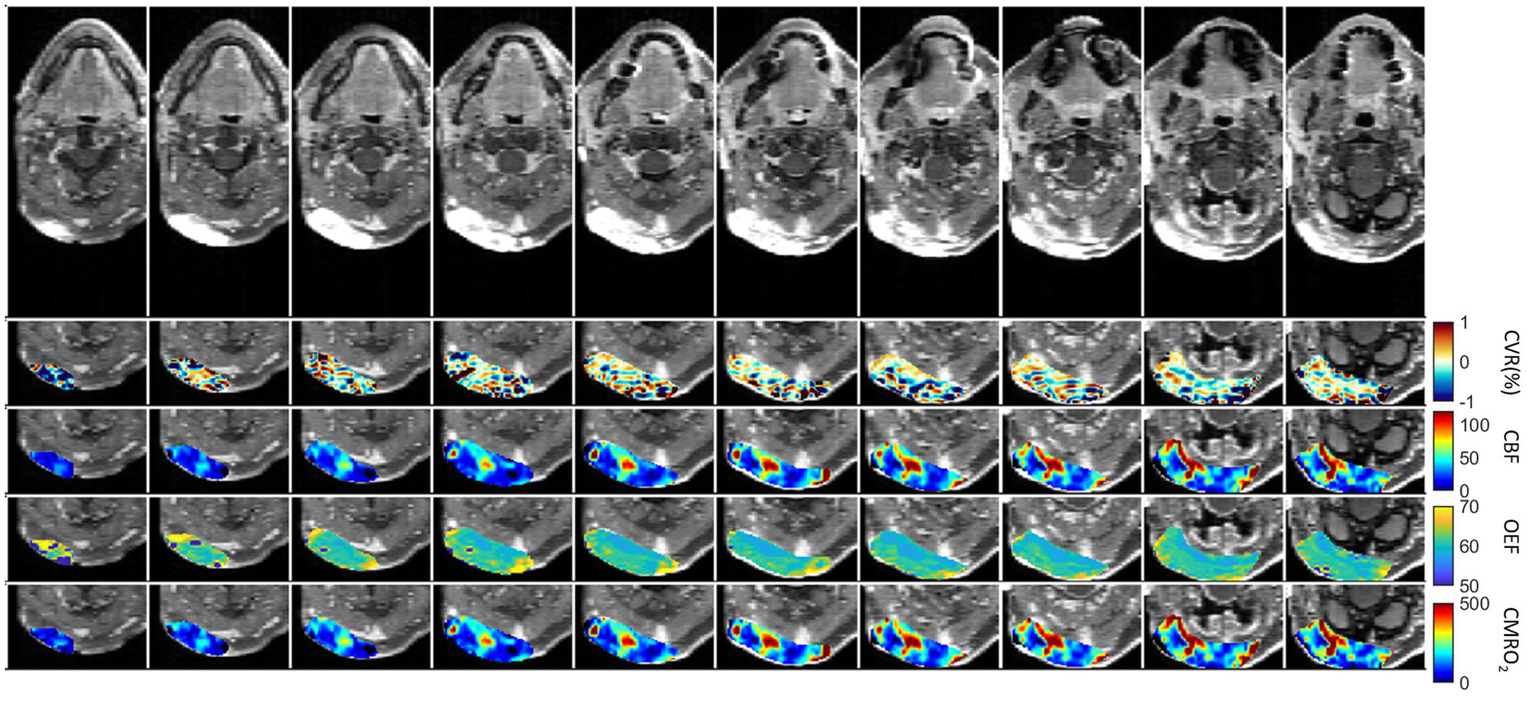
First patient with Melanoma (male, 59 years old, after therapy with Encorafenib und Binimetinib). The primary tumor was located at the right nuchal. ROI with abnormal CET1W were selected and different parameter maps within this ROI were overlaid.
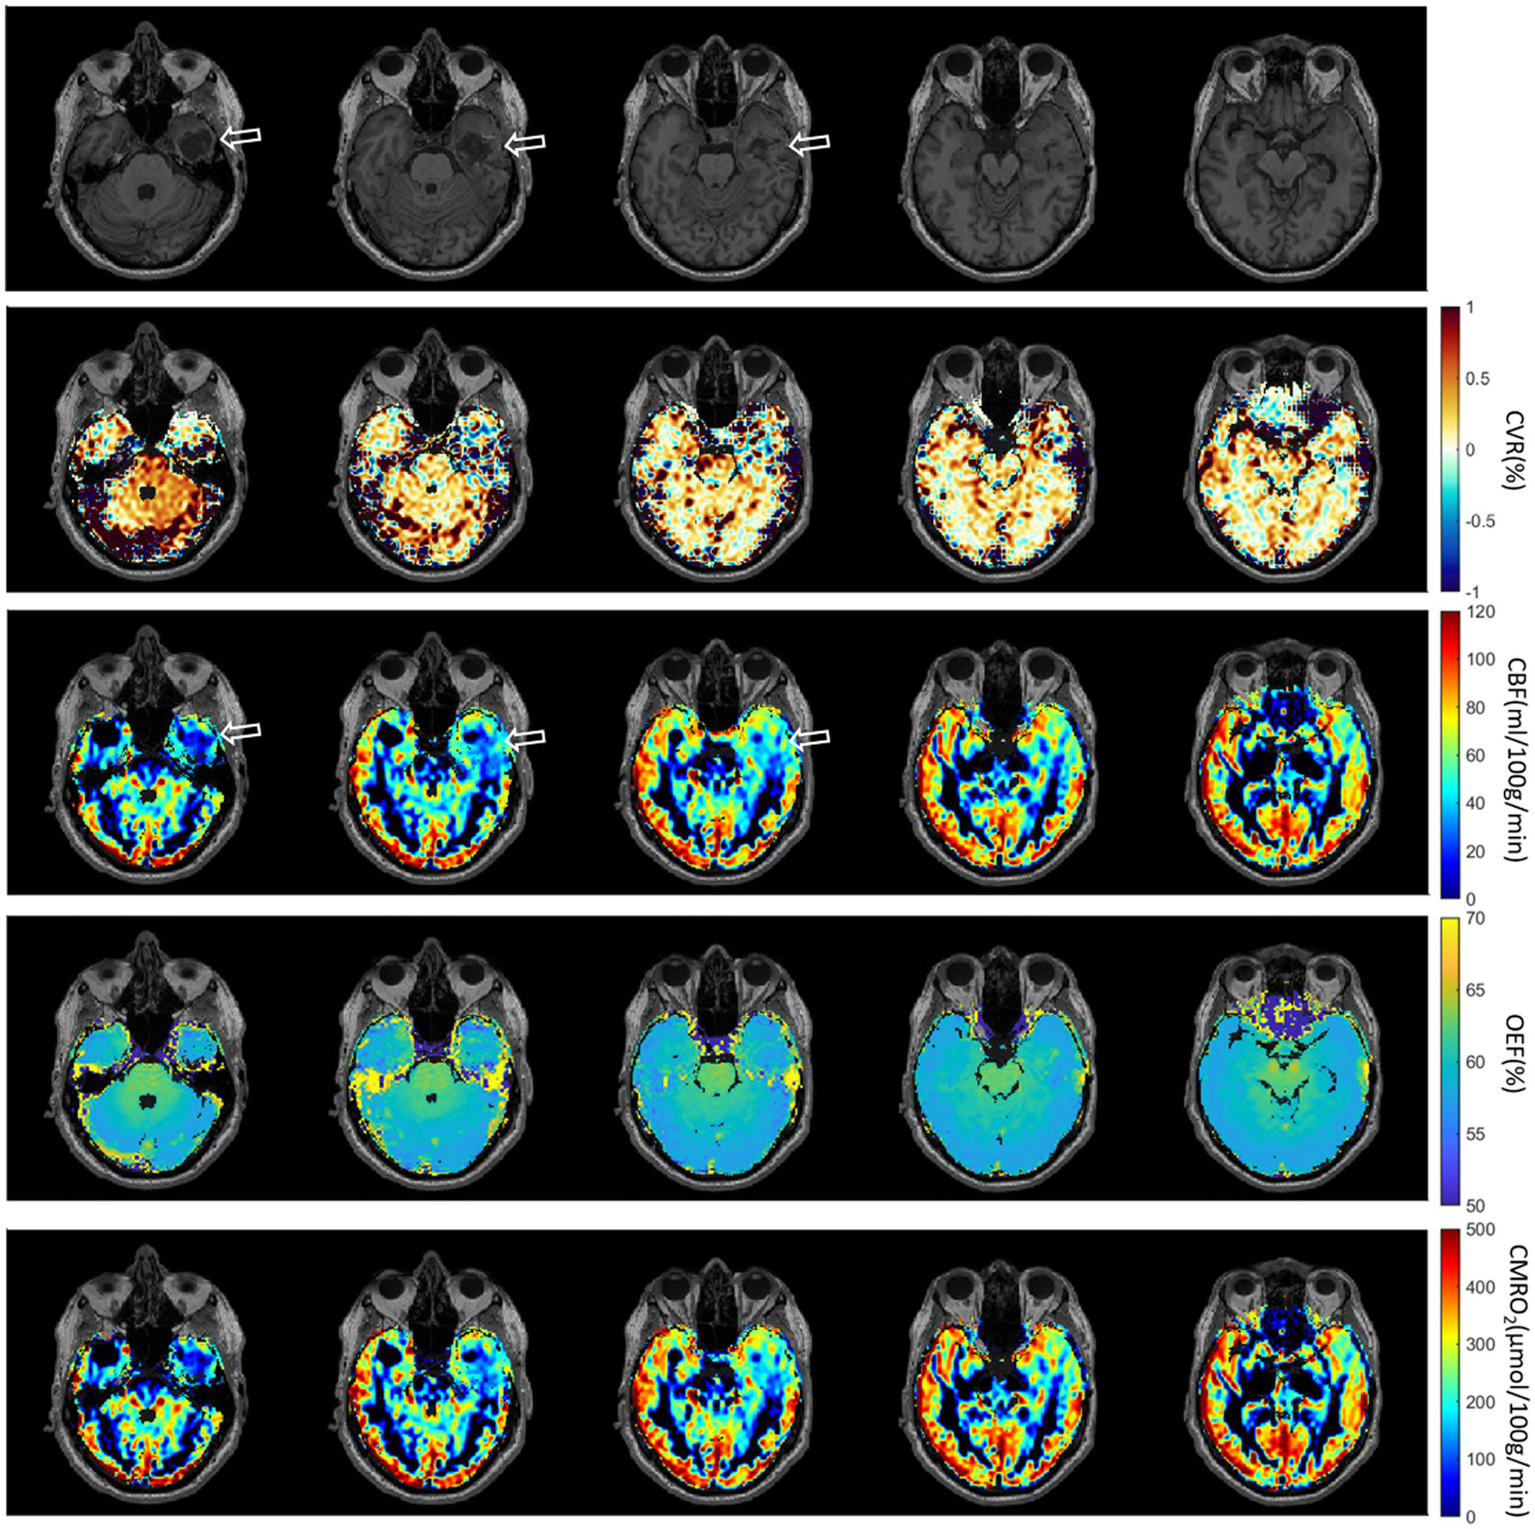
The second patient with multiple brain metastases (melanoma) is presented in Figure 7. The metastases were located at gyrus rectus on the left side (first column), in the frontal operculum on the left side (second column and third column), frontal lobe on the right side (fourth column) without CET1W-hyperintersities, and cingulate gyrus on the left side (fifth column). Brain ROIs were masked and different parameter maps within the brain were overlaid on CET1W. The brain ROIs were defined according to CET1W. White matter was not intentionally excluded. Each parameter displayed abnormalities in different locations. OEF showed enhancements at the location with abnormal CET1W. CBF was increased at the first location but decreased at the last location. CVR was decreased in some metastasis locations.
Figure 7
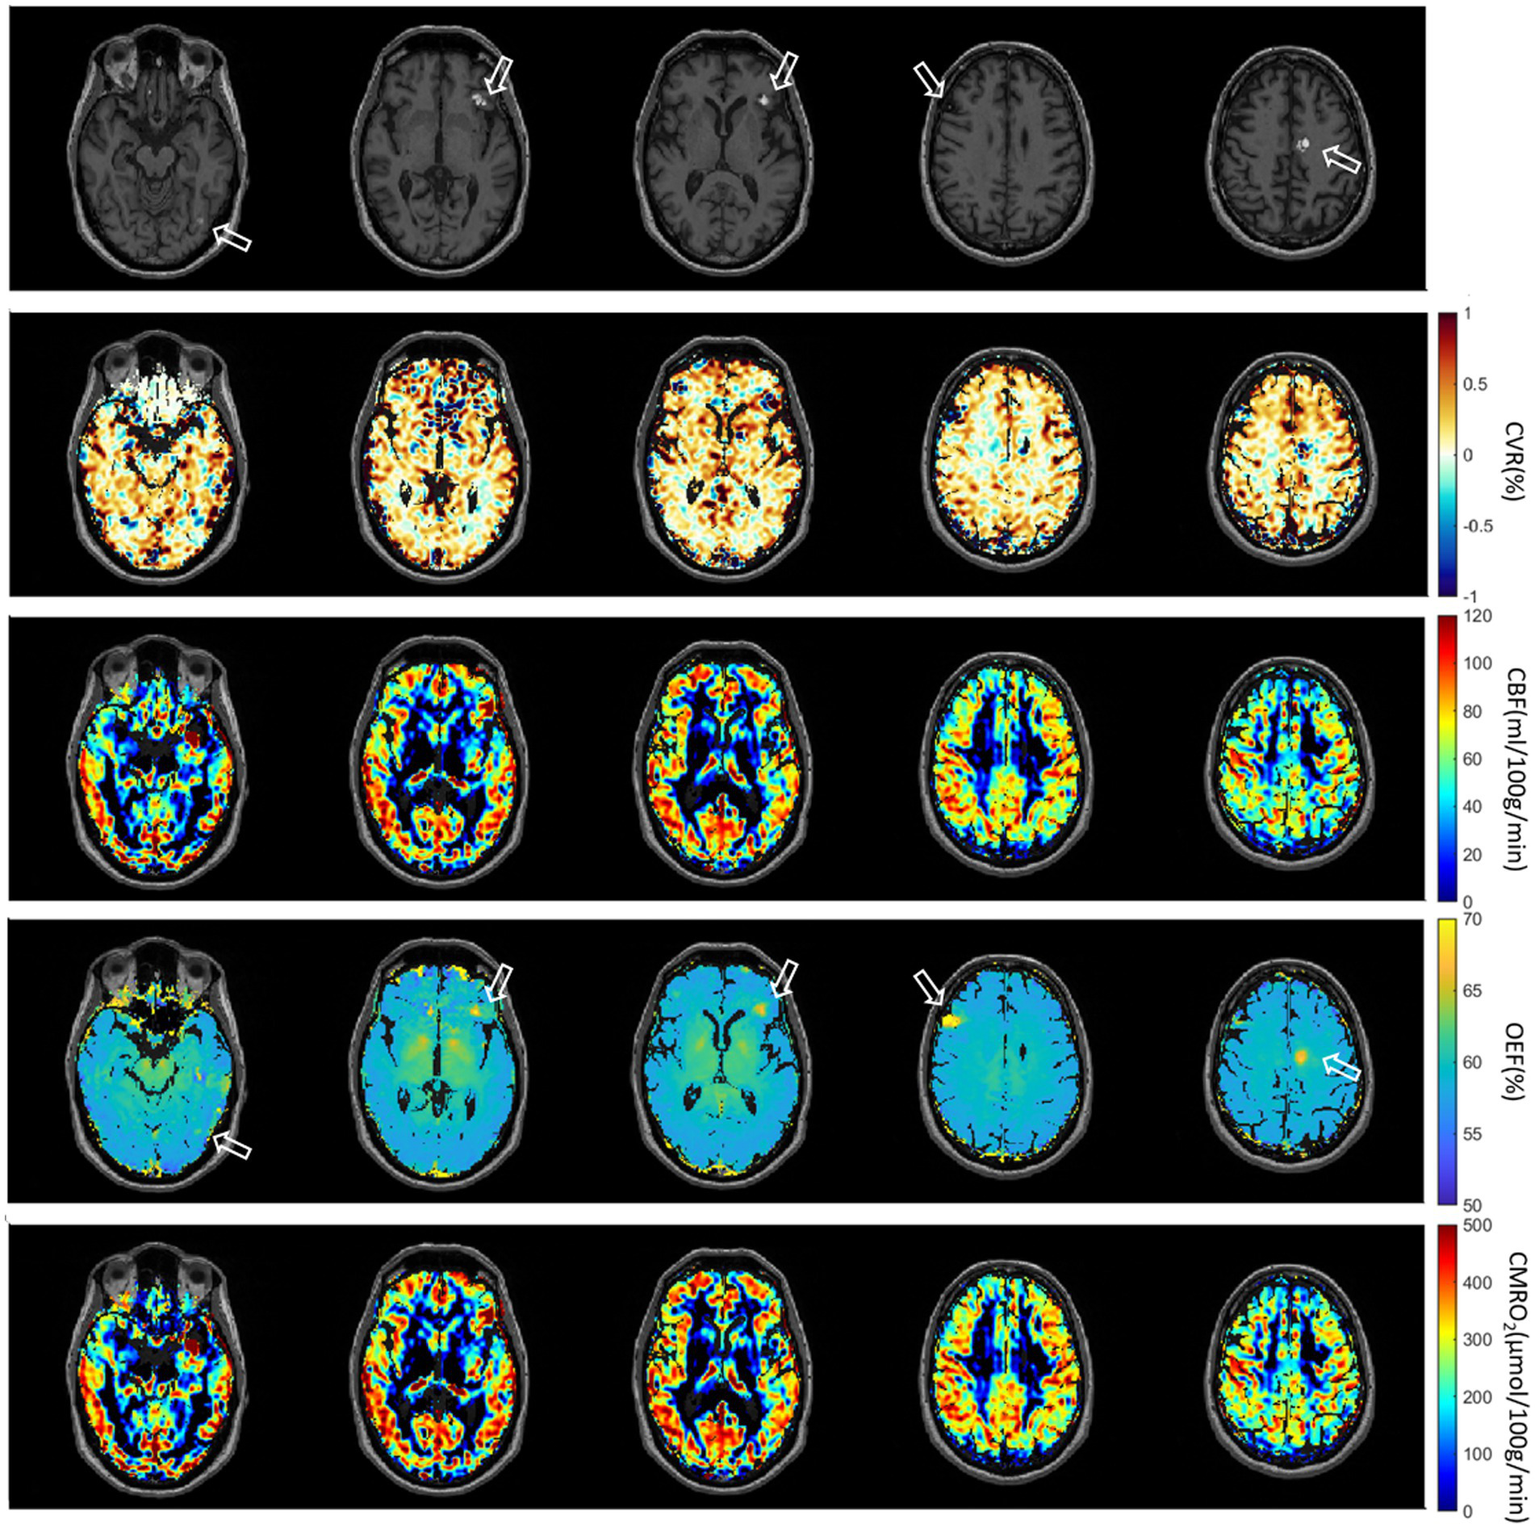
Second patient with Melanoma (male, 55 years old, after therapy with Nivolumab). The metastases are located at gyrus rectus on the left side (first column), in the frontal operculum on the left side (second column and third column), frontal lobe on the right side (fourth column) without CET1W-hyperintersities, and cingulate gyrus on the left side (fifth column).
The third patient with brain Glioblastoma is presented in Figure 8. A defect area after resection of a Glioblastoma in the left temporal lobe with infiltration of the adjacent dura could be observed. Brain ROIs were masked and different parameter maps within the brain were overlaid on CET1W. Generally, CBF and CMRO2 were decreased at the tumor location. CVR was increased at the lower tumor ring, as indicated in the first column.
Figure 8
Third patient with brain Glioblastoma (male, 67 years old, after resection). The defect area after resection of a Glioblastoma in the left temporal lobe with infiltration of the adjacent dura could be observed.
Voxel-wise Spearman’s correlation coefficients between all pairs of physiological parameters in patient tumor ROIs are presented in Supplementary Figure S1. Except the strong correlation between CBF and CMRO2, there was no correlation between other physiological pairs. The results of the remaining patients are presented in Supplementary Figures S2 and S3. Subject-specific maps of T1W, CVR, CBF and OEF from the first six subjects are presented in Supplementary Figure S4.
Discussion
This study aimed to investigate how CVR derived from a breathing task relates to baseline CBF, OEF, and CMRO2. Consistent with previous reports, we found a significant positive correlation between CBF and CVR in five lobes of gray matter (Figure 2A) (6, 15, 17). Additionally, we found no significant correlation between OEF and CBF. This finding contradicts those of earlier research here OEF and CBF was found to be significantly correlated (p = 0.01) (7).
In this study, correlations between OEF and CVR in five lobes were not significant (Figure 2B). Significant positive correlations between CMRO2 and CVR in these lobes across subjects were also found (Figure 2C).
The CVR maps displayed increased values near the large draining veins, like the superior sagittal and transverse sinuses (Figure 1). These increased values were most likely a result of the interaction between sensitivity of the BOLD signal to blood oxygenation, proximity to large vessels, as well as partial volume effects, and the hemodynamic response in these regions. These elevated values do not necessarily reflect brain tissue reactivity but rather the influence of nearby venous structures. Increased OEF in central brain regions like the thalamus and putamen (Figure 1) may be driven by their high metabolic activity, specialized functions, and unique vascular supply characteristics. These areas have high oxygen demand due to their role in vital processes such as motor control, sensory relay, and synaptic transmission (26). Additionally, the vascular characteristics of these regions—small penetrating arteries and relatively lower blood flow—necessitate higher oxygen extraction to maintain efficient brain function (27, 28).
The lower or absence of correlation between OEF and other physiological parameters may arise from the fact that OEF primarily reflects the brain’s metabolic demand for oxygen, while other parameters like CBF and CVR are influenced by vascular and hemodynamic factors that do not always correspond directly to metabolic needs. Cerebral autoregulation, regional metabolic variation, and pathological states further contribute to the decoupling of OEF from these other physiological metrics.
The lack of correlation between CBF and OEF in this study, compared to previous studies (13, 14) could arise from measurement technique. Previous studies measured the global OEF in the superior sagittal sinus either using TRUST (14) or susceptometry-based oximetry (13). In global measurement, regional variations in these parameters could be averaged out, obscuring a relationship that might otherwise be seen in higher-resolution measurements. However according to Figures 1, 4, 5, different brain regions may exhibit varying relationships between CBF and OEF due to differences in metabolic demand. Areas with high baseline metabolism (e.g., the gray matter) could maintain a stable OEF despite fluctuations in CBF, while regions with lower metabolic demand would show less tight coupling. OEF maps (Figure 1) show relatively homogeneous distributions across much of the cortex, particularly within gray matter, consistent with stable oxygen extraction despite variations in perfusion. However, in subcortical regions such as the thalamus and putamen, areas known for high metabolic activity, OEF values appear elevated, likely due to increased oxygen demand. In contrast, CBF maps exhibit more spatial variability between gray and white matter regions, and between cortical areas. When these maps are considered alongside the CMRO₂ maps (which are derived from CBF × OEF), it becomes evident that CMRO2 variability is largely driven by CBF fluctuations, since OEF is relatively stable in the cortex. While strong correlations are observed between CBF and CMRO2 across most brain regions (Figure 4), correlations between OEF and either CBF or CMRO2 are weaker or absent, indicating that OEF remains relatively invariant in many areas despite variations in CBF. Figure 5 shows that very few regions met even a liberal p-threshold for significant correlation between OEF and CBF, reinforcing the observation that these parameters are uncoupled across much of the brain.
Except CBF and CMRO2, averaged maps (Figure 1) and corresponding intensity histograms (Figure 3) of physiological parameters revealed distinct distributions. Comparing to a previous study (29), the peak location of CVR in this study (0.17) is very similar. The histograms of CBF and CMRO2 were similarly distributed but showed a broader range. The peak location of CBF is around 65 mL/100 g/min which is close to the result of a previous study (30). However, the histograms of OEF were very different and had a strong peak at the same location in the whole brain as well as within each of GM and WM separately. Accordingly, we subsequently investigated the regional correlations between them.
CBF and CMRO2 are significantly correlated (Figure 4). This phenomenon is easily understandable since OEF is very homogenous and CMRO2 is the product of CBF and OEF. Therefore, CBF and CMRO2 are similarly distributed. The regional correlations between CVR, OEF, CBF, and CMRO₂ highlight the regional variability in how the brain regulates its blood supply and oxygen metabolism. Strong positive correlations in the white matter and occipital region suggest efficient matching of blood flow and oxygen metabolism, while negative correlations in areas like the insular region reveal compensatory mechanisms where blood flow and oxygen extraction are inversely related. In fMRI studies of visual stimulation (31), occipital regions showed coordinated increases in CBF, BOLD, and CMRO2 response. An inverse correlation of white matter CBF with connectivity has also been shown previously (32).
For regional correlations we selected the 12 AAL regions with the most significant correlations according to the lowest averaged p-value in each region (Figure 5). These regions could also be noticed in Figure 4.
Comparing to TRUST (8) we could measure full brain covered OEF with only minimal artifacts. The GESSE pulse sequence is a sequence that allows a hybrid mapping of T2 and T2* relaxation times. It was developed to separate macroscopic and microscopic magnetic field inhomogeneities in MRI in microstructural brain imaging (18). In GESSE, a set of gradient echoes (GREs) are embedded around the spin echo (SE) of a single SE sequence (24). This sequence structure allows a simultaneous acquisition of a set of images corresponding to different GRE times (TEs) and therefore allows simultaneous T2 and T2* mapping. The measurement of T2 and T2* using GESSE was developed and applied for OEF mapping (23–25). GESSE is insensitive to RF pulse errors and does not suffer from significant field distortions, therefore providing a robust mapping technique in cerebral imaging. The range of OEF measured by qBOLD MRI typically lies between 0.2 and 0.5 (or 20–50%) under healthy physiological conditions (24). According to the histogram of OEF (Figure 3) the peak location is about 57.77 which is very close to the one in the literature (24).
In pathological conditions, the ability of blood vessels to widen in response to a stimulus may be compromised due to an already widened baseline, as seen in sickle cell disease where cerebral blood flow (CBF) is elevated and cerebrovascular reactivity (CVR) diminished (33, 34). In diseases characterized by narrowing or blockage of vessels, such as steno-occlusive diseases, a vasodilatory stimulus can increase CBF in regions with robust vasodilatory capacity. However, this may unexpectedly decrease CBF in neighboring areas with preserved or limited vasodilatory capacity (35). This phenomenon, known as “vascular steal,” may result in apparent negative CVR responses, either with or without changes in CBF (35). The relationship between CBF and CVR in pathological cases is often complex and not easily discernible. Similar to this principle, physiological parameters are distributed differently in the brain tumor cases (Figures 6–8). Except the strong correlation between CBF and CMRO2, there was no correlation between other physiological parameters (Supplementary Figure S1). Due to the differences between physiological parameters, complete measurements of all of them will help the physician to discover different aspect of tumor properties. These metrics help physicians understand critical tumor characteristics such as vascularity, metabolic demand, hypoxia, aggressiveness, and response to treatment. By integrating these data, clinicians can develop more personalized and effective treatment plans, optimize therapeutic strategies, and improve prognosis assessment for patients with brain tumors.
We found that, except for CBF and CMRO2, no other parameters were correlated in tumor cases. This indicated that, apart from the fact that the small cohort of tumor patients may not permit a rigorous statistical analysis and interpretation, (i) local tumor blood flow is correlated with metabolic demand for both tumor and healthy brain regions, as already demonstrated in previous works (36, 37), and (ii) that cerebrovascular reactivity appears independent from other physiological parameters in the tumor region, suggesting a perturbed vascular architecture (38).
There are several limitations of this study. First, GESSE is a very long measurement that takes about 10 min. The versatility of combined GE and SE methodology has been demonstrated in various approaches, based on a wide range of sequence implementations, and differing in the readout (single- or multiple-line acquisitions), spatial resolution, number and type of echoes used (39). EPI outperforms single-line acquisitions in terms of acquisition time (TA) and temporal resolution, making it the current method of choice for fast imaging sequences. However, EPI suffers from distortion, blurring, and local signal loss (40). Secondly, CVR is measured with a breath-holding task. This task requires notable cooperation of patients or volunteers. Without gas challenges, CVR can also be measured during resting-state (41–43). However, special care needs to be taken for it to be more reliable (3, 16). The efficiency of breath-holding as a method for inducing hypercapnia needs to be correlated with physiological measurements like SPO₂ and blood CO2 levels to ensure adequacy. Without monitoring these, the induced hypercapnia may be inconsistent or inadequate, leading to potential bias in the measurement of CVR and other related parameters. This could undermine the reliability of the test results, highlighting the need for better understanding and standardization in CVR testing. While breath-holding is commonly used to assess CVR, its associated hemodynamic changes (like reduced venous return, altered cardiac output, and blood pressure fluctuations) can influence the results. These changes are sometimes monitored, but often they are not fully accounted for, which may introduce bias into the assessment of CVR parameters. To improve accuracy, more careful monitoring and control of these hemodynamic factors such as lagged-GLM17 for optimization are needed during CVR testing (44) and calculation. Thirdly, the ASL scan was a single PLD 3D pCASL. This sequence was not optimized for voxel-wise CBF measures in white matter (45). Finally, by using a constant [H]a in the CMRO2 equation, both the natural variance of and differences in hematocrit between biological sexes is neglected. This may significantly change the oxygenated heme molar concentration in arterioles. Additionally, the chemotherapy treatment in a participant with a metastatic brain could also significantly alter hematocrit.
Conclusion
This study demonstrates a significant positive correlation between CVR and baseline CBF in five lobes of gray matter, indicating a close relationship between vascular reactivity and resting perfusion. In contrast, the weak or absent correlations between OEF and other parameters suggest that OEF reflects distinct metabolic processes less directly coupled to vascular dynamics. The observed regional variability in the relationships among CVR, CBF, OEF, and CMRO₂ highlights the heterogeneous nature of cerebral hemodynamics and oxygen metabolism.
Statements
Data availability statement
The data analyzed in this study is subject to the following licenses/restrictions: The data that support the findings of this study are available from the corresponding author upon reasonable request. Requests to access these datasets should be directed to ke.zhang@uni-heidelberg.de.
Ethics statement
The studies involving humans were approved by Medical faculty of Heidelberg Univeristy. The studies were conducted in accordance with the local legislation and institutional requirements. The participants provided their written informed consent to participate in this study. Written informed consent was obtained from the individual(s) for the publication of any potentially identifiable images or data included in this article.
Author contributions
KZ: Conceptualization, Data curation, Formal analysis, Funding acquisition, Investigation, Methodology, Project administration, Software, Supervision, Validation, Visualization, Writing – original draft, Writing – review & editing. ST: Methodology, Writing – review & editing. MW: Writing – review & editing. JJ: Data curation, Writing – review & editing. ES: Writing – review & editing. CZ: Data curation, Writing – review & editing. ML: Resources, Writing – review & editing. H-PS: Resources, Writing – review & editing. H-UK: Resources, Writing – review & editing. OS: Data curation, Writing – review & editing. FK: Data curation, Funding acquisition, Writing – review & editing.
Funding
The author(s) declare that no financial support was received for the research and/or publication of this article.
Conflict of interest
The authors declare that the research was conducted in the absence of any commercial or financial relationships that could be construed as a potential conflict of interest.
The handling editor IR declared a past co-authorship https://link.springer.com/article/10.1007/s12021-024-09703-4 with the author ML.
The author(s) declared that they were an editorial board member of Frontiers, at the time of submission. This had no impact on the peer review process and the final decision.
Generative AI statement
The authors declare that no Gen AI was used in the creation of this manuscript.
Any alternative text (alt text) provided alongside figures in this article has been generated by Frontiers with the support of artificial intelligence and reasonable efforts have been made to ensure accuracy, including review by the authors wherever possible. If you identify any issues, please contact us.
Publisher’s note
All claims expressed in this article are solely those of the authors and do not necessarily represent those of their affiliated organizations, or those of the publisher, the editors and the reviewers. Any product that may be evaluated in this article, or claim that may be made by its manufacturer, is not guaranteed or endorsed by the publisher.
Supplementary material
The Supplementary material for this article can be found online at: https://www.frontiersin.org/articles/10.3389/fneur.2025.1534844/full#supplementary-material
SUPPLEMENTARY FIGURE S1Voxel-wise Spearman’s correlation coefficients between all pairs of physiological parameters in the tumor ROIs from patient 1 (a), patient 2 (b) and patient 3 (c).
SUPPLEMENTARY FIGURE S2Fourth patient with metastatic Melanoma (male, 67 years old, after radiotherapy).
SUPPLEMENTARY FIGURE S3Fifth patient with metastatic Melanoma (male, 40 years old, after radiotherapy).
SUPPLEMENTARY FIGURE S4Individual T1 weighted anatomical, CVR, CBF and OEF maps were calculated in all subjects (left-right).
SUPPLEMENTARY FIGURE S5Breath-holding task design—five blocks, each consisting of 10 repetition of free breathing (FB), 10 repetition of breath-hold (BH), TR is equal to 1.7s.
References
1.
Sleight E Stringer MS Marshall I Wardlaw JM Thrippleton MJ . Cerebrovascular reactivity measurement using magnetic resonance imaging: a systematic review. Front Physiol. (2021) 12:643468. doi: 10.3389/fphys.2021.643468
2.
Fisher JA Venkatraghavan L Mikulis DJ . Magnetic resonance imaging-based cerebrovascular reactivity and hemodynamic reserve. Stroke. (2018) 49:2011–8. doi: 10.1161/STROKEAHA.118.021012
3.
Liu P Xu C Lin Z Sur S Li Y Yasar S et al . Cerebrovascular reactivity mapping using intermittent breath modulation. NeuroImage. (2020) 215:116787. doi: 10.1016/j.neuroimage.2020.116787
4.
Griffeth VE Perthen JE Buxton RB . Prospects for quantitative fMRI: investigating the effects of caffeine on baseline oxygen metabolism and the response to a visual stimulus in humans. NeuroImage. (2011) 57:809–16. doi: 10.1016/j.neuroimage.2011.04.064
5.
Kim SG Ogawa S . Biophysical and physiological origins of blood oxygenation level-dependent fMRI signals. J Cereb Blood Flow Metab. (2012) 32:1188–206. doi: 10.1038/jcbfm.2012.23
6.
Chu PPW Golestani AM Kwinta JB Khatamian YB Chen JJ . Characterizing the modulation of resting-state fMRI metrics by baseline physiology. NeuroImage. (2018) 173:72–87. doi: 10.1016/j.neuroimage.2018.02.004
7.
Liu P Hebrank AC Rodrigue KM Kennedy KM Park DC Lu H . A comparison of physiologic modulators of fMRI signals. Hum Brain Mapp. (2013) 34:2078–88. doi: 10.1002/hbm.22053
8.
Lu H Ge Y . Quantitative evaluation of oxygenation in venous vessels using T2-relaxation-under-spin-tagging MRI. Magn Reson Med. (2008) 60:357–63. doi: 10.1002/mrm.21627
9.
Xu F Li W Liu P Hua J Strouse JJ Pekar JJ et al . Accounting for the role of hematocrit in between-subject variations of MRI-derived baseline cerebral hemodynamic parameters and functional BOLD responses. Hum Brain Mapp. (2018) 39:344–53. doi: 10.1002/hbm.23846
10.
van Grinsven EE de Leeuw J Siero JCW JJC V MJE v Z Cho J et al . Evaluating physiological MRI parameters in patients with brain metastases undergoing stereotactic radiosurgery-a preliminary analysis and case report. Cancers (Basel). (2023) 15:15. doi: 10.3390/cancers15174298
11.
Germuska M Chandler HL Stickland RC Foster C Fasano F Okell TW et al . Dual-calibrated fMRI measurement of absolute cerebral metabolic rate of oxygen consumption and effective oxygen diffusivity. NeuroImage. (2019) 184:717–28. doi: 10.1016/j.neuroimage.2018.09.035
12.
Watabe T Shimosegawa E Kato H Isohashi K Ishibashi M Tatsumi M et al . Paradoxical reduction of cerebral blood flow after acetazolamide loading: a hemodynamic and metabolic study with (15)O PET. Neurosci Bull. (2014) 30:845–56. doi: 10.1007/s12264-013-1459-z
13.
Jain V Langham MC Wehrli FW . MRI estimation of global brain oxygen consumption rate. J Cereb Blood Flow Metab. (2010) 30:1598–607. doi: 10.1038/jcbfm.2010.49
14.
Xu F Ge Y Lu H . Noninvasive quantification of whole-brain cerebral metabolic rate of oxygen (CMRO2) by MRI. Magn Reson Med. (2009) 62:141–8. doi: 10.1002/mrm.21994
15.
Leoni RF Oliveira IA Pontes-Neto OM Santos AC Leite JP . Cerebral blood flow and vasoreactivity in aging: an arterial spin labeling study. Braz J Med Biol Res. (2017) 50:e5670. doi: 10.1590/1414-431X20175670
16.
Stickland RC Zvolanek KM Moia S Ayyagari A Caballero-Gaudes C Bright MG . A practical modification to a resting state fMRI protocol for improved characterization of cerebrovascular function. NeuroImage. (2021) 239:118306. doi: 10.1016/j.neuroimage.2021.118306
17.
Stickland RC Zvolanek KM Moia S Caballero-Gaudes C Bright MG . Lag-optimized blood oxygenation level dependent cerebrovascular reactivity estimates derived from breathing task data have a stronger relationship with baseline cerebral blood flow. Front Neurosci. (2022) 16:910025. doi: 10.3389/fnins.2022.910025
18.
Pillai JJ Zaca D . Clinical utility of cerebrovascular reactivity mapping in patients with low grade gliomas. World J Clin Oncol. (2011) 2:397–403. doi: 10.5306/wjco.v2.i12.397
19.
Yablonskiy DA Haacke EM . An MRI method for measuring T2 in the presence of static and RF magnetic field inhomogeneities. Magn Reson Med. (1997) 37:872–6. doi: 10.1002/mrm.1910370611
20.
Liu P De Vis JB Lu H . Cerebrovascular reactivity (CVR) MRI with CO2 challenge: a technical review. NeuroImage. (2019) 187:104–15. doi: 10.1016/j.neuroimage.2018.03.047
21.
Bright MG Murphy K . Reliable quantification of BOLD fMRI cerebrovascular reactivity despite poor breath-hold performance. NeuroImage. (2013) 83:559–68. doi: 10.1016/j.neuroimage.2013.07.007
22.
Wang Z Aguirre GK Rao H Wang J Fernández-Seara MA Childress AR et al . Empirical optimization of ASL data analysis using an ASL data processing toolbox: ASLtbx. Magn Reson Imaging. (2008) 26:261–9. doi: 10.1016/j.mri.2007.07.003
23.
Domsch S Murle B Weingartner S . Oxygen extraction fraction mapping at 3 tesla using an artificial neural network: a feasibility study. Magn Reson Med. (2018) 79:890–9. doi: 10.1002/mrm.26749
24.
He X Yablonskiy DA . Quantitative BOLD: mapping of human cerebral deoxygenated blood volume and oxygen extraction fraction: default state. Magn Reson Med. (2007) 57:115–26. doi: 10.1002/mrm.21108
25.
Hubertus S Thomas S Cho J Zhang S Wang Y Schad LR . Comparison of gradient echo and gradient echo sampling of spin echo sequence for the quantification of the oxygen extraction fraction from a combined quantitative susceptibility mapping and quantitative BOLD (QSM+qBOLD) approach. Magn Reson Med. (2019) 82:1491–503. doi: 10.1002/mrm.27804
26.
Van Cauter S Severino M Ammendola R . Bilateral lesions of the basal ganglia and thalami (central grey matter)-pictorial review. Neuroradiology. (2020) 62:1565–605. doi: 10.1007/s00234-020-02511-y
27.
Ito H Ibaraki M Yamakuni R Hakozaki M Ukon N Ishii S et al . Oxygen extraction fraction is not uniform in human brain: a positron emission tomography study. J Physiol Sci. (2023) 73:25. doi: 10.1186/s12576-023-00880-6
28.
Yang L Cho J Chen T Gillen KM Li J Zhang Q et al . Oxygen extraction fraction (OEF) assesses cerebral oxygen metabolism of deep gray matter in patients with pre-eclampsia. Eur Radiol. (2022) 32:6058–69. doi: 10.1007/s00330-022-08713-7
29.
Hou XR Liu PY Li Y Jiang D De Vis JB Lin Z et al . The association between BOLD-based cerebrovascular reactivity (CVR) and end-tidal CO2 in healthy subjects. NeuroImage. (2020) 207:116365. doi: 10.1016/j.neuroimage.2019.116365
30.
Garrett DD Lindenberger U Hoge RD Gauthier CJ . Age differences in brain signal variability are robust to multiple vascular controls. Sci Rep. (2017) 7:10149. doi: 10.1038/s41598-017-09752-7
31.
Hubbard NA Turner MP Ouyang M Himes L Thomas BP Hutchison JL et al . Calibrated imaging reveals altered grey matter metabolism related to white matter microstructure and symptom severity in multiple sclerosis. Hum Brain Mapp. (2017) 38:5375–90. doi: 10.1002/hbm.23727
32.
Aslan S Huang H Uh J Mishra V Xiao G van Osch MJP et al . White matter cerebral blood flow is inversely correlated with structural and functional connectivity in the human brain. NeuroImage. (2011) 56:1145–53. doi: 10.1016/j.neuroimage.2011.02.082
33.
Kosinski PD Croal PL Leung J Williams S Odame I GMT H et al . The severity of anaemia depletes cerebrovascular dilatory reserve in children with sickle cell disease: a quantitative magnetic resonance imaging study. Br J Haematol. (2017) 176:280–7. doi: 10.1111/bjh.14424
34.
Vaclavu L Meynart BN Mutsaerts H Petersen ET Majoie CBLM VanBavel ET et al . Hemodynamic provocation with acetazolamide shows impaired cerebrovascular reserve in adults with sickle cell disease. Haematologica. (2019) 104:690–9. doi: 10.3324/haematol.2018.206094
35.
Sobczyk O Battisti-Charbonney A Fierstra J Mandell DM Poublanc J Crawley AP et al . A conceptual model for CO(2)-induced redistribution of cerebral blood flow with experimental confirmation using BOLD MRI. NeuroImage. (2014) 92:56–68. doi: 10.1016/j.neuroimage.2014.01.051
36.
Bonekamp D Mouridsen K Radbruch A Kurz FT Eidel O Wick A et al . Assessment of tumor oxygenation and its impact on treatment response in bevacizumab-treated recurrent glioblastoma. J Cereb Blood Flow Metab. (2017) 37:485–94. doi: 10.1177/0271678X16630322
37.
Madsen SS Lindberg U Asghar S Olsen KS Møller K HBW L et al . Reproducibility of cerebral blood flow, oxygen metabolism, and lactate and N-acetyl-aspartate concentrations measured using magnetic resonance imaging and spectroscopy. Front Physiol. (2023) 14:3352. doi: 10.3389/fphys.2023.1213352
38.
Breckwoldt MO Bode J Sahm F Krüwel T Solecki G Hahn A et al . Correlated MRI and ultramicroscopy (MR-UM) of brain tumors reveals vast heterogeneity of tumor infiltration and neoangiogenesis in preclinical models and human disease. Front Neurosci. (2019) 12:1004. doi: 10.3389/fnins.2018.01004
39.
Kuppers F Yun SD Shah NJ . Development of a novel 10-echo multi-contrast sequence based on EPIK to deliver simultaneous quantification of T(2) and T(2)(*) with application to oxygen extraction fraction. Magn Reson Med. (2022) 88:1608–23. doi: 10.1002/mrm.29305
40.
Embleton KV Haroon HA Morris DM MAL R GJM P . Distortion correction for diffusion-weighted MRI tractography and fMRI in the temporal lobes. Hum Brain Mapp. (2010) 31:1570–87. doi: 10.1002/hbm.20959
41.
Golestani AM Wei LL Chen JJ . Quantitative mapping of cerebrovascular reactivity using resting-state BOLD fMRI: validation in healthy adults. NeuroImage. (2016) 138:147–63. doi: 10.1016/j.neuroimage.2016.05.025
42.
Jahanian H Christen T Moseley ME Pajewski NM Wright CB Tamura MK et al . Measuring vascular reactivity with resting-state blood oxygenation level-dependent (BOLD) signal fluctuations: a potential alternative to the breath-holding challenge?J Cereb Blood Flow Metab. (2017) 37:2526–38. doi: 10.1177/0271678X16670921
43.
Liu P Li Y Pinho M Park DC Welch BG Lu H . Cerebrovascular reactivity mapping without gas challenges. NeuroImage. (2017) 146:320–6. doi: 10.1016/j.neuroimage.2016.11.054
44.
Zvolanek KM Moia S Dean JN Stickland RC Caballero-Gaudes C Bright MG . Comparing end-tidal CO(2), respiration volume per time (RVT), and average gray matter signal for mapping cerebrovascular reactivity amplitude and delay with breath-hold task BOLD fMRI. NeuroImage. (2023) 272:120038. doi: 10.1016/j.neuroimage.2023.120038
45.
Skurdal MJ Bjornerud A van Osch MJ Nordhøy W Lagopoulos J Groote IR . Voxel-wise perfusion assessment in cerebral white matter with PCASL at 3T; is it possible and how long does it take?PLoS One. (2015) 10:e0135596. doi: 10.1371/journal.pone.0135596
Summary
Keywords
cerebrovascular reactivity, cerebral blood flow, oxygen extraction fraction, cerebral metabolic rate of oxygen, correlationship
Citation
Zhang K, Triphan SMF, Wielpütz MO, Jende J, Sleight E, Ziener CH, Ladd ME, Schlemmer H-P, Kauczor H-U, Sedlaczek O and Kurz FT (2025) Correlation of breathing task derived cerebrovascular reactivity with baseline CBF, OEF and CMRO2. Front. Neurol. 16:1534844. doi: 10.3389/fneur.2025.1534844
Received
28 November 2024
Accepted
26 September 2025
Published
10 October 2025
Volume
16 - 2025
Edited by
Itamar Ronen, Brighton and Sussex Medical School, United Kingdom
Reviewed by
Cesar Caballero-Gaudes, Basque Center on Cognition, Brain and Language, Spain
Thomas Lindner, University of Hamburg, Germany
Updates
Copyright
© 2025 Zhang, Triphan, Wielpütz, Jende, Sleight, Ziener, Ladd, Schlemmer, Kauczor, Sedlaczek and Kurz.
This is an open-access article distributed under the terms of the Creative Commons Attribution License (CC BY). The use, distribution or reproduction in other forums is permitted, provided the original author(s) and the copyright owner(s) are credited and that the original publication in this journal is cited, in accordance with accepted academic practice. No use, distribution or reproduction is permitted which does not comply with these terms.
*Correspondence: Ke Zhang, ke.zhang@uni-heidelberg.de
Disclaimer
All claims expressed in this article are solely those of the authors and do not necessarily represent those of their affiliated organizations, or those of the publisher, the editors and the reviewers. Any product that may be evaluated in this article or claim that may be made by its manufacturer is not guaranteed or endorsed by the publisher.