 Zongbo Sun
 Yuanyuan Li2†
 Li Yang
- 1School of Medicine, Liao Cheng University, Liaocheng, Shandong, China
- 2Department of Radiology, Dongchangfu District Maternal and Child Health Hospital, Liaocheng, Shandong, China
- 3Department of Radiology, Dongchangfu District People’s Hospital, Liaocheng, Shandong, China
- 4Medical Genetics Laboratory, Dongchangfu District Maternal and Child Health Hospital, Liaocheng, Shandong, China
Background: Understanding the neurological complications associated with diabetes mellitus is essential for developing comprehensive treatment strategies. Functional magnetic resonance imaging (fMRI) is a powerful tool for investigating brain functional and structural changes associated with various conditions, including diabetes mellitus.
Objectives: To analyze the application trends, research hotspots, and emerging frontiers of fMRI in diabetes mellitus research through a comprehensive bibliometric analysis.
Methods: A systematic literature search was conducted utilizing the Web of Science Core Collection (WoSCC) database. Bibliometric tools, including VOSviewer (version 1.6.20), CiteSpace (version 6.3.R1), and R (version 4.3.3), were employed for data analysis.
Results: A total of 706 articles about fMRI and diabetes mellitus were published from 1987 to 2024. The United States of America (USA) ranks first (n = 931), followed by China (n = 756) and Germany (n = 270) regarding total publications. Harvard University ranks first in terms of total publications. Among the top ten institutions regarding publications, the majority of articles originated from the USA. The journal Diabetes has the highest number of publications. The author SHAO YI ranks first in total publications, while FRITSCHE ANDREAS ranks first in total citations. The top five keywords identified are “dementia,” “risk,” “brain,” “Alzheimer’s disease,” and “functional connectivity.” Keyword burst analysis indicates that the recent research hotspots included “impairment,” “dysfunction,” and “diagnosis.”
Conclusion: Cognitive impairment and dysfunction related to diabetes mellitus, along with Alzheimer’s disease and dementia, and their diagnosis were identified as focal areas of research. Future investigations should concentrate on predicting and early diagnosing cognitive function in patients with diabetes mellitus using fMRI. The findings of this study provide a valuable reference for researchers and clinicians seeking to explore the neurological dimensions of diabetes mellitus and develop targeted therapeutic approaches.
1 Introduction
Diabetes mellitus is a global health concern affecting millions of individuals worldwide, with its prevalence steadily increasing (1). Diabetes mellitus is a chronic disease associated with complications that significantly impact patients’ quality of life and healthcare systems (2). Among these complications, neurological issues, particularly cognitive impairment and structural brain abnormalities (3, 4), have gained considerable attention in recent years. Cognitive impairment mainly includes Alzheimer’s disease (AD) and vascular dementia. People with type 2 diabetes mellitus (T2DM) have twice the risk of mild cognitive impairment and dementia as non-diabetics, with about 20% of those over 60 years of age at risk of progression to dementia (5). The diagnosis of diabetes mellitus-related cognitive dysfunction mainly relies on neuropsychological scales (6, 7), which may result in misdiagnosis. Besides, diabetic peripheral neuropathy (DPN) is one of the most common chronic complications of diabetes mellitus, with a prevalence of 50% (8, 9). The development of foot ulcers is a serious consequence of the progression of DPN, possibly leading to amputation and death (9). Therefore, early diagnosis and treatment are particularly important. The current gold standard method for diagnosing DPN is electromyography (EMG). Although many patients with DPN show evidence of neurologic deficits on EMG, they do not present with neuropathic symptoms. Due to its insidious onset, DPN often goes undiagnosed in its early stages (10).
Functional magnetic resonance imaging (fMRI) has become a crucial tool in neuroscience, allowing researchers to non-invasively study brain activity and structural changes (11–13). In the context of diabetes mellitus, fMRI has been employed to explore the neurological impacts of the disease, revealing critical insights into cognitive function, brain connectivity, and neurovascular changes (14, 15). fMRI can clearly show the anatomical structure of brain tissue and neuropathological features (16), which is important for diagnosing and treating T2DM cognitive dysfunction. Research has shown that patients with T2DM cognitive dysfunction have abnormal structural changes on fMRI (17). Furthermore, fMRI has become a practical tool for DPN imaging because of its noninvasive, radiation-free characteristics and its ability to reflect in real time the local oxygen consumption of various regions of the CNS in response to external stimuli (10, 18). Although some reviews have discussed the fMRI study of diabetes mellitus, no research has summarized the overview, hotspots, and trends of the application of fMRI in diabetes mellitus using visualization and analysis methods.
Bibliometrics is the cross-cutting science that quantitatively analyzes all knowledge carriers using mathematical and statistical methods. Its main measurement objects are the amount of literature, the number of authors, and vocabulary. The amount of literature is mainly the variety of publications and journals and where lies the majority of the literature. The number of authors mainly refers to the researcher’s personal or group. Vocabulary is mainly the variety of literature markers used to classify most papers (19). Bibliometrics research methods have been applied in many research areas, in medicine and other fields. Currently, literature research is often used in clinical settings to summarize the research frontiers and trends of certain diseases and to provide directions for clinical disease research (20).
Therefore, this study aimed to perform a bibliometric analysis of the application of fMRI in diabetes mellitus research. By systematically analyzing publication trends, research hotspots, and collaboration networks, this study sought to map the current state of research, identify key focus areas, and highlight emerging trends. The findings will provide valuable insights for researchers and clinicians aiming to further explore and address the neurological complications of diabetes mellitus using fMRI.
2 Methods
2.1 Search strategies and data collection
We conducted a literature search on the Web of Science Core Collection (WoSCC) on November 12, 2024. The search queries were used to retrieve articles about fMRI and diabetes mellitus published between 1987 and 2024: Searched Method: TS = (functional magnetic resonance imaging* OR “functional MRI*” OR fMRI* OR (“functional” NEAR/3 “magnetic resonance”) OR ((“functional” NEAR/3 “imag*”) AND (magnetic OR resonance OR MR))) AND TS = (diabet* OR mellitus OR T1DM OR T2DM OR hyperglycemia OR glucose intolerance). All information was collected in plain text file format. The following basic information was collected for each article: titles, author information, institutions, countries/regions, keywords, journals, and references. Articles that met the following criteria were included: (1) published in English, and (2) articles on fMRI and diabetes mellitus, including original research. The exclusion criteria were (1) not related to fMRI in diabetes mellitus, (2) non-article document type (e.g., review, case report, letter, and conference abstracts), (3) duplicated publications, or (4) non-English language.
2.2 Statistical analysis
Relevant data were extracted from the retrieved literature bibliographies, and used Microsoft Excel to identify and calculate the bibliometric indicators. These indicators cover key aspects of publications, including annual publication counts, citation frequencies, average citation rates, journal names, journal impact factors, publication countries/regions, publishing institutions, and authors. Excel allows researchers to organize and analyze bibliometric data efficiently. During the visual analysis process, three powerful bibliometric analysis tools were used to analyze the academic data comprehensively. These tools are VOSviewer (version 1.6.20), CiteSpace (version 6.3.R1), and R 4.3.3.1 VOSviewer is a versatile software tool that plays a crucial role in mapping institutional collaboration, author collaboration, co-authorship, citations, and co-citations (21). VOSviewer allowed the visualization and exploration of complex collaboration and relationship networks within the academic domain, gaining deeper insights into the interconnections among authors, institutions, and publications. VOSviewer was used for keyword co-occurrence analysis, and CiteSpace software was used for keyword burst detection to delve further into emerging trends and research hotspots within our study field. The study employed CiteSpace 6.1.R1 for keyword co-occurrence analysis, setting parameters for time slicing from January 1981 to November 2024 (the initial publications in this field appeared in 1981). The time slice was set to 1 year; node types: keywords. When the node type was keywords, the threshold (top N in each slice) was 5, and the pruning method was pathfinder + pruning merged networks. Based on the parameter settings of each node, visual analysis was conducted to generate a keyword timeline map for the field of “task-based functional magnetic resonance imaging” research. The size of the nodes represents the number of publications, the thickness of the lines represents the strength of the link, and the color of the nodes stands for different clusters or times. The H-index was employed to quantify the academic impact of individuals and journals, respectively. The H-index is a vital indicator for evaluating the academic contribution of researchers and could predict their future scientific achievements (22, 23). In this study, the H-index of each author was obtained from WoSCC. The G-index refers to the highest number of papers that receive H-index or more citations (24). The M-index, defined as (h-index)/(number of years since the author’s first published paper), characterizes the rise in the H-index over time.
3 Results
3.1 Publication outputs and trends
In total, 706 eligible publications were analyzed in the present study. The flowchart of data screening is shown in Figure 1. The investigation showed that 4,793 authors contributed to producing 706 manuscripts in this study. These works were published in 311 journals from 1987 to 2024, citing 24,560 references (Figure 2A). Figure 2B presents the specific number of annual publications regarding the application of fMRI in diabetes mellitus. Since 2006, fMRI and diabetes mellitus research has shown an upward trend. The annual publication volume exceeds 10 articles. The greatest number of annual publications was 70 in 2021. In addition, the index function y = 1.71x-14.767 (R2 = 0.8051) of the annual publication trend was determined to evaluate the changing trend between fMRI and diabetes mellitus studies.
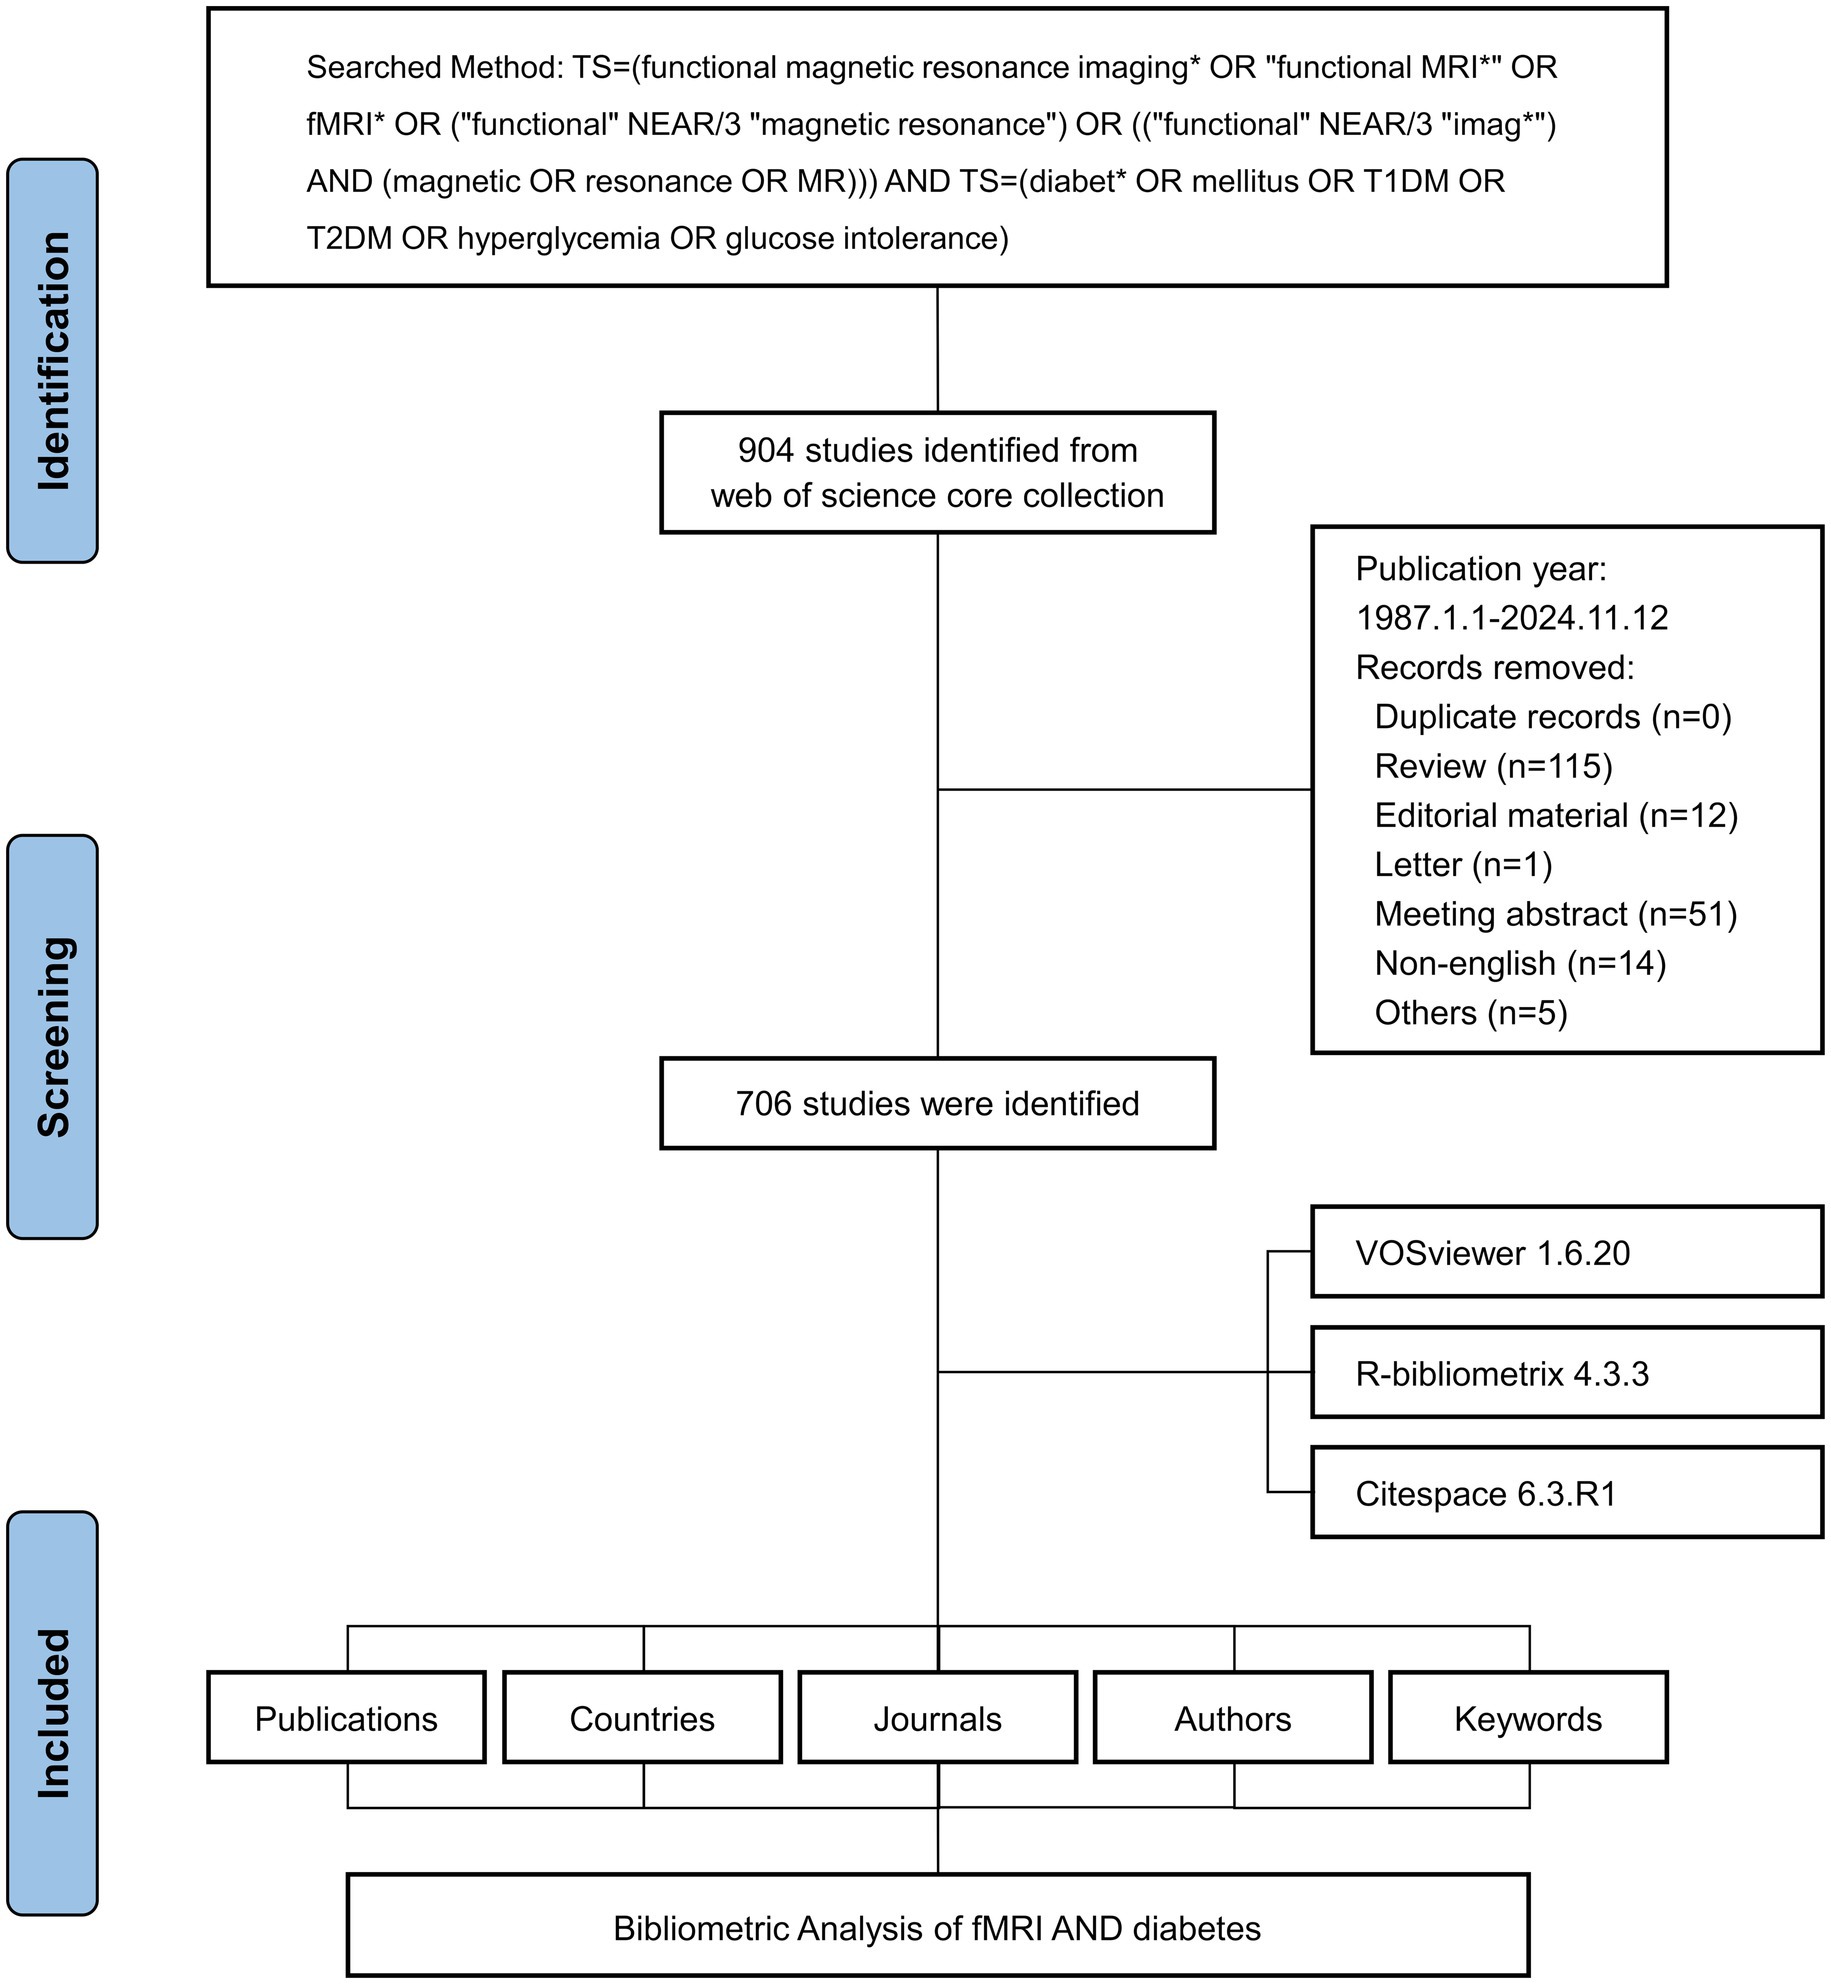
Figure 1. Flowchart of the literature screening process.
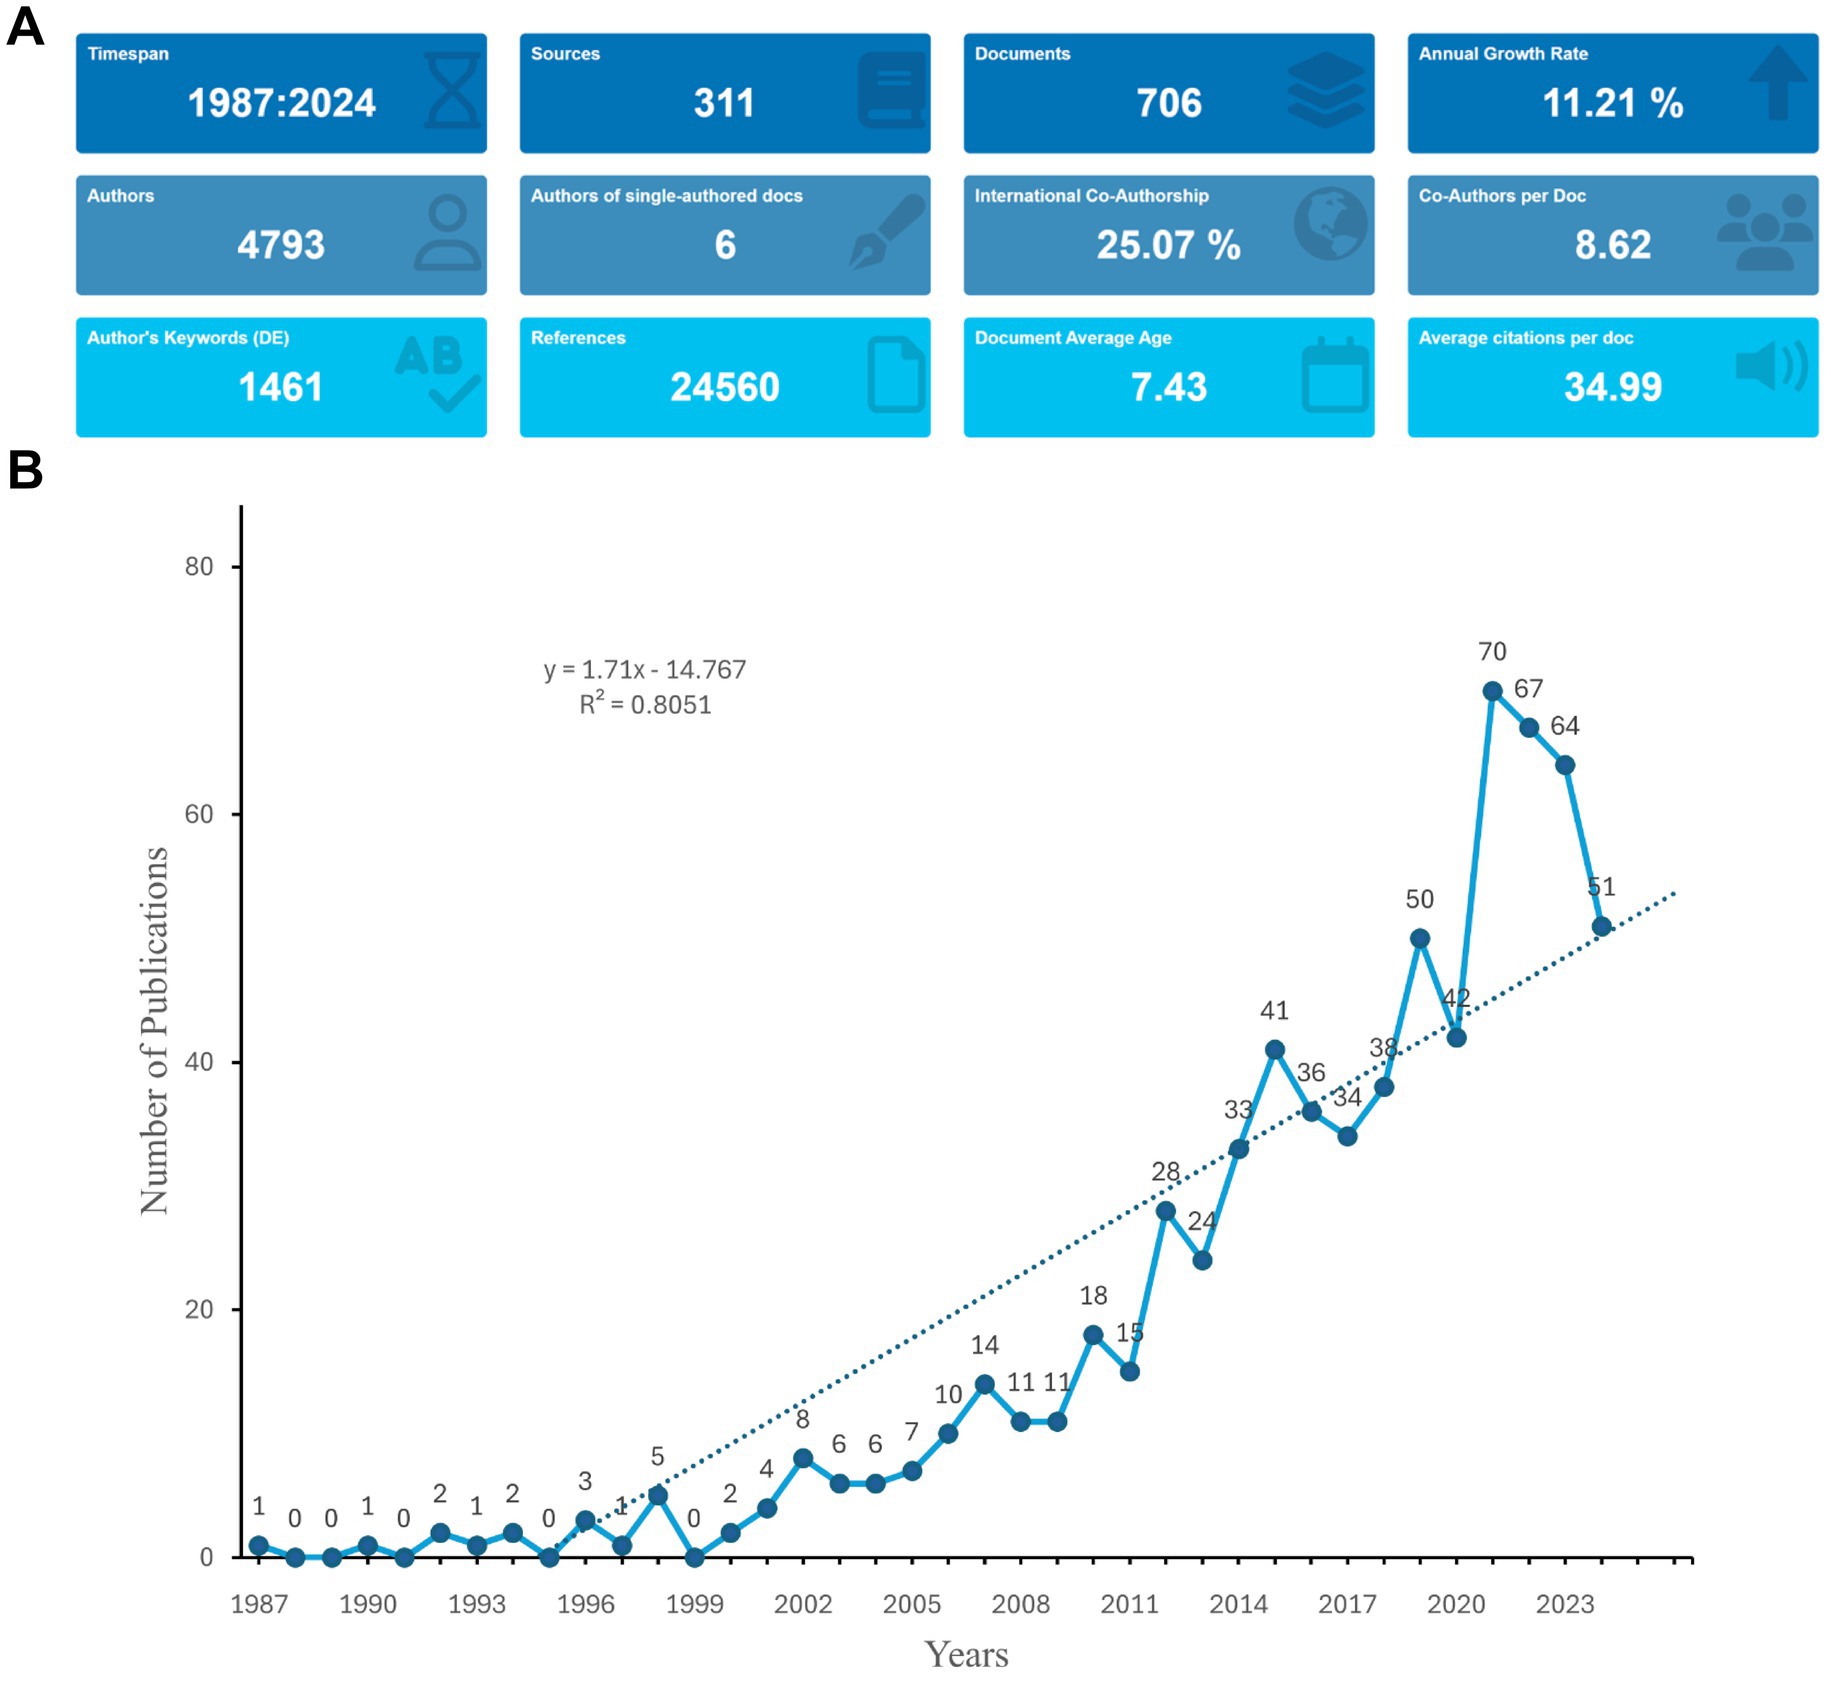
Figure 2. Overall analysis. (A) Summary information of the included studies. (B) The specific number of annual publications regarding diabetes mellitus and fMRI from 1987 to 2024.
3.2 Analysis of countries/regions
Table 1 presents the top 20 countries/regions based on the number of publications. The United States of America (USA) ranks first (n = 931) regarding total publication (TP), followed by China (n = 756) and Germany (n = 270). The USA also has the leading position (n = 10,258) in total citations (TCs), followed by China (n = 3,299) and Netherlands (n = 2086). Besides, the majority of the articles are single-country publications (SCPs) (Figure 3A). For example, more than 180 articles are SCPs in China. In the USA, 130 articles are SCPs. Among the 26 countries involved in international collaborations with a minimum of three articles, the USA has the highest number of collaborations with other countries (n = 151), followed by the United Kingdom (n = 70) and Germany (n = 59) (Figure 3B).
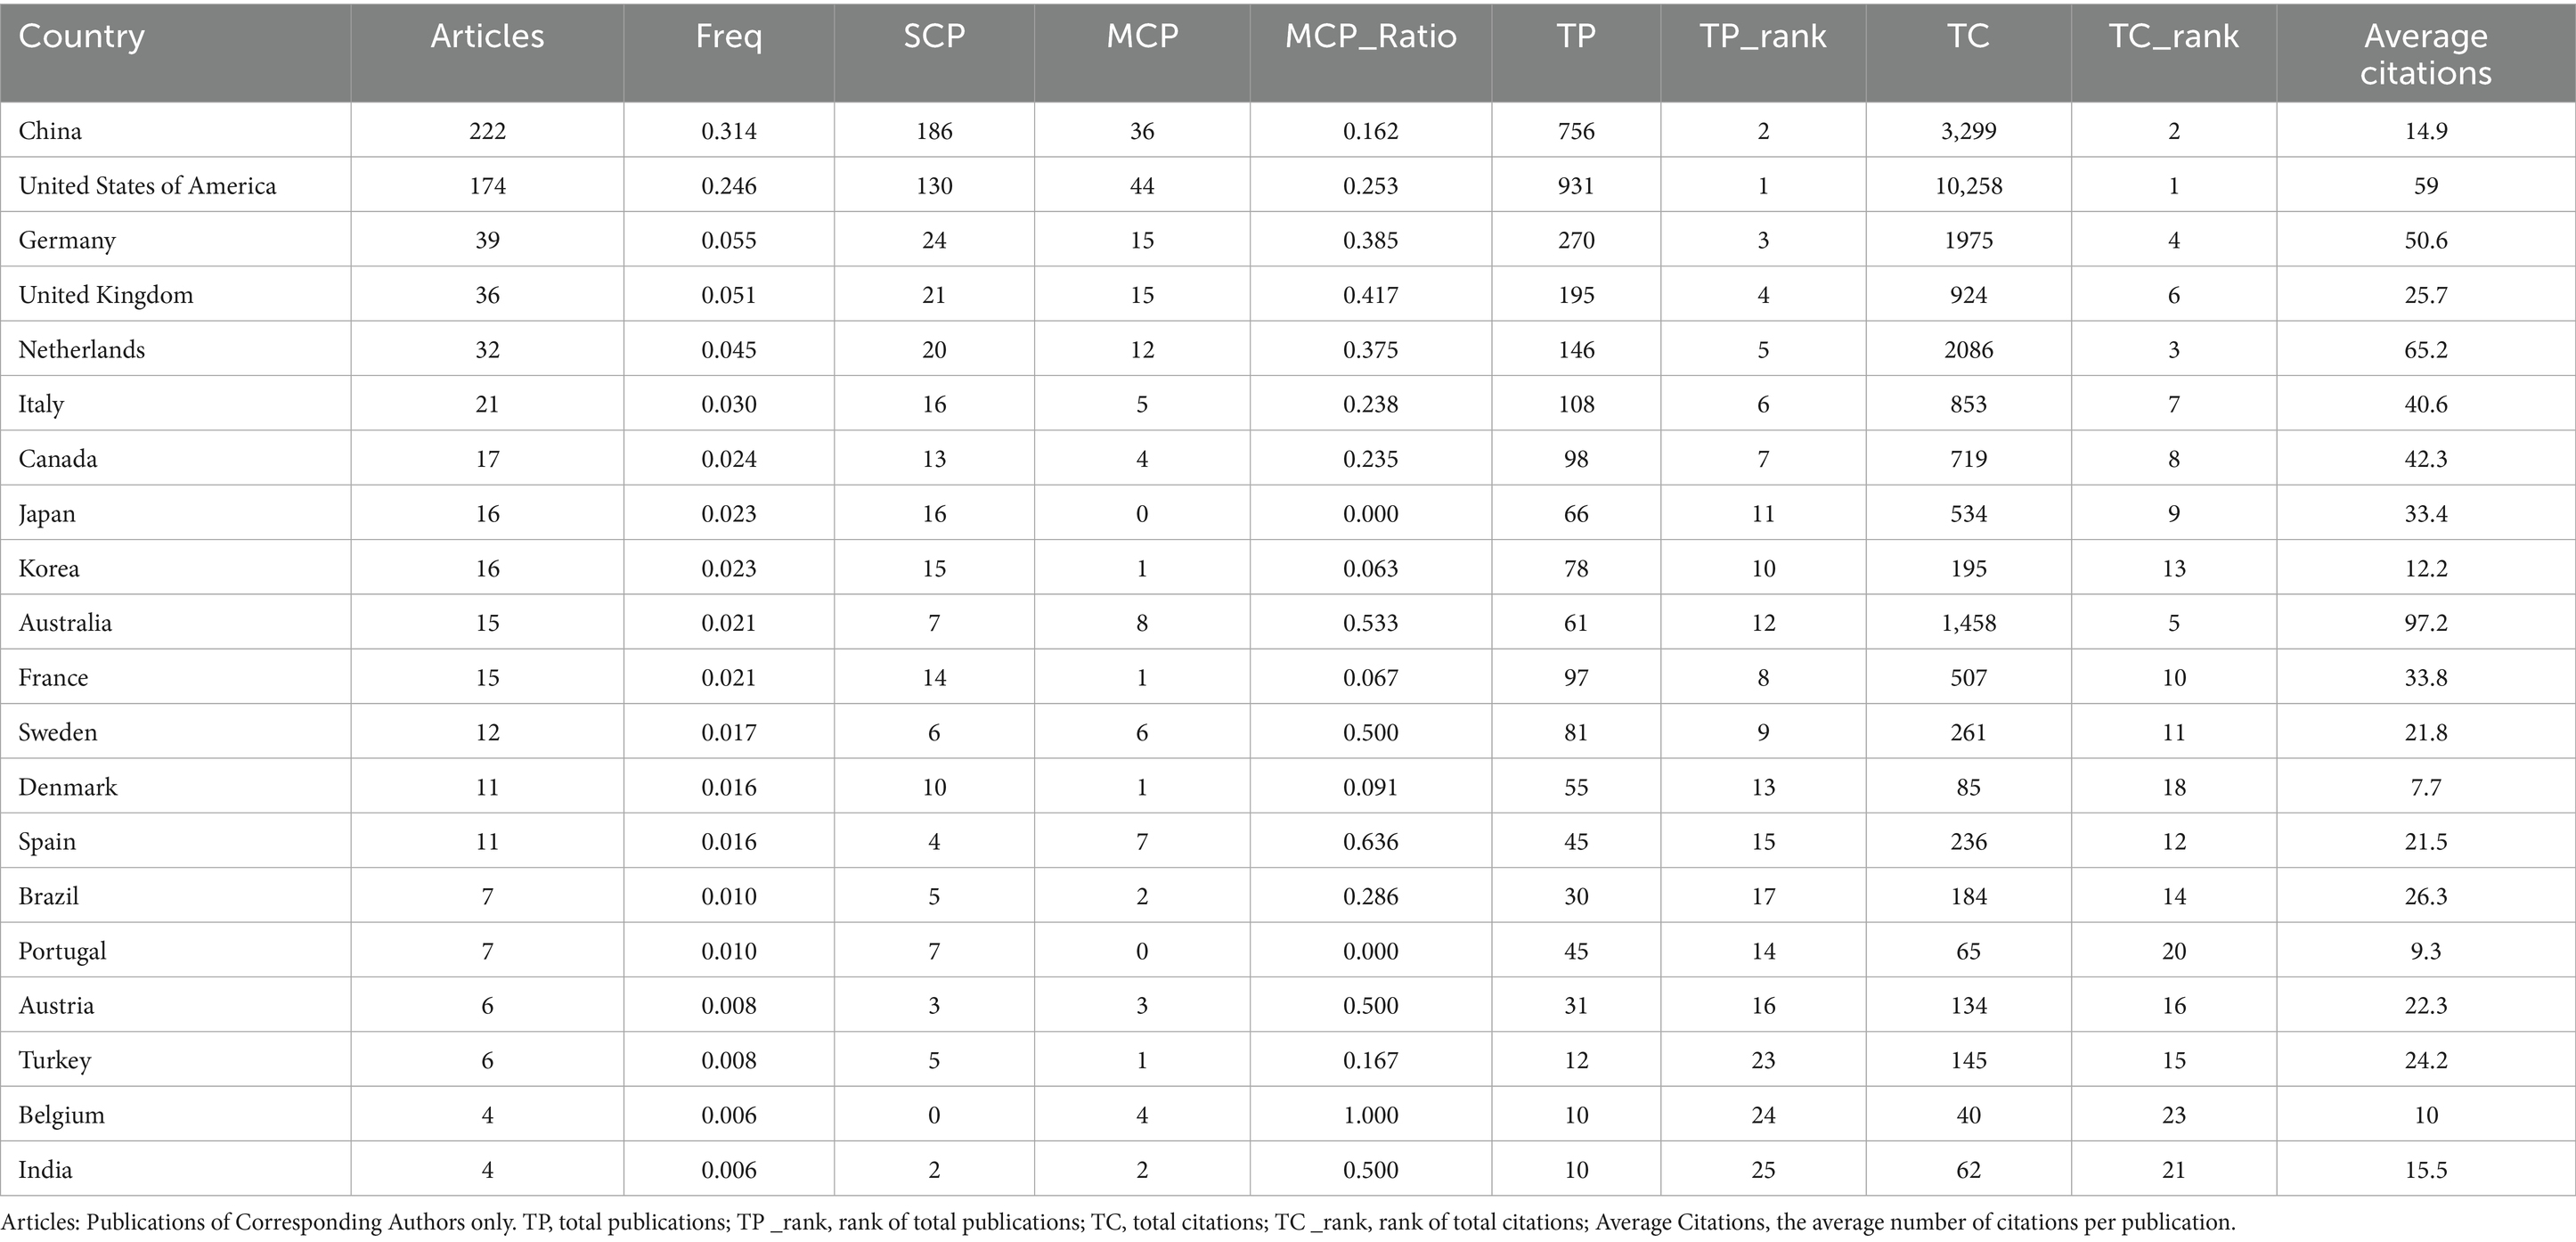
Table 1. Publication and citation profiles of leading countries.
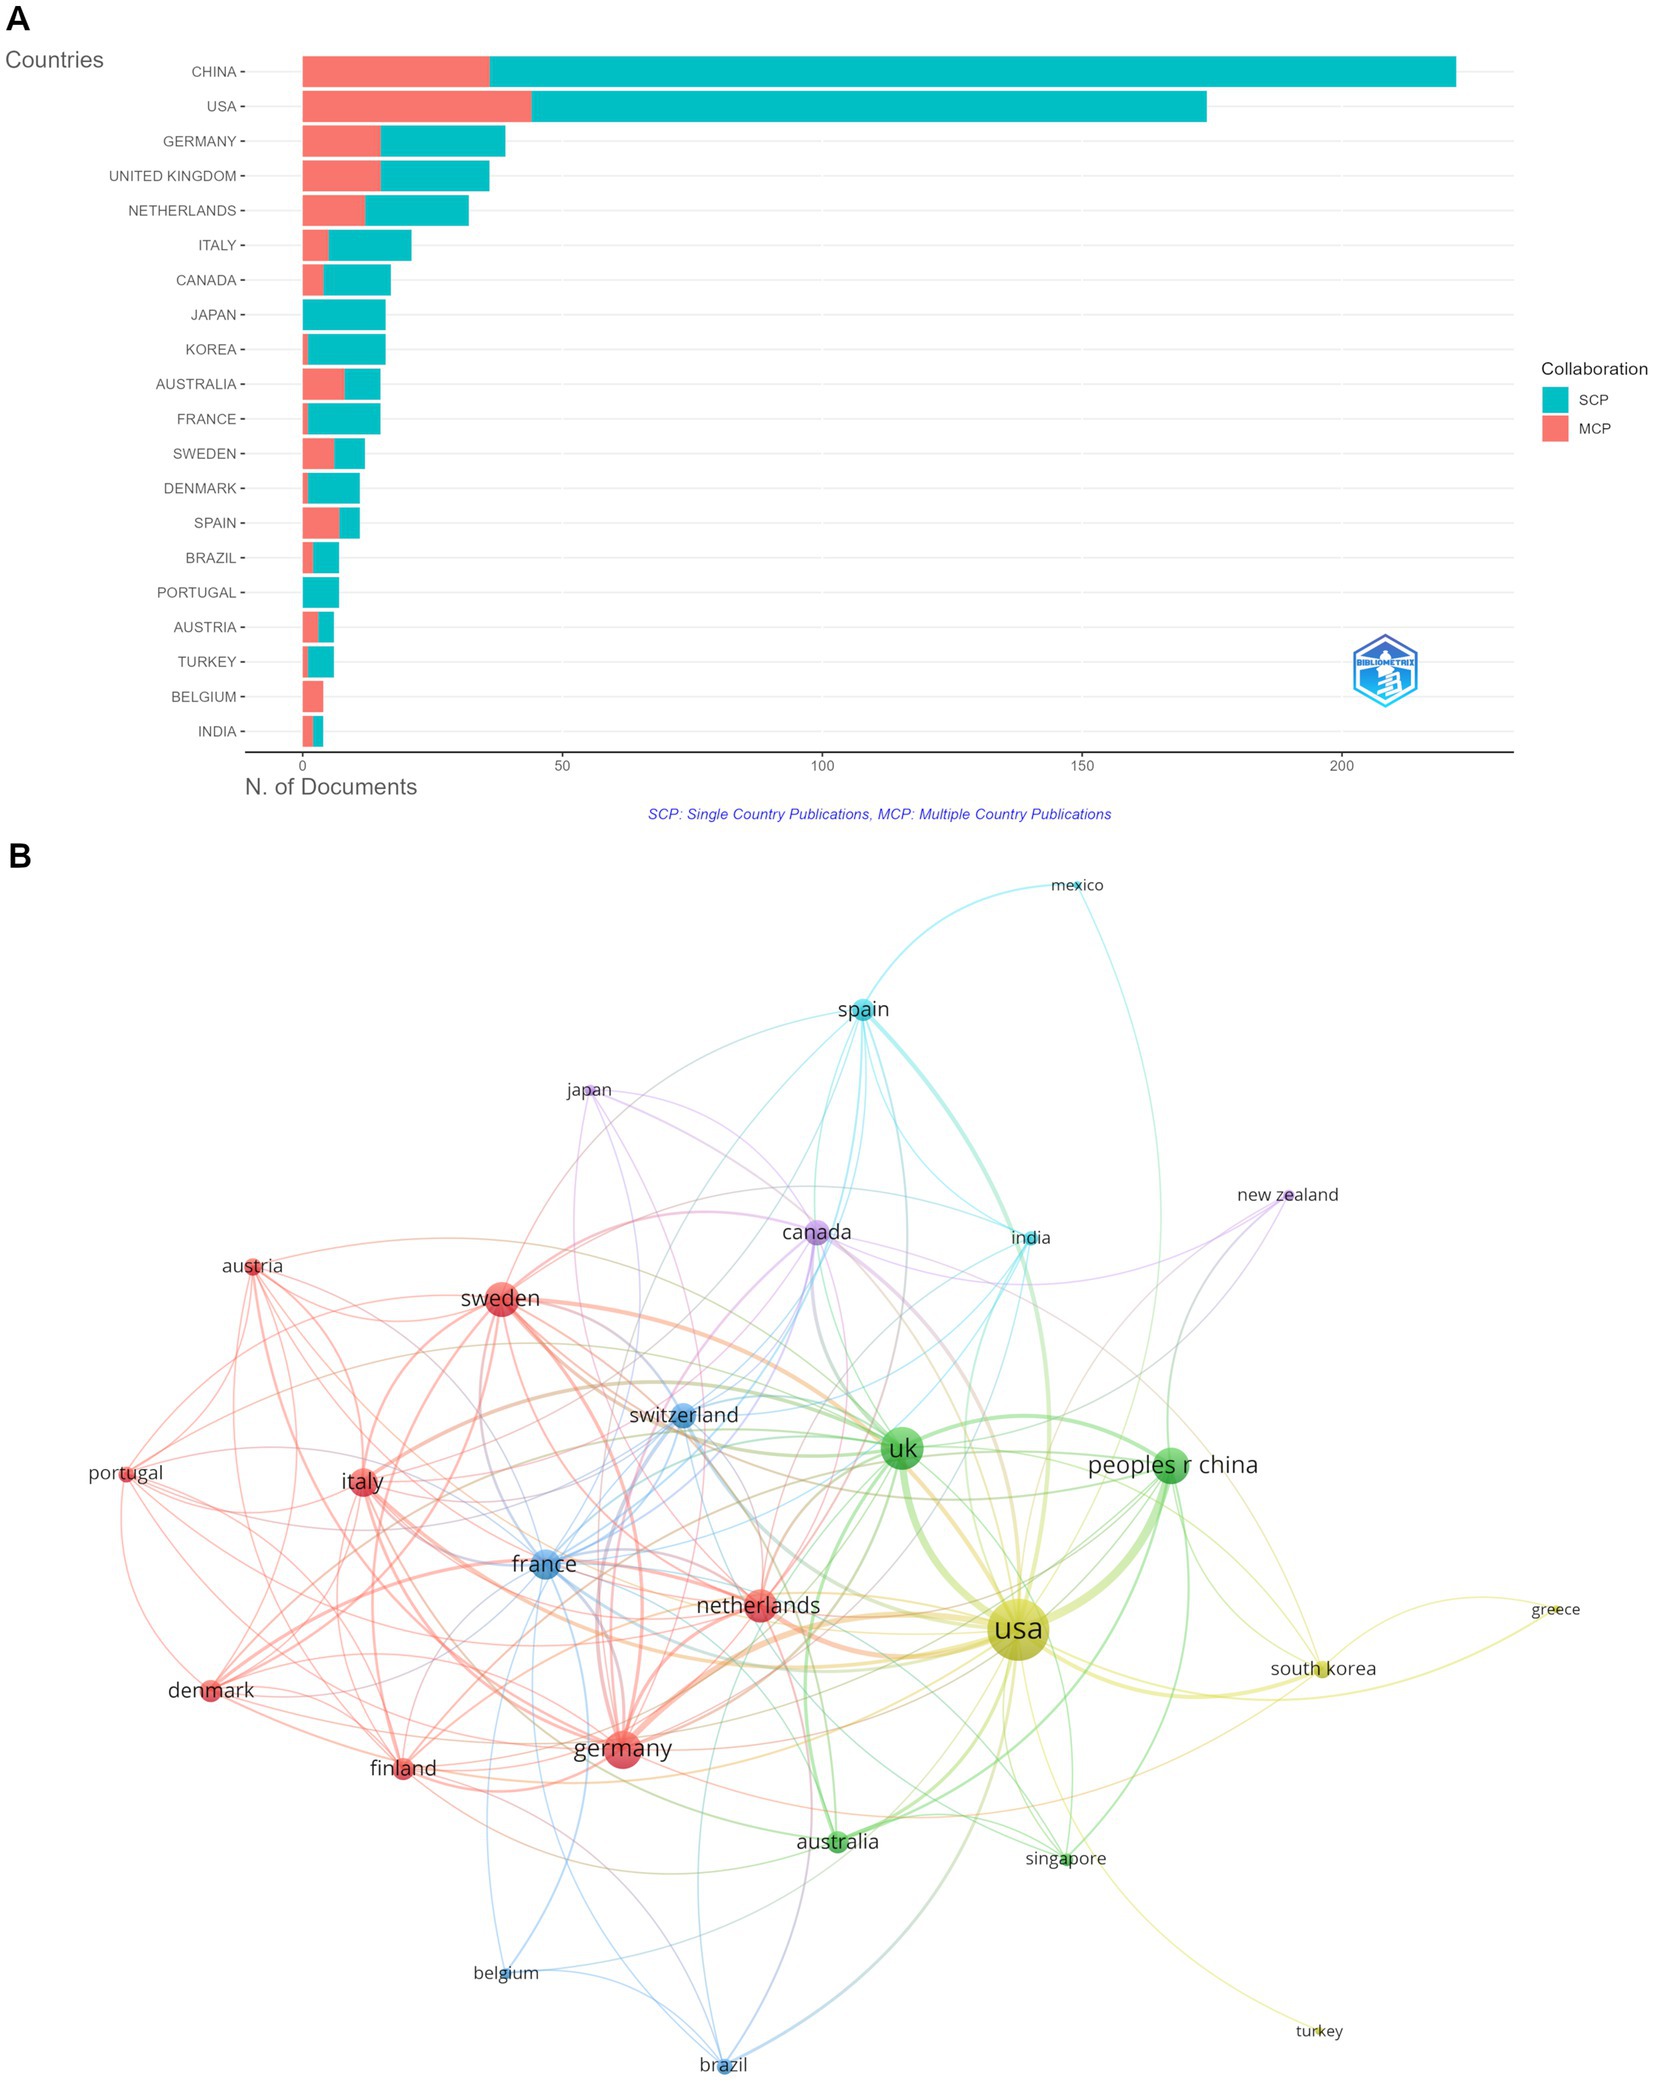
Figure 3. Analysis of countries. (A) Distribution of corresponding author’s publications by country. (B) Visualization map depicting the collaboration among different countries.
3.3 Analysis of institutions
Figure 4A reports the top ten institutions by article count and rank. Harvard University in the USA ranks first with 109 publications, and Eberhard Karls University of Tubingen in Germany ranks second with 76 publications. Figure 4B depicts the institutional collaboration network map. Among the 77 institutions involved in international collaborations with a minimum of five articles, Harvard University has the highest number of collaborations with other countries (total link strength = 46), followed by Beth Israel Deaconess Medical Center (total link strength = 42) and Brigham and Women’s Hospital (total link strength = 34).
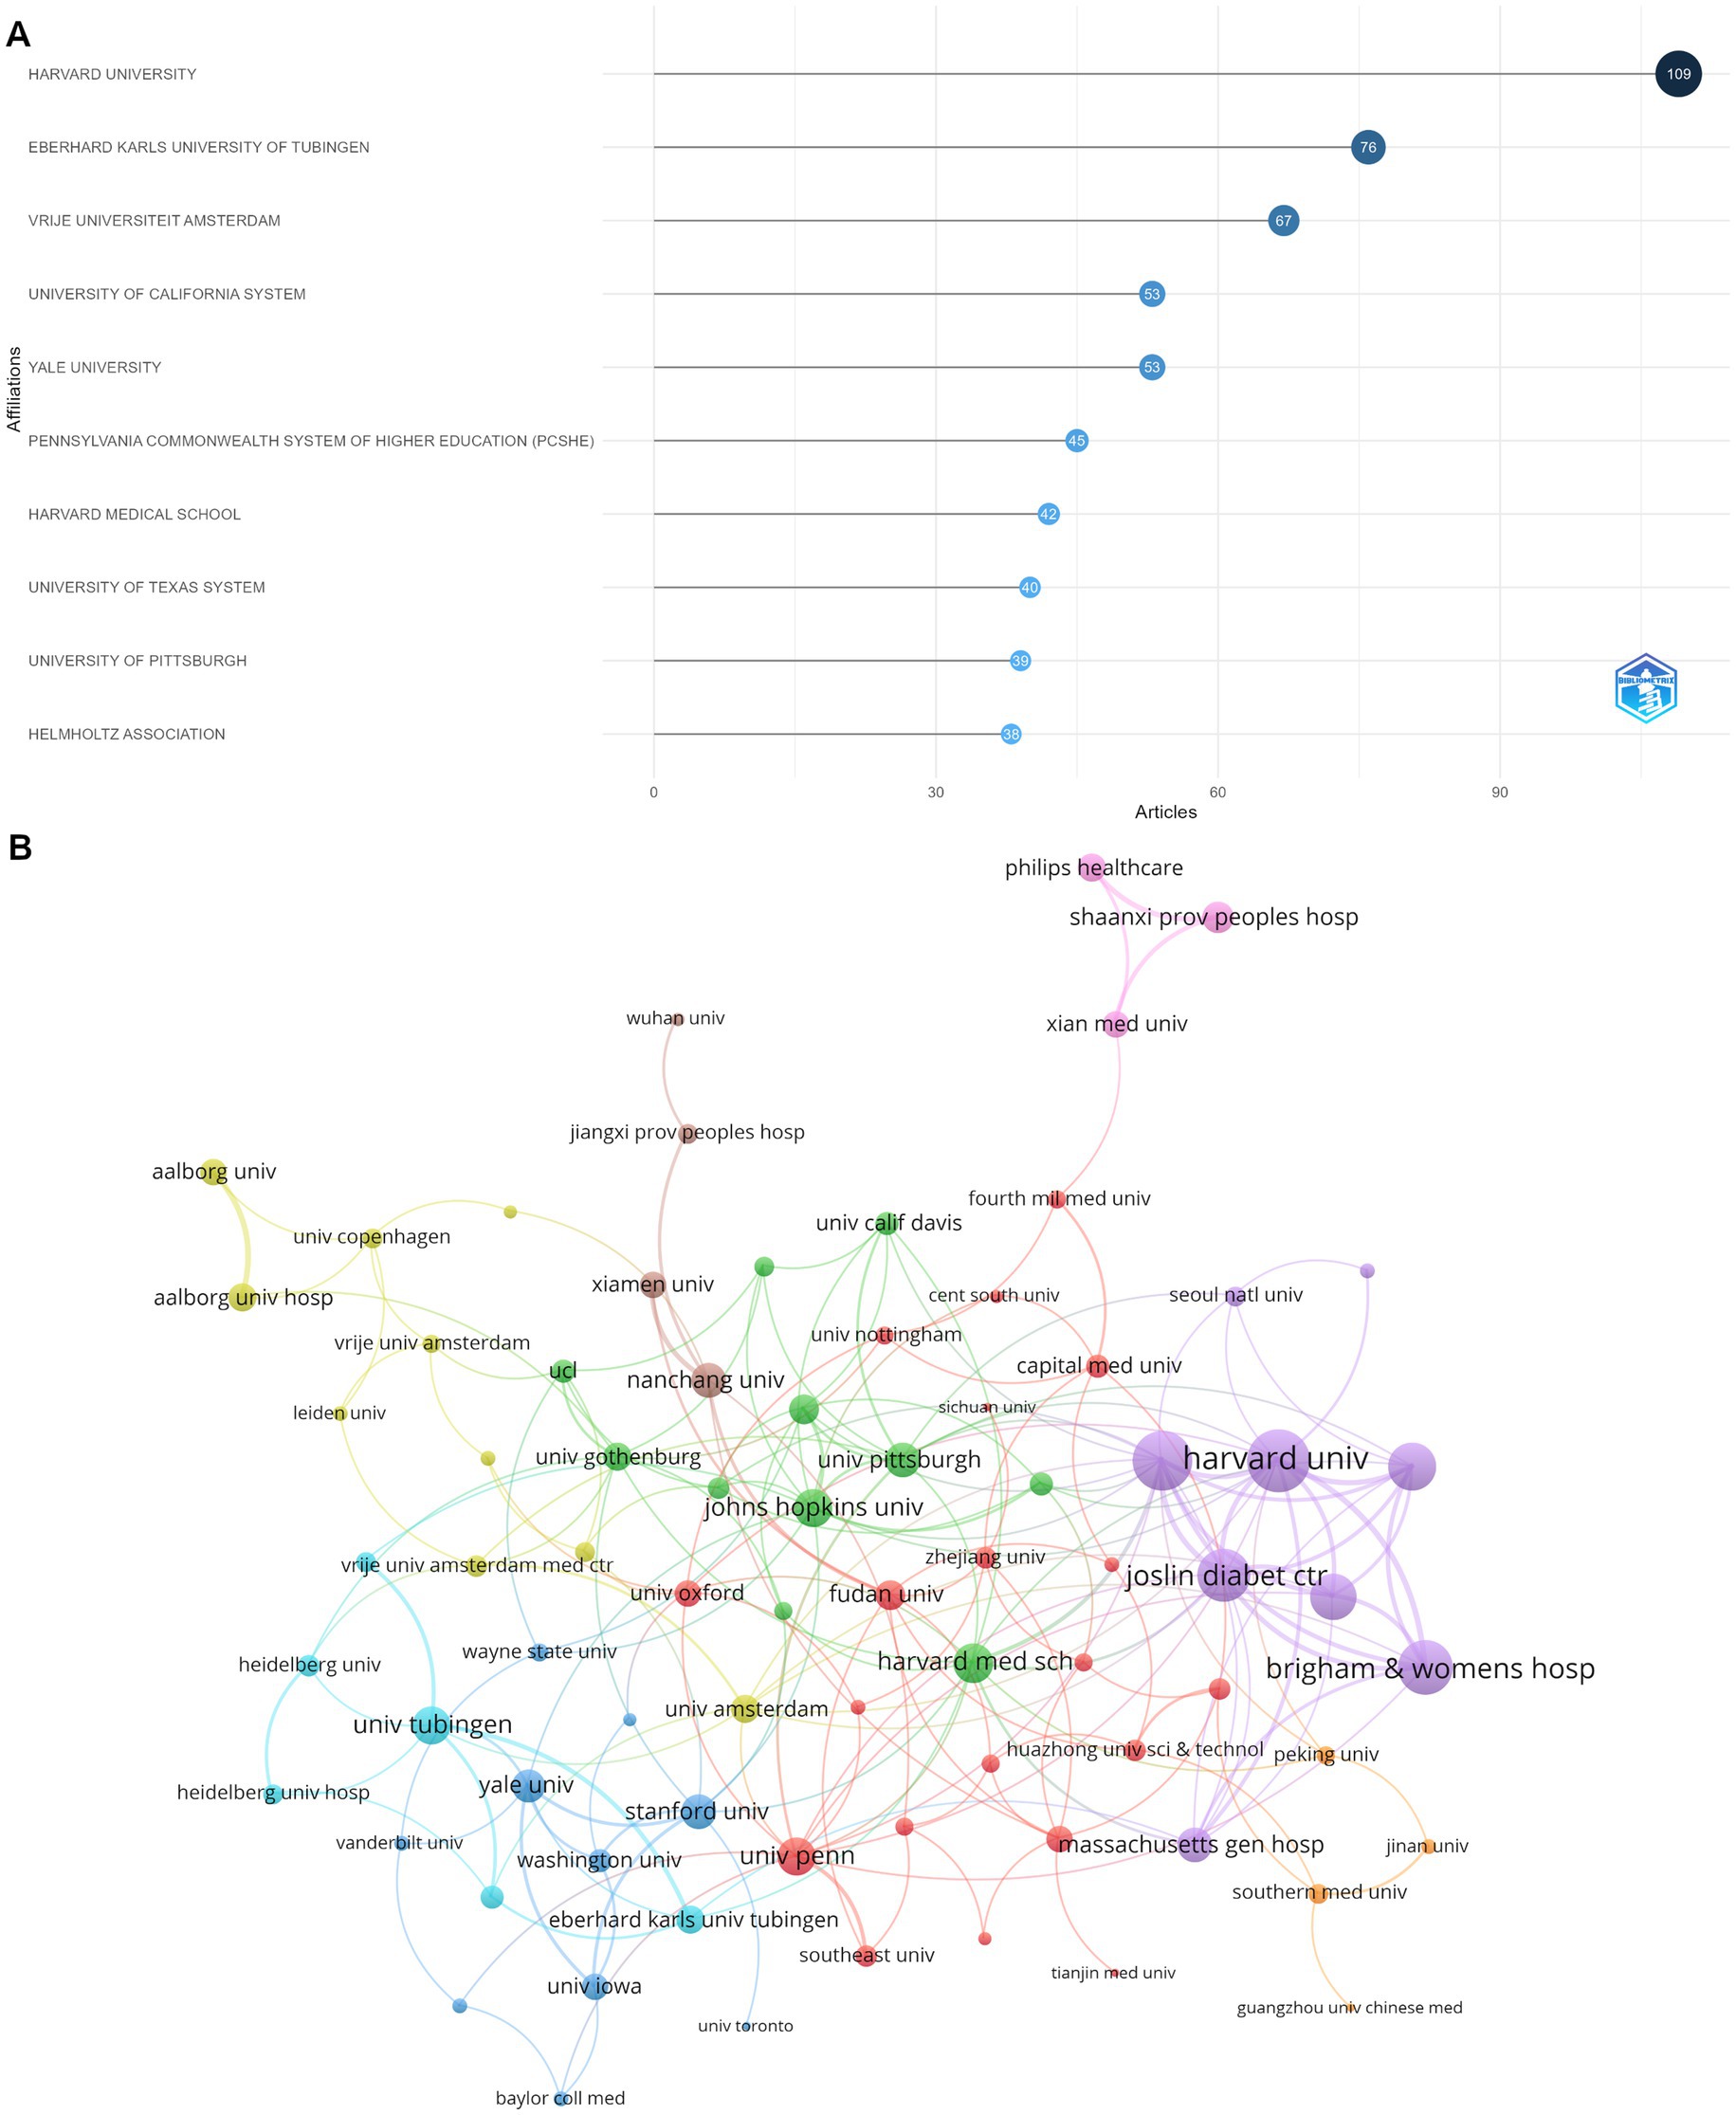
Figure 4. Analysis of institutions. (A) Top 10 institutions according to the publications and citations. (B) Visualization map depicting the collaboration among different institutions.
3.4 Analysis of journals
Table 2 shows the basic information of the top 20 most productive journals in fMRI and diabetes mellitus. The journal with the highest impact factor (IF) was Diabetes Care (IF = 14.8), followed by Cardiovascular Diabetology (IF = 8.5). Diabetes has published the greatest TP of 26 publications, followed by Frontiers in Neuroscience (23 publications) and Diabetes Care (20 publications). In addition, 95% of the top 20 journals were categorized in the Q1 or Q2 Journal Citation Reports (JCR) region. Regarding citations, articles published in Neuroimage were cited most frequently (1,314 times), followed by Diabetes (1,053 times). Regarding H-index, Diabetes Care was in the leading position (H = 22).
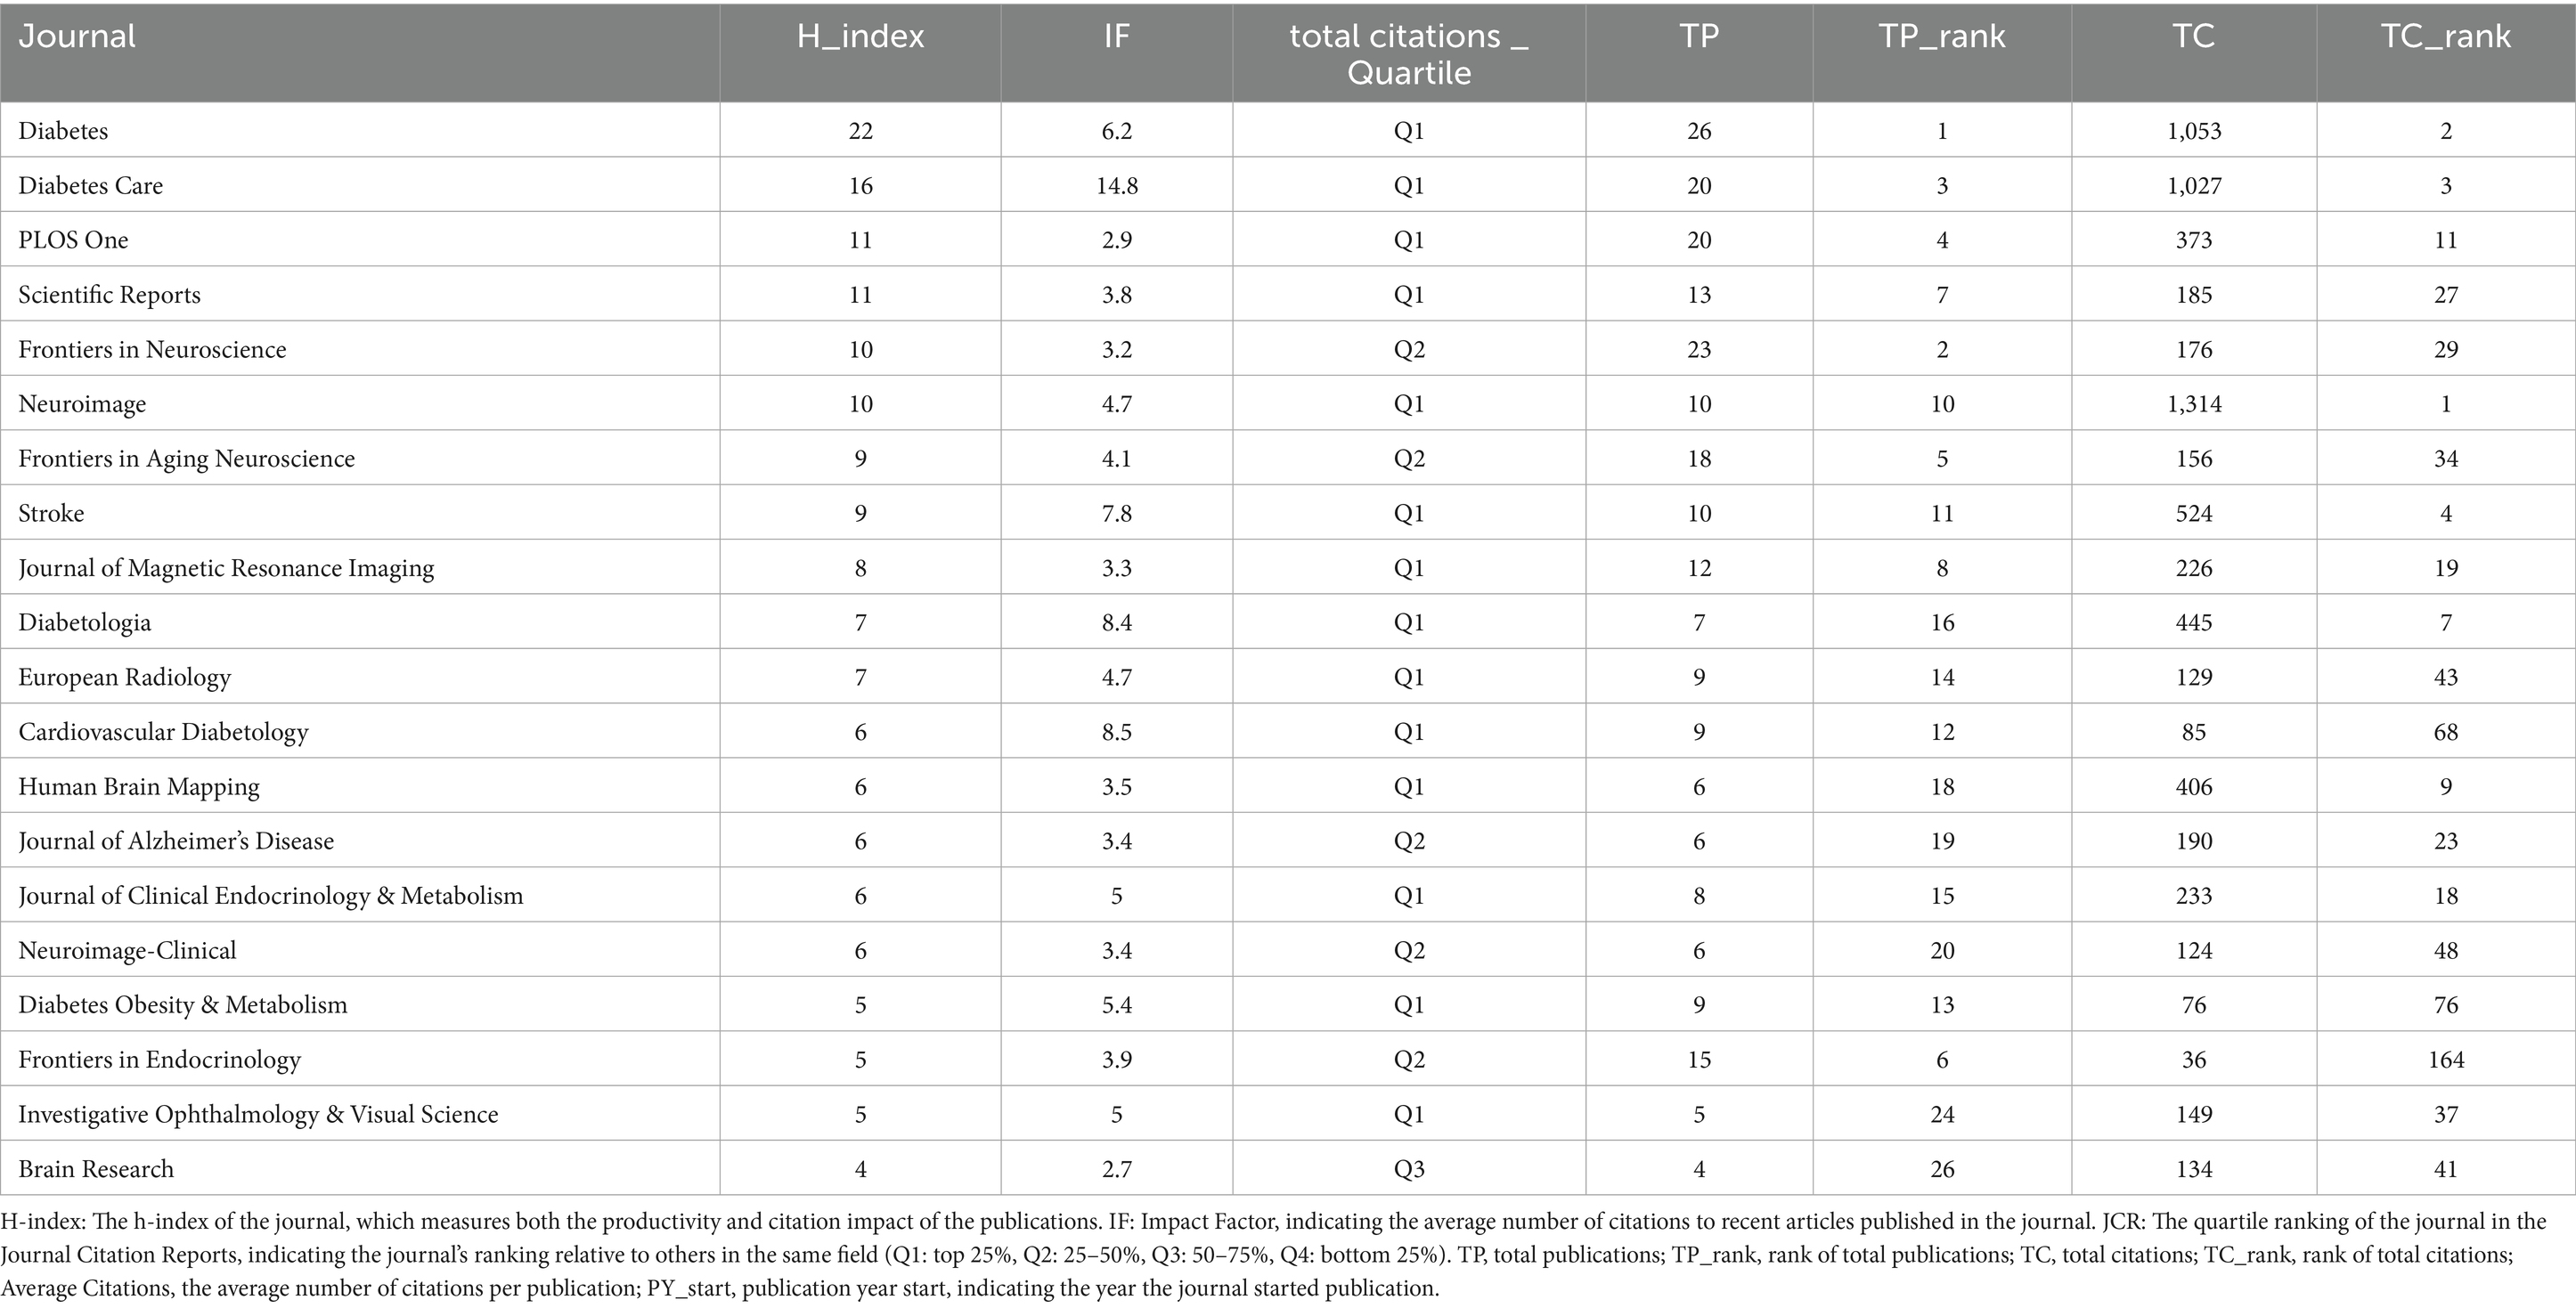
Table 2. Bibliometric indicators of high-impact journals.
Figure 5 depicts the network visualization map of the journal co-citation analysis. The co-occurrence networks of journals contained 65 journals with at least three occurrences. The three key journals with the highest total link strength in co-occurrence networks were Diabetes (total link strength = 254), Frontiers in Neuroscience (total link strength = 164), and Frontiers in Aging Neuroscience (total link strength = 109).
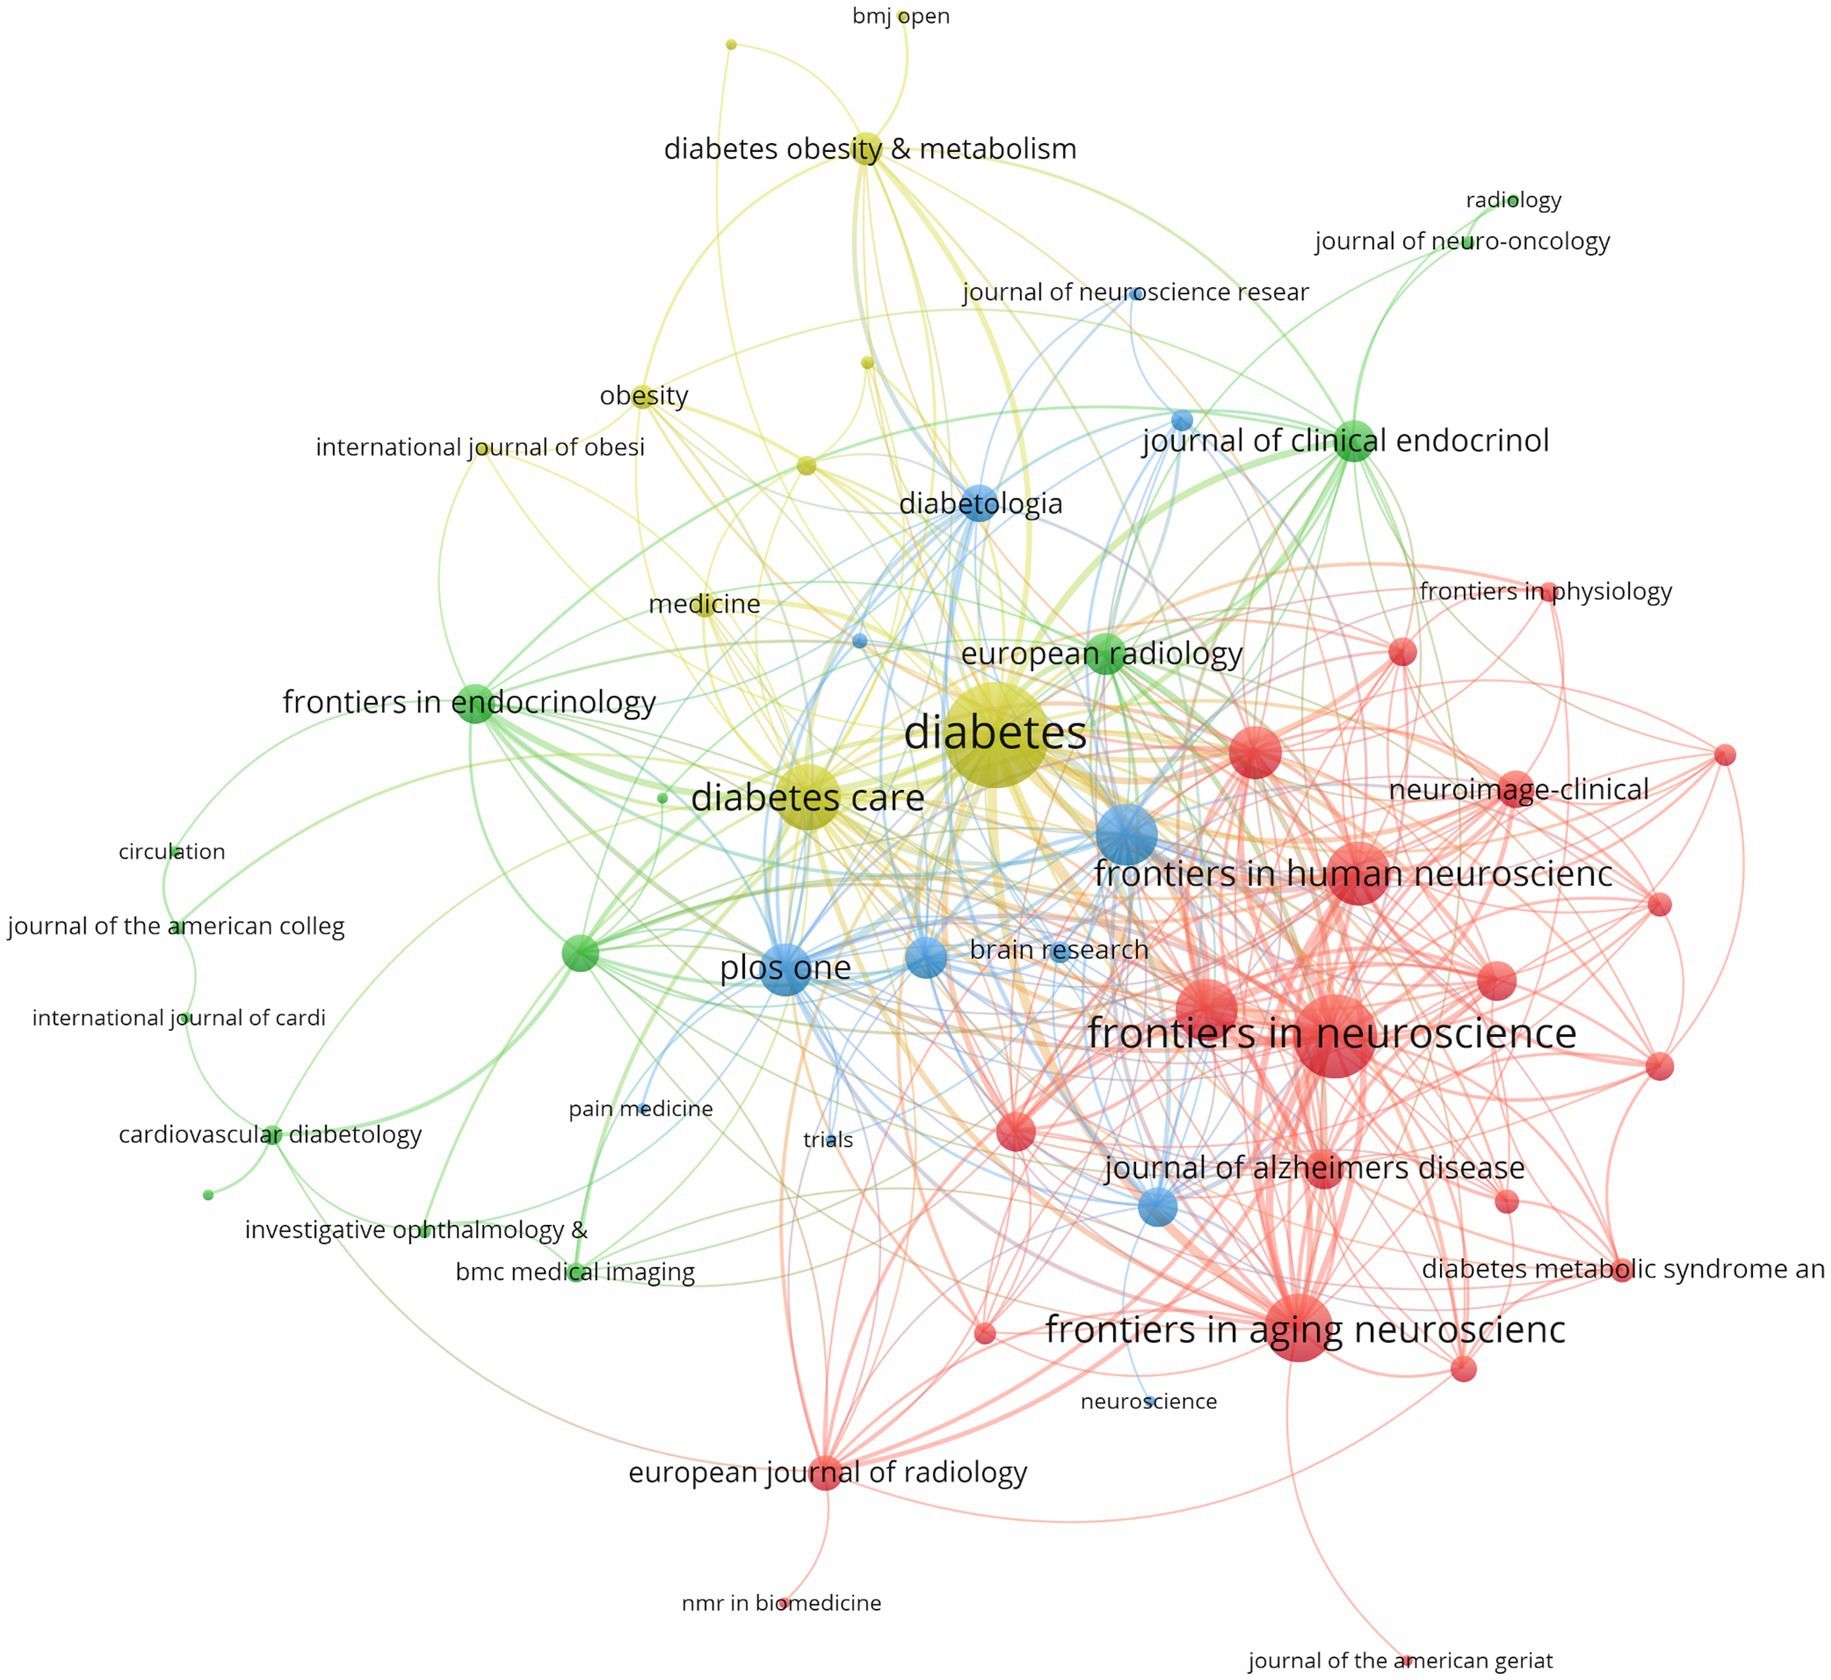
Figure 5. Visualization map depicting the collaboration among different journals.
3.5 Analysis of authors
Table 3 presents the top 20 core authors. The top 20 authors published 210 articles collectively, totaling 9,499 citations. Regarding TP, SHAO YI leads with 16 publications, followed by QIU SHIJUN with 14 publications. Regarding TC, FRITSCHE ANDREAS leads with 962 citations, and PREISSL HUBERT follows with 910 citations. Regarding the H-index and G-index, FRITSCHE ANDREAS is in the leading position. Figure 6 displays the collaborations among authors. Among the 97 authors involved in international collaborations with a minimum of three articles, QIU SHIJUN has the highest number of collaborations with other countries (total link strength = 104), followed by TAN XIN (total link strength = 100) and LIANG YI (total link strength = 85). In the network visualization, the size of the nodes increases with the number of articles published by the authors. The larger the node, the more articles the author publishes.
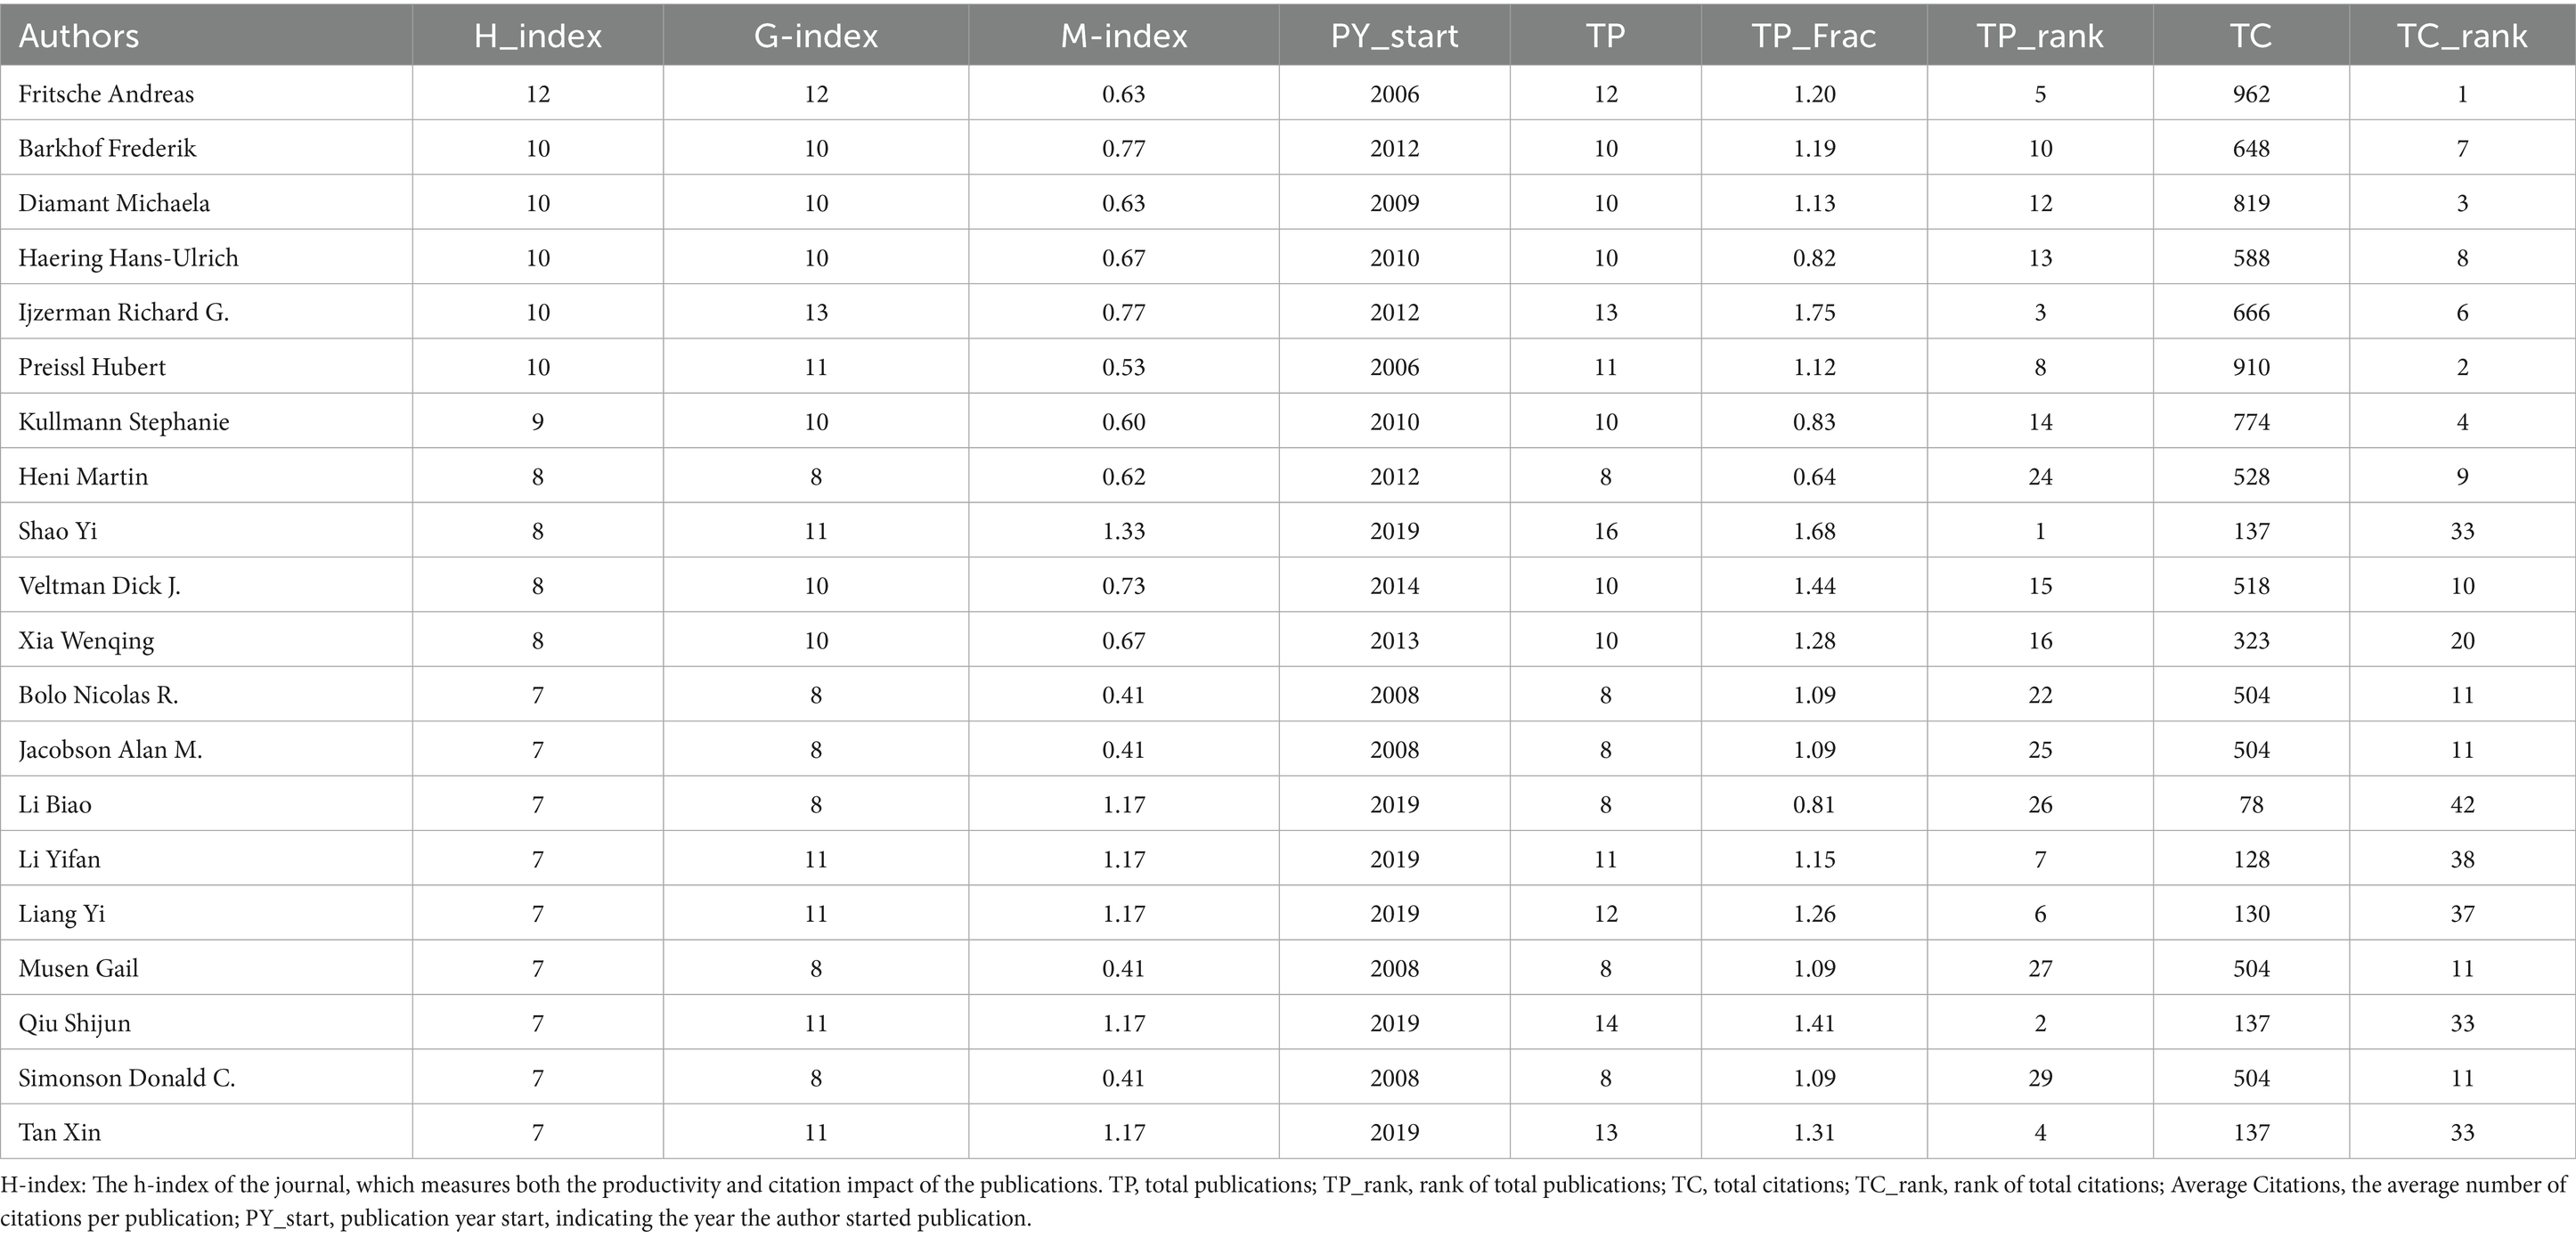
Table 3. Publication and citation profiles of high-impact authors.
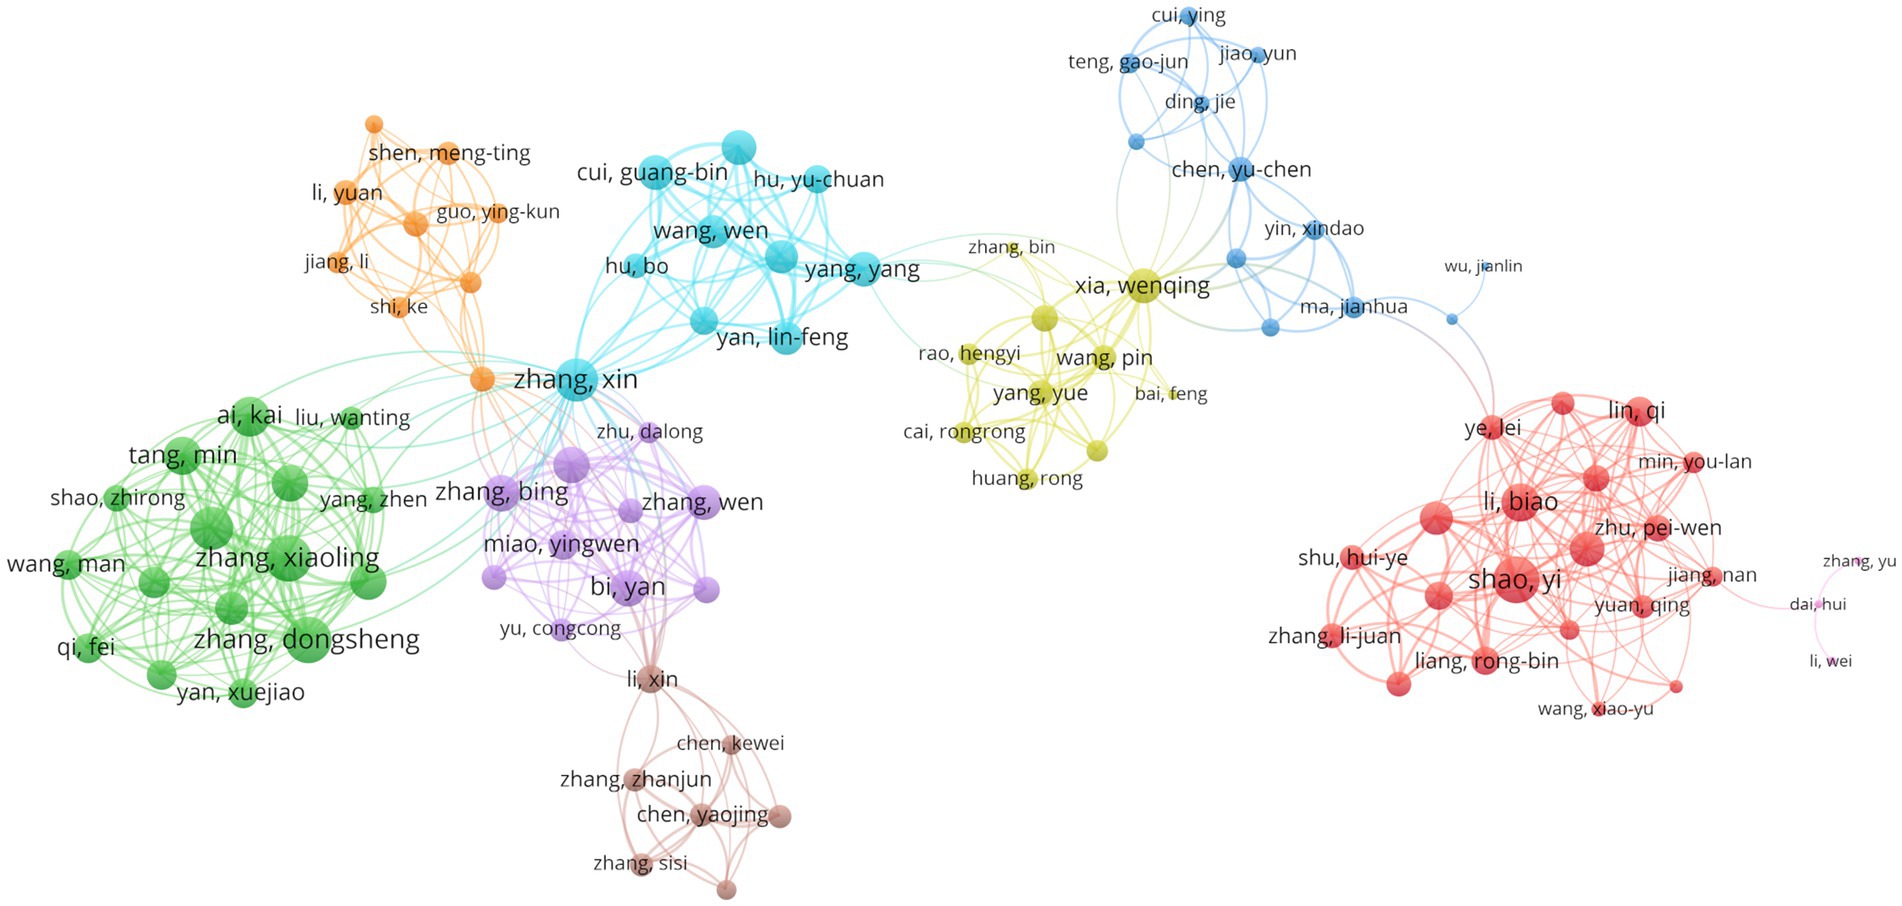
Figure 6. Visualization map depicting the collaboration among different authors.
3.6 Keywords analysis
A comprehensive keyword analysis of the selected articles was performed using “Author Keywords” from the Bibliophagy application and “Keywords Plus” provided by the VOSviewer application. In total, 116 keywords with a minimum of eight occurrences were identified (Figure 7). Table 4 displays the frequency distribution of the keywords in the top 20 most frequent occurrences. Among them, the top five keywords identified were “dementia,” “risk,” “brain,” “Alzheimer’s disease,” and “functional connectivity.”
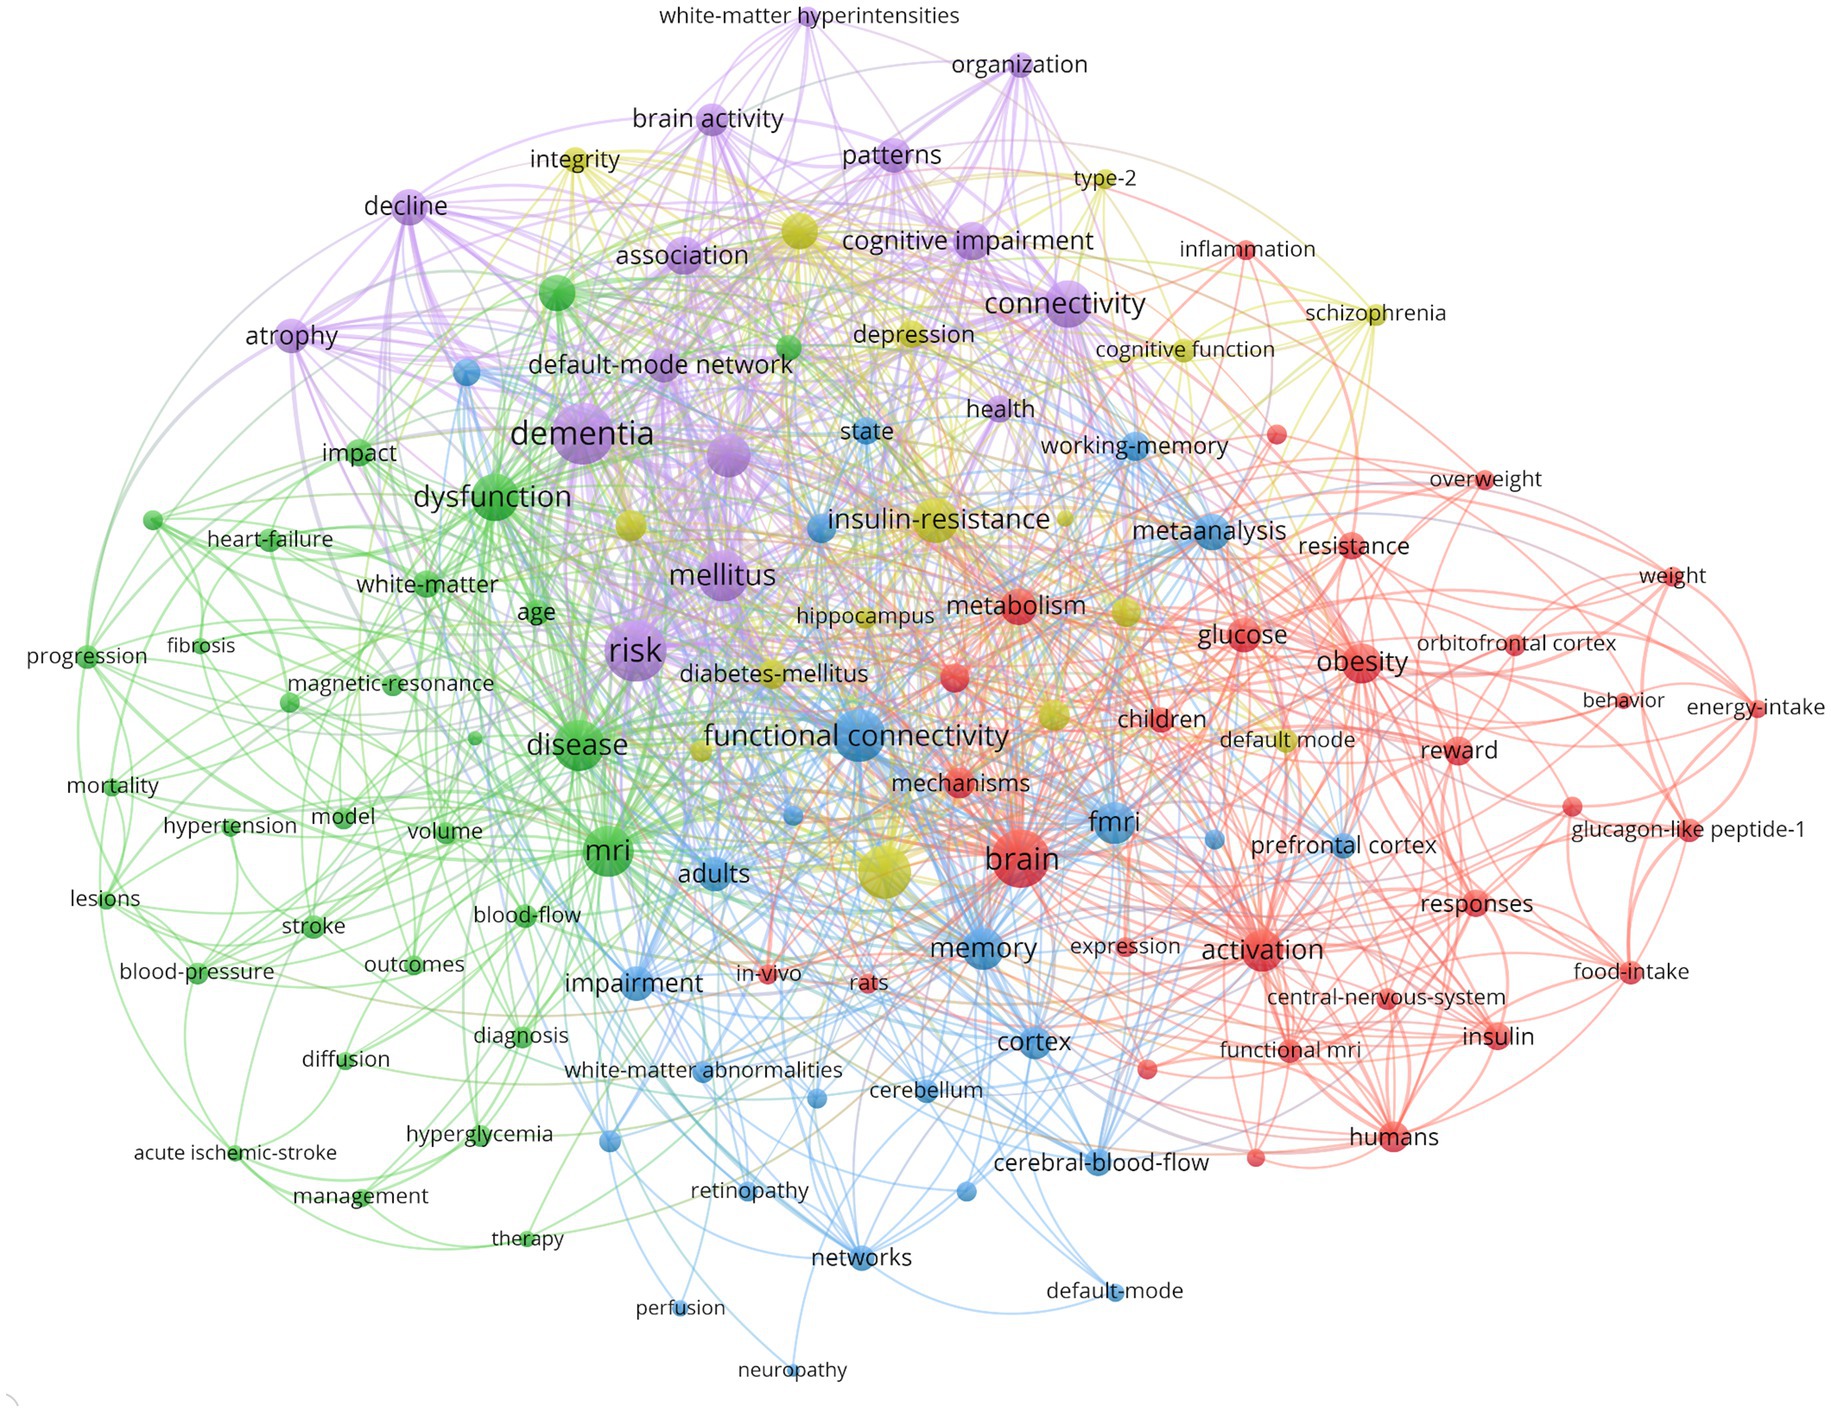
Figure 7. Visual analysis of keyword co-occurrence network analysis.
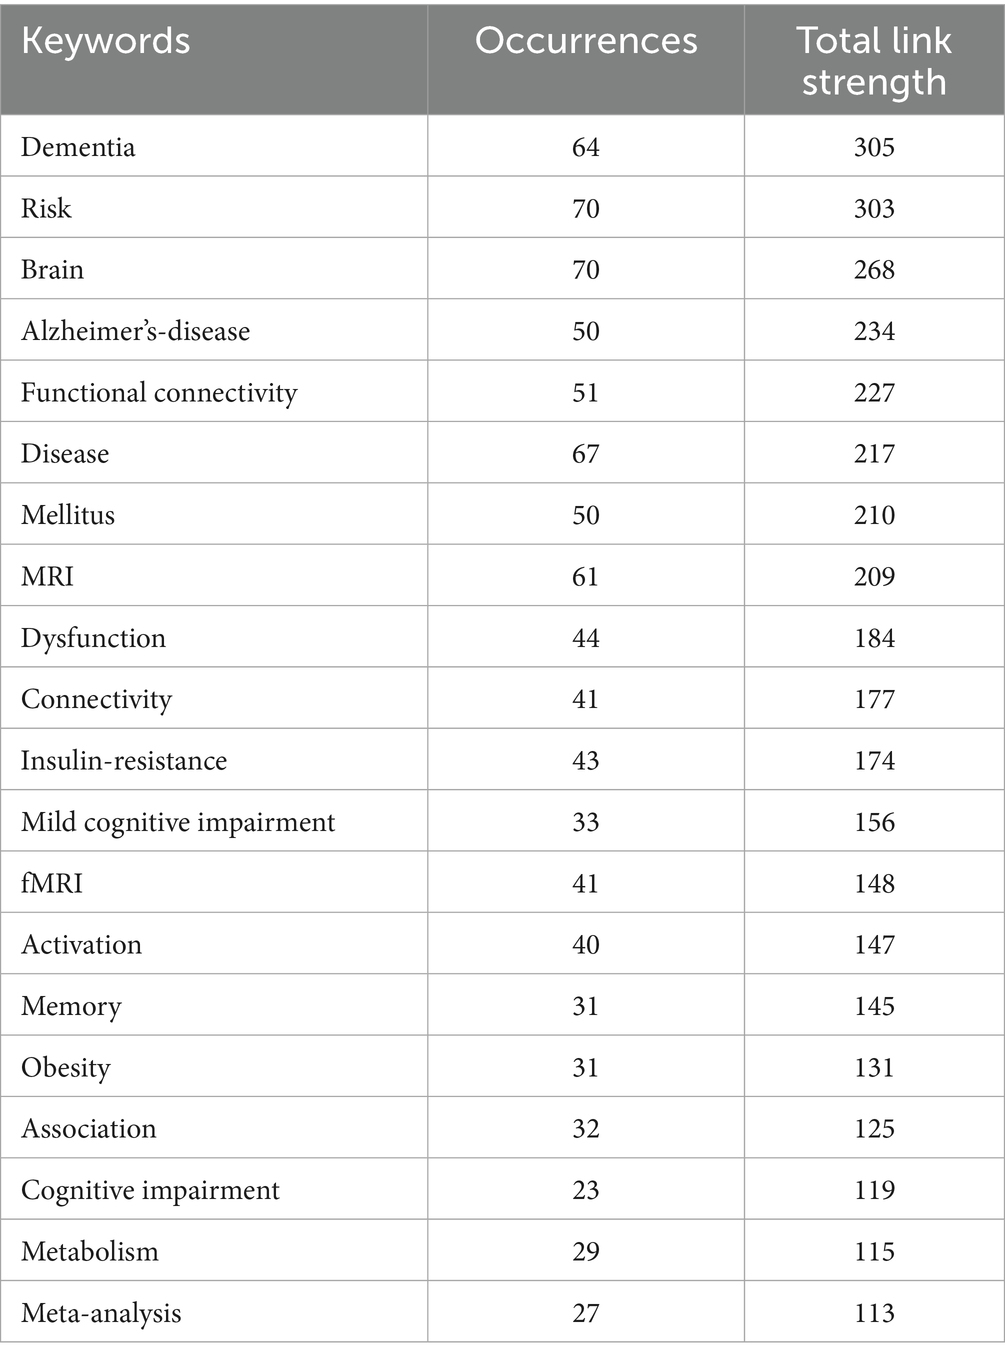
Table 4. Frequency distribution of the top 20 most frequent occurrences keywords.
In addition, the keyword burst detection was used to identify research hot spots. Figure 8 depicts the top 20 references with the strongest keyword bursts on research during the period of 1994–2024. The green line indicates the 1994–2024 timeframe, and the red line indicates the period during which the outbreak was sustained. Since 2017, the keywords “association,” “prevalence,” “default mode network,” “diabetic retinopathy,” “spontaneous brain activity,” “memory,” “dysfunction,” “impairment,” and “diagnosis” have been more prominently concentrated, indicating promising developments. Among the identified keyword bursts, those featured by the end of 2024 were “dysfunction,” “impairment,” and “diagnosis.”
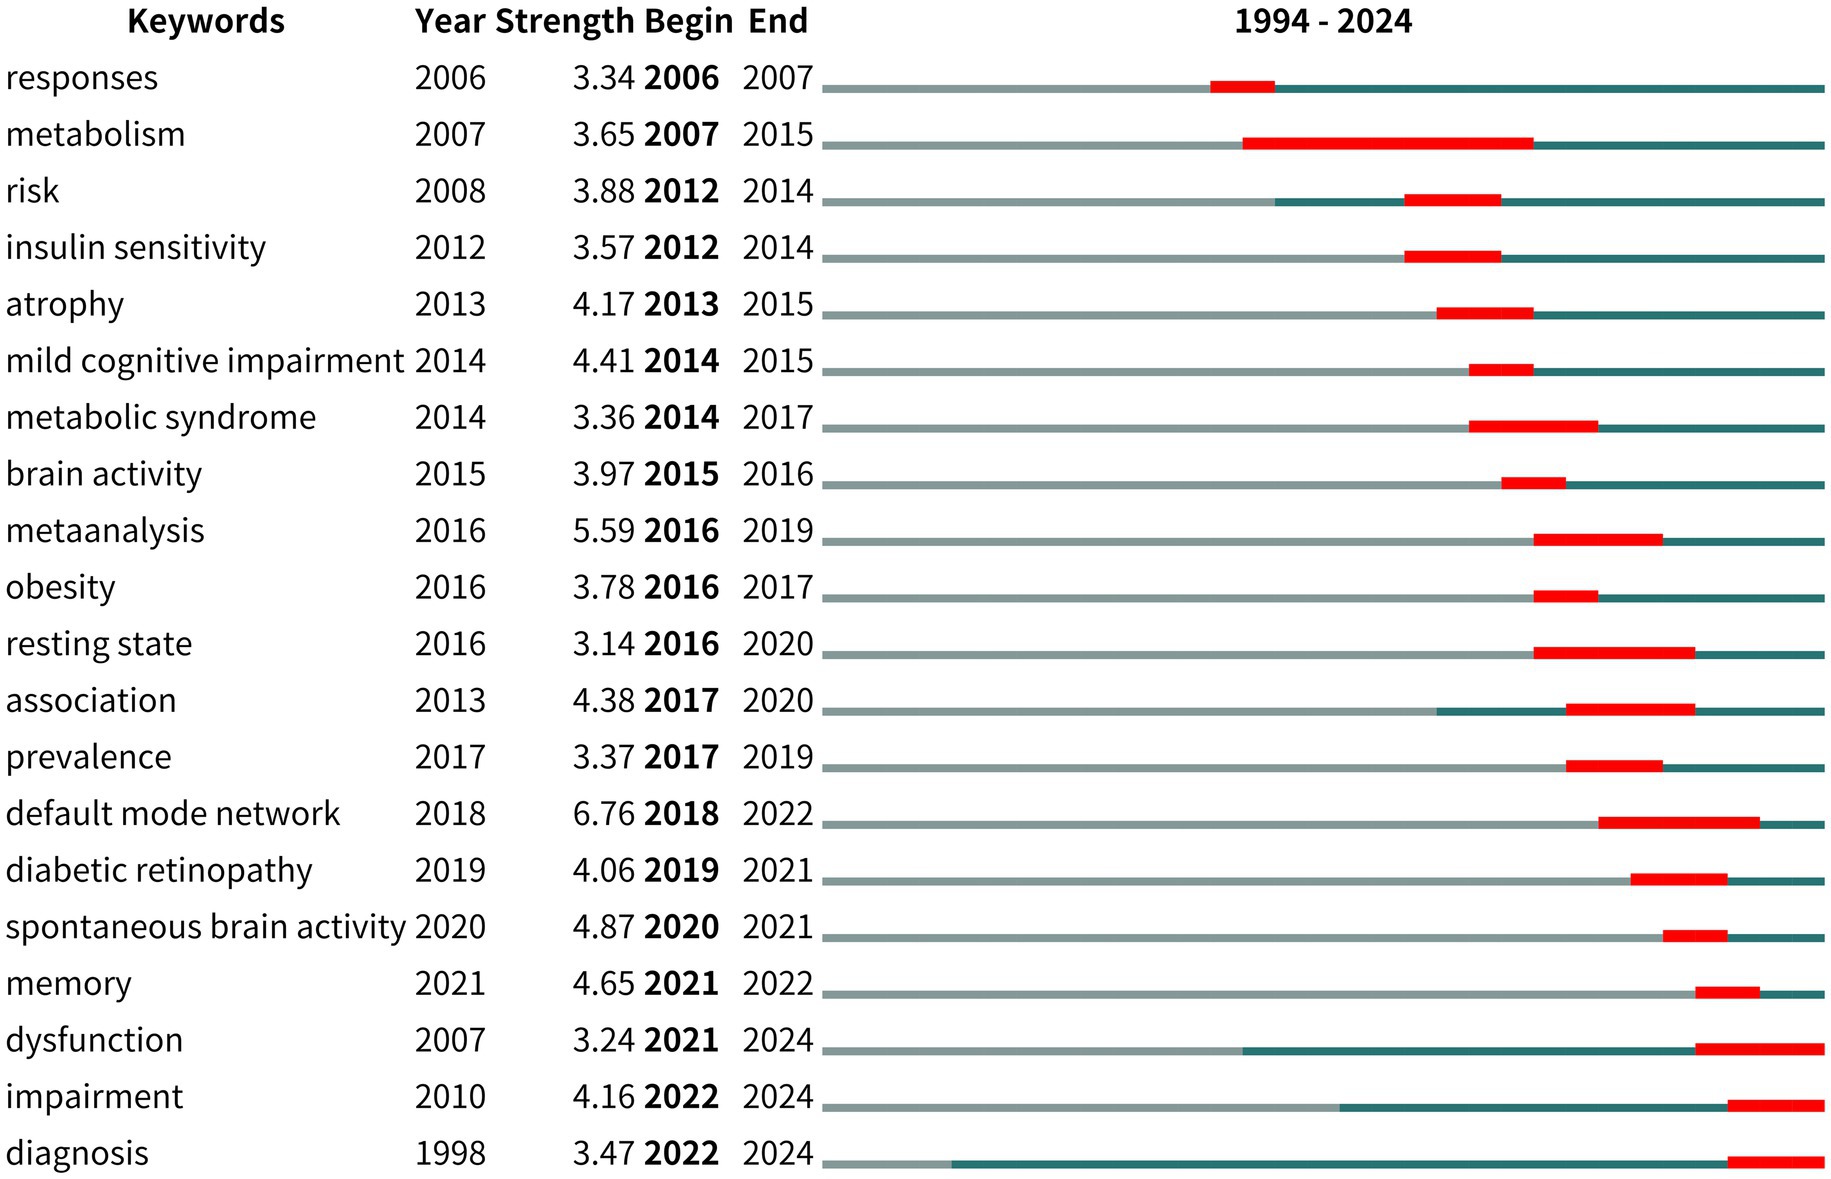
Figure 8. Top 20 keywords with the strongest citation bursts.
4 Discussion
4.1 General information
The present study identified 706 articles about fMRI and diabetes mellitus published from 1987 to 2024. The overall publication numbers maintained a stable growth trend. The USA published the largest number of papers. Among the top ten institutions, the majority are from the USA, suggesting that institutions from the USA lead an important position in this field. Diabetes is the journal with the most publications. SHAO YI has the highest publication among all authors.
In terms of journals, Diabetes has the highest number of publications in fMRI and diabetes mellitus, followed by Frontiers in Neuroscience and Diabetes Care. A previous study published in Diabetes suggested that cognitive functioning among T1DM can be assessed with fMRI techniques (25). Other studies published in Frontiers in Neuroscience used fMRI to acquire brain change data (26). Among the top 20 most cited journals, Neuroimage has the most TCs. The journal Diabetes is ranked second in the number of papers published. Regarding the H-index, the journal Diabetes holds the leading position. In addition, Neuroimage and Diabetes are both from the USA, demonstrating that the USA provides an important platform for developing fMRI and diabetes mellitus.
Regarding publication volume, the most prolific author is SHAO YI from China. His research focuses on brain activity in patients with diabetic optic neuropathy (27, 28). QIU SHIJUN from China mainly studied the functional connectivity (FC) of patients with T2DM and mild cognitive impairment (29). However, regarding TCs, FRITSCHE ANDREAS from the University of Tübingen, Germany, holds the first position and has the highest H-index. He mainly assesses the visceral adipose mass MRI and their correlation with markers for insulin resistance and prediabetes (19). It is crucial to consider the number of publications and the quality of their articles to identify prolific authors.
The annual publications output in the field of fMRI and diabetes mellitus demonstrated a continuous and stable upward trend in the past 30 years. Regarding countries/regions, China and the USA are the leading contributors to fMRI and diabetes mellitus research. Although China ranks first in the number of publications, it has a low position in TCs, indicating a lower quality of articles. The USA ranks first in TCs. The most cited article from the US was published in the Proceedings of the National Academy of Sciences of the United States of America in 2001, with 1986 citations (30), indicating a higher quality of articles. In addition, seven institutions among the top 10 are from the USA. In other words, the USA is significant in the field of fMRI and diabetes mellitus. In the USA, 30.3 million (9.4%) adults had diabetes mellitus in 2017 (31). The country has a good foundation in medical research and provides significant financial support for research. Overall, with irreversible globalization, there is still a need for more collaboration between countries/institutions to promote research in this field.
4.2 Research hotspots and trends
Among the top 20 most frequent keywords, the top five keywords were “dementia,” “risk,” “brain,” “Alzheimer’s disease,” and “functional connectivity.” In addition, the top 20 most cited keywords, listed in Figure 8, reveal the potential hotspots of fMRI and diabetes research in the past 30 years. Firstly, the “risk,” “dysfunction,” “impairment,” and “dementia” keywords suggest that the current literature mainly focuses on diabetes mellitus and the risk of cognitive impairment/dysfunction. Increasing studies suggest that T1DM and T2DM are associated with decreased performance in multiple domains of cognitive function and structural and fMRI abnormalities of the brain (27, 32, 33). Therefore, some researchers began to establish dementia risk prediction modeling with fMRI data to predict cognitive impairment/dysfunction and dementia. For example, Samoilova et al. used MRI data to create a computer neural network model for predicting the development of cognitive impairment in DM based on brain neuroimaging techniques (34). There are few studies on the prediction of cognitive function in patients with T2DM based on fMRI (35). Therefore, future research should present a new solution idea, which extracts the characteristics from fMRI and establishes a cognitive function prediction model among diabetes mellitus patients.
Secondly, the “dysfunction,” “impairment,” and “diagnosis” keywords indicated that one of the research hotspots is to find potential biomarkers for early diagnosis of cognitive impairment/dysfunction. Diabetes mellitus is associated with cognitive decline and altered brain structure (32). FC can be used to reflect brain function, diagnose neurodegenerative diseases, and provide insights into pathophysiologic mechanisms (36, 37). Blood oxygen level-dependent (BOLD) signaling in fMRI reveals hemodynamic changes associated with neural activity and has been used to detect FC alterations in patients with T2DM and mild cognitive impairment (MCI) (38–40). Region-specific FC provides useful features for T2DM-MCI diagnosis. Hence, FC is a potential biomarker for assessing the degree of cognitive decline (41). In addition, the application of multiple resting-state fMRI (rs-MRI) indices can detect abnormal neural activities in different brain regions in patients with T2DM, and a decreased coupling trend between the amplitude of low-frequency fluctuation (ALFF) can help understand the early changes before cognitive impairment appears. Compared with other fMRI techniques, rs-fMRI is widely used because it requires the least number of patients, acquires signals more easily, and is proficient in recognizing functional areas in many different groups, even those with low cooperation. Therefore, rs-fMRI may be useful for detecting central nervous system impairment caused by T2DM with DPN (14). Many studies explored the fMRI imaging of the brain in T2DM cognitive dysfunction (42–44). Research found that hippocampal atrophy can be used as an early imaging marker for structural changes in brain regions of patients with T2DM cognitive impairment (45). These findings provide some new insights into the neural mechanisms of diabetes mellitus-related cognitive impairment.
4.3 Strengths and limitations
This study is the first bibliometric analysis on fMRI and diabetes mellitus over the past 30 years, demonstrating a systematic overview of the field and providing guidance for future research. With the help of the present bibliometric analysis, researchers interested in fMRI and diabetes mellitus can get an overview of the field and quickly get up to speed on the latest research hotspots. However, there were some limitations to this study. Firstly, this study’s reliance on specific databases may have excluded relevant literature not indexed in the SCI-E database from WoSCC. Secondly, while bibliometric methods provide valuable insights, they have limitations in capturing the full scope and nuances of the research landscape. Finally, the generalizability of findings may be limited to the specific context of fMRI in diabetes mellitus research.
5 Conclusion
The present study analyzed the research on fMRI and diabetes mellitus in the past 30 years with the help of bibliometric mapping. The results suggest that the overall publication numbers maintained a stable growth trend. China and the USA published the largest number of papers, highlighting their extensive research contribution in this field. Among the top ten institutions based on the number of publications, the majority of articles are from the USA. Diabetic cognitive impairment/dysfunction and diabetic brain activity are the most intensive research topics. Future research should focus more on predicting cognitive function in patients with diabetes mellitus based on fMRI.
Data availability statement
The original contributions presented in the study are included in the article/supplementary material, further inquiries can be directed to the corresponding authors.
Author contributions
ZS: Conceptualization, Writing – original draft, Writing – review & editing. YL: Writing – review & editing. XQ: Writing – review & editing. LW: Data curation, Writing – review & editing. SZ: Data curation, Writing – review & editing. XuS: Data curation, Writing – review & editing. LY: Conceptualization, Writing – original draft, Writing – review & editing. XiS: Conceptualization, Writing – original draft, Writing – review & editing.
Funding
The author(s) declare that financial support was received for the research and/or publication of this article. This work was supported by grants from the Medical and Health Science and Technology Development Plan Project of Shandong Province of China (202120010871).
Conflict of interest
The authors declare that the research was conducted in the absence of any commercial or financial relationships that could be construed as a potential conflict of interest.
Generative AI statement
The authors declare that no Gen AI was used in the creation of this manuscript.
Any alternative text (alt text) provided alongside figures in this article has been generated by Frontiers with the support of artificial intelligence and reasonable efforts have been made to ensure accuracy, including review by the authors wherever possible. If you identify any issues, please contact us.
Publisher’s note
All claims expressed in this article are solely those of the authors and do not necessarily represent those of their affiliated organizations, or those of the publisher, the editors and the reviewers. Any product that may be evaluated in this article, or claim that may be made by its manufacturer, is not guaranteed or endorsed by the publisher.
Footnotes
References
1. GBD 2021 Diabetes Collaborators. Global, regional, and national burden of diabetes from 1990 to 2021, with projections of prevalence to 2050: a systematic analysis for the global burden of disease study 2021. Lancet. (2023) 402:203–34. doi: 10.1016/S0140-6736(23)01301-6
2. Prabowo, MH, Febrinasari, RP, Pamungkasari, EP, Mahendradhata, Y, Pulkki-Brännström, AM, and Probandari, A. Health-related quality of life of patients with diabetes mellitus measured with the Bahasa Indonesia version of EQ-5D in primary care settings in Indonesia. J Prev Med Public Health. (2023) 56:467–74. doi: 10.3961/jpmph.23.229
3. Zhao, H, Wang, F, Luo, GH, Lei, H, Peng, F, Ren, QP, et al. Assessment of structural brain changes in patients with type 2 diabetes mellitus using the MRI-based brain atrophy and lesion index. Neural Regen Res. (2022) 17:618–24. doi: 10.4103/1673-5374.320996
4. Dove, A, Shang, Y, Xu, W, Grande, G, Laukka, EJ, Fratiglioni, L, et al. The impact of diabetes on cognitive impairment and its progression to dementia. Alzheimers Dement. (2021) 17:1769–78. doi: 10.1002/alz.12482
5. Chornenkyy, Y, Wang, WX, Wei, A, and Nelson, PT. Alzheimer’s disease and type 2 diabetes mellitus are distinct diseases with potential overlapping metabolic dysfunction upstream of observed cognitive decline. Brain Pathol. (2019) 29:3–17. doi: 10.1111/bpa.12655
6. American Diabetes Association Professional Practice Committee. Older adults: standards of medical care in diabetes-2022. Diabetes Care. (2022) 45:S195–207. doi: 10.2337/dc22-S013
7. Nasreddine, ZS, Phillips, NA, Bédirian, V, Charbonneau, S, Whitehead, V, Collin, I, et al. The Montreal cognitive assessment, MoCA: a brief screening tool for mild cognitive impairment. J Am Geriatr Soc. (2005) 53:695–9. doi: 10.1111/j.1532-5415.2005.53221.x
8. Sharma, S, and Rayman, G. Frontiers in diagnostic and therapeutic approaches in diabetic sensorimotor neuropathy (DSPN). Front Endocrinol (Lausanne). (2023) 14:1165505. doi: 10.3389/fendo.2023.1165505
9. Eid, SA, Rumora, AE, Beirowski, B, Bennett, DL, Hur, J, Savelieff, MG, et al. New perspectives in diabetic neuropathy. Neuron. (2023) 111:2623–41. doi: 10.1016/j.neuron.2023.05.003
10. Chitneni, A, Rupp, A, Ghorayeb, J, and Abd-Elsayed, A. Early detection of diabetic peripheral neuropathy by fMRI: an evidence-based review. Brain Sci. (2022) 12:557. doi: 10.3390/brainsci12050557
11. Volz, LJ, Kocher, M, Lohmann, P, Shah, NJ, Fink, GR, and Galldiks, N. Functional magnetic resonance imaging in glioma patients: from clinical applications to future perspectives. Q J Nucl Med Mol Imaging. (2018) 62:295–302. doi: 10.23736/S1824-4785.18.03101-1
12. Zhang, Y, Hua, Y, and Bai, Y. Applications of functional magnetic resonance imaging in determining the pathophysiological mechanisms and rehabilitation of spatial neglect. Front Neurol. (2020) 11:548568. doi: 10.3389/fneur.2020.548568
13. Keilholz, S, Caballero-Gaudes, C, Bandettini, P, Deco, G, and Calhoun, V. Time-resolved resting-state functional magnetic resonance imaging analysis: current status, challenges, and new directions. Brain Connect. (2017) 7:465–81. doi: 10.1089/brain.2017.0543
14. Li, J, Zhang, W, Wang, X, Yuan, T, Liu, P, Wang, T, et al. Functional magnetic resonance imaging reveals differences in brain activation in response to thermal stimuli in diabetic patients with and without diabetic peripheral neuropathy. PLoS One. (2018) 13:e0190699. doi: 10.1371/journal.pone.0190699
15. Chen, GQ, Zhang, X, Xing, Y, Wen, D, Cui, GB, and Han, Y. Resting-state functional magnetic resonance imaging shows altered brain network topology in type 2 diabetic patients without cognitive impairment. Oncotarget. (2017) 8:104560–70. doi: 10.18632/oncotarget.21282
16. Passiak, BS, Liu, D, Kresge, HA, Cambronero, FE, Pechman, KR, Osborn, KE, et al. Perivascular spaces contribute to cognition beyond other small vessel disease markers. Neurology. (2019) 92:e1309–21. doi: 10.1212/WNL.0000000000007124
17. Schreiber, J, Riffert, T, Anwander, A, and Knösche, TR. Plausibility tracking: a method to evaluate anatomical connectivity and microstructural properties along fiber pathways. NeuroImage. (2014) 90:163–78. doi: 10.1016/j.neuroimage.2014.01.002
18. Hillman, EM. Coupling mechanism and significance of the BOLD signal: a status report. Annu Rev Neurosci. (2014) 37:161–81. doi: 10.1146/annurev-neuro-071013-014111
19. Machann, J, Stefan, N, Wagner, R, Fritsche, A, Bell, JD, Whitcher, B, et al. Normalized indices derived from visceral adipose mass assessed by magnetic resonance imaging and their correlation with markers for insulin resistance and prediabetes. Nutrients. (2020) 12:2064. doi: 10.3390/nu12072064
20. Guler, AT, Waaijer, CJ, and Palmblad, M. Scientific workflows for bibliometrics. Scientometrics. (2016) 107:385–98. doi: 10.1007/s11192-016-1885-6
21. van Eck, NJ, and Waltman, L. Software survey: VOSviewer, a computer program for bibliometric mapping. Scientometrics. (2010) 84:523–38. doi: 10.1007/s11192-009-0146-3
22. Bertoli-Barsotti, L, and Lando, T. A theoretical model of the relationship between the h-index and other simple citation indicators. Scientometrics. (2017) 111:1415–48. doi: 10.1007/s11192-017-2351-9
23. Hirsch, JE. An index to quantify an individual’s scientific research output. Proc Natl Acad Sci USA. (2005) 102:16569–72. doi: 10.1073/pnas.0507655102
24. Abbas, AM. Bounds and inequalities relating h-index, g-index, e-index and generalized impact factor: an improvement over existing models. PLoS One. (2012) 7:e33699. doi: 10.1371/journal.pone.0033699
25. van Duinkerken, E, Schoonheim, MM, Sanz-Arigita, EJ, Rg, IJ, Moll, AC, Snoek, FJ, et al. Resting-state brain networks in type 1 diabetic patients with and without microangiopathy and their relation to cognitive functions and disease variables. Diabetes. (2012) 61:1814–21. doi: 10.2337/db11-1358
26. Mahmud, Z, Dhami, PS, Rans, C, Liu, PB, and Hwang, PM. Dilated cardiomyopathy mutations and phosphorylation disrupt the active orientation of cardiac troponin C. J Mol Biol. (2021) 433:167010. doi: 10.1016/j.jmb.2021.167010
27. Chen, SY, Cai, GQ, Liang, RB, Yang, QC, Min, YL, Ge, QM, et al. Regional brain changes in patients with diabetic optic neuropathy: a resting-state functional magnetic resonance imaging study. Quant Imaging Med Surg. (2021) 11:2125–37. doi: 10.21037/qims-20-453
28. Guo, GY, Zhang, LJ, Li, B, Liang, RB, Ge, QM, Shu, HY, et al. Altered spontaneous brain activity in patients with diabetic optic neuropathy: a resting-state functional magnetic resonance imaging study using regional homogeneity. World J Diabetes. (2021) 12:278–91. doi: 10.4239/wjd.v12.i3.278
29. Li, N, Zhu, J, Yin, R, Wang, J, Pan, L, Kong, B, et al. Treatment with Niraparib maintenance therapy in patients with newly diagnosed advanced ovarian Cancer: a phase 3 randomized clinical trial. JAMA Oncol. (2023) 9:1230–7. doi: 10.1001/jamaoncol.2023.2283
30. Egan, MF, Goldberg, TE, Kolachana, BS, Callicott, JH, Mazzanti, CM, Straub, RE, et al. Effect of COMT Val108/158 met genotype on frontal lobe function and risk for schizophrenia. Proc Natl Acad Sci USA. (2001) 98:6917–22. doi: 10.1073/pnas.111134598
31. Genco, RJ, and Borgnakke, WS. Diabetes as a potential risk for periodontitis: association studies. Periodontol. (2020) 83:40–5. doi: 10.1111/prd.12270
32. Zilliox, LA, Chadrasekaran, K, Kwan, JY, and Russell, JW. Diabetes and cognitive impairment. Curr Diab Rep. (2016) 16:87. doi: 10.1007/s11892-016-0775-x
33. Wang, LQ, Yue, JH, Gao, SL, Cao, DN, Li, A, Peng, CL, et al. Magnetic resonance imaging on brain structure and function changes in diabetic peripheral neuropathy. Front Neurol. (2023) 14:1285312. doi: 10.3389/fneur.2023.1285312
34. Samoilova, IG, Matveeva, MV, Kudlay, DA, Tonkikh, OS, and Tolmachev, IV. Neural networks in the predictive diagnosis of cognitive impairment in type 1 and type 2 diabetes mellitus. Ter Arkh. (2021) 93:1349–58. doi: 10.26442/00403660.2021.11.201253
35. Liu, Z, Liu, J, Yuan, H, Liu, T, Cui, X, Tang, Z, et al. Identification of Cognitive Dysfunction in Patients with T2DM Using Whole Brain Functional Connectivity. Genomics Proteomics Bioinformatics. (2019) 17:441–52. doi: 10.1016/j.g.Pb2019.09.002
36. Chen, X, Zhang, H, Gao, Y, Wee, CY, Li, G, and Shen, D. High-order resting-state functional connectivity network for MCI classification. Hum Brain Mapp. (2016) 37:3282–96. doi: 10.1002/hbm.23240
37. Chen, X, Zhang, H, Zhang, L, Shen, C, Lee, SW, and Shen, D. Extraction of dynamic functional connectivity from brain grey matter and white matter for MCI classification. Hum Brain Mapp. (2017) 38:5019–34. doi: 10.1002/hbm.23711
38. Qi, D, Wang, A, Chen, Y, Chen, K, Zhang, S, Zhang, J, et al. Default mode network connectivity and related white matter disruption in type 2 diabetes mellitus patients concurrent with amnestic mild cognitive impairment. Curr Alzheimer Res. (2017) 14:1238–46. doi: 10.2174/1567205014666170417113441
39. Li, C, Zuo, Z, Liu, D, Jiang, R, Li, Y, Li, H, et al. Type 2 diabetes mellitus may exacerbate gray matter atrophy in patients with early-onset mild cognitive impairment. Front Neurosci. (2020) 14:856. doi: 10.3389/fnins.2020.00856
40. Xiong, Y, Chen, X, Zhao, X, Fan, Y, Zhang, Q, and Zhu, W. Altered regional homogeneity and functional brain networks in type 2 diabetes with and without mild cognitive impairment. Sci Rep. (2020) 10:21254. doi: 10.1038/s41598-020-76495-3
41. Wu, J, Fang, Y, Tan, X, Kang, S, Yue, X, Rao, Y, et al. Detecting type 2 diabetes mellitus cognitive impairment using whole-brain functional connectivity. Sci Rep. (2023) 13:3940. doi: 10.1038/s41598-023-28163-5
42. Zhou, B, Wang, X, Yang, Q, Wu, F, Tang, L, Wang, J, et al. Topological alterations of the brain functional network in type 2 diabetes mellitus patients with and without mild cognitive impairment. Front Aging Neurosci. (2022) 14:834319. doi: 10.3389/fnagi.2022.834319
43. Wang, M, Zhang, D, Gao, J, Qi, F, Su, Y, Lei, Y, et al. Abnormal functional connectivity in the right dorsal anterior insula associated with cognitive dysfunction in patients with type 2 diabetes mellitus. Brain Behav. (2022) 12:e2553. doi: 10.1002/brb3.2553
44. Hu, B, Yan, LF, Sun, Q, Yu, Y, Zhang, J, Dai, YJ, et al. Disturbed neurovascular coupling in type 2 diabetes mellitus patients: evidence from a comprehensive fMRI analysis. Neuroimage Clin. (2019) 22:101802. doi: 10.1016/j.nicl.2019.101802
Keywords: diabetes mellitus, bibliometrics, VOSviewer, CiteSpace, functional magnetic resonance imaging
Citation: Sun Z, Li Y, Qu X, Wang L, Zhu S, Sun X, Yang L and Sun X (2025) Research trend of functional magnetic resonance imaging in diabetes mellitus research: a visualization and bibliometric analysis. Front. Neurol. 16:1539995. doi: 10.3389/fneur.2025.1539995
Edited by:
Jan Kassubek, University of Ulm, GermanyReviewed by:
Xufeng Yao, Shanghai University of Medicine and Health Sciences, ChinaJohn Coetzee, Stanford University, United States
Copyright © 2025 Sun, Li, Qu, Wang, Zhu, Sun, Yang and Sun. This is an open-access article distributed under the terms of the Creative Commons Attribution License (CC BY). The use, distribution or reproduction in other forums is permitted, provided the original author(s) and the copyright owner(s) are credited and that the original publication in this journal is cited, in accordance with accepted academic practice. No use, distribution or reproduction is permitted which does not comply with these terms.
*Correspondence: Li Yang, WWFuZ0xpMDcxNjIwMjFAMTYzLmNvbQ== Xiaonan Sun, c3huY2d6QDE2My5jb20=
†These authors have contributed equally to this work and share first authorship