Abstract
Background:
Stroke is a leading global health challenge, significantly burdening individuals and healthcare systems. The Cardiometabolic Index (CMI), a novel metric combining triglycerides, HDL cholesterol, and waist-to-height ratio, has shown promise in predicting metabolic diseases but its relationship with stroke risk is underexplored.
Methods:
This study analyzed data from 9,079 participants in the China Health and Retirement Longitudinal Study (CHARLS). Participants were stratified by CMI quintiles with the following ranges: Q1 (0.074–0.602), Q2 (0.602–0.935), Q3 (0.935–1.402), Q4 (1.402–2.327), and Q5 (2.327–74.326). Stroke incidence over a 7.8-year follow-up period was assessed. Cox proportional hazard models and restricted cubic spline regression were used to evaluate the association between baseline CMI and stroke risk, adjusting for confounders.
Results:
Higher CMI levels were significantly associated with increased stroke risk, with a 21% higher risk per 1-unit increase in CMI after adjustment (HR: 1.21, 95% CI: 1.11–1.32). Stroke incidence showed a dose–response relationship, particularly above a CMI threshold of 1.6.
Conclusion:
Elevated CMI is a strong independent predictor of stroke risk, highlighting its potential as a clinical tool for early risk stratification and prevention. Further large-scale studies are needed to validate its utility.
Introduction
Stroke is a major public health issue worldwide, with over 100 million cases and 6.5 million related deaths annually. The high rates of stroke-related disability, including motor impairment, cognitive decline, and death, place a considerable burden on individuals and health systems (1). Given the multifactorial nature of stroke, early identification and management of individuals at risk are essential for effective stroke prevention and improving patient outcomes. Obesity, hypertension, diabetes, and hyperlipidemia are modifiable risk factors that, if managed early, can prevent or delay the onset of stroke (2–4). However, translating this knowledge into practical prevention strategies remains a significant challenge. Therefore, further research into stroke risk factors and the development of effective diagnostic tools is critical to reducing the global stroke burden (5).
The cardiometabolic index (CMI) is a novel metabolism-related index, calculated as the ratio of triglycerides (TG) to high-density lipoprotein cholesterol (HDL-C) multiplied by the waist-to-height ratio (WHtR) (6, 7). Initially developed as a predictor for diabetes risk, the CMI has garnered attention for its association with a variety of health conditions, including cardiovascular disease (CVD), chronic kidney disease (CKD), non-alcoholic fatty liver disease (NAFLD), and metabolic syndrome (MetS) (7–12). Given its strong predictive value for various diseases, further investigation into the CMI’s prognostic capabilities is warranted. Currently, there is a lack of literature documenting the association between CMI and stroke risk. Therefore, our study aimed to evaluate the association of CMI with stroke, utilizing data from the China Health and Retirement Longitudinal Study (CHARLS).
Methods
Study populations
CHARLS is an ongoing national cohort investigation designed to assess the social, economic, and health status of individuals aged 45 and older in China (13, 14). The baseline survey, which began in 2011, initially included 17,705 participants from 10,257 households, drawn from 150 counties across 28 provinces. In addition to comprehensive sociodemographic data, the survey also collects biomedical measurements, health status, and functional ability information through standardized questionnaires and physical exams. CHARLS has been conducted in five waves, spanning from 2011 to 2020. The study has been approved by the Biomedical Ethics Review Board of Peking University (IRB00001052-11015), and all participants provided written informed consent before their inclusion in the research.
A total of 17,705 individuals who provided blood information in the CHARLS database 2011 baseline survey were chosen as potential study participants. Criteria for exclusion from the participant pool included individuals who suffered a stroke at baseline, with follow-up intervals shorter than 2 years, incomplete stroke data, those under the age of 45, missing baseline data for HDL-C or TG, and WHtR. Finally, 9,079 participants were enrolled, who were divided into four subgroups based on the quintiles of the CMI at baseline. The methodology and flow of participants through the study are depicted in Figure 1. This investigation corresponds to the Strengthening the Reporting of Observational Studies in Epidemiology (STROBE) publishing standards of cohort research.
Figure 1

Flowchart of the study population. The CMI was categorized into five quintiles with the following ranges: Q1 (0.074–0.602), Q2 (0.602–0.935), Q3 (0.935–1.402), Q4 (1.402–2.327), and Q5 (2.327–74.326).
Data collection
Trained interviewers used standardized questionnaires to collect participants’ information on demographic and health-related data, while healthcare professionals conducted body measurements and laboratory tests. Data collection involved gathering a wide range of information from participants, including (1) demographic characteristics such as age, sex, height, weight, systolic and diastolic blood pressure (SBP and DBP), education level, and marital status; (2) cerebrovascular risk factors including smoking status, alcohol consumption, hypertension, diabetes mellitus and other chronic diseases; and (3) laboratory measurements like fasting blood glucose (FBG), total cholesterol (TC), TG, HDL-C, and low-density lipoprotein cholesterol (LDL-C).
Stroke diagnosis
Stroke incidence data were systematically collected throughout the follow-up period using a structured self-reported questionnaire. The questionnaire asked participants about three key aspects: (1) Were you informed of a stroke diagnosis by a medical professional? (2) When did you initially receive or become aware of the diagnosis? (3) Do you have any therapy for your stroke at this time? Affirmative responses in subsequent follow-ups were considered as initial stroke diagnoses, with the reported date marking the onset of the condition.
To determine the timing of stroke occurrence, the interval between the reported stroke onset and the baseline assessment was calculated. For individuals who did not report a stroke during the follow-up period, the duration of their follow-up was determined by calculating the gap between the baseline evaluation and their last survey date.
Statistical analysis
For continuous quantitative data, if the data follow a normal distribution, they are described as mean ± standard deviation, and comparisons among multiple groups are performed using one-way analysis of variance (ANOVA). If the data do not follow a normal distribution, they are presented as the median [P25, P75], and inter-group comparisons are conducted using the rank-sum test. For categorical data, they are described as frequencies (percentages), and comparisons between groups are performed using the chi-square test or Fisher’s exact test. We performed a logarithmic transformation of the CMI index and subsequently utilized the ‘rms’ package in R to construct restricted cubic spline plots to explore potential non-linear associations between the CMI index and stroke events. The median CMI index was used as the reference point, with covariates adjusted in the model. Overall association p-values and non-linearity p-values were calculated. Additionally, univariate and multivariate Cox regression analyses were conducted to investigate the relationship between CMI and stroke risk, and the hazard ratio (HR) and 95% confidence interval (CI) were determined. In these analyses, the CMI index was included both as a continuous variable and as a categorical variable grouped by quintiles with the following ranges: Q1 (0.074–0.602), Q2 (0.602–0.935), Q3 (0.935–1.402), Q4 (1.402–2.327), and Q5 (2.327–74.326). The three models included Model 1 (not adjusted for covariables), Model 2 (adjusted for age and sex), and Model 3 (adjusted for age, sex, education level, economic status, smoking, alcohol consumption, residential region, hypertension, diabetes, heart disease, and kidney disease). Cox proportional hazard models were used to independently analyze subgroups based on age, sex, body mass index (BMI), residential region, diabetes, hypertension, and heart problems to stratify the data. Trend tests based on the median value of each quintile group were conducted. To examine whether the predictive effect of the CMI index on stroke events differed by sex, the above analyses were performed separately for male and female participants. All statistical analyses and visualizations were conducted in R (version 4.4.1), with a two-sided p-value < 0.05 considered statistically significant.
Results
Baseline patient characteristics
The baseline clinical and demographic characteristics of participants categorized by CMI quintile were presented in Table 1. The average age of participants at baseline was 59.60 ± 9.36 years, with 4,212 (46.4%) being males, and 4,867 (53.6%) being female. The median CMI was 1.78 ± 2.46. Compared to those in Q1, participants in other quintiles tended to be younger; female, urban residents; have fewer current smokers and alcohol consumers; have a higher incidence of hypertension, diabetes, and heart problems; have higher waist circumference, triglycerides; and have lower HDL-C (Table 1).
Table 1
| Characteristics | Total (n = 9,079) |
Quintile 1 (n = 1816) |
Quintile 2 (n = 1811) |
Quintile 3 (n = 1819) |
Quintile 4 (n = 1815) |
Quintile 5 (n = 1818) |
p-value |
|---|---|---|---|---|---|---|---|
| Age (years) | 59.60 ± 9.36 | 60.15 ± 9.74 | 59.70 ± 9.49 | 59.86 ± 9.32 | 59.30 ± 9.10 | 58.97 ± 9.10 | 0.001 |
| Height (cm) | 157.87 ± 8.55 | 158.33 ± 8.55 | 157.54 ± 8.42 | 157.72 ± 8.74 | 157.75 ± 8.58 | 158.01 ± 8.48 | 0.051 |
| Waist circumference (cm) | 85.28 ± 10.11 | 78.57 ± 7.91 | 82.17 ± 8.55 | 85.32 ± 9.39 | 88.37 ± 9.41 | 91.96 ± 9.47 | <0.001 |
| Triglycerides (mg/dL) | 131.03 ± 92.52 | 59.92 ± 14.57 | 83.06 ± 17.63 | 107.50 ± 23.20 | 142.12 ± 30.99 | 262.32 ± 124.40 | <0.001 |
| HDL-C (mg/dL) | 51.23 ± 15.08 | 68.44 ± 13.79 | 56.85 ± 10.83 | 50.57 ± 9.51 | 44.49 ± 8.00 | 35.83 ± 8.00 | <0.001 |
| CMI, Mean ± SD | 1.78 ± 2.46 | 0.44 ± 0.11 | 0.76 ± 0.09 | 1.15 ± 0.13 | 1.79 ± 0.26 | 4.74 ± 4.25 | <0.001 |
| Gender, n (%) | <0.001 | ||||||
| Male | 4,212 (46.4) | 1,030 (56.7) | 856 (47.3) | 841 (46.2) | 732 (40.3) | 753 (41.4) | |
| Female | 4,867 (53.6) | 786 (43.3) | 955 (52.7) | 978 (53.8) | 1,083 (59.7) | 1,065 (58.6) | |
| Smoke, n (%) | <0.001 | ||||||
| Never | 5,518 (60.8) | 987 (54.4) | 1,068 (59.0) | 1,109 (61.0) | 1,203 (66.3) | 1,151 (63.3) | |
| Former | 817 (9.0) | 171 (9.4) | 155 (8.6) | 160 (8.8) | 139 (7.7) | 192 (10.6) | |
| Current | 2,744 (30.2) | 658 (36.2) | 588 (32.5) | 550 (30.2) | 473 (26.1) | 475 (26.1) | |
| Drinking, n (%) | <0.001 | ||||||
| Never | 6,223 (68.5) | 1,124 (61.9) | 1,242 (68.6) | 1,261 (69.3) | 1,306 (72.0) | 1,290 (71.0) | |
| Seldom | 1,002 (11.0) | 219 (12.1) | 206 (11.4) | 205 (11.3) | 191 (10.5) | 181 (10.0) | |
| Regular | 1854 (20.4) | 473 (26.0) | 363 (20.0) | 353 (19.4) | 318 (17.5) | 347 (19.1) | |
| Educational, n (%) | 0.131 | ||||||
| Illiteracy | 4,336 (47.8) | 883 (48.6) | 874 (48.3) | 871 (47.9) | 881 (48.5) | 827 (45.5) | |
| Primary school | 2076 (22.9) | 426 (23.5) | 424 (23.4) | 427 (23.5) | 390 (21.5) | 409 (22.5) | |
| Middle school | 1786 (19.7) | 348 (19.2) | 343 (18.9) | 328 (18.0) | 377 (20.8) | 390 (21.5) | |
| High school or above | 881 (9.7) | 159 (8.8) | 170 (9.4) | 193 (10.6) | 167 (9.2) | 192 (10.6) | |
| Marital status, n (%) | 0.066 | ||||||
| Married | 7,936 (87.4) | 1,587 (87.4) | 1,572 (86.8) | 1,583 (87.0) | 1,574 (86.7) | 1,620 (89.1) | |
| Separated | 1,080 (11.9) | 208 (11.5) | 227 (12.5) | 227 (12.5) | 231 (12.7) | 187 (10.3) | |
| Never married | 63 (0.7) | 21 (1.2) | 12 (0.7) | 9 (0.5) | 10 (0.6) | 11 (0.6) | |
| Area Type, n (%) | <0.001 | ||||||
| Rural | 5,961 (65.7) | 1,340 (73.8) | 1,249 (69.0) | 1,194 (65.6) | 1,126 (62.0) | 1,052 (57.9) | |
| Urban | 3,118 (34.3) | 476 (26.2) | 562 (31.0) | 625 (34.4) | 689 (38.0) | 766 (42.1) | |
| Hypertension, n (%) | <0.001 | ||||||
| No | 5,386 (59.3) | 1,269 (69.9) | 1,216 (67.1) | 1,099 (60.4) | 951 (52.4) | 851 (46.8) | |
| Yes | 3,693 (40.7) | 547 (30.1) | 595 (32.9) | 720 (39.6) | 864 (47.6) | 967 (53.2) | |
| Diabetes, n (%) | <0.001 | ||||||
| No | 7,557 (83.2) | 1,649 (90.8) | 1,611 (89.0) | 1,561 (85.8) | 1,491 (82.1) | 1,245 (68.5) | |
| Yes | 1,522 (16.8) | 167 (9.2) | 200 (11.0) | 258 (14.2) | 324 (17.9) | 573 (31.5) | |
| Heart problems, n (%) | <0.001 | ||||||
| No | 8,025 (88.4) | 1,649 (90.8) | 1,636 (90.3) | 1,602 (88.1) | 1,601 (88.2) | 1,537 (84.5) | |
| Yes | 1,054 (11.6) | 167 (9.2) | 175 (9.7) | 217 (11.9) | 214 (11.8) | 281 (15.5) | |
| Kidney Disease, n (%) | 0.285 | ||||||
| No | 8,481 (93.4) | 1,682 (92.6) | 1,685 (93.0) | 1,697 (93.3) | 1703 (93.8) | 1714 (94.3) | |
| Yes | 598 (6.6) | 134 (7.4) | 126 (7.0) | 122 (6.7) | 112 (6.2) | 104 (5.7) |
The baseline characteristics of participants categorized by CMI quintile.
CMI, cardiometabolic index; HDL-C, high-density lipoprotein cholesterol. The CMI was categorized into five quintiles with the following ranges: Q1 (0.074–0.602), Q2 (0.602–0.935), Q3 (0.935–1.402), Q4 (1.402–2.327), and Q5 (2.327–74.326).
Associations between CMI and incident stroke
During an average follow-up period of 7.8 years, 858 (9.5%) participants experienced their first stroke. According to the CMI quintiles, the incidences of stroke for participants from Q1 to Q5, were 5.6, 8.7, 9.3, 11.6, and 11.4%, respectively. Analysis of the Kaplan–Meier cumulative incidence curve revealed a gradual increase in stroke events from the Q1 to Q5 groups in the overall population, with a statistically significant difference observed (Figure 2 log-rank test p < 0.001). The Cox proportional hazard models confirmed a significant relationship between baseline CMI levels and new-onset stroke. Baseline CMI was analyzed as both a continuous variable and a categorical variable (quintiles). Following adjustment for potential confounding factors, per 1-unit increase in baseline CMI was associated with a 21% higher risk of stroke in Model 3 (HR 1.21, 95% CI 1.11–1.32). Furthermore, the risk of stroke showed an increasing trend across quintiles of CMI in Model 3 (HR 1.58, 95% CI 1.23–2.03 for Q2; HR 1.67, 95% CI 1.31–2.14 for Q3; HR 1.96, 95% CI 1.54–2.49 for Q4; HR 1.76, 95% CI 1.38–2.25for Q5; P-trend <0.001, Table 2).
Figure 2
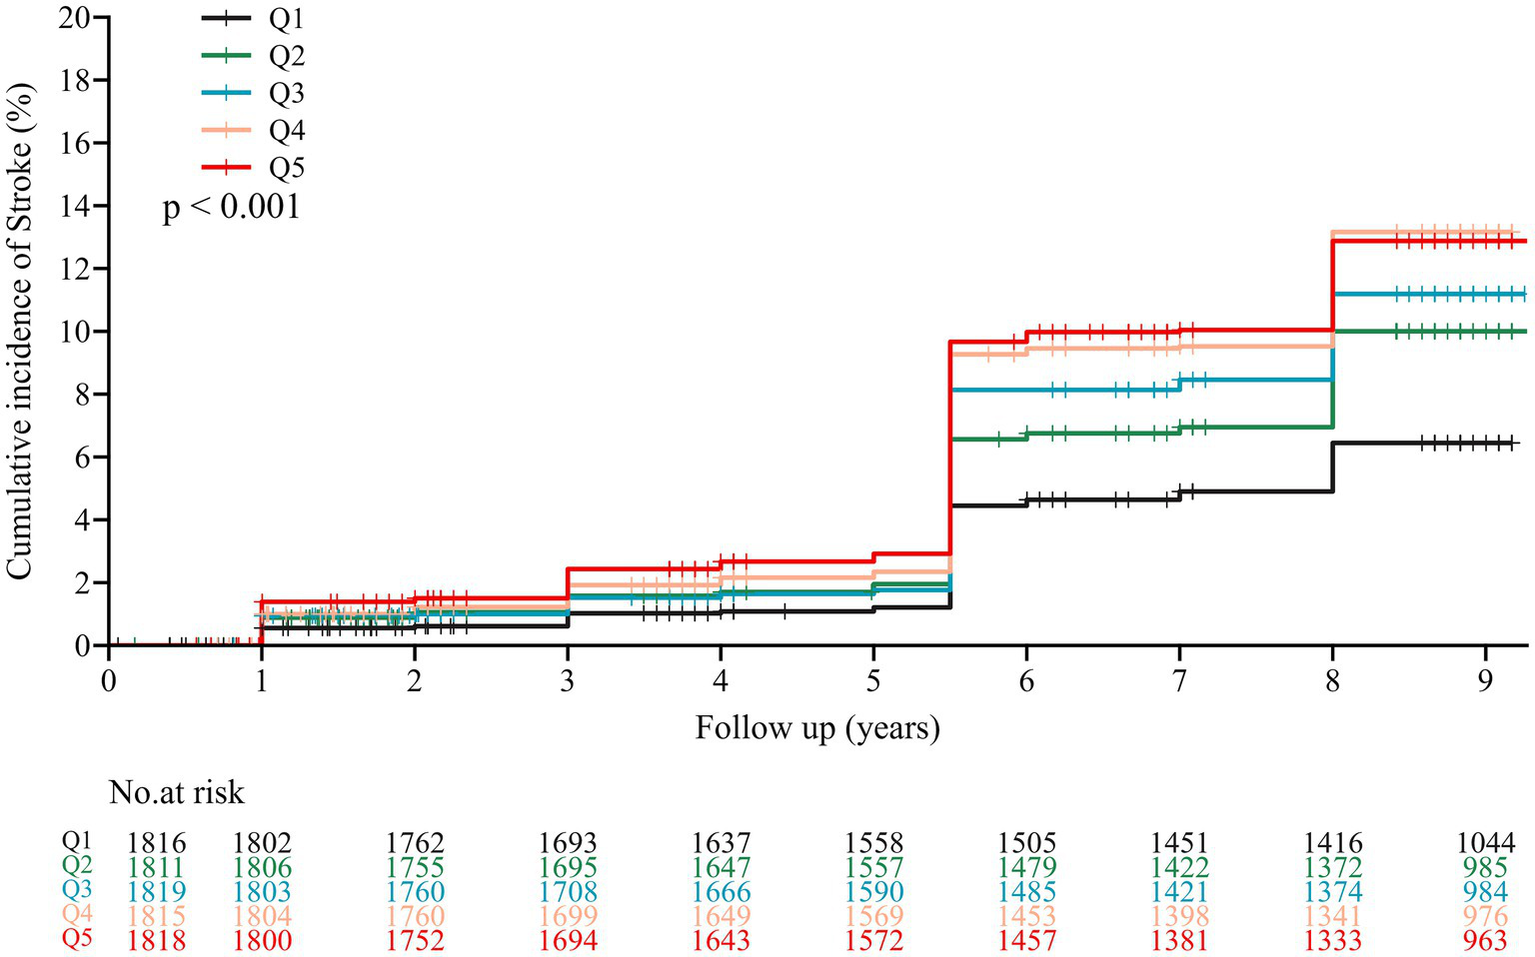
Kaplan–Meier survival curve for new-onset stroke of participants by CMI quintile. The CMI was categorized into five quintiles with the following ranges: Q1 (0.074–0.602), Q2 (0.602–0.935), Q3 (0.935–1.402), Q4 (1.402–2.327), and Q5 (2.327–74.326).
Table 2
| Categories | Event, n (%) | HR (95%CI) | ||
|---|---|---|---|---|
| Model 1 | Model 2 | Model 3 | ||
| Per-unit increase | 858/9079 (9.5%) | 1.31 (1.21 to 1.41) < 0.001 | 1.34 (1.24 to 1.45) < 0.001 | 1.21 (1.11 to 1.32) < 0.001 |
| CMI quintile | ||||
| Q1 | 102/1816 (5.6%) | Ref. | Ref. | Ref. |
| Q2 | 158/1811 (8.7%) | 1.57 (1.23 to 2.02) | 1.62 (1.26 to 2.08) | 1.58 (1.23 to 2.03) |
| Q3 | 180/1819 (9.9%) | 1.78 (1.39 to 2.26) | 1.84 (1.44 to 2.34) | 1.67 (1.31 to 2.14) |
| Q4 | 210/1815 (11.6%) | 2.11 (1.66 to 2.67) | 2.23 (1.76 to 2.83) | 1.96 (1.54 to 2.49) |
| Q5 | 208/1818 (11.4%) | 2.09 (1.65 to 2.65) | 2.23 (1.76 to 2.83) | 1.76 (1.38 to 2.25) |
| P for trend | <0.001 | <0.001 | <0.001 | |
The HR (95% CI) of stroke according to CMI in the three models.
Model 1: unadjusted. Model 2: adjusted for age and gender. Model 3: adjusted for age, sex, education level, economic status, smoking, alcohol consumption, residential region. The CMI was categorized into five quintiles with the following ranges: Q1 (0.074–0.602), Q2 (0.602–0.935), Q3 (0.935–1.402), Q4 (1.402–2.327), and Q5 (2.327–74.326).
The restricted cubic spline regression analysis showed a dose–response relationship between the cumulative CMI and the risk of stroke occurrence (Figure 3). A linear correlation between the cumulative CMI and the risk of stroke occurrence in males, females, and the overall population (all P for overall trend < 0.01) was observed. The risk of stroke increased for individuals, with a cut-off cumulative CMI of 1.6 (HR: 1.27, 95% CI: 1.16–1.39).
Figure 3

Results of RCS regression. (A) RCS results for the stroke. (B) RCS results for stroke in females. (C) RCS results for stroke in males. CI, Confidence interval. RCS, restricted cubic spline.
Subgroup analysis
To further explore the association between baseline CMI and the first stroke event, we performed a subgroup analysis stratified by potential risk factors. As shown in Figure 4, elevated CMI levels were associated with a higher incidence of stroke, which was consistent across different subgroups including age, gender, residence, and hypertension. Among individuals with BMI < 24, without a history of diabetes or heart problems, increased CMI levels were linked to a higher stroke risk. No interaction was observed between the changes in the CMI and subgroup variables (all p-values > 0.05).
Figure 4

Subgroup and interaction analyses of the cumulative CMI and stroke incidence across various subgroups.
Discussion
In this study, we examined the association between CMI and the risk of stroke by analyzing data from 9,079 participants from the CHARLS data. We found a significant correlation between CMI and stroke, regardless of whether CMI was assessed as a continuous or categorical variable. After accounting for several confounding factors, the results confirmed that elevated CMI values are independently associated with an increased risk of stroke. Notably, RCS analysis revealed a non-linear positive correlation between CMI and stroke prevalence, identifying a critical point at CMI = 1.6 through a threshold saturation effect. An increase in CMI within a certain range was linked to an increase in the occurrence of stroke. Subgroup analysis further showed that this correlation remained stable across various populations. These results suggest that within a specific range, CMI may be a risk factor against stroke and further research on CMI could aid in the assessment and prevention of stroke.
Cardiometabolic Index, an innovative anthropometric index, was first introduced by Wakabayashi and Daimon (15) as a tool to identify diabetes mellitus (DM) and has received growing attention since then. CMI primarily combines multiple metabolic health indicators such as body weight, blood lipids, and blood glucose to reflect an individual’s cardiovascular metabolic status (6). This index can be calculated using various methods, but the factors typically considered include: BMI, HDL-C, LDL-C, TG, blood glucose, and blood pressure. The core concept of CMI is that a single risk factor may not fully reflect an individual’s metabolic health while integrating multiple metabolic indicators can provide a more accurate assessment of cardiovascular health risks. An increase in CMI may reflect the cumulative effects of multiple metabolic abnormalities. Metabolic syndrome is one of the major risk factors for cardiovascular diseases and stroke. Abnormalities in blood pressure, blood glucose, and lipid metabolism not only increase the risk of heart disease but are also closely associated with the occurrence of stroke (16). Compared with other anthropometric and metabolic indices such as the triglyceride-glucose (TyG) index, WHtR, and atherogenic index of plasma (AIP), CMI offers distinct advantages by providing a more comprehensive assessment of cardiometabolic risk (7, 17, 18). CMI’s multidimensional nature makes it particularly useful for evaluating complex conditions such as metabolic syndrome, as it combines information on visceral fat and metabolic status for a more holistic risk stratification (7).
Previous studies have found that CMI is associated with several risk factors for stroke. For example, a close association between CMI and hypertension, diabetes mellitus, dyslipidemia, and metabolic syndrome (6, 19–21). Subsequent research further explored the association between metabolic disorders and other disease (22–27). While CMI’s predictive power is widely acknowledged, more large-scale, longitudinal cohort studies are needed to validate its applicability across diverse populations and refine its clinical thresholds for risk stratification. Data are still limited, however, on the relationship between CMI and stroke risk. A cross-sectional study revealed a positive association between CMI and stroke in the general population (28). These findings align with our results. This study, based on data from the CHARLS cohort, found a significant positive and robust correlation between CMI levels and the occurrence of stroke, with subgroup analysis yielding similar results. We also found that a higher CMI was associated with an increased risk of stroke, highlighting the importance of cardiovascular metabolic health in stroke risk assessment.
Elevated CMI reflects an interconnected network of pathophysiological mechanisms, including visceral fat accumulation, pro-inflammatory cytokine release, endothelial dysfunction, and impaired glucose and lipid metabolism. Firstly, an elevated CMI indicates an increase in visceral fat, which leads to chronic systemic inflammation (29). Several signaling pathways have been implicated in the inflammatory processes associated with elevated CMI. These include the NADPH oxidase pathway, NF-κB signaling, and T- and B-cell receptor pathways, which regulate immune cell recruitment and inflammatory responses. These pathways amplify systemic inflammation, induce endothelial dysfunction, and promote the progression of cerebrovascular diseases (30, 31). Chronic low-grade inflammation driven by elevated CMI extends its effects beyond metabolic and cardiovascular systems. It disrupts the blood–brain barrier, allowing harmful substances such as lipids and inflammatory mediators to penetrate cerebral vessels (32). Furthermore, an elevated CMI reflects the worsening of insulin resistance and lipid metabolism abnormalities, which lead to the accumulation of lipids on vascular walls, promoting atherosclerosis, vascular remodeling, and ultimately contributing to the development of hypertension (33). This increases the risk of neurovascular complications, including stroke. The role of CMI in amplifying chronic low-grade inflammation and exacerbating insulin resistance underscores its utility in identifying individuals at high risk for stroke.
Strengths and limitations
The present study has several strengths. First, this study is a prospective cohort study, utilizing the large and representative CHARLS database. Second, the study adjusted for potential confounders and performed subgroup analyses to examine the robustness of the relationship between CMI levels and the risk of stroke in different populations. Despite this, the present study still has some limitations. First, this was an observational study. It established the associations between CMI and stroke without establishing a causative relationship. Second, although multiple confounders were considered, we could not account for all potential confounders and biases. Given that classifying stroke into subtypes could further reduce the incidence of endpoint events, we did not analyze the results based on different types of stroke. Third, the sample selected may not be fully representative of more diverse regions and populations, which may affect the generalizability of the findings. Further large-scale prospective studies and intervention trials in other countries and regions are needed.
Conclusion
In this national prospective longitudinal study, we found a significant positive association between CMI and the risk of stroke. This suggests that CMI could serve as a promising index for improving the risk estimate of stroke in clinical practice. High CMI warranted greater attention for early risk stratification and intervention strategies in individuals at risk. Larger-scale cohort studies are needed to further validate the findings of this research.
Statements
Data availability statement
The raw data supporting the conclusions of this article will be made available by the authors, without undue reservation.
Ethics statement
The study has been approved by the Biomedical Ethics Review Board of Peking University (IRB00001052-11015). The studies were conducted in accordance with the local legislation and institutional requirements. The participants provided their written informed consent to participate in this study.
Author contributions
TL: Writing – original draft. CX: Writing – review & editing. HC: Writing – review & editing. FC: Writing – review & editing. BF: Writing – review & editing. XT: Writing – review & editing. YZ: Writing – review & editing.
Funding
The author(s) declare that no financial support was received for the research and/or publication of this article.
Acknowledgments
We express our sincere gratitude to the CHARLS research team for providing us with high-quality data. We also thank all CHARLS participants for their selfless contributions. All tables and figures are of original design.
Conflict of interest
The authors declare that the research was conducted in the absence of any commercial or financial relationships that could be construed as a potential conflict of interest.
Generative AI statement
The author(s) declare that no Gen AI was used in the creation of this manuscript.
Publisher’s note
All claims expressed in this article are solely those of the authors and do not necessarily represent those of their affiliated organizations, or those of the publisher, the editors and the reviewers. Any product that may be evaluated in this article, or claim that may be made by its manufacturer, is not guaranteed or endorsed by the publisher.
- AIP
Atherogenic Index of Plasma
- ANOVA
Analysis of Variance
- BMI
Body Mass Index
- CAD
Coronary Artery Disease
- CHARLS
China Health and Retirement Longitudinal Study
- CI
Confidence Interval
- CKD
Chronic Kidney Disease
- CMI
Cardiometabolic Index
- CVD
Cardiovascular Disease
- DBP
Diastolic Blood Pressure
- DM
Diabetes Mellitus
- FBG
Fasting Blood Glucose
- HDL-C
High-Density Lipoprotein Cholesterol
- HR
Hazard Ratio
- LDL-C
Low-Density Lipoprotein Cholesterol
- MetS
Metabolic Syndrome
- NAFLD
Non-Alcoholic Fatty Liver Disease
- NF-κB
Nuclear Factor Kappa-Light-Chain-Enhancer of Activated B Cells
- RCS
Restricted Cubic Spline
- SBP
Systolic Blood Pressure
- SD
Standard Deviation
- STROBE
Strengthening the Reporting of Observational Studies in Epidemiology
- TC
Total Cholesterol
- TG
Triglycerides
- TyG
Triglyceride-Glucose Index
- WC
Waist Circumference
- WHtR
Waist-to-Height Ratio
Glossary
References
1.
Thayabaranathan T Kim J Cadilhac DA Thrift AG Donnan GA Howard G et al . Global stroke statistics 2022. Int J Stroke. (2022) 17:946–56. doi: 10.1177/17474930221123175
2.
Mosenzon O Cheng AY Rabinstein AA Sacco S . Diabetes and stroke: what are the connections?J Stroke. (2023) 25:26–38. doi: 10.5853/jos.2022.02306
3.
Alloubani A Saleh A Abdelhafiz I . Hypertension and diabetes mellitus as a predictive risk factors for stroke. Diabetes Metab Syndr Clin Res Rev. (2018) 12:577–84. doi: 10.1016/j.dsx.2018.03.009
4.
Alloubani A Nimer R Samara R . Relationship between hyperlipidemia, cardiovascular disease and stroke: a systematic review. CCR. (2021) 17:e051121189015. doi: 10.2174/1573403X16999201210200342
5.
Pandian JD Gall SL Kate MP Silva GS Akinyemi RO Ovbiagele BI et al . Prevention of stroke: a global perspective. Lancet. (2018) 392:1269–78. doi: 10.1016/S0140-6736(18)31269-8
6.
Lazzer S D’Alleva M Isola M De Martino M Caroli D Bondesan A et al . Cardiometabolic index (CMI) and visceral adiposity index (VAI) highlight a higher risk of metabolic syndrome in women with severe obesity. JCM. (2023) 12:3055. doi: 10.3390/jcm12093055
7.
Liu X Wu Q Yan G Duan J Chen Z Yang P et al . Cardiometabolic index: a new tool for screening the metabolically obese normal weight phenotype. J Endocrinol Investig. (2021) 44:1253–61. doi: 10.1007/s40618-020-01417-z
8.
Cai X Hu J Wen W Wang J Wang M Liu S et al . Associations of the Cardiometabolic index with the risk of cardiovascular disease in patients with hypertension and obstructive sleep apnea: results of a longitudinal cohort study. Oxidative Med Cell Longev. (2022) 2022:1–15. doi: 10.1155/2022/4914791
9.
Zou J Xiong H Zhang H Hu C Lu S Zou Y . Association between the cardiometabolic index and non-alcoholic fatty liver disease: insights from a general population. BMC Gastroenterol. (2022) 22:20. doi: 10.1186/s12876-022-02099-y
10.
Barrea L Muscogiuri G Modica R Altieri B Pugliese G Minotta R et al . Cardio-metabolic indices and metabolic syndrome as predictors of clinical severity of Gastroenteropancreatic neuroendocrine tumors. Front Endocrinol. (2021) 12:649496. doi: 10.3389/fendo.2021.649496
11.
Guo Q Wang Y Liu Y Wang Y Deng L Liao L et al . Association between the cardiometabolic index and chronic kidney disease: a cross-sectional study. Int Urol Nephrol. (2023) 56:1733–41. doi: 10.1007/s11255-023-03888-4
12.
Luo X Cai B . Association between cardiometabolic index and congestive heart failure among US adults: a cross-sectional study. Front Cardiovasc Med. (2024) 11:1433950. doi: 10.3389/fcvm.2024.1433950
13.
Zhao Y Hu Y Smith JP Strauss J Yang G . Cohort profile: the China health and retirement longitudinal study (CHARLS). Int J Epidemiol. (2014) 43:61–8. doi: 10.1093/ije/dys203
14.
Chen X Wang Y Strauss J Zhao Y . China health and retirement longitudinal study (CHARLS) In: GuDDupreME, editors. Encyclopedia of gerontology and population aging. Cham: Springer International Publishing (2021). 948–56.
15.
Wakabayashi I Daimon T . The “cardiometabolic index” as a new marker determined by adiposity and blood lipids for discrimination of diabetes mellitus. Clin Chim Acta. (2015) 438:274–8. doi: 10.1016/j.cca.2014.08.042
16.
Huang H Liao D Dong Y Pu R . Effect of quercetin supplementation on plasma lipid profiles, blood pressure, and glucose levels: a systematic review and meta-analysis. Nutr Rev. (2020) 78:615–26. doi: 10.1093/nutrit/nuz071
17.
Khan SH Sobia F Niazi NK Manzoor SM Fazal N Ahmad F . Metabolic clustering of risk factors: evaluation of triglyceride-glucose index (TyG index) for evaluation of insulin resistance. Diabetol Metab Syndr. (2018) 10:74. doi: 10.1186/s13098-018-0376-8
18.
Tamini S Bondesan A Caroli D Sartorio A . The lipid accumulation product index (LAP) and the Cardiometabolic index (CMI) are useful for predicting the presence and severity of metabolic syndrome in adult patients with obesity. JCM. (2024) 13:2843. doi: 10.3390/jcm13102843
19.
Guo T Zhou Y Yang G Sheng L Chai X . Association between cardiometabolic index and hypertension among US adults from NHANES 2017–2020. Sci Rep. (2025) 15:4007. doi: 10.1038/s41598-025-87029-0
20.
Zuo Y-Q Gao Z-H Yin Y-L Yang X Feng P-Y . Association between the cardiometabolic index and hyperuricemia in an asymptomatic population with normal body mass index. IJGM. (2021) 14:8603–10. doi: 10.2147/IJGM.S340595
21.
Chen M Xiong S Zheng J Zhang J Ye D Xian Y et al . Association between cardiometabolic index and gestational diabetes mellitus: a cross-sectional study. Endocrine. (2024) 87:569–77. doi: 10.1007/s12020-024-04045-2
22.
Wang J Wang B Liu T Shang J Gu X Zhang T et al . Association between cardiometabolic index (CMI) and endometriosis: a cross-sectional study on NHANES. Lipids Health Dis. (2024) 23:328. doi: 10.1186/s12944-024-02314-7
23.
Li D Li J Li Y Dong W Lin Z . Association between the cardiometabolic index and osteoporosis: a cross-sectional study of the NHANES. Front Public Health. (2024) 12:1462169. doi: 10.3389/fpubh.2024.1462169
24.
Wang L Liu X Du Z Tian J Zhang L Yang L . Cardiometabolic index and chronic obstructive pulmonary disease: a population-based cross-sectional study. Heart Lung. (2024) 68:342–9. doi: 10.1016/j.hrtlng.2024.09.002
25.
Zhuo L Lai M Wan L Zhang X Chen R . Cardiometabolic index and the risk of new-onset chronic diseases: results of a national prospective longitudinal study. Front Endocrinol. (2024) 15:1446276. doi: 10.3389/fendo.2024.1446276
26.
Wu X Jin X Xu W She C Li L Mao Y . Cardiometabolic index is associated with increased bone mineral density: a population-based cross-sectional study. Front Public Health. (2024) 12:1403450. doi: 10.3389/fpubh.2024.1403450
27.
Miao M Deng X Wang Z Jiang D Lai S Yu S et al . Cardiometabolic index is associated with urinary albumin excretion and renal function in aged person over 60: data from NHANES 2011–2018. Int J Cardiol. (2023) 384:76–81. doi: 10.1016/j.ijcard.2023.04.017
28.
Li F-E Luo Y Zhang F-L Zhang P Liu D Ta S et al . Association between Cardiometabolic index and stroke: a population-based cross-sectional study. CNR. (2021) 18:324–32. doi: 10.2174/1567202618666211013123557
29.
Xu B Wu Q La R Lu L Abdu FA Yin G et al . Is systemic inflammation a missing link between cardiometabolic index with mortality? Evidence from a large population-based study (2024) 23:212. doi: 10.1186/s12933-024-02251-w
30.
Xu B Wu Q Yin G Lu L La R Zhang Y et al . Associations of cardiometabolic index with diabetic statuses and insulin resistance: the mediating role of inflammation-related indicators. BMC Public Health. (2024) 24:2736. doi: 10.1186/s12889-024-20048-0
31.
DeBerge M Chaudhary R Schroth S Thorp EB . Immunometabolism at the heart of cardiovascular disease. JACC. (2023) 8:884–904. doi: 10.1016/j.jacbts.2022.12.010
32.
Tuttolomondo A Daidone M Pinto A . Endothelial dysfunction and inflammation in ischemic stroke pathogenesis. CPD. (2020) 26:4209–19. doi: 10.2174/1381612826666200417154126
33.
Gaggini M Gorini F Vassalle C . Lipids in atherosclerosis: pathophysiology and the role of calculated lipid indices in assessing cardiovascular risk in patients with hyperlipidemia. IJMS. (2022) 24:75. doi: 10.3390/ijms24010075
Summary
Keywords
cardiometabolic index, stroke risk, longitudinal study, China Health and Retirement Longitudinal Study (CHARLS), prognostic marker
Citation
Liu T, Xu C, Chen H, Chen F, Feng B, Tao X and Zhou Y (2025) Association between cardiometabolic index and stroke risk: insights from the CHARLS cohort study. Front. Neurol. 16:1548977. doi: 10.3389/fneur.2025.1548977
Received
20 December 2024
Accepted
16 July 2025
Published
31 July 2025
Volume
16 - 2025
Edited by
Jean-Claude Baron, University of Cambridge, United Kingdom
Reviewed by
Nikoloz Tsiskaridze, Pineo Medical Ecosystem, Georgia
Byung-Su Kim, Ewha Womans University, Republic of Korea
Nicolas Padilla-Raygoza, Institute of Public Health of the State of Guanajuato (ISAPEG), Mexico
Updates
Copyright
© 2025 Liu, Xu, Chen, Chen, Feng, Tao and Zhou.
This is an open-access article distributed under the terms of the Creative Commons Attribution License (CC BY). The use, distribution or reproduction in other forums is permitted, provided the original author(s) and the copyright owner(s) are credited and that the original publication in this journal is cited, in accordance with accepted academic practice. No use, distribution or reproduction is permitted which does not comply with these terms.
*Correspondence: Yibo Zhou, jediskylt@163.com
Disclaimer
All claims expressed in this article are solely those of the authors and do not necessarily represent those of their affiliated organizations, or those of the publisher, the editors and the reviewers. Any product that may be evaluated in this article or claim that may be made by its manufacturer is not guaranteed or endorsed by the publisher.