Abstract
Introduction:
Self-limited epilepsy with centrotemporal spikes (SeLECTs) represents a common idiopathic focal epilepsy syndrome in childhood. Although most patients demonstrate a favorable prognosis, some patients develop ESES. ESES is associated with poorer neuropsychological prognosis. This association challenges the “benign” classification of SeLECTs. Currently, the diagnostic threshold for ESES remains controversial. Moreover, traditional long-term video-EEG monitoring presents certain limitations.
Methods:
The research utilizes the “Biovital-P1” software integrated with Oppo smart bands to collect multimodal physiological signals. Simultaneously, a 21-channel digital EEG system acquires electroencephalographic data. The study constructs brain networks through DTF analysis. Additionally, it performs preprocessing and feature extraction on multimodal physiological signals (ACC, EDA, PPG).
Results:
The results demonstrate strong functional connectivity in the centrotemporal region in all frequency bands and the delta band. However, as SWI levels increase, the brain network's global and local efficiency significantly reduces. Analyzing multimodal physiological signals reveals statistically significant differences in ACC and PPG signal time-domain features (Maximum, Minimum, Peak) among different SWI groups. Multiple characteristic parameters of EDA signals also show significant intergroup differences. Notably, EDA signals exhibit excellent sensitivity in reflecting stress responses of the autonomic nervous system. The characteristic features of EDA signals demonstrate a significant negative correlation with SWI levels.
1 Introduction
Self-limited epilepsy with centrotemporal spikes (SeLECTs) represents the most common idiopathic focal epilepsy syndrome in childhood (1). Traditionally, this condition, formerly known as “benign epilepsy with central temporal lobe spikes,” has been considered to have a favorable prognosis, with most patients in remission by the age of 16 (2). In epidemiologic surveys, SeLECTs is the most common form of self-limited focal epilepsy, accounting for 6–7% of all childhood epilepsies. Its incidence is about 6.1 cases per 100,000 children under 16 years of age per year (3). The most distinctive feature of SeLECTs is the presence of variable spike discharges in the Rolandic region during interictal periods. Notably, these discharges' quantity significantly correlates with disease severity (4). However, some patients develop electrical status epilepticus during sleep (ESES), which complicates the clinical picture. ESES is frequently associated with poorer neuropsychological prognosis, manifesting as significant cognitive deficits, intellectual decline, and behavioral problems (5). These associations challenge the traditional classification of SeLECTs as a “benign” condition.
ESES is characterized by generalized spike-and-wave complexes at 1.5–3.0 Hz during non-rapid eye movement (NREM) sleep, demonstrating continuous or near-continuous discharges (6, 7). The Spike and Wave Index (SWI) is a crucial diagnostic criterion for ESES. In 1971, Patry et al. (8) first identified ESES and established that a diagnosis requires three consecutive monthly recordings showing SWI between 85% and 100%. Subsequent studies have revealed that patients with SWI ranging from 50% to 65% exhibit relatively better performance in cognitive function tests. When SWI falls below 85%, the impact on cognitive impairment appears less significant. Currently, significant discrepancies exist among researchers regarding the diagnostic threshold for ESES. These differences reflect the complexity and diversity of ESES diagnosis. Different diagnostic thresholds may lead to substantially varied diagnoses for the same patient, potentially affecting treatment decisions and prognosis evaluation. Furthermore, this inconsistency presents considerable challenges for establishing unified diagnostic criteria through future research.
Clinical studies demonstrate that in SeLECTs, higher SWI values correlate with increased epileptic activity and more significant abnormalities in brain electrical activity, elevating the risk of neuropsychological complications (9). Patients with discharge indices ≥50% exhibit prolonged P300 latency, reduced amplitude, and lower cognitive test scores compared to those with lower discharge indices (10). These findings indicate intellectual impairment in SeLECTs patients, with the severity increasing with more frequent electroencephalogram(EEG) discharges. Correlation analysis confirms negative relationships between EEG discharge index and both P300 parameters and intelligence test scores.The most common cognitive deficits in children with SeLECTs are attention deficits (selective attention, impulse control) and language dysfunction (vocabulary extraction and comprehension), which are both directly related to active epileptic phases, and their early identification and targeted interventions can improve the long-term prognosis (11, 12). Therefore, traditional EEG alone cannot comprehensively assess patient conditions, necessitating additional cognitive function evaluations. Furthermore, the substantial workload associated with long-term video-EEG monitoring poses significant challenges for clinicians. This monitoring method requires considerable time and human resources while impacting patients' daily lives. Consequently, identifying a simplified and effective alternative approach has become crucial for clinical practice.
In summary, significant controversy remains regarding the diagnostic threshold of spike-wave index (SWI) in SeLECTS, and the mechanisms by which epileptiform discharges impair brain function are not yet fully understood. Conversely, traditional long-term video-EEG monitoring, though widely utilized, imposes several limitations with regard to accessibility, comfort, and continuous tracking in real-life settings.
The primary objective of this study is to investigate the intrinsic mechanisms of SWI-related brain function impairment in SeLECTS from a neurophysiological signal perspective, while also evaluating the potential of portable monitoring devices as a practical and non-invasive alternative to conventional EEG.To achieve this objective, we first collected electroencephalogram (EEG) and multimodal physiological data from 15 patients diagnosed with SeLECTS. The participants were stratified into three groups based on their SWI levels ( 50%−65%, 65%−80%, and >85%), with the objective of enabling a comprehensive examination of the differential impact of discharge burden on brain function. Subsequently, by comparing traditional electroencephalogram (EEG) monitoring with physiological signals acquired from portable devices, the feasibility and accuracy of wearable technologies in SeLECTS monitoring were assessed. Finally, we employed brain network analysis and multimodal feature extraction techniques to explore changes in brain functional connectivity and neurophysiological signals. As shown in Figure 1, the research framework comprises three main components: data collection and preprocessing, brain network construction and analysis, and multimodal physiological signal feature extraction with statistical analysis.
Figure 1

The flowchart comprises three distinct sections to systematically illustrate the methodology. The leftmost section delineates the instrumentation and raw data acquisition process. Subsequently, the central section elaborates on the signal extraction procedures for EEG, PPG, ACC, and EDA modalities. The concluding section presents the statistical analytical framework employed for result interpretation. EEG, Electroencephalogram; PPG, Photoplehysmography; ACC, Three-axis acceleration; EDA, Electrodermal activity.
2 Materials and methods
2.1 Patients
All patient data were collected from Anhui Provincial Children's Hospital, strictly adhering to medical ethics standards. Informed consent was obtained from all patients' guardians, and the study fully complied with institutional ethical regulations. Data were collected between 8 April 2021 and December 2023, encompassing 432 epilepsy patients aged 3–13 years, representing various epilepsy types. Each patient wore an Oppo smart band featuring “Biovital-P1” software for physiological signal acquisition. The device integrates a three-axis accelerometer and gyroscope for effective data collection. EEG signals were recorded using 32 electrodes positioned according to the 10–20 system (Fp1, Fp2, F3, F4, C3, C4, P3, P4, O1, O2, F7, F8, T3, T4, T5, T6, Fz, Cz, Pz, etc.). Linked mastoids (M1/M2) served as the online reference and AFz as the ground. ECG was monitored using chest electrodes, and two EMG channels (submental and tibialis anterior muscles) tracked muscle activity. Signals were sampled at 500 Hz (EEG), 200 Hz (ECG/EMG), and were bandpass-filtered (EEG: 0.1–70 Hz; ECG: 1–40 Hz; EMG: 10–200 Hz). EEG monitoring lasted 16 h, and sleep-wake phases were scored in 30-s cycles based on American Academy of Sleep Medicine (AASM) criteria. Total sleep time and wake duration were quantified from EEG/electroencephalography patterns. The recording protocol included both wakefulness and sleep states, with a minimum of 4 h dedicated to sleep state recording for the comprehensive capture of brain activity across different states. The following inclusion criteria were applied for SeLECTs patient selection:
-
The age range of SeLECTs patients was 6–13 years.
-
SWI exceeded 50%.
-
Patients had no history of stroke or neuropsychiatric disorders and had not taken antiepileptic drugs in the past three months.
-
Patients exhibited no motor dysfunction and had normal cognitive function before epilepsy onset.
Clinical EEG experts accurately marked seizure periods and SWI by visual inspection. SWI, defined as the percentage of spike-wave discharges per unit time, serves as a key indicator for assessing the severity of abnormal EEG discharges in SeLECTs patients. Research has demonstrated that SWI is closely associated with seizure frequency, cognitive impairment, and disease prognosis (13), with a higher SWI indicating more frequent abnormal discharges and the development of more severe neurological dysfunction (14). Grouping patients according to SWI therefore facilitates a deeper understanding of disease severity and its specific impacts on patients. Studies have shown that SeLECTs patients with SWI>50% often exhibit more significant cognitive impairment, while those with SWI >85% face a higher risk of seizures. Patients in this study were divided into three SWI interval groups: SWI 50%−65%(Group 1), SWI 65%−80% (Group 2), and SWI >85% (Group 3). Ultimately, five patients were in the SWI 50%−65% group, seven patients in the SWI 65%−80% group, and three patients in the SWI >85% group. This categorization facilitates a more detailed analysis of the correlation between abnormal discharge levels and physiological signals recorded by wristbands and provides more precise data for subsequent analyses. Detailed patient information is presented in Table 1.
Table 1
| Characteristic | Patients with SeLECTs | p-values |
|---|---|---|
| Demographics | ||
| Age(y) | 7.733 ± 1.279 | 0.632 |
| Sex(M/FM) | 7/8 | 0.523 |
| DI (Discharge index) | ||
| >50% | 15 | |
| 50%−65% | 5 | |
| 65%−80% | 7 | |
| 85%−100% | 3 | |
| History of epilepsy | ||
| Age at epilepsy onset(y) | 5.867 ± 1.798 | |
| Time to last seizure(m) | 0.516 ± 0.467 | |
| Types of antiepileptic drugs | 2 ± 1 | |
| Frequency of seizures at recording | 0.467 ± 0.483 | |
Demographics detailed information.
Figure 2 depicts the discharge patterns during non-rapid eye movement sleep across the three groups, illustrating distinct differences in their EEG activity. Group 3 exhibited greater EEG signal abnormalities than Group 1, where more stable patterns were observed. Figure 3 presents three types of physiological signals: accelerometer signals (ACC_X, ACC_Y, ACC_Z), electrodermal activity (EDA), and photoplethysmography (PPG). The figure demonstrates an overall increasing trend in the amplitude fluctuations of these physiological signals from Group 1 to Group 3. This pattern suggests that Group 3 patients may exhibit more active or unstable physiological states, while Group 1 patients maintain relatively stable physiological conditions. These differences may be related to the grouping criteria (e.g., SWI index) used in this study. Further analysis of the relationship between these physiological signals and clinical indicators could provide deeper insights into patients' disease severity and changes in their physiological state.
Figure 2
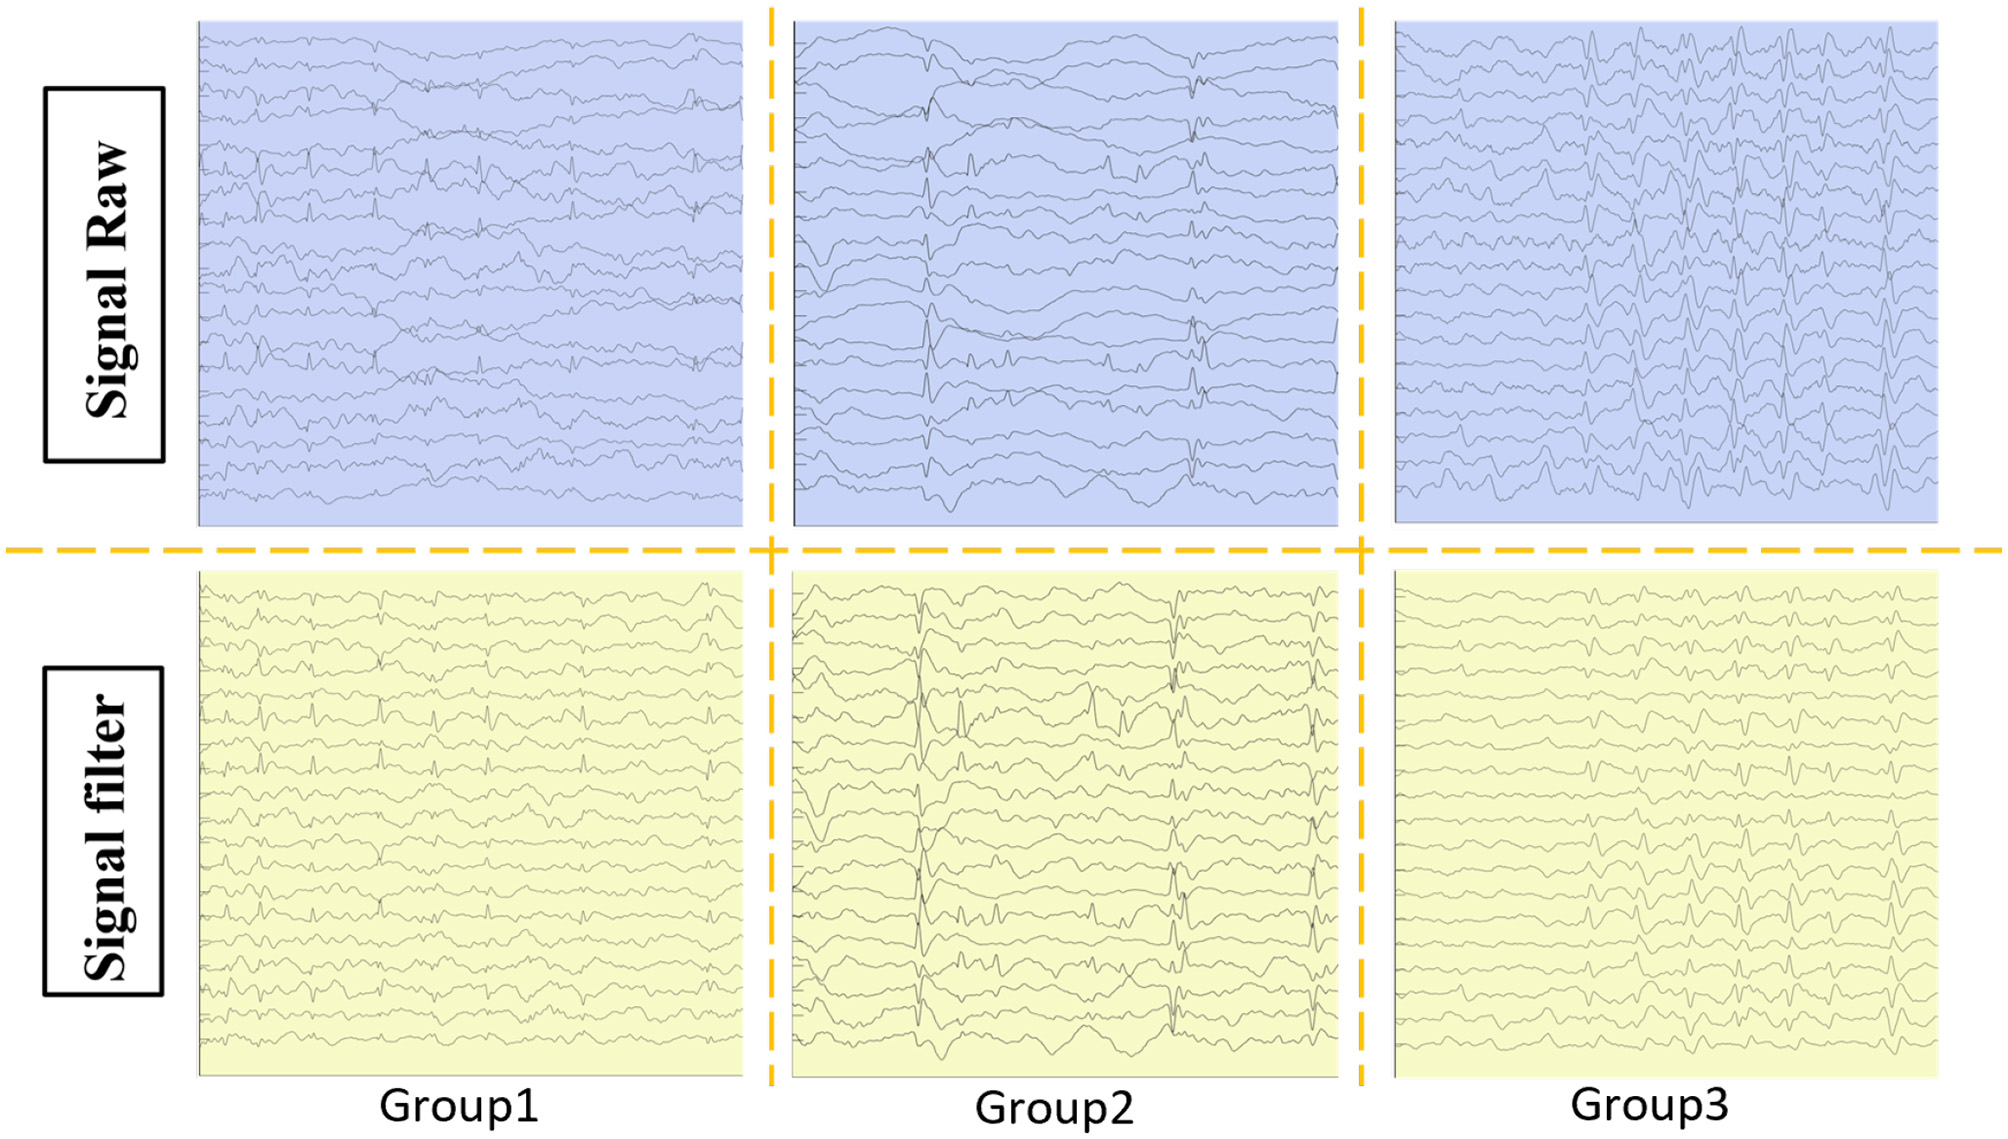
Patients were categorized into three groups based on SWI: group 1: %–65%, group 2: 65%–80%, and group 3: 85%–100%. The raw EEG data from the patients were extracted and filtered.
Figure 3

The filtered signals from the ACC, PPG, and EDA in the patient's portable wristband were extracted. PPG, Photoplehysmography; ACC, Three-axis acceleration; EDA, Electrodermal activity.
2.2 Data processing
2.2.1 EEG signal preprocessing and brain network construction
Traditional EEG analysis primarily focuses on changes in electrical activity in individual electrodes or localized brain regions, making it challenging to ascertain a comprehensive picture of the brain's functional state (15) comprehensively. Brain network analysis addresses this challenge by integrating multi-channel EEG signals to construct functional connectivity networks between different brain regions, clearly illustrating information transfer and interaction patterns across them. In SeLECTs patients, abnormal discharges affect local brain regions and may spread to other areas through brain network connections, subsequently exerting widespread impacts on cognitive functions comprehensively (16). Brain network analysis thus facilitates the direct observation of propagation pathways and the extent of abnormal discharges within the brain network, enabling accurate identification of key affected brain regions and their interrelationships.
Channel selection and signal filtering are crucial steps for preprocessing EEG signals. Earlobe electrodes A1 and A2 contribute minimally to the analysis of abnormal discharges in SeLECTs, brain functional network connectivity, and the investigation of cognitive impairment mechanisms. Therefore, their data were removed from the dataset to ensure the brain network analysis focused on core EEG information, improving analysis accuracy and specificity. During data cleaning, a 1–70 Hz filter was applied to prevent the masking of characteristic abnormal discharge signals in SeLECTs by high-frequency electromagnetic interference, ensuring these signals were more distinguishable. Given the prevalence of 50 Hz power-line interference in everyday environments and its significant impact on EEG signal acquisition, a 50 Hz notch filter was employed to eliminate this frequency interference, ensuring that the signals accurately reflected SeLECTs discharge patterns, providing reliable data for constructing brain networks. Additionally, EEG signal accuracy may be compromised by unconscious limb movements during sleep, which can generate motion artifacts. To mitigate this effect, a 500 μV threshold was set for the filtered data, ensuring that the acquired EEG signals more precisely reflect the actual SeLECTs discharge characteristics. This approach enables a more accurate capture of fundamental changes in brain functional connectivity during network construction, providing more reliable evidence for in-depth investigation of the relationship between abnormal discharges and cognitive impairment. δ waves are low-frequency brain waves that are most prominent during the N3 stage of NREM sleep. In patients with ESES, sleep EEG is characterized by continuous spike and slow-wave activity within the 1.5–4 Hz range, which overlaps with the δ wave frequency band. We excluded the alpha frequency band analysis since α rhythms typically dissociate during sleep. Furthermore, considering that hospitalization may negatively affect sleep quality and duration, we focused on the N3 stage of NREM sleep to minimize environmental interference, making delta waves an ideal target for our analysis (6).
Due to variations in EEG sampling duration among SeLECTs patients, the constructed functional brain networks exhibit different sensitivities. Research indicates that longer sampling durations result in reduced functional connectivity values, and different connectivity metrics require varying durations to reach stable states (17). The present study employed the Directed Transfer Function (DTF) method to ensure consistency and accuracy in analyzing abnormal discharge levels and functional connectivity in SeLECTs and further investigate the underlying mechanisms of cognitive impairment. This study employed the Directed Transfer Function (DTF) method. Sleep EEG data from all SeLECTs patients were segmented into 4-s epochs with 50% overlap for subsequent in-depth analysis (18). The DTF method quantifies the direction and strength of information transfer between different nodes in the brain network, enabling a precise analysis of the propagation of abnormal discharges throughout the network and their impact on cognitive function. The DTF calculation formula is generally given by:
where Sij(f) is an element of the cross-spectral density matrix of multi-channel EEG signals, representing the frequency domain relationship between signals xi(t) and xj(t).This relationship enables an in-depth exploration of the signal transmission patterns between brain regions associated with abnormal discharges in SeLECTs and their association with cognitive impairment.Sii(f) and Sjj(f) are the power spectral density (PSD) of signals xi(t) and xj(t), respectively, reflecting the spectral characteristics of each EEG signal. These PSDs help identify the frequency characteristics of abnormal discharges in SeLECTs, facilitating analysis of the impact of these discharges' different frequency components on cognitive function. The magnitude of the cross-spectral density, |Sij(f)|, indicates the strength of information transfer from signalis xi(t) to xj(t). This measure is useful for assessing the propagation strength of abnormal discharges across different brain regions and its relationship with the degree of cognitive impairment. The normalization factor ensures that the DTF values lie within the range [0, 1], allowing for quantitative comparison and analysis of causal relationships between different brain regions.
2.2.2 Preprocessing of multimodal physiological signals from wearable devices
After grouping patients based on SWI criteria, we gave each participant a portable, non-invasive wristband device to investigate its potential as an alternative to long-term video-EEG monitoring. This multimodal physiological signal acquisition system was designed to capture three key biosignals: ACC, EDA, and PPG. Each modality provides multidimensional data support through distinct physiological relevance and sampling frequencies:
-
ACC signals were collected at a sampling frequency of 50 Hz to capture real-time limb movement states. These signals provided critical data for analyzing movement- interictal epileptiform discharge (IED) relationships, given the established association between limb activity, IEDs during peri-ictal periods, and sleep in SeLECTs patients, as well as their potential cognitive implications.This facilitated exploration of the potential cognitive impacts of abnormal discharges. ACC signal noise primarily originates from physiological movements and motion artifacts (19). To address this, we first removed the 0 Hz component to calibrate baseline drift and eliminate direct current offset effects. Subsequently, a median filter was applied to suppress motion artifacts and high-frequency interference, enhancing signal quality for downstream analysis.
-
EDA signals were recorded at 4 Hz to monitor autonomic nervous system (ANS) dynamics. During SeLECTs episodes, Sympathetic arousal responses mediated by the ANS have been associated with cognitive alterations during SeLECTs episodes. Continuous EDA monitoring enabled systematic investigation of ANS-cognition interactions (20), providing novel insights into the pathophysiological mechanisms underlying SeLECTs-related cognitive impairment. We implemented a signal quality index (SQI) calculation protocol to ensure data integrity following established methodologies (21).Given EDA signals' slow-varying nature and susceptibility to motion artifacts, we deployed a median filter identical to the ACC processing pipeline to remove contaminating components, improving the specificity of ANS-related electrophysiological features.
-
PPG signals were acquired at 4 Hz, matching the EDA sampling rate, to provide cardiovascular system metrics. Research has demonstrated significant associations between cardiovascular dynamics, epileptiform discharges, and cognitive dysfunction in SeLECTs. PPG signals therefore offer essential data for investigating cardiovascular-cognition relationships, enabling a systemic perspective on SeLECTs-related cognitive impairment. However, PPG recordings are particularly vulnerable to motion-induced noise contamination. To address this limitation, we applied the same median filtering approach used for ACC and EDA processing, effectively suppressing motion artifacts to ensure reliable signal quality for subsequent cardiovascular feature analysis (22).
Integrating multimodal physiological signals from the wrist-worn device with brain network analysis enables a comprehensive, multidimensional assessment of SeLECTs patients' physiological states and neural functional alterations . This integrated analytical framework provides robust, system-level insights for evaluating cognitive impairment, facilitating mechanistic investigations of the relationship between epileptiform discharges and cognitive dysfunction. To optimize feature extraction and analysis, we rigorously selected 20-min artifact-free recording segments according to strict inclusion criteria (23). These segments were processed using a sliding window approach with a 4-s window duration and a 50% overlap, balancing temporal continuity with independent analytical units (24). Subsequently, modality-specific features were extracted from each window for systematic statistical analysis.
2.3 Feature extractions
2.3.1 EEG: extraction of graph theoretic features
Graph theory is a fundamental mathematical framework that represents a practical approach to modeling brain networks. It enables the extraction of critical information about functional brain organization from EEG signals and facilitates the understanding of neural mechanisms in both healthy and pathological states. IIn the present study, we implemented DTF analysis to derive directed graph-theoretical features from SeLECTs patients. This method captures causal relationships and directionality in EEG signals, offering significant insights into propagation patterns and the spatial extent of epileptiform discharges within brain networks (25, 26). Specifically, we focused on analyzing routing and diffusion efficiency to elucidate the potential mechanisms linking abnormal discharges to functional impairments in SeLECTs.
2.3.1.1 Diffusion efficiency
Diffusion efficiency refers to the average first-passage time from node i to node j, reflecting a networks' ability to transmit information between its nodes, where mf pt (i, j) is the mean first passage time from node i to node j.
Global mean diffusion efficiency is the average diffusion efficiency of all node pairs, excluding self-connections. It reflects the overall information transmission and integration capabilities of the brain network.
In this study, diffusion efficiency represents the shortest duration of the transport of information between two channels or brain regions, reflecting the speed of information flow between them.
2.3.1.2 Routing efficiency
Global routing efficiency is an important tool for evaluating the ability of the network to spread information, optimize network structure, and improve network robustness. It results from the sum of the shortest path between all nodes and the average value.
In the formula above, ERout represents the routing efficiency matrix between nodes. This study defines routing efficiency as the transmission distance of information flow between two channels or brain regions. It reflects the efficiency and reliability of information transmission between these channels or regions. All graph theoretical features in this paper were extracted using the BCT toolbox in MATLAB.
2.3.2 Multimodal physiological signal feature extraction
We implemented a multimodal signal analysis framework to comprehensively investigate physiological state alterations during SeLECTs episodes in multiple dimensions.
-
For ACC signals, time-domain features were prioritized due to their computational efficiency, enabling real-time analysis. During SeLECTs episodes, abnormal limb movements were using through ACC time-domain analysis, providing quantitative evidence for examining the impact of epileptiform discharges on motor activity (27).
-
PPG signals, reflecting cardiovascular dynamics, were transformed into the frequency domain using Fourier analysis. This enabled the identification of frequency-specific components associated with ictal events (28).
-
EDA nonlinear features were analyzed to capture sympathetic nervous system responses. The sensitivity of these features to skin conductance variations enabled precise monitoring of ANS activation during seizures, supporting investigations of ANS cognition interactions (29).
Our feature extraction framework encompassed time-domain, frequency-domain, and nonlinear features, supplemented by statistical descriptors (mean, standard deviation, skewness, and kurtosis) (Table 2) to comprehensively quantify ictal-interictal transitions. This multimodal approach, integrating motor, cardiovascular, and autonomic nervous system metrics, demonstrated superior seizure detection accuracy to unimodal analysis. By correlating these multimodal features with SWI levels, we were able to establish quantitative relationships between electrophysiological markers and physiological responses, advancing our understanding of the mechanisms underlying SeLECTs-related cognitive impairment.
Table 2
| Characteristic | Abbreviations |
|---|---|
| Maximum | Max |
| Minimum | Min |
| Peak | Peak |
| Peak-to-peak | P2P |
| Mean | Mean |
| Average amplitude | AVP |
| Root amplitude | RAT |
| Standard deviation | SD |
| Variance | VAR |
| Root mean squared | RMS |
| Kurtosis | KUR |
| Skewness | SKW |
| Shape factor | SHF |
| Peaking factor | PKF |
| Pulse factor | PF |
| Margin factor | MF |
| Clearance factor | CF |
| Mean square frequency | MSF |
| Frequency component | FC |
| Root mean square fluctuation | RMSF |
| Root variance fluctuation | RVF |
| Mean power spectral density | MPSD |
| Mean frequency of maximum deviation | MFMD |
Signaling characteristic abbreviations.
2.4 Statistical analysis
To elucidate the relationships between multimodal signal features, SeLECTs -related seizure activity, and cognitive impairment, we employed rigorous statistical methods, including analysis of variance (ANOVA) and Pearson correlation analysis. The assumptions for the ANOVA were assessed using Shapiro-Wilk normality testing and Levene's test for homogeneity of variance. Multiple comparisons were subsequently performed following significant ANOVA outcomes. The ANOVA was conducted to assess the statistical significance of feature variations across different SWI levels. The F-statistic was calculated as follows:
where MSbetween and MSwithin represent between-group and within-group mean squares, respectively. This analysis identified features significantly associated with ictal events, enabling the selection of robust biomarkers for SeLECTs detection.
Pearson correlation analysis quantified the linear relationships between signal features and SWI levels using the following formula:
This provided critical insights into feature-severity correlations, supporting the development of accurate association models. The integration of multimodal signals—capturing motor (ACC), cardiovascular (PPG), and autonomic (EDA) dynamics—comprehensively represented physiological states during SeLECTs episodes. This framework significantly enhanced seizure detection accuracy compared to unimodal approaches by leveraging complementary information across physiological systems. By systematically analyzing SWI- dependent variations in multimodal features, we established quantitative association models between electrophysiological markers and physiological responses. These models, parameterized through rigorous statistical analysis, advanced our understanding of the pathophysiological mechanisms underlying SeLECTs-related cognitive dysfunction.
3 Results
We employed DTF to characterize brain network dynamics for functional connectivity visualization and analysis, as shown in Figures 4, 5. The whole frequency band (1–70 Hz) and delta band (1–4 Hz) exhibited enhanced functional connectivity in the centrotemporal regions, reflecting increased neuronal synchronization associated with epileptiform discharges. Comparative analysis revealed significant between-group differences in connectivity patterns, demonstrating the influence of SWI levels on interregional functional organization. Graph-theoretical analysis further indicated that higher SWI levels were associated with decreased network diffusion and routing efficiency.
Figure 4
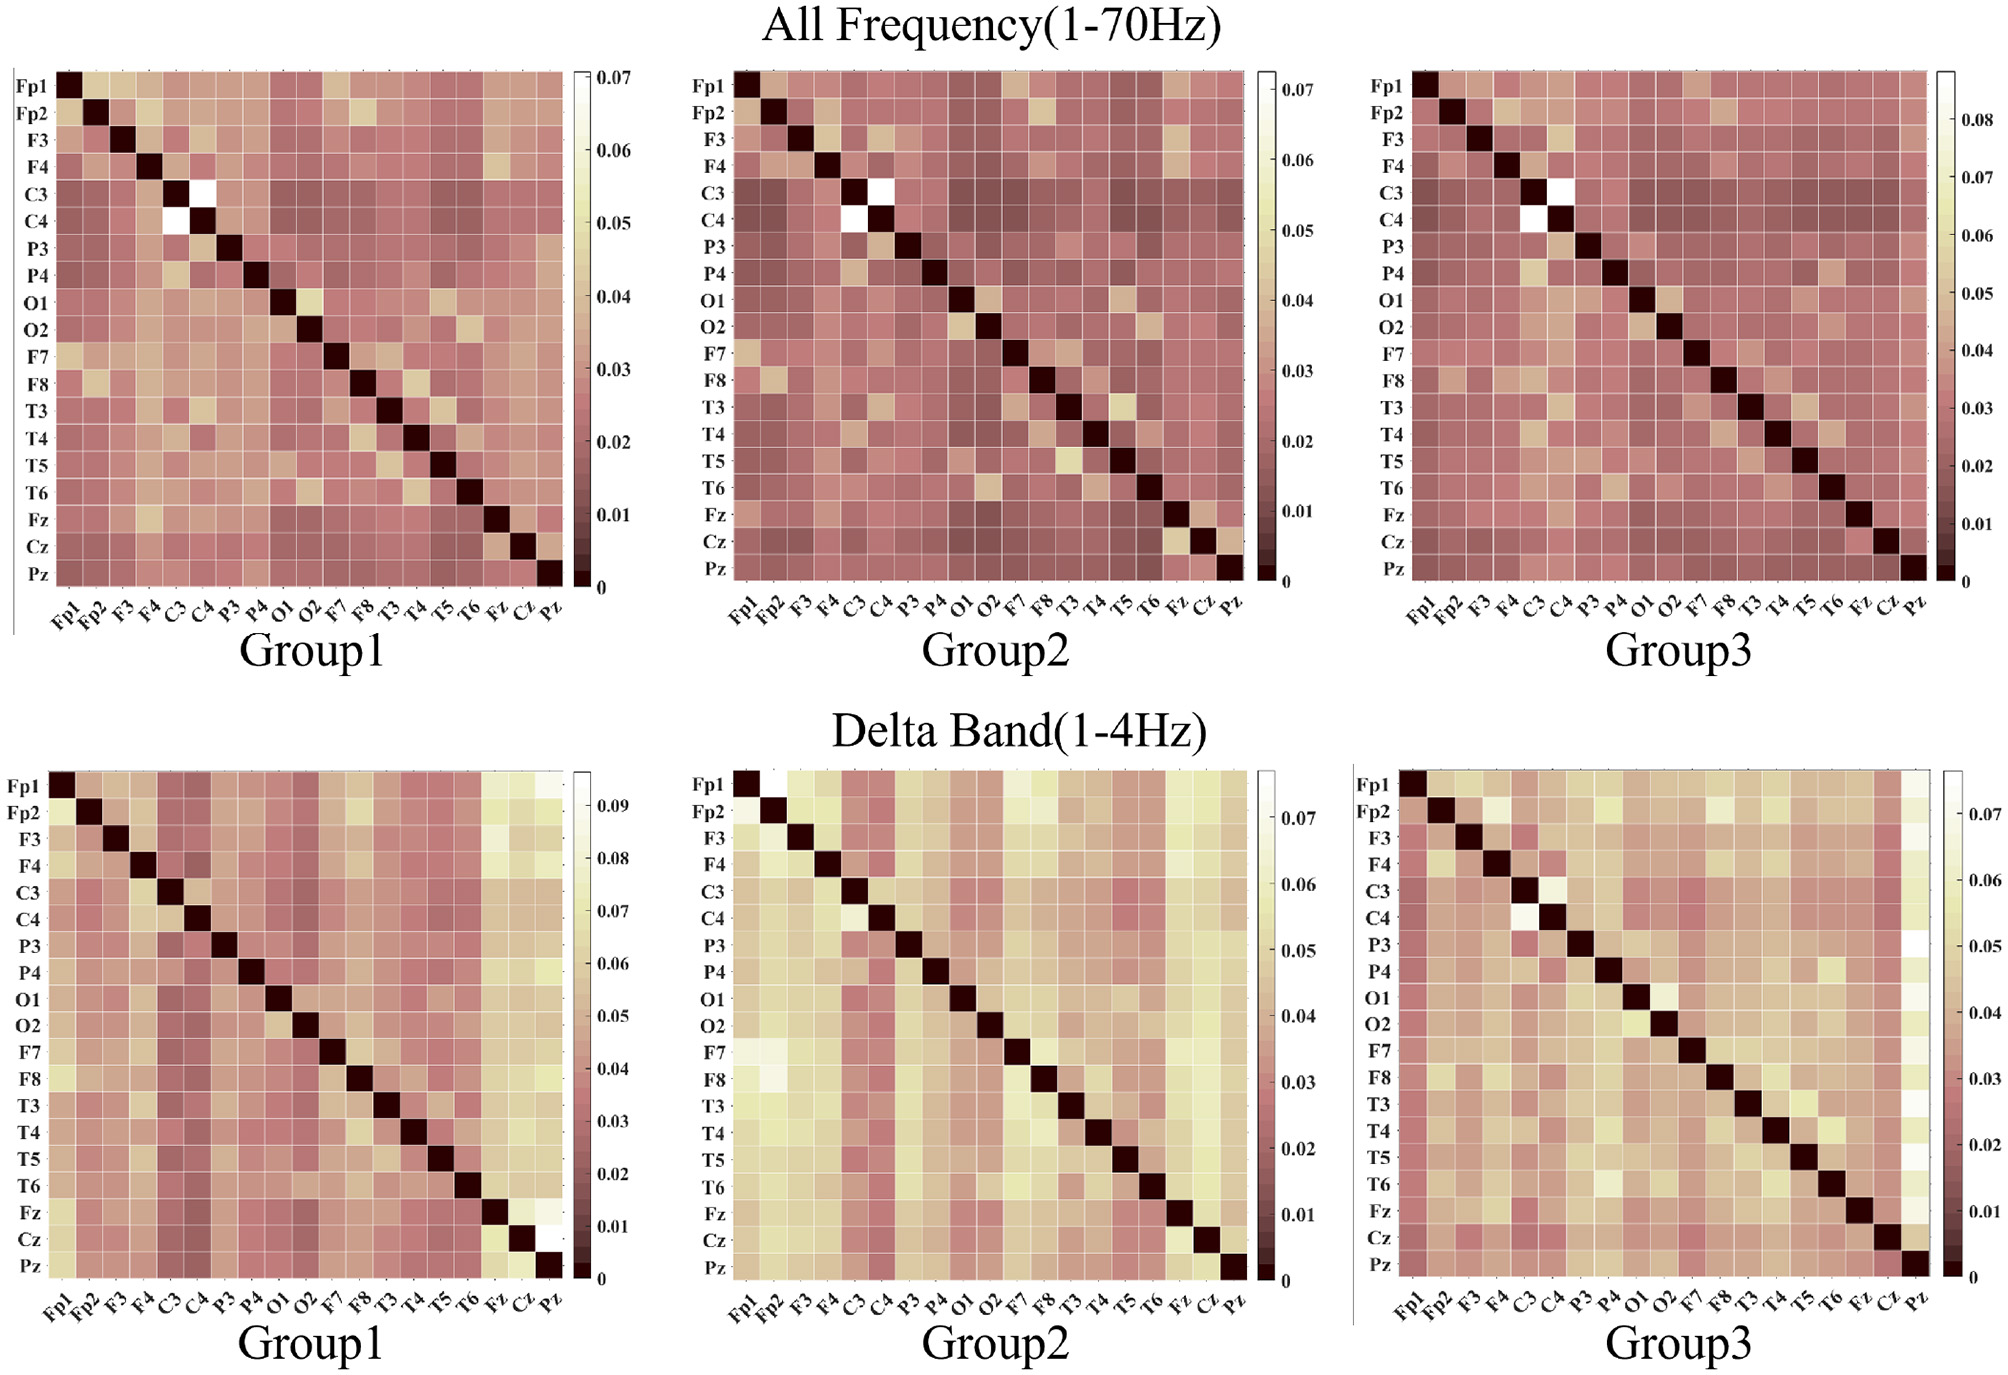
The images above, from left to right, display the visualization results of the DTF function across a frequency range of 1 to 70 Hz. The images below, also from left to right, depict the visualizations for the delta band DTF. In both the delta band and the full-screen segment, the central temporal region exhibits strong functional connectivity.
Figure 5

Chordal maps illustrate the differences in brain network connectivity. Blue lines indicate that Delta bands exhibit reduced functional connectivity compared to the full-screen segment bands. In contrast, red lines show that Delta bands have increased functional connectivity compared to the full-screen segment bands.
We conducted a detailed analysis of graph-theoretical metrics, focusing on diffusion and routing efficiency of SeLECTs activity, as illustrated in Figure 6. Participants were stratified into three groups based on SWI levels: Group 1 (50%–65%), Group 2 (65%–80%), and Group 3 (85%–100%). The analysis revealed an inverse relationship between SWI levels and network efficiency metrics, with both diffusion and routing efficiency demonstrating significant declines as SWI increased. This pattern indicates that heightened epileptiform discharges impair the brain's capacity for information propagation and integration (30). The observed network inefficiencies may underlie specific cognitive deficits, particularly in attention, memory, and executive functioning.
Figure 6

This figure illustrates two theoretical concepts in graph theory: diffusion efficiency and routing efficiency. The left panel displays diffusion efficiency, while the right panel shows routing efficiency.
The results of the multidimensional feature analysis of the ACC, PPG, and EDA signals are shown in Table 3. The analysis indicates that features such as Maximum, Minimum, and Peak in the ACC and PPG all exhibit significant differences under different experimental conditions(P < 0.05). The changes in these features may reflect the abnormal limb movement patterns of patients during SeLECTs seizures and the disorder of the autonomic nerve regulation function of the cardiovascular system (31). It is worth noting that the analysis results of the EDA signal show that except for Variance and Root Mean Square Fluctuation, the remaining features all show significant statistical differences (P < 0.05), and the magnitude of their changes is significantly larger than that of the ACC and PPG signals.
Table 3
| Features | ACC | PPG | EDA |
|---|---|---|---|
| Maximum | 0.0469 | 0.0120 | 0.0430 |
| Minimum | 0.0465 | 0.0110 | 0.0248 |
| Peak | 0.0065 | 0.0200 | 0.0443 |
| Peak-to-Peak | 0.0091 | 0.0031 | 0.0486 |
| Mean | 0.0353 | 0.0362 | 0.0424 |
| Average amplitude | 0.0258 | 0.0063 | 0.0441 |
| Root amplitude | 0.0264 | 0.0483 | 0.0371 |
| Standard deviation | 0.0211 | 0.0356 | 0.0088 |
| Variance | 0.0122 | 0.2933 | 0.0096 |
| Root mean squared | 0.0057 | 0.0014 | 0.0085 |
| Kurtosis | 0.0011 | 0.0012 | 0.0041 |
| Skewness | 0.0261 | 0.0168 | 0.0208 |
| Shape factor | 0.0035 | 0.0030 | 0.0021 |
| Peaking factor | 0.0201 | 0.0013 | 0.0026 |
| Pulse factor | 0.0012 | 0.0011 | 0.0021 |
| Margin factor | 0.0209 | 0.0448 | 0.0201 |
| Clearance factor | 0.0119 | 0.0168 | 0.0094 |
| Mean square frequency | 0.0060 | 0.0065 | 0.0031 |
| Frequency component | 0.0015 | 0.0050 | 0.0072 |
| Root mean square fluctuation | 0.0015 | 0.0041 | 0.8600 |
| Root variance fluctuation | 0.0312 | 0.0355 | 0.0186 |
| Mean power spectral density | 0.0028 | 0.007 | 0.0018 |
p-values of different features on 3-modal signals.
The assumptions for ANOVA were assessed using Shapiro-Wilk normality testing and Levene's test for homogeneity of variance.
We analyzed both time-domain (EDA Peak, EDA mean, EDA root Amplitude, EDA RMS) and frequency-domain (EDA MSF, EDA MPSD, EDA MFMD) features of EDA across different SWI groups, as shown in Figure 7. Significant between-group differences were observed in EDA temporal dynamics. For instance, EDA Peak values were consistently higher in Group 1 compared to Group 3 during specific time intervals, with statistically significant differences across multiple epochs. These findings suggest a systematic relationship between EDA features and SWI levels, indicating suppressed sympathetic nervous system activity in patients with higher SWI.
Figure 7

The figure reveals significant intergroup differences in the spatiotemporal dynamics of EDA. From left to right, the features include EDA Peak, EDA Mean, EDA Root Amplitude, and EDA RMS in the time-domain, as well as EDA MSF, EDA MPSD, and EDA MFMD in the frequency-domain. Peak, Peak; Mean, Mean; RAT, Root Amplitude; RMS, Root Mean Squared; MSF, Mean Square Frequency; MPSD, Mean Power Spectral Density; MFMD, Mean Frequency of Maximum Deviation.
4 Discussion
4.1 Analysis of neurophysiological signals in the brain function impairment mechanism caused by SeLECTs and high spike-wave index
This study investigated the neurophysiological mechanisms underlying brain functional impairment in SeLECTs using EEG analysis. Our findings demonstrate a significant inverse relationship between SWI and brain network efficiency metrics, notably global and local efficiency. The observed reductions in diffusion efficiency (reflecting information propagation speed) and routing efficiency (indicating optimal path selection) suggest that SeLECTs patients exhibit impaired information transfer and integration. These network inefficiencies may lead to slowed or unstable interregional communication, providing a neurophysiological basis for the cognitive deficits—particularly in executive functioning and memory processing—observed during SeLECTs patients' active seizure periods. Our analysis revealed dynamic, SWI-dependent alterations in functional connectivity and graph-theoretical metrics, indicating a dose-response relationship between epileptiform discharge intensity and network dysfunction. At lower SWI levels, the brain network retains partial information transfer efficiency; however, as SWI increases, the disruptive effects of abnormal discharges progressively intensify, ultimately leading to significant network efficiency degradation. These findings suggest that SeLECTs patients exhibit a state of network instability, in which discharge intensity and frequency directly modulate network stability and efficiency. Consequently, clinical management strategies should extend beyond seizure control to include targeted network restoration and stabilization interventions, potentially improving cognitive outcomes in affected patients.
4.2 Applications of non-invasive wristband devices
A key objective of this study was to develop an accurate and convenient alternative to long-term video-EEG monitoring using portable devices. Leveraging the technical capabilities of OPPO watch sensors, we investigated PPG, EDA, and ACC signals as primary monitoring metrics. Our results demonstrated the superior performance of EDA in detecting SeLECTs -related ANS alterations, exhibiting greater sensitivity and dynamic range than ACC and PPG signals. Specifically, several key EDA parameters, such as peak value, root amplitude, RMS, temporal mean value, mean square frequency, average power spectral density, and maximum deviation of mean frequency, all demonstrated significant reductions. These findings align with Horinouchi et al.'s (32) reports of EDA attenuation in epilepsy patients due to autonomic dysfunction, providing additional objective evidence of peripheral autonomic abnormalities in epilepsy.
From a neurophysiological perspective, elevated SWI may reflect the pathological hypersynchronization of cortical discharges during epileptic episodes (33). This excessive synchronization could impair information integration and transmission efficiency among neural network nodes, potentially affecting higher cognitive functions such as attention and memory. Concurrently, the reduction in EDA signals might result from descending inhibition of the peripheral autonomic nervous system by epileptic activity. Research indicates that epileptiform discharges are not confined to the central nervous system but can also suppress preganglionic sympathetic neuronal activity through descending pathways, including the brainstem reticular formation, leading to diminished skin conductance responses. More significantly, increased SWI may disrupt the negative feedback regulation of the hypothalamic-pituitary-adrenal (HPA) axis, altering the rhythmic secretion of glucocorticoids (34). This disruption could further suppress sympathetic nervous system excitability, reducing EDA signal intensity. The bidirectional interaction between the central and peripheral ANS likely forms the neurobiological basis for characteristic EDA signal alterations in SeLECTs patients.
It should be noted that while elevated SWI levels may correlate with increased seizure frequency, currently, there is no direct evidence establishing a causal relationship between increased SWI and decreased EDA signal characteristics. However, it should be noted that while elevated SWI levels may correlate with increased seizure frequency, current research has not provided direct evidence establishing a causal relationship between increased SWI and decreased EDA signal characteristics. Vieluf et al. (35) observed circadian rhythm alterations in EDA patterns among epilepsy patients during 24-h continuous monitoring. These alterations were characterized by overall reductions in skin conductance level and amplitude of the skin conductance response. A preceding study demonstrated that EDA has the capacity to reduce the frequency of seizures and is associated with widespread activation of the cerebral cortex (36, 37). This study further corroborated the findings that EDA signals are significantly linked to cerebral network activity and revealed alterations in specific network characteristics. These findings are of particular significance for patients who experience seizure warning symptoms or prodromal symptoms prior to seizures, as they provide a basis for implementing timely preventive strategies. Furthermore, the study indicated that SWI levels may play a substantial role in these autonomous changes. This finding reveals a complex interaction between central and peripheral autonomous regulation in epilepsy. This objective evidence is pivotal for clinical diagnosis and understanding of epilepsy-related autonomous nervous system dysfunction. EDA signal monitoring has the capacity to facilitate real-time seizure activity assessment, facilitate identification of high-risk seizure states (ESES), and enhance the refinement of treatment and follow-up management plans.
4.3 Study limitations and future directions
This study contributes to the understanding of brain function impairment mechanisms in SeLECTs by applying neurophysiological signal analysis. It explores a potential alternative to long-term video—EEG monitoring using portable devices. However, several limitations should be acknowledged, and future research directions are proposed to advance this field. Our study recognizes several important limitations in our participant selection process: (1) the lack of a control group that includes both non-ESES epileptic patients (e.g., patients with focal epilepsy with SWI <50%) and healthy controls. Although the 85% threshold has historically been dominant, recent guidelines suggest a lower threshold of SWI ≥50% in NREM sleep. However, some groups have adopted thresholds as low as 25%, and thus these categorization criteria contributed to our SWI cut-off values and the analysis of the control group (5, 38). (2) Relatively small sample size. Although our research strategy is consistent with previous ESES literature (39–41), these observations should be interpreted with caution, and may not be generalizable.These limitations primarily reflect the practical challenges of conducting a single-center exploratory study with stringent inclusion criteria: all enrolled ESES patients were required to meet both rigorous electroclinical diagnostic standards (SWI ≥85%) with documented cognitive regression) and complete multimodal neurophysiological assessments, which significantly prolonged case recruitment and data collection timelines. We plan to collaborate on future multicenter studies where the inclusion of diverse comparison cohorts will be more feasible.
The current classification framework implicitly acknowledges the phenotypic continuum of epilepsy, where some cases may transition from benign presentations to non-benign stages during disease progression, potentially accompanied by cognitive decline (2, 3). However, while these systems theoretically recognize this continuum, further clinical validation is required to clarify critical parameters. These include the specific proportion of children with SeLECTs who progress to ESES, develop language or cognitive regression, or evolve into drug-resistant epilepsy, as well as the predictive factors underlying such transitions. More than 50 years since the first description of ESES, the pathophysiologic mechanisms underlying the emergence of encephalopathies associated with enhanced sleep-related epileptic discharges remain incompletely elucidated (42). Current research on SWI and cognitive impairment remains scarce. The effect of spikes on long- and short-term cognitive impairment remains unclear. The present study's findings could be further strengthened by optimizing data acquisition and analysis methods for non-invasive wristband devices, particularly in terms of enhancing their accuracy and convenience for epilepsy monitoring. Future studies should consider expanding the sample size and implementing multicenter research designs to validate the generalizability and reliability of the results. Additionally, extending monitoring periods would enable researchers to capture dynamic changes in physiological signals, potentially leading to the development of comprehensive datasets for early disease warning systems and facilitating personalized treatment strategies using through longitudinal data analysis (43). These future directions would address current limitations while building upon the foundation established by this study, potentially leading to more effective monitoring and treatment approaches for SeLECTs patients.
5 Conclusions
This study aimed to investigate the intrinsic neural mechanisms underlying brain function impairment caused by abnormal discharges SeLECTs and to explore the potential of non-invasive wristband devices in epilepsy monitoring. The results demonstrate that increased SWI in SeLECTs patients significantly correlates with reduced global and local efficiency of brain functional networks, revealing the detrimental effects of abnormal discharges on brain information transmission and integration capabilities. Simultaneously, monitoring through non-invasive wristband devices revealed that EDA signals exhibit excellent performance in capturing SeLECTs-related autonomic nervous system activity changes. The observed decrease in EDA parameters shows a strong association with both central nervous system abnormal discharges and peripheral autonomic inhibition, further elucidating the bidirectional interactions between central and peripheral nervous systems. These findings provide novel insights into the pathological mechanisms of SeLECTs and establish a foundation for optimizing and clinically applying non-invasive monitoring technologies. Future research should focus on expanding sample sizes, prolonging monitoring durations, and refining analytical methods to advance early warning systems and personalized treatment strategies for SeLECTs.
Statements
Data availability statement
The raw data supporting the conclusions of this article will be made available by the authors, without undue reservation.
Ethics statement
The studies involving humans were approved by the Ethics Committee of Anhui Medical University. The studies were conducted in accordance with the local legislation and institutional requirements. Written informed consent for participation in this study was provided by the participants' legal guardians/next of kin. Written informed consent was obtained from the individual(s), and minor(s)' legal guardian/next of kin, for the publication of any potentially identifiable images or data included in this article.
Author contributions
MX: Writing – original draft, Writing – review & editing. XL: Writing – review & editing. YF: Writing – review & editing. DH: Writing – review & editing. YZ: Investigation, Writing – review & editing. WW: Investigation, Writing – review & editing. YG: Investigation, Writing – review & editing. KL: Investigation, Writing – review & editing. BY: Investigation, Writing – review & editing. JC: Supervision, Writing – original draft, Writing – review & editing. TJ: Investigation, Supervision, Writing – original draft, Writing – review & editing.
Funding
The author(s) declare that financial support was received for the research and/or publication of this article. This study was supported by the 2023 Anhui Provincial Natural Science Research Project (2023AH040076).
Acknowledgments
Thanks to the students of Hangzhou University of Electronic Science and Technology for their technical support.
Conflict of interest
The authors declare that the research was conducted in the absence of any commercial or financial relationships that could be construed as a potential conflict of interest.
Generative AI statement
The author(s) declare that no Gen AI was used in the creation of this manuscript.
Any alternative text (alt text) provided alongside figures in this article has been generated by Frontiers with the support of artificial intelligence and reasonable efforts have been made to ensure accuracy, including review by the authors wherever possible. If you identify any issues, please contact us.
Correction Note
A correction has been made to this article. Details can be found at: 10.3389/fneur.2025.1719076.
Publisher’s note
All claims expressed in this article are solely those of the authors and do not necessarily represent those of their affiliated organizations, or those of the publisher, the editors and the reviewers. Any product that may be evaluated in this article, or claim that may be made by its manufacturer, is not guaranteed or endorsed by the publisher.
References
1.
Camfield P Camfield C . Epileptic syndromes in childhood: clinical features, outcomes, and treatment. Epilepsia. (2002) 43:27–32. 10.1046/j.1528-1157.43.s.3.3.x
2.
Scheffer IE Berkovic S Capovilla G Connolly MB French J Guilhoto L et al . ILAE classification of the epilepsies: position paper of the ILAE commission for classification and terminology. Epilepsia. (2017) 58:512–21. 10.1111/epi.13709
3.
Specchio N Wirrell EC Scheffer IE Nabbout R Riney K Samia P et al . International league against epilepsy classification and definition of epilepsy syndromes with onset in childhood: position paper by the ILAE task force on nosology and definitions. Epilepsia. (2022) 63:1398–442. 10.1111/epi.17241
4.
Parisi P Paolino MC Raucci U Ferretti A Villa MP Trenite DK . “Atypical forms” of benign epilepsy with centrotemporal spikes (BECTS): how to diagnose and guide these children. a practical/scientific approach. Epilepsy Behav. (2017) 75:165–9. 10.1016/j.yebeh.2017.08.001
5.
Öztoprak Ü Yayici Köken Ö Aksoy E Yüksel D . Spike-wave index assessment and electro-clinical correlation in patients with encephalopathy associated with epileptic state during slow sleep (ESES/CSWS); single-center experience. Epilepsy Res. (2021) 170:106549. 10.1016/j.eplepsyres.2021.106549
6.
Sánchez Fernández I Loddenkemper T Peters JM Kothare SV . Electrical status epilepticus in sleep: clinical presentation and pathophysiology. Pediatr Neurol. (2012) 47:390–410. 10.1016/j.pediatrneurol.2012.06.016
7.
Posar A Visconti P . Continuous spike—waves during slow sleep today: an update. Children. (2024) 11:169. 10.3390/children11020169
8.
Patry G Lyagoubi S Tassinari CA . Subclinical "electrical status epilepticus” induced by sleep in children: a clinical and electroencephalographic study of six cases. Arch Neurol. (1971) 24:242–52.
9.
Li Y Wang Y Jiang P Sun J Chen Q Wang X . Alterations in the default mode network in rolandic epilepsy with mild spike-wave index in non-rapid eye movement sleep. Front Neurosci. (2022) 16:944391. 10.3389/fnins.2022.944391
10.
Zhong R Li M Chen Q Li J Li G Lin W . The P300 event-related potential component and cognitive impairment in epilepsy: a systematic review and meta-analysis. Front Neurol. (2019) 10:943. 10.3389/fneur.2019.00943
11.
Cerminara C D'Agati E Lange KW Kaunzinger I Tucha O Parisi P et al . Benign childhood epilepsy with centrotemporal spikes and the multicomponent model of attention: a matched control study. Epilepsy Behav. (2010) 19:69–77. 10.1016/j.yebeh.2010.07.008
12.
Verrotti A D'Egidio C Agostinelli S Parisi P Chiarelli F Coppola G . Cognitive and linguistic abnormalities in benign childhood epilepsy with centrotemporal spikes. Acta Paediatrica. (2011) 100:768–72. 10.1111/j.1651-2227.2011.02159.x
13.
Novak A Vizjak K Rakusa M . Cognitive impairment in people with epilepsy. J Clin Med. (2022) 11:267. 10.3390/jcm11010267
14.
Sánchez Fernández I Loddenkemper T Galanopoulou AS Moshé SL . Should epileptiform discharges be treated?Epilepsia. (2015) 56:1492–504. 10.1111/epi.13108
15.
Chaddad A Wu Y Kateb R Bouridane A . Electroencephalography signal processing: a comprehensive review and analysis of methods and techniques. Sensors. (2023) 23:6434. 10.3390/s23146434
16.
Wu J Hu D Zheng R Jiang T Gao F Cao J . Information flow-based brain network analysis of healthy and epileptic syndromes children. IEEE Sens J. (2024) 24:19417–27. 10.1109/JSEN.2024.3393299
17.
Fraschini M Demuru M Crobe A Marrosu F Stam CJ Hillebrand A . The effect of epoch length on estimated EEG functional connectivity and brain network organisation. J Neural Eng. (2016) 13:36015. 10.1088/1741-2560/13/3/036015
18.
Klinzing JG Tashiro L Ruf S Wolff M Born J Ngo HVV . Auditory stimulation during sleep suppresses spike activity in benign epilepsy with centrotemporal spikes. Cell Rep Med. (2021) 2:100432. 10.1016/j.xcrm.2021.100432
19.
Nasseri M Nurse E Glasstetter M Böttcher S Gregg NM Laks Nandakumar A et al . Signal quality and patient experience with wearable devices for epilepsy management. Epilepsia. (2020) 61:S25–35. 10.1111/epi.16527
20.
Alvarez V Reinsberger C Scirica B O'Brien MH Avery KR Henderson G et al . Continuous electrodermal activity as a potential novel neurophysiological biomarker of prognosis after cardiac arrest—a pilot study. Resuscitation. (2015) 93:128–35. 10.1016/j.resuscitation.2015.06.006
21.
Böttcher S Vieluf S Bruno E Joseph B Epitashvili N Biondi A et al . Data quality evaluation in wearable monitoring. Sci Rep. (2022) 12:21412. 10.1038/s41598-022-25949-x
22.
Wang Y Azimi I Kazemi K Rahmani AM Liljeberg P . PPG signal reconstruction using deep convolutional generative adversarial network. In: 2022 44th Annual International Conference of the IEEE Engineering in Medicine & Biology Society. EMBC: Glasgow, Scotland, United Kingdom (2022). p. 3387–91. 10.1109/EMBC48229.2022.9871678
23.
Mohammadpour Touserkani F Tamilia E Coughlin F Hammond S El Atrache R Jackson M et al . Photoplethysmographic evaluation of generalized tonic-clonic seizures. Epilepsia. (2020) 61:1606–16. 10.1111/epi.16590
24.
Chung S Lim J Noh KJ Kim G Jeong H . Sensor data acquisition and multimodal sensor fusion for human activity recognition using deep learning. Sensors. (2019) 19:1716. 10.3390/s19071716
25.
Bullmore E Sporns O . Complex brain networks: graph theoretical analysis of structural and functional systems. Nat Rev Neurosci. (2009) 10:186–98. 10.1038/nrn2575
26.
Falsaperla R Vitaliti G Marino SD Praticò AD Mailo J Spatuzza M et al . Graph theory in paediatric epilepsy: a systematic review. Dialogues Clin Neurosci. (2021) 23:3–13. 10.1080/19585969.2022.2043128
27.
Wang J Hu D Lai X Jiang T Jiang T Gao F et al . Epileptic seizure detection based on attitude angle signal of wearable device. IEEE Trans Instrum Meas. (2025) 74:1–10. 10.1109/TIM.2025.3529058
28.
Shaffer F Ginsberg JP . An overview of heart rate variability metrics and norms. Front Public Health. (2017) 5:258. 10.3389/fpubh.2017.00258
29.
Visnovcova Z Ferencova N Grendar M Ondrejka I Olexova LB Bujnakova I et al . Electrodermal activity spectral and nonlinear analysis—potential biomarkers for sympathetic dysregulation in autism. Gen Physiol Biophys. (2023) 41:123–31. 10.4149/gpb_2022011
30.
Lee C Im CH Koo YS Lim JA Kim TJ Byun JI et al . Altered network characteristics of spike-wave discharges in juvenile myoclonic epilepsy. Clin EEG Neurosci. (2017) 48:111–7. 10.1177/1550059415621831
31.
Devinsky O . Effects of seizures on autonomic and cardiovascular function. Epilepsy Curr. (2004) 4:43–6. 10.1111/j.1535-7597.2004.42001.x
32.
Horinouchi T Sakurai K Munekata N Kurita T Takeda Y Kusumi I . Decreased electrodermal activity in patients with epilepsy. Epilepsy Behav. (2019) 100:106517. 10.1016/j.yebeh.2019.106517
33.
Avoli M . Mechanisms of epileptiform synchronization in cortical neuronal networks. Curr Med Chem. (2014) 21:653–62. 10.2174/0929867320666131119151136
34.
Packard AEB Egan AE Ulrich-Lai YM . In: HPA Axis Interactions with Behavioral Systems. John Wiley & Sons, Ltd (2016). p. 1897–934. Available online at: https://onlinelibrary.wiley.com/doi/abs/10.1002/cphy.c150042
35.
Vieluf S Amengual-Gual M Zhang B El Atrache R Ufongene C Jackson MC et al . Twenty-four-hour patterns in electrodermal activity recordings of patients with and without epileptic seizures. Epilepsia. (2021) 62:960–72. 10.1111/epi.16843
36.
Schach S Rings T Bregulla M Witt JA Bröhl T Surges R et al . Electrodermal activity biofeedback alters evolving functional brain networks in people with epilepsy, but in a non-specific manner. Front Neurosci. (2022) 16:828283. 10.3389/fnins.2022.828283
37.
Nagai Y Jones CI Sen A . Galvanic skin response (GSR)/electrodermal/skin conductance biofeedback on epilepsy: a systematic review and meta-analysis. Front Neurol. (2019) 10:377. 10.3389/fneur.2019.00377
38.
Stowe RC Kelley SA Bhatia S McLaren JR Rao LM Patel SH et al . Rebuilding the tower of babel: the current landscape and emerging opportunities in DEE-SWAS. Epilepsy Curr. (2025) 9:15357597251344191. 10.1177/15357597251344191
39.
Caraballo RH Fortini S Flesler S Pasteris MC Caramuta L Portuondo E . Encephalopathy with status epilepticus during sleep: unusual EEG patterns. Seizure. (2015) 25:117–25. 10.1016/j.seizure.2014.10.003
40.
Bölsterli Heinzle BK Fattinger S Kurth S LeBourgeois MK Ringli M Bast T et al . Spike wave location and density disturb sleep slow waves in patients with CSWS (continuous spike waves during sleep). Epilepsia. (2014) 55:584–91. 10.1111/epi.12576
41.
Han Y Gao J Zhou Y Deng J Yang H Wang X et al . rTMS improves cognition in patients with self-limited epilepsy with centrotemporal spikes with electrical status epilepticus in sleep via increase of the sleep spindle. CNS Neurosci Ther. (2025) 31:e70501. 10.1111/cns.70501
42.
Rubboli G Gardella E Cantalupo G Tassinari C . Encephalopathy related to status epilepticus during slow sleep (ESES). Pathophysiological insights and nosological considerations. Epilepsy Behav. (2023) 140:109105. 10.1016/j.yebeh.2023.109105
43.
Böttcher S Zabler N Jackson M Bruno E Biondi A Epitashvili N et al . Effects of epileptic seizures on the quality of biosignals recorded from wearables. Epilepsia. (2024) 65:3513–25. 10.1111/epi.18138
Summary
Keywords
SWI, ACC, PPG, EDA, DTF, SeLECTs
Citation
Xu M, Li X, Fu Y, Hu D, Zhang Y, Wei W, Gao Y, Lin K, Yang B, Cao J and Jiang T (2025) Study on brain functional networks and wearable device monitoring in children with SeLECTs and high spike-wave index (SWI >50%). Front. Neurol. 16:1571330. doi: 10.3389/fneur.2025.1571330
Received
05 February 2025
Accepted
28 August 2025
Published
30 September 2025
Corrected
21 October 2025
Volume
16 - 2025
Edited by
Francesca Felicia Operto, University of Salerno, Italy
Reviewed by
Nishant Sinha, University of Pennsylvania, United States
Anca Adriana Arbune, Fundeni Clinical Institute, Romania
Updates
Copyright
© 2025 Xu, Li, Fu, Hu, Zhang, Wei, Gao, Lin, Yang, Cao and Jiang.
This is an open-access article distributed under the terms of the Creative Commons Attribution License (CC BY). The use, distribution or reproduction in other forums is permitted, provided the original author(s) and the copyright owner(s) are credited and that the original publication in this journal is cited, in accordance with accepted academic practice. No use, distribution or reproduction is permitted which does not comply with these terms.
*Correspondence: Jiuwen Cao jwcao@hdu.edu.cnTao Jiang jiangtao@ahmu.edu.cn
Disclaimer
All claims expressed in this article are solely those of the authors and do not necessarily represent those of their affiliated organizations, or those of the publisher, the editors and the reviewers. Any product that may be evaluated in this article or claim that may be made by its manufacturer is not guaranteed or endorsed by the publisher.