Abstract
Introduction:
Our study aimed to quantify the predictive ability of the Systemic Immune-inflammatory Index (SII) for predicting the prognosis and multidimensional complications in acute ischemic stroke (AIS) patients. The primary outcome was poor prognosis, and secondary outcomes included mortality, severity, hemorrhagic transformation/symptomatic intracerebral hemorrhage, stroke-associated pneumonia/poststroke pneumonia, early neurological deterioration, post-stroke depression, progression or recurrence, and other adverse outcomes.
Methods:
We searched 15 databases from their establishment to 13 October 2024 and selected cohort or case-control analyses that analyzed the association of continuous or categorized SII as exposures with the above adverse outcomes of AIS populations.
Results:
The results showed that 78 studies with 40,682 participants were included in meta-analyses. Continuous SII values were significantly higher in poor prognosis groups than in controls (SMD = 248.13, 95% CI: 198.77 to 297.50; p = 0.000). Poor prognosis incidences rose with higher continuous SII values (OR = 1.004, 95% CI: 1.002 to 1.005; p = 0.000). More patients in High SII groups had poor prognosis (RR = 1.95, 95% CI: 1.66 to 2.28; p = 0.000). The risk of poor prognosis was higher in the high SII groups, though this was not statistically significant (OR = 1.007, 95% CI: 0.998 to 1.015; p = 0.120).
Discussion:
In conclusion, our study found that continuous SII and high SII were associated with poor prognosis of AIS and various complications. Given the accessibility and low cost of SII, integrating it into prognostic scores merits further research for better clinical choices.
Systematic review registration:
PROSPERO (CRD42024586414), https://www.crd.york.ac.uk/PROSPERO/view/CRD42024586414.
1 Introduction
Acute ischemic stroke (AIS), a prominent form of stroke, ranks as the primary cause of disability and mortality on a global scale (1). Given its high prevalence, there is an urgent need for a simple, accurate, and inexpensive prognostic biomarker to better predict AIS outcomes. Systemic Immune-Inflammatory Index (SII) is an inflammatory indicator calculated as Neutrophil ×Platelets/Lymphocyte, which reflects the balance between the body’s inflammatory response and immune state and the state of coagulation. There were three systematic reviews that reported on SII’s predictive value in the prognosis of AIS, but all were published early and flawed in design, with few included studies (2–4). The purpose of this study was to conduct a thorough literature search and pool data on the prognostic ability of SII for outcomes of AIS, including poor prognosis, mortality, severity, complications like hemorrhagic transformation (HT)/symptomatic intracerebral hemorrhage (sICH), stroke-associated pneumonia (SAP)/poststroke pneumonia (PSP), early neurological deterioration (END), post-stroke depression (PSD), progression/recurrence, and other complications.
2 Materials and methods
There were two researchers who independently conducted the entire process under MOOSE (4), with the review protocol deposited in PROSPERO (CRD42024586414). There were 15 databases searched from their establishment to 13 October 2024: PubMed, Embase, Cochrane, EBSCO, Scopus, OVID, Web of Science, CNKI, Wanfang, VIP, Sinomed, Clinical Trials, WHO-ICTRP, Chictr, and DANS EASY. AIS search subject terms included “Brain Infarction,” “Brain Ischemia,” “Cerebral Arterial Diseases,” “Cerebral Infarction,” “Cerebrovascular Disorders,” “Stroke,” and free terms included 122. SII terms included six terms (Search criteria, strategies, and results as shown in Supplementary material 1).
After eliminating duplicate reports, the remaining studies’ titles and abstracts were screened to assess their appropriateness for inclusion. Subsequently, the previously selected papers were evaluated for eligibility, data obtained, and bias risk evaluated by the Newcastle-Ottawa Scale (NOS) using the full text. Another two researchers independently conducted the abovementioned processes, and any disagreements were resolved by consulting a third guide researcher.
Eligible articles were cohort or case–control analyses analyzing the relationship between SII and AIS adverse outcomes, including poor prognosis, mortality, severity, and complications such as HT/sICH, SAP/PSP, END, PSD, progression/recurrence, and others. The inclusion criteria were as follows: 1. Population: Patients of AIS and its complications (any diagnostic criteria); 2. Required data: Continuous SII value of poor prognosis/death/mild severity/HT/SAP/END/PSD/progression or recurrence/other complications groups versus the corresponding control groups; sample size of outcomes’ events, adjusted odds ratio (aOR)/adjusted hazard ratio (aHR) of outcomes, and National Institute of Health Stroke Scale (NIHSS) in High SII groups versus Low SII groups; SII cut-off values and area under curve (AUC) of receiver operating characteristic (ROC) curves. 3. Exclusion criteria were as follows: duplicate publications, obviously incorrect data, mismatched research types, and low quality (NOS ≤ 4) (When studies provided sample sizes of outcomes’ events for high- and low-SII groups, HIGH SII was defined as the highest SII group, and LOW SII was the sum of the other groups. For aOR/aHR or NIHSS data, HIGH SII was defined as the highest SII group, and LOW SII was the lowest SII group).
We assessed the association between SII and AIS adverse outcomes using mean difference (MD), Relative Risk (RR), and pooled aOR/aHR. Using Stata 14.0, we considered a p-value < 0.05 significant, quantified heterogeneity with I2 and p value of Cochran’s Q statistics, applied the random-effects model for high heterogeneity, and checked for bias with funnel plots and Begg/Egger tests.
3 Results
3.1 General results
Literature search and studies included the initial search, which resulted in 1646 total studies, 670 studies that remained to be screened after removing duplicates, and 99 studies that remained for full-text assessment. Finally, 79 studies (1, 5–82) remained to be included in the systematic review, and 78 studies remained to be included in the meta-analysis (1, 5–33, 35–82) except Wang SN 2024 (34). Details of the process are shown in Figure 1. A summary of the main characteristics of the 78 studies is presented in Table 1; the rating of the quality of the evidence by NOS is presented in Table 2.
Figure 1

The search and screening process.
Table 1
| No. | References | Study design | NOS | Region | Population | Type of AIS | Entry time | Participants (M/F) | Age-year (Mean ± SD)/[Median(IQR)] | Medical & medication history | Blood sampling | Followed-up | Outcomes |
|---|---|---|---|---|---|---|---|---|---|---|---|---|---|
| Cohort studies | |||||||||||||
| 1 | Wang N 2024 (13) | R-S | 9 | China | Changhai Hospital of Naval Medical University | AIS with IVT | 2016.01–2020.12 | 466 (291/175) | 65.5 | ①②③⑤⑥ | Before IVT (Within 4.5 h of Symptom Onset) | 90d | ACDE |
| 2 | Zhang LL 2024 (15) | R-S | 9 | China | the First Affiliated Hospital of Soochow University | AIS with Atherosclerotic Plaque in Responsible Carotid Artery | 2020.01–2022.06 | 202 (147/55) | Vulnerable groups 65.13 ± 10.53/Stable groups 64.57 ± 11.28 | ①②③④⑮⑱ | Within 24 h of Admission | 1mos | J |
| 3 | Wei 2024 (16) | R-S | 9 | China | Second Hospital of Tianjin Medical University | AIS with IVT | 2019.03–2021.05 | 221 (138/83) | 68.0 ± 12.1 | ①②③④⑤⑥⑮⑯ | Before The Bolus of IVT | 3mos | ABCDE |
| 4 | Zhang MK 2024 (32) | R-S | 9 | China | Xuan Wu Hospital, affiliated to Capital Medical University | AIS with EVT & fDNI | 2017.01–2020.04 | 352 (250/102) | DNI groups 60.89 ± 11.63/Non-DNI groups 64.81 ± 11.85 | ①②③④⑤⑥ | Before EVT | 90d | J |
| 5 | Yang Y 2024 (5) | R-S | 8 | China | Beijing Friend-ship Hospital, Capital Medical University | AIS with ICA severe stenosis and SAP | 2020.1–2023.6 | 342 (171/171) | 65.2 ± 10.2/66.3 ± 11.1 | ①②③④⑤⑥⑦⑮⑯⑱⑲ | The Next Morning (5:00 a.m.) after Admission | 120d | BC |
| 6 | Cao 2024 (8) | R-S | 8 | China | Xuanwu Hospital of Capital Medical University | Anterior Circulation AIS-LVO with EVT | 2018.12–2022.12 | 482 (323/159) | 65 (56–72) | ①②③④⑤⑥⑮⑯ | Admission or the first day post-EVT | 90d | AD |
| 7 | Arslan 2024 (6) | R-S | 7 | Turkey | Istanbul Kanuni Sultan Süleyman Training and Research Hospital | Critical AIS in ICU | 2020–2022 | 198 (95/103) | 70 (56–86) | ①②④⑤⑧ | NR | 28d | AB |
| 8 | Zhu 2024 (7) | R-S | 7 | China | Nantong Third People’s Hospital | AIS NOT EVT or IVT | 2019.09–2024.02 | 306 (191/115) | FPG groups 68.761 ± 10.763, PPG groups 75.327 ± 8.911 | ①②③④⑤⑥⑫⑮⑯⑱ | Within 1 h of Admission | 30d | AG |
| 9 | Zhao 2024 (17) | R-S | 7 | China | Wuxi People’s Hospital | AIS with IVT | NR | 197 (125/72) | FPG 68.18 ± 10.09/PPG 67.69 ± 8.75 | ①②⑤ | Within 4.5 h of Symptom Onset | NR | A |
| 10 | Guoqing 2024 (18) | R-S | 7 | China | People’s Hospital of Xinjiang Uygur Autonomous Region | AIS with IVT | 2021.06–2023.06 | 122 (65/57) | 58 (54, 63) | ①② | Before The Bolus of IVT | 6mos | A |
| 11 | Ma L 2024 (21) | R-S | 7 | China | the Second Affiliated Hospital of Anhui Medical University | ACI with IVT | 2021.09–2023.09 | 199 (130/69) | 62.96 ± 13.00 | ①②⑤⑥⑮⑱ | Before IVT | 3mos | AEG |
| 12 | Huang H 2024 (29) | R-S | 7 | China | the First People’s Hospital of Suqian | Minor Stroke Due to Anterior Circulation AIS-LVO | 2021.11–2023.12 | 132 (85/47) | 68 (58–77) | ①②③④⑤⑥⑮⑯⑱⑲㉒ | 340 (228 ~ 572)Min after Onset | 24 h | E |
| 13 | Misirlioglu 2024 (10) | R-S | 6 | Turkey | Gaziosmanpasa Education and Research Hospital | AIS | 2019.01–2023.06 | 1,350 (710/640) | 64.38 ± 16.43 | ①②③④⑤ | Within 24 h of Stroke Onset | NR | B |
| 14 | Mengting 2024 (20) | R-S | 6 | China | Xishan People’s Hospital of Wuxi | ACI with IVT | 2022.01–2023.12 | 174 (111/63) | FPG groups 68 (57, 76)/PPG groups74 (66, 81) | ①②③④⑤⑥⑮⑱ | Before and 24 h after IVT | Discharge | A |
| 15 | Zhouquan 2024 (23) | R-S | 6 | China | the Second People’s Hospital of Chengdu | AIS with IVT | 2022.03–2023.03 | 213 (125/88) | 67.5 ± 20.5 | ①②⑤ | Admission | 3mos | A |
| 16 | Jiaxiang 2024 (25) | R-S | 6 | China | Nanjing Drum Tower Hospital | AIS with IVT | 2020.01–2022.12 | 185 (104/81) | END groups 80 (70, 84)/Non-END groups 73 (66, 80) | ①②③⑤⑥ | NR | 3mos | E |
| 17 | Zhang J 2024 (27) | R-S | 5 | China | The Affiliated Hospital of Chengde Medical College | AIS | 2023.01–2023.12 | 115 (81/34) | PIS groups 61.83 ± 10.89/Non-PIS groups 64.06 ± 9.92 | ①②④⑤ | Within 24 h of Admission | 7d | J |
| 18 | Haimei 2024 (30) | R-S | 5 | China | Taizhou People’s Hospital | AIS | 2022.01–2022.12 | 259 (159/100) | SAP groups 71.00 (61.00, 81.00)/Non-SAP groups 70.00 (58.00, 77.25) | ①②④⑤ | NR | 7d | F |
| 19 | Lijun 2024 (31) | R-S | 5 | China | The First Affiliated Hospital of Naval Medical University | AIS | 2022.08–2022.12 | 80 (58/22) | 27–84 | ①②③④⑥ | The Day After Admission | 90d | G |
| 20(1) | Huang SW 2024 (1) (1) | R-M | 8 | China | the First Affiliated Hospital of Wenzhou Medical University | AIS without IVT | 2020.1–2020.12 | 1,268 (835/433) | 67 (59–76) | ①②④⑤⑥ | Within 24 h of Admission | 1y | ABJ |
| 20(2) | Huang SW 2024 (1) (2) | R-M | 8 | China | the Third Affiliated Hospital of Wenzhou Medical University | AIS without IVT | 2020.1–2020.12 | 536 (341/195) | 69 (60–78) | ①②④⑤⑥ | Within 24 h of Admission | 1y | ABJ |
| 20(3) | Huang SW 2024 (1) (3) | R-M | 8 | China | Both | AIS without IVT | 2020.1–2020.12 | 650 (391/259) | 75.00 (68.00–81.00) | ①②④⑤⑥ | Within 24 h of Admission | 1y | ABJ |
| 21 | Lee 2024 (12) | P-S | 8 | Korea | Soonchunhyang University School of Medicine | AIS | 2019.01–2021.12 | 697 (405/292) | 4 SII groups:69.4 ± 13.3/67.1 ± 13.1/68.8 ± 13.8/71.4 ± 14.1 | ①②⑤⑨⑩⑭⑰⑱⑲ | Within 1 h after Admission | 7d | ACEI |
| 22 | Cheng 2024 (9) | P-S | 8 | China | the First People’s Hospital of Yancheng | AIS | 2022.01–2023.03 | 332 (203/129) | 68 (58–76) | ①②④⑤⑬ | The Next Morning | 3mos | J |
| 23 | Hao 2024 (11) | P-S | 7 | China | People’s Hospital of Zhengzhou University | AIS with IVT | 2020.01–2022.08 | 121 (78/43) | 63.8 ± 12.9 | ①②④⑥⑬⑲⑳ | Within 24 h after Ischemic Stroke Onset | Discharge | J |
| 24 | Chen GJ 2024 (14) | P-M | 8 | China | 111 hospitals(Clinical trials NCT03370939) | AIS with EVT | 2017.11–2019.03 | 1,002 (660/342) | 65 (55–72) | ①②④⑤ | The First Test on Admission & before EVT | 90d | AC |
| 25 | Fernández-Garza 2023 (35) | R-S | 9 | Mexico | University Hospital “Dr. José Eleuterio González” | AIS | 2018.01–2019.06 | 145 (97/48) | 61.5 ± 12.75 | ①②③⑥⑲ | Within 24 h of Admission | 90d | AG |
| 26 | Ma 2023 (37) | R-S | 9 | China | Jiangsu Province Hospital of Chinese Medicine | AIS with IVT | 2019.09–2022.12 | 190 (122/68) | 70.389 ± 11.675 | ①②④⑤⑥⑮⑯⑱㉒㉓ | Within 24 h of Admission | 3mos | ABI |
| 27 | Zhao 2023 (38) | R-S | 8 | China | Hebei general hospital | AIS with IVT | 2017.09–2022.08 | 281 (168/113) | 66 (56–73) | ①②③④⑤⑥ | Before IVT | 3mos | AE |
| 28 | Hu 2023 (39) | R-S | 8 | America | MIMIC-IV(the Beth Israel Deaconess Medical Center) | AIS Admitted to the ICU | 2008–2019 | 463 (221/242) | 71.68 ± 16.29 | ②④⑦⑧⑩⑪ | NR | Discharge | B |
| 29 | Zhang 2023 (40) | R-S | 8 | China | Changhai Hospital | AIS with EVT | 2019.01–2019.12 | 248 (160/188) | 67.19 ± 11.47 | ①②③④⑤㉔ | On Admission | 90 ± 14d | F |
| 30 | Chu 2023 (41) | R-S | 8 | China | Minhang Hospital of Fudan University | Mild AIS with IVT | 2017.01–2022.05 | 240 (81/159) | 66.00 (60.00–73.35) | ①②⑤ | Before IVT | 3mos | A |
| 31 | Gao 2023 (54) | R-S | 8 | China | Huai’an First People’s Hospital | AIS with IVT | 2019.07–2022.07 | 352 (240/112) | 66.46 ± 12.00 | ①②⑤⑥ | The Morning after Admission | 36 h | D |
| 32 | Wang S 2023 (36) | R-S | 7 | China | the First Affiliated Hospital of Soochow University | AIS with IVT | 2017.01–2022.08 | 717 (485/232) | 68 (58–75) | ①②③⑤⑥⑮⑯⑰ | NR | 3mos | A |
| 33 | Zhou 2023 (46) | R-S | 7 | China | The Affiliated Hospital of Guilin Medical College | AIS | 2020.01–2020.12 | 208 (143/65) | 63.3 ± 11.3 | ①②③④⑤ | Within 24 h of Admission | 3mos | AC |
| 34 | Xiao 2023 (43) | R-S | 6 | China | Guangzhou First People’s Hospital | AIS with PFO | 2021.02–2021.12 | 100 (78/22) | PFO groups 50.48 ± 8.86/Non-PFO groups 54.00 ± 10.30 | ①②③ | NR | NR | J |
| 35 | Dan-dan 2023 (44) | R-S | 6 | China | Affiliated Hospital of Xuzhou Medical University | Elderly AIS with IVT | 2019.08–2022.02 | 347 (228/119) | 60–93 (70.12 ± 7.71) | ①②⑤⑥ | NR | 3mos | AD |
| 36 | Shao 2023 (47) | R-S | 6 | China | Lianyungang Second People’s Hospital | Acute Lacunar Infarction | 2021.01–2022.06 | 172 (112/60) | BG-EPVS mild groups 63.35 ± 11.46/BG-EPVS Moderate-to-Severe groups 69.16 ± 10.13 | ①② | The Morning after Admission | 7d | J |
| 37 | Wang X 2023 (48) | R-S | 6 | China | the First Affiliated Hospital of Shihezi University Medical College | AIS with EVT | 2019.01–2022.12 | 682 (481/201) | 65.00(55.00, 76.00) | ①② | NR | 90d | A |
| 38 | Song 2023 (49) | R-S | 6 | China | Wafangdian Third Hospital | ACI | 2021.01–2022.05 | 310 (200/110) | 62.58 ± 10.27 | ①②③④⑤ | Within 24 h of Admission | 1mos | HJ |
| 39 | Wang YL 2023 (50) | R-S | 6 | China | Jianping County Hospital of traditional Chinese medicine | ACI with IVT | 2021.05–2022.09 | 100 (40/60) | 64.24 ± 9.22 | ①②④⑥ | NR | 3mos | A |
| 40 | Liu HT 2023 (51) | R-S | 6 | China | Northern Jiangsu People’s Hospital | AIS with AF & IVT | 2018.10–2022.11 | 514 (285/229) | AF-S groups 73.2 ± 10.2/Non-AF-S groups 66.1 ± 11.1 | ①②④⑤⑥⑮⑯ | Before IVT; Morning of The Second Day after Admission | 90d | ADJ |
| 41 | Dong 2023 (53) | R-S | 6 | China | Baoji Municipal Central Hospital | AIS-LVO with EVT | 2017.12–2022.06 | 219 (122/97) | 39–83 (61 ± 9) | ①②③④⑤ | Immediately after Admission | 90d | J |
| 42 | Huixin 2023 (55) | R-S | 6 | China | Xuanwu Hospital | ALVOS with EVT | 2019.01–2021.01 | 426 (282/144) | 65 (57, 74) | ①②③④⑤⑥ | Before EVT | 90d | A |
| 43 | Liu YY 2023 (56) | R-S | 6 | China | The Fifth Affiliated Hospital of Zhengzhou University | AIS | 2021.03–2022.10 | 22 (NR) | NR | ①②④⑥⑮⑱ | The Morning after Admission | 90d | A |
| 44 | Su 2023 (57) | R-S | 6 | China | Nanchong Mental Health Center of Sichuan Province | AIS with IVT | 2021.01–2022.08 | Model 272 (143/129); Verification 112 (54/58) | 63.02 ± 11.27 | ①④ | NR | 3mos | J |
| 45 | Lin 2023 (42) | P-S | 7 | China | Shunde Hospital of Southern Medical University | AIS | 2022.01–2022.09 | 177 (121/56) | FPG groups 63.04 ± 12.26/PPG groups 63.17 ± 13.44 | ①②③④⑥㉔ | Within 24 h On The Day of Admission | 90d | AGJ |
| 46 | Wang ZT 2023 (52) | P-S | 7 | China | the First Affiliated Hospital of China Medical University | AIS with IVT | 2020.09–2022.09 | 324 (219/105) | 65 (58, 71) | ①②④⑤ | Before IVT | 90d | AE |
| 47 | Li 2023 (45) | P-S | 6 | China | Xianyang Hospital of Yan’an University | Anterior Circulation AIS | 2020.10–2022.10 | 110 (83/27 | 62.03 ± 10.54 | NR | Within 24 h | 3mos | A |
| 48 | Zhang 2022 (59) | R-S | 9 | China | the First People’s Hospital of Yancheng | AIS with Carotid Atherosclerotic Plaque | 2020.06–2021.03 | 131 (98/33) | 61.86 ± 12.37 | ①②④⑥⑮⑱ | Within 24 h of Admission | 1mon | CJ |
| 49 | Liu 2022 (69) | R-S | 9 | China | Yantai Yuhuangding Hospital | AIS | 2020.08–2021.08 | 266 (160/106) | Mild groups 64.2 ± 10.0/Moderate-to-severe groups 66.2 ± 12.1 | ①②⑤⑮⑯ | Within 24 h after Onset | 90d | ADG |
| 50 | Wu 2022 (61) | R-S | 8 | America | MIMIC-IV(the Beth Israel Deaconess Medical Center) | AIS | 2008–2019 | 1,181 (600/581) | 69.1 ± 15.6 | ①②③④⑤⑧⑩⑪⑫⑭⑮⑯㉔ | The First Test Results At Icu. | 30d&90d | B |
| 51 | Yang 2022 (64) | R-S | 8 | China | West China Hospital | AIS-LVO with EVT | 2017.01–2021.01 | 379 (199/180) | 71 (58–78) | ①②③⑤⑰⑱ | Immediately Upon Arrival At The Emergency Room | NR | CD |
| 52 | Li 2022 (58) | R-S | 7 | China | Huizhou Central People’s Hospital | LAO-AIS after EVT | 2020.01–2022.01 | 173 (118/55) | 56.9 ± 8.9 | ①②③④⑤ | In The Emergency Department Or Within 1D of Admission | NR | J |
| 53 | Wenli Z 2022 (71) | R-S | 7 | China | Nanjing Municipal First Hospital | Acute Stroke with EVT | 2018.01–2020.06 | 88 (52/36) | 67.39 ± 28.21 | ①②③⑤ | NR | 3mos | AJ |
| 54 | Lin 2022 (63) | R-S | 6 | China | NR | AIS | 2017.01–2019.06 | 526 (277/249) | Definite AF groups 68.08 ± 12.16/Non-AF groups 78.61 ± 9.65 | ①②④⑥⑲⑳ | During Hospitalization, after Fasting For At Least 12 h | Discharge | J |
| 55 | Zhou 2022 (65) | R-S | 6 | China | The Affiliated Hospital of Guilin Medical University | AIS | 2020.01–2020.12 | 208 (143/65) | 63.3 ± 11.3 | ①②③④⑤ | Within 24 h | 3mos | A |
| 56 | Ma 2022 (68) | R-S | 6 | China | Urumqi Friendship Hospital | AIS with IVT | 2020.05–2021.08 | 63 (33/30) | 65.0 ± 11.0 | NR | Before IVT | 90d | A |
| 57 | Laiyun Z 2022 (70) | R-S | 6 | China | The Affiliated Hospital of Xuzhou Medical University | Young ACI | 2019.03–2021.03 | 182 (152/30) | FPG groups 40.00 (35.00, 44.00)/PPG groups 39.00 (34.00, 43.00) | ①② | Within 24 h of Admission | 3mos | AG |
| 58 | Chen 2022 (66) | R-S | 5 | China Taiwan | Taipei Tzu Chi Hospital | AIS | 2011.01–2021.04 | 3,402 (72 IHIS+3,330 OHIS) (1959/1443) | IHIS groups 75.3 (65.6–81.9)/OHIS groups 71.8 (61.7–81.5) | ①②③④⑤⑥⑦⑩ | Emergency Department Arrival/During Acute Attack of Stroke at Ward | Discharge | AB |
| 59 | Adiguzel 2022 (67) | R-S | 5 | Turkey | Hacettepe University Neurology Intensive Care and Stroke Unit | Severe AIS(NIHSS>10) | 2019–2021 | 205 (85/120) | 71 ± 15 | ①②⑤⑧⑨⑰㉔ | Within The First 12H after Stroke Onset | Discharge/3mos | ABFJ |
| 60 | Ji 2022 (62) | R-M | 8 | China | Jinling Hospital & Yijishan Hospital | Anterior Circulation LVOS with EVT | 2014.01–2018.12/2015.09–2021.07 | 675 (402/273) | 67.1 ± 11.4 | ①②⑤ | Within The First 24 h after Admission | 90d | AJ |
| 61 | Wang 2022 (60) | P-M | 8 | China | 201 hospitals(CNSR-III) | AIS | NR | 9,107 (6343/2764) | 61.9 ± 11.1 | ①②③④⑤⑥ | NR | 90d&1y | ABI |
| 62 | Zhong 2021 (79) | R-S | 8 | China | the First Affiliated Hospital of Kunming Medical University | AIS | 2017.02–2020.04 | 238 (131/107) | FPG groups 60.47 ± 13.25/PPG groups 68.86 ± 13.19 | ①②③④⑤⑥⑧⑲㉔ | Within 24 h of Admission | 3mos | AFG |
| 63 | Weng 2021 (75) | R-S | 8 | China | the Third Affiliated Hospital of Wenzhou Medical University | AIS with IVT | 2016.02–2019.04 | 216 (136/80) | 68.5 (59.25–76) | ①②③④⑤⑥ | Within 24 h after Admission | 3mos | ACG |
| 64 | Wei 2021 (76) | R-S | 8 | China | the General Hospital of the Eastern Theater Command | AIS | 2017.07–2017.12 | 116 (87/29) | 62.09 ± 12.42 | NR | AIS groups Admission/Control groups Fasted For More Than 12 h | 2y | IJ |
| 65 | Li LH 2021 (74) | R-S | 7 | China Taiwan | Taipei Veterans General Hospital | AIS within 3 h | 2016.01–2018.12 | 277 (157/120) | 73.2 ± 13.4 | ②③④ | Emergency Department Arrival | 1y | J |
| 66 | Cheng 2021 (77) | R-S | 6 | China | The Affiliated Hospital of Xuzhou Medical University | AIS | 2020.01–2020.12 | 305 (200/105) | SAP groups 75.77 ± 10.19//Non-SAP groups 61.68 ± 12.31 | ①②③④⑤⑥㉑㉔ | Within 24 h of Admission | 7d | F |
| 67 | Yi 2021 (73) | R-M | 7 | Korea | Soonchunhyang University Bucheon Hospital & St. Vincent’s Hospital | LAO-AIS with ET | 2015.01–2020.09 | 440 (260/180) | FPG groups 68.0 (13.4)/PPG groups 72.6 (11.7) | ①②③④⑤⑥ | On Admission | 3mos | ACDJ |
| 68 | Hu 2021 (72) | P-S | 9 | China | the First Affiliated Hospital of Wenzhou Medical University | AIS | 2014–2017 | 432 (272/151) | 62.58 ± 10.27 | ①②③④ | The Morning after Admission, 05:00–08:00 | 1mon | CHJ |
| 69 | Wei 2021 (76) | P-S | 6 | China | Affiliated Beijing Shijitan Hospital of Capital Medical University | ACI | 2018.03–2019.02 | 220 (137/83) | 60 ~ 93 (73.86 ± 8.58) | ①②③④⑤⑥⑧ | Within 24 h of Admission | Discharge | F |
| 70 | Zhao 2020 (81) | R-S | 8 | China | Subei People’s Hospital of Jiangsu Province | ACI | 2019.01–2019.07 | 140 (84/56) | 68.20 | ①②④ | Within The First 24 h after Admission. | 0.5y | A |
| 71 | Chu 2020 (82) | R-S | 6 | China Taiwan | Taipei Tzu Chi Hospital | AIS | 2010.05–2020.02 | 2,543 (1469/1074) | 70.8 ± 13.5 | ①②③④⑥⑦⑩ | Arrival In The Emergency Room | At Discharge | AJ |
| 72 | Ceng 2020 (80) | P-S | 9 | China | the First Affiliated Hospital of Zhengzhou University | AIS | 2015.01–2017.12 | SAP 1155 (NR);3 Month 1,106 (NR);1 Year 1,074 (721/434) | Non-SAP groups 59.51 ± 12.30/SAP groups 65.65 ± 13.22 | ①②③④⑤⑥ | Within 24 h | 3mos&1y | ABF |
| Case–control studies | |||||||||||||
| 73 | Dong 2024 (28) | R-S | 8 | China | Baoji Central Hospital | AIS | 2019.02–2021.02 | 307 (159/148) | PSD groups 59.52 ± 10.04/Non-PSD groups 61.76 ± 9.96 | ①②③④⑤ | Early Morning after Admission (05:00 ~ 08:00) | 30d | H |
| 74 | Zheng 2024 (33) | R-S | 6 | China | The Affiliated Hospital of Putian University | Massive Cerebral Infarction within 48 h | 2019.01–2021.11 | 82 (52/30) | FPG groups 68 (61.5, 80.5)/PPG groups 70 (57.5, 76) | ①②⑤⑥ | Within 24 h of Admission | Discharge | ADFJ |
| 75 | Zhou 2024 (19) | R-S | 6 | China | Wujin Hospital, Affiliated to Jiangsu University | AIS | 2020.01–2022.12 | 238 (161/77) | SAP groups 77.57 ± 8.69/Non-SAP groups 76.57 ± 9.36 | ①②④ | Within 24 h of Admission | 7d | F |
| 76 | Tianlu 2024 (24) | R-S | 6 | China | the First Affiliated Hospital of Harbin Medical University | AIS | 2020.01–2023.06 | 236 (143/93) | NR | ①②㉑ | NR | 7d | F |
| 77 | Yu 2024 (77) | R-S | 6 | China | China-Japan Union Hospital of Jilin University | AIS with EVT | 2021.01–2023.08 | 150 (103/47) | 68 (59, 72) | ①②④⑤⑥ | NR | NR | D |
| 78 | Niu 2024 (26) | R-S | 5 | China | Lijin County Central Hospital | AIS with IVT | 2021.07–2023.07 | 150 (83/67) | HT groups 49.63 ± 9.52/Non-HT groups 50.89 ± 9.66 | ⑭ | The Next Morning | NR | D |
Characteristics of studies investigating the relationship between SII and AIS.
ACI, Acute Cerebral Infarction; AF, Atrial fibrillation; AF-S, Atrial fibrillation Stroke; AIS, Acute Ischemic Stroke; AIS-LVO, Acute Ischemic Stroke with Large Vessel Occlusion; ALVOS, Acute Large Vessel Occlusive Stroke; BG-EPVS, Basal Ganglia-Enlarged Perivascular Spaces; BG-EPVS, Basal Ganglia Region Enlarged Perivascular Spaces; CNSR-III, China National Stroke Registry III; CSO-EPVS, Central Semi-ovale Region Enlarged Perivascular Spaces; DNI, Delayed Neurological Improvement; END, Early Neurological Deterioration; EVT, Endovascular Treatment; FPE, First Pass Effect; FPG, Favorable Prognosis groups; HT, Hemorrhagic Transformation; ICA, Internal Carotid Artery; IHIS, In-hospital Ischemic Stroke; IS, Ischemic Stroke; LAO-AIS, Large Artery Occlusion-Acute Ischemic Stroke; LAA, Large Artery Atherosclerosis; LVOS, Large-vessel Occlusive Stroke; MCE, Malignant Cerebral Edema; MIMIC-IV, Medical Information Mart for Intensive Care-IV; MT, mechanical thrombectomy; NOS, Newcastle–Ottawa Scale; NIHSS, National Institutes of Health Stroke Scale; NR, Not Reported; OHIS, Out-of-hospital Ischemic Stroke; PCI, Progressive Cerebral Infarction; PFO, Patent Foramen Ovale; PPG, Poor Prognosis groups; PSCI, Post-stroke Cognitive Impairment; PSD, Post-stroke Depression; PSP, Poststroke Pneumonia; PIS, Progressive Ischemic Stroke; R, Retrospective; SAP, Stroke-Associated Pneumonia; SHS, Stroke-heart Syndrome; SII, Systemic Immune-inflammation Index; sICH, Symptomatic Intracerebral Hemorrhage; IVT, Intravenous Thrombolysis; ICU, Intensive Care Unit; fDNI, Failure of Delayed Neurological Improvement.
R, Retrospective; P, Prospective; S, Single-center; M, Multi-center. M, Male; F, Female; h, hours; d, day; y, year; mon, month; mos, months; w, week.
① Hypertension; ② Diabetes; ③ Dyslipidaemia; ④ Heart Diseases (Coronary Heart Disease/Heart Failure/Myocardial Infarction, etc.); ⑤ Atrial Fibrillation; ⑥ Previous Cerebrovascular Diseases (Stroke/TIA, etc.); ⑦ Kidney Diseases; ⑧ Respiratory Diseases (Asthma/Chronic Obstructive Pulmonary Disease, etc.); ⑨ Infections; ⑩ Cancer; ⑪ Dementia; ⑫ Peripheral Arterial Diseases; ⑬ Carotid Diseases (Carotid Plaque/Carotid Atherosclerosis/Carotid Artery Stenosis, etc.); ⑭ Other Diseases; ⑮ Antiplatelets; ⑯ Anticoagulants; ⑰ Antithrombotics; ⑱ Statins; ⑲ IVT; ⑳ EVT; ㉑ Antibiotics; ㉒ Antihypertensive Drugs; ㉓ Hypoglycemic Drugs; ㉔ Other Drugs or Therapies.
A, Poor Prognosis; B, Mortality; C, Admission NIHSS; D, HT/sICH; E, END; F, SAP/PSP; G, AIS Severity; H, PSD; I, Stroke Progression/Recurrence; J, Others.
Table 2
| Cohort studies | ||||||||||
|---|---|---|---|---|---|---|---|---|---|---|
| No. | Study | Total | Selection | Comparability | Outcome | |||||
| 1 | 2 | 3 | 4 | 1 | 1 | 2 | 3 | |||
| Representativeness of the exposed cohort | Selection of the non-exposed cohort | Ascertainment of exposure | Demonstration that outcome of interest was not present at start of study | Comparability of cohorts on the basis of the design or analysis | Assessment of outcome | Was follow-up long enough for outcomes to occur | Adequacy of follow-up of cohorts | |||
| 1 | Yang Y 2024 (5) | 8 | ☆ | ☆ | ☆ | ☆ | ☆☆ | × | ☆ | ☆ |
| 2 | Huang SW 2024 (1) | 8 | ☆ | ☆ | ☆ | ☆ | ☆☆ | ☆ | ☆ | × |
| 3 | Arslan 2024 (6) | 7 | ☆ | ☆ | ☆ | ☆ | ☆ | ☆ | × | ☆ |
| 4 | Zhu 2024 (7) | 7 | ☆ | ☆ | ☆ | ☆ | ☆☆ | × | × | ☆ |
| 5 | Cao 2024 (8) | 8 | ☆ | ☆ | ☆ | ☆ | ☆☆ | × | ☆ | ☆ |
| 6 | Cheng 2024 (9) | 8 | ☆ | ☆ | ☆ | ☆ | ☆☆ | × | ☆ | ☆ |
| 7 | Misirlioglu 2024 (10) | 6 | ☆ | ☆ | ☆ | ☆ | × | ☆ | × | ☆ |
| 8 | Hao 2024 (11) | 7 | ☆ | ☆ | ☆ | × | ☆☆ | ☆ | × | ☆ |
| 9 | Lee 2024 (12) | 8 | ☆ | ☆ | ☆ | ☆ | ☆☆ | ☆ | × | ☆ |
| 10 | Wang N 2024 (13) | 9 | ☆ | ☆ | ☆ | ☆ | ☆☆ | ☆ | ☆ | ☆ |
| 11 | Chen GJ 2024 (14) | 8 | ☆ | × | ☆ | ☆ | ☆☆ | ☆ | ☆ | ☆ |
| 12 | Zhang LL 2024 (15) | 9 | ☆ | ☆ | ☆ | ☆ | ☆☆ | ☆ | ☆ | ☆ |
| 13 | Wei 2024 (16) | 9 | ☆ | ☆ | ☆ | ☆ | ☆☆ | ☆ | ☆ | ☆ |
| 14 | Zhao 2024 (17) | 7 | ☆ | ☆ | ☆ | ☆ | ☆ | ☆ | × | ☆ |
| 15 | Guoqing 2024 (18) | 7 | ☆ | ☆ | ☆ | ☆ | ☆ | ☆ | ☆ | × |
| 16 | Mengting 2024 (20) | 6 | ☆ | ☆ | ☆ | ☆ | ☆ | × | ☆ | × |
| 17 | Zhouquan 2024 (23) | 6 | ☆ | ☆ | ☆ | ☆ | ☆ | × | ☆ | × |
| 18 | Jiaxiang 2024 (25) | 6 | ☆ | ☆ | ☆ | ☆ | ☆ | × | ☆ | × |
| 19 | Ma L 2024 (21) | 7 | ☆ | ☆ | ☆ | ☆ | ☆ | × | ☆ | ☆ |
| 20 | Zhang J 2024 (27) | 5 | ☆ | ☆ | ☆ | ☆ | ☆ | × | × | × |
| 21 | Huang H 2024 (29) | 7 | ☆ | ☆ | ☆ | ☆ | ☆ | ☆ | × | ☆ |
| 22 | Haimei 2024 (30) | 5 | ☆ | ☆ | ☆ | ☆ | × | × | ☆ | × |
| 23 | Lijun 2024 (31) | 5 | ☆ | ☆ | ☆ | ☆ | × | × | ☆ | × |
| 24 | Zhang MK 2024 (32) | 9 | ☆ | ☆ | ☆ | ☆ | ☆☆ | ☆ | ☆ | ☆ |
| 25 | Lin 2023 (42) | 7 | ☆ | ☆ | ☆ | ☆ | ☆ | × | ☆ | ☆ |
| 26 | Xiao 2023 (43) | 6 | ☆ | ☆ | ☆ | ☆ | ☆☆ | × | × | × |
| 27 | Dan-dan 2023 (44) | 6 | ☆ | ☆ | ☆ | ☆ | × | ☆ | ☆ | × |
| 28 | Zhou 2023 (46) | 7 | ☆ | ☆ | ☆ | ☆ | ☆ | ☆ | ☆ | × |
| 29 | Shao 2023 (47) | 6 | ☆ | ☆ | ☆ | × | ☆ | ☆ | ☆ | × |
| 30 | Wang X 2023 (48) | 6 | ☆ | ☆ | ☆ | ☆ | × | × | ☆ | ☆ |
| 31 | Song 2023 (49) | 6 | ☆ | ☆ | ☆ | ☆ | ☆ | × | ☆ | × |
| 32 | Wang YL 2023 (50) | 6 | ☆ | ☆ | ☆ | ☆ | ☆ | × | ☆ | ☆ |
| 33 | Liu HT 2023 (51) | 6 | ☆ | ☆ | ☆ | ☆ | ☆ | c | ☆ | × |
| 34 | Wang ZT 2023 (52) | 7 | ☆ | ☆ | ☆ | ☆ | ☆☆ | × | ☆ | × |
| 35 | Dong 2023 (53) | 6 | ☆ | ☆ | ☆ | ☆ | ☆ | × | ☆ | × |
| 36 | Gao 2023 (54) | 8 | ☆ | ☆ | ☆ | ☆ | ☆☆ | × | ☆ | ☆ |
| 37 | Huixin 2023 (55) | 6 | ☆ | ☆ | ☆ | ☆ | × | × | ☆ | × |
| 38 | Liu YY 2023 (56) | 6 | ☆ | ☆ | ☆ | ☆ | × | ☆ | ☆ | ☆ |
| 39 | Su 2023 (57) | 6 | ☆ | ☆ | ☆ | ☆ | ☆ | × | ☆ | × |
| 40 | Fernández-Garza 2023 (35) | 9 | ☆ | ☆ | ☆ | ☆ | ☆☆ | ☆ | ☆ | ☆ |
| 41 | Wang S 2023 (36) | 7 | ☆ | ☆ | ☆ | ☆ | × | ☆ | ☆ | ☆ |
| 42 | Ma 2023 (37) | 9 | ☆ | ☆ | ☆ | ☆ | ☆☆ | ☆ | ☆ | ☆ |
| 43 | Zhao 2023 (38) | 8 | ☆ | ☆ | ☆ | ☆ | ☆☆ | × | ☆ | ☆ |
| 44 | Hu 2023 (39) | 8 | ☆ | ☆ | ☆ | ☆ | ☆☆ | ☆ | ☆ | × |
| 45 | Zhang 2023 (40) | 8 | ☆ | ☆ | ☆ | ☆ | ☆ | ☆ | ☆ | ☆ |
| 46 | Chu 2023 (41) | 8 | ☆ | ☆ | ☆ | ☆ | ☆ | ☆ | ☆ | ☆ |
| 47 | Li 2023 (45) | 6 | ☆ | ☆ | ☆ | ☆ | × | ☆ | ☆ | × |
| 48 | Ma 2022 (68) | 6 | ☆ | ☆ | ☆ | ☆ | × | ☆ | ☆ | × |
| 49 | Liu 2022 (69) | 9 | ☆ | ☆ | ☆ | ☆ | ☆☆ | ☆ | ☆ | ☆ |
| 50 | Laiyun Z 2022 (70) | 6 | ☆ | ☆ | ☆ | ☆ | ☆ | × | ☆ | × |
| 51 | Wenli Z 2022 (71) | 7 | ☆ | ☆ | ☆ | ☆ | ☆ | ☆ | ☆ | × |
| 52 | Li 2022 (58) | 7 | ☆ | ☆ | ☆ | ☆ | ☆ | ☆ | × | ☆ |
| 53 | Zhang 2022 (59) | 9 | ☆ | ☆ | ☆ | ☆ | ☆☆ | ☆ | ☆ | ☆ |
| 54 | Wang 2022 (60) | 8 | ☆ | ☆ | ☆ | ☆ | ☆☆ | × | ☆ | ☆ |
| 55 | Wu 2022 (61) | 8 | ☆ | ☆ | ☆ | ☆ | ☆☆ | × | ☆ | ☆ |
| 56 | Ji 2022 (62) | 8 | ☆ | ☆ | ☆ | ☆ | ☆☆ | × | ☆ | ☆ |
| 57 | Lin 2022 (63) | 6 | ☆ | ☆ | ☆ | ☆ | × | ☆ | ☆ | ☆ |
| 58 | Yang 2022 (64) | 8 | ☆ | ☆ | ☆ | ☆ | ☆☆ | ☆ | × | ☆ |
| 59 | Zhou 2022 (65) | 6 | ☆ | ☆ | ☆ | ☆ | ☆ | × | ☆ | ☆ |
| 60 | Chen 2022 (66) | 5 | ☆ | ☆ | ☆ | ☆ | × | ☆ | × | × |
| 61 | Adiguzel 2022 (67) | 5 | ☆ | ☆ | ☆ | ☆ | × | × | ☆ | × |
| 62 | Wei L 2021 (76) | 6 | ☆ | ☆ | ☆ | ☆ | ☆☆ | × | × | × |
| 63 | Cheng 2021 (77) | 6 | ☆ | ☆ | ☆ | ☆ | ☆ | × | ☆ | × |
| 64 | Zhong 2021 (79) | 8 | ☆ | ☆ | ☆ | ☆ | ☆☆ | × | ☆ | ☆ |
| 65 | Hu 2021 (72) | 9 | ☆ | ☆ | ☆ | ☆ | ☆☆ | ☆ | ☆ | ☆ |
| 66 | Yi 2021 (73) | 7 | ☆ | ☆ | ☆ | ☆ | ☆ | ☆ | ☆ | × |
| 67 | Li LH 2021 (74) | 7 | ☆ | ☆ | ☆ | ☆ | ☆ | ☆ | ☆ | × |
| 68 | Weng 2021 (75) | 8 | ☆ | ☆ | ☆ | ☆ | ☆☆ | ☆ | ☆ | × |
| 69 | Wei-shi 2021 (78) | 8 | ☆ | ☆ | ☆ | ☆ | ☆☆ | ☆ | ☆ | × |
| 70 | Ceng 2020 (80) | 9 | ☆ | ☆ | ☆ | ☆ | ☆☆ | ☆ | ☆ | ☆ |
| 71 | Zhao 2020 (81) | 8 | ☆ | ☆ | ☆ | ☆ | ☆☆ | ☆ | ☆ | × |
| 72 | Chu 2020 (82) | 6 | ☆ | ☆ | ☆ | ☆ | ☆ | ☆ | × | × |
| 73 | Wang SN 2024 (34) | 4 | ☆ | ☆ | ☆ | ☆ | × | × | × | × |
| Case–control studies | ||||||||||
|---|---|---|---|---|---|---|---|---|---|---|
| No. | Study | Total | Selection | Comparability | Exposure | |||||
| 1 | 2 | 3 | 4 | 1 | 1 | 2 | 3 | |||
| Adequate case-definition | Representativeness of the cases | Selection of controls | Definition of controls | Comparability of cases and controls on the basis of the design or analysis | Ascertainment of exposure | Same Method of ascertainment for cases and controls | Non-response rate | |||
| 1 | Zheng 2024 (33) | 6 | ☆ | ☆ | ☆ | ☆ | × | ☆ | × | ☆ |
| 2 | Zhou 2024 (19) | 6 | ☆ | ☆ | ☆ | ☆ | ☆ | × | ☆ | × |
| 3 | Tianlu 2024 (24) | 6 | ☆ | ☆ | ☆ | ☆ | ☆ | × | ☆ | × |
| 4 | Yu 2024 (77) | 6 | ☆ | ☆ | ☆ | ☆ | ☆ | × | × | ☆ |
| 5 | Niu 2024 (26) | 5 | ☆ | ☆ | ☆ | ☆ | ☆ | × | × | × |
| 6 | Dong 2024 (28) | 8 | ☆ | ☆ | ☆ | ☆ | ☆☆ | ☆ | × | ☆ |
Quality assessment based on the Newcastle–Ottawa Scale (NOS).
*Wang SN 2024 (34) was excluded from the meta-analysis because of low quality (Nos ≤ 4). The meanings of the ☆, ☆☆, and × can be found at the official instruction website of the NOS scale: https://www.ohri.ca/programs/clinical_epidemiology/oxford.asp.
3.2 Study characteristics
This systematic review and meta-analysis encompassed 40,682 individuals; the sample size ranged from a minimum of 22 (56) to a maximum of 9,107 (60). Not all studies reported the sex distribution and age data, preventing the accurate calculation of these data. Geographically, 68 studies were conducted in China (1, 5, 7–9, 11, 13–33, 36–38, 40–60, 62–65, 68–72, 75–81), 11 studies were conducted in other states or area including Turkey (n = 3) (6, 10, 67), China Taiwan (n = 3) (66, 74, 82), America (n = 2) (61), Korea (n = 2) (12, 73), Mexico (n = 1) (35). Moreover, studies (1, 5–8, 10, 13, 15–33, 35–41, 43, 44, 46–51, 53–59, 61–71, 73–75, 77–79, 81, 82) were retrospective, and 11 studies (9, 11, 12, 14, 42, 45, 52, 60, 72, 76, 80) were prospective. At the same time, 73 studies (5–13, 15–33, 35–59, 61, 63–72, 74–82) were single-center, and 5 studies (1, 14, 60, 62, 73) were multi-center. The number of studies reporting data on outcomes were as follows: poor prognosis (n = 43) (1, 6–8, 12–14, 16–18, 20, 21, 23, 33, 35–38, 41, 42, 44–46, 48, 50–52, 55, 56, 60, 62, 65–71, 73, 75, 79–82), mortality (n = 12) (1, 5, 6, 10, 16, 37, 39, 60, 61, 66, 67, 80), severity (n = 9) (7, 21, 31, 35, 42, 69, 70, 75, 79), HT/sICH (n = 12) (8, 13, 16, 22, 26, 33, 44, 51, 54, 64, 69, 73), END (n = 8) (12, 13, 16, 21, 25, 29, 38, 52), SAP/PSP (n = 10) (19, 24, 30, 33, 40, 67, 76, 77, 79, 80), PSD (n = 3) (28, 49, 72), progression/recurrence (n = 4) (12, 37, 60, 78), admission NIHSS (n = 11) (5, 12–14, 16, 46, 59, 64, 72, 73, 75), and other complications (n = 25) (1, 9, 11, 15, 27, 32, 33, 42, 43, 47, 49, 51, 53, 57–59, 62, 63, 67, 71–74, 78, 82).
3.3 Predictive value of SII for AIS poor prognosis (primary outcome)
3.3.1 Predictive value of continuous SII for AIS poor prognosis
A total of 32 studies (1, 6–8, 14, 16–18, 20, 21, 23, 33, 35–38, 41, 42, 48, 50, 51, 55, 66–71, 73, 79, 81, 82), which included 42 designs and involved 14,915 AIS patients, were included. Among them, 6,198 patients were in the poor prognosis groups, and 8,717 were in the favorable prognosis groups. A total of 16 studies (8, 14, 16, 17, 23, 36, 37, 42, 50, 55, 68–71, 73, 79) with 20 designs adopted the guideline-recommended 3-month modified Rankin Scale (mRS) 3–6 as the poor prognostic criterion (83). Ultimately, 26 studies came from China (1, 7, 8, 14, 16–18, 20, 21, 23, 33, 36–38, 41, 42, 48, 50, 51, 55, 68–71, 79, 81), and 6 from other countries and regions (6, 35, 66, 67, 73, 82). In the meantime, 12 studies mentioned IVT (16–18, 20, 21, 23, 36, 38, 41, 50, 51, 68), 6 mentioned EVT (8, 14, 48, 55, 71, 73), and 14 used pure medication therapy (1, 6, 7, 33, 35, 37, 42, 66, 67, 69, 70, 79, 81, 82). I2 = 89.9% > 50%, Q statistics p = 0.000, indicating a high level of heterogeneity among 42 designs. Meta-regression was conducted with effect size (ES) as the dependent variable and the 5 possible sources of heterogeneity (mRS rating, follow-up time, treatment modality, regional distribution, and mRS rating + follow-up time) as independent variables. The meta-regression results showed that for the 5 independent variables, all p-values were > 0.05 (0.444; 0.380; 0.275; 0.745; 0.643), indicating that the heterogeneity was not related to these 5 factors, and the source of heterogeneity needs to be further explored. Random-effects model showed the baseline SII value was significantly higher in poor prognosis groups (SMD = 248.13, 95% CI: 198.77 to 297.50, p = 0.000, Figure 2A), meaning that the SII value of the poor prognosis groups was 248.13 × 10⁹/L higher than that of the favourable prognosis groups significantly. Figure 3A shows the funnel plot was asymmetric, Begg p = 0.319 > 0.05, Egger p = 0.004 < 0.05, indicating a slight publication bias in the 42 designs. After applying the trim-and-fill method, the significance of the overall effect size and the heterogeneity did not change, suggesting that publication bias did not distort the conclusions of this meta-analysis (Figure 3B).
Figure 2

Forest plots of associations between AIS poor prognosis and SII. (A) Continuous SII value in poor prognosis groups vs. favorable prognosis groups; (B) Pooled OR of continuous SII in predicting poor prognosis; (C) The sample size of poor prognosis patients in high SII groups vs. low SII groups; (D) Pooled OR of high SII in predicting poor prognosis.
Figure 3

Funnel plots and trim-and-fill plots of associations between AIS poor prognosis and SII. (A) Funnel plot-continuous SII value in poor prognosis groups vs. favorable prognosis groups; (B) Trim-and-fill plot-continuous SII value in poor prognosis groups vs. favorable prognosis groups; (C) Funnel plot-pooled OR of continuous SII in predicting poor prognosis; (D) Trim-and-fill plot-pooled OR of continuous SII in predicting poor prognosis; (E) Funnel plot-the sample size of poor prognosis patients in high SII groups vs. low SII groups; (F) Funnel plot-pooled OR of high SII in predicting poor prognosis.
A total of fourteen studies (6, 14, 16–18, 20, 21, 23, 45, 50, 52, 69, 79, 81), with 15 designs, evaluated the aORs of continuous SII in predicting AIS poor prognosis. High heterogeneity was found (I2 = 90.9%, Q-statistic, p = 0.000). Meta-regression indicated that neither follow-up time nor treatment modality was a source of heterogeneity (p = 0.578; 0.489). Figure 2B shows a trend: with an increase in continuous SII, the incidence of poor prognosis may be slightly higher (OR = 1.004, 95% CI: 1.002 to 1.005, p = 0.000). The funnel plot in Figure 3C shows a specific publication bias in the 15 designs (Begg p = 0.020, Egger p = 0.834). The trim-and-fill analysis showed that the number of imputed missing studies was negligible, and the adjusted effect size (OR = 1.003, 95% CI: 1.002 to 1.005, p = 0.000) was almost consistent with the unadjusted one (Figure 3D).
Additionally, 2 studies involved aORs of SII per 1 standard deviation (SD) to predict AIS poor prognosis. Chen GJ 2024 (14) reported aOR = 1.241 (95% CI: 1.051 to 1.465), and Huang SW 2024 (1) reported aOR = 1.191 (95% CI: 1.006 to 1.410), indicating that for every 1 SD increase in SII, the likelihood of a poor prognosis increases in AIS patients.
3.3.2 Predictive value of categorized SII for AIS poor prognosis
A total of 10 studies (12–14, 16, 44–46, 60, 65, 75), with 11 designs, provided data on the sample size of poor/favorable prognosis patients in both high and low SII groups; all criteria of poor prognosis were mRS 3–6. Among 21,719 patients, 5,761 were in high SII groups, and 15,958 were in low SII groups. High heterogeneity was noted (I2 = 92.9%, Q statistics p = 0.000), and meta-regression showed follow-up time, regional distribution, and treatment modality were not sources of heterogeneity (p = 0.590; 0.459; 0.593). Subgroup analysis by treatment modality in Figure 2C revealed less within-group heterogeneity. A random-effects model for all designs indicated RR = 1.95 (95% CI: 1.66 to 2.28, p = 0.000), meaning patients with High SII were 1.95 times more likely to have a poor prognosis significantly. The almost symmetrical funnel plot (Begg p = 0.876, Egger p = 0.134) suggests that there is no expected publication bias, as shown in Figure 3E.
A total of 16 studies (1, 8, 12, 14, 32, 35, 37, 38, 46, 51, 60, 62, 65, 70, 75, 80) with 19 designs reported aORs of categorized SII in predicting poor prognosis. Among them, CAO 2024 (8) with 2 designs was removed as its aOR = 1.000 (95% CI: 1.000 to 1.000) made log-conversion in STATA difficult. The remaining studies had substantial heterogeneity (I2 = 92.8%, Q-statistic p = 0.000). Meta-regression showed that four variables (follow-up time, regional distribution, treatment modality, and mRS rating+follow-up time) were not the source of heterogeneity (p = 0.866; 0.893; 0.710; 0.949 > 0.05). Figure 2D shows that the random-effects model pooled OR = 1.007 (95% CI: 0.998 to 1.015, p = 0.120), indicating a higher but non-significantly poor prognosis risk in the high SII groups compared to the low SII groups. Funnel plots for the 17 designs were symmetrical, and bias tests (Begg p = 0.760, Egger p = 0.833) suggested likely no publication bias in the designs (Figure 3F).
3.4 Predictive value of SII for AIS secondary outcomes (mortality, severity, HT/sICH, END, PSD, progression/recurrence, and other complications)
3.4.1 Continuous SII
Continuous SII values were listed in both the death, mild severity, HT/sICH, SAP/PSP, END, PSD, Progression/Recurrence groups, and the corresponding control groups, including 5 (5, 6, 16, 66, 67), 6 (21, 31, 42, 69, 70, 79), 8 (8, 22, 26, 33, 44, 51, 54, 69), 10 (19, 24, 30, 33, 40, 67, 76, 77, 79, 80), 7 (13, 16, 21, 25, 29, 38, 52), and 3 (28, 49, 72), 1 (27) studies. The baseline SII value was significantly higher in the death groups, SMD = [369.889 (95% CI: 274.957 to 464.822), p = 0.000, I2 = 0.0%, Q statistics p = 0.545, fixed, Figure 4A; Begg p = 0.707, Egger p = 0.150, Figure 5A]; mild severity groups SMD = [−366.98 (95% CI: −524.43 to −209.53), p = 0.000, I2 = 87.7%, Q statistics p = 0.000, random, Figure 4D; Begg p = 1.000, Egger p = 0.166, Figure 5D]; HT/sICH groups [Excluding NIU 2024 (26), one design of Gao 2023 (54) and one design of Cao 2024 (8), SMD = 444.540 (95% CI: 377.566 to 511.514), p = 0.000, I2 = 0.0%, Q statistics p = 0.502, fixed, Figure 4F; Begg p = 0.371, Egger p = 0.274, Figure 5E]; SAP/PSP (Excluding Tianlu 2024 (24), SMD = 634.39 (95% CI: 556.60 to 712.18), p = 0.000, I2 = 32.8%, Q statistics p = 0.156, fixed, Figure 4J; Begg p = 0.34, Egger p = 0.311, Figure 5G]; END (Excluding Wang ZT 2023 (52), SMD = 255.72 (95% CI: 186.61 to 324.83), p = 0.000, I2 = 51.1%, Q statistics p = 0.069, fixed, Figure 4L; Begg p = 0.707, Egger p = 0.536, Figure 5H]; PSD SMD = [73.21(95% CI: 59.41 to 87.01), p = 0.000, I2 = 7.2%, Q statistics p = 0.341, fixed, Figure 4P]; Progression/Recurrence groups [Progression/Recurrence groups SII = 557.00 (345.00, 832.88); Non-Progression/Recurrence groups SII = 420.63 (310.58, 546.48), p = 0.011].
Adjusted ORs of continuous SII in predicting AIS mortality, mild severity, HT/sICH, SAP/PSP, and END were reported in 2 (6, 16), 5 (7, 21, 42, 69, 79), 4 (22, 26, 54, 69), 4 (19, 24, 77, 79), and 5 (16, 21, 25, 29, 52) studies. Except for severity, the incidence of adverse outcomes could be higher with an increase significantly in continuous SII, Mortality pooled OR = [2.592 (95% CI: 1.046 to 6.421), p = 0.040]; severity pooled OR = [1.001(95% CI: 0.998 to 1.003), p = 0.718, I2 = 88.0%, Q statistics p = 0.000, random, Figure 4E]; HT/sICH pooled OR = [1.001 (95% CI: 0.999 to 1.002), p = 0.000, I2 = 90.2%, Q statistics p = 0.000, random, Figure 4G]; SAP/PSP pooled OR = [1.46 (95% CI: 1.05 to 2.03), p = 0.000, I2 = 74.7%, Q statistics p = 0.008, random, Figure 4K]; END pooled OR = [1.003 (95% CI: 0.999 to 1.008), p = 0.123, I2 = 93.6%, Q statistics p = 0.000, random, Figure 4M].
Huang SW 2024 (1) mentioned SII per 1 SD to predict mortality, aHR = 1.195 (95% CI: 1.072 to 1.332), p = 0.001. Yang 2022 (64) mentioned SII per 10 SD to predict HT/sICH, aOR = 1.005 (95% CI: 1.002 to 1.008), p = 0.002.
Figure 4

Forest plots of associations between AIS secondary outcomes and SII. (A) Continuous SII value in death groups vs. survival groups; (B) The sample size of death patients in high SII groups vs. low SII groups; (C) Pooled HR of high SII in predicting mortality; (D) Continuous SII value in mild severity groups vs. mild-moderate severity groups; (E) Pooled OR of continuous SII in predicting severity; (F) Continuous SII value in HT/sICH groups vs. non-HT/sICH groups; (G) Pooled OR of continuous SII in predicting HT/sICH; (H) The sample size of HT/sICH patients in high SII groups vs. low SII groups; (I) Pooled OR of high SII in predicting HT/sICH; (J) Continuous SII value in SAP/PSP groups vs. non-SAP/PSP groups; (K) Pooled OR of continuous SII in predicting SAP/PSP; (L) Continuous SII value in END groups vs. non-END groups; (M) Pooled OR of continuous SII in predicting END; (N) The sample size of END patients in high SII groups vs. low SII groups; (O) Pooled OR of high SII in predicting END; (P) Continuous SII value in PSD groups vs. survival groups; (Q) Pooled OR of high SII in predicting PSD; (R) The sample size of progression/recurrence patients in high SII groups vs. low SII groups; (S) Admission NIHSS in high SII groups vs. low SII groups.
Figure 5
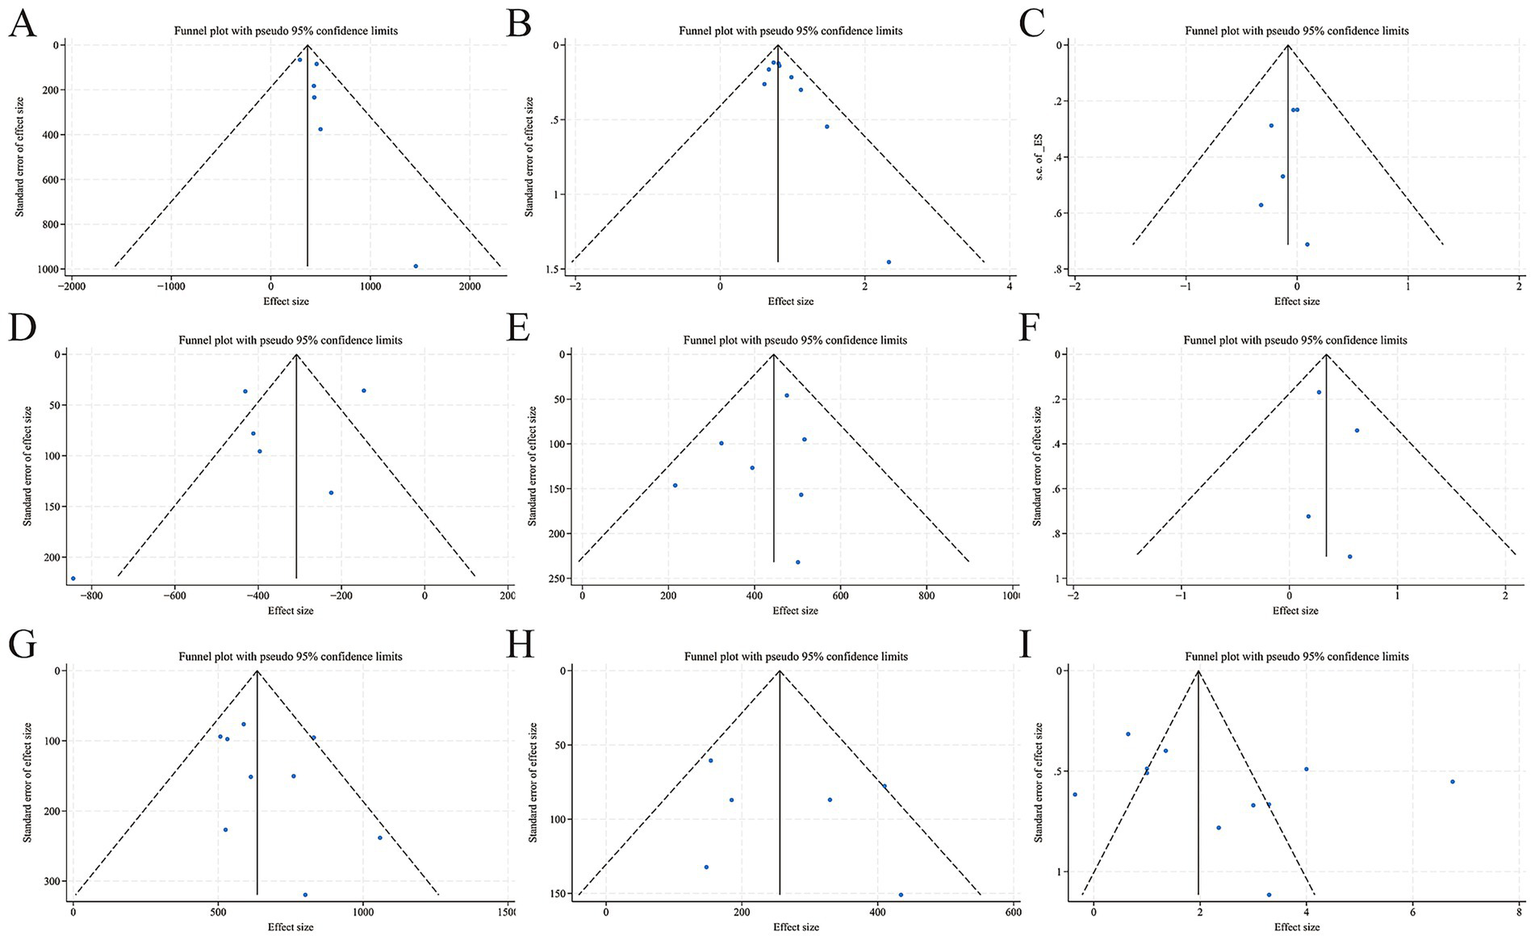
Funnel plots of associations between AIS poor prognosis and SII. (A) Continuous SII value in death groups vs. survival groups; (B) The sample size of death patients in high SII groups vs. low SII groups; (C) Pooled HR of high SII in predicting mortality; (D) Continuous SII value in mild severity groups vs. mild-moderate severity groups; (E) Continuous SII value in HT/sICH groups vs. non-HT/sICH groups; (F) The sample size of HT/sICH patients in high SII groups vs. low SII groups; (G) Continuous SII value in SAP/PSP groups vs. non-SAP/PSP groups; (H) Continuous SII value in END groups vs. non-END groups; (I) Admission NIHSS in high SII groups vs. low SII groups.
3.4.2 Categorized SII
The sample size of death, HT/sICH, END, progression/recurrence patients in both High SII vs. Low SII groups was listed, including 6 (5, 16, 37, 39, 60, 61), 3 (13, 16, 73), 3 (12, 13, 16), 3 (12, 37, 60) studies. The sample size of adverse outcomes patients of high SII groups were significantly higher than low SII groups, death pooled RR = [2.26 (95% CI: 2.01 to 2.55, p = 0.000, I2 = 0%, Q statistics p = 0.649, fixed, Figure 4B; Begg p = 0.076, Egger p = 0.036, Figure 5B]; HT/sICH pooled RR = [1.41 (95% CI: 1.06 to 1.88), p = 0.019, I2 = 0.0%, Q statistics p = 0.808, fixed, Figure 4H; Begg p = 0.734, Egger p = 0.601, Figure 5F]; END pooled RR = [2.07 (95% CI: 1.66 to 2.59), p = 0.000, I2 = 0.0%, Q statistics p = 0.402, fixed, Figure 4N]; Progression/Recurrence pooled RR = [1.39 (95% CI: 1.25 to 1.54), p = 0.000, I2 = 0.0%, Q statistics p = 0.490, fixed, Figure 4R].
Adjusted ORs of categorized SII in predicting AIS mortality, severity, HT/sICH, SAP/PSP, END, PSD, Progression/Recurrence were reported in 2 (5, 80), 1 (35), 4 (8, 44, 51, 64), 2 (76, 80), 3 (12, 13, 38), 3 (28, 49, 72), and 1 (27) studies. Except for END, the risk of adverse outcomes in high SII groups was significantly higher than in low SII groups, mortality pooled OR = [Ceng 2020 (80) ① 90d: 7.332 (95% CI: 1.608 to 33.419, p = 0.01; ② 1y: 5.15 (95% CI: 1.918 to 13.841), p = 0.001; Yang Y 2024 (5) 4.671(95% CI: 1.379 to 15.826), p = 0.013]; severity pooled OR = [7.462 (95% CI: 1.666 to 33.333), p = 0.009]; HT/sICH pooled OR = [Excluding CAO 2024 (8), 3.04 (95% CI: 0.84 to 8.99), p = 0.000, I2 = 93.4%, Q statistics p = 0.000, random, Figure 4I]; SAP/PSP pooled OR = [Ceng 2020 (80) 6.803 (95% CI: 3.251 to 14.236), p = 0.000; Wei 2021 (76) 0.999 (95% CI: 0.998 to 1.000), p = 0.060], END pooled OR = [1.74(95% CI: 0.82 to 3.68), p = 0.150, I2 = 85.1%, Q statistics p = 0.001, random, Figure 4O]; PSD pooled OR = [2.34 (95% CI: 1.81 to 3.07), p = 0.000, I2 = 0.0%, Q statistics p = 0.891, fixed, Figure 4Q]; Progression/Recurrence pooled OR = [1.003(95% CI: 1.000485 to 1.005), p = 0.017].
Adjusted HRs of categorized SII in predicting AIS mortality were reported in 4 studies (1, 39, 60, 61), pooled HR = 2.45 (95% CI: 2.00 to 3.01, p = 0.000, I2 = 0.0%, Q statistics p = 0.954, fixed, Figure 4C; Begg p = 0.707, Egger p = 0.589, Figure 5C).
A total of 11 studies (5, 12–14, 16, 46, 59, 64, 72, 73, 75) provided data on the value of Admission NIHSS in both high SII and low SII groups, NIHSS in high SII groups were significantly higher, pooled SMD = 2.365 (95% CI: 1.178 to 3.552, p = 0.003, I2 = 92.94%, Q statistics p = 0.000, random, Figure 4S; Begg p = 0.350, Egger p = 0.242, Figure 5I).
3.5 Other complications
A total of 17 studies (1, 9, 11, 15, 32, 42, 43, 47, 51–53, 57–59, 62, 71, 78) listed continuous/categorized SII aORs/aHRs in other complication groups studied, as shown in Table 3. A total of 13 studies (9–11, 15, 33, 43, 47, 51, 57, 62, 63, 70, 78) listed continuous SII values in other complications groups were studied, as shown in Table 4.
Table 3
| No. | Study | Indicators (continuous SII/HIGH SII) | Outcomes | aOR/aHR(95% CI) |
|---|---|---|---|---|
| 1 | Huang SW 2024 (1) (1) | High SII vs. Low SII | Functional Dependency | 2.894 (1.093, 7.659) |
| 2 | Huang SW 2024 (1) (2) | High SII vs. Low SII | Stroke-associated Infection | 2.655 (1.490, 4.731) |
| 3 | Cheng 2024 (9) | High SII vs. Low SII | Post-stroke Cognitive Impairment | 10.369 (4.460, 24.107) |
| 4 | Liu HT 2023 (51) | High SII vs. Low SII | Atrial fibrillation Stroke | 1.116 (1.024, 1.438) |
| 5 | Zhang 2022 (59) (1) | High SII vs. Low SII | Vulnerable Plaques Presence | 2.242 (1.378, 4.024) |
| 6 | Zhang 2022 (59) (2) | High SII vs. Low SII | Ruptured Fibrous Caps | 3.462 (2.031, 6.074) |
| 7 | Li 2022 (58) | High SII vs. Low SII | Decompressive craniectomy | 3.579 (1.360, 9.422) |
| 8 | Zhang LL 2024 (15) (1) | Continuous SII | Presence of Vulnerability Plaques | 5.013 (2.671, 8.472) |
| 9 | Zhang LL 2024 (15) (2) | Continuous SII | Presence of Ulcerative Plaques | 5.017 (3.010, 8.023) |
| 10 | Hao 2024 (11) | Continuous SII | Stroke-heart Syndrome | 5.089 (1.981, 15.74) |
| 11 | Dong 2023 (53) | Continuous SII | First Pass Effect | 0.895 (0.801, 0.971) |
| 12 | Wang ZT 2023 (52) | Continuous SII | Early Neurological Improvement | 0.998 (0.997, 0.999) |
| 13 | Shao 2023 (47) | Continuous SII | Basal Ganglia-Enlarged Perivascular Spaces Severity | 1.004 (1.001, 1.008) |
| 14 | Lin 2023 (42) | Continuous SII | Good Prognosis (90d/mRS 0–2) | 1.000 (0.999, 1.001) |
| 15 | Xiao 2023 (43) | Continuous SII | PatentForamenOvale | 0.99 (0.98, 1.01) |
| 16 | Su 2023 (57) | Continuous SII | Vascular Dementia | 1.006 (1.002, 1.010) |
| 17 | Ji 2022 (62) | Continuous SII | Malignant Cerebral Edema | 1.209 (1.034, 1.413) |
| 18 | Wenli Z 2022 (71) | Continuous SII | Ineffective Recanalization | 3.731 (1.641, 10.602) |
| 19 | Huang SW 2024 (1) (3) | SII (per 1 SD) | Functional Dependency | 1.224 (1.040, 1.441) |
| 20 | Huang SW 2024 (1) (4) | SII (per 1 SD) | Stroke-associated Infection | 1.349 (1.139, 1.598) |
| 21 | Zhang MK 2024 (32) | SII (per 200 Units) | Failure of Delayed Neurological Improvement | 1.065 (1.001, 1.132) |
| 22 | Wei 2021 (76) | continuous SII | Favorable Prognosis (Non-cerebrovascular Diseases Recurrence/2y) | 1.284 (1.105, 1.493) |
Continuous/categorized SII aORs/aHRs in other complications.
Only the effect size of the Wei2021 literature is aHR, and the rest are aORs. As shown in columns 3 and 4 of Table 3, four aOR/aHR (95% CI) data are mentioned in the literature by Huang SW (1). (1) represents the aOR/aHR (95% CI) with “High SII vs. Low SII” as the Indicator and “Functional Dependency” as the Outcome. (2) represents the aOR/aHR (95% CI) with “High SII vs. Low SII” as the Indicator and “Stroke-associated Infection” as the Outcome. (3) represents the aOR/aHR (95% CI) with “SII (per 1 SD)” as the Indicator and “Functional Dependency” as the Outcome. (4) represents the aOR/aHR (95% CI) with “SII (per 1 SD)” as the Indicator and “Stroke-associated Infection” as the Outcome.
Table 4
| No. | Complications | Study | Group 1 | Group 2 | Group 3 | |||
|---|---|---|---|---|---|---|---|---|
| n | SII [M (Q1, Q3]/ ± s | n | SII [M (Q1, Q3]/ ± s | n | SII [M(Q1, Q3]/ ± s | |||
| 1&2 | AF-S/Non-AF-S | Liu HT 2023 (51) | 144 | 759 (516, 1,549) | 370 | 480 (379, 1,081) | – | – |
| Lin 2022 (63) | 173 | 802.29 (473.08, 1390.30) | 353 | 562.50 (379.73, 1040.33) | – | – | ||
| 3 | Plaque: Vulnerable/Stable | Zhang LL 2024 (15) | 144 | 684.6 (553.2, 819.7) | 58 | 407.1 (293.4, 601.9) | – | – |
| 4 | Cerebral Herniation /Non-Cerebral Herniation | Zheng 2024 (33) | 7 | 2184.13 (1849.47, 4724.67) | 75 | 1336.41 (833.34, 2242.55) | – | – |
| 5 | SHS/Non-SHS | Hao 2024 (11) | 24 | 1,100 (700, 1,500) | 97 | 500 (400, 800) | – | – |
| 6 | PFO /Non-PFO | Xiao 2023 (43) | 50 | 613.08 ± 202.03 | 50 | 411.64 ± 157.81 | – | – |
| 7 | Vascular Dementia /Non-Vascular Dementia | Su 2023 (57) | 56 | 579.35 ± 122.32 | 216 | 503.46 ± 122.41 | – | – |
| 8 | MCE/Non-MCE | Ji 2022 (62) | 132 | 2,460 ± 1,860 | 543 | 1,570 ± 1,300 | – | – |
| 9 | PSCI/Non-PSCI | Cheng 2024 (9) | 193 | 587.75 (337.42, 988.95) | 139 | 345.66 (248.44, 572.89) | – | – |
| 10 | BG-EPVS Severity: Mild /Moderate–Severe | Shao 2023 (47) | 57 | 466.16 (336.69, 603.12) | 115 | 652.63 (463.75, 903.16) | – | – |
| 11 | CSO-EPVS Severity: Mild/Moderate–Severe | Shao 2023 (47) | 100 | 579.45 (418.36, 775.58) | 72 | 581.75 (391.48, 751.26) | – | – |
| 11 | Aetiology: Small Vessels/Large Vessels /Other Etiologies |
Misirlioglu 2024 (10) | 794 | 871.04 (650.62, 1102.69) | 396 | 898.17 (565.27, 1165.79) | 160 | 243.34 (142.97, 367.66) |
| 12 | Infarct Focus Volume: Small/Medium/Large | Laiyun Z 2022 (70) | 77 | 565.13 (369.81, 741.89) | 75 | 696.25 (441.22, 1072.71) | 30 | 1187.28 (730.05, 2251.80) |
| 13 | Recurrent Cerebrovascular Disease (Ischemic Stroke/Hemorrhagic Stroke/Transient Ischemic Attack) | Wei 2021 (76) | 24 | 1190.65 (439.77, 2290.33) | 92 | 426.35 (311.45, 769.23) | – | – |
Continuous SII values in other complication groups and the corresponding control groups.
AF-S, Atrial Fibrillation Stroke; SHS, Stroke-heart Syndrome; PFO, patent foramen ovale; MCE, Malignant Cerebral Edema; PSCI, Post-stroke Cognitive Impairment; BG-EPVS, Basal Ganglia-Enlarged Perivascular Spaces; CSO-EPVS, Central Semi-ovale Region Enlarged Perivascular Spaces.
3.6 SII cut-off values and AUC of ROC curves
A total of 51 studies (5, 6, 8, 9, 11–13, 15–21, 24–29, 32, 33, 35–39, 43, 44, 46, 47, 49–52, 54, 56, 58, 62, 65, 66, 68–70, 72, 73, 76, 77, 79, 80, 82) listed cut-off values, AUC (95% CI), sensitivity, and specificity of ROC curves, as shown in Table 5.
Table 5
| No. | Study | Outcomes | AUC (95% CI) | SII Cut-off | Sensitivity (%) | Specificity (%) |
|---|---|---|---|---|---|---|
| 1. Poor prognosis | ||||||
| 1 | Zheng 2024 (33) | Poor Prognosis (Discharge) | 0.721 (0.561, 0.881) | 1,192 | 92.3 | 44.9 |
| 2 | Mengting 2024 (20) | Poor Prognosis (Discharge) | 0.821 (0.746, 0.896) | 753.68 | 87.2 | 74.8 |
| 3 | Chu 2020 (82) | Poor Prognosis (Discharge) | NR | 651 | NR | NR |
| 4(1) | Ma 2022(1) (68) | Poor Prognosis (3mos) | 0.714 (0.514, 0.914) | 974 | 75.0 | 85.7 |
| 4(2) | Ma 2022(2) (68) | Poor Prognosis (3mos) | 0.688 (0.504, 0.871) | 695 | 100 | 62.5 |
| 5(1) | Ceng 2020(1) (80) | Poor Prognosis (3mos) | 0.612 (NR, NR) | 555 | 68 | 49.9 |
| 6 | Zhao 2024 (17) | Poor Prognosis (3mos) | 0.779 (0.715, 0.843) | NR | NR | NR |
| 7 | Cao 2024 (8) | Poor Prognosis (3mos) | 0.633 (0.583, 0.683) | 1617.42 | 60.6 | 64.1 |
| 8 | Liu YY 2023 (56) | Poor Prognosis (3mos) | 0.848 (0.634, 1.000) | 1103.22 | NR | NR |
| 9 | Wang ZT 2023 (52) | Poor Prognosis (3mos) | 0.702 (0.642, 0.762) | 848.7 | 62.5 | 72.3 |
| 10 | Liu HT 2023 (51) | Poor Prognosis (3mos) | 0.701 (0.611, 0.790) | 644 | 85.2 | 58.9 |
| 11 | Liu 2022 (69) | Poor Prognosis (3mos) | 0.880 (0.836, 0.924) | 449.76 | 83.7 | 67.3 |
| 12 | Ma 2023 (37) | Poor Prognosis (3mos) | 0.715 (0.546, 0.826) | 392.903 | 87.9 | 46.5 |
| 13 | Wang YL 2023 (50) | Poor Prognosis (3mos) | 0.880 (0.804, 0.957) | 1012.06 | 90.8 | 79.2 |
| 14 | Zhouquan 2024 (23) | Poor Prognosis (3mos) | 0.715 (0.6550, 0.776) | 868.55 | 55.7 | 84.0 |
| 15 | Yi 2021 (73) | Poor Prognosis (3mos) | 0.679 (0.643, 0.745) | 853 | NR | NR |
| 16 | Zhou 2023 (46) | Poor Prognosis (3mos) | 0.657 (0.572, 0.742) | 802.8 | 70.9 | 58.2 |
| 17 | Zhou 2022 (65) | Poor Prognosis (3mos) | 0.657 (0.572, 0.742) | 802.8 | 70.9 | 58.2 |
| 18 | Laiyun Z 2022 (70) | Poor Prognosis (3mos) | 0.789 (0.712, 0.866) | 781.4 | 74.5 | 74.0 |
| 19 | Zhao 2023 (38) | Poor Prognosis (3mos) | 0.787 (0.731, 0.843) | 621.68 | 71.7 | 75.4 |
| 20 | Wang S 2023 (36) | Poor Prognosis (3mos) | 0.598 (0.552, 0.645) | 582.755 | 65 | 53 |
| 21 | Zhong 2021 (79) | Poor Prognosis (3mos) | 0.702 (0.635, 0.769) | 580 | 73.1 | 69.7 |
| 22 | Wei 2024 (16) | Poor Prognosis (3mos) | 0.717 (0.646, 0.788) | 504.99 | 70.9 | 69.6 |
| 23 | Ma L 2024 (21) | Poor Prognosis (3mos after Discharge) | 0.826 (0.755, 0.898) | 781.16 | 96.2 | 52.5 |
| 24 | Arslan 2024 (6) | Poor Prognosis (28d) | 0.645 (0.568, 0.722) | 1,146 | 50.5 | 78.8 |
| 25 | Fernández-Garza 2023 (35) | Poor Prognosis (30d) | 0.634 (0.528, 0.741) | 621.161 | 73.6 | 51.0 |
| 26 | Guoqing 2024 (18) | Poor Prognosis (6mos) | 0.841 (0.759, 0.924) | 880.53 | 63.41 | 95.06 |
| 5(2) | Zeng 2020(2) (80) | Poor Prognosis (1y) | 0.662 (NR, NR) | 856.46 | 43.9 | 75.5 |
| 2. Mortality | ||||||
| 1(1) | Chen 2022(1) (66) | Mortality (Discharge) | NR | 1,051 | NR | NR |
| 1(2) | Chen 2022(2) (66) | Mortality (Discharge) | 0.707 (NR, NR) | 2,120 | 50.0 | 91.4 |
| 2 | Hu 2023 (39) | Mortality (Discharge) | 0.65 (0.62, 0.68) | NR | NR | NR |
| 3 | Wei 2024 (16) | Mortality (3mos) | 0.703 (0.582, 0.825) | 524.47 | 78.9 | 59.9 |
| 4(1) | Ceng 2020(1) (80) | Mortality (3mos) | 0.765 (NR, NR) | 915.03 | 70.4 | 76.6 |
| 4(2) | Ceng 2020(2) (80) | Mortality (1y) | 0.725 (NR, NR) | 887.25 | 60.8 | 75.4 |
| 5 | Yang Y 2024 (5) | Mortality (120d) | 0.830 (0.710, 0.949) | 666.31 | 72.7 | 92.0 |
| 3. HT/sICH | ||||||
| 1 | Niu 2024 (26) | HT | 0.604 (0.506, 0.701) | NR | 27.60 | 43.20 |
| 2 | Zheng 2024 (33) | HT | 0.659 (0.541, 0.776) | 1721.7914 | 58.3 | 71.7 |
| 3 | Liu 2022 (69) | HT | 0.857 (0.808, 0.907) | 728.03 | 79.2 | 82.6 |
| 4 | Dan-dan 2023 (44) | HT | 0.784 (0.715, 0.853) | 721 | 73.1 | 70.5 |
| 5 | Liu HT 2023 (51) | HT | 0.82 (0.747, 0.889) | 706.3 | 83.7 | 53.2 |
| 6(1) | Gao 2023(1) (54) | HT | 0.610 (0.535, 0.686) | 488.48 | 69 | 47 |
| 6(2) | Gao 2023(2) (54) | sICH | 0.739 (0.636, 0.842) | 846.56 | 70 | 77 |
| 7 | Cao 2024 (8) | sICH | 0.707 (0.639, 0.776) | 1817.83 | 70 | 65 |
| 8 | Wei 2024 (16) | sICH | 0.517 (0.279, 0.754) | NR | NR | NR |
| 4. END | ||||||
| 1 | Huang H 2024 (29) | END | 0.798 (0.709, 0.888) | 854.76 | 80.7 | 78.2 |
| 2 | Jiaxiang 2024 (25) | END | 0.658 (0.558, 0.758) | 768.206 | 63.4 | 69.4 |
| 3 | Wang N 2024 (13) | END | 0.61 (0.54, 0.69) | 591.63 | 58.1 | 64.6 |
| 4 | Lee 2024 (12) | END | 0.702 (0.620, 0.784) | 588.9 | NR | NR |
| 5 | Wei 2024 (16) | END | 0.708 (0.631, 0.785) | 504.99 | 70.7 | 62.6 |
| 6 | Zhao 2023 (38) | END | 0.601 (0.473, 0.730) | NR | NR | NR |
| 7 | Wang ZT 2023 (52) | END | 0.845 (0.772, 0.918) | 1,429 | 71.9 | 93.5 |
| 5. SAP | ||||||
| 1 | Zhou 2024 (19) | SAP | 0.807 (0.751, 0.855) | 846.55 | 74.58 | 79.17 |
| 2 | Tianlu 2024 (24) | SAP | 0.723 (0.643, 0.802) | 1179.56 | 62.50 | 79.44 |
| 3 | Zhong 2021 (79) | SAP | 0.742 (0.673, 0.812) | 700 | 73.9 | 66.9 |
| 4 | Cheng 2021 (77) | SAP | 0.843 (0.798, 0.882) | 885.05 | 79.5 | 85.0 |
| 5 | Wei L 2021 (76) | SAP | 0.801 (0.742, 0.852) | NR | NR | NR |
| 6 | Ceng 2020 (2) (80) | SAP | 0.762 (0.736, 0.787) | 901.06 | 68.67 | 78.00 |
| 6. PSD | ||||||
| 1 | Dong 2024 (28) | PSD | 0.765 (0.709, 0.820) | 478.18 | 75.7 | 67.6 |
| 2 | Song 2023 (49) | PSD | 0.827 (0.736, 0.918) | NR | NR | NR |
| 3 | Hu 2021 (72) | PSD | 0.579 (0.517, 0.641) | 565.7 | NR | NR |
| 7. Moderate to Severe Disability(mRS3-5) | ||||||
| 1 | Ceng 2020(1) (80) | mRS3-5(90d) | 0.557 (NR, NR) | 1148.4 | 26.8 | 87 |
| 2 | Ceng 2020(2) (80) | mRS3-5(1y) | 0.575 (NR, NR) | 1179.43 | 25 | 88.4 |
| 8. AIS Severity | ||||||
| 1 | Fernández-Garza 2023 (35) | AIS Severity | 0.693 (0.599, 0.786) | 623.723 | 73.5 | 67.3 |
| 9. Others | ||||||
| 1 | Shao 2023 (47) | Moderate—Severe BG-EPVS | 0.717 (0.638, 0.796) | 686.35 | 47.8 | 91.2 |
| 2 | Ji 2022 (62) | Malignant Cerebral Edema | 0.69 (0.66, 0.73) | 2,144 | 55 | 80 |
| 3 | Zhang MK 2024 (32) | Failure of Delayed Neurological Improvement | 0.861 (0.816, 0.907) | 696.165 | NR | NR |
| 4 | Wang ZT 2023 (52) | Early neurological improvement | 0.58 (0.511, 0.648) | 639.9 | 55.8 | 57.3 |
| 5 | Li 2022 (58) | Decompressive Craniectomy | 0.649 (NR, NR) | 2505.7 | 55 | 75.8 |
| 6 | Zheng 2024 (33) | Cerebral Herniation | 0.794 (0.636, 0.953) | 1798 | 85.7 | 68 |
| 7 | Xiao 2023 (43) | Patent Foramen Ovale | 0.777 (0.674, 0.861) | 476.4 | 70 | 70 |
| 8 | Zhang LL 2024 (15) | Ulcerative Plaque | 0.895 (NR, NR) | 537.4 | 93.3 | 89.2 |
| 9 | Hao 2024 (11) | Stroke-heart Syndrome | 0.767 (0.6443, 0.8892) | 857 | 66.67 | 83.51 |
| 10 | Zhang J 2024 (27) | Progressive Ischemic Stroke | 0.656 (0.535, 0.778) | 737.624 | 40.0 | 92.9 |
| 11 | Cheng 2024 (9) | Post-stroke Cognitive Impairment | 0.659 (0.600, 0.717) | 676.83 | 44.6 | 82.0 |
SII cut-off values and AUC of ROC curves.
SII, Systemic Immune-inflammation Index; AUC, Area Under the Curve; NR, Not Reported; AIS, Acute Ischemic Stroke; HT, Hemorrhagic Transformation; sICH, Symptomatic Intracerebral Hemorrhage; END, Early Neurological Deterioration; SAP, Stroke-Associated Pneumonia; PSD, Post-stroke Depression; mRS, Modified Rankin Scale; BG-EPVS, Basal Ganglia Region Enlarged Perivascular Spaces; h, hours; d, day; y, year; mos, month(s); w, week.
4 Discussion
In this study, we conducted a comprehensive systematic review and meta-analysis to explore the link between SII and AIS. A total of 40,682 individuals from 78 studies (1, 5–33, 35–82) were involved in the meta-analysis, while 79 studies (1, 5–82) were included in the systematic review.
The principal findings of this study are as follows: (1) The continuous SII values in poor prognosis, death, moderate–severe severity, HT/sICH, SAP/PSP, END, PSD, Progression/Recurrence groups were significantly higher than those in favorable prognosis, survival, mild severity, non-HT/sICH, non-SAP/PSP, non-END, non-PSD, no-progression/recurrence groups. (2) The incidence of poor prognosis, mortality, moderate–severe severity, HT/sICH, SAP/PSP, and END could be higher with an increase in continuous SII, significantly higher except for the incidence related to severity. (3) The sample size of poor prognosis, death, HT/sICH, END, progression/recurrence patients of high SII groups was significantly higher than that of low SII groups. (4) The risk of mortality, severity, HT/sICH, SAP/PSP, END, PSD, Progression/Recurrence in high SII groups was higher than in low SII groups, significantly higher except for the risks of poor prognosis and END. (5) The Admission NIHSS in AIS patients with high SII groups was significantly higher than in low SII groups.
From a pathophysiological perspective, the body’s immune-inflammatory response is activated following the onset of AIS. SII, a biomarker of systemic immune inflammation, has an elevated SII level that often implies an exacerbated inflammatory response, triggering a cascade of adverse events (84). Inflammatory cells infiltrate the brain tissue, releasing diverse inflammatory factors that disrupt the blood–brain barrier, exacerbate brain edema, and intensify neurological damage (83). Additionally, high SII levels are associated with platelet activation and aggregation, promoting thrombosis, aggravating cerebral ischemia, and influencing AIS prognosis, mortality, severity, END, progression, and recurrence (2–4). Patients in high SII groups are at a significantly higher risk of developing HT (64), likely due to high-SII-induced vascular endothelial damage, increased vascular permeability, and blood component exudation. Patients in High SII groups are also more susceptible to PSD (72), as the inflammatory response interferes with neurotransmitter synthesis, metabolism, and release, leading to an imbalance in neurotransmitters like 5-hydroxytryptamine and dopamine. Moreover, high SII levels, reflecting a perturbed immune-inflammatory state, increase the risk of SAP by reducing the body’s resistance and making it more vulnerable to pulmonary infections (76, 80).
Our study boasts noteworthy strengths. First, given that the concept of the SII was first proposed by Chinese researchers (84), we specifically retrieved several Chinese databases as sources. This effort significantly broadened the scope of our system review. The search strategy we implemented was more sophisticated. For the research on AIS, our search keywords included 6 subject terms and 122 free terms, effectively reducing the probability of missed or inaccurate retrievals. By incorporating studies from more recent years, we broadened the scope further, guaranteeing the inclusion of the latest research findings. Moreover, our analysis encompassed additional outcomes, such as SAP/PSP, END, and PSD, which were integrated into the meta-analysis for the first time, facilitating a more multi-dimensional assessment.
There are several limitations to our study. First, language is a constraint, as we only included literature in Chinese and English, while relevant studies in other languages may contain valuable information, affecting the generalizability and comprehensiveness of the findings. Second, due to the variability of cut-offs of SII used in different studies, we could not determine a consensus on the best cut-off value based on our analysis, which may limit clinical guidance. Third, although we used various methods to assess and deal with heterogeneity, some analysis results still have high heterogeneity, which may affect the accuracy and reliability of pooled effect values, reducing the persuasiveness of the findings. Sources of heterogeneity may include differences in study participants (age, sex, nationality, etc.), differences in study design (prospective cohort studies, retrospective cohort studies, and case–control studies), differences in interventions (different treatments, drug use, etc.), differences in SII grouping criteria (time of blood sampling and instruments), and differences in outcome measures (definitions and evaluation tools).
This result suggests that SII levels may represent an important diagnostic and prognostic tool for AIS complications in clinical practice. Monitoring and treatment should be strengthened for patients with higher SII levels, and more active measures should be taken to control the inflammatory response and clotting state. However, the role of SII in predicting poor prognosis, mortality, severity, and a variety of other complications is not fully understood.
In summary, high SII levels are linked to poor AIS prognosis and multiple complications, and SII may function as a cost-effective prognostic biomarker. Evaluating the role of SII in therapeutic decision-making is necessary, as our preliminary results suggest its potential to reflect clinical conditions and assist decision-makers. However, more research, especially large-sample and multi-center studies, is needed to better understand the utility of SII through dynamic monitoring.
Statements
Data availability statement
The raw data supporting the conclusions of this article will be made available by the authors, without undue reservation.
Author contributions
YJ: Data curation, Methodology, Writing – original draft, Investigation. YC: Formal analysis, Writing – original draft, Data curation. XH: Investigation, Data curation, Supervision, Writing – original draft. JL: Writing – original draft, Formal analysis, Data curation. XQ: Investigation, Writing – original draft. XW: Conceptualization, Supervision, Funding acquisition, Writing – review & editing. XM: Writing – review & editing, Conceptualization.
Funding
The author(s) declare that financial support was received for the research and/or publication of this article. XW was supported by the Natural Science Foundation of Shandong Province (Grant Number: ZR2020MH156) and the National Famous Old Chinese Medicine Experts Inheritance Studio Construction Project (Grant Number: National Chinese Medicine Human Education Letter [2022] No. 75).
Conflict of interest
The authors declare that the research was conducted in the absence of any commercial or financial relationships that could be construed as a potential conflict of interest.
Generative AI statement
The authors declare that no Gen AI was used in the creation of this manuscript.
Any alternative text (alt text) provided alongside figures in this article has been generated by Frontiers with the support of artificial intelligence and reasonable efforts have been made to ensure accuracy, including review by the authors wherever possible. If you identify any issues, please contact us.
Publisher’s note
All claims expressed in this article are solely those of the authors and do not necessarily represent those of their affiliated organizations, or those of the publisher, the editors and the reviewers. Any product that may be evaluated in this article, or claim that may be made by its manufacturer, is not guaranteed or endorsed by the publisher.
Supplementary material
The Supplementary material for this article can be found online at: https://www.frontiersin.org/articles/10.3389/fneur.2025.1594258/full#supplementary-material
References
1.
Huang S Xie W Gao Y Jin Y Chen Y Zhou G et al . A role for systemic inflammation in stroke-associated infection and the long-term prognosis of acute ischemic stroke: a mediation analysis. Jir. (2024) 17:6533–45. doi: 10.2147/JIR.S474344
2.
Han J Yang L Lou Z Zhu Y . Association between systemic immune-inflammation index and systemic inflammation response index and outcomes of acute ischemic stroke: a systematic review and meta-analysis. Ann Indian Acad Neurol. (2023) 26:655–62. doi: 10.4103/aian.aian_85_23
3.
Huang Y Yin X Li Z . Association of the systemic immune-inflammation index (SII) and clinical outcomes in patients with stroke: a systematic review and meta-analysis. Front Immunol. (2022) 13:1090305. doi: 10.3389/fimmu.2022.1090305
4.
Ye Z Hu T Wang J Xiao R Liao X Liu M et al . Systemic immune-inflammation index as a potential biomarker of cardiovascular diseases: a systematic review and meta-analysis. Front Cardiovasc Med. (2022) 9:933913. doi: 10.3389/fcvm.2022.933913
5.
Yang Y He P Zhang Y . Systemic immune-inflammation index predicts short-term mortality in acute ischemic stroke with severe stenosis of internal carotid artery associated pneumonia. Brain Behav. (2024) 14:e70047. doi: 10.1002/brb3.70047
6.
Arslan K Sultan Sahin A . Prognostic value of systemic immune-inflammation index and systemic inflammatory response index on functional status and mortality in patients with critical acute ischemic stroke. Tohoku J Exp Med. (2024) 265:91–97. doi: 10.1620/tjem.2024.J094
7.
Zhu F Wang Z Song J Ji Y . Correlation analysis of inflammatory markers with the short-term prognosis of acute ischaemic stroke. Sci Rep. (2024) 14:17772. doi: 10.1038/s41598-024-66279-4
8.
Cao W Song Y Bai X Yang B Li L Wang X et al . Systemic-inflammatory indices and clinical outcomes in patients with anterior circulation acute ischemic stroke undergoing successful endovascular thrombectomy. Heliyon. (2024) 10:e31122. doi: 10.1016/j.heliyon.2024.e31122
9.
Cheng Y Zhu H Liu C Li L Lin F Guo Y et al . Systemic immune-inflammation index upon admission correlates to post-stroke cognitive impairment in patients with acute ischemic stroke. Aging. (2024) 16:8810–21. doi: 10.18632/aging.205839
10.
Misirlioglu NF Uzun N Ozen GD Çalik M Altinbilek E Sutasir N et al . The relationship between neutrophil–lymphocyte ratios with nutritional status, risk of nutritional indices, prognostic nutritional indices and morbidity in patients with ischemic stroke. Nutrients. (2024) 16:1225. doi: 10.3390/nu16081225
11.
Hao X Zhu M Sun Z Li P Meng Q Tan L et al . Systemic immune-inflammation index is associated with cardiac complications following acute ischemic stroke: a retrospective single-center study. Clin Neurol Neurosurg. (2024) 241:108285. doi: 10.1016/j.clineuro.2024.108285
12.
Lee M Lee EJ Kim RO Pyun J Joo B Kwon K et al . Systemic immune-inflammation index as a predictor of early stroke progression/recurrence in acute atherosclerotic ischemic stroke. Clin Neurol Neurosurg. (2024) 238:108182. doi: 10.1016/j.clineuro.2024.108182
13.
Wang N Wang L Zhang M Deng B Wu T . Correlations of 2 novel inflammation indexes with the risk for early neurological deterioration in acute ischemic stroke patients after intravenous thrombolytic therapy. Neurologist. (2024) 29:146–51. doi: 10.1097/NRL.0000000000000557
14.
Chen G Wang A Zhang X Li Y Xia X Tian X et al . Systemic immune-inflammation response is associated with futile recanalization after endovascular treatment. Neurocrit Care. (2024) 41:165–73. doi: 10.1007/s12028-023-01930-y
15.
Zhang L Xu X Zhang X Jiang S Hui P . Systemic immune-inflammation index is associated with ulcerative plaque in patients with acute ischemic stroke: a single center exploratory study. J Clin Ultrasound. (2024) 52:295–304. doi: 10.1002/jcu.23632
16.
Wei C Xue J Zhou X Xia X Li X . Systemic immune-inflammation index is a prognostic predictor for patients with acute ischemic stroke treated with intravenous thrombolysis. Neurologist. (2024) 29:22–30. doi: 10.1097/NRL.0000000000000508
17.
Zhao KJ Wu XQ . Relationship between peripheral blood inflammation indicators and short-term adverse outcomes in patients with acute ischemic stroke treated with intravenous thrombolysis. Signa Vitae. (2024) 20:96–103. doi: 10.22514/sv.2024.087
18.
Guoqing B Yan J Amiti D Mingyuan W Fu XU Hongyan LI . Systemic immune-inflammation index, serum amyloid a and N-terminal pro-brain natriuretic peptide for predicting prognosis of patients with acute cerebral infarction after thrombolytic therapy. J Chin Pract Diagn Therap. (2024) 38:1023–8. doi: 10.13507/j.issn.1674-3474.2024.10.009
19.
Zhou LN Zhang X Li XH . Predictive value of systemic immune inflammation index and neutrophil lymphocyte ratio for acute ischemic stroke associated pneumonia. Syst Med. (2024) 9:4–7. doi: 10.19368/j.cnki.2096-1782.2024.17.004
20.
Mengting C Jian H Yunnan LU Xiaohua Z . Study on the value of systemic immune-inflammation index in predicting short-term functional prognosis of patients with a-cute cerebral infarction. Chin J Geriatric Care. (2024) 22:28–33. doi: 10.3969/j.issn.1672-2671.2024.04.006
21.
Ma L. Correlation analysis between SII, NAR and short-term prognosis ofPatients with acute cerebral infarction after intravenous thrombolysis. Master Type, Anhui Medical University (2024)
22.
Yu H. Correlation analysis of NLR, dNLR, PLR, SII and hemorrhagic transformation after EVT in acute ischaemic stroke. Master Type, 吉林大学 (2024). doi: 10.27162/d.cnki.gjlin.2024.002156
23.
Zhouquan HU Peng J Yong T Baoli XU Shu Z . Efficacy of systemic immune inflammation index and National Institutes of Health stroke scale score on evaluating the short-term prognosis of patients with acute ischemic stroke receiving intravenous thrombolysis. West China Med J. (2024) 39:699–704. doi: 10.7507/1002-0179.202311160
24.
Tianlu W Ran W Jing M Lei T . Predictive value of multiple inflammatory markers in stroke-associated pneumonia. Int J Geriatrics. (2024) 45:308–13. doi: 10.3969/j.issn.1674-7593.2024.03.011
25.
Jiaxiang Y Xiaoxi LI Jun X Haopeng LI Jun W . Predictive value of hypoperfusion intensity ratio combined with systemic immune-inflammation index for early neurological deterioration after thrombolysis in elderly patients with acute ischemic stroke. Pract Geriatrics. (2024) 38:598–602. doi: 10.3969/j.issn.1003-9198.2024.06.013
26.
Niu FL Gao LH . Influencing factors and predictive value of hemorrhagic transformation of recombinant tissue plasminogen activator in patients with acute ischemic stroke. Doctor. (2024) 9:86–9. doi: 10.3969/j.issn.2096-2665.2024.05.029
27.
Zhang J. Research on the predictive value of MHR, NPAR, and SI for the occurrence of progressive ischemic stroke. Master Type, Chengde Medical University (2024). doi: 10.27691/d.cnki.gcdyx.2024.000187
28.
Dong L Guoliang LI Huijun W Junwen W . Predictive value of systemic immune-inflammatory index on post-stroke depression in patients with acute ischemic stroke. Chin J Stroke. (2024) 19:190–6. doi: 10.3969/j.issn.1673-5765.2024.02.010
29.
Huang H Liu ZW Yu ZH Song CJ Li D Han YY . Systemic inflammatory response index, systemic immune-inflammatory index, and CT perfusion imaging parameters predict early neurological deterioration in patients with minor stroke due to anterior circulation large vessel occlusion. Int J Cerebrovasc Dis. (2024) 32:407–13. doi: 10.3760/cma.j.issn.1673-4165.2024.06.002
30.
Haimei L Huiying FU Yang B . Predictive value of inflammatory markers on the risk of stroke-associated pneumonia in acute ischemic stroke patients. J Clin Neurol. (2024) 37:9–14. doi: 10.3969/j.issn.1004-1648.2024.01.003
31.
Lijun W Ping Z Meihua H Jie Y Hongjian S Fang S et al . Relationships between peripheral blood inflammatory markers and acute ischemic stroke. Acad J Naval Med Univ. (2024) 45:174–80. doi: 10.16781/j.CN31-2187/R.20230539
32.
Zhang M Zhao W Wu C Xu J Guo W Ren C et al . Inflammation index in failure of delay functional independence after successful recanalization. Int J Neurosci. (2024) 1:1–8. doi: 10.1080/00207454.2024.2414280
33.
Zheng L Lin Z . The relationship between composite inflammatory ratios and complications of massive ischaemic stroke. J Coll Physicians Surg Pak. (2024) 34:434–9. doi: 10.29271/jcpsp.2024.04.434
34.
Wang S.N. Predictive value of inflammatory markers and blood urea nitrogen to creatinine ratio in progressive cerebral infarction. Master Type, Jilin University (2024). doi: 10.27162/d.cnki.gjlin.2024.004422
35.
Fernández-Garza LE González-Aquines A Botello-Hernández E Pérez-Vázquez G Cristobal-Niño M Góngora-Rivera F . Segmented neutrophil-to-monocyte ratio and systemic immune-inflammation index associated with the severity and functional prognosis of acute ischemic stroke. Int J Neurosci. (2023) 135:228–36. doi: 10.1080/00207454.2023.2294705
36.
Wang S Zhang L Qi H Zhang F L Fang Q Qiu L . Pan-immune-inflammatory value predicts the 3 months outcome in acute ischemic stroke patients after intravenous thrombolysis. Curr Neurovasc Res. (2023) 20:464–71. doi: 10.2174/0115672026276427231024045957
37.
Ma F Li L Xu L Wu J Zhang A Liao J et al . The relationship between systemic inflammation index, systemic immune-inflammatory index, and inflammatory prognostic index and 90-day outcomes in acute ischemic stroke patients treated with intravenous thrombolysis. J Neuroinflamm. (2023) 20:220. doi: 10.1186/s12974-023-02890-y
38.
Zhao J Dong L Hui S Lu F Xie Y Chang Y et al . Prognostic values of prothrombin time and inflammation-related parameter in acute ischemic stroke patients after intravenous thrombolysis with rt-PA. Clin Appl Thromb Hemost. (2023) 29:1299587750. doi: 10.1177/10760296231198042
39.
Hu X Liang J Hao W Zhou J Gao Y Gong X et al . Prognostic value of inflammatory markers for in-hospital mortality in intensive care patients with acute ischemic stroke: a retrospective observational study based on MIMIC-IV. Front Neurol. (2023) 14:1174711. doi: 10.3389/fneur.2023.1174711
40.
Zhang P Chen L Jiang Y Yuan H Zhu X Zhang M et al . Risk factors for and outcomes of poststroke pneumonia in patients with acute ischemic stroke treated with mechanical thrombectomy. Front Neurol. (2023) 14:1023475. doi: 10.3389/fneur.2023.1023475
41.
Chu M Luo Y Wang D Liu Y Wang D Wang Y et al . Systemic inflammation response index predicts 3-month outcome in patients with mild acute ischemic stroke receiving intravenous thrombolysis. Front Neurol. (2023) 14:1095668. doi: 10.3389/fneur.2023.1095668
42.
Lin J.X. Effect of serum inflammatory cytokines on neurological impairment and prognosis in patients with acute cerebral infarction. Master Type, Southern Medical University (2023). doi: 10.27003/d.cnki.gojyu.2023.001348
43.
Xiao LJ Wen XJ . Diagnostic value of SIl, NLR and PLR levels in acute ischemic stroke with patent foramen ovale. Guangzhou Med J. (2023) 54:28–33. doi: 10.3969/j.issn.1000-8535.2023.09.005
44.
Dan-dan Y Lin-zhi J Li-yan LI De-qin G Lei LI . Value of systemic immune inflammation index in predicting hemorrhage transformation after thrombolysis in elderly patients with stroke. Pract Geriatrics. (2023) 37:789–93. doi: 10.3969/j.issn.1003-9198.2023.08.009
45.
Li L. Assessment of serum IL-1β, IL-6, hs-CRP and systemic Immunoinflammatory index (SII) studies on the severity and prognosis of acute ischemic stroke. Master Type, Yanan University (2023). doi: 10.27438/d.cnki.gyadu.2023.000285
46.
Zhou Y.X. Predictive value of the systemic immune inflammation index for adverse outcomes in patients with acute ischemic stroke. Master Type, Guilin Medical University (2023). doi: 10.27806/d.cnki.gglyx.2023.000084
47.
Shao Y.Y. Study on the relationship between plasma fibrin level, SI and enlargement of perivascular space inpatients with acute lacunar infarction. Master Type, Bengbu Medical University (2023). doi: 10.26925/d.cnki.gbbyc.2023.000075
48.
Wang X. A single-center retrospective study of prognostic factors in patients with simple mechanical thrombectomy and remedial stent implantation. Master Type, Shihezi University (2023). doi: 10.27332/d.cnki.gshzu.2023.000515
49.
Song C. Study on the correlation between systemic immune-inflammation index and post-stroke depression in acute stage of ischemic stroke. Master Type, Jinzhou Medical University (2023). doi: 10.27812/d.cnki.glnyx.2023.000031
50.
Wang Y.L. The relationship between the neutrophil tolymphocyte ratio and systemic immune inflammation index and prognosis in patients with acute cerebral infarction before intravenous thrombolysis. Master Type, Jinzhou Medical University (2023). doi: 10.27812/d.cnki.glnyx.2023.000115
51.
Liu H.T. Association of systemic immunoinflammatory index with hemorrhagic transformation and short-term prognosis after intravenous thrombolysis in patients with acute ischemic stroke with atrial fibrillation. Master Type, Dalian Medical University (2023). doi: 10.26994/d.cnki.gdlyu.2023.000333
52.
Wang Z.T. Correlation between composite inflammatory indicators and early eurological outcome and prognosis after intravenous thrombolysis in acute ischemic stroke. Master Type, China Medical University (2023). doi: 10.27652/d.cnki.gzyku.2023.001168
53.
Dong L Guoliang L Junwen W . Predictive value of the systemic immuno-inflammatory index for the first pass effect of mechanical thrombectomy in acute anterior circulation large vessel occlusions. Chin J Cerebrovasc Dis. (2023) 20:10–9. doi: 10.3969/j.issn.1672-5921.2023.01.002
54.
Gao J Sun B Zhao WD Chen XY Tian XY . Systemic immune-inflammation index predicts hemorrhagic transformation after intravenous thrombolysis in patients with acute ischemic stroke. Int J Cerebrovasc Dis. (2023) 31:94–9. doi: 10.3760/cma.j.issn.1673-4165.2023.02.003
55.
Huixin S Wei S Xiao W Haiqing S Fei C Xiaoqin H . Influence of inflammatory markers on predicting clinical prognosis in patients with acute ischemic stroke after endovascular treatment. Chin J Cerebrovasc Dis. (2023) 20:382–91. doi: 10.3969/j.issn.1672-5921.2023.06.004
56.
Liu Y.Y. Analysis of the sequencing characteristics of T cell receptor library in patients with acute ischemic stroke. Master Type, Zhengzhou University (2023)
57.
Su HE Shiyu L Yangwei Z Xiaoli DU Haiyan W . Establishment and validation of risk predictive model for vascular dementia in patients with acute cerebral infarction after thrombolytic therapy. Mil Med Joint Logist. (2023) 37:761–7. doi: 10.13730/j.issn.2097-2148.2023.09.008
58.
Li W Zhou Y Zhu G Zeng K Zeng H Chen J et al . Systemic immune inflammatory index is an independent predictor for the requirement of decompressive craniectomy in large artery occlusion acute ischemic stroke patients after mechanical thrombectomy. Front Neurol. (2022) 13:945437. doi: 10.3389/fneur.2022.945437
59.
Zhang L Lyu Q Zhou W Li X Ni Q Jiang S et al . High systemic immune-inflammation index is associated with carotid plaque vulnerability: new findings based on carotid ultrasound imaging in patients with acute ischemic stroke. Front Neurol. (2022) 13:959531. doi: 10.3389/fneur.2022.959531
60.
Wang N Yang Y Qiu B Gao Y Wang A Xu Q et al . Correlation of the systemic immune-inflammation index with short- and long-term prognosis after acute ischemic stroke. Aging. (2022) 14:6567–78. doi: 10.18632/aging.204228
61.
Wu S Shi X Zhou Q Duan X Zhang X Guo H . The association between systemic immune-inflammation index and all-cause mortality in acute ischemic stroke patients: analysis from the MIMIC-IV database. Emerg Med Int. (2022) 2022:1–10. doi: 10.1155/2022/4156489
62.
Ji Y Xu X Wu K Sun Y Wang H Guo Y et al . Prognosis of ischemic stroke patients undergoing endovascular Thrombectomy is influenced by systemic inflammatory index through malignant brain edema. Cia. (2022) 17:1001–12. doi: 10.2147/CIA.S365553
63.
Lin K Fan F Cai M Yu Y Fu C Ding L et al . Systemic immune inflammation index and system inflammation response index are potential biomarkers of atrial fibrillation among the patients presenting with ischemic stroke. Eur J Med Res. (2022) 27:106. doi: 10.1186/s40001-022-00733-9
64.
Yang Y Cui T Bai X Wang A Zhang X Wan J et al . Association between systemic immune-inflammation index and symptomatic intracranial hemorrhage in acute ischemic stroke patients undergoing Endovascular Treatment. Cnr. (2022) 19:83–91. doi: 10.2174/1567202619666220406102429
65.
Zhou Y Li W Xia S Xiang T Tang C Luo J et al . Predictive value of the systemic immune inflammation index for adverse outcomes in patients with acute ischemic stroke. Front Neurol. (2022) 13:836595. doi: 10.3389/fneur.2022.836595
66.
Chen P Chen G Hsiao C Hsu P Yang F Liu C et al . Comparison of clinical features, immune-inflammatory markers, and outcomes between patients with acute in-hospital and out-of-hospital ischemic stroke. J Inflamm Res. (2022) 15:881–95. doi: 10.2147/JIR.S342830
67.
Adiguzel A Arsava EM Topcuoglu MA . Temporal course of peripheral inflammation markers and indexes following acute ischemic stroke: prediction of mortality, functional outcome, and stroke-associated pneumonia. Neurol Res. (2022) 44:224–31. doi: 10.1080/01616412.2021.1975222
68.
Ma X Yang J Yang XY . The clinical value of system immune inflammation index and fibrinogen to albumin ratio in severity and short-term prognosis of acute ischemic stroke. Int J Lab Med. (2022) 43:2639–44. doi: 10.3969/j.issn.1673-4130.2022.21.017
69.
Liu Z. Correlation between systemic immune-inflammation index and acute ischemic stroke severity and prognosis. Master Type, Qingdao University (2022). doi: 10.27262/d.cnki.gqdau.2022.001260
70.
Laiyun Z Jing L Chenghua X . Study on the relationship between systemic immune inflammation index and D-dimer and the severity and prognosis of young acute cerebral infarction patients. J Neurosci Mental Health. (2022) 22:363–8. doi: 10.3969/j.issn.1009-6574.2022.05.011
71.
Wenli Z Chuanyang Z Mingyang P Guozhong C Wen SU . Risk factors and nomogram prediction model construction of ineffective recanalization after endovascular treatment in acute stroke. Chongqing Med. (2022) 51:4043–7. doi: 10.3969/j.issn.1671-8348.2022.23.017
72.
Hu J Wang L Fan K Ren W Wang Q Ruan Y et al . The association between systemic inflammatory markers and post-stroke depression: a prospective stroke cohort. Cia. (2021) 16:1231–9. doi: 10.2147/CIA.S314131
73.
Yi HJ Sung JH Lee DH . Systemic inflammation response index and systemic immune-inflammation index are associated with clinical outcomes in patients treated with mechanical Thrombectomy for large artery occlusion. World Neurosurg. (2021) 153:e282–9. doi: 10.1016/j.wneu.2021.06.113
74.
Li L Chen C Chang Y Chen Y Lee I How C . Prognostic role of neutrophil-to-lymphocyte ratio, platelet-to-lymphocyte ratio, and systemic immune inflammation index in acute ischemic stroke. Medicine. (2021) 100:e26354. doi: 10.1097/MD.0000000000026354
75.
Weng Y Zeng T Huang H Ren J Wang J Yang C et al . Systemic immune-inflammation index predicts 3-month functional outcome in acute ischemic stroke patients treated with intravenous thrombolysis. Cia. (2021) 16:877–86. doi: 10.2147/CIA.S311047
76.
Wei L Lili W . Value of neutrophil/lymphocyte ratio and systemic-immune-inflammation index for diagnosing stroke-associated pneumonia in ACI patients. Chin J Geriatric Heart Brain Vessel Dis. (2021) 23:968–71. doi: 10.3969/j.issn.1009-0126.2021.09.019
77.
Cheng QU Zunsheng Z . Predictive value of systemic immune-inflammation index for stroke-associated pneumonia in patients with acute ischemic stroke. Acta Acad Med Xuzhou. (2021) 41:528–33. doi: 10.3969/j.issn.2096-3882.2021.07.011
78.
Wei-shi W Jia WU Wen-nan N Xiao-yang YU Jun-jun W . Clinical value of blood routine ratio parameters in patients with acute ischemic stroke. J Med Postgraduates. (2021) 34:594–9. doi: 10.16571/j.cnki.1008-8199.2021.06.006
79.
Zhong X. Clinical application of systemic immune InflammatoryIndex in acute ischemic stroke patients. Master Type, Kunming Medical University (2021). doi: 10.27202/d.cnki.gkmyc.2021.000651
80.
Ceng X. Study of relationship between systemic immune inflammation index and acute stroke-associated pneumonia and stroke. Master Type, Zhengzhou University (2020). doi: 10.27466/d.cnki.gzzdu.2020.004041
81.
Zhao HN Liu XJ Chen X . Prognostic value of neutrophil lymphocyte ratio and systemic immune inflammation index in patients with acute cerebral infarction. Electron J Gen Stomatol. (2020) 7:65–7.
82.
Chu Y Chen P Lin S . Correlation between immune-inflammatory markers and clinical features in patients with acute ischemic stroke. Acta Neurol Taiwanica. (2020) 29:103–13.
83.
Powers WJ Rabinstein AA Ackerson T Adeoye OM Bambakidis NC Becker K et al . Guidelines for the early Management of Patients with Acute Ischemic Stroke: 2019 update to the 2018 guidelines for the early Management of Acute Ischemic Stroke: a guideline for healthcare professionals from the American Heart Association/American Stroke Association. Stroke. (2019) 50:e344–418. doi: 10.1161/STR.0000000000000211
84.
Hu B Yang X Xu Y Sun Y Sun C Guo W et al . Systemic immune-inflammation index predicts prognosis of patients after curative resection for hepatocellular carcinoma. Clin Cancer Res. (2014) 20:6212–22. doi: 10.1158/1078-0432.CCR-14-0442
Summary
Keywords
acute ischemic stroke, systemic immune-inflammatory index, poor prognosis, prognostic biomarker, meta-analysis
Citation
Jiang Y, Cui Y, Hu X, Lian J, Qin X, Wang X and Ma X (2025) Prognostic assessment of acute ischemic stroke by systemic immune-inflammatory index: a comprehensive meta-analysis of multidimensional outcomes. Front. Neurol. 16:1594258. doi: 10.3389/fneur.2025.1594258
Received
08 April 2025
Accepted
29 August 2025
Published
20 October 2025
Volume
16 - 2025
Edited by
Pradeep Kumar, All India Institute of Medical Sciences, Delhi, India
Reviewed by
Murat Mert Atmaca, University of Health Sciences, Türkiye
Yang Liu, Fudan University, China
Updates
Copyright
© 2025 Jiang, Cui, Hu, Lian, Qin, Wang and Ma.
This is an open-access article distributed under the terms of the Creative Commons Attribution License (CC BY). The use, distribution or reproduction in other forums is permitted, provided the original author(s) and the copyright owner(s) are credited and that the original publication in this journal is cited, in accordance with accepted academic practice. No use, distribution or reproduction is permitted which does not comply with these terms.
*Correspondence: Xingchen Wang, sdlcwxc@163.comXuran Ma, 60230092@sdutcm.edu.cn
Disclaimer
All claims expressed in this article are solely those of the authors and do not necessarily represent those of their affiliated organizations, or those of the publisher, the editors and the reviewers. Any product that may be evaluated in this article or claim that may be made by its manufacturer is not guaranteed or endorsed by the publisher.