Abstract
Background:
Stroke is a leading cause of mortality and disability worldwide. The relationship between hyperuricemia and stroke prognosis remains controversial. This study aims to investigate the association between hyperuricemia and stroke prevalence, as well as the impact of hyperuricemia on mortality risk among stroke patients, utilizing data from the National Health and Nutrition Examination Survey (NHANES) 2001–2018.
Methods:
Hyperuricemia was defined as serum uric acid ≥416 μmol/L (7.0 mg/dL) in men or ≥357 μmol/L (6.0 mg/dL) in women. We conducted weighted logistic regression analyses to assess the association between hyperuricemia and stroke prevalence. Cox proportional hazards regression models were used to evaluate the impact of hyperuricemia on all-cause and cardiovascular mortality among stroke patients. The models were progressively adjusted for demographic factors, lifestyle factors, comorbidities, and biomarkers. Time-dependent ROC curves were constructed to assess predictive performance. Restricted cubic splines were applied to investigate potential nonlinear relationships between serum uric acid and mortality. Subgroup and mediation analyses explored the interactions and indirect effects, respectively. Sensitivity analyses were conducted to ensure the robustness of the results.
Results:
Hyperuricemia was associated with increased odds of stroke (adjusted OR 1.25; 95% CI: 1.07–1.45; p = 0.005). Among 1,579 stroke patients, hyperuricemia was linked to higher risks of all-cause mortality (adjusted HR 1.25; 95% CI: 1.06–1.48; p = 0.008) and cardio-cerebrovascular mortality (adjusted HR 1.38; 95% CI: 1.05–1.80; p = 0.020). Inflammation markers SII and CRP partially mediated these associations.
Conclusion:
Hyperuricemia is associated with an increased prevalence of stroke. It is also strongly associated with increased mortality in stroke patients, an association mediated in part by inflammation.
Background
Globally, stroke ranks as the second leading cause of death and a major contributor to mortality and disability (1). In China, stroke has become the foremost cause of death and disability (2). Only a small proportion of patients receive effective treatment within the eligible therapeutic time window (such as intravenous thrombolysis or endovascular thrombectomy) (3). Recent studies indicate that since 2015, the decline in stroke incidence has plateaued, and the prevalence and mortality rates have even increased in regions like Southeast Asia, East Asia, Oceania, countries with lower socio-demographic indices, and among individuals under 70 years old (4). Stroke imposes a significant disease burden on global health, individual families, and societal medical costs (5, 6).
In addition to traditional risk factors, the role of emerging metabolic risk factors in the development and progression of stroke is increasingly recognized. Among these, hyperuricemia—a chronic metabolic disorder resulting from purine metabolism dysfunction—is showing a rising prevalence trend (7). It has been associated with various diseases, including diabetes (8), gout (9), hypertension (10), coronary heart disease (CHD) (11), metabolic disorders, and kidney diseases (12). Moreover, the link between hyperuricemia and mortality risk has garnered growing attention (13–15). However, the relationship between serum uric acid (SUA) levels and cardiovascular diseases, including stroke, remains a subject of significant controversy. Some studies suggest no association, while others even indicate an inverse relationship (16, 17). Particularly in the field of stroke, the impact of SUA on the prognosis of stroke patients (e.g., mortality risk) remains a subject of intense debate (18), with some studies suggesting no association, while others support a neuroprotective role (19, 20).
Therefore, this study aims to utilize the large-scale cohort data from the National Health and Nutrition Examination Survey (NHANES) to investigate the following critical questions, addressing current knowledge gaps: (1) The association between hyperuricemia and stroke prevalence in the general population; (2) The impact of hyperuricemia on all-cause mortality and cardiovascular-specific mortality among patients diagnosed with stroke. By gaining deeper insights into the role of hyperuricemia in the long-term prognosis of stroke patients—particularly in resolving the aforementioned key controversies—we aim to provide a more robust scientific basis for clinical risk stratification and targeted interventions.
Methods
Study population
A large-scale study designed to assess the health and nutritional status of the U.S. population, NHANES includes data on demographics, physical examinations, questionnaires, and laboratory tests. NHANES data can be linked to mortality data from the National Center for Health Statistics (NCHS) up to December 31, 2019, allowing us to conduct cohort studies.
This study utilized NHANES data from 2001 to 2018, focusing on adults; thus, minors were excluded. Additionally, participants lacking serum uric acid data, stroke data, or who were pregnant or lost to follow-up were excluded (Figure 1). Missing data were handled by case-wise exclusion: any participant with missing values in key variables (including serum uric acid, stroke status, or covariates required for regression models) was removed from the final analysis. All participants gave their informed consent, and the study received approval from the NCHS Institutional Review Board. Consequently, no further consent or ethical approval was necessary. All procedures adhered to the applicable guidelines and regulations.
Figure 1

Inclusion and exclusion flowchart. NHANES, National Health and Nutrition Examination Survey.
Definition of hyperuricemia and stroke
Serum uric acid (SUA) concentration was determined using the standardized NHANES laboratory protocol (DxC800 analyzer, timed endpoint method; detailed procedure: https://wwwn.cdc.gov/Nchs/Data/Nhanes/Public/2011/DataFiles/BIOPRO_G.htm#LBXSUA). To ensure data quality, observations with SUA values below the lower limit of detection (0.4 mg/dL) or above the upper limit of detection (11.3 mg/dL) were excluded from analysis.
Participants were considered to have hyperuricemia if their SUA levels were ≥416 μmol/L (7.0 mg/dL) for men and ≥357 μmol/L (6.0 mg/dL) for women. Stroke was defined based on the questionnaire question: “Has a doctor or other health professional ever told you that you have had a stroke?” (21, 22).
Covariates
Potential confounding variables were selected, including demographic factors (age, sex, race, poverty level, education level, and marital status), lifestyle factors (smoking and drinking), baseline disease conditions (CHD, diabetes, cancer, and hyperlipidemia), and biomarkers [total cholesterol (TC), aspartate aminotransferase (AST), alanine aminotransferase (ALT), albumin, monocytes, neutrophils, lymphocytes, and platelet count].
Statistical analysis
For continuous variables that followed a normal distribution, the data are shown as mean ± standard deviation (SD). For variables that were not normally distributed, the data are presented as the median with interquartile range. Categorical data are expressed as frequencies and percentages. Comparisons between groups were carried out using t-tests for normally distributed continuous variables, the Mann–Whitney U test for non-normally distributed variables, and Chi-square tests for categorical variables.
We conducted weighted logistic regression analyses with three stepwise-adjusted models to examine the association between hyperuricemia and stroke prevalence. In survival analysis, Kaplan–Meier curves were used to estimate survival probabilities, and the log-rank test was employed to compare survival differences between groups. Similar to the logistic regression, three stepwise-adjusted Cox proportional hazards regression models were established to evaluate the association between hyperuricemia and all-cause mortality and cardio-cerebrovascular disease mortality among stroke patients. Restricted cubic spline (RCS) analyses were employed to evaluate the nonlinear correlation between serum uric acid levels and mortality risk in patients who had experienced a stroke. Stratified by gender, with the likelihood ratio test used to assess nonlinearity. To evaluate the predictive performance of hyperuricemia on mortality outcomes, time-dependent receiver operating characteristic (ROC) curve analyses were performed, calculating the area under the curve (AUC) at specific clinically relevant time points: 3 years, 5 years, and 10 years after the baseline assessment. These time points were selected based on their established clinical significance in long-term mortality follow-up studies for stroke patients and to assess both intermediate (3–5 years) and long-term (10 years) predictive ability.
Subgroup analyses were conducted to assess potential interactions between hyperuricemia and various subgroups. Mediation analysis was performed to calculate the average causal mediation effect (ACME), average direct effect (ADE), and proportion mediated, exploring possible factors mediating the relationship between hyperuricemia and mortality risk in stroke patients. Finally, sensitivity analyses were conducted to assess the robustness of the results.
All statistical analyses were performed using R software (version 4.3.3). All statistical tests were two-sided, and a p-value of less than 0.05 was considered statistically significant.
Results
Baseline characteristics
This study included 32,766 participants, among whom 1,579 were identified as having had a stroke (Table 1). Stroke participants were significantly older than those in the non-stroke group. The proportion of females and non-Hispanic Black participants was higher in the stroke group, while Mexican Americans had a higher proportion in the non-stroke group. Additionally, the stroke group had higher prevalence rates of hyperuricemia (31%), hypertension (78.3%), CHD (18.9%), diabetes (35.8%), and cancer (22.2%), all with p-values less than 0.001. Biochemical indicators showed that the stroke group had higher systemic immune-inflammation index (SII) and SUA levels.
Table 1
| Characteristics | Non-stroke (n = 42,739) | Stroke (n = 1,579) | p value |
|---|---|---|---|
| Sex (%) | <0.001 | ||
| Female | 50.9 | 57.8 | |
| Male | 49.1 | 42.2 | |
| Age (%) | <0.001 | ||
| Age < 50 | 57.4 | 16 | |
| Age 50–65 | 25.8 | 27.9 | |
| Age > 65 | 16.8 | 56 | |
| Race (%) | <0.001 | ||
| Mexican American | 8.4 | 4.3 | |
| Non-Hispanic White | 68.6 | 71.5 | |
| Non-Hispanic Black | 10.5 | 14.3 | |
| Other | 12.5 | 9.9 | |
| Poverty level (%) | <0.001 | ||
| Non-poverty | 87.4 | 81.7 | |
| Poverty | 12.6 | 18.3 | |
| Marital status (%) | <0.001 | ||
| No | 35.7 | 43.3 | |
| Yes | 64.3 | 56.7 | |
| Education level (%) | <0.001 | ||
| High School or above | 16.1 | 28.2 | |
| Below high school | 83.9 | 71.8 | |
| Smoking (%) | 0.002 | ||
| No | 78.8 | 74.4 | |
| Yes | 21.2 | 25.6 | |
| Drinking (%) | <0.001 | ||
| No | 36.7 | 43 | |
| Yes | 63.3 | 57 | |
| Hyperuricemia (%) | <0.001 | ||
| No | 81.6 | 69 | |
| Yes | 18.4 | 31 | |
| Hypertension (%) | <0.001 | ||
| No | 64 | 21.7 | |
| Yes | 36 | 78.3 | |
| CHD (%) | <0.001 | ||
| No | 96.9 | 81.1 | |
| Yes | 3.1 | 18.9 | |
| Diabetes (%) | <0.001 | ||
| No | 87.5 | 64.2 | |
| Yes | 12.5 | 35.8 | |
| Cancer (%) | <0.001 | ||
| No | 90.8 | 77.8 | |
| Yes | 9.2 | 22.2 | |
| BMI, kg/m2 | 27.70 [24.08;32.20] | 28.92 [25.10;33.70] | <0.001 |
| SUA, μmol/L | 315.20 [261.70;374.70] | 333.10 [273.60;404.50] | <0.001 |
| TC, mg/dL | 193.00 [167.00;220.00] | 184.00 [157.00;216.00] | <0.001 |
| AST, U/L | 23.00 [19.00;27.00] | 22.00 [19.00;27.00] | 0.032 |
| ALT, U/L | 21.00 [16.00;29.00] | 19.00 [15.00;26.00] | <0.001 |
| Albumin, g/dL | 43.00 [41.00;45.00] | 41.00 [39.00;44.00] | <0.001 |
| Monocyte, 1,000 cells/μL | 0.50 [0.40;0.70] | 0.60 [0.50;0.70] | <0.001 |
| Neutrophils, 1,000 cells/μL | 4.00 [3.10;5.10] | 4.33 [3.40;5.50] | <0.001 |
| Lymphocyte, 1,000 cells/μL | 2.00 [1.60;2.50] | 1.90 [1.50;2.40] | <0.001 |
| Platelet, 1,000 cells/μL | 245.00 [209.00;290.00] | 233.62 [194.00;280.00] | <0.001 |
| SII | 482.62 [350.24;673.06] | 523.22 [370.23;728.36] | <0.001 |
Weighted basic characteristics of participants according to presence or absence of stroke.
The continuous variables were presented as either the mean ± standard deviation or the median with interquartile range, and p values were calculated using weighted t-tests for normally distributed variables and weighted Mann–Whitney U tests for non-normally distributed variables. Categorical variables were expressed as weighted percentages and p values were computed using weighted chi-square tests. BMI, body mass index; SUA, serum uric acid; TC, total cholesterol; AST, aspartate aminotransferase; ALT, alanine aminotransferase; SII, systemic immune-inflammation index; CHD, coronary heart disease.
Table 2 shows the baseline characteristics of 1,579 stroke patients, classified according to their survival status. By the end of follow-up on December 31, 2019, there were 635 all-cause mortality events, with a median survival time of 74.0 [35.5; 119] months. Among stroke patients, those who died were often older (82% were over 65 years old), more likely to be male, and non-Hispanic Black participants. Deceased patients had higher prevalence rates of hyperuricemia, hypertension, CHD, and cancer. Notably, deceased stroke patients had significantly higher SII and SUA levels (p < 0.001).
Table 2
| Characteristics | Total (N = 1,579) | All-cause mortality | p value | |
|---|---|---|---|---|
| No (N = 924) | Yes (N = 655) | |||
| Sex (%) | 0.001 | |||
| Female | 813 (51.5%) | 523 (56.6%) | 290 (44.3%) | |
| Male | 766 (48.5%) | 401 (43.4%) | 365 (55.7%) | |
| Age (%) | <0.001 | |||
| Age < 50 | 186 (11.8%) | 166 (18.0%) | 20 (3.05%) | |
| Age 50–65 | 430 (27.2%) | 332 (35.9%) | 98 (15.0%) | |
| Age > 65 | 963 (61.0%) | 426 (46.1%) | 537 (82.0%) | |
| Race (%) | <0.001 | |||
| Mexican American | 158 (10.0%) | 102 (11.0%) | 56 (8.55%) | |
| Non-Hispanic White | 413 (26.2%) | 280 (30.3%) | 133 (20.3%) | |
| Non-Hispanic Black | 826 (52.3%) | 401 (43.4%) | 425 (64.9%) | |
| Other | 182 (11.5%) | 141 (15.3%) | 41 (6.26%) | |
| Poverty level (%) | 0.009 | |||
| Non-poverty | 1,220 (77.3%) | 692 (74.9%) | 528 (80.6%) | |
| Poverty | 359 (22.7%) | 232 (25.1%) | 127 (19.4%) | |
| Marital status (%) | 0.032 | |||
| No | 763 (48.3%) | 425 (46.0%) | 338 (51.6%) | |
| Yes | 816 (51.7%) | 499 (54.0%) | 317 (48.4%) | |
| Education level (%) | 0.001 | |||
| High School or above | 569 (36.0%) | 294 (31.8%) | 275 (42.0%) | |
| Below high school | 1,010 (64.0%) | 630 (68.2%) | 380 (58.0%) | |
| Smoking (%) | 0.001 | |||
| No | 1,203 (76.2%) | 673 (72.8%) | 530 (80.9%) | |
| Yes | 376 (23.8%) | 251 (27.2%) | 125 (19.1%) | |
| Drinking (%) | <0.001 | |||
| No | 702 (44.5%) | 372 (40.3%) | 330 (50.4%) | |
| Yes | 877 (55.5%) | 552 (59.7%) | 325 (49.6%) | |
| Hyperuricemia (%) | <0.001 | |||
| No | 1,071 (67.8%) | 660 (71.4%) | 411 (62.7%) | |
| Yes | 508 (32.2%) | 264 (28.6%) | 244 (37.3%) | |
| Hypertension (%) | 0.002 | |||
| No | 303 (19.2%) | 202 (21.9%) | 101 (15.4%) | |
| Yes | 1,276 (80.8%) | 722 (78.1%) | 554 (84.6%) | |
| CHD (%) | <0.001 | |||
| No | 1,293 (81.9%) | 790 (85.5%) | 503 (76.8%) | |
| Yes | 286 (18.1%) | 134 (14.5%) | 152 (23.2%) | |
| Diabetes (%) | 0.130 | |||
| No | 957 (60.6%) | 575 (62.2%) | 382 (58.3%) | |
| Yes | 622 (39.4%) | 349 (37.8%) | 273 (41.7%) | |
| Cancer (%) | <0.001 | |||
| No | 1,241 (78.6%) | 768 (83.1%) | 473 (72.2%) | |
| Yes | 338 (21.4%) | 156 (16.9%) | 182 (27.8%) | |
| BMI, kg/m2 | 28.8 [25.1;33.2] | 29.6 [25.6;34.3] | 27.8 [24.6;31.8] | <0.001 |
| SUA, μmol/L | 339 [280;410] | 327 [274;393] | 357 [292;437] | <0.001 |
| TC, mg/dL | 183 [156;215] | 185 [158;213] | 180 [151;217] | 0.312 |
| AST, U/L | 22.0 [19.0;27.0] | 22.0 [18.0;27.0] | 23.0 [19.0;28.0] | 0.004 |
| ALT, U/L | 19.0 [15.0;25.0] | 20.0 [15.0;26.0] | 18.0 [15.0;24.0] | 0.031 |
| Albumin, g/dL | 41.0 [39.0;43.0] | 41.0 [39.0;43.0] | 41.0 [38.0;43.0] | 0.009 |
| Monocyte, 1,000 cells/μL | 0.60 [0.50;0.70] | 0.60 [0.40;0.70] | 0.60 [0.50;0.70] | <0.001 |
| Neutrophils, 1,000 cells/μL | 4.30 [3.30;5.40] | 4.20 [3.20;5.40] | 4.40 [3.40;5.50] | 0.009 |
| Lymphocyte, 1,000 cells/μL | 1.90 [1.50;2.50] | 2.00 [1.60;2.60] | 1.80 [1.30;2.30] | <0.001 |
| Platelet, 1,000 cells/μL | 231 [193;276] | 234 [198;278] | 225 [185;272] | 0.003 |
| SII | 512 [356;728] | 488 [342;691] | 553 [383;802] | <0.001 |
Basic characteristics of stroke participants grouped according to survival status.
The continuous variables were presented as either the mean ± standard deviation or the median with interquartile range, and p values were calculated using t-tests for normally distributed variables and Mann–Whitney U tests for non-normally distributed variables. Categorical variables were expressed as percentages and frequencies, and p values were computed using weighted chi-square tests. BMI, body mass index; SUA, serum uric acid; TC, total cholesterol; AST, aspartate aminotransferase; ALT, alanine aminotransferase; SII, systemic immune-inflammation index; CHD, coronary heart disease.
Association between hyperuricemia and stroke
In our three stepwise-adjusted weighted logistic regression models (Table 3), hyperuricemia consistently showed a positive association with the occurrence of stroke (all p-values < 0.05), indicating that patients with hyperuricemia were more likely to have a stroke. Specifically, the unadjusted Model 1 showed that hyperuricemia patients had approximately twice the odds of having a stroke compared to non-hyperuricemia patients (OR 1.98, 95% CI 1.73–2.27). As covariates were adjusted, the OR gradually decreased; in the fully adjusted Model 3, the OR decreased to 1.25 (OR 1.25, 95% CI 1.07–1.45), but the association remained significant.
Table 3
| Exposure | Model 1 | Model 2 | Model 3 | |||
|---|---|---|---|---|---|---|
| OR (95%CI) | p value | OR (95%CI) | p value | OR (95%CI) | p value | |
| Non-hyperuricemia | Reference | Reference | Reference | |||
| Hyperuricemia | 1.98 (1.73, 2.27) | <0.001 | 1.51 (1.31, 1.75) | <0.001 | 1.25 (1.07, 1.45) | 0.005 |
Weighted logistic regression analysis of hyperuricemia and stroke across three models.
Model 1, Did not adjust any covariates; Model 2, Adjusted for age, sex, and race; Model 3, Adjusted for sex, age, race, poverty level, marital status, education level, smoking, drinking, hypertension, coronary heart disease, diabetes, cancer, body mass index, total cholesterol, aspartate aminotransferase, alanine aminotransferase, albumin, monocytes, neutrophils, lymphocytes, and platelets; OR, odds ratio; CI, confidence interval.
Hyperuricemia and survival status of stroke patients
The Kaplan–Meier survival curves (Figure 2), stratified by the presence of hyperuricemia, showed significant differences in survival probabilities between the stroke and non-stroke groups (log-rank test p < 0.05). Among stroke patients, the hyperuricemia group had significantly lower survival probabilities than the non-hyperuricemia group, suggesting that hyperuricemia is associated with poor prognosis in stroke patients. Further stepwise-adjusted Cox proportional hazards regression analyses (Table 4), hyperuricemia was found to be a significant predictor of mortality in stroke patients. In the unadjusted Model 1, there was a statistically significant association between hyperuricemia and an increased mortality risk, with an HR of 1.34 (95% CI 1.15–1.57). In Model 2, after adjusting for basic demographic factors, the risk remained significant but was slightly attenuated (HR 1.19, 95% CI 1.01–1.39). In the fully adjusted Model 3, after adjusting for more covariates, the HR slightly increased (HR 1.25, 95% CI 1.06–1.48). This may reflect the complex modulation of covariates on the relationship between hyperuricemia and mortality risk.
Figure 2

Kaplan–Meier survival curve analysis of all-cause mortality based on the presence or absence of hyperuricemia. (A) Stroke patients and (B) non-stroke patients.
Table 4
| Exposure | Model 1 | Model 2 | Model 3 | |||
|---|---|---|---|---|---|---|
| HR (95%CI) | p value | HR (95%CI) | p value | HR (95%CI) | p value | |
| All-cause mortality | ||||||
| Non-hyperuricemia | Reference | Reference | Reference | |||
| Hyperuricemia | 1.34 (1.15, 1.57) | <0.001 | 1.19 (1.01, 1.39) | 0.036 | 1.25 (1.06, 1.48) | 0.008 |
| Cardio-cerebrovascular diseases mortality | ||||||
| Non-hyperuricemia | Reference | Reference | Reference | |||
| Hyperuricemia | 1.45 (1.12, 1.87) | 0.005 | 1.30 (1.00, 1.68) | 0.049 | 1.38 (1.05, 1.80) | 0.020 |
Association between hyperuricemia and all-cause mortality and cardio-cerebrovascular diseases mortality in stroke patients.
Model 1, Did not adjust any covariates; Model 2, Adjusted for age, sex, and race; Model 3, Adjusted for sex, age, race, poverty level, marital status, education level, smoking, drinking, hypertension, coronary heart disease, diabetes, cancer, body mass index, total cholesterol, aspartate aminotransferase, alanine aminotransferase, albumin, monocytes, neutrophils, lymphocytes, and platelets; HR, hazard rate; CI; confidence interval.
Time-dependent ROC curve analyses (Figure 3) further reinforced these findings. The fully adjusted Model 3 had higher AUCs in predicting 3-year, 5-year, and 10-year mortality rates compared to the unadjusted model, demonstrating superior predictive performance. This indicates that hyperuricemia is an independent strong predictor of long-term mortality in stroke patients, and its predictive efficacy is more pronounced after comprehensive covariate adjustment. Additionally, RCS analyses (Figure 4) showed no significant nonlinear association between serum uric acid levels and stroke mortality risk in different genders (male P for nonlinearity = 0.0904; female P for nonlinearity = 0.6594), suggesting that stroke mortality risk may change in a relatively linear manner with uric acid levels.
Figure 3

Comparative ROC curves for all-cause and cardio-cerebrovascular diseases mortality over different periods. (A) 3-year ROC curve for all-cause mortality, (B) 5-year ROC curve for all-cause mortality, (C) 10-year ROC curve for all-cause mortality, (D) 3-year ROC curve for CVDs mortality, (E) 5-year ROC curve for CVDs mortality, (F) 10-year ROC curve for CVDs mortality. ROC, receiver operating characteristic; AUC, area under the curve; CVDs, cardio-cerebrovascular diseases.
Figure 4

Restricted cubic spline curves analyzed the relationship between serum uric acid and the risk of all-cause mortality in stroke patients by gender.
Subgroup analysis and mediation analysis
The increase in HR in the fully adjusted Cox model may reflect interactions between hyperuricemia and specific subgroups or indirect effects mediated through intermediary variables. Therefore, we conducted subgroup analyses and mediation analyses. Subgroup analysis revealed an absence of statistically significant interaction between hyperuricemia and all-cause mortality among stroke patients (P for interaction > 0.05 in all subgroups), indicating that the association between hyperuricemia and all-cause mortality was fairly stable across all subgroups (Table 5). The mediation analysis results (Figure 5) showed that hyperuricemia had a significant mediation effect through SII (ACME: -0.08, 95% CI: −0.17 to −0.02, p = 0.008) accounted for 6.8% of the total effect (p = 0.016), and CRP (ACME: -0.09, 95% CI: −0.22 to −0.01, p = 0.024) accounted for 7.1% of the total effect (p = 0.029). This suggests that hyperuricemia not only directly affects the mortality risk of stroke patients but also partially indirectly influences survival time through SII and CRP.
Table 5
| Variable | HR (95%CI) | p value | P for interaction |
|---|---|---|---|
| Sex | 0.302 | ||
| Female | 1.41 (1.09, 1.83) | 0.01 | |
| Male | 1.12 (0.89, 1.41) | 0.329 | |
| Age | 0.224 | ||
| Age < 50 | 1.82 (0.47, 6.98) | 0.384 | |
| Age 50–65 | 1.29 (0.80, 2.10) | 0.295 | |
| Age > 65 | 1.27 (1.06, 1.53) | 0.009 | |
| Race | 0.305 | ||
| Mexican American | 1.13 (0.48, 2.65) | 0.772 | |
| Non-Hispanic Black | 1.50 (1.04, 2.17) | 0.029 | |
| Non-Hispanic White | 1.26 (1.02, 1.55) | 0.033 | |
| Other | 0.78 (0.34, 1.81) | 0.564 | |
| Poverty level | 0.981 | ||
| Non-poverty | 1.26 (1.05, 1.52) | 0.015 | |
| Poverty | 1.29 (0.85, 1.96) | 0.228 | |
| Marital status | 0.650 | ||
| No | 1.30 (1.02, 1.64) | 0.033 | |
| Yes | 1.15 (0.90, 1.47) | 0.263 | |
| Education level | 0.473 | ||
| Below high school | 1.20 (0.92, 1.57) | 0.180 | |
| High School or above | 1.29 (1.04, 1.61) | 0.021 | |
| Smoking | 0.453 | ||
| No | 1.29 (1.07, 1.54) | 0.006 | |
| Yes | 1.11 (0.69, 1.78) | 0.681 | |
| Drinking | 0.748 | ||
| No | 1.29 (1.02, 1.63) | 0.035 | |
| Yes | 1.23 (0.97, 1.57) | 0.092 | |
| Hypertension | 0.271 | ||
| No | 1.67 (1.03, 2.72) | 0.039 | |
| Yes | 1.23 (1.03, 1.47) | 0.024 | |
| CHD | 0.718 | ||
| No | 1.25 (1.03, 1.51) | 0.025 | |
| Yes | 1.20 (0.85, 1.71) | 0.301 | |
| Diabetes | 0.589 | ||
| No | 1.28 (1.03, 1.60) | 0.028 | |
| Yes | 1.20 (0.93, 1.56) | 0.168 | |
| Cancer | 0.321 | ||
| No | 1.29 (1.06, 1.57) | 0.013 | |
| Yes | 1.19 (0.86, 1.63) | 0.294 |
Subgroup analysis of all-cause mortality in stroke patients.
The regression model adjusted covariates as in Model 3. CHD, coronary heart disease; HR, hazard rate; CI, confidence interval.
Figure 5
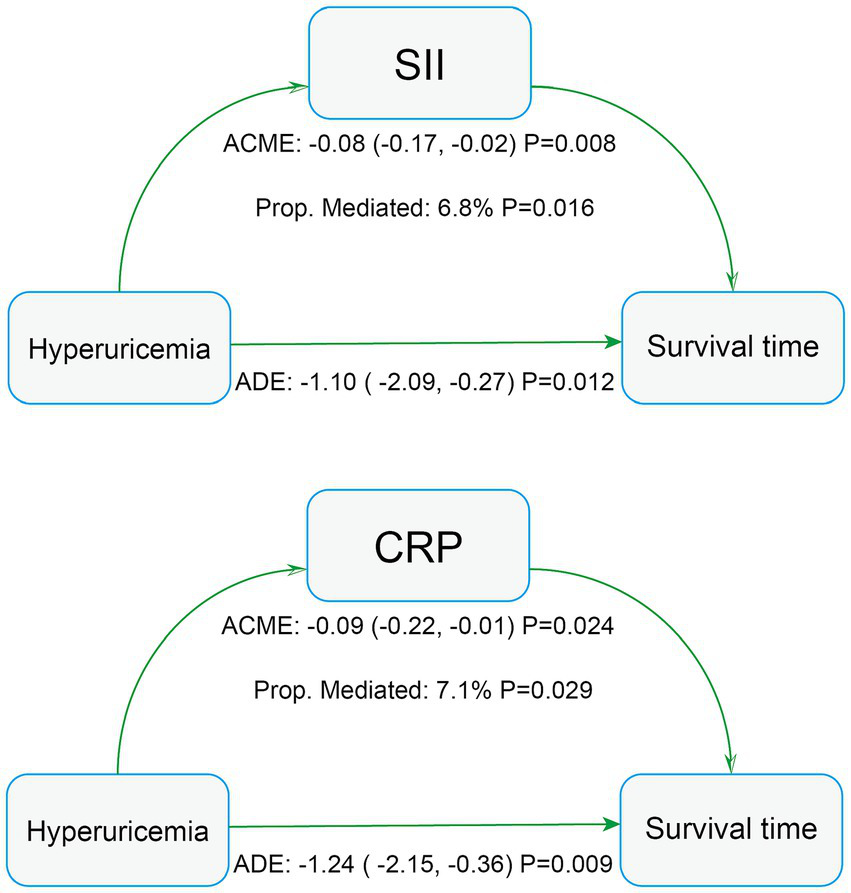
Mediation analysis of all-cause mortality in stroke patients. AST, aspartate aminotransferase; SII, systemic immune-inflammation index; CRP, C-reactive protein.
Sensitive analysis
In the sensitivity analyses, the unweighted logistic regression results (Supplementary Table S1) showed that serum uric acid and hyperuricemia were significantly associated with the occurrence of stroke. Including potential confounding factors such as asthma, liver disease, and hyperlipidemia in the final adjustment model (Supplementary Table S2), and excluding patients with survival times less than 12 months (Supplementary Table S3), did not significantly change the association between hyperuricemia and mortality in stroke patients. Furthermore, treating serum uric acid as a continuous variable was associated with all-cause mortality and cardiovascular disease mortality in stroke patients. However, in the quartile analysis, only the highest quartile (SUA > 410.4 μmol/L) showed a statistically significant association with all-cause mortality in stroke patients (Supplementary Table S4).
Discussion
This study is the largest sample size investigation to date based on NHANES data examining the association between uric acid and stroke prevalence, as well as mortality risk in stroke patients. We found that higher uric acid levels are associated with stroke prevalence, consistent with previous studies from various cohorts (23–25). A single-center emergency study has confirmed that serum uric acid levels are significantly elevated in stroke patients (especially those with ischemic stroke) presenting to the emergency department. The study also found that hyperuricemia increased the risk of ischemic stroke by 2.4 times, while hypouricemia reduced the risk. This suggests that monitoring uric acid levels in the emergency setting holds potential value for identifying stroke, particularly ischemic stroke (26). Furthermore, hyperuricemia was associated with increased mortality risk in stroke patients. The Kaplan–Meier survival curves showed that stroke patients with hyperuricemia had significantly reduced survival rates. Cox regression analysis further confirmed this finding; even after adjusting for multiple covariates, hyperuricemia remained an independent predictor of mortality.
It remains controversial, however, whether SUA levels affect stroke prognosis. Some studies have shown a significant positive correlation between SUA levels and the prognosis of ischemic stroke (27, 28) with a greater impact observed in women (29). Higher SUA levels pose a higher mortality risk in elderly women over 50 years old (30) and some studies have identified it as an independent predictor of stroke in elderly postmenopausal women (31), which aligns with our results (steeper RCS in women and higher HR in female patients in subgroup analysis). Conversely, other studies have shown no significant correlation between serum uric acid levels and ischemic stroke prognosis (32) and some have even suggested that higher uric acid levels have neuroprotective effects after acute ischemic stroke (19, 20). Given the longer follow-up time in NHANES data, our results tend to reveal the association between hyperuricemia and long-term poor prognosis in stroke patients, enabling a more thorough understanding of SUA levels’ impact on stroke prognosis.
The potential mechanisms underlying the association between hyperuricemia and increased mortality in stroke patients are multifaceted. First, elevated serum uric acid levels may lead to endothelial dysfunction (33, 34) and oxidative stress (35). Importantly, our mediation analysis specifically identified systemic inflammation (measured by SII and CRP) as a significant pathway linking hyperuricemia to mortality. This finding aligns with substantial evidence linking hyperuricemia to pro-inflammatory states (36, 37), which can directly damage the vasculature and promote adverse outcomes. The significant mediation effects through SII and CRP provide empirical support for the role of inflammation in this association. Moreover, uric acid may exacerbate stroke prognosis by altering platelet reactivity (38) and promoting vascular calcification (39). The endothelial dysfunction pathway, suggested by uric acid’s link to reduced nitric oxide production, is also a plausible contributor to mortality risk, although it was not explicitly captured as a mediator in our current analysis. The metabolic syndrome (including hypertension, insulin resistance, and dyslipidemia) and hyperuricemia are also related (40), which may further worsen stroke outcomes through complex interactions involving the mechanisms described above.
Notably, the slight increase in HR in the fully adjusted model indicates a robust association between hyperuricemia and poorer survival outcomes. Mediation analysis further showed that SII and CRP partially mediated the effect of hyperuricemia on mortality in stroke patients. The inflammatory marker SII, composed of platelet count, neutrophil count, and lymphocyte count (41), is closely related to atherosclerosis and cardiovascular diseases (42, 43). CRP is a well-established inflammatory marker. Therefore, we suggest that inflammation plays a mediating role in this association. Additionally, when evaluating SUA quartiles, only the highest quartile (SUA > 410.4 μmol/L) was significantly associated with stroke mortality, which is close to the clinical threshold for defining hyperuricemia, indicating that patients with extremely high serum uric acid levels may face a higher risk of stroke mortality.
However, this study has several limitations. First, stroke diagnosis relied on self-reported questionnaire data. Although this approach is practical for large-scale cohort studies, it is susceptible to misclassification: participants may underreport stroke events due to unrecognized clinical symptoms (e.g., silent strokes), recall bias, or misinterpretation of questions, potentially leading to an underestimation of the true effect size. Second, SUA levels were based on a single measurement. SUA concentration exhibits within-individual variability influenced by factors such as recent diet (e.g., purine intake) and medication use (e.g., diuretics, allopurinol). A single measurement may fail to accurately capture an individual’s long-term average SUA exposure level during the critical period preceding the stroke event. As with all observational studies, not all potential confounding factors could be adjusted for in the statistical model; unmeasured confounders (such as urate-lowering medication information not directly available in the NHANES database) may still influence the results. The inflammatory biomarkers assessed in this study (CRP and SII), while biologically significant and clinically useful, do not encompass a broader range of markers specific to particular inflammatory pathways (such as specific cytokines, adhesion molecules, etc.). These additional markers could potentially provide deeper mechanistic insights. Future research should incorporate more comprehensive inflammatory profiling to further elucidate the specific inflammatory mechanisms through which uric acid influences stroke risk. Although our mediation analysis suggested a potential mediating role of inflammation in the association between SUA and stroke, it is imperative to emphasize that analyses based on observational data cannot definitively establish causality. More precise experimental or longitudinal studies are needed to confirm the mediating role of inflammation and further elucidate its underlying mechanisms. The findings of this study are based on NHANES data, with its national representativeness being its core strength. However, further validation is needed in other independent populations, particularly diverse national or ethnic populations, in the future. This study acknowledges the potential confounding effects of urate-lowering medications and other substances on serum uric acid levels. However, due to structural limitations in NHANES medication data — including non-continuous assessment of medication history (captured only within 30-day recall windows), absence of dosage/duration information, and significant rates of missing data and underreporting of over-the-counter medications — reliable adjustment for these confounders was not feasible. This limitation, common to observational studies utilizing NHANES, is explicitly noted to contextualize our findings. Future prospective studies with longitudinal medication records are warranted to validate these associations. Finally, due to the nature of NHANES data, we were unable to differentiate between ischemic stroke and hemorrhagic stroke. Future prospective studies with rigorous subtype determination (e.g., based on neuroimaging) and larger stroke cohorts are needed to investigate potential differential mechanisms.
Conclusion
In this study, we found that hyperuricemia is significantly associated with increased prevalence of stroke among U.S. adults and is an independent predictor of higher all-cause and cardio-cerebrovascular mortality in stroke patients. Importantly, the mediation analysis indicates that inflammation partially mediates this association. Our study underscores the importance of monitoring and managing SUA levels to improve stroke outcomes. We recommend further research to explore the underlying biological mechanisms and to evaluate whether interventions targeting hyperuricemia could reduce mortality in stroke patients.
Statements
Data availability statement
Publicly available datasets were analyzed in this study. This data can be found at: https://www.cdc.gov/nchs/nhanes/.
Ethics statement
Ethical review and approval was not required for the study on human participants in accordance with the local legislation and institutional requirements. Written informed consent from the patients/participants or patients/participants' legal guardian/next of kin was not required to participate in this study in accordance with the national legislation and the institutional requirements.
Author contributions
YH: Data curation, Project administration, Writing – original draft, Visualization, Conceptualization, Writing – review & editing, Validation, Investigation, Software, Methodology, Formal analysis. JY: Writing – original draft, Visualization, Formal analysis, Project administration, Data curation, Writing – review & editing, Investigation. ZF: Writing – review & editing, Formal analysis, Investigation, Writing – original draft, Data curation, Project administration. ZW: Formal analysis, Data curation, Writing – review & editing, Writing – original draft, Investigation. MQ: Resources, Writing – original draft, Methodology, Project administration, Conceptualization, Writing – review & editing, Funding acquisition, Supervision.
Funding
The author(s) declare that no financial support was received for the research and/or publication of this article.
Acknowledgments
We thank NCHS for providing the NHANES data. We also acknowledge the participants and staff involved in NHANES for their valuable contributions to this research.
Conflict of interest
The authors declare that the research was conducted in the absence of any commercial or financial relationships that could be construed as a potential conflict of interest.
Generative AI statement
The authors declare that no Gen AI was used in the creation of this manuscript.
Publisher’s note
All claims expressed in this article are solely those of the authors and do not necessarily represent those of their affiliated organizations, or those of the publisher, the editors and the reviewers. Any product that may be evaluated in this article, or claim that may be made by its manufacturer, is not guaranteed or endorsed by the publisher.
Supplementary material
The Supplementary material for this article can be found online at: https://www.frontiersin.org/articles/10.3389/fneur.2025.1599730/full#supplementary-material
- NHANES
National Health and Nutrition Examination Survey
- SUA
Serum Uric Acid
- CVDs
Cardiovascular Diseases
- BMI
Body Mass Index
- TC
Total Cholesterol
- AST
Aspartate Aminotransferase
- ALT
Alanine Aminotransferase
- CHD
Coronary Heart Disease
- ROC
Receiver Operating Characteristic
- AUC
Area Under the Curve
- HR
Hazard Ratio
- CI
Confidence Interval
- ACME
Average Causal Mediation Effect
- ADE
Average Direct Effect
- SD
Standard Deviation
- CRP
C-reactive Protein
- SII
Systemic Inflammatory Index
- RCS
Restricted Cubic Spline
- KM
Kaplan–Meier
- P
p-value
Glossary
References
1.
Collaborators GS . Global, regional, and national burden of stroke and its risk factors, 1990-2019: a systematic analysis for the global burden of disease study 2019. Lancet Neurol. (2021) 20:795–820. doi: 10.1016/S1474-4422(21)00252-0
2.
Wang Y Li Z Zhao X Wang D Li H Xian Y et al . Stroke care quality in China: substantial improvement, and a huge challenge and opportunity. Int J Stroke. (2017) 12:229–35. doi: 10.1177/1747493017694392
3.
Saini V Guada L Yavagal DR . Global epidemiology of stroke and access to acute ischemic stroke interventions. Neurology. (2021) 97:S6–S16. doi: 10.1212/WNL.0000000000012781
4.
GBD 2021 Stroke Risk Factor Collaborators . Global, regional, and national burden of stroke and its risk factors, 1990-2021: a systematic analysis for the global burden of disease study 2021. Lancet Neurol. (2024) 23:973. doi: 10.1016/S1474-4422(24)00369-7
5.
Feigin VL Brainin M Norrving B Martins S Sacco RL Hacke W et al . World stroke organization (WSO): global stroke fact sheet 2022. Int J Stroke. (2022) 17:18–29. doi: 10.1177/17474930211065917
6.
Owolabi MO Thrift AG Mahal A Ishida M Martins S Johnson WD et al . Primary stroke prevention worldwide: translating evidence into action. Lancet Public Health. (2022) 7:e74–85. doi: 10.1016/S2468-2667(21)00230-9
7.
Zhang M Zhu X Wu J Huang Z Zhao Z Zhang X et al . Prevalence of hyperuricemia among Chinese adults: findings from two nationally representative cross-sectional surveys in 2015-16 and 2018-19. Front Immunol. (2021) 12:791983. doi: 10.3389/fimmu.2021.791983
8.
Mortada I . Hyperuricemia, type 2 diabetes mellitus, and hypertension: an emerging association. Curr Hypertens Rep. (2017) 19:69. doi: 10.1007/s11906-017-0770-x
9.
Dehlin M Jacobsson L Roddy E . Global epidemiology of gout: prevalence, incidence, treatment patterns and risk factors. Nat Rev Rheumatol. (2020) 16:380–90. doi: 10.1038/s41584-020-0441-1
10.
Tian X Chen S Wang P Xu Q Zhang Y Zhang X et al . Temporal relationship between hyperuricemia and hypertension and its impact on future risk of cardiovascular disease. Eur J Intern Med. (2023) 111:82–9. doi: 10.1016/j.ejim.2023.02.023
11.
Braga F Pasqualetti S Ferraro S Panteghini M . Hyperuricemia as risk factor for coronary heart disease incidence and mortality in the general population: a systematic review and meta-analysis. Clin Chem Lab Med. (2016) 54:7–15. doi: 10.1515/cclm-2015-0523
12.
Borghi C Agabiti-Rosei E Johnson RJ Kielstein JT Lurbe E Mancia G et al . Hyperuricaemia and gout in cardiovascular, metabolic and kidney disease. Eur J Intern Med. (2020) 80:1–11. doi: 10.1016/j.ejim.2020.07.006
13.
Crawley WT Jungels CG Stenmark KR Fini MA . U-shaped association of uric acid to overall-cause mortality and its impact on clinical management of hyperuricemia. Redox Biol. (2022) 51:102271. doi: 10.1016/j.redox.2022.102271
14.
Liu Y-F Han L Geng Y-H Wang H-H Yan J-H Tu S-H . Nonlinearity association between hyperuricemia and all-cause mortality in patients with chronic kidney disease. Sci Rep. (2024) 14:673. doi: 10.1038/s41598-023-51010-6
15.
Otaki Y Konta T Ichikawa K Fujimoto S Iseki K Moriyama T et al . Possible burden of hyperuricaemia on mortality in a community-based population: a large-scale cohort study. Sci Rep. (2021) 11:8999. doi: 10.1038/s41598-021-88631-8
16.
Li X Meng X Timofeeva M Tzoulaki I Tsilidis KK Ioannidis JPA et al . Serum uric acid levels and multiple health outcomes: umbrella review of evidence from observational studies, randomised controlled trials, and Mendelian randomisation studies. BMJ. (2017) 357:j2376. doi: 10.1136/bmj.j2376
17.
Keenan T Zhao W Rasheed A Ho WK Malik R Felix JF et al . Causal assessment of serum urate levels in Cardiometabolic diseases through a Mendelian randomization study. J Am Coll Cardiol. (2016) 67:407–16. doi: 10.1016/j.jacc.2015.10.086
18.
Seet RCS Kasiman K Gruber J Tang S-Y Wong M-C Chang H-M et al . Is uric acid protective or deleterious in acute ischemic stroke? A prospective cohort study. Atherosclerosis. (2010) 209:215–9. doi: 10.1016/j.atherosclerosis.2009.08.012
19.
Chamorro A Obach V Cervera A Revilla M Deulofeu R Aponte JH . Prognostic significance of uric acid serum concentration in patients with acute ischemic stroke. Stroke. (2002) 33:1048–52. doi: 10.1161/hs0402.105927
20.
Wang Z Lin Y Liu Y Chen Y Wang B Li C et al . Serum uric acid levels and outcomes after acute ischemic stroke. Mol Neurobiol. (2016) 53:1753–9. doi: 10.1007/s12035-015-9134-1
21.
Cheng W Bu X Xu C Wen G Kong F Pan H et al . Higher systemic immune-inflammation index and systemic inflammation response index levels are associated with stroke prevalence in the asthmatic population: a cross-sectional analysis of the NHANES 1999-2018. Front Immunol. (2023) 14:1191130. doi: 10.3389/fimmu.2023.1191130
22.
Jiang YA Shen J Chen P Cai J Zhao Y Liang J et al . Association of triglyceride glucose index with stroke: from two large cohort studies and Mendelian randomization analysis. Int J Surg. (2024) 110:5409–16. doi: 10.1097/JS9.0000000000001795
23.
Gao B Bao Y Meng M Yu L Lu Y Sa R et al . Association of serum uric acid with risk of stroke in US adults: a cross-sectional study from NHANES 1999-2020. J Stroke Cerebrovasc Dis. (2023) 32:107206. doi: 10.1016/j.jstrokecerebrovasdis.2023.107206
24.
Li J Muraki I Imano H Cui R Yamagishi K Umesawa M et al . Serum uric acid and risk of stroke and its types: the circulatory risk in communities study (CIRCS). Hypertens Res. (2020) 43:313–21. doi: 10.1038/s41440-019-0385-5
25.
Tian X Chen S Xu Q Wang P Zhang Y Zhang X et al . Cumulative serum uric acid exposure and its time course with the risk of incident stroke. Stroke. (2023) 54:2077–86. doi: 10.1161/STROKEAHA.123.042708
26.
Şengüldür E Demir MC . Evaluation of the Association of Serum Uric Acid Levels and Stroke in emergency department patients. Düzce Tıp Fakültesi Dergisi. (2024) 26:112–7. doi: 10.18678/dtfd.1457023
27.
Lei Z Cai J Hong H Wang Y . Serum uric acid level and outcome of patients with ischemic stroke: a systematic review and meta-analysis. Neurologist. (2019) 24:121–31. doi: 10.1097/NRL.0000000000000234
28.
Weir CJ Muir SW Walters MR Lees KR . Serum urate as an independent predictor of poor outcome and future vascular events after acute stroke. Stroke. (2003) 34:1951–6. doi: 10.1161/01.STR.0000081983.34771.D2
29.
Liu C-Y Hsiao C-L Chen P-Y Tsou A Tzeng IS Lin S-K . J-shaped relationship of serum uric acid with unfavorable short-term outcomes among patients with acute ischemic stroke. Biomedicine. (2022) 10:2185. doi: 10.3390/biomedicines10092185
30.
Mazidi M Katsiki N Mikhailidis DP Banach M . Associations of serum uric acid with total and cause-specific mortality: findings from individuals and pooling prospective studies. Atherosclerosis. (2020) 296:49–58. doi: 10.1016/j.atherosclerosis.2019.07.019
31.
Strasak AM Kelleher CC Brant LJ Rapp K Ruttmann E Concin H et al . Serum uric acid is an independent predictor for all major forms of cardiovascular death in 28, 613 elderly women: a prospective 21-year follow-up study. Int J Cardiol. (2008) 125:232–9. doi: 10.1016/j.ijcard.2007.11.094
32.
Zhang M Wang Y Wang K Yin R Pan X Ma A . Association between uric acid and the prognosis of acute ischemic stroke: a systematic review and meta-analysis. Nutr Metab Cardiovasc Dis. (2021) 31:3016–23. doi: 10.1016/j.numecd.2021.07.031
33.
Saito Y Kitahara H Nakayama T Fujimoto Y Kobayashi Y . Relation of elevated serum uric acid level to endothelial dysfunction in patients with acute coronary syndrome. J Atheroscler Thromb. (2019) 26:362–7. doi: 10.5551/jat.45179
34.
Puddu P Puddu GM Cravero E Vizioli L Muscari A . Relationships among hyperuricemia, endothelial dysfunction and cardiovascular disease: molecular mechanisms and clinical implications. J Cardiol. (2012) 59:235–42. doi: 10.1016/j.jjcc.2012.01.013
35.
Strazzullo P Puig JG . Uric acid and oxidative stress: relative impact on cardiovascular risk?Nutr Metab Cardiovasc Dis. (2007) 17:409–14. doi: 10.1016/j.numecd.2007.02.011
36.
Spiga R Marini MA Mancuso E Di Fatta C Fuoco A Perticone F et al . Uric acid is associated with inflammatory biomarkers and induces inflammation via activating the NF-κB signaling pathway in Hep G2 cells. Arterioscler Thromb Vasc Biol. (2017) 37:1241–9. doi: 10.1161/ATVBAHA.117.309128
37.
Kang D-H Park S-K Lee I-K Johnson RJ . Uric acid-induced C-reactive protein expression: implication on cell proliferation and nitric oxide production of human vascular cells. J Am Soc Nephrol. (2005) 16:3553–62. doi: 10.1681/ASN.2005050572
38.
Ginsberg MH Kozin F O'Malley M McCarty DJ . Release of platelet constituents by monosodium urate crystals. J Clin Invest. (1977) 60:999–1007. doi: 10.1172/JCI108880
39.
Drivelegka P Forsblad-d'Elia H Angerås O Bergström G Schmidt C Jacobsson LTH et al . Association between serum level of urate and subclinical atherosclerosis: results from the SCAPIS pilot. Arthritis Res Ther. (2020) 22:37. doi: 10.1186/s13075-020-2119-0
40.
Copur S Demiray A Kanbay M . Uric acid in metabolic syndrome: does uric acid have a definitive role?Eur J Intern Med. (2022) 103:4–12. doi: 10.1016/j.ejim.2022.04.022
41.
Hu B Yang X-R Xu Y Sun Y-F Sun C Guo W et al . Systemic immune-inflammation index predicts prognosis of patients after curative resection for hepatocellular carcinoma. Clin Cancer Res. (2014) 20:6212–22. doi: 10.1158/1078-0432.CCR-14-0442
42.
Xu M Chen R Liu L Liu X Hou J Liao J et al . Systemic immune-inflammation index and incident cardiovascular diseases among middle-aged and elderly Chinese adults: the Dongfeng-Tongji cohort study. Atherosclerosis. (2021) 323:20–9. doi: 10.1016/j.atherosclerosis.2021.02.012
43.
Jin Z Wu Q Chen S Gao J Li X Zhang X et al . The associations of two novel inflammation indexes, SII and SIRI with the risks for cardiovascular diseases and all-cause mortality: a ten-year follow-up study in 85,154 individuals. J Inflamm Res. (2021) 14:131–40. doi: 10.2147/JIR.S283835
Summary
Keywords
hyperuricemia, stroke, mortality, inflammation, NHANES, mediation analysis
Citation
He Y, You J, Fan Z, Wang Z and Qian M (2025) Inflammation mediates the association between hyperuricemia and stroke mortality: a cohort study. Front. Neurol. 16:1599730. doi: 10.3389/fneur.2025.1599730
Received
19 May 2025
Accepted
21 July 2025
Published
01 August 2025
Volume
16 - 2025
Edited by
Nobuyuki Kobayashi, Mainrain Brain Inc., Japan
Reviewed by
Kanwal Ashiq, Superior University, Pakistan
Juan Du, Xuzhou Central Hospital, China
Erdinç Şengüldür, Duzce Universitesi Tip Fakultesi, Türkiye
Mikel Jordhani, Universidad Catolica San Antonio de Murcia Biblioteca, Spain
Updates
Copyright
© 2025 He, You, Fan, Wang and Qian.
This is an open-access article distributed under the terms of the Creative Commons Attribution License (CC BY). The use, distribution or reproduction in other forums is permitted, provided the original author(s) and the copyright owner(s) are credited and that the original publication in this journal is cited, in accordance with accepted academic practice. No use, distribution or reproduction is permitted which does not comply with these terms.
*Correspondence: Min Qian, qianmin@ctgu.edu.cn
Disclaimer
All claims expressed in this article are solely those of the authors and do not necessarily represent those of their affiliated organizations, or those of the publisher, the editors and the reviewers. Any product that may be evaluated in this article or claim that may be made by its manufacturer is not guaranteed or endorsed by the publisher.