Abstract
Background:
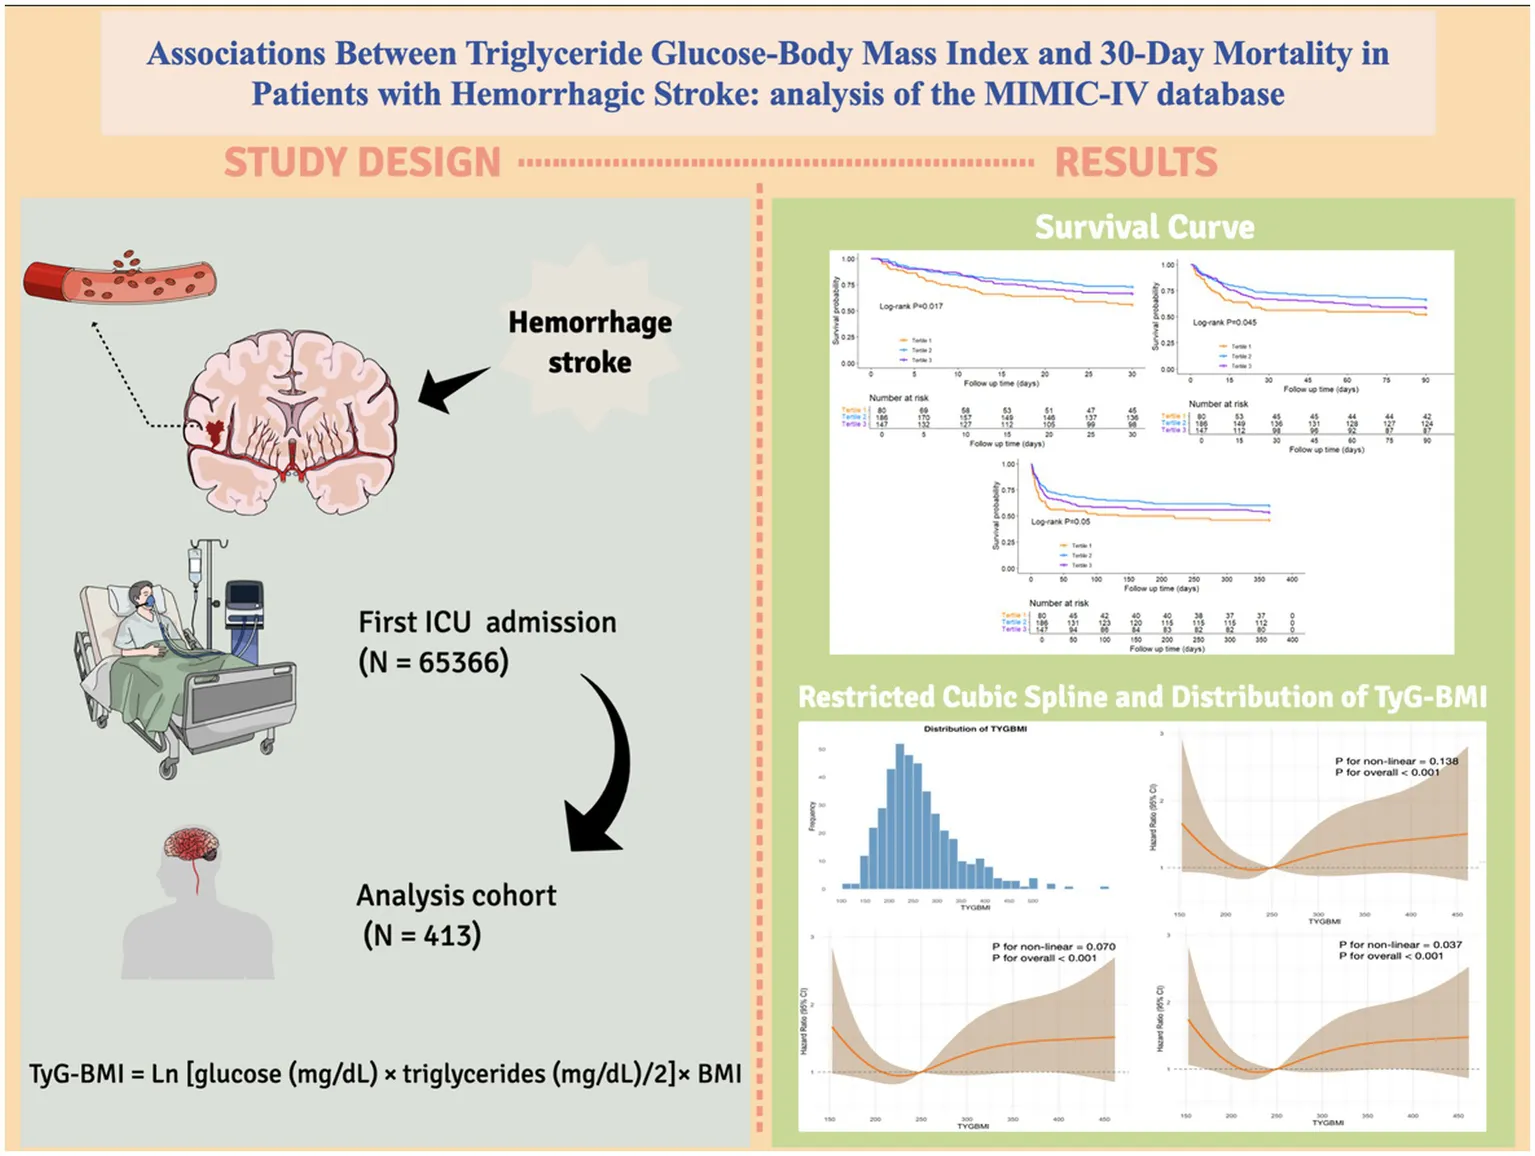
Hemorrhagic stroke (HS), accounting for over 40% of stroke-related deaths, imposes a severe global health burden due to high mortality and disability rates. The triglyceride-glucose-body mass index (TyG-BMI), integrating lipid-glucose metabolism and obesity, has shown prognostic value in cardiovascular diseases but remains underexplored in HS populations.
Methods:
This retrospective cohort study analyzed 413 HS patients from the MIMIC-IV database. Multivariable Cox regression, Kaplan–Meier analysis, and restricted cubic spline models assessed mortality risks at 30-day, 90-day, and 1-year intervals. Subgroup analysis and interaction tests were performed to evaluate the robustness of the results.
Results:
Compared with the intermediate TyG-BMI group, the low TyG-BMI group exhibited a significantly increased risk of death at 30 days (adjusted hazard ratio [aHR] = 1.836, p = 0.010), 90 days (aHR = 1.694, p = 0.016), and 1 year (aHR = 1.642, p = 0.014). Similarly, the high TyG-BMI group also showed higher mortality risk at 30 days (aHR = 1.584, p = 0.039), 90 days (aHR = 1.571, p = 0.024), and 1 year (aHR = 1.484, p = 0.030). Kaplan–Meier analysis revealed the highest survival rate in the middle tertile group. Restricted cubic spline curve showed a U-shaped relationship emerged between TyG-BMI and mortality. No interactions between TyG-BMI and the stratified variables, except for coronary artery disease.
Conclusion:
Patients with intermediate TyG-BMI levels have a lower 30-day mortality risk. As a composite metabolic-nutritional marker, TyG-BMI aids risk stratification in intensive care unit settings.
Introduction
Stroke is a leading cause of death and long-term disability worldwide, placing a substantial burden on global healthcare systems (1, 2). Hemorrhagic stroke (HS), which includes intracerebral hemorrhage (ICH) and spontaneous subarachnoid hemorrhage (SAH), accounts for 27.9 and 9.7% of all stroke cases, respectively (3). However, due to its catastrophic neurological consequences, it is responsible for over 40% of stroke-related deaths (4). Notably, the mortality and disability rates associated with hemorrhagic stroke are significantly higher than those associated with ischemic stroke, especially in low-and middle-income countries (5). This underscores the urgent need for reliable prognostic biomarkers to identify high-risk patients early, optimize treatment allocation, and improve clinical outcomes.
Insulin resistance (IR), characterized by hyperglycemia, dyslipidemia, obesity, and hypertension, is a key metabolic driver of stroke (6). The triglyceride-glucose-body mass index (TyG-BMI), calculated as the product of fasting triglycerides, fasting blood glucose, and body mass index (BMI), integrates lipid metabolism, glucose status, and obesity into a single index. It has been shown to outperform individual parameters in assessing IR and predicting cardiovascular diseases (7). Interestingly, recent studies have reported conflicting findings. In stroke cohorts, lower TyG-BMI has been significantly associated with higher long-term all-cause mortality risk (8), whereas in ischemic stroke cohorts, TyG-BMI has shown a positive correlation with mortality (9). These contradictory observations highlight that the prognostic role of TyG-BMI may depend on specific clinical contexts, warranting disease-specific investigations.
Although the prognostic value of TyG-BMI has been established in ischemic stroke and cardiovascular diseases, its role in hemorrhagic stroke populations remains underexplored, particularly among patients at higher risk of systemic complications such as metabolic instability, and secondary brain injury.
This study, utilizing data from the MIMIC-IV database, aims to assess the association between TyG-BMI and all-cause mortality in HS patients, to establish it as a predictive tool for early risk stratification and personalized interventions to reduce global disease burden.
Methods
Data source and data privacy
This retrospective cohort study is based on health-related data obtained from the MIMIC-IV database version 3.0. The MIMIC-IV database contains comprehensive and extensive medical records of patients admitted to the intensive care unit (ICU) at Beth Israel Deaconess Medical Center (BIDMC, Boston, MA, United States) (10). The author, Yuexin Lu, completed the Collaborative Institutional Training Initiative (CITI) program (record ID: 12901560), which granted access to and permission for data extraction from the MIMIC-IV database. Given the deidentified nature of the data, the Institutional Review Board of Beth Israel Deaconess Medical Center waived the requirement for informed consent.
Study population
This retrospective study included patients diagnosed with ICH and SAH based on the International Classification of Diseases, 9th and 10th revisions. The exclusion criteria were as follows: (1) patients with multiple ICU admissions due to HS, with data extracted only from their first admission; (2) patients whose key data such as blood glucose, triglycerides, and body mass index were missing; (3) patients with an ICU stay of less than 24 h; and (4) patients under the age of 18 years at the time of first admission. Ultimately, 413 HS patients were included in this study. The inclusion flowchart is shown in Figure 1.
Figure 1

Flowchart of participant selection.
Data collection and management of missing values
Data were extracted via PostgreSQL 16.4 and Navicat Premium version 17 from the database using Structured Query Language (SQL). Comprehensive data regarding each patient were collected, such as demographic variables: age, gender, race, height, and weight; clinical severity scores at admission: the Glasgow Coma Scale, Sequential Organ Failure Assessment (SOFA) score, and Acute Physiology Score III (APSIII); comorbidities: hypertension, diabetes, chronic obstructive pulmonary disease (COPD), arrhythmia, coronary artery disease (CAD), sepsis, liver disease, hyperlipemia, ventilator-associated pneumonia, Charlson comorbidity index; laboratory markers: triglyceride, glucose, red blood cells, white blood cells, platelets, hemoglobin, creatinine, chloride, albumin, blood urea nitrogen, sodium, potassium, lactate, bicarbonate, prothrombin time and international normalized ratio; treatment methods: includes vasopressors, anticoagulants, antiplatelet drugs, lipid-lowering drugs, and oxygen delivery; clinical outcomes: Length of stay (LOS) in ICU, LOS in hospital; ICU, in-hospital, 30-day; 90-day, 1-year, ICU, in-hospital mortality. All laboratory markers and severity scores were extracted from the first recorded data after ICU admission.
Outcomes and measures
The primary outcome of this study was 30-day all-cause mortality. While the secondary outcomes included 90-day mortality, 1-year mortality, ICU mortality, and in-hospital mortality.
To minimize potential bias caused by missing data, variables with more than 20% missing values were excluded from the study. The results of the data integrity checks are shown in the Supplementary Table 1. Multiple imputation was performed on variables with less than 20% missing values using the “mice” package in R software.
TyG-BMI calculation
The TyG was computed as follows: Ln [glucose (mg/dL) × triglycerides (mg/dL)/2] while BMI was calculated by dividing the body weight (kg) by the square of height (m) (kg/m2). The TyG-BMI index was calculated as TyG × BMI.
In this study, we grouped the variable TyG-BMI to explore its relationship with survival time and mortality risk. To determine the optimal cutoff point, we utilized the surv_cutpoint function from the R package “survival,” which identifies the best cutoff by maximizing the differences in survival data. After calculating the first optimal cutoff point using this method, to ensure a reasonable sample size for the intermediate group and statistically significant differences between groups, we set the second cutoff point to 1.35 times the first cutoff point. After obtaining the two cutoff points, we manually divided the data into three groups.
Statistical analysis
For continuous variables with a normal distribution, Student’s t-test and one-way ANOVA are used, and the results are presented as mean ± standard deviation (SD). For skewed or non-normally distributed continuous variables, the Kruskal-Wallis rank-sum test is used for comparison, and the results are presented as median with interquartile range (IQRs). Fisher’s exact test or chi-square test is used for analyzing categorical variables, and the results are reported as numbers and percentages. We conducted a sensitivity analysis comparing the inclusion cohort with the exclusion cohort, which was defined by missing triglyceride, glucose, and BMI data. The baseline characteristics and crude outcomes between the inclusion and exclusion cohorts are presented in Supplementary Table 2. Kaplan–Meier curves were used to visualize the incidence of endpoints in survival analysis. Univariate and multivariate cox proportional hazard models were employed to determine the impact of TyG-BMI levels on the mortality in HS patients. The multivariate models included variables related to clinical outcomes and prognosis: Model 1: unadjusted; Model 2: adjusted for age, gender, and ethnicity; Model 3: based on the results of the univariate Cox regression analysis, adjusted for age, gender, SOFA score, hypertension, arrhythmias, liver failure, urea, white blood cells, hemoglobin, chloride, vasopressors, oxygen delivery, antiplatelet, anticoagulants, and lipid-lowering drugs. The results are reported as adjusted hazard ratios (aHRs) with 95% confidence intervals. Before including covariates in the multivariate model, we assessed multicollinearity using the variance inflation factor and reported the diagnostic results. Subgroup analyses were performed to determine the robustness of the result, with the results visually described through a forest plot. Restricted cubic spline (RCS) curve analysis was performed to investigate the dose-effect relationship between TyG-BMI and mortality in HS patients. The receiver operating characteristic curve was used to evaluate the predictive efficacy of TyG-BMI.
Statistical analyses were performed using STATA 14.0, R software (version 4.4.2), and SPSS 25.0 (IBM SPSS Statistics, Armonk, NY, United States). A two-tailed p-value < 0.05 was considered statistically significant.
Results
Baseline characteristics
As shown in Table 1, this study included 413 critically ill HS patients, with a median age of 66.77 (21.21), and 58.8% were male. Participants were divided into low (n = 80), intermediate (n = 186), and high (n = 147) TyG-BMI groups. There were significant differences between the three groups in terms of age, SOFA score, diabetes, sepsis, ventilator-associated pneumonia, white blood cells, creatinine, urea, international normalized ratio, oxygen delivery, vasopressor use, and anticoagulant medication. The high TyG-BMI group had a significantly lower median age (p = 0.001) and more severe condition which has indicated by SOFA scores (p = 0.002). The prevalence of comorbidities, including diabetes (p < 0.05), sepsis (p = 0.009), and ventilator-associated pneumonia (p = 0.001), was higher in the high TyG-BMI group. In laboratory indicators, the high TyG-BMI group had higher levels of white blood cells (p = 0.019), creatinine (p < 0.001), urea (p = 0.036), and international normalized ratio (p = 0.002). The low TyG-BMI group had a lower oxygen delivery rate (p = 0.025) and anticoagulant usage rate (p = 0.002). The intermediate TyG-BMI group had a lower vasopressor usage rate (p = 0.014). Regarding clinical outcomes, the high TyG-BMI group had a longer ICU stay (p = 0.001) and longer hospital stay (p = 0.008), while the intermediate TyG-BMI group had lower 30-day mortality (p = 0.025) and ICU mortality (p = 0.025).
Table 1
| Variable | Overall | Low TyG-BMI (<201.6) | Middle TyG-BMI (201.7–271.9) | High TyG-BMI (>272.0) | P value |
|---|---|---|---|---|---|
| 413 | 80 | 186 | 147 | ||
| TyG-BMI | 249.41 (90.18) | 177.62 (31.60) | 237.24 (34.07) | 328.01 (86.79) | <0.001 |
| Demographics | |||||
| Age, years | 66.77 (21.21) | 68.56 (21.24) | 68.71 (21.78) | 62.29 (18.96) | 0.001 |
| Men, n (%) | 243 (58.8%) | 38 (47.5%) | 117 (62.9%) | 88 (59.9%) | 0.061 |
| Body mass index, kg/cm2 | 27.81 (8.17) | 20.71 (3.49) | 26.56 (3.48) | 34.65 (8.90) | <0.001 |
| Race/ethnicity, n (%) | 0.433 | ||||
| White | 162 (39.2%) | 35 (43.8%) | 69 (37.1%) | 58 (39.5%) | |
| Black | 45 (10.9%) | 7 (8.8%) | 21 (11.3%) | 17 (11.6%) | |
| Asian | 13 (3.1%) | 3 (3.8%) | 9 (4.8%) | 1 (0.7%) | |
| Other or unknown | 193 (46.7%) | 35 (43.8%) | 87 (46.8%) | 71 (48.3%) | |
| Clinical severity | |||||
| GCS | 15 (3) | 15 (3) | 14 (3) | 15 (2) | 0.395 |
| SOFA | 3 (3) | 3 (4) | 3 (3) | 4 (5) | 0.002 |
| APS III | 39 (23) | 38 (21) | 37 (21) | 40 (27) | 0.075 |
| Comorbidities | |||||
| Hypertension, n (%) | 234 (56.7%) | 45 (56.3%) | 107 (57.5%) | 82 (55.8%) | 0.947 |
| Diabetes mellitus, n (%) | 123 (29.8%) | 10 (12.5%) | 47 (25.3%) | 66 (44.9%) | <0.05 |
| COPD, n (%) | 22 (5.3%) | 4 (5.0%) | 9 (4.8%) | 9 (6.1%) | 0.865 |
| Arrhythmias, n (%) | 154 (37.3%) | 24 (30.0%) | 71 (38.2%) | 59 (40.1%) | 0.303 |
| CAD, n (%) | 55 (13.3%) | 8 (10.0%) | 25 (13.4%) | 22 (15.0%) | 0.574 |
| Sepsis, n (%) | 18 (4.4%) | 0 (0.0%) | 6 (3.2%) | 12 (8.2%) | 0.009 |
| Liver disease, n (%) | 36 (8.7%) | 7 (8.8%) | 14 (7.5%) | 15 (10.2%) | 0.691 |
| Hyperlipemia, n (%) | 3 (0.7%) | 1 (1.3%) | 2 (0.6%) | 0 | 0.429 |
| Ventilator-associated pneumonia, n (%) | 67 (16.2%) | 7 (8.8%) | 23 (12.4%) | 37 (25.2%) | 0.001 |
| Charlson comorbidity index, n (%) | 6.0 (4.0) | 6.0 (4.0) | 6.0 (4.0) | 5.0 (3.0) | 0.234 |
| Laboratory parameters | |||||
| Triglyceride, mg/dL | 116.0 (96.0) | 79.0 (47.0) | 110.0 (76.0) | 149.0 (124.0) | <0.001 |
| Glucose, mg/dL | 126.0 (58.0) | 110.5 (39.0) | 121.0 (54.0) | 146.0 (72.0) | <0.001 |
| RBC, K/uL | 4.12 (0.86) | 4.04 (0.86) | 4.12 (0.82) | 4.22 (0.85) | 0.091 |
| WBC, m/uL | 11.2 (5.9) | 9.9 (6.8) | 10.9 (5.5) | 12.2 (5.9) | 0.019 |
| Platelet, K/uL | 206.0 (95.5) | 208.0 (104.0) | 193.0 (97.0) | 219.0 (91.0) | 0.076 |
| Hemoglobin, g/dl | 12.4 (2.9) | 12.05 (3.1) | 12.3 (3.0) | 12.6 (2.7) | 0.298 |
| Creatinine, mg/dl | 0.9 (0.5) | 0.8 (0.4) | 0.9 (0.4) | 1.0 (0.5) | <0.001 |
| Chloride, mEq/L | 104.0 (6.0) | 104.0 (7.0) | 104.0 (6.0) | 103.0 (7.0) | 0.383 |
| Bicarbonate, mEq/L | 22.0 (4.0) | 22.0 (4.0) | 22.0 (3.0) | 22.0 (3.0) | 0.500 |
| Urea, mg/dl | 16.0 (12.0) | 13.0 (10.0) | 16.0 (11.0) | 18.0 (13.0) | 0.036 |
| Prothrombin time, s | 12.9 (2.1) | 12.6 (2.4) | 13.0 (2.2) | 13.1 (1.8) | 0.129 |
| International normalized ratio | 1.2 (0.2) | 1.2 (0.2) | 1.2 (0.2) | 1.2 (0.3) | 0.002 |
| Treatment | |||||
| Vasopressors, n (%) | 94 (22.8%) | 22 (27.5%) | 30 (16.1%) | 42 (28.6%) | 0.014 |
| Oxygen delivery, n (%) | 270 (65.4%) | 42 (52.5%) | 126 (67.7%) | 102 (69.4%) | 0.025 |
| Antiplatelet | 124 (30.0%) | 18 (22.5%) | 60 (32.3%) | 46 (31.3%) | 0.258 |
| Anticoagulation | 366 (88.6%) | 62 (77.5%) | 171 (91.9%) | 133 (90.5%) | 0.002 |
| Lipid-lowering | 115 (27.8%) | 21 (26.3%) | 53 (28.5%) | 41 (27.9%) | 0.932 |
| Clinical outcomes | |||||
| LOS ICU, day | 9.77 (12.99) | 7.31 (10.45) | 8.99 (10.90) | 12.55 (15.16) | 0.001 |
| LOS Hospital, day | 15.50 (18.99) | 11.09 (17.35) | 14.94 (17.91) | 18.25 (21.75) | 0.008 |
| All-cause mortality | |||||
| In-hospital mortality, n (%) | 110 (26.6%) | 23 (28.7%) | 41 (22.0%) | 46 (41.8%) | 0.148 |
| ICU mortality, n (%) | 98 (23.7%) | 17 (21.3%) | 35 (18.8%) | 46 (31.3%) | 0.025 |
| 30-day mortality, n (%) | 134 (32.4%) | 35 (43.8%) | 50 (26.9%) | 49 (33.3%) | 0.025 |
| 90-day mortality, n (%) | 160 (38.7%) | 38 (47.5%) | 62 (33.3%) | 60 (40.8%) | 0.076 |
| 1-year mortality, n (%) | 185 (44.8%) | 43 (53.8%) | 74 (39.8%) | 68 (46.3%) | 0.100 |
Baseline characteristics.
GCS, Glasgow coma scale; SOFA, sequential organ failure assessment; APSIII, acute physiology scores III; COPD, chronic pulmonary disease; CAD, coronary atherosclerotic heart disease; RBC, red blood cell; WBC, white blood cell. LOS, length of stay.
Associations between TyG-BMI and clinical outcomes
The results of the univariate Cox regression analysis and the Multicollinearity Diagnosis are shown in Supplementary Tables 3, 4. Multivariable Cox regression analysis was conducted to assess the effect of TyG-BMI on the mortality risk at different time points in patients with HS, which is shown in Table 2 and Supplementary Table 5. The results revealed that in both the unadjusted model (Model 1) and the model adjusted for age, gender, and race (Model 2), the low TyG-BMI group (Tertile 1) had a significantly higher risk of mortality at 30 days [Model 1: aHR = 1.863, 95% CI: 1.209–2.869, p = 0.005; Model 2: aHR = 1.842, 95% CI: 1.190–2.852, p = 0.006], 90 days, and 1 year compared to the intermediate TyG-BMI group (Tertile 2), whereas there was no significant difference between the high TyG-BMI group (Tertile 3) and the reference group (Tertile 2) (all p > 0.05). In Model 3, the low TyG-BMI group (Tertile 1) had a significantly higher risk of mortality at 30 days (HR = 1.836, 95% CI: 1.158–2.911, p = 0.010), 90 days (HR = 1.694, 95% CI: 1.104–2.601, p = 0.016), and 1 year (HR = 1.642, 95% CI: 1.107–2.437, p = 0.014) compared to the reference group. The high TyG-BMI group (Tertile 3) also had a significantly higher risk of mortality at 30 days (HR = 1.584, 95% CI: 1.024–2.453, p = 0.039), 90 days (HR = 1.571, 95% CI: 1.062–2.323, p = 0.024), and 1 year (HR = 1.484, 95% CI: 1.038–2.121, p = 0.030) compared to the reference group. These findings suggest that both the low and high TyG-BMI groups are associated with a higher mortality risk, while intermediate TyG-BMI levels have a protective effect for HS patients. Additionally, the trend test (P for trend) results across all models were not statistically significant (all p > 0.05), indicating that there may not be a linear dose–response relationship between TyG-BMI and mortality risk, but rather a U-shaped association.
Table 2
| Model 1 | Model 2 | Model 3 | ||||
|---|---|---|---|---|---|---|
| HR, 95%CI | P value | HR, 95%CI | P value | HR, 95%CI | P value | |
| 30-day mortality | ||||||
| Tertile 1 | 1.863 (1.209–2.869) | 0.005 | 1.842 (1.190–2.852) | 0.006 | 1.836 (1.158–2.911) | 0.010 |
| Tertile 2 | Ref | Ref | Ref | |||
| Tertile 3 | 1.278 (0.862–1.895) | 0.222 | 1.341 (0.899–1.998) | 0.150 | 1.584 (1.024–2.453) | 0.039 |
| P for trend | 0.857 (0.677–1.09) | 0.202 | 0.884 (0.695–1.12) | 0.315 | 0.954 (0.733–1.241) | 0.726 |
| 90-day mortality | ||||||
| Tertile 1 | 1.657 (1.106–2.482) | 0.014 | 1.624 (1.079–2.443) | 0.020 | 1.694 (1.104–2.601) | 0.016 |
| Tertile 2 | Ref | Ref | Ref | |||
| Tertile 3 | 1.278 (0.896–1.822) | 0.176 | 1.351 (0.943–1.936) | 0.102 | 1.571 (1.062–2.323) | 0.024 |
| P for trend | 0.915 (0.735–1.14) | 0.423 | 0.951 (0.762–1.19) | 0.660 | 1.002 (0.787–1.277) | 0.984 |
| 1-year mortality | ||||||
| Tertile 1 | 1.591 (1.093–2.318) | 0.015 | 1.549 (1.059–2.266) | 0.024 | 1.642 (1.107–2.437) | 0.014 |
| Tertile 2 | Ref | Ref | Ref | |||
| Tertile 3 | 1.223 (0.880–1.701) | 0.230 | 1.304 (0.934–1.822) | 0.119 | 1.484 (1.038–2.121) | 0.030 |
| P for trend | 0.91 (0.742–1.11) | 0.361 | 0.953 (0.775–1.17) | 0.650 | 0.989 (0.792–1.235) | 0.920 |
Cox proportional hazard ratios for all-cause mortality at 30-day, 90-day, and 1-year.
HR, hazard ratio; CI, confidence interval; Model 1: unadjusted. Model 2: adjusted age, gender, and ethnicity. Model 3: adjusted for age, gender, SOFA score, hypertension, arrhythmias, liver failure, urea, white blood cells, hemoglobin, chloride, vasopressors, oxygen delivery, antiplatelet, anticoagulants, and lipid-lowering drugs.
The Kaplan–Meier curve was used to compare the mortality outcomes among different TyG-BMI subgroups in HS patients. The analysis revealed significant differences in survival curves between the groups at 30-day (Log-rank p = 0.017; Figure 2A) and 90-day (Log-rank p = 0.045; Figure 2B), and a marginally significant difference at 1-year (Log-rank p = 0.050; Figure 2C). Patients in the lowest TyG-BMI group had the lowest survival rate, while those in the intermediate TyG-BMI group had the highest survival rate. The difference among the three groups in terms of ICU and in-hospital mortality did not reach statistical significance, with log-rank p values of 0.42 and 0.22, respectively (Supplementary Figure 1).
Figure 2

Kaplan–Meier survival analysis curves for (A) 30-day, (B) 90-day, and (C) 1-year all-cause mortality.
Relationship between the TyG-BMI and mortality risk
Figure 3A shows the distribution of TyG-BMI. Across the 30-day (Figure 3B), 90-day (Figure 3C), or 1-year point (Figure 3D), all three RCS curves display a similarly U-shaped pattern. At lower TyG-BMI values, an increase in the index is associated with a reduction in mortality risk. However, once a certain threshold is reached, the mortality risk increases as TyG-BMI continues to rise beyond this threshold. The RCS curves for ICU and in-hospital mortality risk are shown in Supplementary Figure 2.
Figure 3

The (A) distribution of TyG-BMI and the restricted cubic spline curve for (B) 30-day, (C) 90-day, and (D) 1-year all-cause mortality.
The predictive value of clinical TyG-BMI for mortality was assessed using receiver operating characteristic curves (Supplementary Figure 3). However, the area under the curve (AUC) values showed limited predictive ability (30-day mortality AUC: 0.529; 90-day mortality AUC: 0.513; 1-year mortality AUC: 0.523).
Subgroup analysis
To further assess the relationship between TyG-BMI and mortality, we conducted subgroup analyses to evaluate the associations between age (<70 years and ≥70 years), race, hypertension, diabetes, CAD, ventilator-associated pneumonia, COPD, use of vasopressors, and anticoagulants with all-cause mortality at 30-day (Figure 4A), 90-day (Figure 4B), and 1-year (Figure 4C) in HS patients. The subgroup analysis showed that TyG-BMI was significantly associated with a lower risk of mortality at 30-day in HS patients without coronary artery disease (HR 0.77, 95% CI: 0.60–1.00, p = 0.047), and no other subgroup factors significantly influenced the relationship between TyG-BMI and all-cause mortality in HS patients. Interaction tests revealed a significant interaction between coronary artery disease and the 30-day, 90-day, and 1-year mortality risks in HS patients (all interaction p-values < 0.05). For ICU and in-hospital mortality (Supplementary Figure 4), no subgroup factors had a significant effect, and only the use of anticoagulants showed an interaction with in-hospital mortality (p for interaction = 0.007).
Figure 4

Forest plots of hazard ratios for (A) 30-day, (B) 90-day, (C) 1-year all-cause mortality across different subgroups.
Discussion
This study is the first to explore the relationship between TyG-BMI and mortality risk in HS patients using the MIMIC database. It revealed a U-shaped relationship between TyG-BMI and 30-day mortality rates, demonstrating that both low and high levels of TyG-BMI levels are associated with an increased risk of mortality in the United States patient population. Notably, compared to the intermediate TyG-BMI group, the 30-day mortality risk in the low TyG-BMI group was increased by 83.6% (HR = 1.836, p = 0.010), while the 30-day mortality risk in the high TyG-BMI group increased by 58.4% (HR = 1.584, p = 0.039). This pattern remained evident in the 90-day and 1-year mortality analyses. These findings highlighting its potential as a feasible biomarker for predicting mortality risk in HS patients.
The TyG index, a reliable surrogate marker for IR, has become an important predictive tool for stroke risk management in recent years (11–13). Multicenter cohort studies have demonstrated that, compared to stroke patients with lower TyG indices, those with higher TyG indices exhibit significantly greater clinical risks. Specifically, the risk of recurrent stroke increases by 50% (OR = 1.50, 95%CI 1.19–1.89), and the risk of all-cause mortality increases by 40% (OR = 1.40, 95%CI 1.14–1.71) (14). The TyG index has also been linked to an increased incidence of carotid plaque (15).
Obesity, a core component of metabolic syndrome, is closely linked to classic stroke risk factors such as hypertension, diabetes, and dyslipidemia. However, recent studies have revealed a complex relationship between obesity and hemorrhagic stroke prognosis. A study involving 234,863 Korean men demonstrated a J-shaped association between BMI and HS (16). Since obesity leads to hypertension, diabetes, and hypercholesterolemia, these variables may contribute to the increased stroke risk associated with obesity. Interestingly, clinical observations of ICH patients further revealed that in-hospital mortality rates were significantly reduced by 31% (OR = 0.69; 95%CI = 0.62–0.76; p < 0.001) in the obesity group (BMI ≥ 30 kg/m2) and by 15% (OR = 0.85; 95%CI = 0.74–0.97; p = 0.02) in the morbid obesity group (BMI > 40 kg/m2), compared to normal weight patients (17). Notably, prospective studies have shown that underweight patients (BMI < 18.5 kg/m2) exhibit a significantly higher risk (41%) of severe functional impairment (Modified Rankin Scale 5–6) after ICH, compared to those with normal weight (OR: 1.41 [1.01–1.99]). This could be due to decreased tissue repair capacity and impaired immune response caused by malnutrition (18).
TyG-BMI, a composite metabolic index that combines fasting blood glucose, triglycerides, and BMI, has recently gained widespread recognition as a sensitive tool for evaluating IR and cardiovascular metabolic risks (19–21). By integrating both glucose-lipid metabolism abnormalities and obesity, TyG-BMI is considered to provide a more comprehensive reflection of the pathophysiological processes associated with IR compared to individual indices. A moderate TyG-BMI may suggest a balance in energy reserves, potentially placing the body in an optimal state between pro-inflammatory and anti-inflammatory activities. This balance may better support the body’s response to insulin resistance and neuroinflammatory responses during acute hemorrhage, facilitate tissue repair and stress demands (22), and reduce endothelial dysfunction caused by impaired nitric oxide (NO) synthesis due to high IR. It may also reduce the release of adipose tissue inflammatory factors, thereby mitigating systemic inflammation (23). The persistent elevation of TyG-BMI can trigger the continuous release of inflammatory mediators, such as CRP and various cytokines. These inflammatory factors may adversely affect the structural integrity and functional capacity of the vascular endothelium (9). Low TyG-BMI may reflect severe energy deficiency (such as malnutrition or cachexia) or excessive depletion. In malnutrition, energy reserves are low, accompanied by immune suppression and abnormal inflammatory responses, limiting the body’s ability to respond to acute hemorrhage.
We employed RCS to explore the dose–response relationship between IR surrogate indices and HS. Our findings partially align with previous studies, while also revealing important distinctions. Unlike the L-shaped correlation reported by Huang et al. in stroke populations (8), we observed that both low and high TyG-BMI were associated with an increased risk of HS mortality. The higher mortality risk in HS patients with high TyG-BMI may be related to the following reasons: high TyG-BMI exacerbates IR, leading to endothelial dysfunction (reduced nitric oxide synthesis and increased endothelin) (24), which promotes vasospasm and re-rupture. High TyG-BMI also triggers systemic inflammation (increased TNF-α, IL-6) (23), exacerbating perivascular neuroinflammation and secondary brain injury (25). Notably, a study based on the eICU database found high TyG-BMI was associated with an increased risk of mortality in ischemic stroke patients (9), aligns with our finding that high TyG-BMI is associated with increased HS mortality.
The biological plausibility of our study’s findings may be explained by the following complementary mechanisms. First, the protective effect observed at intermediate TyG-BMI levels may reflect an optimal balance of energy reserves and metabolic flexibility, thereby providing protection. As a composite measure of glucose-lipid metabolism and nutritional status, the ideal TyG-BMI level likely balances the utilization of energy substrates with the regulation of inflammation. Intermediate metabolic activity helps the body cope with acute stress responses while avoiding metabolic imbalances caused by excessive obesity or malnutrition. This balance may mitigate or prevent secondary injury triggered by metabolic disturbances and excessive inflammatory responses. Second, lower TyG-BMI levels may indicate severe malnutrition or cachexia, conditions that impair immune function, decrease tissue repair capacity, and increase the risk of infection. In the context of hemorrhagic stroke, these factors can significantly affect patient survival and prognosis.
Our study does have several limitations. First, as a retrospective, single-center analysis based on observational data from the MIMIC-IV database. Although we adjusted for various variables and conducted subgroup analyses, we cannot completely rule out the potential influence of unmeasured confounders on the outcomes. Sensitivity analysis indicated that the exclusion of patients due to missing triglyceride, glucose, and BMI data resulted in some selection bias. We observed that patients in the excluded cohort appeared less acutely ill and had a lower documented burden of relevant comorbidities (especially hypertension, diabetes, CAD). Clinicians may have deemed comprehensive metabolic profiling less immediately necessary for diagnosis or management in these patients. Second, the relatively small sample size limits the generalizability of our findings, and larger cohort studies are needed to further validate our conclusions. Third, the categorization of the TyG-BMI index into three groups based on statistically optimized cutoffs introduces methodological constraints. While this approach aimed to maximize survival differences and ensure comparability between groups, the thresholds used lack established clinical relevance. Future research should focus the prospective validation of standardized TyG-BMI values across diverse ethnic populations, and the integration of inflammatory biomarkers a in mechanistic studies.
Conclusion
This study found that the TyG-BMI index is a potential predictor of 30-day all-cause mortality in patients with HS. There is a similarly U-shaped relationship between TyG-BMI levels and all-cause mortality in these patients. The TyG-BMI index can serve as an effective marker for stratifying and managing HS patients in the ICU.
Statements
Data availability statement
Publicly available datasets were analyzed in this study. This data can be found here: https://physionet.org/content/mimiciv/3.0/.
Ethics statement
The studies involving humans were approved by Beth Israel Deaconess Medical Center’s ethical committee. The studies were conducted in accordance with the local legislation and institutional requirements. Written informed consent for participation was not required from the participants or the participants’ legal guardians/next of kin in accordance with the national legislation and institutional requirements.
Author contributions
YL: Conceptualization, Data curation, Formal analysis, Methodology, Writing – original draft. ES: Conceptualization, Data curation, Writing – review & editing. RC: Conceptualization, Data curation, Writing – review & editing. LJ: Conceptualization, Data curation, Writing – review & editing. JT: Conceptualization, Formal analysis, Writing – review & editing. SS: Conceptualization, Formal analysis, Writing – review & editing. MW: Conceptualization, Writing – review & editing. SW: Conceptualization, Funding acquisition, Writing – review & editing.
Funding
The author(s) declare that financial support was received for the research and/or publication of this article. This work was supported by grants from Zhejiang Province’s Vanguard Geese Leading Plan Project (2025C02151), and the Zhejiang Clinovation Pride (CXTD202501002).
Acknowledgments
We would like to thank all the participants and investigators that took part in this study.
Conflict of interest
The authors declare that the research was conducted in the absence of any commercial or financial relationships that could be construed as a potential conflict of interest.
Generative AI statement
The authors declare that no Gen AI was used in the creation of this manuscript.
Publisher’s note
All claims expressed in this article are solely those of the authors and do not necessarily represent those of their affiliated organizations, or those of the publisher, the editors and the reviewers. Any product that may be evaluated in this article, or claim that may be made by its manufacturer, is not guaranteed or endorsed by the publisher.
Supplementary material
The Supplementary material for this article can be found online at: https://www.frontiersin.org/articles/10.3389/fneur.2025.1602822/full#supplementary-material
References
1.
Al-Shahi Salman R Frantzias J Lee RJ Lyden PD Battey TWK Ayres AM et al . Absolute risk and predictors of the growth of acute spontaneous intracerebral haemorrhage: a systematic review and meta-analysis of individual patient data. Lancet Neurol. (2018) 17:885–94. doi: 10.1016/s1474-4422(18)30253-9
2.
Song D Xu D Li M Wang F Feng M Badr A et al . Global, regional, and national burdens of intracerebral hemorrhage and its risk factors from 1990 to 2021. Eur J Neurol. (2025) 32:e70031. doi: 10.1111/ene.70031
3.
GBD 2019 Stroke Collaborators . Global, regional, and national burden of stroke and its risk factors, 1990-2019: a systematic analysis for the global burden of disease study 2019. Lancet Neurol. (2021) 20:795–820. doi: 10.1016/s1474-4422(21)00252-0
4.
González-Pérez A Gaist D Wallander MA McFeat G García-Rodríguez LA . Mortality after hemorrhagic stroke: data from general practice (the health improvement network). Neurology. (2013) 81:559–65. doi: 10.1212/WNL.0b013e31829e6eff
5.
Zhang Y Zhu S Hu Y Guo H Zhang J Hua T et al . Correlation between early intracranial pressure and cerebral perfusion pressure with 28-day intensive care unit mortality in patients with hemorrhagic stroke. Eur Stroke J. (2024) 9:648–57. doi: 10.1177/23969873241232311
6.
Uehara K Santoleri D Whitlock AEG Titchenell PM . Insulin regulation of hepatic lipid homeostasis. Compr Physiol. (2023) 13:4785–809. doi: 10.1002/cphy.c220015
7.
Er LK Wu S Chou HH Hsu LA Teng MS Sun YC et al . Triglyceride glucose-body mass index is a simple and clinically useful surrogate marker for insulin resistance in nondiabetic individuals. PLoS One. (2016) 11:e0149731. doi: 10.1371/journal.pone.0149731
8.
Huang Y Li Z Yin X . Long-term survival in stroke patients: insights into triglyceride-glucose body mass index from ICU data. Cardiovasc Diabetol. (2024) 23:137. doi: 10.1186/s12933-024-02231-0
9.
Ouyang Q Xu L Yu M . Associations of triglyceride glucose-body mass index with short-term mortality in critically ill patients with ischemic stroke. Cardiovasc Diabetol. (2025) 24:91. doi: 10.1186/s12933-025-02583-1
10.
Johnson AEW Bulgarelli L Shen L Gayles A Shammout A Horng S et al . MIMIC-IV, a freely accessible electronic health record dataset. Sci Data. (2023) 10:1. doi: 10.1038/s41597-022-01899-x
11.
Jiang Y Shen J Chen P Cai J Zhao Y Liang J et al . Association of triglyceride glucose index with stroke: from two large cohort studies and Mendelian randomization analysis. Int J Surg. (2024) 110:5409–16. doi: 10.1097/js9.0000000000001795
12.
Liao C Xu H Jin T Xu K Xu Z Zhu L et al . Triglyceride-glucose index and the incidence of stroke: a meta-analysis of cohort studies. Front Neurol. (2022) 13:1033385. doi: 10.3389/fneur.2022.1033385
13.
Wang X Liu Q Wang T Tian W Chen X Zhang J et al . Triglyceride-glucose index and the risk of stroke in American adults: findings from the atherosclerosis risk in communities study. Diabetol Metab Syndr. (2023) 15:187. doi: 10.1186/s13098-023-01161-3
14.
Yang Y Huang X Wang Y Leng L Xu J Feng L et al . The impact of triglyceride-glucose index on ischemic stroke: a systematic review and meta-analysis. Cardiovasc Diabetol. (2023) 22:2. doi: 10.1186/s12933-022-01732-0
15.
Zhang Y Wu Z Li X Wei J Zhang Q Wang J . Association between the triglyceride-glucose index and carotid plaque incidence: a longitudinal study. Cardiovasc Diabetol. (2022) 21:244. doi: 10.1186/s12933-022-01683-6
16.
Song YM Sung J Davey Smith G Ebrahim S . Body mass index and ischemic and hemorrhagic stroke: a prospective study in Korean men. Stroke. (2004) 35:831–6. doi: 10.1161/01.Str.0000119386.22691.1c
17.
Persaud SR Lieber AC Donath E Stingone JA Dangayach NS Zhang X et al . Obesity paradox in intracerebral hemorrhage. Stroke. (2019) 50:999–1002. doi: 10.1161/strokeaha.119.024638
18.
Miwa K Nakai M Yoshimura S Sasahara Y Wada S Koge J et al . Clinical impact of body mass index on outcomes of ischemic and hemorrhagic strokes. Int J Stroke. (2024) 19:907–15. doi: 10.1177/17474930241249370
19.
Dou J Guo C Wang Y Peng Z Wu R Li Q et al . Association between triglyceride glucose-body mass and one-year all-cause mortality of patients with heart failure: a retrospective study utilizing the MIMIC-IV database. Cardiovasc Diabetol. (2023) 22:309. doi: 10.1186/s12933-023-02047-4
20.
Hu Y Zhao Y Zhang J Li C . The association between triglyceride glucose-body mass index and all-cause mortality in critically ill patients with atrial fibrillation: a retrospective study from MIMIC-IV database. Cardiovasc Diabetol. (2024) 23:64. doi: 10.1186/s12933-024-02153-x
21.
Yang X Li K Wen J Yang C Li Y Xu G et al . Association of the triglyceride glucose-body mass index with the extent of coronary artery disease in patients with acute coronary syndromes. Cardiovasc Diabetol. (2024) 23:24. doi: 10.1186/s12933-024-02124-2
22.
Hou Z Pan Y Yang Y Yang X Xiang X Wang Y et al . An analysis of the potential relationship of triglyceride glucose and body mass index with stroke prognosis. Front Neurol. (2021) 12:630140. doi: 10.3389/fneur.2021.630140
23.
Qiao Y Wang Y Chen C Huang Y Zhao C . Association between triglyceride-glucose (TyG) related indices and cardiovascular diseases and mortality among individuals with metabolic dysfunction-associated steatotic liver disease: a cohort study of UK biobank. Cardiovasc Diabetol. (2025) 24:12. doi: 10.1186/s12933-024-02572-w
24.
Luo JW Duan WH Yu YQ Song L Shi DZ . Prognostic significance of triglyceride-glucose index for adverse cardiovascular events in patients with coronary artery disease: a systematic review and Meta-analysis. Front Cardiovasc Med. (2021) 8:774781. doi: 10.3389/fcvm.2021.774781
25.
Li J Jiang S Guo P Lin W Yu J Xu L et al . TyG-BMI and TyG/BMI %: valuable evaluation tools for predicting unfavorable prognosis in ischemic stroke patients with large vessel occlusion after endovascular therapy. J Stroke Cerebrovasc Dis. (2025) 34:108352. doi: 10.1016/j.jstrokecerebrovasdis.2025.108352
Summary
Keywords
triglyceride glucose-body mass index, hemorrhagic stroke, all-cause mortality, MIMIC-IV database, intensive care unit
Citation
Lu Y, Song E, Chen R, Jing L, Tang J, Shi S, Wang M and Wan S (2025) Associations between triglyceride glucose-body mass index and 30-day mortality in patients with hemorrhagic stroke: analysis of the MIMIC-IV database. Front. Neurol. 16:1602822. doi: 10.3389/fneur.2025.1602822
Received
23 April 2025
Accepted
25 July 2025
Published
08 August 2025
Volume
16 - 2025
Edited by
Zilong Zhao, Tianjin Medical University General Hospital, China
Reviewed by
Guangdong Wang, First Affiliated Hospital of Xi’an Jiaotong University, China
I. Nyoman Wande, Udayana University, Indonesia
Updates
Copyright
© 2025 Lu, Song, Chen, Jing, Tang, Shi, Wang and Wan.
This is an open-access article distributed under the terms of the Creative Commons Attribution License (CC BY). The use, distribution or reproduction in other forums is permitted, provided the original author(s) and the copyright owner(s) are credited and that the original publication in this journal is cited, in accordance with accepted academic practice. No use, distribution or reproduction is permitted which does not comply with these terms.
*Correspondence: Shu Wan, wanshu@zju.edu.cn
†ORCID: Shu Wan, orcid.org/0000-0002-0186-6274
Disclaimer
All claims expressed in this article are solely those of the authors and do not necessarily represent those of their affiliated organizations, or those of the publisher, the editors and the reviewers. Any product that may be evaluated in this article or claim that may be made by its manufacturer is not guaranteed or endorsed by the publisher.